Article

An Object-Based Deep Learning Approach for Building Height Estimation from Single SAR Images

1
Department of Civil, Building and Environmental Engineering, Sapienza University of Rome, 00185 Rome, Italy
2
Department of Electrical, Computer and Biomedical Engineering, University of Pavia, 27100 Pavia, Italy
3
Department of Engineering, University of Sannio, 82100 Benevento, Italy
*
Author to whom correspondence should be addressed.
Remote Sens. 2025, 17(17), 2922; https://doi.org/10.3390/rs17172922
Submission received: 4 July 2025 / Revised: 14 August 2025 / Accepted: 20 August 2025 / Published: 22 August 2025

Abstract

The accurate estimation of building heights using very-high-resolution (VHR) synthetic aperture radar (SAR) imagery is crucial for various urban applications. This paper introduces a deep learning (DL)-based methodology for automated building height estimation from single VHR COSMO-SkyMed images: an object-based regression approach based on bounding box detection followed by height estimation. This model was trained and evaluated on a unique multi-continental dataset comprising eight geographically diverse cities across Europe, North and South America, and Asia, employing a cross-validation strategy to explicitly assess out-of-distribution (OOD) generalization. The results demonstrate highly promising performance, particularly on European cities where the model achieves a Mean Absolute Error (MAE) of approximately one building story (2.20 m in Munich), significantly outperforming recent state-of-the-art methods in similar OOD scenarios. Despite the increased variability observed when generalizing to cities in other continents, particularly in Asia with its distinct urban typologies and the prevalence of high-rise structures, this study underscores the significant potential of DL for robust cross-city and cross-continental transfer learning in building height estimation from single VHR SAR data.

Graphical Abstract

1. Introduction

The integration of remote sensing (RS) techniques with Deep Learning (DL) methodologies has emerged as a highly effective approach for detecting two-dimensional (2D) and three-dimensional (3D) building feature extraction [1,2]. Still, the accurate estimation of 3D changes in urban environments remains a challenging task due to factors such as obstruction from neighboring structures, variations in building materials, and complex urban geometries [3,4].
Focusing on 3D feature extraction, many methods for building height estimation typically utilize stereo imagery and Digital Elevation Models (DEMs) [5,6,7]. These approaches leverage elevation differences to extract structural information, enabling the estimation of building heights and urban morphology. However, such methods depend on the availability and accuracy of high-quality elevation data, which may not always be accessible or up-to-date.
More recent approaches for 3D building height estimation can be categorized into three main groups according to the type of imagery utilized:
  • Multimodal fusion techniques that combine radar and optical data to enable the simultaneous extraction of complementary features from both image sources. This integration allows for a geometric analysis of the interactions between sunlight, buildings, and shadows in optical imagery, while also taking advantage of the all-weather, day-and-night imaging capabilities of radar data.
  • Methodologies that rely on a time sequence of datasets coming exclusively from a single data source, either radar or optical imagery. This strategy is motivated by the desire to simplify the pre-processing workflow, reduce computational and storage overhead, and minimize the potential for errors that can arise during data fusion.
  • Methodologies that rely solely on a single image from a single data source, aiming at the best trade-off between the simplicity of data acquisition and the detailed structural information necessary for precise analysis.
With respect to the first group of approaches, a good example is [8], which introduces the Building Height Estimating Network (BHE-NET) to process Sentinel-1 and Sentinel-2 in parallel. The network is based on the U-Net architecture [9], which serves as the core framework for the model. Similarly, in [10] the authors proposed a methodology, the Multimodal Building Height Regression Network (MBHR-Net), a DL model specifically designed to process and analyze data from the same sources. Conversely, ref. [11] introduces a core innovation relying in the multi-level cross-fusion approach, which integrates features from SAR and electro-optical (EO) images. The model incorporates semantic information, which is particularly beneficial in densely built environments, as it helps to differentiate building structures and their respective heights. Finally, the work in [12] introduces a so called Temporally Attentive and Swin Transformer-enhanced dual-task UNet model (T-SwinUNet) to simultaneously perform feature extraction, building height estimation, and building segmentation. The model leverages complex, multimodal time series data—specifically, 12 months of Sentinel-1 SAR and Sentinel-2 MSI imagery, including both ascending and descending passes—to capture local and global spatial patterns.
Among the second group of approaches, ref. [13] introduces a novel methodology to estimate building heights using only Sentinel-1 Ground Range Detected (GRD) data. By utilizing the VVH indicator in combination with reference building height data derived from airborne LiDAR images, the authors developed a calibrated building height estimation model, grounded on reliable reference points from seven U.S. cities. As another example, in [14], the limitation of satellite-based altimetry methodologies to distinguish between the photons belonging to buildings and other objects is discussed. In this study, a self-adaptive method was proposed using the Ice, Cloud and Land Elevation Satellite (ICESat-2) and Global Ecosystem Dynamics Investigation (GEDI) data in Los Angeles and New York to estimate the height of the buildings.
In the third group, some methodologies leverage the grouping of 2D primitives, such as edges and segments, to infer building heights and delineate urban structures [15]. However, these approaches generally rely on additional auxiliary information, such as shadows and wall evidence, to infer building heights. As a result, they are highly dependent on specific imaging conditions, such as oblique viewing angles or particular times of day, when shadows and structural details are more pronounced. This dependency can limit their applicability, as variations in sun position, atmospheric conditions, and sensor orientation may affect the consistency and reliability of height estimations.
Another interesting development is the work described in [16], which integrates 2D and 3D contextual information by leveraging a contour-based grouping hierarchy derived from the principles of perceptual organization. By utilizing a Markov random Field (MRF) model, this approach estimates building heights using a single remote sensing image and generates rooftop hypotheses without requiring explicit 3D data, but final accuracy is limited. More recent works [17,18] demonstrate the feasibility of estimating building heights from single VHR SAR images. In particular, Ref. [17] proposes a DL model trained on over 50 TerraSAR-X images from eight cities for reconstructing urban height maps from single VHR SAR images by integrating sensor-specific knowledge. Their method converts SAR intensity images into shadow maps to filter out low-intensity pixels, then applies mosaicking and filtering to refine height estimates. Complementarily, ref. [18] introduces an object-based approach that estimates building heights via bounding-box regression between the footprint and building bounding boxes, an instance-based formulation particularly effective for structures with clearly defined footprints.
Building upon the strategies as described before, this paper aims to harness the detailed information present in single VHR SAR images to deliver accurate and efficient 3D urban structure analysis without the complexities of multi-source data fusion or multi-temporal analysis. An object-based approach is thus proposed, utilizing footprint geometries to perform instance-based height estimation. The method exploits building boundaries such as Sun et al. [18], but introduces several key distinctions. First, while Sun et al. employed four input features, including the bounding box center coordinates, this approach uses only the bounding box dimensions (length and width), as we found out that the center coordinates contribute marginally to height prediction when the box is well aligned with the footprint, which will be proved later. This simplification reduces model complexity and the risk of overfitting to spatial patterns. Second, unlike [18], the methodology presented in this paper explicitly operates in the ground range domain, avoiding the need to reproject data into the SAR image (slant range) plane. Instead of computing bounding boxes aligned with the slant-range geometry, as in Sun et al., our method accounts for the orbit geometry and incidence angle by directly rotating and adjusting the footprint-aligned bounding box (FBB) in ground coordinates. This preserves geometric consistency with the SAR acquisition geometry while simplifying the processing chain.
To test the proposed methodology, this study systematically evaluates the strengths and limitations of the proposed approach across different urban morphologies. The approach is therefore applied to COSMO-SkyMed VHR radar images acquired from a geographically diverse set of cities, including Buenos Aires, Los Angeles, Milan, Munich, New York, Rome, Shanghai, and Shenzhen. Since this city set represents a wide spectrum of urban environments, the use of COSMO-SkyMed data with consistent orbital direction and acquisition mode (as detailed in Table 1) ensures that a robust and generalizable model is trained.
The rest of the article is organized as follows. In Section 2, an overview of the study area is provided along with a detailed description of the datasets, including reference data acquisition, VHR SAR image selection, and pre-processing steps. In Section 2.2, the proposed object-based methodology for building height estimation is presented. In Section 3, a detailed analysis of the performance of the proposed method in estimating building heights for different cities is reported, and finally, Section 5 summarizes the main findings of the study.

2. Materials and Methods

2.1. Study Area and Data

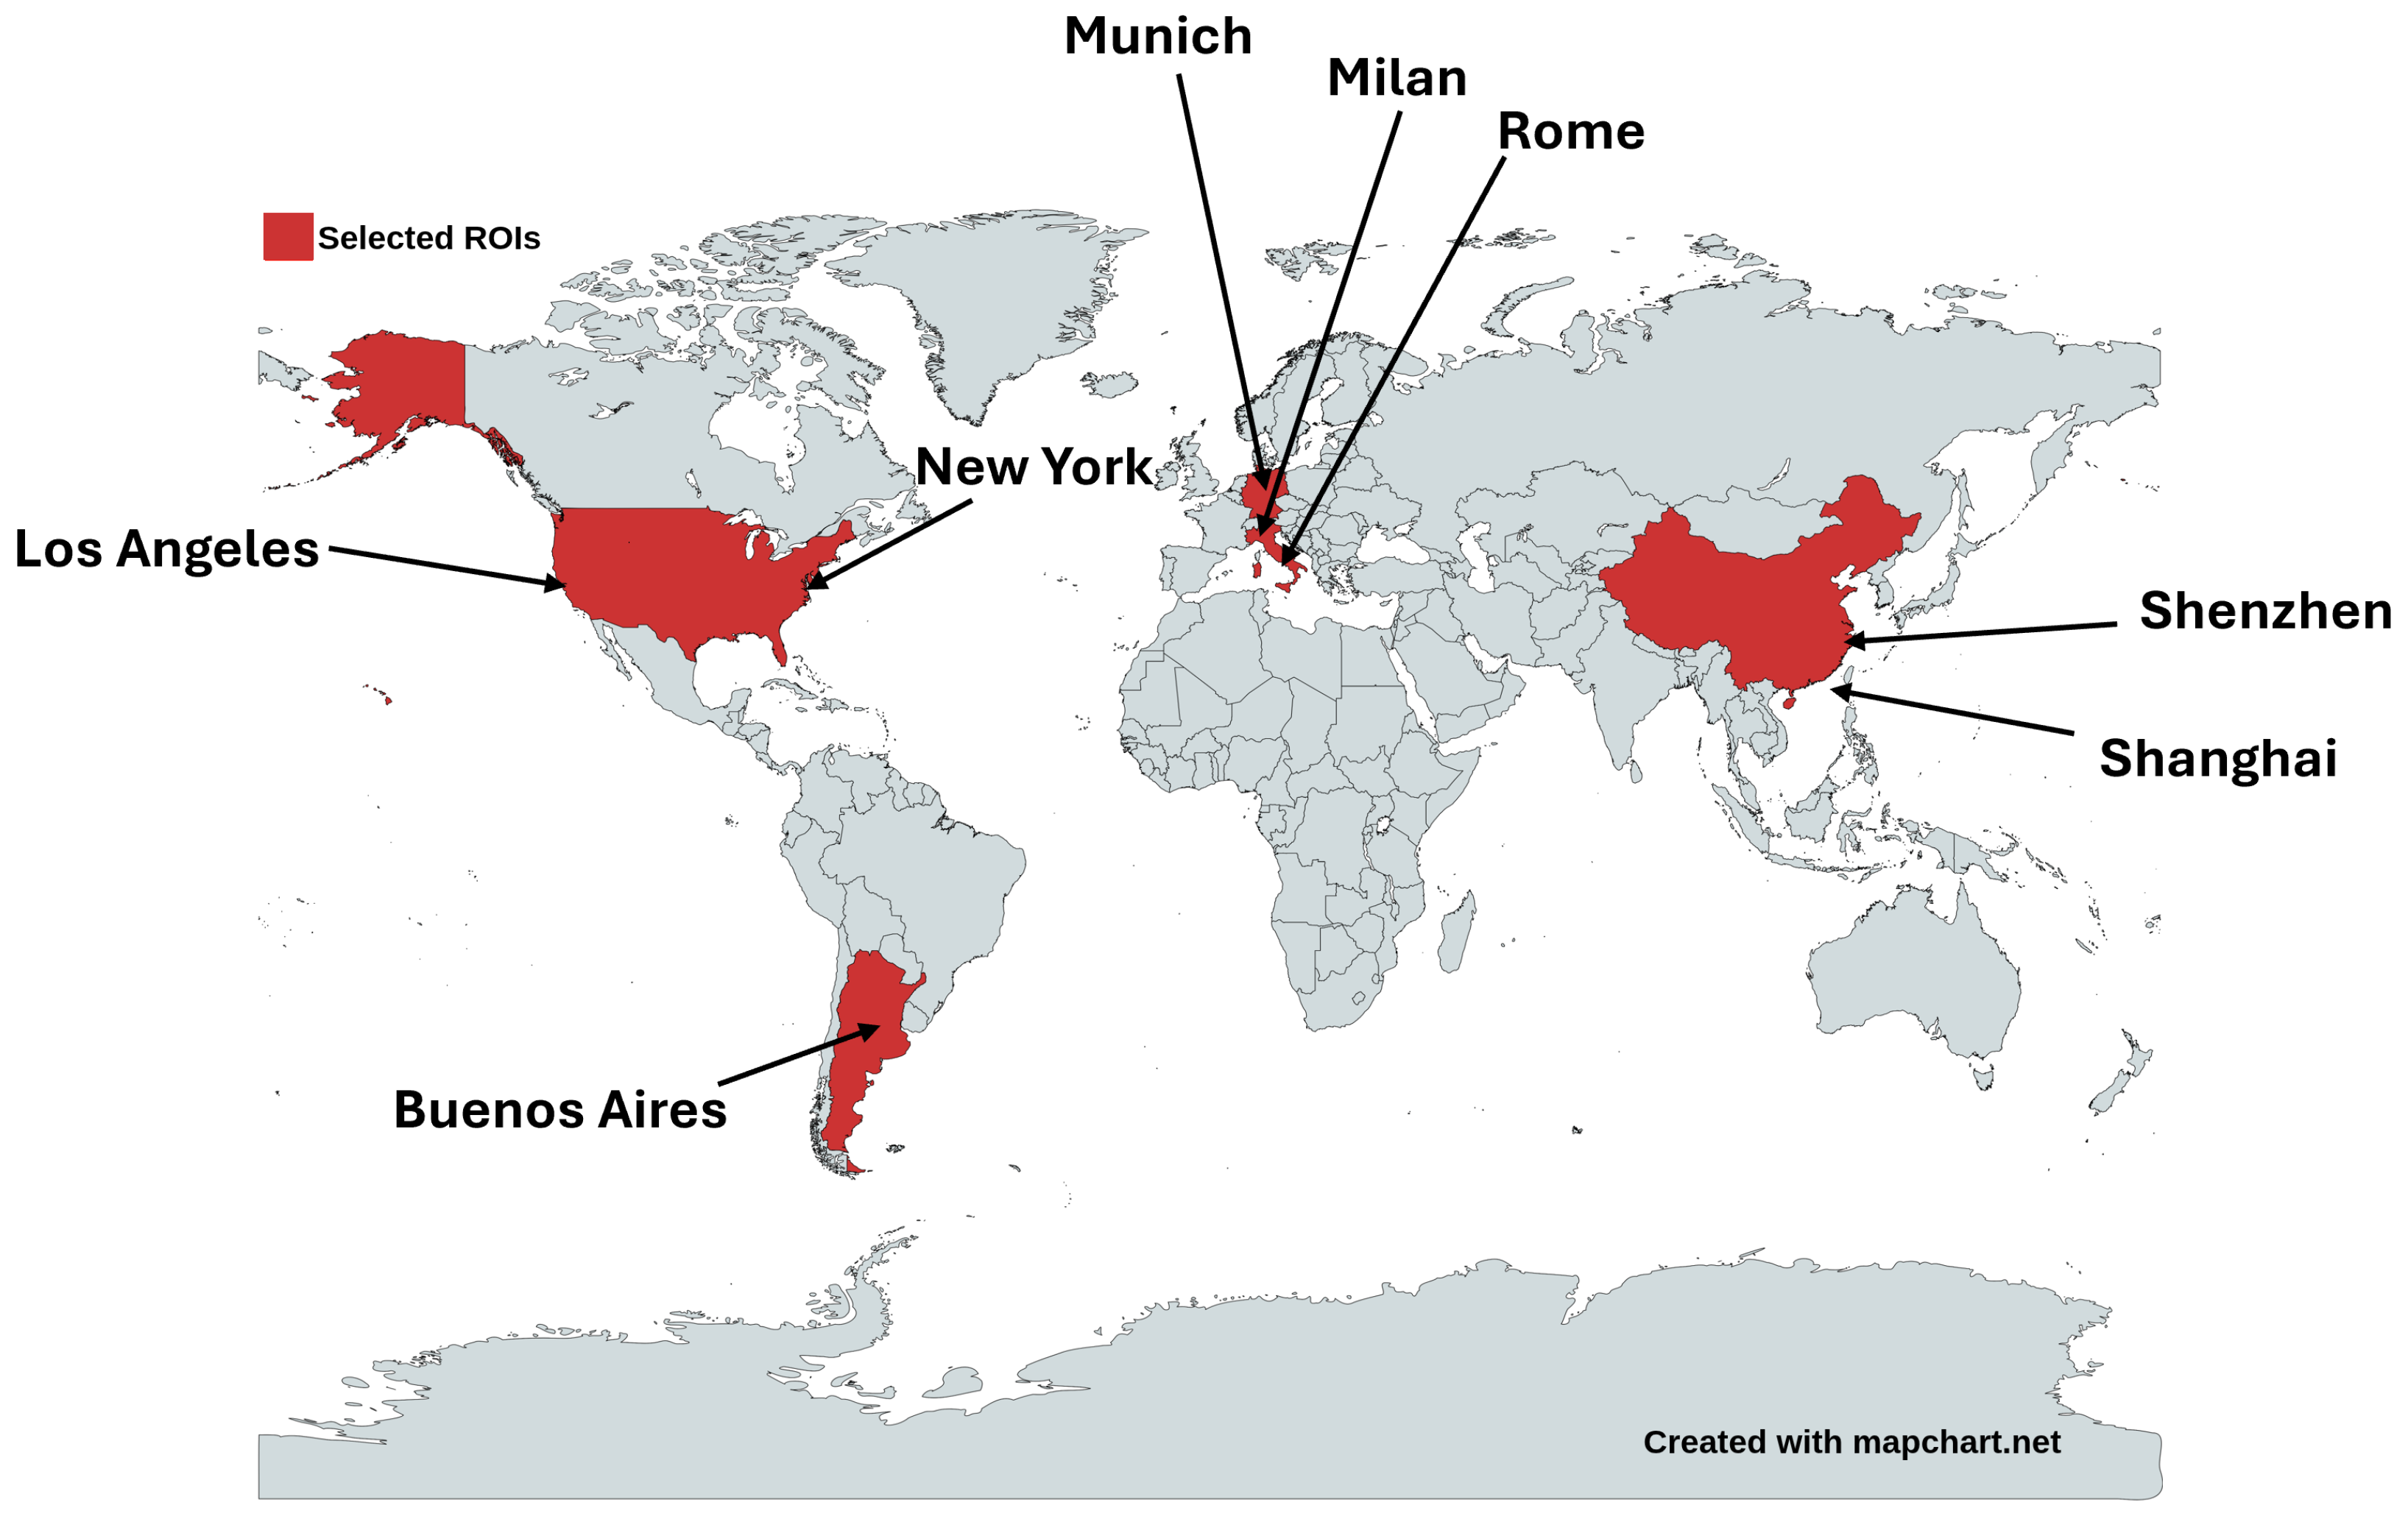
This study was conducted across eight cities located on three continents: Milan, Rome, and Munich in Europe; Shenzhen and Shanghai in Asia; Los Angeles and New York in the U.S.A., and Buenos Aires in South America. The geographical distribution of these areas is illustrated in Figure 1. The selection of these cities was primarily driven by the aim of developing an adaptable and scalable methodology. Furthermore, focusing on cities across different continents ensured exposure to a wide variety of buildings with diverse characteristics. These variations stem from differences in building materials, urban development conditions, architectural structures, and even cultural distinctions across regions. The urban morphologies of these eight cities vary significantly, reflecting their historical development, planning strategies, and cultural influences. European cities like Milan, Rome, and Munich have predominantly low- to mid-rise structures, with historic city centers featuring irregular street patterns. Although Milan has some modern high-rise districts, Rome remains largely uniform in height due to preservation laws. Munich enforces strict height limits, maintaining a balance between tradition and modernity. In contrast, Shenzhen and Shanghai in Asia are characterized by high-rise dominance, with Shenzhen’s planned grid and super-tall skyscrapers showcasing rapid urbanization, whereas Shanghai blends historic low-rise neighborhoods with its futuristic skyline in Pudong. American cities exhibit a broader spectrum of urban density and planning. New York City stands out for its extreme verticality, with some of the tallest buildings in the world densely packed in Manhattan, while Los Angeles is defined by urban sprawl, with skyscrapers concentrated in downtown but vast low-rise suburbs dominating the landscape. Buenos Aires combines both aspects, featuring a European-influenced grid with a mix of mid-rise and high-rise structures, maintaining a dense core that gradually disperses into suburban areas. As a result, differences in feature distributions can complicate model training and lead to inconsistent learning. However, an effective training data split can balance these features, thereby enhancing the model’s ability to generalize across diverse urban environments.

2.1.1. Input Data

The Constellation of Small Satellites for the Mediterranean Basin Observation (COSMO-SkyMed) represents the largest Italian investment in RS space programs. It is jointly funded by the Italian Space Agency (ASI) and the Italian Ministry of Defence and has been observing the Earth since 2007 [19]. The COSMO-SkyMed (CSK) (https://earth.esa.int/eogateway/missions/cosmo-skymed (accessed on 1 January 2025)) facilitates Earth observation for both civilian and defense purposes. By capturing high-resolution images under all weather conditions, it supports a diverse range of applications, including risk management, scientific research, commercial activities, and defense operations. The four satellites of the CSK constellation follow a sun-synchronous orbit, ensuring consistent global coverage with regular revisit times. When the full constellation is operational, it can revisit a specific area on Earth within a few hours, with varying incidence angles depending on the observation requirements. CSK provides a variety of acquisition modes, each tailored to meet specific observational requirements. These modes offer flexibility in spatial resolution, coverage area, and revisit time, making the system suitable for a wide range of applications.
In this study, we used the CSK StripMap (SM) HIMAGE mode, which maintains constant radar transmit/receive configurations to capture the full Doppler bandwidth, featuring a 40 km swath width, an azimuth coverage of about 40 km (for 7 s acquisitions), PRF values of 34 kHz, and chirp durations of 3540 microseconds, with chirp bandwidth ranging from 65 MHz to 140 MHz based on ground resolution. To ensure the utilization of SAR data with consistent characteristics and the highest coverage of the examined cities, the data of CSK Satellite 2 (CSKS2), acquired in descending orbital path and processed at Level-1D, were employed. This acquisition mode provides a spatial resolution of 2.5 m × 2.5 m, making it highly suitable for detailed urban analysis. Level 1D ensures that the dataset has the highest possible level of corrections available from the SAR product chain for this sensor. Table 1 briefly shows an overview of the CSK images used in this study. Using a descending orbital path, we ensure geometric consistency across the dataset. This choice reduces variability in the acquisition geometry and simplifies the modeling process, which is particularly beneficial when employing DL methods that can be sensitive to such variations.
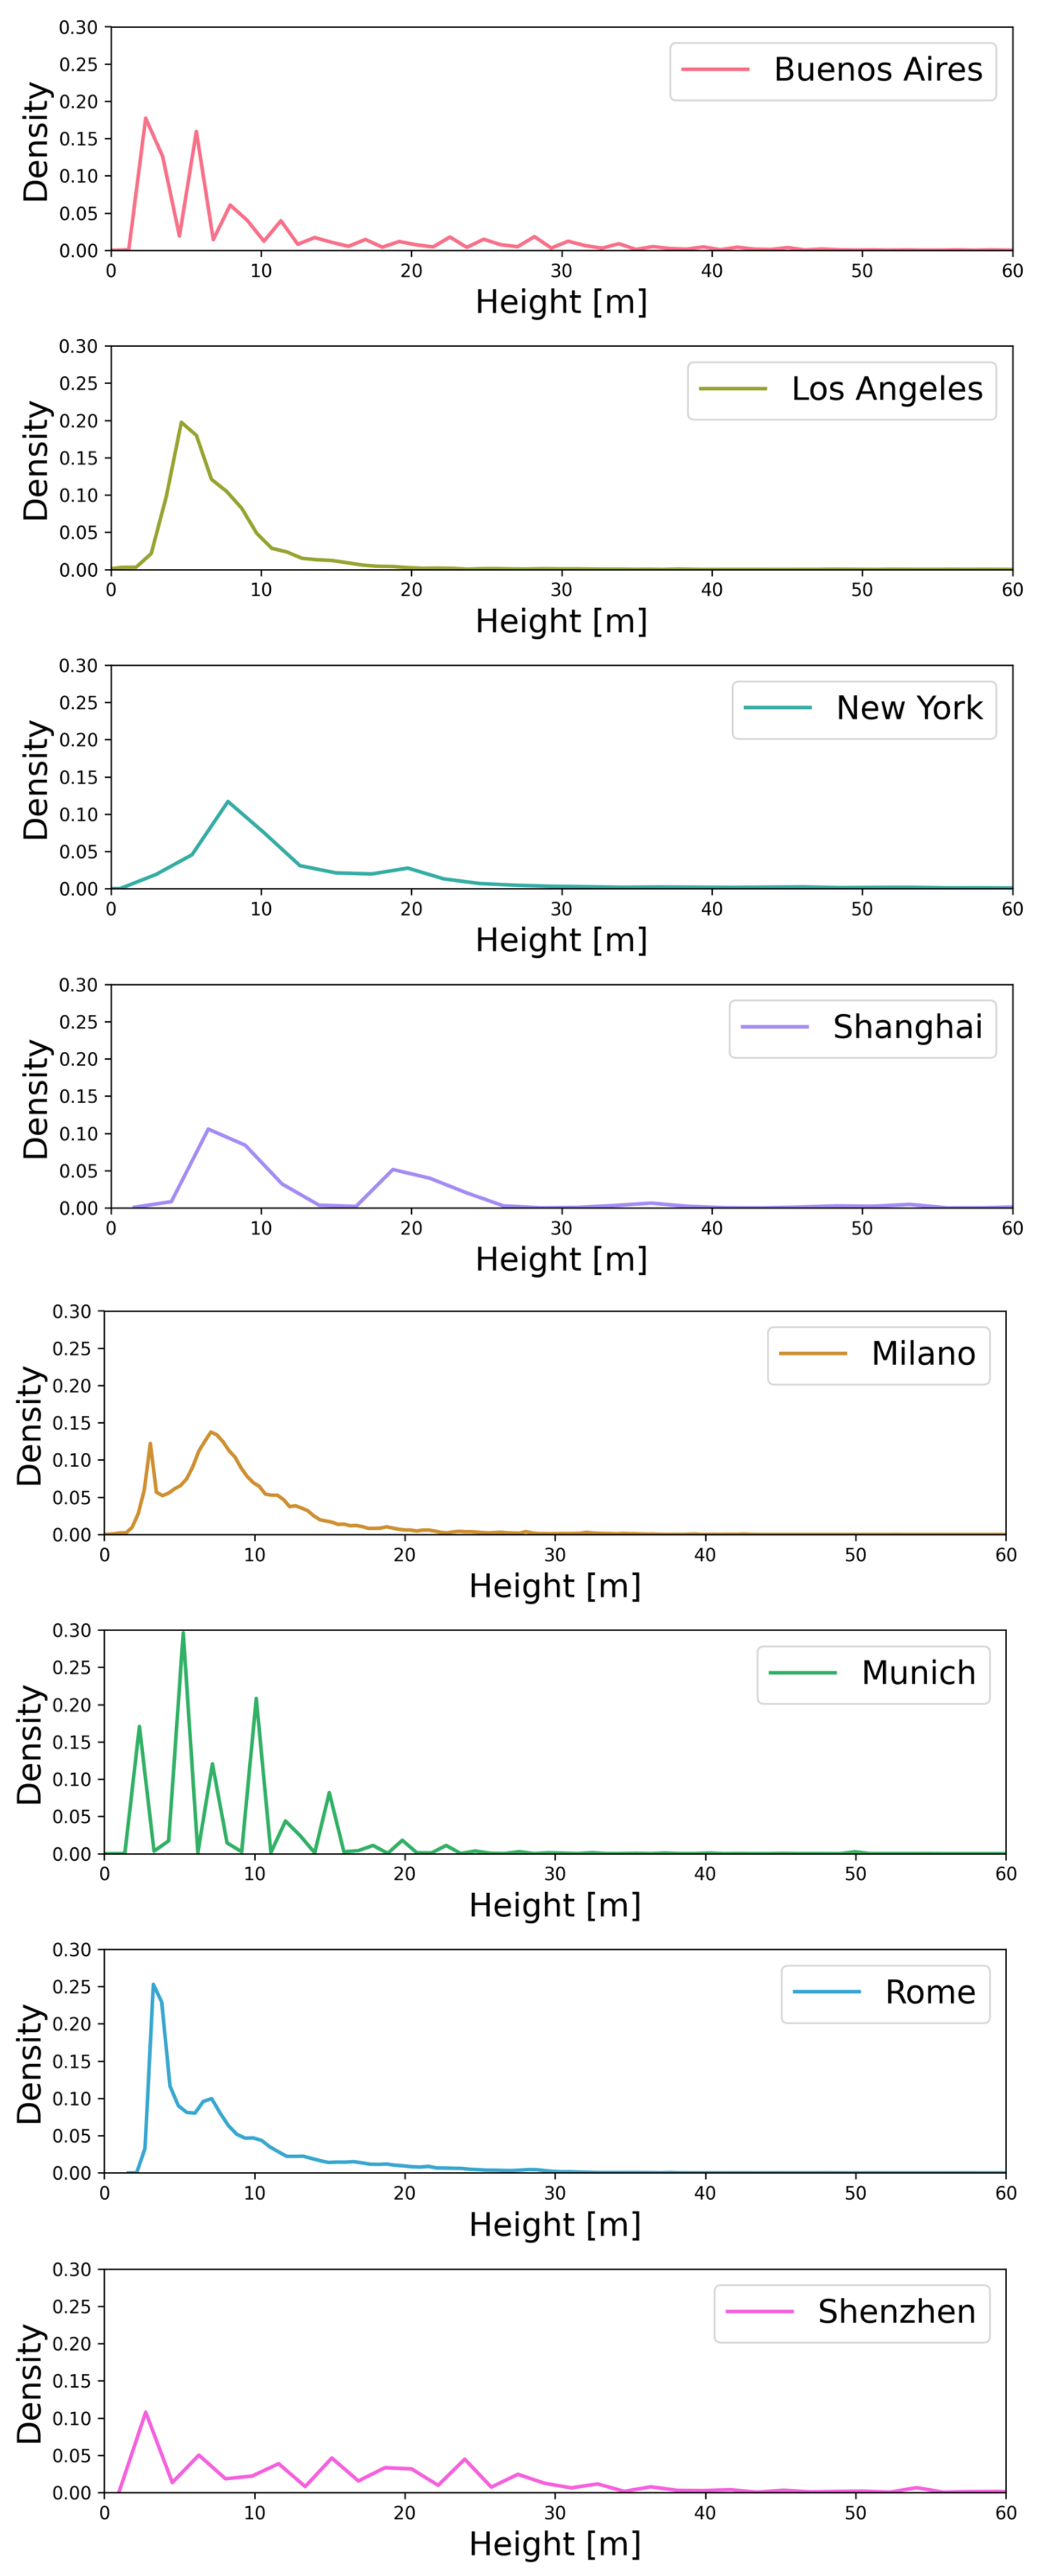
What we did first was identifing a number of different cities as already highlighted, whose building height density distributions are illustrated in Figure 2.

2.1.2. Reference Data

A significant effort in this study was dedicated to collecting reference data for model training from reliable and diverse sources, as detailed in Table 2. For the European cities of Milan, Rome, and Munich, the reference data were obtained from EUBUCCO [20], a scientifically curated database that provides individual building footprints for over 200 million structures across the 27 European Union member states and Switzerland. The EUBUCCO database integrates information from 50 open government datasets and Open Street Map (OSM), which have been systematically collected, harmonized, and partially validated.
The reference data for New York City were sourced from the NYC Open Data (https://opendata.cityofnewyork.us/ (accessed on 1 January 2025)) database, an extensive platform managed and regularly updated by the Open Data Team at the NYC Office of Technology and Innovation (OTI). This initiative focuses on documenting and managing public datasets to ensure accessibility and transparency. Similarly, the required data for Los Angeles are publicly available through the Los Angeles GeoHub (https://geohub.lacity.org/datasets/ (accessed on 1 January 2025)), a centralized open data platform managed by the City of Los Angeles. For this study, data from the publicly available 2017 dataset were used.
Reference data for urban regions in China, instead, posed significant challenges due to the limited availability of publicly accessible datasets. In this case, the data were sourced from [21]. The authors employ Sentinel-1 and Sentinel-2 satellite imagery to calculate building footprints and heights for 40 major cities across China. The results of their analysis were made publicly available in a dedicated database, which served as the reference data for Chinese cities in this study. This dataset provided a reliable and scientifically validated resource for urban analysis in the region of interest.

2.1.3. Data Pre-Processing and Splitting

The input data was segmented into smaller tiles using a standardized approach, to ensure consistency in data processing while allowing a rigorous evaluation of the performance of the method. More specifically, the SAR images and the corresponding reference data were partitioned into 256 × 256 pixel patches with a 20% overlap, ensuring spatial continuity and preventing the loss of information at the edges. This process yielded a total of 53,079 paired SAR and reference patches across all urban environments. Table 2 introduced the above details the distribution of these patches city by city. Although the object-based method presented in the next section uses only a subset of these patches, the full dataset remains a significant outcome of this work and can support the future benchmarking and evaluation of new methodologies.

2.1.4. Training and Optimization

The object-based approach utilizes an individual patch for each building and its corresponding footprint mask as input data. In other words, each building is individually identified, and a specific image patch and corresponding footprint mask is generated. In the eight cities used in this study, a total of 3,317,956 buildings were identified and a corresponding number of patches was generated (see Table 2). However, training the object-based model on the entire set of patches poses significant computational challenges. To address this constraint, a random subset of 20,000 samples was selected from each city, resulting in 160,000 training patches in total. Subsequently, the model was trained and evaluated using a cross-validation strategy, where in each run, one city was held out as an out of distribution (OOD) test set, while data from the remaining cities were used for training, as better detailed in Section 3. Since the object-based approach regresses a single height value per building and any large error in this prediction affects the overall estimate of a single building, a quadratic penalty is preferable. Therefore, the Mean Squared Error (MSE) loss was used, defined as
MSE = 1 n i = 1 n ( y i y ^ i ) 2
where y i represents the ground truth values, y ^ i denotes the predicted values, and n is the total number of building objects in a batch. MSE strongly penalizes large discrepancies, thus encouraging the model to correct substantial deviations more aggressively.

2.2. Object-Based Building Height Estimation

This section provides a comprehensive explanation of the proposed object-based methodology, which is based on considering each building as an independent entity. Under this assumption, variations in height between different points in a building, resulting from structural differences such as the shape of the roof or architectural features, are not considered. Instead, a single representative value is assigned to denote the height of the building.
The basic element of the object-based building analysis approach is the building footprint, which serves as a crucial source of information in various domains, including disaster management and urban planning [22]. Therefore, a binary footprint mask is generated for each building, along with the corresponding segment of the SAR image. To achieve this, in each initial patch created during the pre-processing stage, as described in Section 2.1.3, all building footprints are identified and the corresponding SAR patch is extracted. Given that the initial patches include an overlap of 20 % , some buildings may appear two to four times in different patches. To ensure a clean and non-redundant dataset, duplicate instances are identified and removed based on the geometric properties of each building. This refinement process ensures that each building is represented only once in the final training dataset.

2.2.1. Extra Feature Generation

As mentioned, in this work, we rely on the idea proposed in [18], where the authors describe the relationship between the geometry of the SAR imagery and the actual physical structure of a building on the ground. Figure 3 illustrates this relationship. SAR imagery is acquired in a slant range coordinate system, where the projection of a building’s footprint and height is inherently influenced by this geometry.
In this way, two bounding areas can be defined based on the structural characteristics of each building.
The first one is the footprint bounding box (FBB) which encompasses the building’s ground footprint. The second one is the building bounding box (BBB), which includes the projection of both the footprint and the building’s height within the SAR image. Therefore, these two bounding boxes can be used to calculate the height of the building by applying the incidence angle ( θ ) of the sensor.
By delineating these two regions, the difference in length between them can be calculated as follows:
L = L BBB L FBB
where [ L B B B ] and [ L F B B ] are the lengths of the BBB and FBB, respectively, in the range direction. Thus, the building height can be estimated as
h = L / cos θ
where h is the height of the building, L is the difference in the lengths of the BBB and its corresponding FBB, and θ is the incidence angle of the satellite.
It is important to note that it is crucial to factor in the satellite’s position when monitoring a building, ensuring that the FBB and BBB are accurately calculated to achieve reliable results. By using the inclination angle, defined as the angle between the orbital plane and the equator, FBB and BBB can be calculated in a manner that accurately covers the entire area of the building, aligning with the satellite’s angle of view.
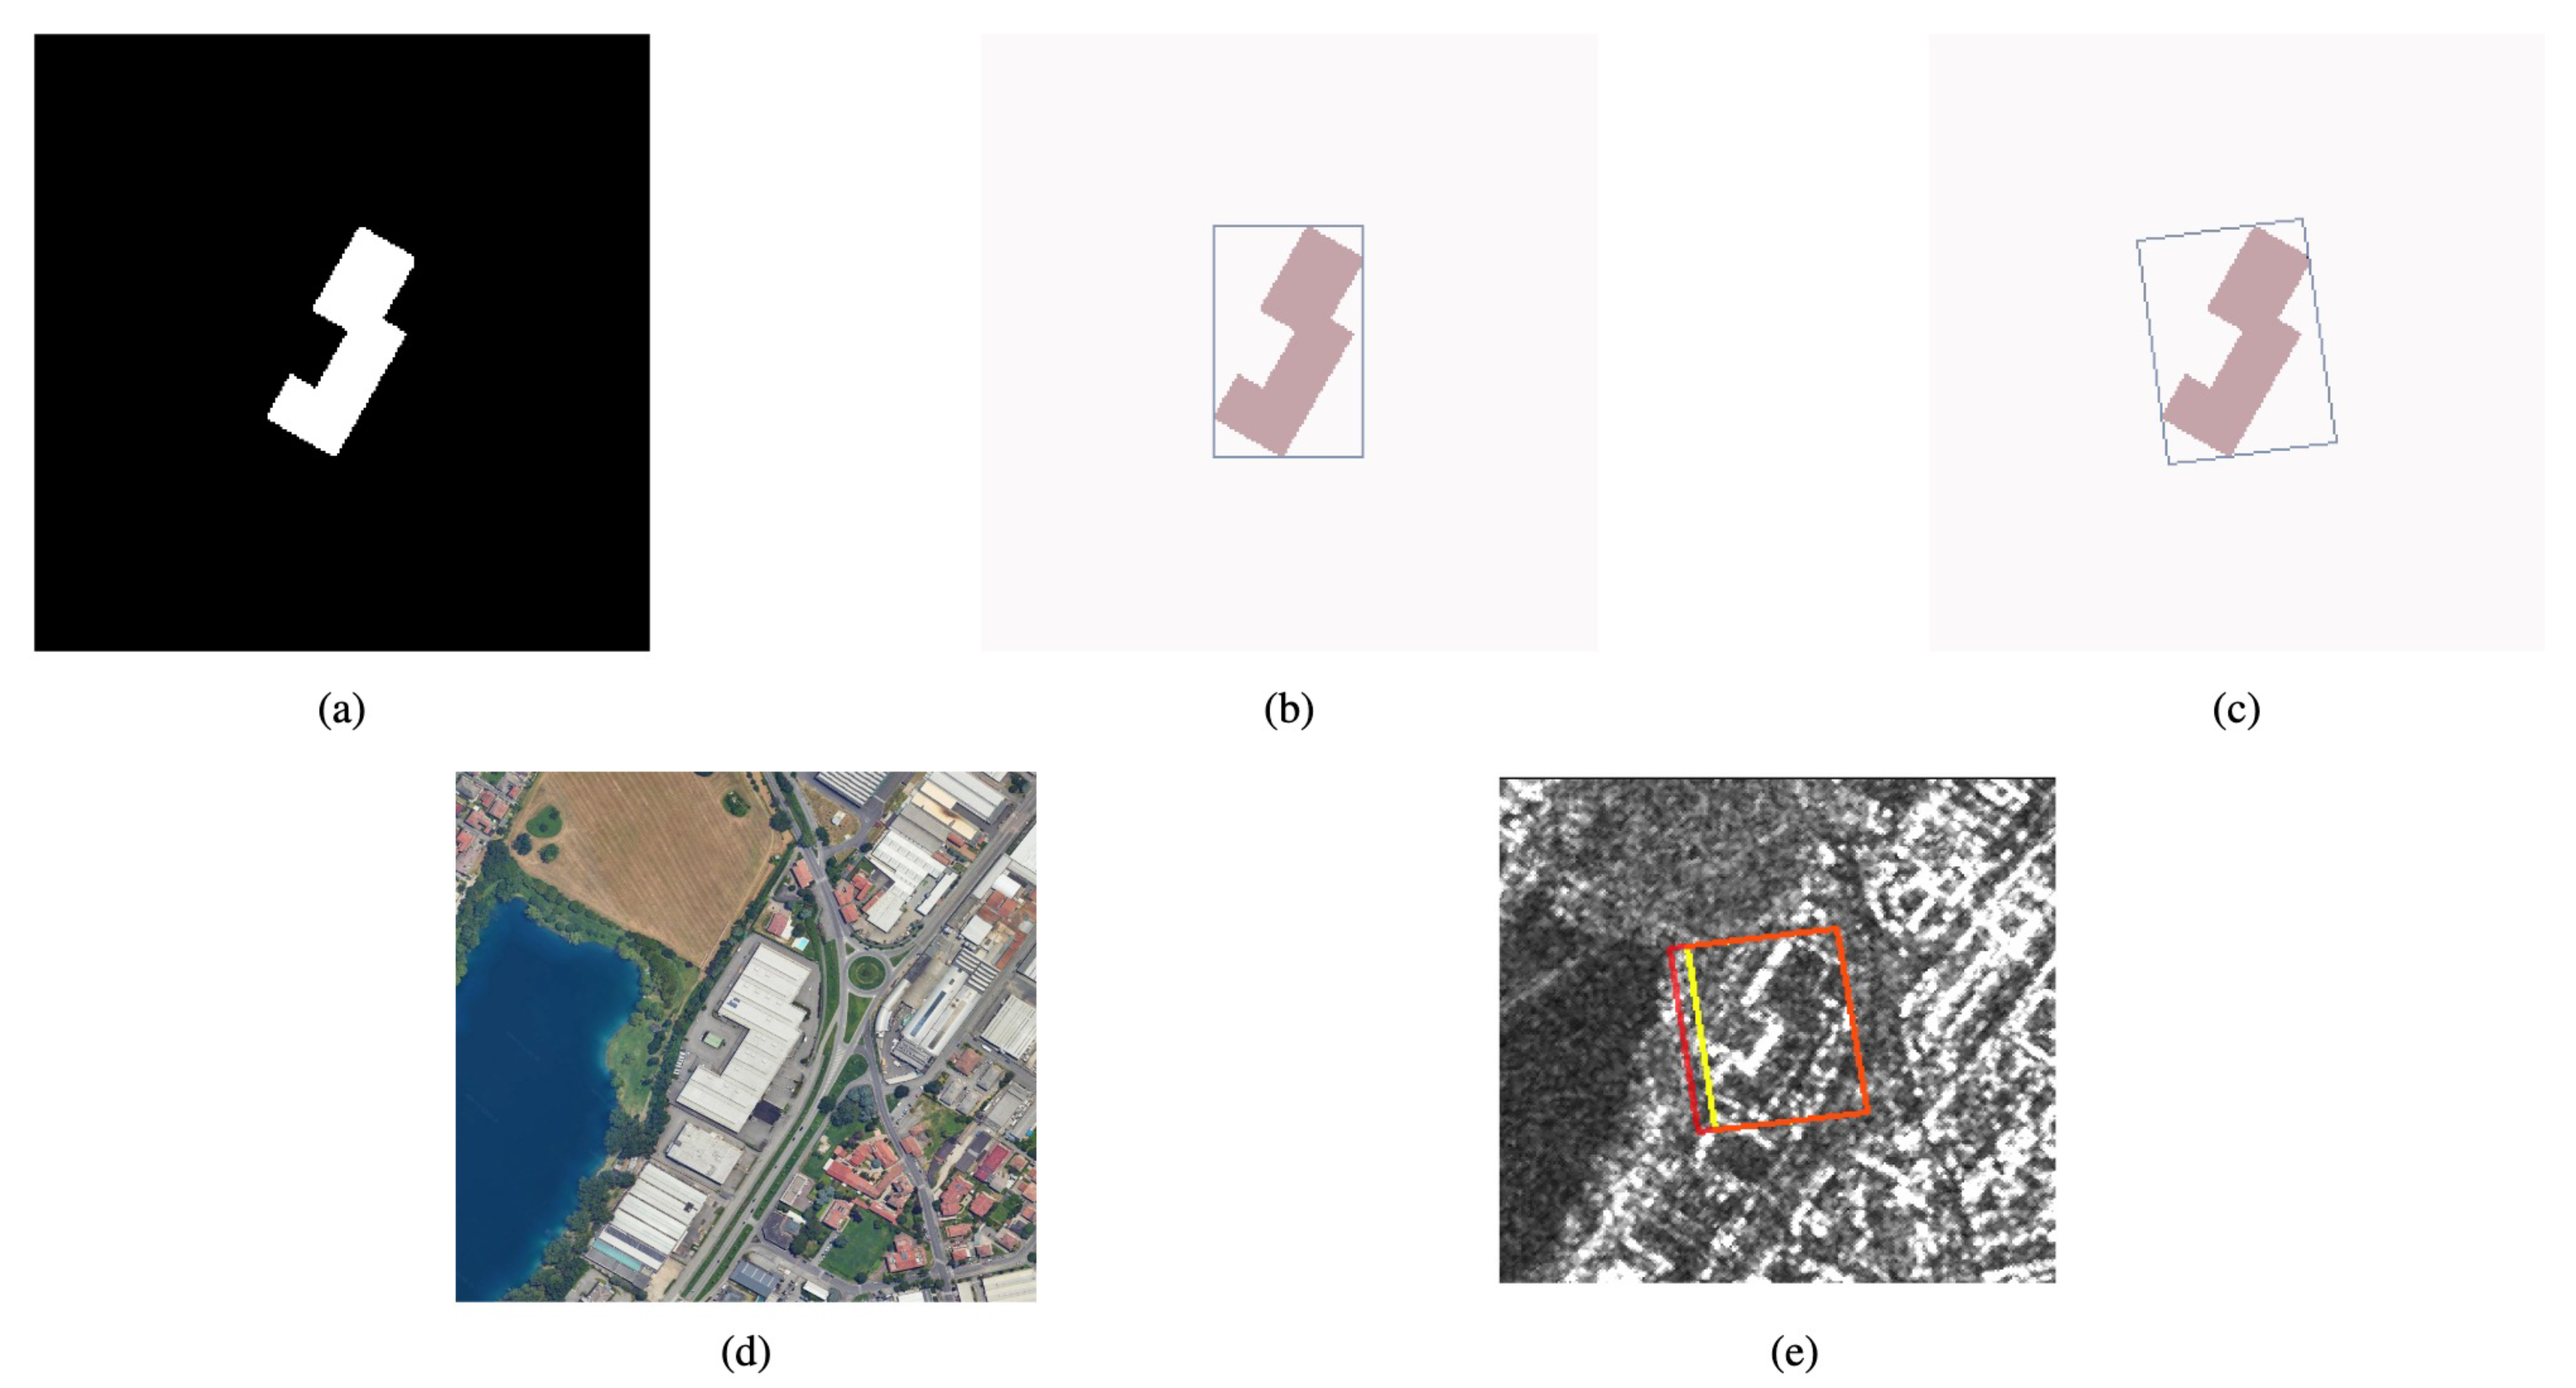
The FBB is extracted by looking for the smallest enclosing rectangle that fully covers the footprint area. Then, this rectangle is rotated according to the inclination angle, and its size is adjusted to ensure the complete coverage of the footprint. Figure 4 represents the process of extracting the FBB for a sample building footprint.

2.2.2. Model Architecture

The overall framework of the instance-based methodology is depicted in Figure 5, illustrating the sequential processes involved in detecting and analyzing individual objects within the dataset. The proposed methodology consists of three main parts:
1.
A DL framework that extracts the features from the input SAR image and its corresponding footprint mask;
2.
A feature generator that calculates the extra attributes for each building separately;
3.
A fully connected layer to integrate the extracted features and extra attributes to estimate the height of the buildings.
The DL framework is based on ResNet-101 [23]. ResNet-101 is a deep residual network comprising 101 weighted layers, structured into five convolutional blocks, each containing multiple residual sub-networks. The model contains an initial convolutional layer that applies 64 filters of size 7 × 7 with stride 2. The choice of 7 × 7 filter is motivated by the need to capture broader contextual and structural information in the early layers, especially important when dealing with VHR SAR images that include complex scattering behaviors. The use of stride 2 in both convolution and pooling reduces the spatial resolution from 256 × 256 to 64 × 64 , while significantly lowering the computational load and enabling the network to process larger receptive fields in deeper layers. Max pooling further helps ignore background noise and enhances the most dominant features, such as edges, building contours, and corner structures. Following the initial downsampling, the feature maps are passed through four stages of residual block sets, Conv2 to Conv5, each progressively increasing the number of filters and the depth of semantic representation. Conv2 consists of three residual blocks with 64 filters and maintains the spatial resolution at 64 × 64 . These early residual layers extract low-level features such as lines, edges, and footprint boundaries, while the identity connections ensure efficient gradient flow during backpropagation, mitigating the risk of vanishing gradients. Next, Conv3 introduces four residual blocks with 128 filters, allowing the network to capture mid-level abstractions. Conv4, the deepest stage, comprises 23 residual blocks. This stage plays a central role in capturing high-level semantic features such as building shape or shadow profile. By Conv5, the features are highly abstracted and encode the most informative patterns necessary for the task, such as spatial layout. To transform the spatial feature maps into a compact representation suitable for regression, the model applies global average pooling, producing a fixed-length feature vector. Average pooling ensures an overall contextual summary of the input rather than focusing on localized features. This operation is critical in regression tasks, as the objective is to predict scalar quantities related to the entire input image. This architecture is specifically designed to facilitate efficient feature extraction by employing residual learning, which addresses the vanishing gradient and degradation problems commonly encountered in very deep networks.
In the proposed methodology, all the layers of ResNet-101 are utilized to extract meaningful feature representations from SAR imagery. The model initially takes the SAR image and building footprint as input. In the first stage, convolutional layers process these inputs to generate an initial set of feature maps. Then, additional features, which were derived from FBB using the feature generator component, are integrated with the extracted feature maps before being passed to the fully connected layer. The output of the fully connected layer is then compared with the ground truth data in a regression framework, where the objective is to estimate the bounding boxes that define building extents. Finally, from these bounding boxes, the building height is computed.

3. Results

In order to evaluate and compare the performance of the methodology presented in this study, the Mean Absolute Error (MAE) and the Root Mean Squared Error (RMSE) were utilized as evaluation metrics. In particular, RMSE quantifies the average magnitude of the error by computing the square root of the mean of squared differences between the actual values y and the predicted values y ^ for n number of samples:
MAE = 1 n i = 1 n | y i y ^ i |
RMSE = 1 n i = 1 n ( y i y ^ i ) 2

3.1. Backbone Selection

Initially, to select the best one, different backbones were compared in a first set of experiments. In these experiments, the dataset comprising eight cities was randomly split into 70 % for training and 30 % for validation, without any geographical separation. All simulations were run on a high-performance workstation equipped with an NVIDIA GeForce RTX 3070 GPU (featuring 8192 MiB of dedicated memory) and 128 GB of system RAM, using a batch size factor of 8 to ensure consistency between the two methodologies.
An alternative backbone is based on the Dynamic One-For-All (DOFA) [24] Vision Transformer (ViT) [25] architecture, specifically the vit-base-patch14 variant, whose weights were initialized from the DOFA foundation model pre-trained on large-scale datasets. DOFA is a large-scale, general-purpose foundation model designed for versatile adaptation across various downstream tasks. Its architecture leverages Transformer-based attention mechanisms, enabling it to model long-range dependencies in images and capture rich contextual relationships. In our case, the DOFA backbone provided a strong starting point by transferring pre-learned representations from diverse imagery, potentially allowing the model to generalize well even in data-scarce settings. However, as Table 3 shows, while the ViT-based DOFA achieves competitive results (MAE of 5.45 m), it is outperformed by the proposed method in both overall and high-building categories.
Another tested model is the U-Net [9] backbone, a widely used convolutional neural network (CNN) architecture originally developed for biomedical image segmentation but now prevalent in remote sensing tasks. Its encoder–decoder structure with skip connections allows it to retain fine spatial details while learning deep semantic features. In our context, U-Net processed SAR and footprint inputs by progressively downsampling to capture abstract features, then upsampling to reconstruct detailed spatial information. While U-Net achieves a better MAE for tall buildings than ViT ( 41.56 m vs. 43.67 m) and competitive RMSE values, it is still surpassed by the proposed approach. This is likely due to the fact that the U-Net design is highly optimized for pixel-level prediction rather than global regression tasks, which may limit its ability to generalize height patterns across diverse building scales when compared to architectures explicitly tuned for feature aggregation.
Finally, we evaluated a ResNet101 backbone implemented differently from the proposed architecture, retaining the five convolutional block stages of ResNet101 but incorporating max pooling layers at both the beginning and the end of the model, along with a different fully connected module in terms of the number and size of layers. While the deep residual structure of ResNet101 is well known for its effectiveness in hierarchical feature extraction and its ability to mitigate vanishing gradients, this particular configuration yields the weakest performance among all tested backbones, with an overall MAE of 6.55 m and the highest RMSE for tall buildings (more than 40 m) at 62.96 m.
The architecture proposed in this work, which incorporates a ResNet101 backbone, achieves the best results across nearly all metrics. Specifically, it attains the lowest overall MAE ( 4.95 m) and RMSE ( 8.87 m) and shows substantial improvements for tall buildings with an RMSE of 41.09 m, outperforming all other tested backbones. These results demonstrate the effectiveness of the architectural choices in leveraging both SAR texture patterns and footprint geometry to produce accurate and robust building height estimates.

3.2. Extra Feature Selection

Moreover, in order to evaluate the performance of using only two input variables ( W F B B and L F B B ) compared to the four variables considered in [18], five additional experiments were performed. These experiments applied both scenarios to the same training and testing datasets, which were generated using a 70–30 split with different random seed values. As shown in Table 4, the proposed method consistently outperformed the original approach in all experiments. This improvement can be attributed to the effective integration of building footprint information with our network architecture design, particularly the incorporation of the max pooling layer. When the SAR image is well aligned with its corresponding footprint mask, this layer is especially effective at capturing strong spatial features and localized activations associated with building edges, sharp boundaries, and high-backscatter regions, thereby enhancing the accuracy of the height estimation.

3.3. Cross-Validation

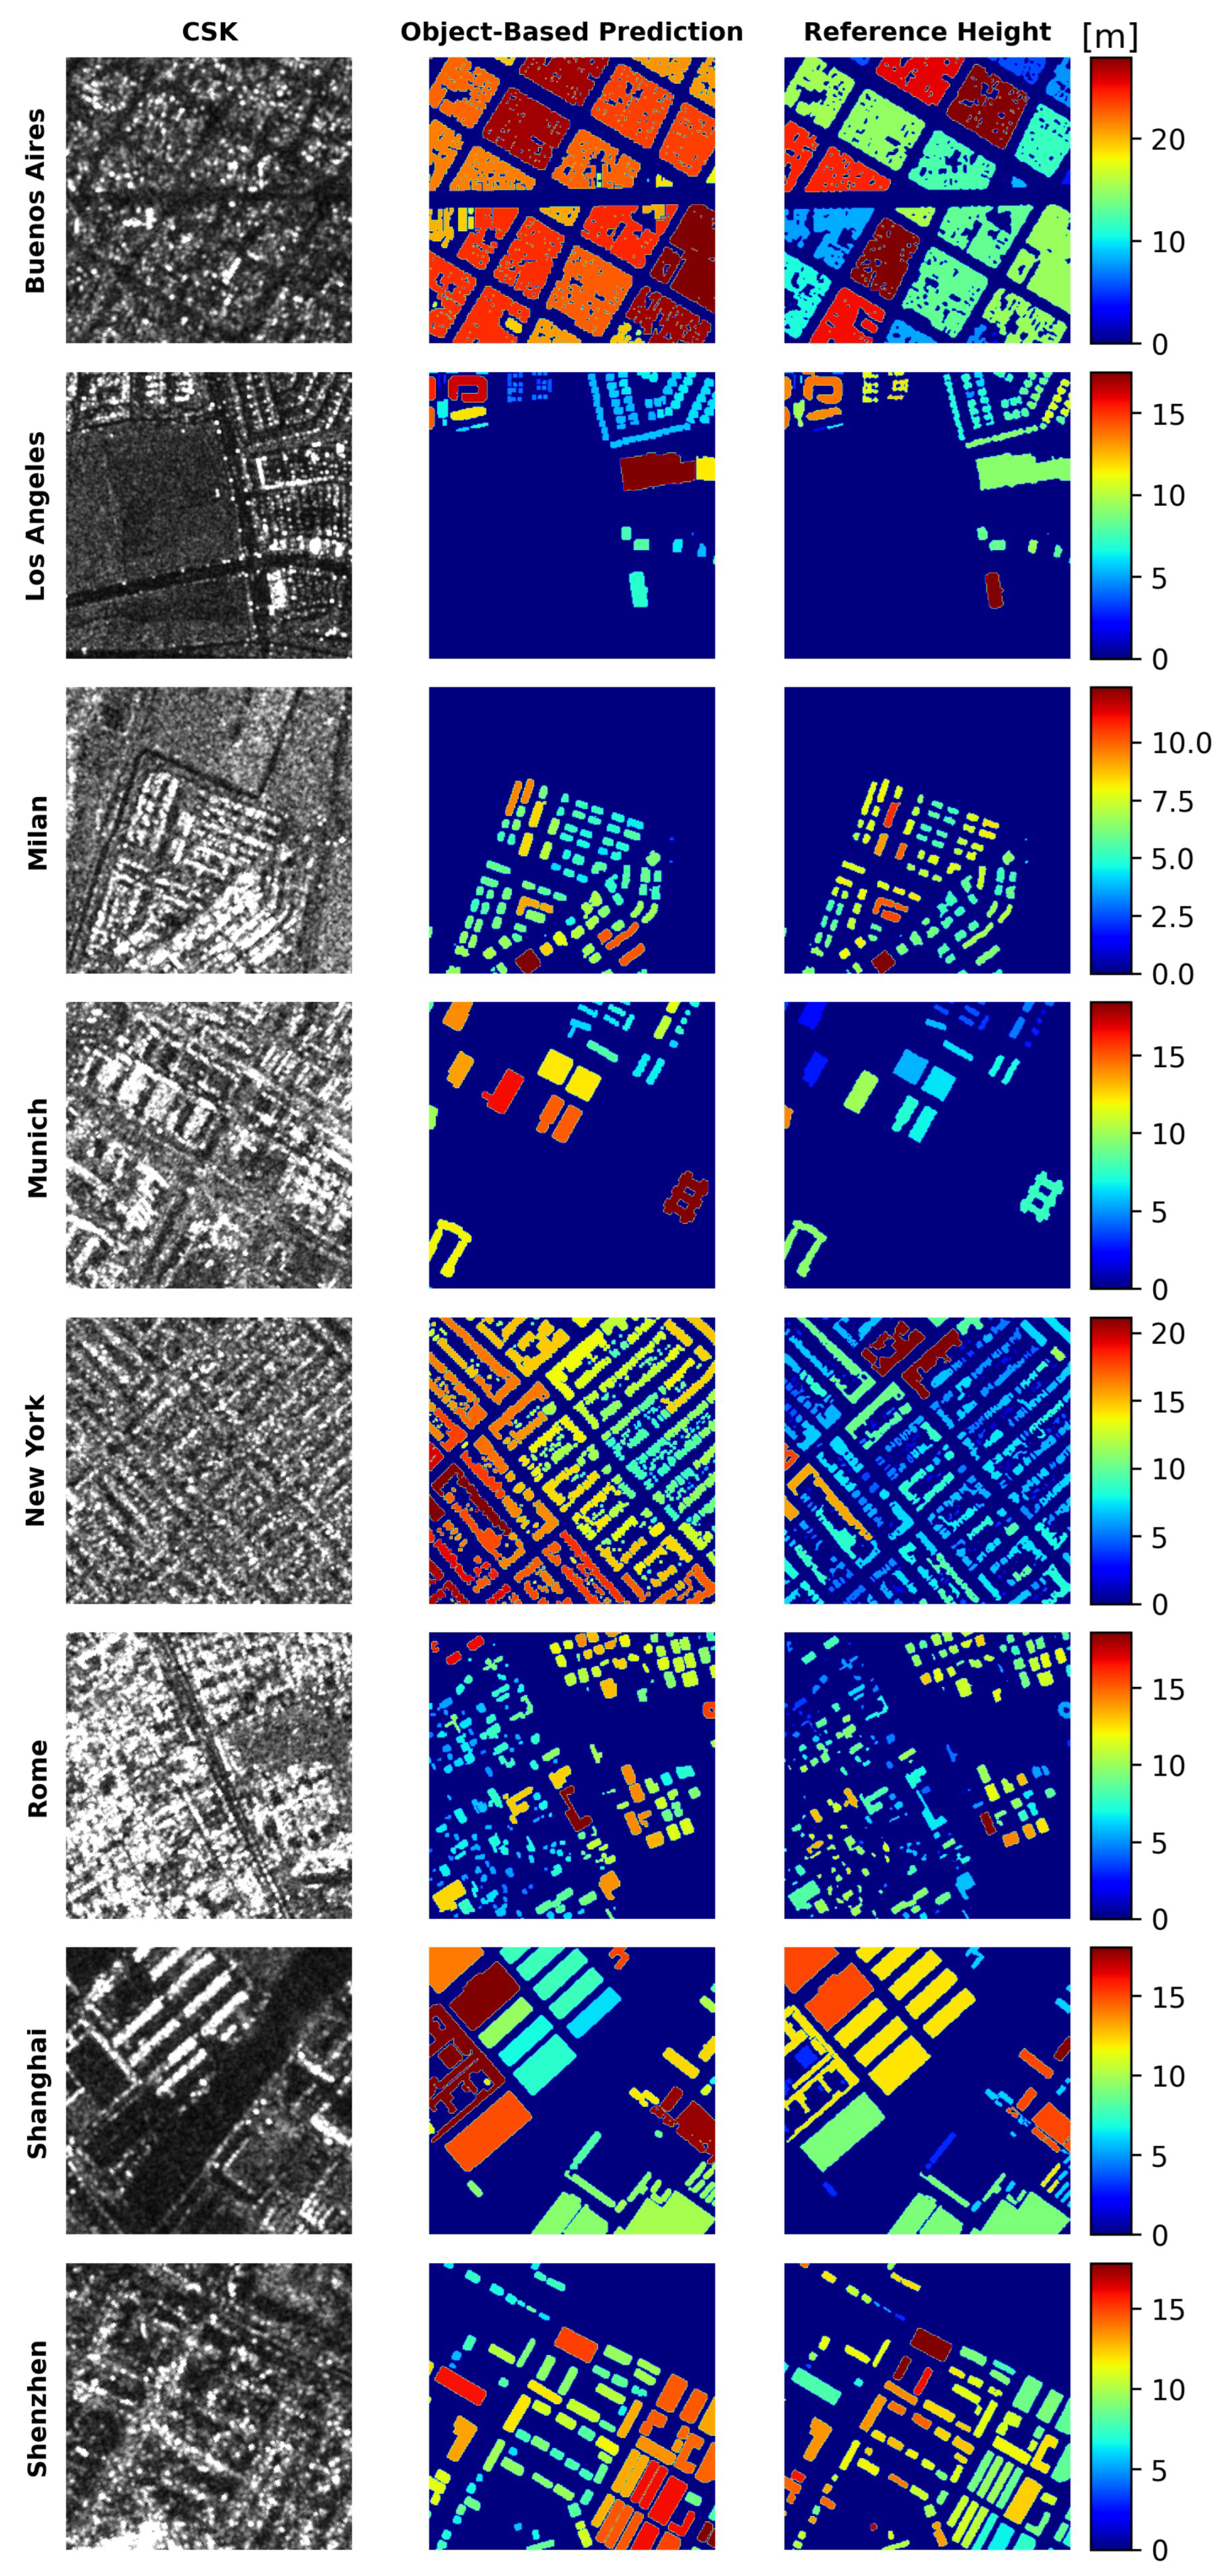
Once the backbone and the extra features were decided, in a second set of experiments, a cross-validation strategy was considered. Accordingly, in eight different experiments, the data from seven cities served as the training dataset, while the remaining city was used for evaluation. This strategy ensures a comprehensive assessment of the generalization capabilities of the two methodologies on unseen urban environments, as they were trained on data from diverse geographical regions, across different continents. The quantitative results are presented in Table 5. MAE and RMSE were computed across three scenarios: for all buildings, for buildings with a reference height below 40 m, and for buildings above 40 m. This classification enables a deeper analysis of the performance over different building height ranges, offering a more comprehensive assessment of the obtained precision in both low-rise and high-rise urban contexts. Qualitative examples illustrating these results for several cities are also shown Figure 6.

4. Discussion

The results reveal a complex interplay between methodology and urban environment. In Buenos Aires, the relatively poor performance of the method is likely attributed to the exceptionally high building density, a factor that complicates object identification and delineation in SAR imagery. The extensive overlap of structures poses a significant challenge for any object-based methodology, which relies on accurate building boundary box detection. A similar behavior is observed for New York. Here, a contributing factor is the exceptionally high density of very tall buildings within specific areas of the city. For instance, Manhattan exhibits one of the highest densities of buildings exceeding 40 m in height, a feature that is not equally present in the other cities analyzed in this study.
Conversely, the proposed approach demonstrates good performances in Los Angeles. Los Angeles’s urban landscape, characterized by more distinct building separation compared to Buenos Aires, likely facilitates more accurate object delineation, thus benefiting the object-based approach. In Milan, the approach exhibits excellent performances (MAE: 2.26 m, RMSE: 3.67 m), suggesting that, in cities with moderate building density and complexity, object-based approaches are working well. However, it struggles in cities with a high prevalence of tall buildings and complex architectural diversity, such as Shenzhen (MAE: 10.51 m, RMSE: 16.35 m) and Shanghai. The uneven distribution of building heights in the training data, skewed towards lower buildings (as illustrated in Figure 2), likely hindered the models’ ability to generalize effectively to these cities with a high proportion of skyscrapers. Furthermore, the intricate architectural styles and high building density in these Asian megacities introduce significant challenges for accurate height estimation.
Figure 7 presents a detailed spatial analysis of the absolute errors in height estimation across eight cities, offering insights that go beyond the aggregate metrics reported in Table 5. The high concentration of points with relatively small errors, particularly in areas corresponding to buildings under 40 m, as also confirmed by the building height distribution in Table 2, suggests a consistent and reliable performance for the most common building stock. This spatial coherence in error magnitudes reinforces the overall robustness of the method in low- to mid-rise urban environments.
At the same time, the scatter plots reveal notable regions of divergence. The increased presence of points with larger errors in areas characterized by taller or more architecturally complex structures visually confirms the challenges faced by the method as the building height increases. These observations are consistent with the higher error values reported in Table 5 for buildings exceeding 40 m.
A more in-depth analysis of the scatter plots further suggests that specific urban morphologies or building typologies within individual cities may systematically lead to larger estimation discrepancies. This raises important questions about the influence of factors such as building density, architectural diversity, or even the imaging conditions and limitations inherent to SAR data in different geographic contexts. Gaining a deeper understanding of these interactions could help identify the operational boundaries of the proposed methodology and guide future improvements for enhanced adaptability across diverse urban landscapes.
As a final test, the results of the proposed methodology are compared to state-of-the-art approaches in the same cities as in Table 6. It is worth noting that, given the range and diversity of cities considered in this study, no single reference could serve as a universal benchmark across all experimental settings. Accordingly, comparisons were performed on a city basis, by looking at the best reported results for specific cities by means of other scientifically validated techniques and input datasets.
In Los Angeles, the proposed model can be compared with, and actually outperforms, the results in [14]. Indeed, it achieved an MAE of 2.24 m vs. a reported MAE of 4.66 m in the above-mentioned study, as well as an RMSE of 3.29 m vs. 6.42 m. In contrast, for New York City, the performance was slightly worse (MAE: 7.43 m vs. 6.24 m and RMSE: 9.36 m vs. 8.28 m).
In the case of Milan, the T-SwinUNet model from [12] was used for comparison. Yadav et al. reported an MAE of 3.54 m and an RMSE of 4.54 m, whereas the proposed method yields better results (MAE: 2.26 m; RMSE: 3.67 m). It must be noted that [12] exploits multimodal and multitemporal data from Sentinel-1 and Sentinel-2, hence incorporating additional input information and spatio-temporal attention mechanisms. Nevertheless, our method brings an improvement that can be partly attributed to the use of VHR SAR images (COSMO-SkyMed vs. Sentinel-1).
The last city for which we compared the extraction results with those reported in the scientific literature is Shenzhen. We used the study in [26] for comparison, where the authors developed an effective Building Height Estimation method by synergizing photogrammetry and deep learning methods (BHEPD) to leverage Chinese multi-view GaoFen-7 (GF-7) images for high-resolution building height estimation. The results indicate that BHEPD outperforms our model, achieving better MAE and RMSE values, 4.00 m and 6.72 m, respectively. This represents the worst performance of the proposed method used in this research and was left for a fair comparison and evaluation. This result (in disagreement with the other ones) can be attributed to the unique characteristics of Shenzhen: as shown in Figure 2, this city has a significantly high frequency of buildings taller than 40 m. Consequently, when this city is excluded from the training set and used as test data (recall that our experiments are OOD), the model has a limited exposure to tall building heights, resulting in poorer height estimates. Furthermore, it is essential to consider the impact of building footprint dimensions on the accuracy of height estimation in the object-based methodology. In these urban settings, it is common to encounter very tall buildings, such as skyscrapers, with narrow footprints, which can complicate the estimation process in SAR (i.e., slanted) images.
This city-specific comparison effectively describes how the proposed methodology performs under various urban conditions across different cities. In Los Angeles and New York, it demonstrates competitive accuracy relative to benchmark studies. In Milan, the use of VHR SAR images yields improved accuracy compared to state-of-the-art models that rely on multimodal and multitemporal composites, while in Shenzhen, the prevalence of tall buildings with narrow footprints poses big challenges and limits to the model performance.
Finally, Table 7 provides a summary of the key characteristics of the object-based building height estimation methodology proposed in this work. Among the reported metrics, inference speed, measured in frames per second (FPS), is of particular importance. In this context, FPS denotes the number of building-specific image patches processed per second during inference, a metric widely adopted in the remote sensing literature to assess the computational efficiency in large-scale data processing scenarios [27].
The proposed approach is designed to operate on a per-object basis, whereby individual buildings are treated as separate instances. It requires as input a single VHR SAR image, a building footprint mask, and the corresponding footprint bounding box (FBB). Each building instance is processed independently, and a single height value is estimated using a deep convolutional network based on the ResNet-101 architecture.
Despite the model’s complexity (over 42 million trainable parameters), it demonstrates competitive computational efficiency, achieving an average inference throughput of 390.06 FPS and a training time per epoch of approximately six minutes. This efficiency is largely attributable to the object-level formulation, which eliminates the need for dense, pixel-wise prediction over large image areas.
Nevertheless, the method relies on the availability of building footprint data at both the training and inference stages, which can limit its applicability in scenarios where such ancillary information is incomplete or unavailable. Moreover, its performance may degrade in densely built-up areas, where structural complexity and SAR-specific imaging artifacts hinder accurate footprint delineation.
It should be noted that the proposed method is not limited to COSMO-SkyMed data and can be applied to data from other satellites with only minor modifications. In fact, a single adjustment is required to ensure compatibility. In the proposed framework for building height estimation, satellite acquisition parameters are used to calculate the length and width of the FBB, which are incorporated as additional input features. These geometric features are derived from the inclination angle and orbital path of the satellite. Consequently, when applying the method to imagery acquired from a different satellite, these features must be recalculated to reflect the specific sensor geometry and acquisition parameters, as variations in these factors can significantly influence the accuracy of the estimated heights. This adaptability highlights the scalability and general applicability of the proposed approach on different SAR platforms.
Despite these limitations, the object-based approach remains a robust and efficient solution for building height estimation in settings where high-quality footprint data are available. Its ability to deliver fast inference and precise, instance-level predictions makes it particularly well suited for large-scale urban analysis.

5. Conclusions

This study presents and thoroughly evaluates an object-based methodology for the challenging task of building height estimation from single VHR SAR imagery. The main goals of this paper were to reduce time and computational costs using single-time-acquisition VHR SAR images for each city and to train a scalable model to be applied across different continents with a reasonable amount of error.
Eight test sites (Buenos Aires, Los Angeles, Milan, Munich, New York, Rome, Shanghai, and Shenzhen) were selected in order to provide diverse training and test sets due to the different built-up structure distributions and different cultural and historical urban settings. The experiments provided transparent critical insights into the strengths and weaknesses of the proposed approach under realistic conditions, especially in the OOD experiments.
A key highlight of this research is the strong generalization capability demonstrated for the European cities. Indeed, achieving an accuracy of approximately one building story in an out-of-distribution setting, surpassing that of recent methodologies, underscores the effectiveness of the proposed DL frameworks. This performance demonstrates its potential for deployment in urban environments that are geographically and architecturally similar, even when city-specific training data are not available. While performance on North American and South American cities remained competitive, the noticeable decrease in accuracy observed for much more recently built cities in China (Shanghai and Shenzhen) points to the challenges in achieving robust cross-continental generalization. Factors such as distinct architectural styles, varying building densities, and the prevalence of very high-rise structures appear to pose a greater challenge for current methodologies. This suggests that, while the foundational framework shows significant promise for transfer learning, further research is needed to bridge the gap in performance across highly diverse global urban landscapes.
Looking ahead, future work could focus on enhancing the model’s ability to generalize across diverse global urban landscapes, particularly in cities with a high prevalence of tall buildings and complex architectural diversity. In addition, it is also possible to incorporate ascending orbit images and explore methods based on data fusion to enhance the reliability of the approach. Furthermore, it would be interesting to compare first and then possibly combine object-based and pixel-based methodologies to exploit their respective strengths. For generalization in specific urban landscapes, the use of fine-tuning techniques could also be explored to adapt pre-trained models to new cities more effectively.
Author Contributions

Conceptualization, P.G., S.L.U., B.M. and L.R.; methodology, B.M. and L.R.; software, B.M. and L.R.; validation, B.M. and L.R.; formal analysis, P.G. and S.L.U.; data curation, B.M. and L.R.; writing—original draft preparation, B.M. and L.R.; writing—review and editing, P.G. and S.L.U.; visualization, L.R.; supervision, P.G.; funding acquisition, P.G. All authors have read and agreed to the published version of the manuscript.

Funding

This research was performed in the framework of a Ph.D. funded by NextGenerationEU, Action 4, DM n. 118, 02/03/2023.

Data Availability Statement

The data is available to the authors by a research agreement with ASI, and can be provided upon request to other researchers after a similar agreement between their institution(s) and ASI is signed.

Conflicts of Interest

The authors declare no conflicts of interest.

References

  1. Gomroki, M.; Hasanlou, M.; Chanussot, J. Automatic 3D Multiple Building Change Detection Model Based on Encoder–Decoder Network Using Highly Unbalanced Remote Sensing Datasets. IEEE J. Sel. Top. Appl. Earth Obs. Remote Sens. 2023, 16, 10311–10325. [Google Scholar] [CrossRef]
  2. Xiao, W.; Cao, H.; Tang, M.; Zhang, Z.; Chen, N. 3D urban object change detection from aerial and terrestrial point clouds: A review. Int. J. Appl. Earth Obs. Geoinf. 2023, 118, 103258. [Google Scholar] [CrossRef]
  3. He, J.; Cheng, Y.; Wang, W.; Ren, Z.; Zhang, C.; Zhang, W. A Lightweight Building Extraction Approach for Contour Recovery in Complex Urban Environments. Remote Sens. 2024, 16, 740. [Google Scholar] [CrossRef]
  4. Hao, M.; Chen, S.; Lin, H.; Zhang, H.; Zheng, N. A prior knowledge guided deep learning method for building extraction from high-resolution remote sensing images. Urban Inform. 2024, 3, 6. [Google Scholar] [CrossRef]
  5. Kim, Z.; Nevatia, R. Automatic description of complex buildings from multiple images. Comput. Vis. Image Underst. 2004, 96, 60–95. [Google Scholar] [CrossRef]
  6. Noronha, S.; Nevatia, R. Detection and modeling of buildings from multiple aerial images. IEEE Trans. Pattern Anal. Mach. Intell. 2001, 23, 501–518. [Google Scholar] [CrossRef]
  7. Henricsson, O. The role of color attributes and similarity grouping in 3-D building reconstruction. Comput. Vis. Image Underst. 1998, 72, 163–184. [Google Scholar] [CrossRef]
  8. Cai, B.; Shao, Z.; Huang, X.; Zhou, X.; Fang, S. Deep learning-based building height mapping using Sentinel-1 and Sentinel-2 data. Int. J. Appl. Earth Obs. Geoinf. 2023, 122, 103399. [Google Scholar] [CrossRef]
  9. Ronneberger, O.; Fischer, P.; Brox, T. U-Net: Convolutional networks for biomedical image segmentation. In Medical Image Computing and Computer-Assisted Intervention–MICCAI 2015, Proceedings of the 18th International Conference, Munich, Germany, 5–9 October 2015; Proceedings, Part III 18; Springer: Cham, Switzerland, 2015; pp. 234–241. [Google Scholar]
  10. Nascetti, A.; Yadav, R.; Ban, Y. A CNN Regression Model to Estimate Buildings Height Maps Using Sentinel-1 SAR and Sentinel-2 MSI Time Series. In Proceedings of the IGARSS 2023—2023 IEEE International Geoscience and Remote Sensing Symposium, Pasadena, CA, USA, 16–21 July 2023; pp. 2831–2834. [Google Scholar] [CrossRef]
  11. Ma, C.; Zhang, Y.; Guo, J.; Zhou, G.; Geng, X. FusionHeightNet: A Multi-Level Cross-Fusion Method from Multi-Source Remote Sensing Images for Urban Building Height Estimation. Remote Sens. 2024, 16, 958. [Google Scholar] [CrossRef]
  12. Yadav, R.; Nascetti, A.; Ban, Y. How high are we? Large-scale building height estimation at 10 m using Sentinel-1 SAR and Sentinel-2 MSI time series. Remote Sens. Environ. 2025, 318, 114556. [Google Scholar] [CrossRef]
  13. Li, X.; Zhou, Y.; Gong, P.; Seto, K.C.; Clinton, N. Developing a method to estimate building height from Sentinel-1 data. Remote Sens. Environ. 2020, 240, 111705. [Google Scholar] [CrossRef]
  14. Kaya, Y. Automated Estimation of Building Heights with ICESat-2 and GEDI LiDAR Altimeter and Building Footprints: The Case of New York City and Los Angeles. Buildings 2024, 14, 3571. [Google Scholar] [CrossRef]
  15. Champion, N.; Boldo, D.; Pierrot-Deseilligny, M.; Stamon, G. 2D building change detection from high resolution satelliteimagery: A two-step hierarchical method based on 3D invariant primitives. Pattern Recognit. Lett. 2010, 31, 1138–1147. [Google Scholar] [CrossRef]
  16. Katartzis, A.; Sahli, H. A Stochastic Framework for the Identification of Building Rooftops Using a Single Remote Sensing Image. IEEE Trans. Geosci. Remote Sens. 2008, 46, 259–271. [Google Scholar] [CrossRef]
  17. Recla, M.; Schmitt, M. The SAR2Height framework for urban height map reconstruction from single SAR intensity images. ISPRS J. Photogramm. Remote Sens. 2024, 211, 104–120. [Google Scholar] [CrossRef]
  18. Sun, Y.; Mou, L.; Wang, Y.; Montazeri, S.; Zhu, X.X. Large-scale building height retrieval from single SAR imagery based on bounding box regression networks. ISPRS J. Photogramm. Remote Sens. 2022, 184, 79–95. [Google Scholar] [CrossRef]
  19. Covello, F.; Battazza, F.; Coletta, A.; Lopinto, E.; Fiorentino, C.; Pietranera, L.; Valentini, G.; Zoffoli, S. COSMO-SkyMed an existing opportunity for observing the Earth. J. Geodyn. 2010, 49, 171–180. [Google Scholar] [CrossRef]
  20. Milojevic-Dupont, N.; Wagner, F.; Nachtigall, F.; Hu, J.; Brüser, G.B.; Zumwald, M.; Biljecki, F.; Heeren, N.; Kaack, L.H.; Pichler, P.P.; et al. EUBUCCO v0.1: European building stock characteristics in a common and open database for 200+ million individual buildings. Sci. Data 2023, 10, 147. [Google Scholar] [CrossRef]
  21. Egger, P.; Rao, S.X.; Papini, S. Building Floorspace in China: A Dataset and Learning Pipeline. arXiv 2023, arXiv:2303.02230. [Google Scholar] [CrossRef]
  22. Wangiyana, S.; Samczyński, P.; Gromek, A. Data augmentation for building footprint segmentation in SAR images: An empirical study. Remote Sens. 2022, 14, 2012. [Google Scholar] [CrossRef]
  23. He, K.; Zhang, X.; Ren, S.; Sun, J. Deep residual learning for image recognition. In Proceedings of the IEEE Conference on Computer Vision and Pattern Recognition, Las Vegas, NV, USA, 27–30 June 2016; pp. 770–778. [Google Scholar]
  24. Xiong, Z.; Wang, Y.; Zhang, F.; Stewart, A.J.; Hanna, J.; Borth, D.; Papoutsis, I.; Saux, B.L.; Camps-Valls, G.; Zhu, X.X. Neural Plasticity-Inspired Foundation Model for Observing the Earth Crossing Modalities. arXiv 2024, arXiv:2403.15356. [Google Scholar] [CrossRef]
  25. Li, Y.; Mao, H.; Girshick, R.; He, K. Exploring Plain Vision Transformer Backbones for Object Detection. In Computer Vision—-ECCV 2022; Avidan, S., Brostow, G., Cissé, M., Farinella, G.M., Hassner, T., Eds.; Springer: Cham, Switzerland, 2022; pp. 280–296. [Google Scholar]
  26. Chen, P.; Huang, H.; Liu, J.; Wang, J.; Liu, C.; Zhang, N.; Su, M.; Zhang, D. Leveraging Chinese GaoFen-7 imagery for high-resolution building height estimation in multiple cities. Remote Sens. Environ. 2023, 298, 113802. [Google Scholar] [CrossRef]
  27. Russo, L.; Sorriso, A.; Ullo, S.L.; Gamba, P. A Deep Learning Architecture for Land Cover Mapping Using Spatio-Temporal Sentinel-1 Features. IEEE J. Sel. Top. Appl. Earth Obs. Remote Sens. 2025, 18, 10562–10581. [Google Scholar] [CrossRef]
Figure 1. Study area consisting of 8 cities: Los Angeles, New York, Buenos Aires, Munich, Milan, Rome, Shanghai, and Shenzhen is highlighted in red across 3 different continents.
Remotesensing 17 02922 g001
Figure 2. Building height density distributions for the eight cities considered in this study. As shown in the figure, the distributions exhibit a typical long-tail pattern, characteristic of urban environments, where lower buildings are predominant, while taller structures are less frequent.
Remotesensing 17 02922 g002
Figure 3. Graphical representation of a building in the UTM and SAR image coordinate systems.
Remotesensing 17 02922 g003
Figure 4. Extracting FBB with a consideration of the inclination angle: (a) building footprint in New York City, (b) FBB before and (c) after angle correction, and the corresponding (d) optical and (e) SAR images with superimposed FBB and BBB (yellow and red boxes, overlap in orange).
Remotesensing 17 02922 g004
Figure 5. Overview of the proposed workflow for the object-based building height estimation. The model utilizes ResNet101 as the backbone in combination with the extracted features from the 2D coordinates of the building. After generating the extra features using the footprint of the buildings, the model concatenates a SAR image and the corresponding footprint from the training dataset. Using the extracted features and the 2D coordinates information, the network predicts the building projected footprint to estimate the height of the building.
Remotesensing 17 02922 g005
Figure 6. Comparison of building height estimation results for different cities. Each row displays an image patch for a specific city (from top to bottom: Buenos Aires, Los Angeles, Milan, Munich, New York, Rome, Shanghai, and Shenzhen), showing (from left to right) the CSK input SAR patch, the object-based height estimation, and the corresponding ground truth height map. The predictions are OOD, computed from models trained on all the other cities.
Remotesensing 17 02922 g006
Figure 7. Scatter plots of absolute errors per city relative to reference heights. Each point represents the error of a single building.
Remotesensing 17 02922 g007
Table 1. Overview of COSMO-SkyMed images utilized in this study. For each city, with the exception of Los Angeles, one SAR image was selected with the same orbital pass and polarization, and the closest time interval to the corresponding reference data. In Los Angeles case, the extensive urban area and the variety of reference data led to the utilization of three SAR images. The coverage area refers to both urban and non-urban areas.
CityAcquisition DateIncidence Angles (°)Coverage Area (km2)PolarizationOrbit Pass
Buenos Aires10 January 202126.4885.56HHDescending
Los Angeles (northwest)5 January 201747.38661.68HHDescending
Los Angeles (southwest)5 January 201747.38250.28HHDescending
Los Angeles (southeast)4 April 201750.09144.50HHDescending
Milan18 November 202230.552040.95HHDescending
Munich29 July 202220.042694.41HHDescending
New York5 January 202424.03751.86HHDescending
Rome18 September 202324.612027.173HHDescending
Shanghai31 August 201830.543312.83HHDescending
Shenzhen2 April 201729.011865.15HHDescending
Table 2. Overview of reference data for each study area. It reflects the diversity of urban environments and building heights across eight different cities in this study, and includes information about the year of data collection, the number of data patches, the number of buildings categorized by height, and the data provider for each city.
CityYear#Patches#BuildingsProvider
h < 40 mh ≥ 40 m
Buenos Aires2021579544,72613,888BA Data
Los Angeles20173817857,521578Los Angeles GeoHub
Milan20227929252,54072EUBUCCO
Munich202210,49586,84280EUBUCCO
New York20242643719,8084212NYC Open Data
Rome20227802303,093139EUBUCCO
Shanghai201712,935316,93524,646Research Collection
Shenzhen20176879308,42920,034Research Collection
Table 3. Quantitative comparison of building height estimation using different backbones for the in-distribution (ID) test, where the entire dataset (without any geographic split) was divided into 70 % for training and 30 % for validation. Values in bold refer to the outcomes of this paper’s experiments.
BackboneMAE [m]RMSE [m]
∀ hh < 40 mh ≥ 40 m∀ hh < 40 mh ≥ 40 m
DOFA [24]5.454.6343.679.646.5349.35
U-Net [9]5.144.3541.569.366.6047.61
Different ResNet1016.555.0657.5212.797.2362.96
This paper4.954.2835.638.876.5741.09
Table 4. Quantitative comparison of average height estimation results obtained using four vs. two additional features (see text). The data were randomly split into training and testing subsets using a 70–30 ratio, and the experiments were repeated with five different seed values.
SeedsExtra Features MAE ¯ [m] RMSE ¯ [m]
12, 22, 32, 42, 524 elements7.0010.80
2 elements5.4110.36
Table 5. Quantitative evaluation of the object-based building height estimates across the eight different unseen cities for each run.
CityMAE [m]RMSE [m]
∀ hh < 40 mh ≥ 40 m∀ hh < 40 mh ≥ 40 m
Buenos Aires8.667.7943.1513.4311.4446.15
Los Angeles2.242.2153.363.293.0259.71
Milan2.262.2537.913.673.6139.01
Munich2.202.1661.773.973.4674.42
New York7.437.2636.199.368.7942.93
Rome10.7110.7020.0212.8112.8030.52
Shanghai10.008.0834.6814.8910.5140.64
Shenzhen10.518.3144.3216.3510.5851.57
Table 6. Comparison of the proposed model with state-of-the-art methodology applied to some of the cities belonging to our dataset.
CityMethodologyMAE [m]RMSE [m]
Los AngelesKaya [14]4.666.42
This paper 2.243.29
MilanT-SwinUNet [12]3.544.54
This paper 2.263.67
New YorkKaya [14]6.248.28
This paper 7.439.36
ShenzhenBHEPD [26]4.006.72
This paper 10.5116.35
Table 7. Summary of the object-based building height estimation methodology proposed in this study.
CharacteristicObject-Based Approach (This Paper)
Input dataVHR SAR image + Footprint mask + FBB
Output typeSingle height value per building
Model backboneResNet-101
Trainable parameters42,501,762
Training time per epoch≈6 min
Inference speed390.06 FPS
StrengthsFast inference; object-level accuracy
LimitationsSensitive to very dense urban morphologies
Disclaimer/Publisher’s Note: The statements, opinions and data contained in all publications are solely those of the individual author(s) and contributor(s) and not of MDPI and/or the editor(s). MDPI and/or the editor(s) disclaim responsibility for any injury to people or property resulting from any ideas, methods, instructions or products referred to in the content.