Article

Polarmetric Consistency Assessment and Calibration Method for Quad-Polarized ScanSAR Based on Cross-Beam Data

1
Aerospace Information Research Institute, Chinese Academy of Sciences, Beijing 100094, China
2
School of Electronic, Electrical and Communication Engineering, University of Chinese Academy of Sciences, Beijing 101408, China
3
Key Laboratory of Target Cognition and Application Technology (TCAT), Beijing 100190, China
4
Key Laboratory of Technology in Geo-Spatial Information Processing and Application System, Beijing 100190, China
5
Aerospace Information Research Institute of QiLu, Jinan 250101, China
6
Institute of Remote Sensing Satellite, China Aerospace Science and Technology Corporation, Beijing 100094, China
7
Suzhou Aerospace Information Research Institute, Suzhou 215000, China
8
Suzhou Key Laboratory of Microwave Imaging, Processing and Application Technology, Suzhou 215000, China
*
Author to whom correspondence should be addressed.
Remote Sens. 2025, 17(20), 3420; https://doi.org/10.3390/rs17203420 (registering DOI)
Submission received: 9 August 2025 / Revised: 29 September 2025 / Accepted: 10 October 2025 / Published: 13 October 2025

Abstract

Highlights

What are the main findings?
  • This paper investigates the effectiveness of utilizing cross-beam area images for polarimetric calibration on quad-polarized wide-swath SAR data.
What is the implication of the main finding?
  • This study can effectively reduce the workload and time required for conducting quad-polarized wide-swath SAR data calibration.

Abstract

The range-dependence on polarization distortion of spaceborne polarimetric synthetic aperture radar (SAR) affects the accuracy of wide-swath polarization applications, such as environmental monitoring, sea ice classification and ocean wave inversion. Traditional calibration methods, assessing the distortion mainly based on ground experiments, suffer from tedious active calibrator deployment work, which are time-consuming and cost-intensive. This paper proposes a novel polarimetric assessment and calibration method for the quad-polarized wide-swath ScanSAR imaging mode. Firstly, by using distributed target data that satisfy the system reciprocity requirement, we assess the polarization distortion matrices for a single beam in the mode. Secondly, we transfer the matrix results from one beam to another by analyzing data from the overlapping region between beams. Thirdly, we calibrate the quad-polarized data and achieve an overall assessment and calibration results. Compared to traditional calibration methods, the presented method focuses on using cross-beam (overlapping area) data to reduce the dependence on active calibrators and avoid conducting calibration work beam-by-beam. The assessment and calibration experiment is conducted on Gaofen-3 quad-polarized ScanSAR experiment mode data. The calibrated images and polarization decomposition results are compared with those from well-calibrated quad-polarized Stripmap mode data located in the same region. The results of the comparison revealed the effectiveness and accuracy of the proposed method.

1. Introduction

Polarimetric SAR (PolSAR) data have greatly enriched the applications of SAR radar satellites [1,2,3,4,5]. In particular, quad-polarized polarimetric data can improve the effectiveness of classification [6,7,8], target detection [9,10,11], identification [12], etc. Stripmap (SM) and ScanSAR (SC) are two commonly used PolSAR operating modes. In polarized SM, the width of an image swath is in the range of tens of kilometers [1,4]. Benefiting from rapid beam switching, the radar can cover a larger image swath of hundreds of kilometers in polarized SC [13,14,15]. A larger swath can obtain much more polarimetric information while SAR captures images. Therefore, quad-polarized SC is a more efficient PolSAR data acquisition mode. To ensure the accuracy of applications using quad-polarized SC data, research on the polarimetric assessment and calibration process of these data is essential.
In the past two decades, almost all advanced SAR radar satellites around the world have been designed as polarimetric SAR satellites [1,3,4,5]. TerraSAR-X, launched in 2007 by Germany, provides dual-polarized SM data and single-polarized SC data [14,15]. Following that, all publicly reported PolSAR satellites have been designed with a mode combination of quad-polarized SM and dual-polarized SC/TOPS mode, such as RADARSAT-2 [16], Sentinel-1A [17], and Gaofen-3 [5], among others. Under this circumstance, rich quad-polarimetric information can be obtained through use of the SM mode but with a limited swath of tens of kilometers. However, with continued advancement in SAR payload technology, a quad-polarized wide-swath imaging mode presents the potential for polarimetric application in near-future SAR satellites.
With the rapid development of PolSAR satellites, polarimetric assessment and calibration technologies have also made significant progress [12,18,19,20,21]. There are two main types of polarimetric precessing approaches. One calibration approach is based on active calibrators [18,22,23], which are ideal point targets with known scattering signatures. The other is based on distributed ground targets that have certain radiometric and polarimetric characteristics [24,25]. When carrying out satellite calibration experiments, both approaches are often used to achieve the highest calibration efficiency [26,27]. As an illustration, when performing polarimetric calibration on TerraSAR-X, scientists used distributed targets to calibrate polarimetric crosstalk and ideal point targets to calibrate the channel imbalance between H-V [28]. In the case of RADARSAT-2, tropical rainforest was used as distributed targets to calibrate channel imbalance, while polarimetric crosstalk was addressed using artificial point targets [29,30]. However, current satellite systems are limited to quad-polarized SM configurations. Most of these polarimetric calibration experiments were not applicable to the quad-polarized SC mode.
Cross-calibration methods, which were first used to calibrate optical imaging satellites [31,32,33], are gradually being applied to the radiometric calibration of SAR satellites [28,34]. The data of well-calibrated satellites are used to assess and calibrate other satellites of the same type. These approaches avoid reliance on active calibrators and reduce the requirement for the selection of distributed ground targets. However, it is important to note that the same target, viewed at different incidence angles, will present different polarimetric representations. This shows that the polarimetric information is sensitive to variation in the incidence angle. Therefore, the cross-calibration method has not yet been employed in the polarimetric assessment and calibration of the PolSAR satellites.
The major challenges in polarimetric consistency assessment and calibration on quad-polarized SC mode data can be summarized as follows:
  • The SC mode has a large illumination area. In order to obtain assessment results across the region, conventional methods have to deploy an active calibrator in this large area. Moreover, a calibration often consists of several experiments. The calibrators have to be moved over long distances and re-deployed between these experiments. Both od these processes are very labor-intensive and time-consuming.
  • In SC mode, one single task contains multiple beams switching rapidly in turn. Assessment and calibration performed beam-by-beam can multiply the workload several times compared to the SM mode. Meanwhile, constrained by the satellite review period, some of the beams may not be able to reach the calibration field in several weeks. This means that the overall assessment of a SAR satellite may be delayed by weeks due to the lack of results for a few beams.
  • Methods that use an active calibrator or volume scattering distributed targets to assess polarimetric performance can only achieve results that are not correlated between beams. A calibration based on these results may lead to leaps in the overlapping area, which affects the polarimetric consistency of the mosaic-ed image.
We proposed a method for the polarimetric assessment and calibration of the quad-polarized SC mode, which consists of two distinct parts. One part is an accuracy assessment for a single-beam image using volume-scattering distributed targets inside the beam. The other part is a consistency calibration for mosaic-ed images using the cross-beam data mentioned above.
In general, the main contributions of this method are as follows.
  • To reduce the need for active calibrators to conduct polarimetric calibration work in SC mode. The method selects volume-scattering distributed targets that satisfy the system reciprocity requirement to perform an assessment of the amplitude and phase imbalance within a single beam in SC mode. Based on the assessment results, the calibrated data are used to generate a Pauli pseudo-color image. The image is accurately color-coded, thereby demonstrating the effectiveness of the assessment and calibration process.
  • To avoid performing polarimetric calibration beam-by-beam, a method using cross-beam data to assess polarimetric distortion difference between beams has been proposed. By introducing the concept of polarization contrast ratio (PCR), the method selects certain distributed targets located in the cross-beam area to assess the amplitude and phase differences at different polarizations. Furthermore, we can transmit the polarimetric distortion matrix across different beams, which can effectively improve the efficiency of the assessment and calibration work.
  • With the transfer of the polarimetric distortion matrix, the method also improves the polarimetric consistency of the mosaic-ed image. Based on the transferred assessment results, a mosaic-ed Pauli pseudo-color image is generated. The image shows good consistency across beams, which also validates the effectiveness of the method.
The rest of this article is organized as follows. Section 2 mainly describes the data used to verify our method and the pre-processing for these data. Section 3 presents detailed methods for an accuracy assessment for a single-beam image and a consistency calibration for mosaic-ed images. Section 4 presents the experimental results on Gaofen-3 quad-polarized SC experiment mode data and the verification results with quad-polarized SM mode data. Finally, Section 5 concludes this article.

2. Study Data and Data Pre-Processing

The Gaofen-3 (GF3), China’s first C-band multi-polarization synthetic aperture radar (SAR) imaging satellite, is the sole SAR satellite in China’s Gaofen satellite series. The GF3 has 12 imaging modes, covering the traditional SM mode to the SC mode, making it an SAR satellite with the most imaging modes in the world. The GF3 is capable of acquiring quad-polarized data over an image width of 30–40 km. In addition, the satellite can acquire dual-polarized data over an image width of 300–500 km in SC mode.
There is no PolSAR system that has ever been operated in a quad-polarized wide-swath mode. By combining the technical features of the GF3’s quad-polarized SM and dual-polarized SC mode, a novel quad-polarized SC mode experiment was conducted. Furthermore, other quad-polarized SM mode data was acquired in the same area. Both data were used for the derivation and validation of the method.

2.1. Quad-Polarized ScanSAR Experiment Data

The GF3 uses SC for large-swath illumination, which can be divided into three categories according to the width of the span: Narrow Scan (NSC), Wide Scan (WSC), and Global Scan (GLO). Seven different beams, each on the left and right side of the satellite, have been designed to meet the requirements of the SC mode. In NSC mode, any three consecutive beams out of seven can be selected; in WSC mode, any five consecutive beams out of seven can be selected; and all of the seven beams are used in GLO mode. The parameters for the GF3 SC mode are shown in the Table 1.
In practice, to acquire quad-polarized SC mode data, the GF3 operates in NSC mode while three SM mode beams are used to replace the original SC mode beams. The experiment was carried out on 29 October 2019 in the Nile basin in north-central Sudan. Much of the scene is covered with bare soil and mountains, while containing several urban areas and forested areas. The satellite was operated in a descending orbit with a right-look view and the SAR payload operated for about a minute. The data have three swaths of 152 bursts each, acquiring image data over approximately 400 km in the azimuth direction. These three beams, which we we use (Q9, Q10, Q11), can each acquire quad-polarized data over a width of about 40 km in the range direction, and the sensible parameter design sets these beams to overlap at a certain distance, which is excellent for assembling a complete SC image. The near-range and far-range look angles of Beam Q9 are 28.51° and 30.21° respectively, of Beam Q10 are 29.74° and 31.39°, and of Beam Q11 are 31.12° and 32.67°. The beamwidth in the range direction of the three beams are 1.7°, 1.65°, and 1.55°, respectively, resulting in an overlap of 0.47° and 0.27° between each two beams. Data in the overlap region, which we call cross-beam data, are invaluable in supporting our work on polarimetric calibration between swaths. Some of the important imaging parameters are listed in Table 2.

2.2. Quad-Polarized SM Data for Validation

The GF3 satellite has two conventional quad-polarized SM modes: QPSI and QPSII. The resolution of the QPSI mode is 8 m, with a width of 30 km. The resolution of the QPSII mode is 25 m, with a width of 40 km. In practice, polarimetric applications that utilize these two modes are quite well-established and effective. This is principally attributable to the annual calibration campaigns for the GF3 using the calibration fields. Such campaigns ensure that the polarimetric accuracy of the image products remains at an optimal level throughout the years.
Fortunately, we found a set of QPSI data from the GF3 located in the same area as our SC experiment data, which was acquired on 26 April 2018 using the beam Q11. It is important to note that since the beam Q11 is one of the three beams of our SC experiment and the satellite was also operated in a descending orbit with a right-look view, the GF3 is roughly in a single path when acquiring these two data. In this case, the illumination areas of the third swath of the experimental data and the QPSI data overlap highly. As mentioned above, the beam Q11 operating in the QPSI mode has already been well calibrated, so the QPSI data can truly reflect the polarimetric characteristics of the local ground feature without any further calibration procedure. Therefore, it is feasible to use the well-calibrated QPSI mode data from the GF3 satellite to verify the polarimetric accuracy of the experiment data.

2.3. Data Pre-Processing

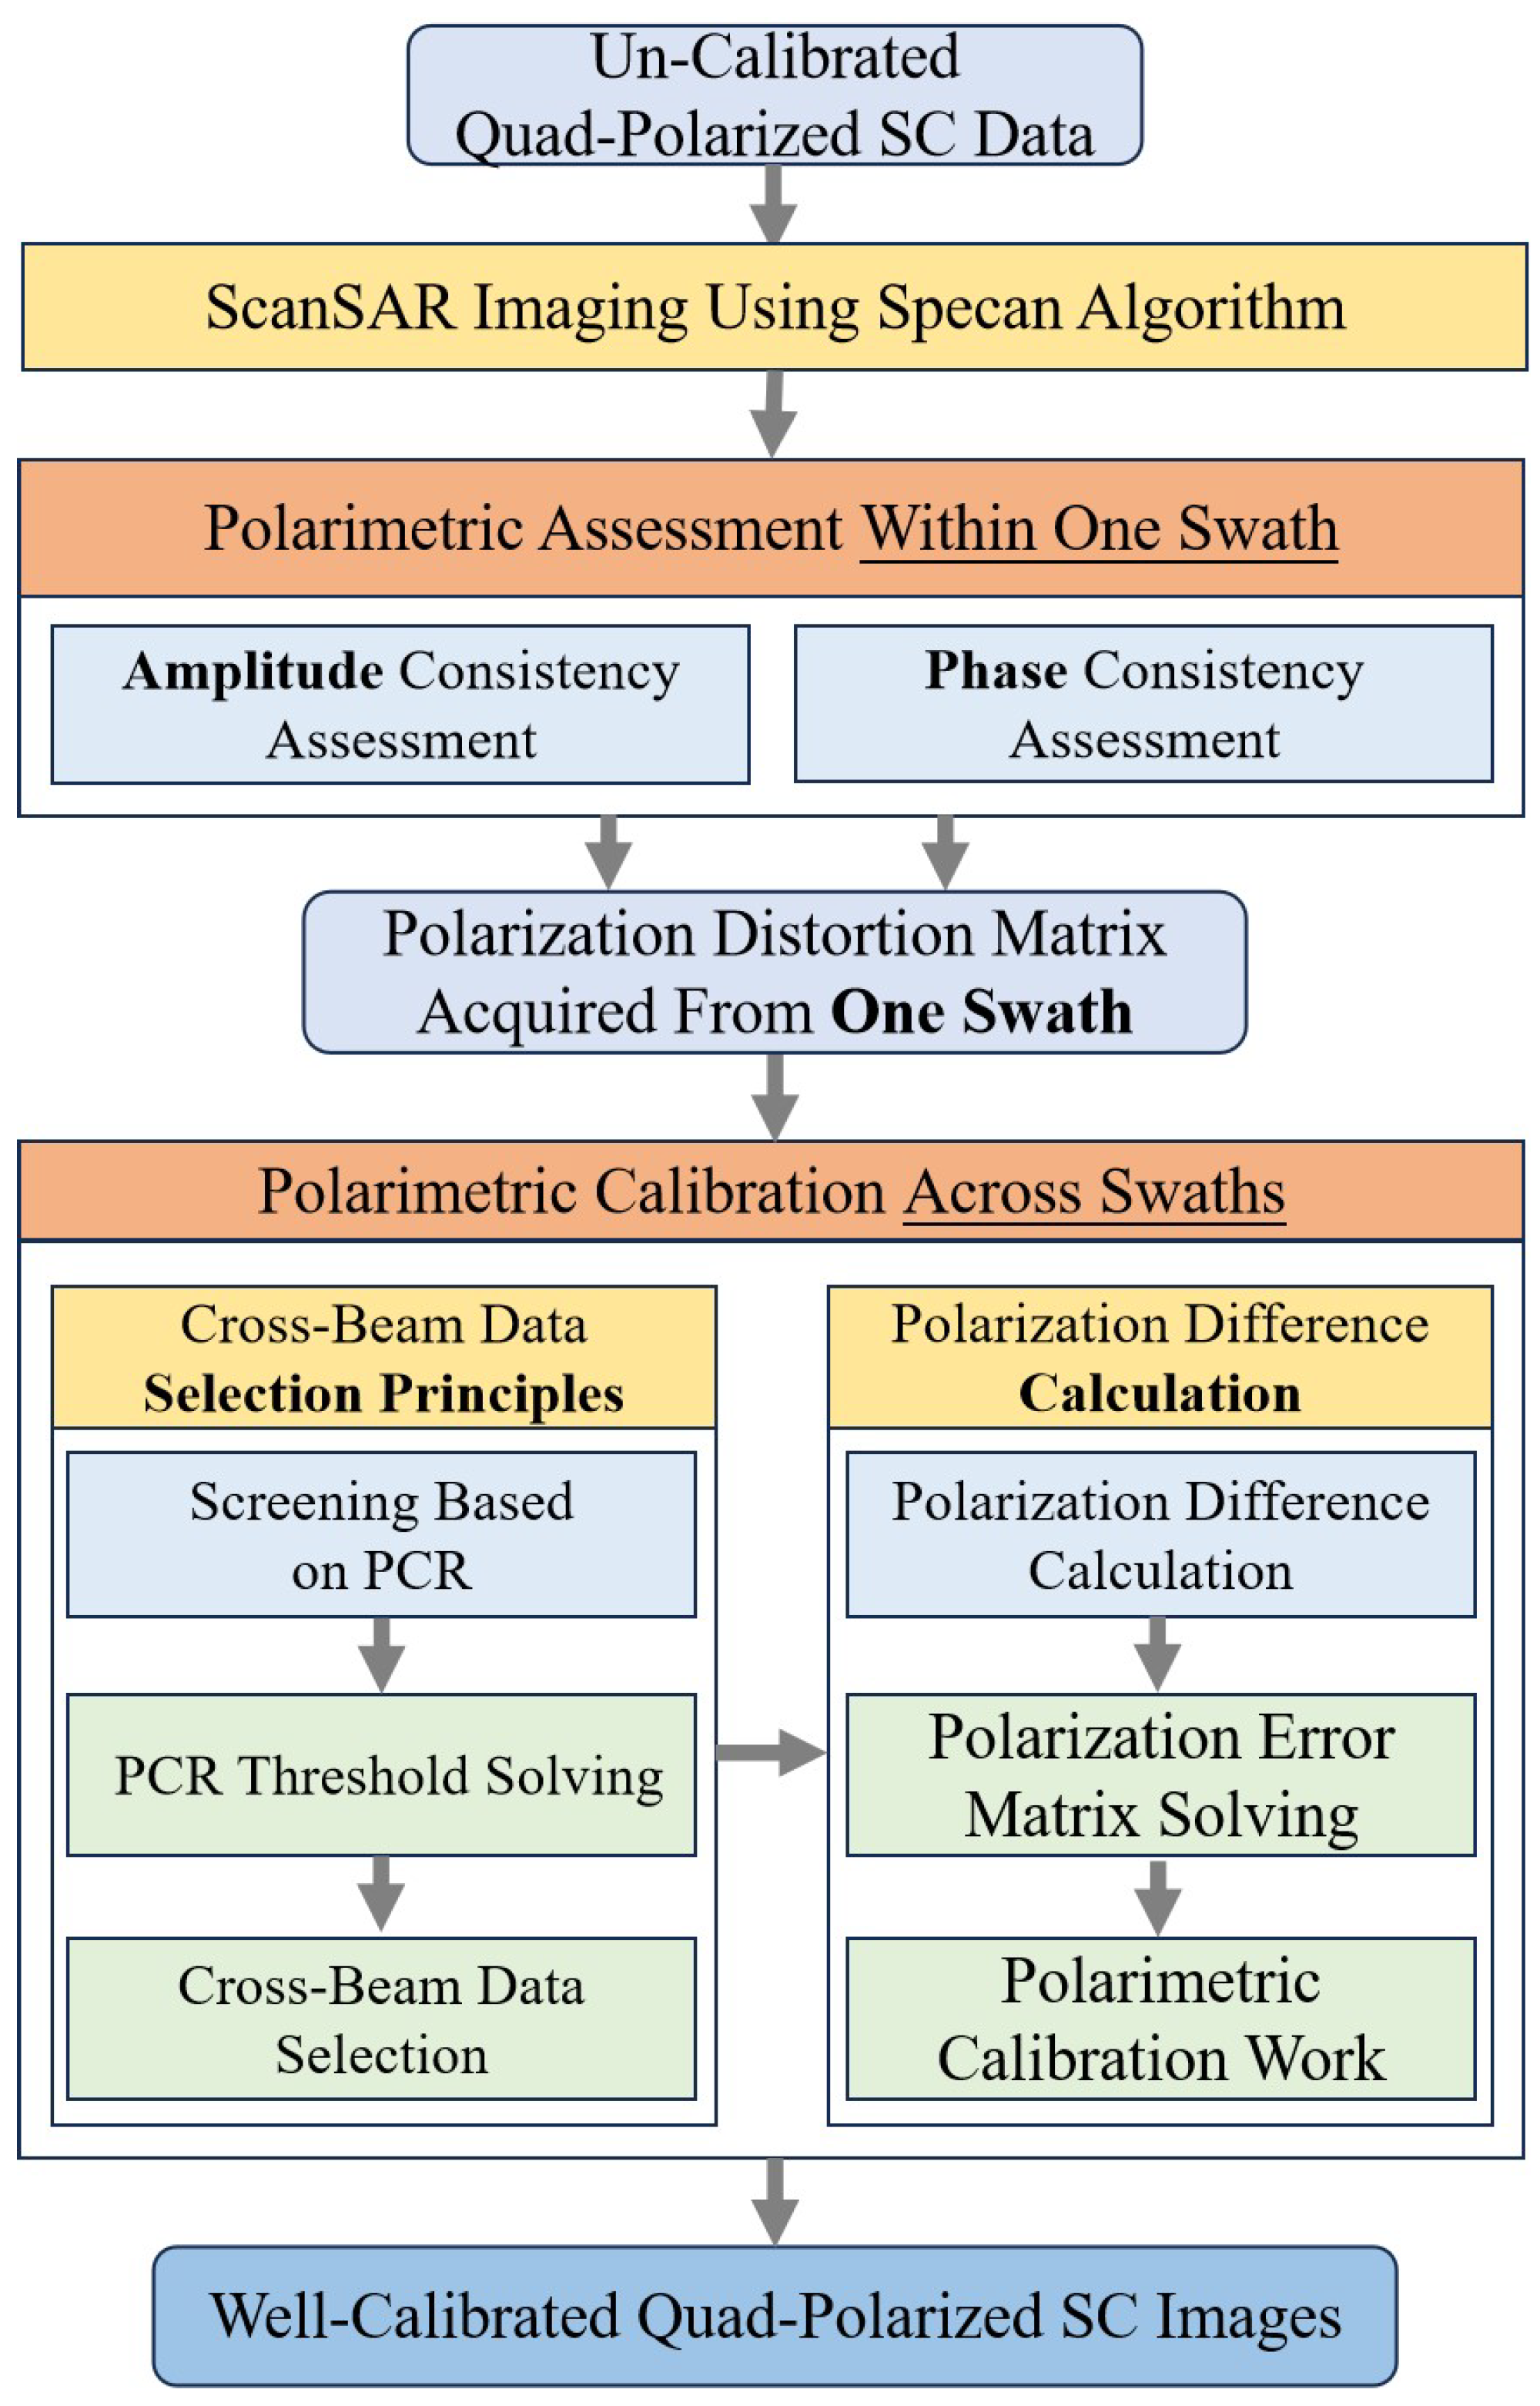
As the quad-polarized SC mode is not a standard GF3 imaging mode, processing of the SC experiment data is primarily concerned with image processing and radiometric calibration work. Data were processed using the Spean imaging algorithm, which ensures a consistent phase after imaging. Following the imaging process, a high-precision radiometric calibration of the image is conducted, encompassing the calibration of the SAR antenna, the processing gain, the system gain, and other related procedures. Note that we used the nominal value of each beam for calibration during the processing. Subsequently, the images of disparate swaths are mosaic-ed into four SAR images (HH/HV/VH/VV). During this process, radiometric inconsistencies between swaths are eliminated. The flow chart is shown in Figure 1.
SM mode data are the standard L1A product (single-look complex data) for GF3. The backscatter coefficient can be expressed according to the following relationship:
σ db = 10 log 10 ( P I ) × QV m 2 K db
where σ db represents the calibrated backscatter coefficient in dB and P I is the sum of the squares of the real() and imag() parts of the L1A data. The value of m is 32,768 and the value of QV is the maximum value before quantization. K db represents the calibration constant. Combining (1) and the effect of the calibration constants, the true value of the real() and imag() parts can be expressed as:
Re ( · ) = re ( · ) × Q V m × 10 K d b 20
Im ( · ) = im ( · ) × Q V m × 10 K d b 20
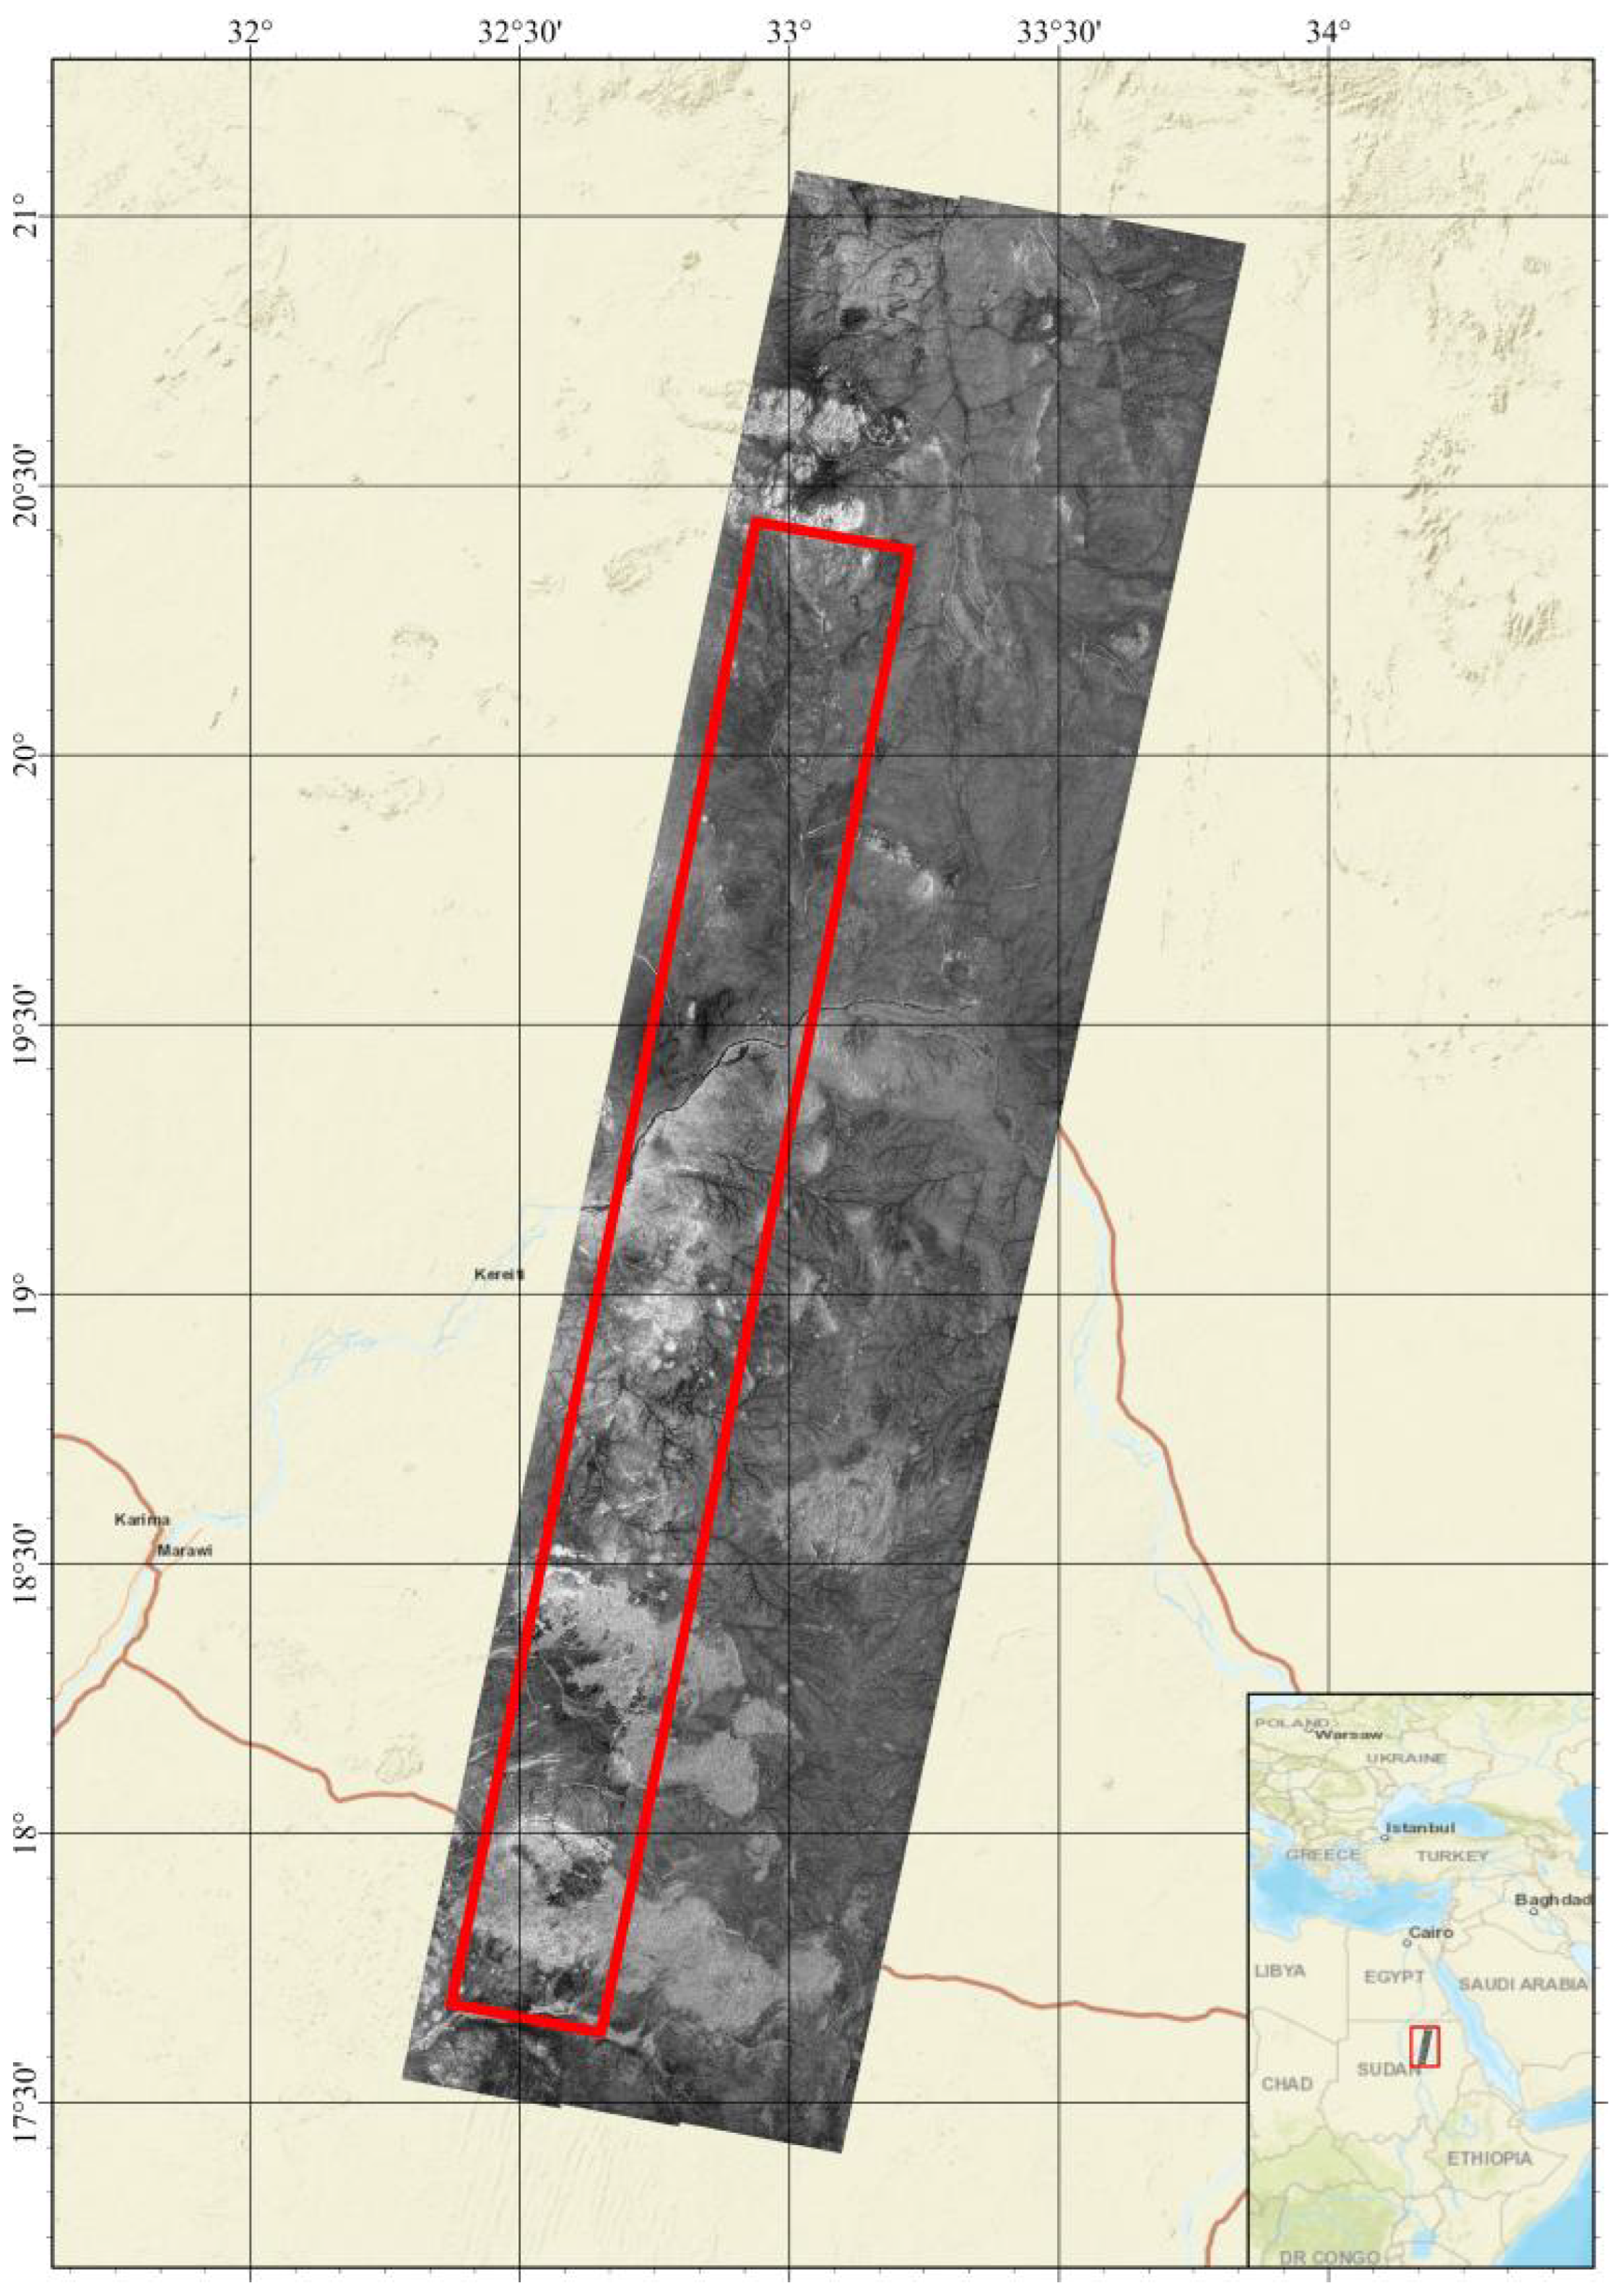
As stated previously, the accumulated experimental and validation data are located in north-central Sudan. The image in HH polarization of the experimental SC data is presented in Figure 2. The figure also illustrates the location of the SM data utilized for validation, which is demarcated by a red box.

3. Methodology

This section will introduce a method that can be used to perform polarimetric assessment and calibration on quad-polarized SC mode data. Figure 3 shows the overall flow chart of the proposed method based on cross-beam data. The methodology mainly consists of the data pre-processing (described above), polarimetric assessment within a single swath, and polarimetric calibration across swaths based on cross-beam data. The assessment component involves the utilization of volume-scattering distributed targets within a single swath to assess the polarimetric quality. This component entails the selection of typical feature data and the solving of the polarimetric distortion matrices. After the first swath is well calibrated during the above process, the calibration work involves the utilization of data from cross-beam area in SC mode to facilitate the transfer of polarimetric distortion difference across swaths. This process ensures the accuracy of the polarimetric calibration for the remaining swaths and the polarimetric consistency of the overall SC image.

3.1. Polarimetric Assessment Method Within One Swath

As indicated in [35], when distributed targets satisfy the system reciprocity requirement [36], the imbalance of amplitude of the transmit channel and the receive channel, and phase imbalance of the transmit channel and receive channel can be expressed as follows:
| f r | L = 1 2 ( | M V V | L | M H H | L + | M H V | L | M V H | L ) | f t | L = 1 2 ( | M V V | L | M H H | L + | M H V | L | M V H | L )
θ r = 1 2 ( P ( ( M H V M V H * ) ) P ( ( M H H M V V * ) ) ) θ t = 1 2 ( P ( ( M H V M V H * ) ) + P ( ( M H H M V V * ) ) )
where M tr is the measured signal for the polarization tr , t , and r represent the transmit and receive polarization, respectively, | · | L = 10 × log 10 ( | · | 2 ) . In [37], the authors showed that most forested areas or ground targets experiencing a volume scattering mechanism can satisfy the reciprocity requirement, which is usually used to assess the amplitude imbalance. Furthermore, refs. [38,39] show that almost all natural features (including bare soil, agricultural land, forests, and water), with the exception of urban areas, are capable of satisfying the phase-loose reciprocity requirement, which is usually used to assess phase imbalance. The larger width of the SC mode makes it easier to cover more types of feature than the traditional SM mode. The initial stage of the whole process entails the selection of appropriate distributed targets within a single swath, aiming of assess the amplitude imbalance and phase imbalance.
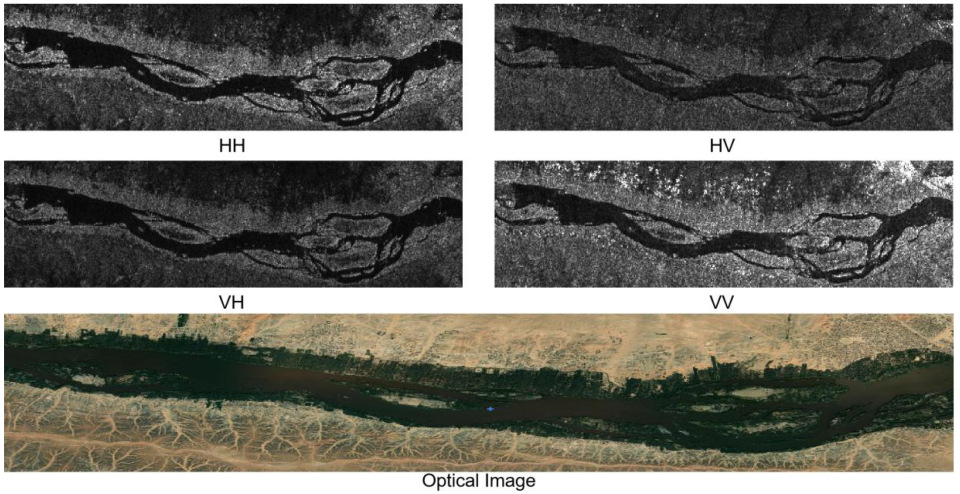
In this study, the forest belt on both sides of the Nile River is selected as the sample date that satisfies the loose reciprocity requirement to estimate the amplitude imbalance. The optical images indicate the presence of extensive forested areas on both sides of the Nile River, with a width ranging from 300 to 600 m and an average width of approximately 500 m. Despite the limited expanse of the forested area, it extends along the Nile River, encompassing the entire image. The total length of the forested area is more than 40 km. Even in Swath-1 (S1), which has the shortest range, the length of the forest area exceeds 10 km. Consequently, there are still sufficient forested areas to assess the amplitude imbalance. In Figure 4, we show optical and quad-polarized images of the Nile River and its banks within S1. The forested area can be distinguished by each of the images.
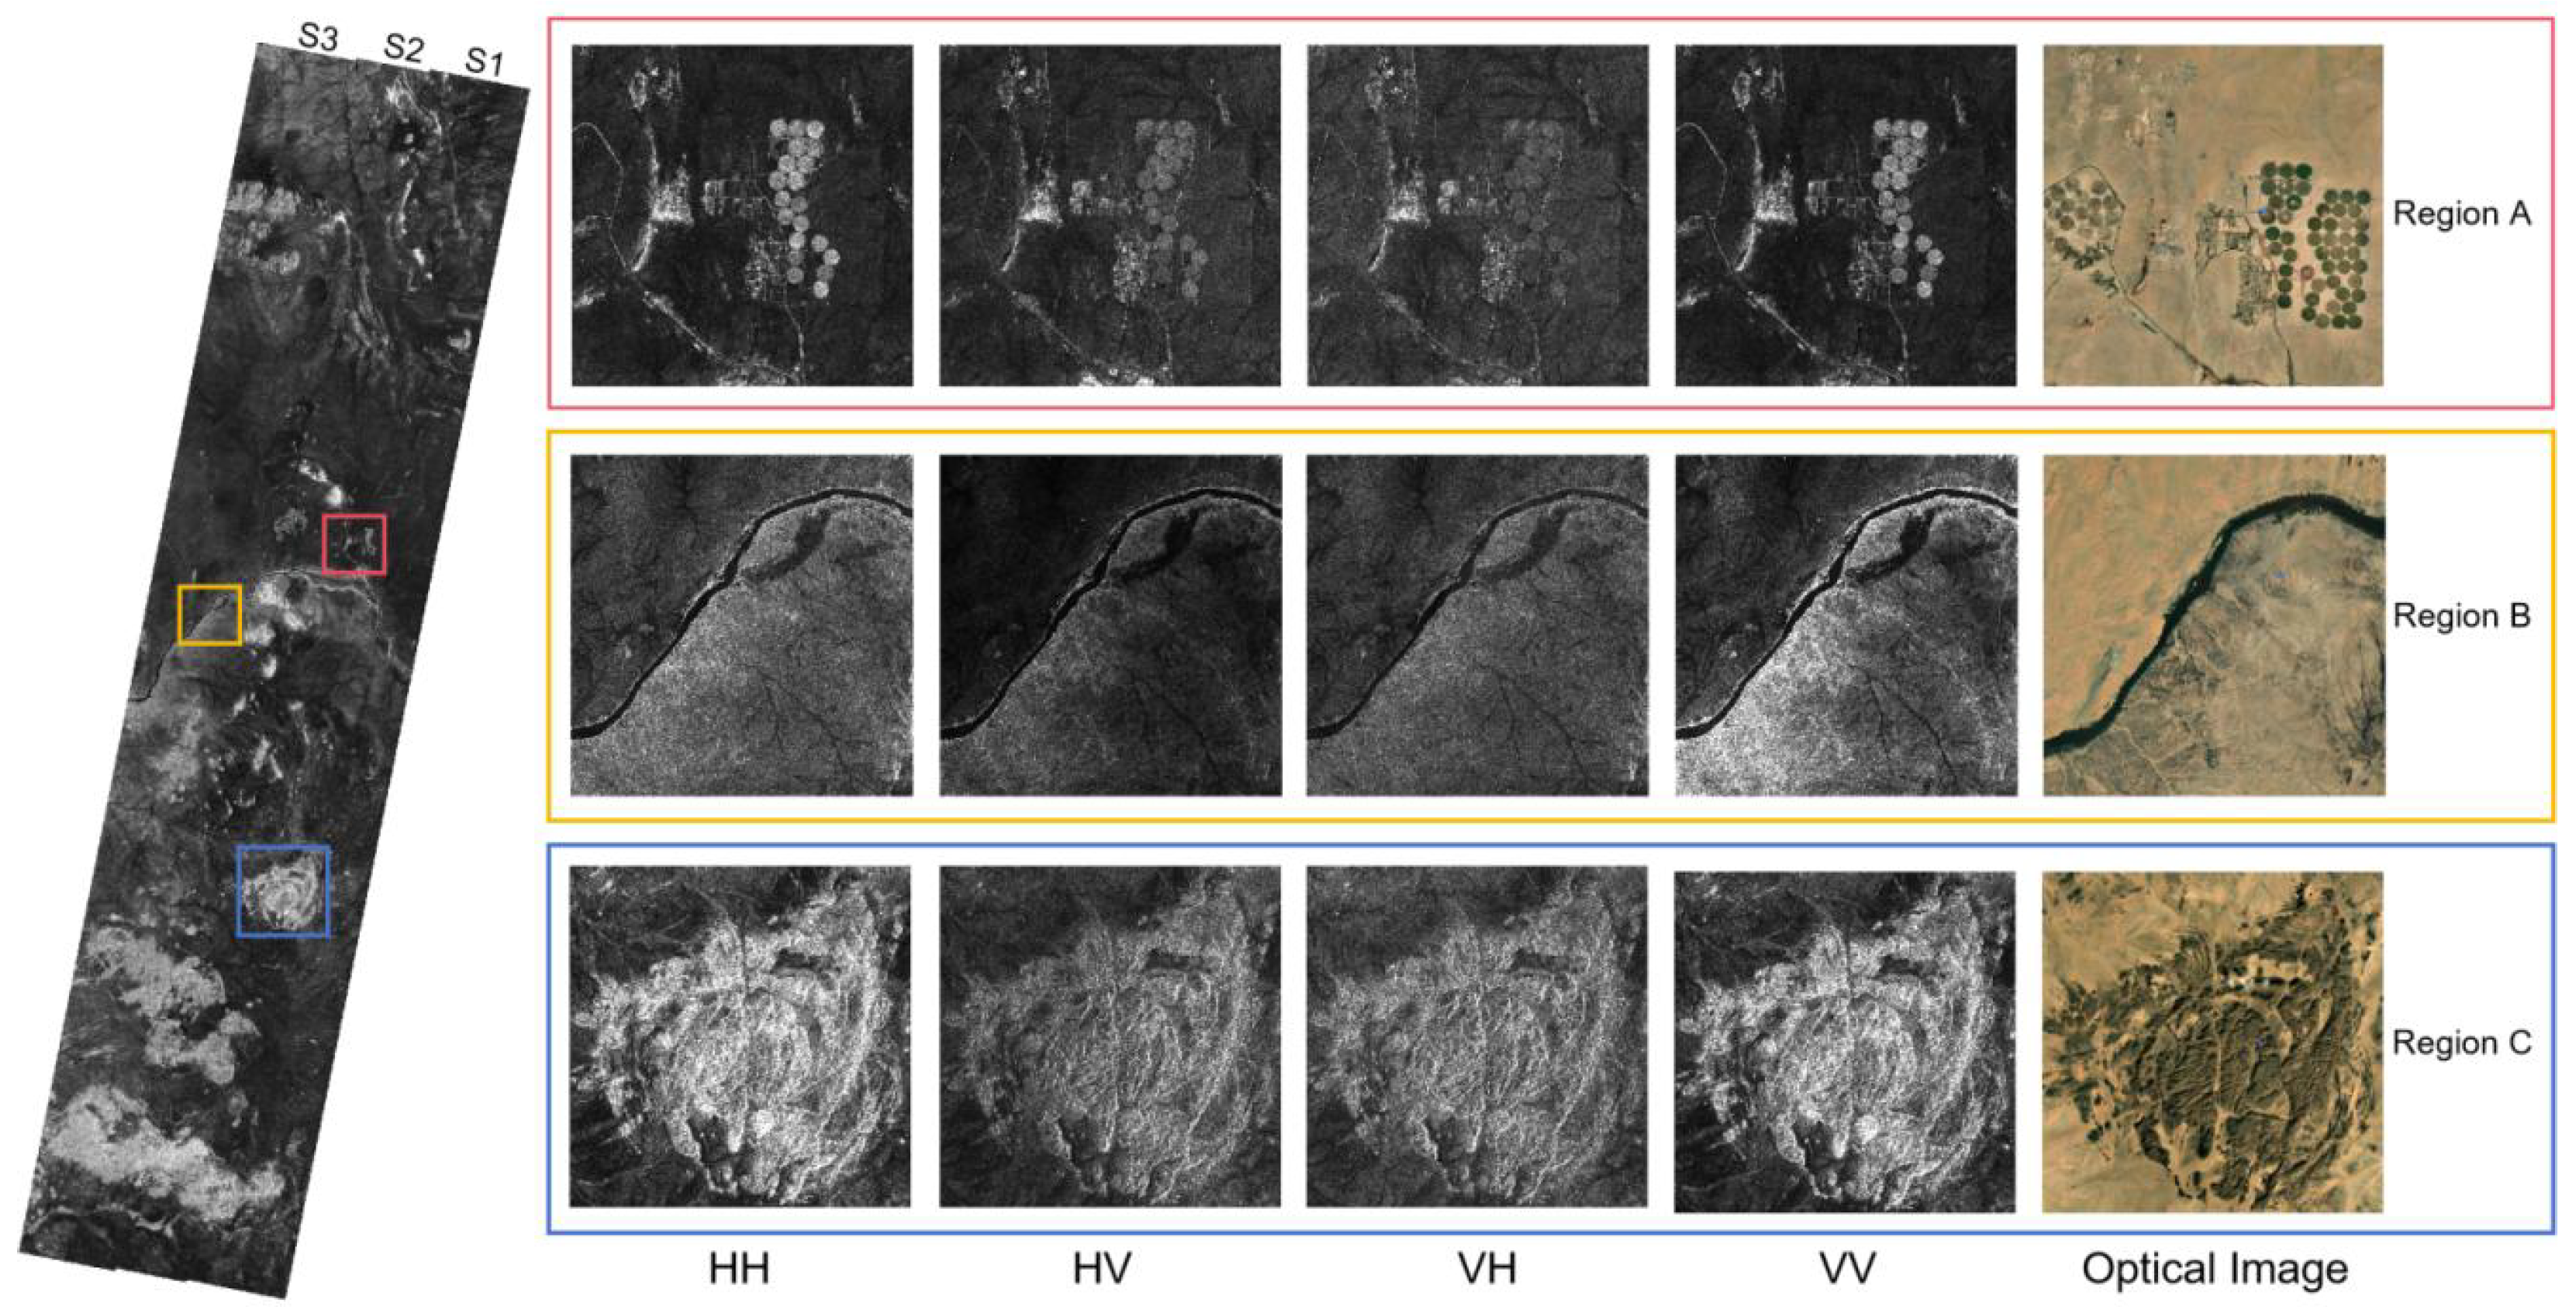
In contrast, a considerably more comprehensive range of distributed targets is available for the estimation of phase imbalance. Three typical features in the area of this experiment are shown in Figure 5. Region A in S1 comprises a number of agricultural fields. Given the geographical location (near the equator) and the data collection time (29 October), it can be assumed that these fields are covered by crops. A comparable tract of agricultural land is located in S2 near Region A, the data of this area will be employed in the subsequent processing. Region B contains part of the Nile River, which is the water body. The river traverses the entire image and thus can be identified in all three swaths. Region C is a mountainous area covered with bare soil, and the same types of features are also present in each swath. As mentioned above, agricultural land, soil ground, and water bodies satisfy the phase-loose reciprocity requirement and can be used to assess phase imbalance.
Given the large span of the SC image and the dispersed distribution of the selected distributed targets, we manually distinguished the typical features from the other ground targets to avoid inadvertently mixing the ineligible data when performing polarimetric information extraction. Within the selected area, we use boxes of approximately 100 × 100∼200 × 200 pixels to collect data samples and calculate the corresponding f t , f r , θ t , and θ r according to Equations (4) and (5). Given that there is randomness in the process of selecting data, resulting in some discrete points, in addition to improving stability by increasing the sample size, we use the median to describe the real situation of the rating when performing mathematical statistics.

3.2. Calibration Method for Polarization Differences Between Swaths

Based on the polarization distortion results obtained from one swath, the polarization assessment task for other swaths can be reformulated as a swath discrepancy assessment analysis. The cross-beam area provides an optimal domain for conducting such analysis. To rationally select strong polarization scattering targets within this region, we introduce the concept of Polarization Contrast Ratio (PCR). An adaptive PCR threshold is determined using the OTSU method. Finally, the polarization discrepancy matrix between swaths is computed based on selected target regions.

3.2.1. Cross-Beam Area

Cross-beam area refers to the overlapping portion between the illuminated areas of different beams in the SC mode. In SC mode, the satellite rapidly switches beams along the range direction to achieve wide-swath imaging. The cross-beam areas are designed mainly to ensure the integrity and continuity of the mosaic images. Typically, the switching interval between beams is only 0.1–0.2 s. This implies that the ground features within the cross-beam area will be illuminated twice in an extremely short period. The distribution of the cross-beam area in the mosaic SC mode image is shown in Figure 6.
From the perspective of SAR imaging geometry, due to the short time intervals between two illuminations, the satellite has moved only about 1 km along the azimuth side. When evaluated in comparison with a slant range of approximately 700–1000 km, the movement in the azimuth direction can be considered negligible, which means that the geometric relationship between the satellite and the targets in the cross-beam area remains virtually unchanged. Therefore, the influence of the incidence angle on the backscatter coefficient and polarimetric characteristics within the area remains unchanged between the two illuminations. Typically, cross-calibration methods require selecting targets whose scattering characteristics are insensitive to changes in incidence angle, such as tropical rainforest. The consistency of incidence angles between the two illuminations within the cross-beam area obviates the need to consider the potential issue of scattering characteristics that vary with incidence angle for irregular scatterers within the scene.
From the perspective of the operating status of the payload, SAR polarimetric distortion errors are mainly influenced by atmospheric transport, radar hardware fixed error, platform motion error, and antenna system errors. Obviously, during the beam switching process in SC mode, the first three factors remain unchanged and the main source of error differences come from the two beams used for the illuminations. Therefore, the polarization differences within the overlap area actually reflect the differences in polarization error matrices between different beams.

3.2.2. Polarization Contrast Ratio Threshold Solving Based on OTSU

Cross-beam areas are distributed along the azimuth side throughout the image, providing a great deal of ground features to assess polarization differences. However, not all ground features are suitable for assessment. Priority should be given to selecting ground features with strong polarization scattering for assessment and calculation.
The primary reasons are as follows. First, the polarization characteristic stability of the strongly scattering targets is high. Regions of high scattering intensity have a stable and significant energy distribution across various polarization channels, and their polarization scattering mechanisms (such as double-bounce scattering and surface scattering) are less affected by environmental factors. In contrast, weak scattering scenes are prone to energy attenuation in cross-polarization (HV/VH) channels, leading to blurred or even ineffective polarization characteristics, which cannot reliably reflect the true polarization differences between beams. Second, strongly scattering targets retain more complete polarization information. High-scattering regions (such as metal structures, steep terrains) can typically excite all channels (HH/HV/VH/VV) of a fully polarized SAR system, and their scattering matrices (such as the coherence matrix T3 or covariance matrix C3) are complete, fully supporting quantitative analysis of polarization differences between beams. Weak scattering targets (such as smooth water surfaces) may suffer from data failure in cross-polarization channels because of insufficient signal-to-noise ratio, forcing assessments to rely on incomplete polarization channels, thereby introducing systematic biases. Third, weak scattering scenes are susceptible to interference and noise. Low-scattering ground features (such as water-saturated soil and sparse vegetation) are extremely sensitive to parameters such as surface roughness and dielectric constant and are susceptible to interference from factors such as system noise and atmospheric disturbances. Minor changes in such areas can be misjudged as polarization differences between beams, leading to distorted assessment results.
Based on these three reasons, we introduce the concept of Polarization Contrast Ratio (PCR) as a basis for selecting scenes suitable for polarization assessment. The expression is shown below:
PCR = 10 · log 10 Σ | S target | 2 Σ | S background | 2
S target denotes the scattering intensity of the target area and S background represents the scattering intensity of the surrounding weak scattering background. Σ | · | 2 denotes the total energy within the region.
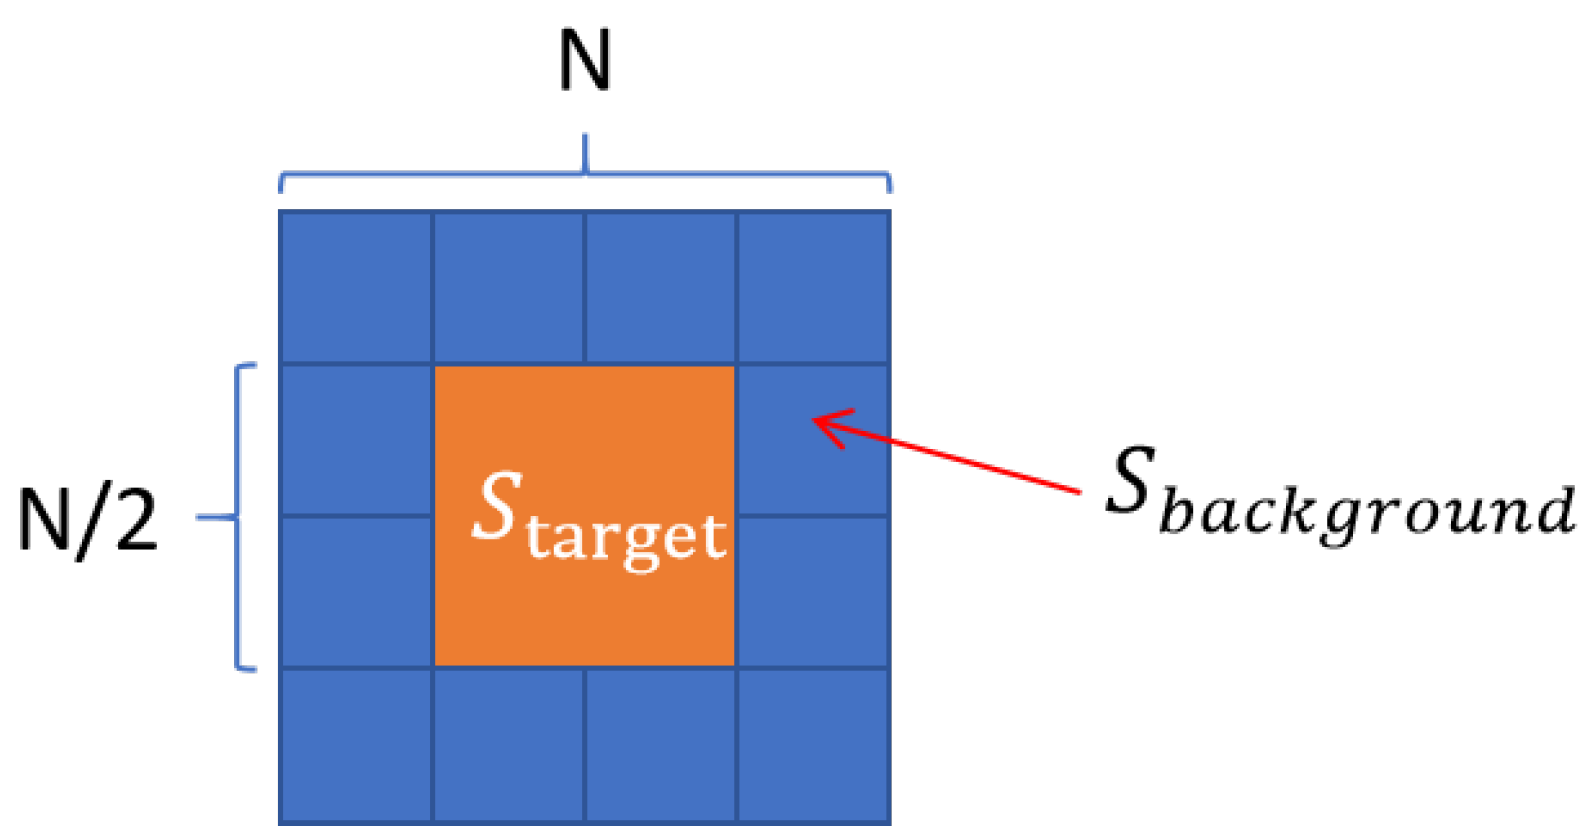
PCR is defined by calculating the power difference between the target area and the background area. We design a window for the data acquisition matrix N × N , where N represents the number of sampling points. Within this window, another target acquisition matrix sized N 2 × N 2 centered is established. The energies of the two regions are S target and S background .
By constraining the PCR within the framed area, we ensure that the scattering intensity of the target area is significantly higher than the background noise (such as urban buildings, isolated corner reflectors), avoiding the introduction of aliasing errors by low-PCR areas (such as uniform vegetation, bare soil). Meanwhile, excessively high polarization contrast requirements may result in too few scene areas included in the calculations, which can also negatively impact the accuracy of the final differentiation analysis results. Selecting the correct threshold is the focus of subsequent research.
The OTSU method, or Maximum Between-Class Variance Method, was proposed by Japanese scholar Nobuyuki Otsu in 1979. It is an automatic threshold segmentation method based on maximum between-class variance, primarily used to automatically calculate the optimal threshold for binarizing an image according to its histogram, thus distinguishing the foreground from the background. For selecting the PCR threshold, our core objective is to distinguish between high and low scattering areas (i.e., high and low PCR representations), which aligns with the functionality of the OTSU algorithm [40]. The diagram below illustrates the specific methodology for selecting appropriate data.

3.2.3. Derivation Methodology for the Polarization Discrepancy Matrix

In practice, we designed a sliding window for data acquisition that slides along the range side of the cross-beam area to collect the results of the PCR calculation. Since the width of the overlapping region in the azimuth direction is relatively narrow, we set the sliding window size to this width, which is N in Figure 7, and the sliding step is N/2. As the window slides, we can obtain the PCR calculation results and a corresponding PCR threshold. Using the threshold, we can select the qualified cross-beam area.
As previously outlined, we tend to solve the existing polarization inconsistency problem between swaths by calculating the polarization characteristic differences of the same area from between swaths. Consequently, the qualified areas are divided into multiple blocks, and the amplitude and phase are calculated under each polarization. The corresponding magnitude and phase values for each region are expressed in Figure 8.
A x · TR = 1 m n i = 1 n j = 1 m S x ( TR ) i j
θ x · TR = a r g 1 m n i = 1 n j = 1 m S x ( TR ) i j
where A and θ is the measured magnitude and phase of the corresponding area, respectively, x indicates the swath number in the entire image, T and R correspond to the transmit and receive polarization, m and n denote the size of the sample data. In order to further prevent unreasonable A and θ from compromising the accuracy of the final calculation, the ‘Grubbs’ test [41] is used to eliminate outliers in the sample. This process prevents errors from propagating and increasing across swaths. As in the previous process, we use the median to describe the real situation of the rating when performing mathematical statistics calculation. The amplitude and phase differences between the corresponding polarization channels are computed as:
Δ A T R = A x + 1 · TR A x · TR , Δ θ T R = θ x + 1 · TR θ x · TR
Δ A HH and Δ θ HH , which represent the difference between A x · TR and A x + 1 · TR , θ x · TR and θ x + 1 · TR , respectively. These differences are systematically organized into the polarization discrepancy matrix to capture the polarization differences matrices:
T r a n s x x + 1 = Δ A HH · e Δ θ HH i Δ A HV · e Δ θ HV i Δ A VH · e Δ θ VH i Δ A VV · e Δ θ VV i
The matrix explicitly quantifies the amplitude/phase distortion between beams. The diagonal terms Δ A HH e Δ θ HH i , Δ A VV e Δ θ VV i represent co-polarization channel imbalances, while off-diagonal terms Δ A HV e Δ θ HV i and Δ A VH e Δ θ VH i characterize cross-polarization discrepancies. The exponential terms preserve phase relationships critical for polarimetric coherence.
S x calibrated = Trans x x + 1 S x
For calibration, this matrix is applied multiplicatively to the original scattering matrix S x ( TR ) i j . In Equation (11), ⊙ denotes element-wise multiplication. This ensures polarimetric consistency across the mosaic image by propagating calibration parameters through overlapping regions.

4. Results and Validation

In this section, two experiments are conducted on quad-polarized SC data, and the results are validated using quad-polarized SM data. Firstly, the magnitude and phase imbalance of the uncalibrated SC data were assessed using typical distributed targets. Specifically, we utilize the forest-covered areas along the Nile River to estimate the magnitude imbalance and the farmland areas to estimate the phase imbalance, which have been shown in Figure 4 and Figure 5 Region A, respectively. Secondly, by analyzing the polarimetric parameter differences of the features in the overlap region between the three swaths, we can obtain the polarimetric inconsistency between them. By combining the results of the above two points, we can then obtain the ‘calibrated’ quad-polarized SC image. Finally, using the well-calibrated quad-polarized SM data located in the same area, we verify the validity and accuracy of the processing method in terms of both polarimetric parameters and polarimetric pseudo-color image.

4.1. Polarimetric Assessment and Calibration Results from Swath-1

The assessment of amplitude imbalance is conducted using forested areas data on both sides of the Nile in Swath-1. A data frame with a pixel size of 100 × 100 is employed to divide the selected forested area into approximately 29 blocks. Given the relatively lush forested area on the north side of the river, 24 of the selected data blocks have been distributed on the north bank of the river, and 5 on the south bank. The specific distribution is illustrated in Figure 9.
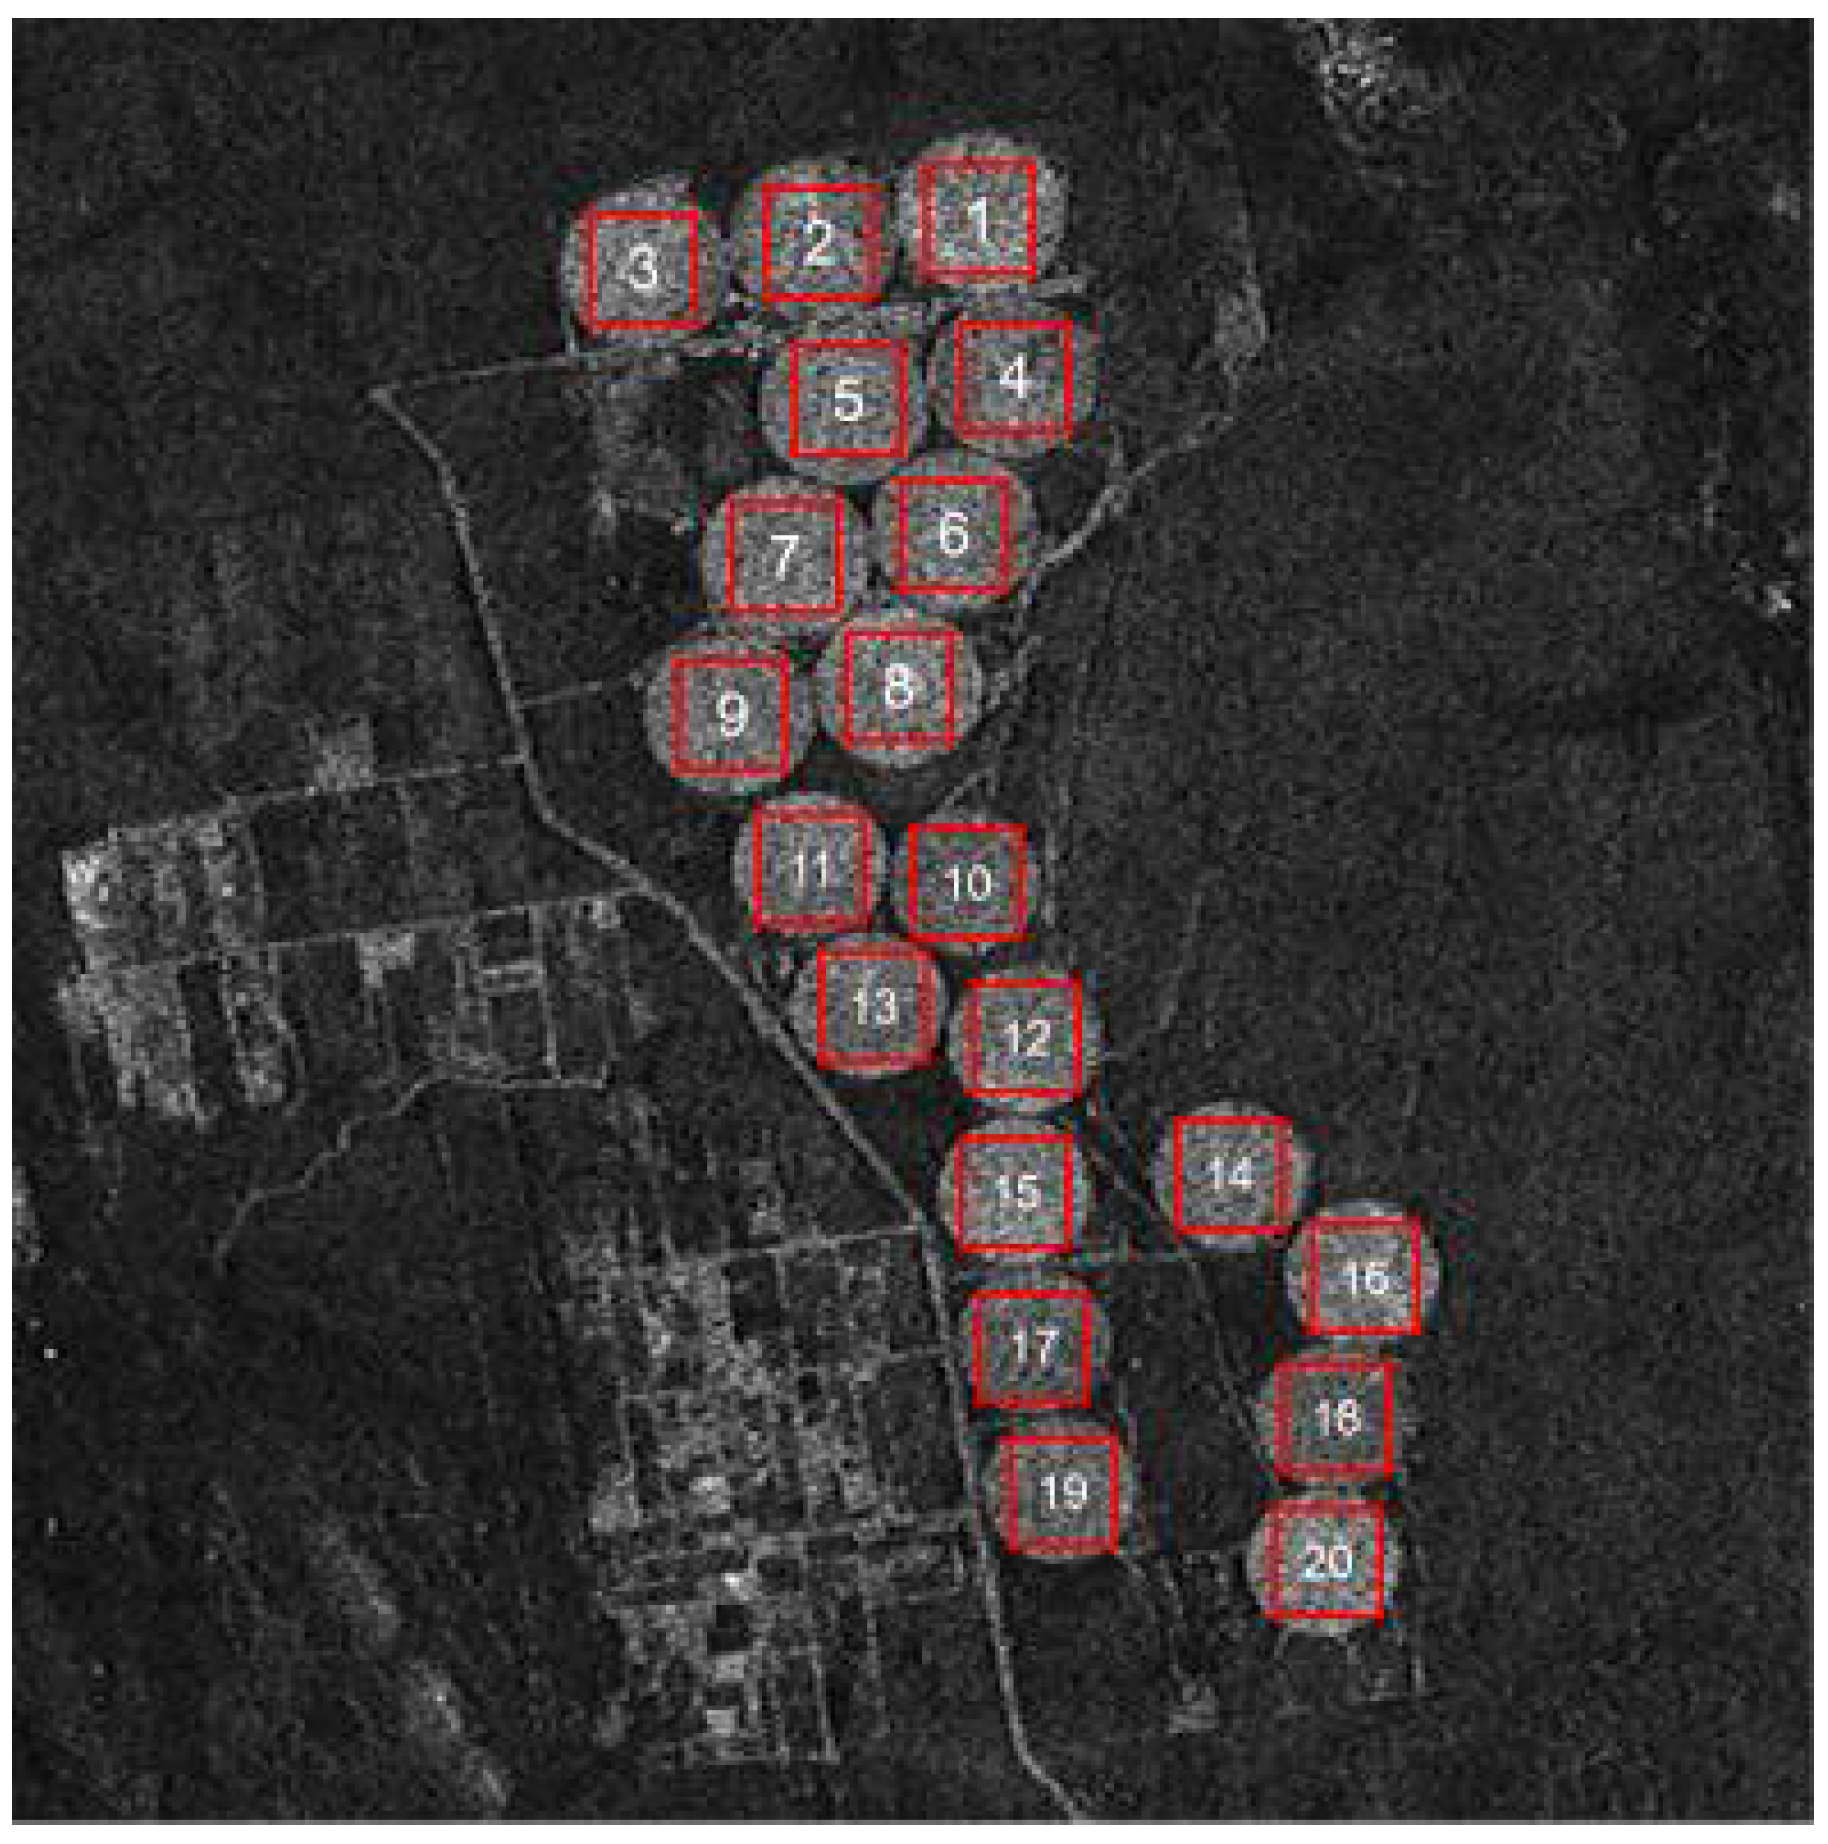
The assessment of the phase imbalance was carried out based on the area in Figure 5 Region A, which contains 20 circular croplands. Each circled area was used as a sample data for one assessment. To provide a more comprehensible description of the results, the croplands were numbered and are displayed in Figure 10.
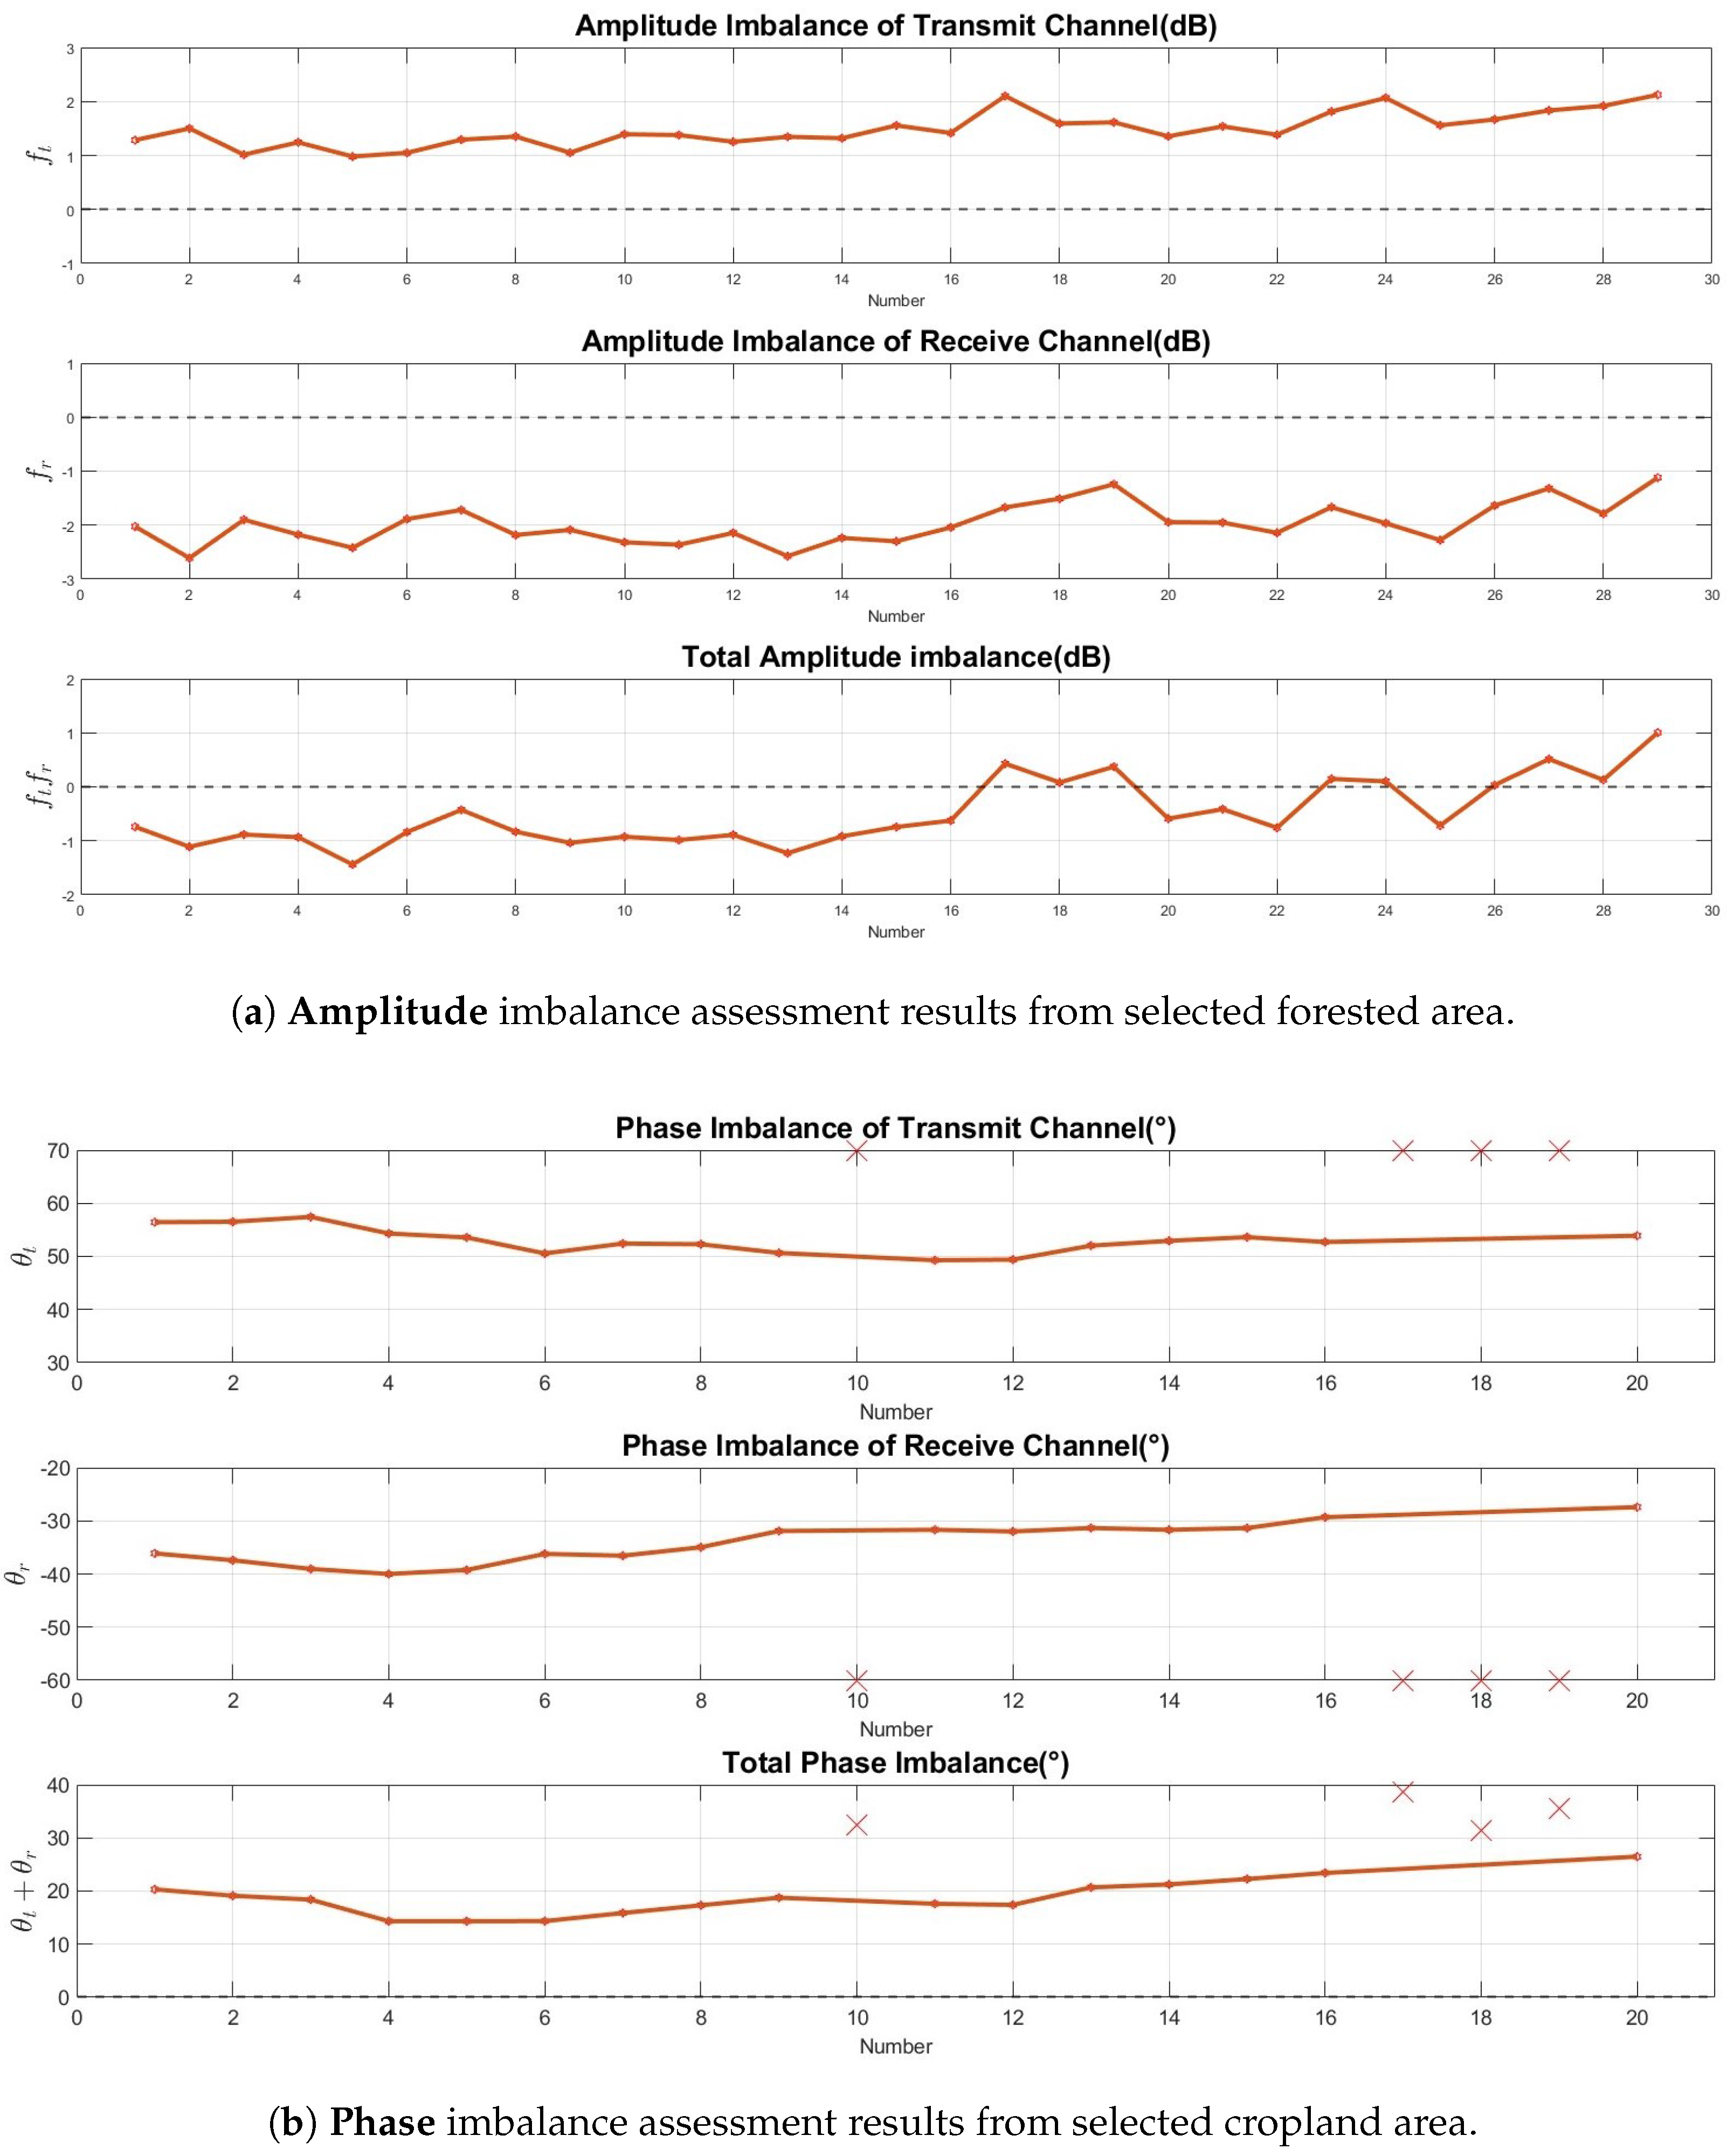
The results of the amplitude and phase assessment results are presented in Figure 11a and Figure 11b, respectively. It can be seen that the evaluation results for both amplitude and phase are relatively stable. The median values of the arrays | f r | L and | f t | L are 1.3930 (dB) and −2.0262 (dB), respectively, while the θ t ’ and θ r ’ are 52.82° and −33.48°.
In terms of the results of the amplitude assessment, the absolute values of | f r | L and | f t | L obtained from the data are slightly higher than the amplitude imbalance in the conventional quad-polarized mode, usually within 1 dB. This is mainly attributable to the fact that, despite the absence of a polarimetric calibration process, conventional radiometric calibration efforts ensure that the radiometric accuracy of the image in each polarization remains at an acceptable level. However, given that the beam employed in this experiment was not a conventional SC beam, some of the radiometric calibration parameters, especially the gain parameters that vary with polarization, are unknown to us compared to those in quad-polarized SM mode. In this case, we can view them as a source of polarimetric errors, which are effectively removed during the polarimetric calibration process.
With regard to the phase assessment results, it is first necessary to clarify that the data blocks (10, 17, 18, and 19) were not included in the statistical analysis of the phase assessment results. The reason for this is that the SAR imagery in Figure 10. clearly shows that these four data blocks exhibit markedly darker image characteristics compared to the other 16 blocks. Furthermore, the calculated θ t and θ r for these four blocks deviate significantly from the results obtained for the other data points. The existence of a discrepancy in visual and numerical results indicates that the agricultural cultivation status of the area is distinct, which is inconsistent with the majority. This suggests that these data may not be suitable for uniform analysis. All other evaluation results for θ t and θ r are within 10° of their averages, which is a desirable result. The total phase imbalance is stable at around 20°, indicating that the phase imbalance of the calibrated data can be kept within 10° by the correction, which will meet the expected requirement of spaceborne polarimetric SAR data.
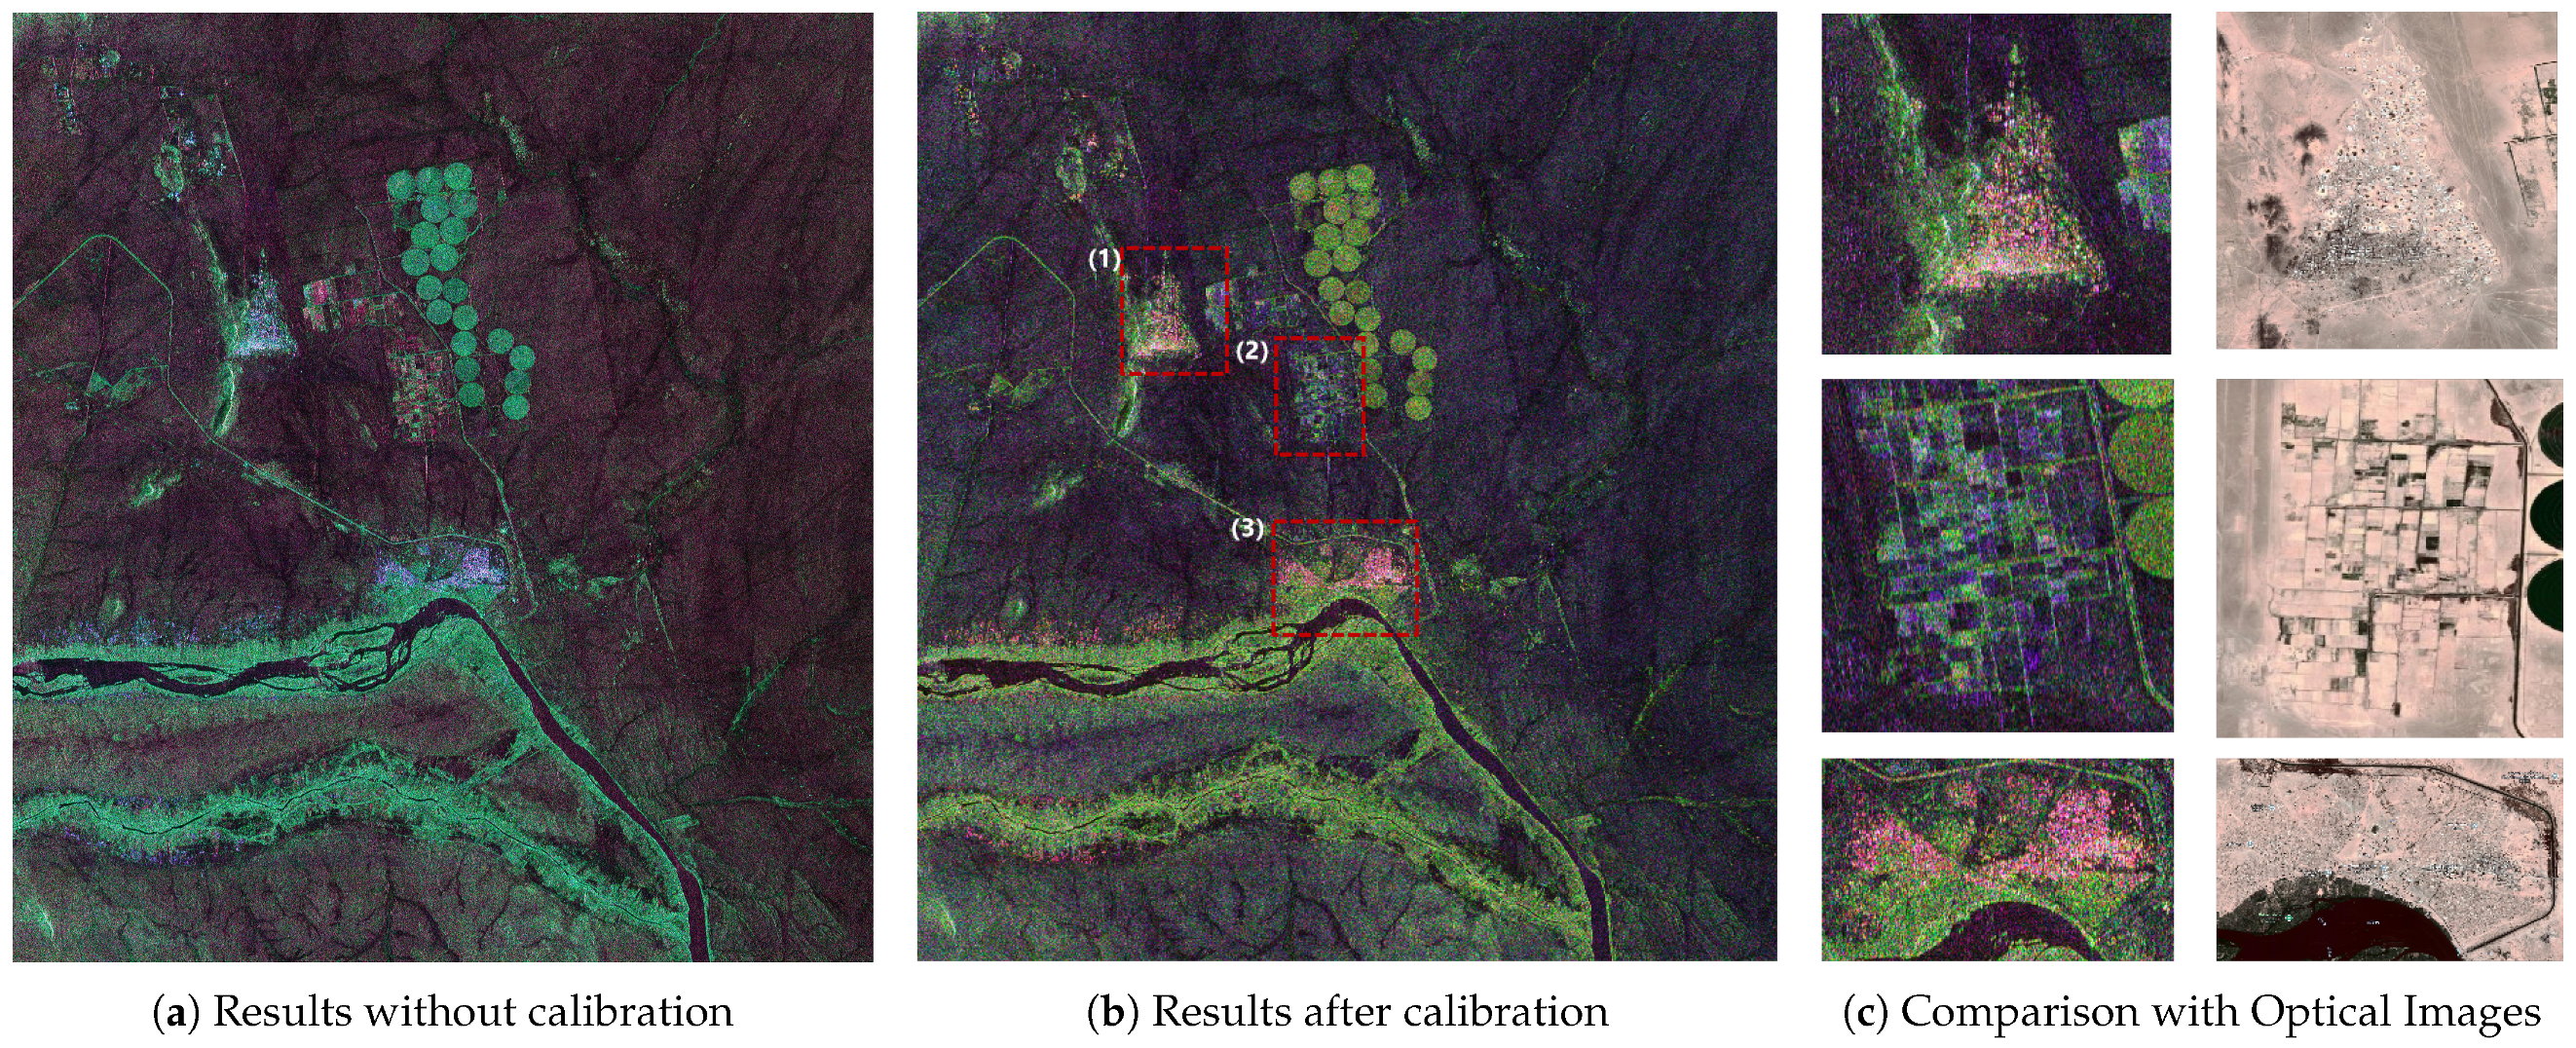
On the basis of these assessment results, we carried out the polarimetric calibration process on the data and obtained the Pauli pseudo-color image. The central latitude and longitude of this area are approximately 19.55°N and 33.29°E. As illustrated in Figure 12, the pseudo-color images, both before and after the calibration, are presented. The comparison results between three typical ground features and their corresponding optical images are also provided. The results reveals that the uncalibrated image demonstrates significant color deviation. In Figure 12b, the area on both sides of the Nile and the area labeled in Figure 10 are presented in green, which indicates a stronger distribution of the volume scattering features. This finding is consistent with the optical image. In the calibrated image, we have annotated three areas and displayed the corresponding optical image from the same period in Figure 12c. The areas labeled (1) and (3) in the figure are believed to be the downtown area of the Sudanese city of Abu Hamad, with a considerable number of buildings accurately delineated in red on the pseudo-color composite map. The two typical distributed targets depicted have been accurately color coded, demonstrating the effectiveness of the assessment and calibration process.

4.2. Polarimetric Calibration Results Between Swaths

Derivation Results for the Polarization Discrepancy Matrix

Polarimetric calibration between different swaths is performed mainly using data from the overlapping regions. The azimuth width of the data is 350 km, thereby providing a rich variety of distributed targets to choose from. As mentioned above, selecting the appropriate area for the calculation is essential to ensure high polarization accuracy.
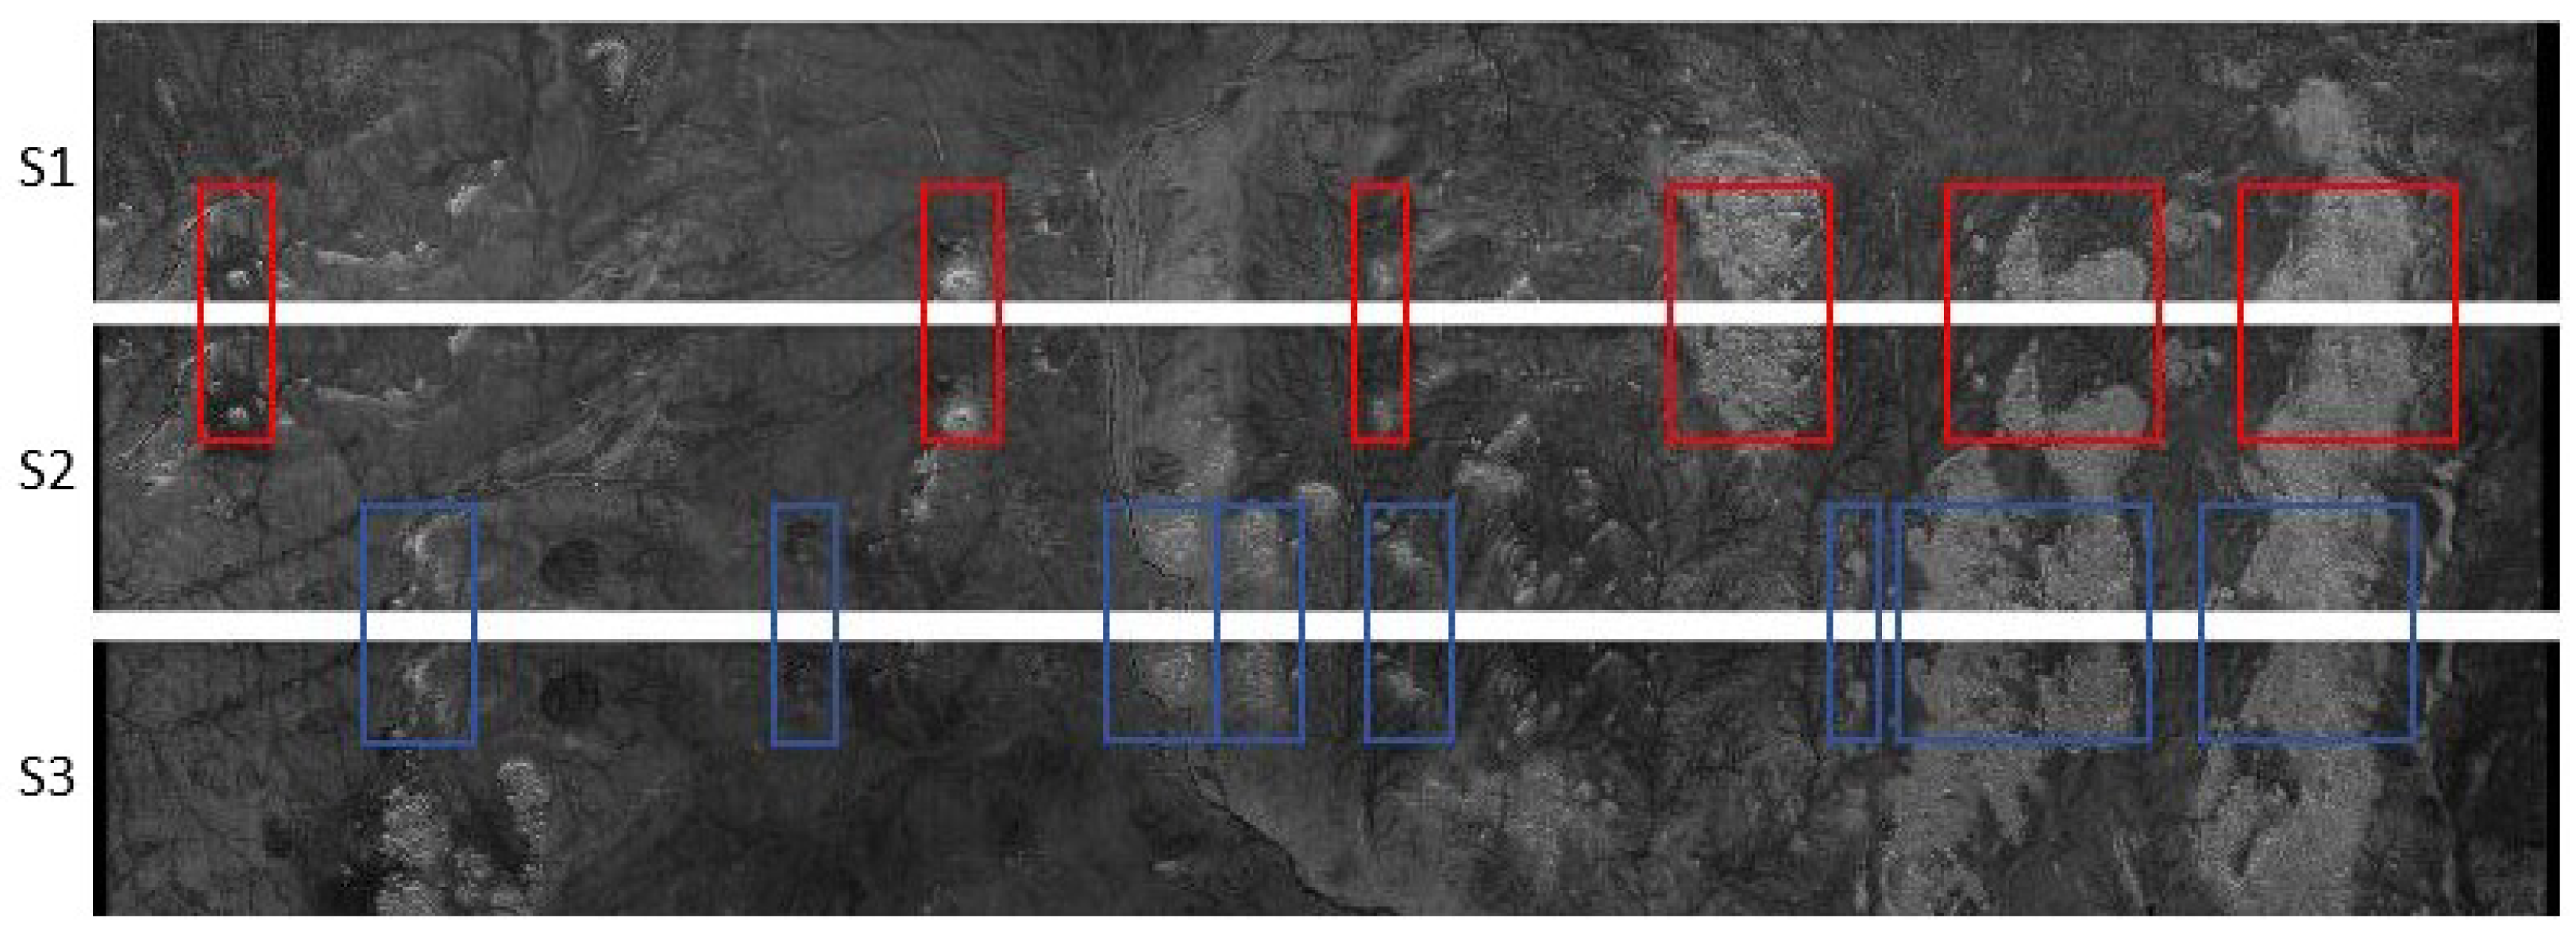
In order to obtain a better calibration accuracy, we introduced the concept of PCR and calculated the PCR change curve along the azimuth direction. We calculated the corresponding PCR thresholds based on the curve data. Based on PCR thresholds, we have selected six overlapping regions between S1 and S2 and eight between S2 and S3 for the calibration process. The images of three swaths are presented in Figure 13. Each swath was matched along the azimuth in accordance with the time of data acquisition. We have selected six overlapping regions between S1 and S2 and eight between S2 and S3 for the calibration process. The selected area is labeled as red and blue boxes, respectively.
Table 3 shows the analysis of the amplitude and phase error using the overlap region between S1 and S2 (S1&S2) and S2 and S3 (S2&S3), respectively, and the error from S1 to S3 (S1→S3) is obtained by error transfer. Δ A T R and Δ P T R denote the amplitude error and phase error for each polarization, respectively. From the data results, it can be seen that the error of co-polarization is small, the maximum is 0.50 dB, the error of cross-polarization is relatively large, and the maximum reaches 0.98 dB; although the phase error analysis results for each polarization are relatively different, the results for each sample point under the same polarization are uniform and stable, and considering that the data have not been calibrated, we believe that the statistical results are plausible and will pursue further validation with the calibrated image results. On the basis of the results data analyzed, we convert the energy error from decibels to magnitudes and phase errors from angles to radians. Two error calibration matrices were formed and designated as:
H 1 2 = 1.037 e 0.645 i 1.062 e 2.902 i 0.988 e 0.951 i 1.045 e 0.644 i
H 1 3 = 0.978 e 0.532 i 1.119 e 1.287 i 0.917 e 1.079 i 1.059 e 0.970 i
The calibrated image data can be obtained by multiplying the data from S2 and S3 by Equation (12) and Equation (13), respectively. In the next section, we will show the complete quad-polarized SC Pauli pseudo-color image.

4.3. Overall Calibration Results and Validation Based on SM Data

After the above two steps of calibration and correction, we acquire the overall image data with consistent and correct polarimetric information. In this section, two parts of the results will be presented. Firstly, the mosaic-ed quad-polarized SC Pauli pseudo-color image will be displayed. Concurrently, the quad-polarized SM images generated using ESA’s PolSARPro will be exhibited for the purpose of evaluating the efficacy of our polarimetric calibration method from the perspective of image comparison. Secondly, a comparison of the polarization alpha angle is conducted on several selected distributed targets, which also verify the validity of our polarimetric calibration method from the perspective of mathematical analysis.
Since the resolution of SC mode differs from that of SM mode, the impact of resolution differences should be mitigated through two primary approaches. Firstly, when performing calibration within one swath, the selection of distributed targets with stable scattering characteristics that satisfy the loose reciprocity principle is essential. Such targets are relatively large in size and less sensitive to variations in resolution. The second approach involves the use of the Polarization Contrast Ratio (PCR) to identify strongly scattering targets (e.g., urban areas) within overlapping regions. The targets under scrutiny exhibit significantly higher scattering intensities relative to the background noise, thereby also mitigating errors introduced by variations in resolution.
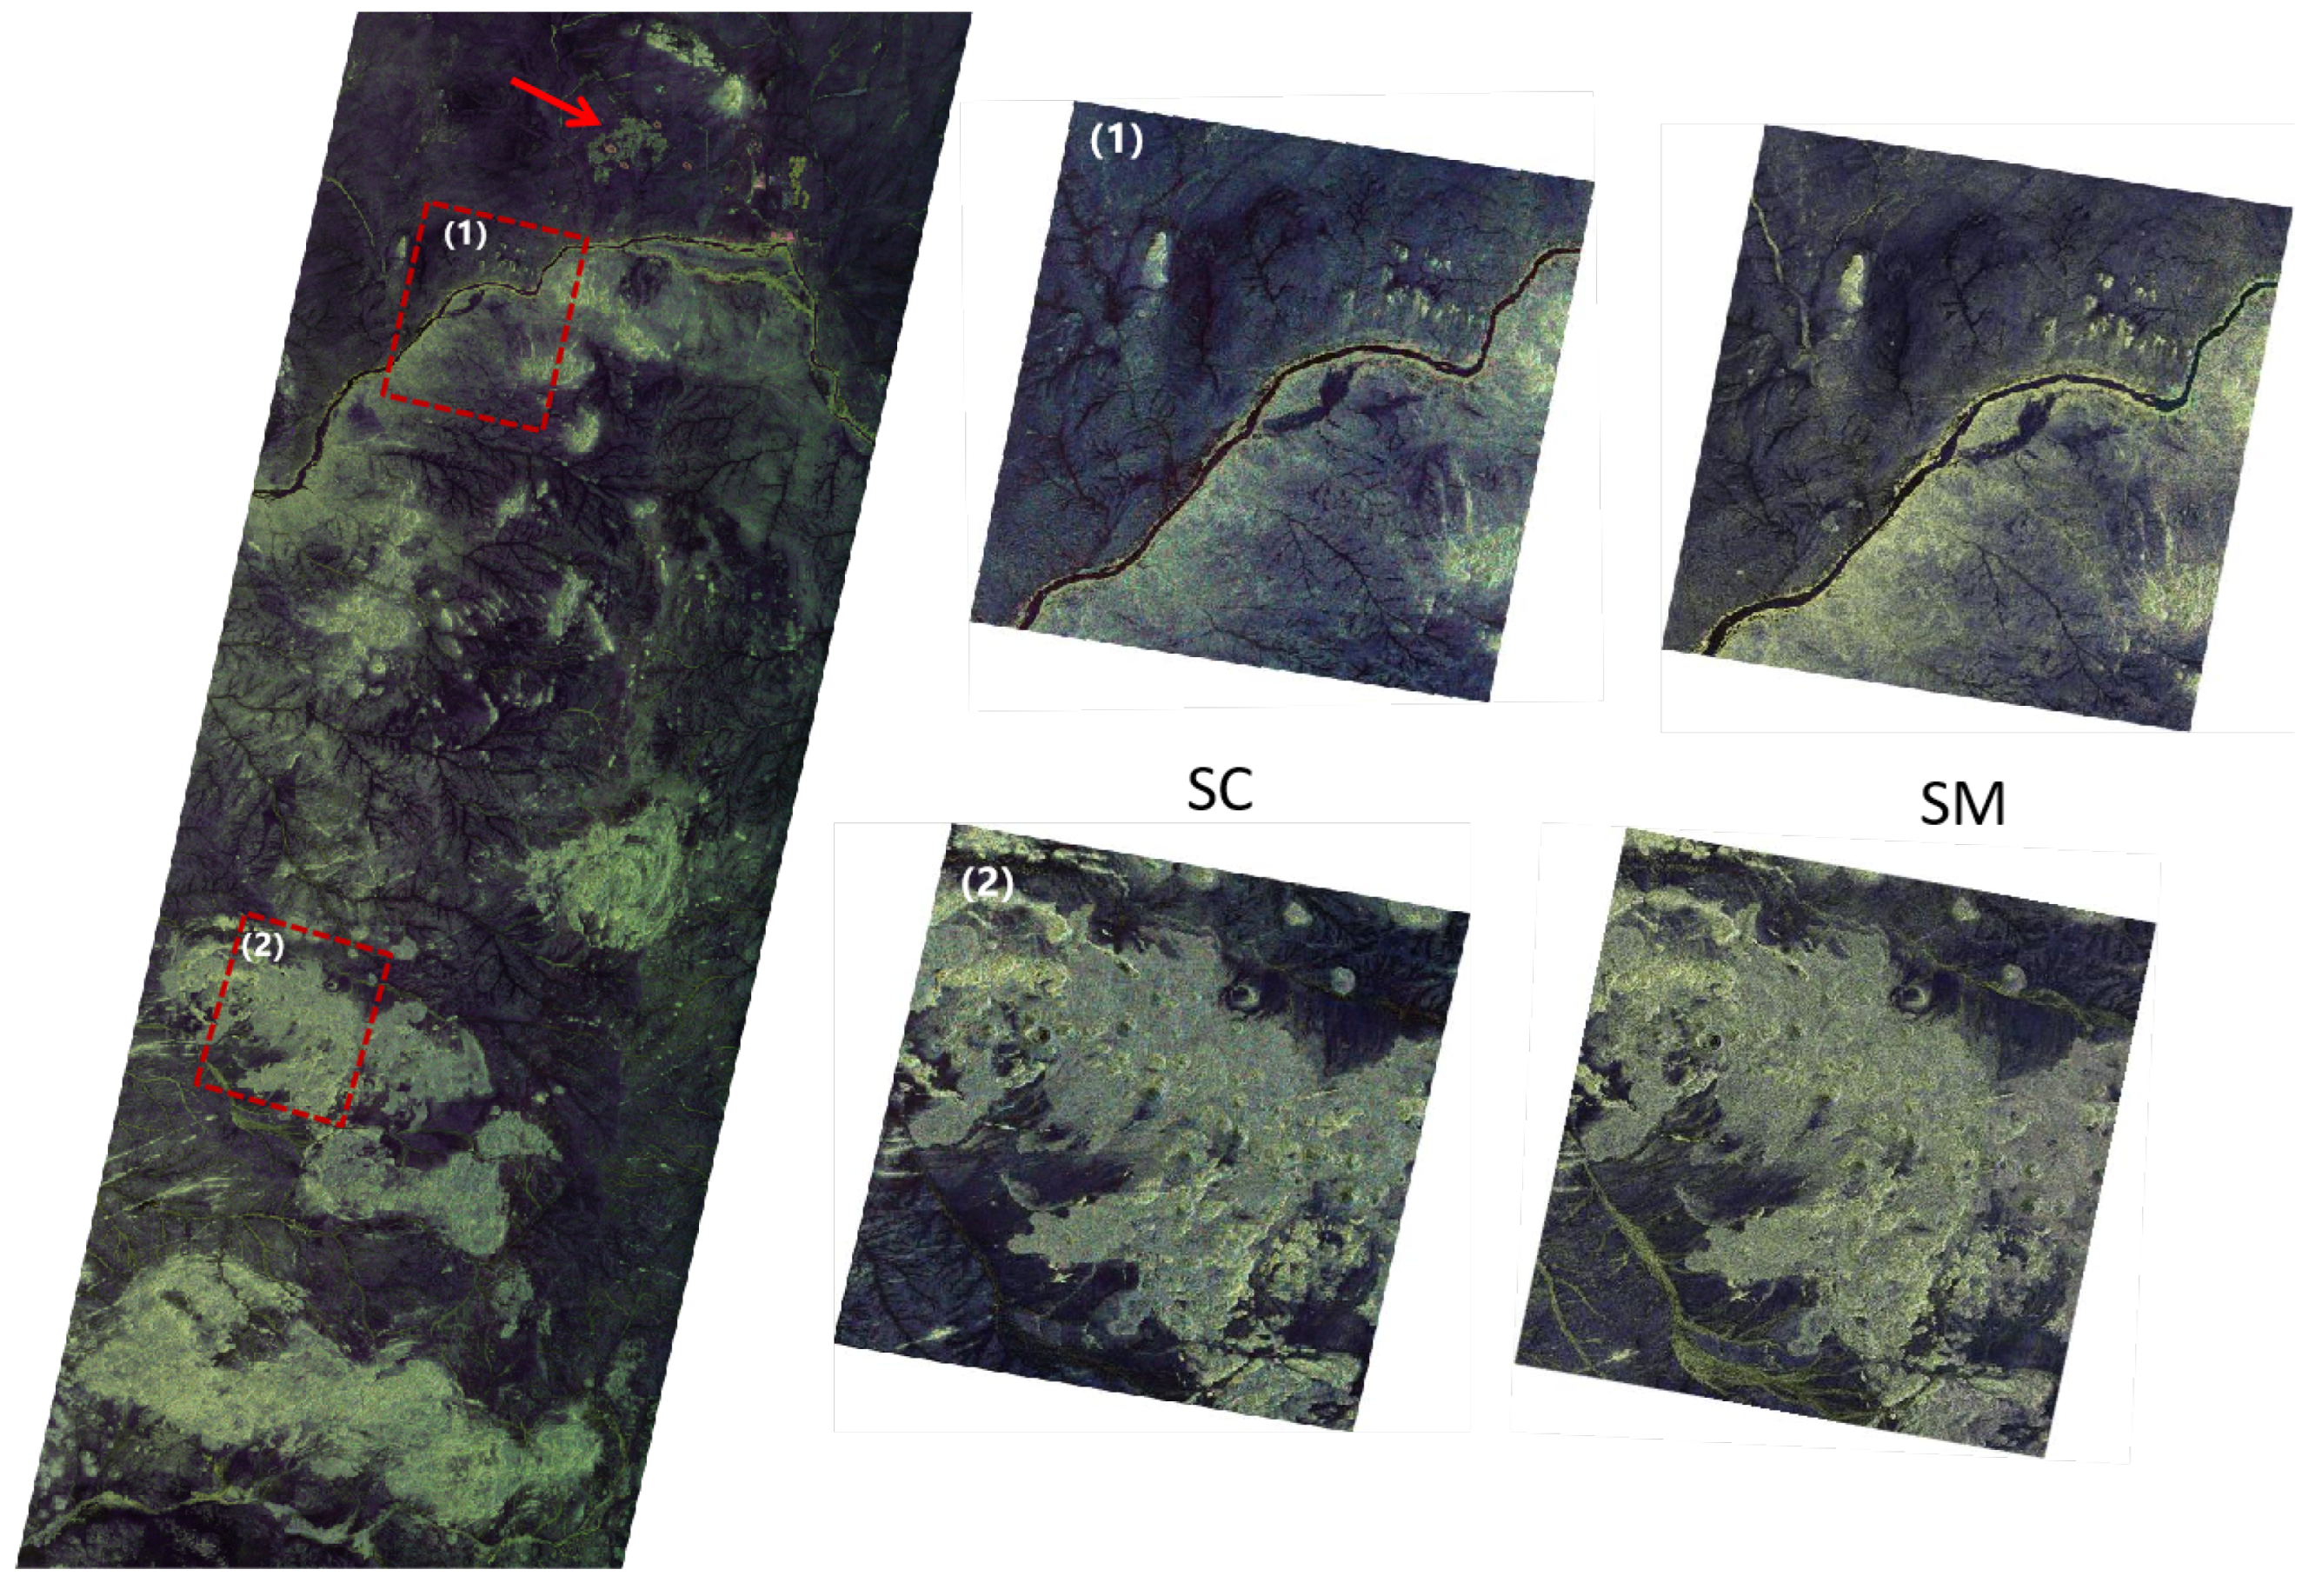
In Figure 14, the mosaic-ed Pauli pseudo-color image and comparison of SC and SM images from two regions are presented. Due to the large azimuth size of the image, we select a typical section of representative regions for display, which encompasses urban areas, water bodies, forested areas, vegetated areas, bare soil, and mountainous regions, covering all the distributed targets present in the original image. A thorough examination of the mosaic-ed pseudo-color images reveals three distinct analyses. First, four urban areas (indicated by the arrow) depicted in the image at the northern location of the river are labeled in red, which aligns with the downtown area observed in Figure 12b. These regions are located in S2, which means that the data have undergone calibration between swaths. This indicates that the image data in S2 can be rectified to obtain the true polarimetric characteristics, which substantiate the efficacy of the method used. Secondly, the color representation of the image along the range direction demonstrates excellent continuity and consistency, and the overall color representation tends to be consistent with the image representation of the quad-polarized SM data in the same area. As demonstrated in the figure, region (1) is located at the junction between S2 and S3. In the SC mode image, the color representation of the data in this region is continuous, with no apparent differences between swaths. Lastly, the pseudo-color images captured in quad-polarized SM mode exhibit superior clarity in the depiction of fine features when compared to those obtained in quad-polarized SC mode. A discernible red hue, indicative of the urban area, is evident in the images captured using SM mode. However, this distinction becomes undetectable in the images obtained using the SC mode, a phenomenon that can be primarily attributed to the disparity in resolution. Note that a lower resolution limits the ability to discern the polarimetric characteristics of small areas to a certain extent.
With reference to validation by mathematical analysis, we have chosen a polarimetric feature, which is the polarization alpha angle( α ) under investigation. Polarization α is frequently employed to characterize the average scattering mechanism. The derivation of α is based on the polarization coherency matrix, which can be described as:
T = T 11 T 12 T 13 T 21 T 22 T 23 T 31 T 32 T 33 = k p k p T = i = 1 3 λ i e i e i T
in which k p = 1 2 S H H + S V V S H H S V V 2 S H V T , λ i , and e i are the eigenvalues and eigenvectors of the matrix eigenvalue decomposition, respectively. Based on the results of the decomposition, α can be expressed as
α = i = 1 3 p i α i p i = λ i λ 1 + λ 2 + λ 3
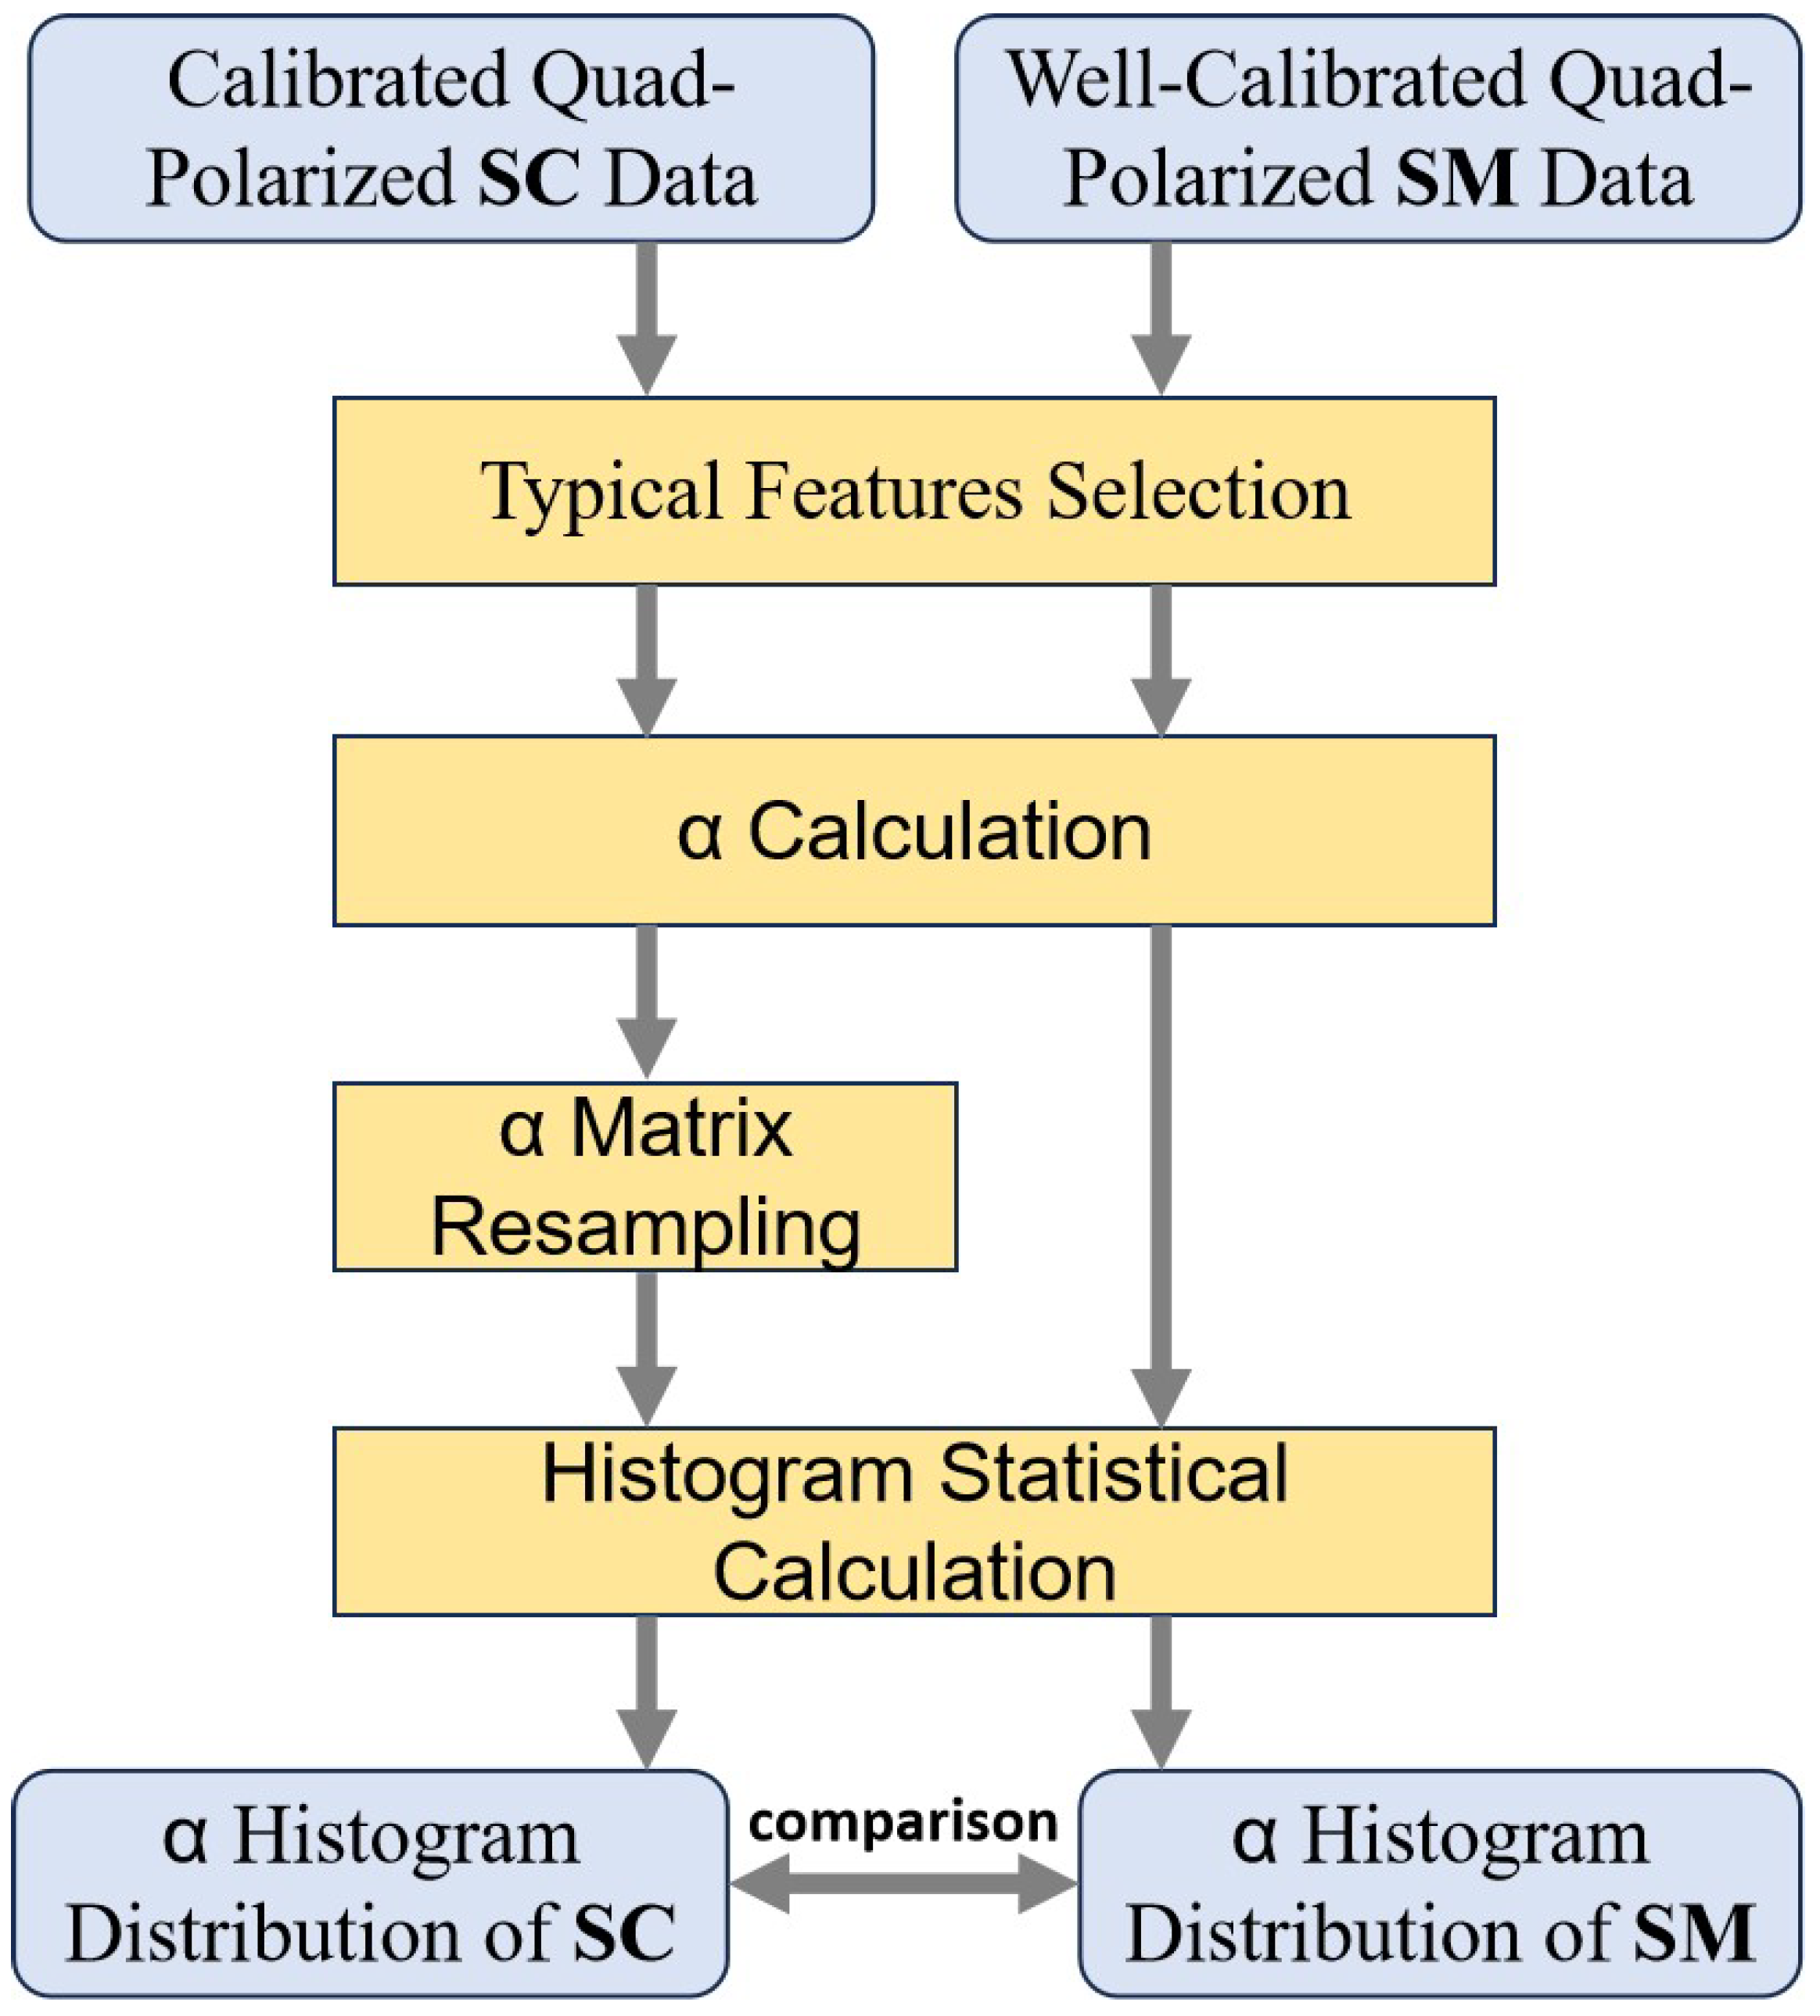
The histogram statistics of the polarization alpha angle calculated from several distributed targets will be compared between the SM and SC data. Note that due to the different resolutions of the two data sets, we resampled the SC data after the alpha calculation for histogram statistics to make the two data sets equal in size. The specific calculation process is shown in Figure 15.
Three different feature scenes have been selected to calculate the polarization alpha angle in the SM and SC modes, respectively. In Figure 16, the images of the SC mode of these three regions (river region, bare soil region, and mountain region) and the distribution comparison of α in the SC and SM modes are shown. The blue and orange bars represent the distribution of α in the SM and SC mode, respectively. The figures demonstrate the presence of a higher degree of regularity and smoothness in the distribution of α in the SM mode compared to that in the SC mode. This discrepancy is attributed to the higher resolution of the SM mode data, thereby enabling the acquisition of more detailed polarimetric information. Despite this, we can still observe that the distributions of α calculated from two different modes are quite the same. Meanwhile, α ’s distribution in SC mode varies as the scenes varies, thereby indicating its capacity to accurately reflect the polarimetric characteristics under different distributed targets. Both demonstrate that the calibrated SC mode data in S3 characterize the polarimetric information accurately. These results also verify that the method we proposed in this article is capable of assessing polarimetric performance through analyzing body-scattered natural features, as well as effectively conveying polarimetric error matrices between swaths for overall polarimetric assessment and calibration.

5. Discussion and Conclusions

In this paper, we present a method that can be used to assess and calibrate the polarimetric characteristics of a multi-beam SAR imaging mode (e.g., SC mode). In this method, the polarimetric performance of a single swath is assessed using volume-scattering distributed targets within the swath. Subsequently, by comparatively analyzing data from cross-beam areas between swaths, we transfer the polarimetric error matrix from the first swath to the others. Ultimately, a comprehensive polarimetric precessing is conducted throughout the SC image. This paper presents the first public report on the spaceborne quad-polarized SC mode.
According to the results of the experiment presented in Section 4, the following points are concluded. Firstly, by using distributed target data that satisfy the system reciprocity requirement to conduct polarimetric assessment and calibration, we obtain a Pauli pseudo-color image of a single swath that accurately characterizes the polarimetric information from different features. Secondly, we obtain the difference in polarimetric error from different beams by calculating the difference in polarimetric performance of the data in the overlapping region between swaths. Third, we applied the assessment results to the polarimetric calibration and obtained the mosaic-ed quad-polarized SC image. Finally, we compare the Pseudo-color image and polarimetric parameters generated from the SC mode image with those generated from a well-calibrated quad-polarized SM mode image located in the same region. The results validate the effectiveness of our method.
Compared to the traditional external calibration method, the presented method focuses on using distributed volume scattering targets to conduct polarimetric evaluation, which could reduce the dependence of active calibrators. In addition, the method ensures polarimetric consistency between swaths while avoiding assessing the SC mode data beam-by-beam as in the conventional method.
The method we presented has not been validated in its universality because of the rarity of quad-polarized SC mode data. However, we can still explain its applicability and limitations. The polarimetric characteristics of ground features are believed to remain invariant across different satellite platforms. Our method’s core innovation lies in its error-transmission framework: once true polarimetric characteristics are obtained for specific regions, calibration can be achieved through parameter transfer. Theoretically, it is not limited to data from a specific satellite. Meanwhile, we emphasize that the method’s implementation requires only two essential conditions: (1) the presence of natural targets satisfying the loose reciprocity requirement, and (2) the availability of cross-beam area with sufficient PCR. Given the typical 300–500 km width of the wide-swath SAR systems, these requirements are practically achievable in most scenarios. Thus, we believe that the idea of the method can be applied in the assessment and calibration processing on dual-polarized SC or TOPS modes, which are widely adopted on existing SAR satellites. We believe that this part of the research can be a focus of subsequent studies.

Author Contributions

Conceptualization of the Manuscript Idea: D.Y., L.Z. (Lihua Zhong) and J.D.; Methodology and Software: D.Y., L.Z. (Lihua Zhong) and S.S.; Supervision and Funding Acquisition: L.Z. (Lihua Zhong), X.W. and W.H.; Wrote the original draft preparation: D.Y.; Reviewed and edited this paper: D.Y. and L.Z. (Lihua Zhong). Data curation: L.Z. (Liangbo Zhao) and J.S. All authors have read and agreed to the published version of the manuscript.

Funding

This work was funded by the National Natural Science Foundation of China 62171435.

Data Availability Statement

The data presented in this study are available on request from the corresponding author due to legal restrictions.

Conflicts of Interest

Author Liangbo Zhao was employed by the company China Aerospace Science and Technology Corporation.The remaining authors declare that the research was conducted in the absence of any commercial or financial relationships that could be construed as a potential conflict of interest.

References

  1. Morena, L.C.; James, K.V.; Beck, J. An introduction to the RADARSAT-2 mission. Can. J. Remote Sens. 2004, 30, 221–234. [Google Scholar] [CrossRef]
  2. Freeman, A. A new system model for radar polarimeters. IEEE Trans. Geosci. Remote Sens. 1991, 29, 761–767. [Google Scholar] [CrossRef]
  3. Thompson, A.A. Overview of the RADARSAT Constellation Mission. Can. J. Remote Sens. 2015, 41, 401–407. [Google Scholar] [CrossRef]
  4. Pitz, W.; Miller, D. The Terrasar X satellite. IEEE Trans. Geosci. Remote Sens. 2010, 48, 615–622. [Google Scholar] [CrossRef]
  5. Zhao, L.; Zhang, Q.; Li, Y.; Li, H. China’s Gaofen-3 Satellite System and Its Application and Prospect. IEEE J. Sel. Top. Appl. Earth Obs. Remote Sens. 2021, 14, 11019–11028. [Google Scholar] [CrossRef]
  6. Xie, N.; Zhang, T.; Guo, W.; Zhang, Z.; Yu, W. Dual Branch Deep Network for Ship Classification of Dual-Polarized SAR Images. IEEE Trans. Geosci. Remote Sens. 2024, 62, 5207415. [Google Scholar] [CrossRef]
  7. Suman, S.; Malin, J.; Nicholas, H.; Munk, H.S.; Henriette, S. Arctic Sea Ice Characterization Using Spaceborne Fully Polarimetric L-, C-, and X-Band SAR with Validation by Airborne Measurements. IEEE Trans. Geoence Remote Sens. 2018, 56, 3715–3734. [Google Scholar]
  8. Gill, J.P.S.; Yackel, J.J. Evaluation of C-band SAR polarimetric parameters for discrimination of first-year sea ice types. Can. J. Remote Sens. 2012, 38, 306–323. [Google Scholar] [CrossRef]
  9. Azmedroub, B.; Ouarzeddine, M.; Souissi, B. Extraction of Urban Areas from Polarimetric SAR Imagery. IEEE J. Sel. Top. Appl. Earth Obs. Remote Sens. 2016, 9, 2583–2591. [Google Scholar] [CrossRef]
  10. Liu, Y.; Zhang, M.H.; Xu, P.; Guo, Z.W. SAR ship detection using sea-land segmentation-based convolutional neural network. In Proceedings of the 2017 International Workshop on Remote Sensing with Intelligent Processing (RSIP), Shanghai, China, 18–21 May 2017; IEEE: Piscataway, NJ, USA, 2017. [Google Scholar]
  11. Wang, J.; Quan, S.; Xing, S.; Li, Y.; Wu, H.; Meng, W. PSO-based fine polarimetric decomposition for ship scattering characterization. Isprs J. Photogramm. Remote Sens. 2025, 220, 18–31. [Google Scholar] [CrossRef]
  12. Denize, J.; Hubert-Moy, L.; Pottier, E. Polarimetric SAR Time-Series for Identification of Winter Land Use. Sensors 2019, 19, 5574. [Google Scholar] [CrossRef]
  13. Holzner, J.; Bamler, R. Burst-mode and ScanSAR interferometry. IEEE Trans. Geosci. Remote Sens. 2002, 40, 1917–1934. [Google Scholar] [CrossRef]
  14. Velotto, D.; Migliaccio, M.; Nunziata, F.; Lehner, S. Dual-Polarized TerraSAR-X Data for Oil-Spill Observation. IEEE Trans. Geosci. Remote Sens. 2011, 49, 4751–4762. [Google Scholar] [CrossRef]
  15. Bräutigam, B.; Rizzoli, P.; Gonzalez, C.; Polimeni, D.; Schrank, D.; Schwerdt, M. SAR Performance of TerraSAR-X Mission with Two Satellites. In Proceedings of the 8th European Conference on Synthetic Aperture Radar, Aachen, Germany, 7–10 June 2010. [Google Scholar]
  16. Touzi, R.; Hawkins, R.K.; Cote, S. High-Precision Assessment and Calibration of Polarimetric RADARSAT-2 SAR Using Transponder Measurements. IEEE Trans. Geosci. Remote Sens. 2013, 51, 487–503. [Google Scholar] [CrossRef]
  17. Torres, R.; Navas-Traver, I.; Bibby, D.; Lokas, S.; Geudtner, D. Sentinel-1 SAR system and mission. In Proceedings of the 2017 IEEE Radar Conference (RadarConf), Seattle, WA, USA, 8–12 May 2017; IEEE: Piscataway, NJ, USA, 2017. [Google Scholar]
  18. Jiao, Y.; Zhang, F.; Liu, X.; Huang, Z.; Yuan, J. C-SAR/02 Satellite Polarimetric Calibration and Validation Based on Active Radar Calibrators. Remote Sens. 2025, 17, 282. [Google Scholar] [CrossRef]
  19. Liu, J.; Liu, L.; Zhou, X. Calibration of SAR Polarimetric Images by Covariance Matching Estimation Technique with Initial Search. Remote Sens. 2024, 16, 2400. [Google Scholar] [CrossRef]
  20. Wang, S.; Chen, K.S.; Sato, M. Performance of SAR Polarimetric Calibration Using Hybrid Corner Reflectors: Numerical Simulations and Experimental Measurements. IEEE J. Sel. Top. Appl. Earth Obs. Remote Sens. 2021, 14, 440–451. [Google Scholar] [CrossRef]
  21. Chang, Y.; Zhao, L.; Shi, L.; Nie, Y.; Hui, Z.; Xiong, Q.; Li, P. Polarimetric calibration of SAR images using reflection symmetric targets with low helix scattering. Int. J. Appl. Earth Obs. Geoinf. 2021, 104, 102559. [Google Scholar] [CrossRef]
  22. Chen, Y.; Li, L.; Liu, G.; Li, Z. Performance of an Effective SAR Polarimetric Calibration Method Using Polarimetric Active Radar Calibrators: Numerical Simulations and LT-1 Experiments. Remote Sens. 2025, 17, 584. [Google Scholar] [CrossRef]
  23. Chen, Y.; Wang, Y.; Liu, G.; Li, L. A New Polarimetric SAR Calibration Method Using Polarimetric Active Radar Calibrators. In Proceedings of the 2024 9th International Conference on Signal and Image Processing (ICSIP), Nanjing, China, 12–14 July 2024; pp. 74–77. [Google Scholar]
  24. Chi, B.; Zhang, J.; Lu, L.; Yang, S.; Huang, G. A new distributed target extraction method for polarimetric sar calibration. ISPRS Ann. Photogramm. Remote Sens. Spat. Inf. Sci. 2022, 10, 31–36. [Google Scholar] [CrossRef]
  25. Zhou, Y.; Chen, P.; Yin, Q.; Chen, E.; Ferro-Famil, L.; Zhang, F. Polarimetric SAR cross-calibration method based on stable distributed targets. Geo-Spat. Inf. Sci. 2024, 27, 773–793. [Google Scholar] [CrossRef]
  26. Cuerda Munoz, J.M.; Garcia Rodriguez, M.; Casal Vazquez, N.; Cifuentes Revenga, P.; Gi-Meno Martinez, N.; Gonzalez Bonilla, M.J.; Schmidt, K. PAZ Calibration Status After First Year of Operation. In Proceedings of the EUSAR 2021; 13th European Conference on Synthetic Aperture Radar, Online, 29 March–1 April 2021; pp. 114–119. [Google Scholar]
  27. Badatala, S.; Sharma, S.; Tripathi, S.; Patel, P.R.; Mathur, A.K. Radiometric calibration stability assessment of Sentinel-1B using point targets at Surat Basin, Australia. Int. J. Microw. Wirel. Technol. 2022, 14, 1262–1269. [Google Scholar] [CrossRef]
  28. Martínez, N.G.; Miguel, B.G.; Pescador, A.L.; Revenga, P.C.; Borge, J.C.N. Cross-calibration of full polarimetric RIX and TerraSAR-X data. In Proceedings of the 2012 IEEE International Geoscience and Remote Sensing Symposium, Munich, Germany, 22–27 July 2012. [Google Scholar]
  29. Caves, R. RADARSAT-2 Polarimetric Calibration Performance Over Five Years of Operation. In Proceedings of the EUSAR 2014; 10th European Conference on Synthetic Aperture Radar, Berlin, Germany, 3–5 June 2014. [Google Scholar]
  30. Luscombe, A.P.; Chotoo, K.; Huxtable, B.D. Polarimetric calibration for RADARSAT-2. In Proceedings of the IEEE International Geoscience Remote Sensing Symposium, Honolulu, HI, USA, 24–28 July 2000. [Google Scholar]
  31. Huang, J.; Yan, B.; Sun, N. Monitoring of the Cross-Calibration Biases Between the S-NPP and NOAA-20 VIIRS Sensor Data Records Using Goes Advanced Baseline Imager as a Transfer. In Proceedings of the IGARSS 2020–2020 IEEE International Geoscience and Remote Sensing Symposium, Waikoloa, HI, USA, 26 September–2 October 2020; IEEE: Piscataway, NJ, USA, 2020. [Google Scholar]
  32. Gao, C.; Jiang, X.; Li, X.; Li, X. The cross-calibration of CBERS-02B/CCD visible-near infrared channels with Terra/MODIS channels. Int. J. Remote Sens. 2013, 34, 3688–3698. [Google Scholar] [CrossRef]
  33. Thome, K.J.; Biggar, S.F.; Wisniewski, W. Cross comparison of EO-1 sensors and other Earth resources sensors to Landsat-7 ETM+ using Railroad Valley Playa. IEEE Trans. Geosci. Remote Sens. 2003, 41, 1180–1188. [Google Scholar] [CrossRef]
  34. Zhou, Y.; Chen, X.; Yin, Q.; Ma, F.; Zhang, F. SAR Radiometric Cross-Calibration Based on Multiple Pseudoinvariant Calibration Sites with Extensive Backscattering Coefficient Range. IEEE J. Sel. Top. Appl. Earth Obs. Remote Sens. 2025, 18, 4836–4849. [Google Scholar] [CrossRef]
  35. Jiang, S.; Qiu, X.; Han, B.; Hu, W. A Quality Assessment Method Based on Common Distributed Targets for GF-3 Polarimetric SAR Data. Sensors 2018, 18, 807. [Google Scholar] [CrossRef]
  36. Zyl, J.J.V. Calibration of polarimetric radar images using only image parameters and trihedral corner reflector responses. IEEE Trans. Geosci. Remote Sens. 1990, 28, 337–348. [Google Scholar]
  37. Souyris, J.C.; Imbo, P.; Fjortoft, R.; Mingot, S.; Lee, J.S. Compact polarimetry based on symmetry properties of geophysical media: The /spl pi//4 mode. IEEE Trans. Geosci. Remote Sens. 2005, 43, 634–646. [Google Scholar] [CrossRef]
  38. Guissard, A. Phase calibration of polarimetric radars from slightly rough surfaces. IEEE Trans. Geosci. Remote Sens. 1994, 32, 712–715. [Google Scholar] [CrossRef]
  39. Zebker, H.A.; Lou, Y. Phase calibration of imaging radar polarimeter Stokes matrices. IEEE Trans. Geosci. Remote Sens. 2002, 28, 246–252. [Google Scholar] [CrossRef]
  40. Otsu, N. A Threshold Selection Method from Gray-Level Histograms. IEEE Trans. Syst. Man, Cybern. 1979, 9, 62–66. [Google Scholar] [CrossRef]
  41. Mahmood, E.A.; Rana, S.; Midi, H.; Hussin, A.G. Detection of Outliers in Univariate Circular Data using Robust Circular Distance. J. Mod. Appl. Stat. Methods 2017, 16, 418–438. [Google Scholar] [CrossRef]
Figure 1. ScanSAR data processing approach.
Remotesensing 17 03420 g001
Figure 2. The image of the experimental ScanSAR data.
Remotesensing 17 03420 g002
Figure 3. Overall flow chart of the proposed assessment and calibration method.
Remotesensing 17 03420 g003
Figure 4. Forested area in the Swath-1 and corresponding optical images.
Remotesensing 17 03420 g004
Figure 5. Distributed targets that satisfy the reciprocity requirement for phase assessment and corresponding optical images.
Remotesensing 17 03420 g005
Figure 6. The distribution of cross-beam area in ScanSAR.
Remotesensing 17 03420 g006
Figure 7. Distribution of target and background for PCR calculations.
Remotesensing 17 03420 g007
Figure 8. Threshold Solving Method diagram Based on OTSU.
Remotesensing 17 03420 g008
Figure 9. The distribution of selected forested area.
Remotesensing 17 03420 g009
Figure 10. The distribution of selected cropland area.
Remotesensing 17 03420 g010
Figure 11. Polarimetric imbalance assessment results.
Remotesensing 17 03420 g011
Figure 12. Pauli pseudo-color image of the assessment area.
Remotesensing 17 03420 g012
Figure 13. Swath images and selected overlapping regions.
Remotesensing 17 03420 g013
Figure 14. Pauli pseudo-color image of the mosaic-ed quad-polarized SC data.
Remotesensing 17 03420 g014
Figure 15. The Specific calculation process.
Remotesensing 17 03420 g015
Figure 16. Histograms of the polarization alpha angle.
Remotesensing 17 03420 g016
Table 1. Gaofen-3 ScanSAR Mode Parameters.
Swath NumberResolution(m)Swath Width (km)Polarization Mode
NSC350300HHHV/VVVH
WSC5100500HHHV/VVVH
GLO7500650HHHV/VVVH
Table 2. Imaging Parameters of the SC Experiment Data.
SwathBeamCenter Look Angle (°)PRF (Hz)Bandwidth (MHz)
S1Q929.362797.860.00
S2Q1030.562738.140.00
S3Q1131.702554.430.00
Table 3. Results of amplitude and phase error for each polarization.
Overlapping SwathsNo. Δ A HH ( dB ) Δ P HH ( ) Δ A HV ( dB ) Δ P HV ( ) Δ A VH ( dB ) Δ P VH ( ) Δ A VV ( dB ) Δ P VV ( )
S1&S21−0.0416−32.78590.2279164.1152−0.503653.7889−0.053237.9361
20.2830−35.08610.8305165.67380.047252.12940.350537.1410
3−0.1433−36.35980.1132165.9473−0.581852.0011−0.182039.2041
40.4237−39.20930.4395166.6406−0.181955.12740.447036.5987
50.3551−39.76850.6870168.28310.009858.11010.409934.0034
60.4343−37.49310.5987166.5710−0.051457.16450.480335.8576
Results(S1→S2)0.3191−36.92650.5191166.2592−0.116754.45820.380236.8699
S2&S31−0.48774.89550.4476−91.4284−1.02566.97440.1027−98.0951
2−0.9754.1116−0.6315−94.11251.14739.1473−0.4656−96.9788
3−0.54076.25420.4694−92.6288−0.21557.78450.1401−94.4985
4−0.39858.40670.5658−92.3695−1.41276.58730.2338−92.8406
5−0.6929.60960.0326−89.28501.22589.2258−0.0785−91.8729
6−0.55626.60800.3428−91.9332−0.24327.75680.0134−92.0900
7−0.15657.39881.0122−92.8681−3.24854.75150.5645−92.0114
8−0.22384.69590.9205−95.5601−5.34182.65820.5042−89.1590
Results(S2→S3)−0.51426.43110.4585−92.4992−0.63447.36560.1214−92.4653
(S1→S3)−0.1952−30.49540.977673.76−0.751161.82380.5016−55.5955
Disclaimer/Publisher’s Note: The statements, opinions and data contained in all publications are solely those of the individual author(s) and contributor(s) and not of MDPI and/or the editor(s). MDPI and/or the editor(s) disclaim responsibility for any injury to people or property resulting from any ideas, methods, instructions or products referred to in the content.