Article

Geographically Weighted Quantile Machine Learning for Probabilistic Soil Moisture Prediction from Spatially Resolved Remote Sensing

1
Intelligent Data Ecosystems, Rothamsted Research, Harpenden AL5 2JQ, UK
2
Net Zero and Resilient Farming, Rothamsted Research, Okehampton EX20 2SB, UK
*
Author to whom correspondence should be addressed.
Remote Sens. 2025, 17(16), 2907; https://doi.org/10.3390/rs17162907
Submission received: 1 July 2025 / Revised: 7 August 2025 / Accepted: 18 August 2025 / Published: 20 August 2025

Abstract

This study proposes a geographically weighted (GW) quantile machine learning (GWQML) framework for soil moisture (SM) prediction, integrating spatial kernel functions with quantile-based prediction and uncertainty quantification. The framework incorporates satellite radar backscatter, meteorological re-analysis, and topographic variables, applied across 15 SM stations and six land use systems at the North Wyke Farm Platform, southwest England, UK. GWQML was implemented using Gaussian and Tricube spatial kernels across a range of kernel bandwidths (500–1500 m). Model performance was evaluated using both in-sample and Leave-One-Land-Use-Out validation schemes, and a global quantile machine learning model (QML) without spatial weighting served as the benchmark. GWQML achieved R2 values up to 0.85 and prediction interval coverage probabilities up to 0.9, with intermediate kernel bandwidths (750–1250 m) offering the best balance between accuracy and uncertainty calibration. Spatial autocorrelation analysis using Moran’s I revealed a lower residual clustering under GWQML relative to the benchmark model, which suggests improved handling of local spatial variation. This study represents one of the first applications of geographically weighted kernel functions in a quantile machine learning framework for daily soil moisture prediction. The approach implicitly captures spatially varying relationships while delivering calibrated uncertainty estimates for scalable SM monitoring across heterogenous agricultural landscapes.

1. Introduction

Soil moisture (SM) is a key variable in hydrology, agronomy, and environmental science [1]. It controls the movement of water and energy between atmosphere, vegetation, and soil [2], and influences essential processes such as plant growth, microbial activity, runoff generation, and drought development [3,4,5]. A precise estimation of SM is important for crop modelling, irrigation scheduling, and climate impact assessment. However, SM is variable in both space and time. Its dynamics are shaped by interactions between soil type, vegetation, land managements, topography, and meteorological conditions which often vary across short distances [6]. This variability presents a challenge for large-scale timely prediction and limits the reliability of predictive models trained on aggregated data.
The increasing availability of remote sensing data has improved the ability to predict SM over a range of spatial and temporal scales [7]. Passive microwave observations, such as those from SMOS and SMAP, provide direct measurements of surface SM at coarse resolution, and have been widely used in large-scale hydrological and climate studies. SMOS products have shown improved accuracy in dense vegetation conditions and heterogeneous surfaces when evaluated against global in situ networks [8]. Algorithm developments, including neural network-based retrievals, have further enhanced the spatial consistency of SMOS across diverse eco-climatic regions [9]. SMAP observations have also been applied to monitor SM dynamics in response to seismic events, highlighting their utility beyond conventional hydrological contexts [10]. However, the coarse spatial resolution of passive microwave SM products (typically 25–50 km) limits their applicability in field-scale studies, motivating research into spatial downscaling techniques [11]. Active microwave systems, including radar backscatter from Sentinel-1 and similar missions, offer finer spatial detail and greater sensitivity to changes in surface roughness and moisture, particularly under vegetated conditions. Recent studies have demonstrated the value of Sentinel-1 data for high-resolution SM prediction at the global scale using dual-polarization retrieval algorithms, achieving spatial resolutions of 1 km with strong agreement to in situ observations [12]. At the field scale, the integration of Sentinel-1 with ground-penetrating radar has further enhanced the accuracy of moisture mapping under heterogeneous surface conditions, supporting precision agriculture and localised water management [13]. Optical and thermal sensors, including MODIS and Landsat, do not sense SM directly but provide vegetation and temperature indices that are often used as proxies for SM availability. MODIS-derived NDVI and land surface temperature have been used to estimate SM at a 1 km resolution across diverse land cover types in China, with model performance shown to vary by vegetation and soil properties [14]. In a separate study by Zhang et al. [15] over the Tibetan Plateau, Landsat 8 data combined with ensemble learning models produced SM predictions at 30 m resolution. These remotely sensed data sources are increasingly combined with re-analysis climate products such as ERA5-Land, and terrain attributes based on elevation models to generate predictor sets for empirical models [16,17,18]. This integration enables near real-time SM predictions at resolutions compatible with field or region-level applications.
To predict SM across space and time, two broad classes of modelling approaches have been widely used, as follows: process-based and data-driven models. Process-based models (PBMs) simulate the physical and biochemical mechanisms that govern soil water movement, infiltration, and evapotranspiration. Models such as SWAP [19] and SWAT [20], which represent SM as a function of hydraulic properties, boundary conditions, and vegetation parameters have successfully simulated SM in different landscapes [20,21]. However, their application requires detailed site-specific parametrisation and input parameters that are not always easy to generate at scale. The second approach of SM modelling is based on data-driven and statistical association. These models learn directly from data without explicit representation of the underlying processes and have been widely adopted to predict SM across agricultural and hydrological systems [22]. They often require fewer assumptions and less computationally intensive calibrations [23]. However, their effectiveness depends on the representativeness and quality of the training data [24]. Another limitation is that data-driven models often assume that the relationships learned are spatially invariant across study areas [25], potentially reducing accuracy in heterogenous landscapes.
The assumption of spatial stationary is problematic in heterogenous landscapes where soil properties, land management, and vegetation vary over short distances [26,27]. In such contexts, a global (non-spatial) model may fail to capture the spatial variation in predictor–response relationships, leading to systematic biases and unreliable uncertainty estimates [28]. Spatially adaptive frameworks have been always considered as a possible solution [29,30]. By enabling the structure of the model to vary over space during learning processes, geographically weighted (GW) machine learning (GWML) models incorporate spatial kernels that assign location-specific weights to training data. Thus, they can accommodate local heterogeneity and reduce spatial bias in predictions. Applications of GW approaches have demonstrated improved performance in downscaling coarse-resolution satellite moisture products. For instance, Zhong et al. [31] applied a multiscale GW regression to downscale SMAP SM in semi-arid regions. The results showed that the model not only effectively captured variable spatial influence of predictions such as NDVI and LST but also achieved lower prediction errors compared to conventional moving-window methods. Similarly, Tong et al. [32] combined GWML with radiative transfer models to disaggregate SMAP brightness temperature from 36 km to 1 km in the ShanDian River Basin, producing high-resolution SM prediction that aligned more closely with in situ measurements than standard SMAP products.
In parallel to efforts towards spatial adaptivity, increasing attention has been given to probabilistic modelling frameworks that capture not only point predictions but also the range of likely outcomes [33,34]. Quantile regression provides an effective way to characterise the conditional distribution of a target variable and has been integrated into machine learning algorithms such as quantile random forests [35] and gradient-boosted quantile trees [36]. These models produce interval estimates that quantify predictive uncertainty, which is important for risk-aware decision-making in agricultural and environmental application. Despite the advantages of quantile-based models, their standard implementations are global and do not incorporate spatial weighting. Consequently, they inherit the same limitations as other spatially invariant models in heterogeneous settings. While spatially weighted models and quantile-based approaches have each been used to address distinct challenges in SM modelling, no prior study has combined them into a unified framework for SM prediction. This absence limits the ability to simultaneously account for spatial heterogeneity and quantify predictive uncertainty in heterogenous landscapes.
To address this gap, the present study introduces a GW Quantile Machine Learning (GWQML) framework for spatially adaptive and uncertainty-aware predictions of SM. The framework combines quantile regression with spatial kernel weighting, allowing, subsequently, the conditional distribution of predictions to vary across space. The model incorporates fixed-bandwidth Gaussian and Tricube kernels to weight training observations based on their spatial proximity to each prediction location. The approach is applied to 15 SM stations at the three research farms of the North Wyke Farm Platform (NWFP) in southwest England, in which the landscape has been managed under six different land use systems. The objectives of this study are to (i) evaluate whether a spatially weighted quantile model improves predictive accuracy and uncertainty estimates compared to a global (non-spatial) quantile model; (ii) assess their ability to generalise to previously unseen land use systems; and (iii) examine the extent to which spatial weighting mitigates spatial dependence in model residuals relative to a global baseline. Model performance was evaluated under both conventional random cross-validation and a Leave-One-Land-Use-Out (LOLUO) scheme to assess spatial generalisability. A global quantile machine learning model (QML) without spatial weighting served as a benchmark. Residual spatial autocorrelation in prediction error was evaluated to determine whether the proposed model improved spatial consistency relative to the non-spatial baseline.

2. Materials and Methods

2.1. Experimental Setup

This study was conducted at the NWFP, a long-term experimental research site situated in Devon, southwest England (50°46′N, 3°54′W). Established in 2010, the NWFP is designed to support integrated research on sustainable land management and agri-environmental processes under temperate conditions [37,38,39]. The platform spans approximatively 63 hectares and is subdivided into 15 hydrologically isolated catchments equally grouped across three farmlets (termed Red, Green, and Blue), where each farmlet is managed according to a distinct land use strategy (Figure 1) that periodically changes to facilitate multiple land use comparisons. The NWFP lies within a temperate maritime climate zone characterised by mild temperatures and high rainfall, with a mean annual precipitation of approximatively 1031 mm and a mean air temperature of 10.1 °C. Precipitation is unevenly distributed across the year, with most rainfall occurring between October and March, often leading to seasonally saturated soils. The predominant soil types across the platform are Hallsworth and Halstow series [40]. The Hallsworth soils are poorly drained, heavy clay loams prone to waterlogging, while Halstow soils offer better drainage and moderate water retention [41].
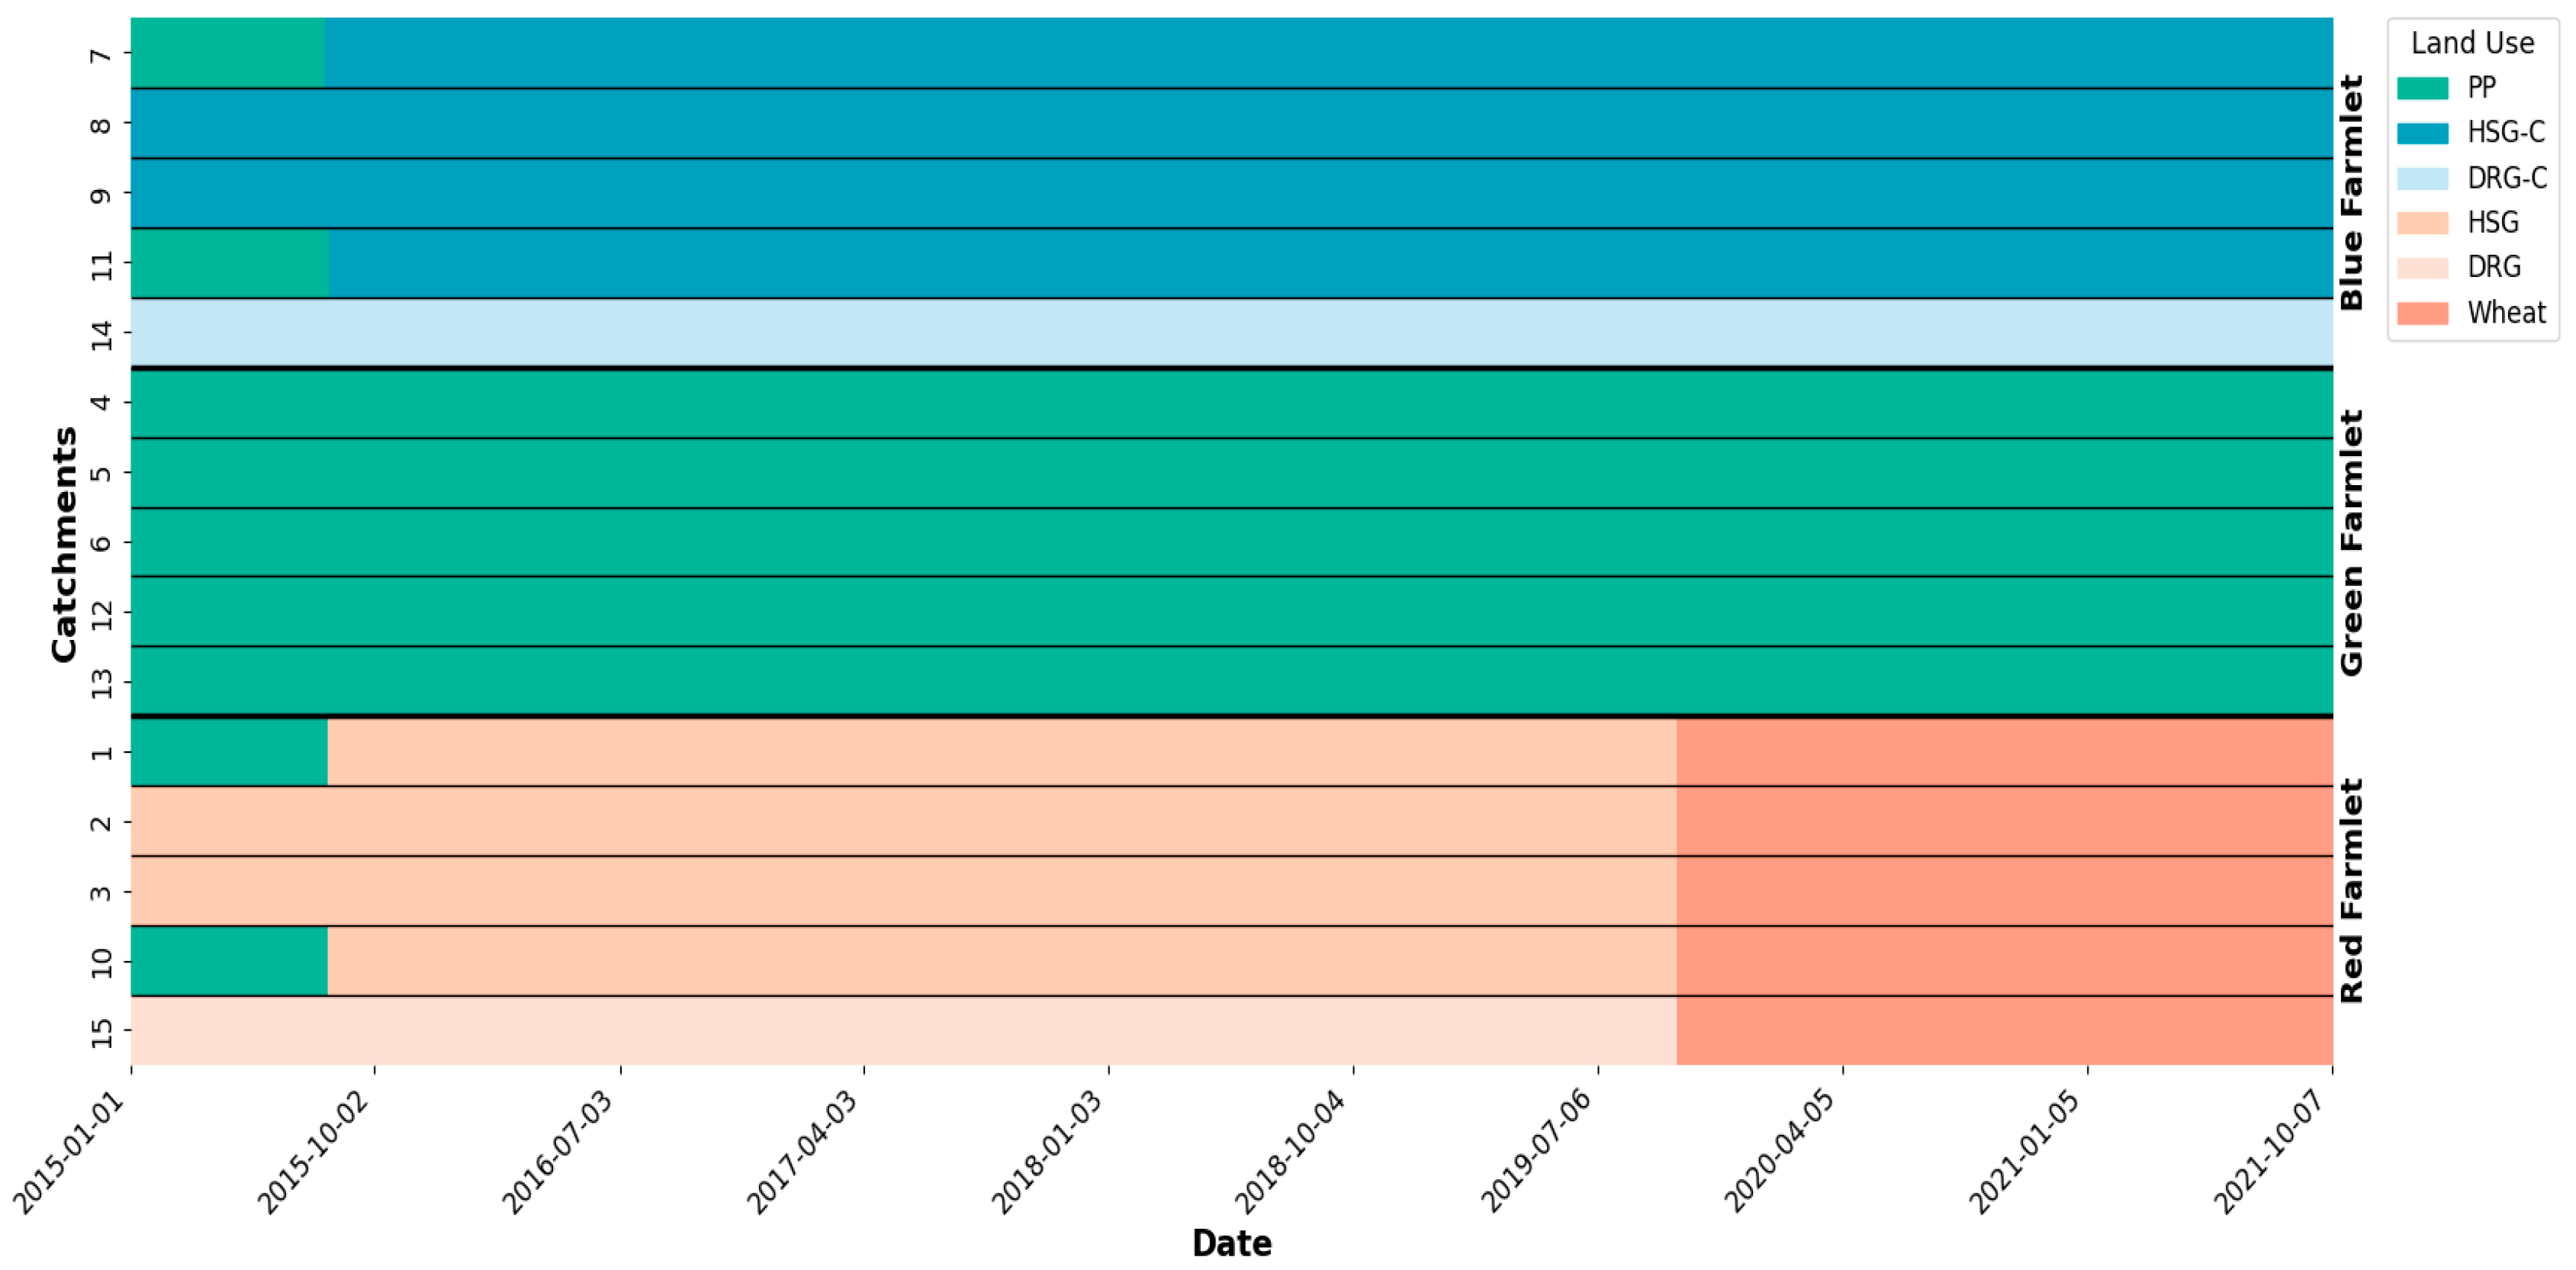
Land use varied both spatially and temporally across the 15 catchments (Figure 2). In total, six land use types were investigated across the study period (2015–2021): permanent pasture (PP), high-sugar grass (HSG), high-sugar grass with clover (HSG-C), deep-rooted grass (DRG), deep-rooted grass with clover (DRG-C), and (winter) wheat. The Red farmlet initially supported a mix of PP, DRG, and HSG systems, but all the Red farmlet’s catchments were converted to winter wheat in 2019. The Green farmlet was consistently managed under PP throughout the study period. The Blue farmlet included catchments that remained under DRG-C and HSG-C, while others initially under PP transitioned to HSG-C. Observe that some of the 15 catchments consist of two fields and that the DRG and DRG-C land use was limited in implementation to only 2 catchments [42,43].

2.2. Soil Moisture Data

Soil moisture (SM) measurements were obtained using a network of 15 SM stations, each equipped with capacitance-based probes (Adcon SM1, model A51730) installed to 30 cm depths and reported high-resolution SM at 15 min intervals. Data from the six land use categories were first quality controlled and harmonised from scaled frequency units (SFU) to volumetric moisture content (m3/m3) using a series of protocols [42]. Only SM data at 10 cm depths were used due to unreliability in deeper probe readings. Figure 3 presents the temporal evolution of SM for each land use from January 2015 to October 2021. Daily SM averages were calculated to characterise seasonal patterns across land uses and to reduce high-frequency temporal autocorrelation present in the original 15 min measurements, thereby improving the independence of observations used in subsequent modelling and validation steps. All land uses showed a clear seasonal cycle, with higher SM values during winter (typically > 0.38 m3/m3) and progressive drying during spring and summer. DRG and DRG-C land uses displayed the most dynamic seasonal ranges, with frequent declines below 0.2 m3/m3 during summer droughts. Descriptive statistics summarising the full distributions of SM by land use are presented in Table 1. A detailed year-wise distribution of SM observations for each land use is provided in Appendix A (Table A1).

2.3. Satellite-Derived and Temporal Predictors

Environmental predictor variables were extracted using Google Earth Engine [44], covering radar backscatter, meteorological re-analysis, and terrain-based topographic indices. Data were processed at daily resolution and spatially summarised using a 10 m buffer around each soil moisture station. Backscatter data were obtained from Sentinel-1 Ground Range Detected (GRD) products in interferometric wide swath mode, restricted to descending orbits with dual-polarised (VV and VH) acquisitions. From these base channels, multiple polarimetric indices were computed to enhance sensitivity to surface moisture vegetation structure and roughness. The Water Index (WI) was calculated as
W I = σ V H 0 σ V H 0 + σ V V 0 + ε
where σ V V 0 and σ V H 0 are the co-polarised and cross-polarised backscatter coefficients, respectively, and ε is a small constant added to avoid division by zero. This ratio serves a radar-based proxy for surface wetness, particularly in vegetated environments [45]. In addition, the Depolarisation Power (DP) was derived as
D P = σ V H 0 .   σ V V 0
The Depolarisation Power reflects the intensity of depolarised radar returns and is often associated with heterogeneous canopy or rough soil surfaces. In addition to polarimetric indices, the raw VV and VH backscatter coefficients were included as standalone variables to capture direct radar reflectance from surface and vegetation structures. Meteorological variables were also extracted from ERA5-Land at hourly resolutions and aggregated to daily values. These include the 2 m air temperature, surface pressure, total precipitation, surface runoff, and daily net solar radiation. Terrain variables were also computed from the Shuttle Radar Topography Mission (SRTM) digital elevation model at 90 m resolution. These variables included elevation, hill-shade, and slope. The Topographic Position Index (TPI) was calculated by subtracting the mean elevation of a circular neighbourhood from each pixel’s elevation [46]. The Topographic Wetness Index (TWI) was computed as
T W I = log   α + 1 tan β + ε
where α is upslope contributing area, β is the slope in radians, and ε is a small constant to avoid division by zero. TWI is widely used to represent the spatial distribution of SM potential based on terrain configuration [47,48]. Although the study area is relatively small, local variations in slope and upslope contributing area can influence lateral water redistribution and surface saturation. Including TWI therefore helps capture micro-topographic controls on soil moisture dynamics that may interact with land use and meteorological variability at fine scales.
To account for the intra-annual periodicity of SM dynamics and retrieved remotely sensed data, a cyclic temporal signal (CTS) was incorporated and defined as
C T S = cos ( 2 π . d 365 )
where d denotes the day of the year. This transformation has been widely adopted in environmental and land surface modelling to encode periodic and climatic drivers [49,50]. Given the non-linear, tree-based nature of LightGBM (v3.3.5), which is robust to multicollinearity, no formal diagnostic was applied. The CTS signal was retained based on its contribution to prediction accuracy in preliminary experiments.

2.4. Methodological Framework

To model spatially heterogeneous SM dynamics and their associated uncertainty, we implemented a probabilistic, kernel-weighted machine learning framework composed of a Global Quantile Machine Learning Model (QML) and a spatially localised, GW Quantile Machine Learning Model (GWQML). Both models were fitted using Light Gradient Boosting Machine [51], a gradient-boosting decision tree algorithm that supports native quantile regression and enables direct estimation of conditional quantiles through its asymmetric loss function. All predictor variables were aggregated into a unified feature vector for each observation and standardised using z-score normalisation. These features served as direct inputs to the quantile LightGBM models. In the QML (global) model, all training samples contributed equally, whereas in the GWQML setting, the same inputs were used but each sample was weighted according to its spatial proximity to the test point using kernel functions. The spatial weights thus modulated the influence of each training instance during learning, without altering the structure or selection of input features. For a given quantile level τ ϵ (0,1), the objective function minimised by the model is the quantile loss:
d τ ( y , y ^ )   = τ   y y ^ , y y ^ 1 τ   y ^ y , o t h e r w i s e
where y is the observed SM and y ^ is the predicted quantile. This formulation was used to independently estimate the 0.1, 0.5, and 0.9 conditional quantiles of SM, with predictor variables standardised using a z-score normalisation prior to fitting [52]. The global model, QML, served as a benchmark where no spatial structure was introduced, while the localised model, GWQML, assigned distance-based kernel weights to training samples to account for spatial non-stationarity in predictor–response relationships. This distinction reflects the difference between a spatially uniform model and one that adapts locally via distance-based weighting. In the GWQML setting, spatial weights were assigned using a kernel function based on haversine distances between the test location and all training samples. The haversine distance is defined as
d i = 2 r . a r c s i n ( sin 2 ϙ i ϙ 0 2 + cos ϙ i cos ϙ 0 s i n 2 ζ i ζ 0 2 )
where ( ϙ i , ζ i ) are the latitude and longitude of the training sample, ( ϙ o , ζ o ) denote the centroid of the test sample, and r is the Earth’s radius. The resultant distance was then transformed into a sample weight using two alternative kernel functions. The geographical weighting term corresponds to kernel-derived weights computed from the distance between each training point and the test location. The Gaussian kernel is defined as
w i = e 1 2   d i b 2
while the Tricube kernel is defined as
w i = 1 d i b 3 3 ,           i f   d i < b         0 ,                                                             O t h e r w i s e
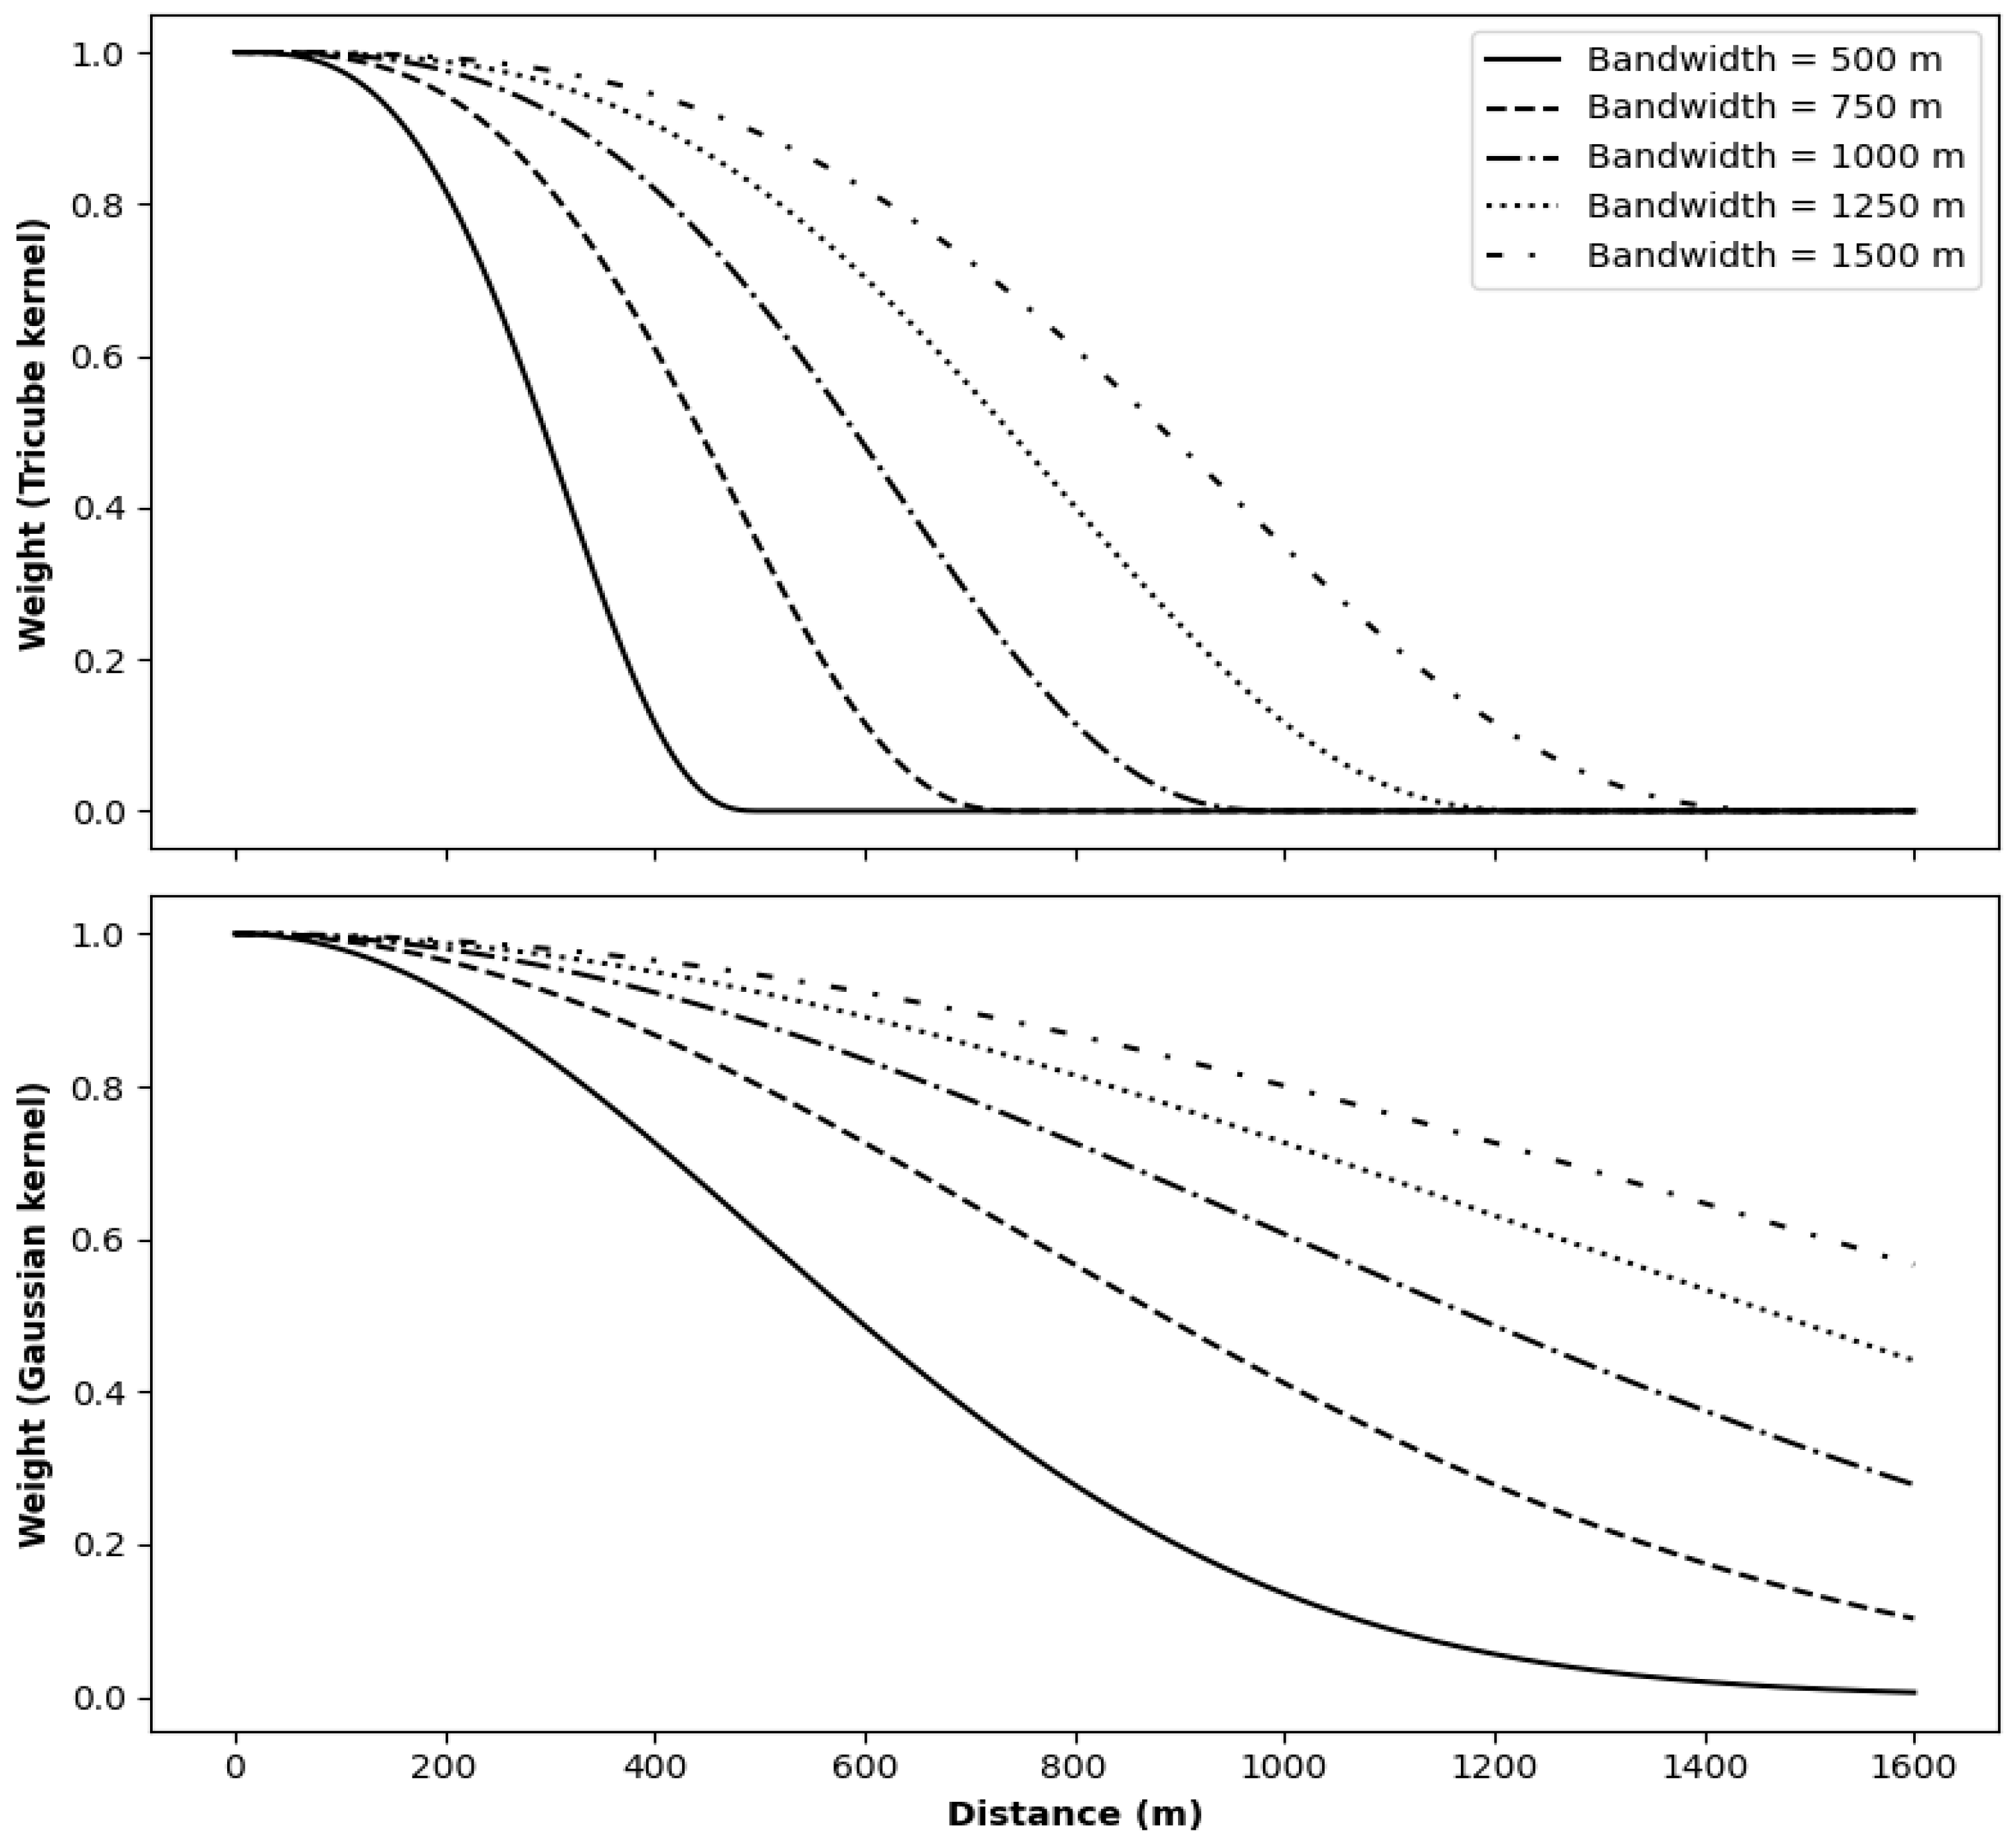
where b is a kernel bandwidth that controls the spatial extent of influence. To systematically evaluate the sensitivity of model performance to the scale of spatial weighting, we used a fixed set of five bandwidth values: 500, 750, 1000, 1250, and 1500 m. These values were selected to span the full range of pairwise distances observed among the 15 SM stations at the NWFP. The decay behaviour of both kernel types across the selected bandwidths is shown in Figure 4.
Model complexity was controlled by training each configuration with 50 boosting iterations. The 0.5 quantile provided the central prediction, while the 0.1 and 0.9 quantiles formed a symmetric 80% uncertainty band. To ensure calibrated interval estimates, we used conformal prediction on a held-out calibration set (30% of training samples). Conformal intervals were defined as
y ^ 0.1 ε l o y i y ^ 0.9 + ε u p
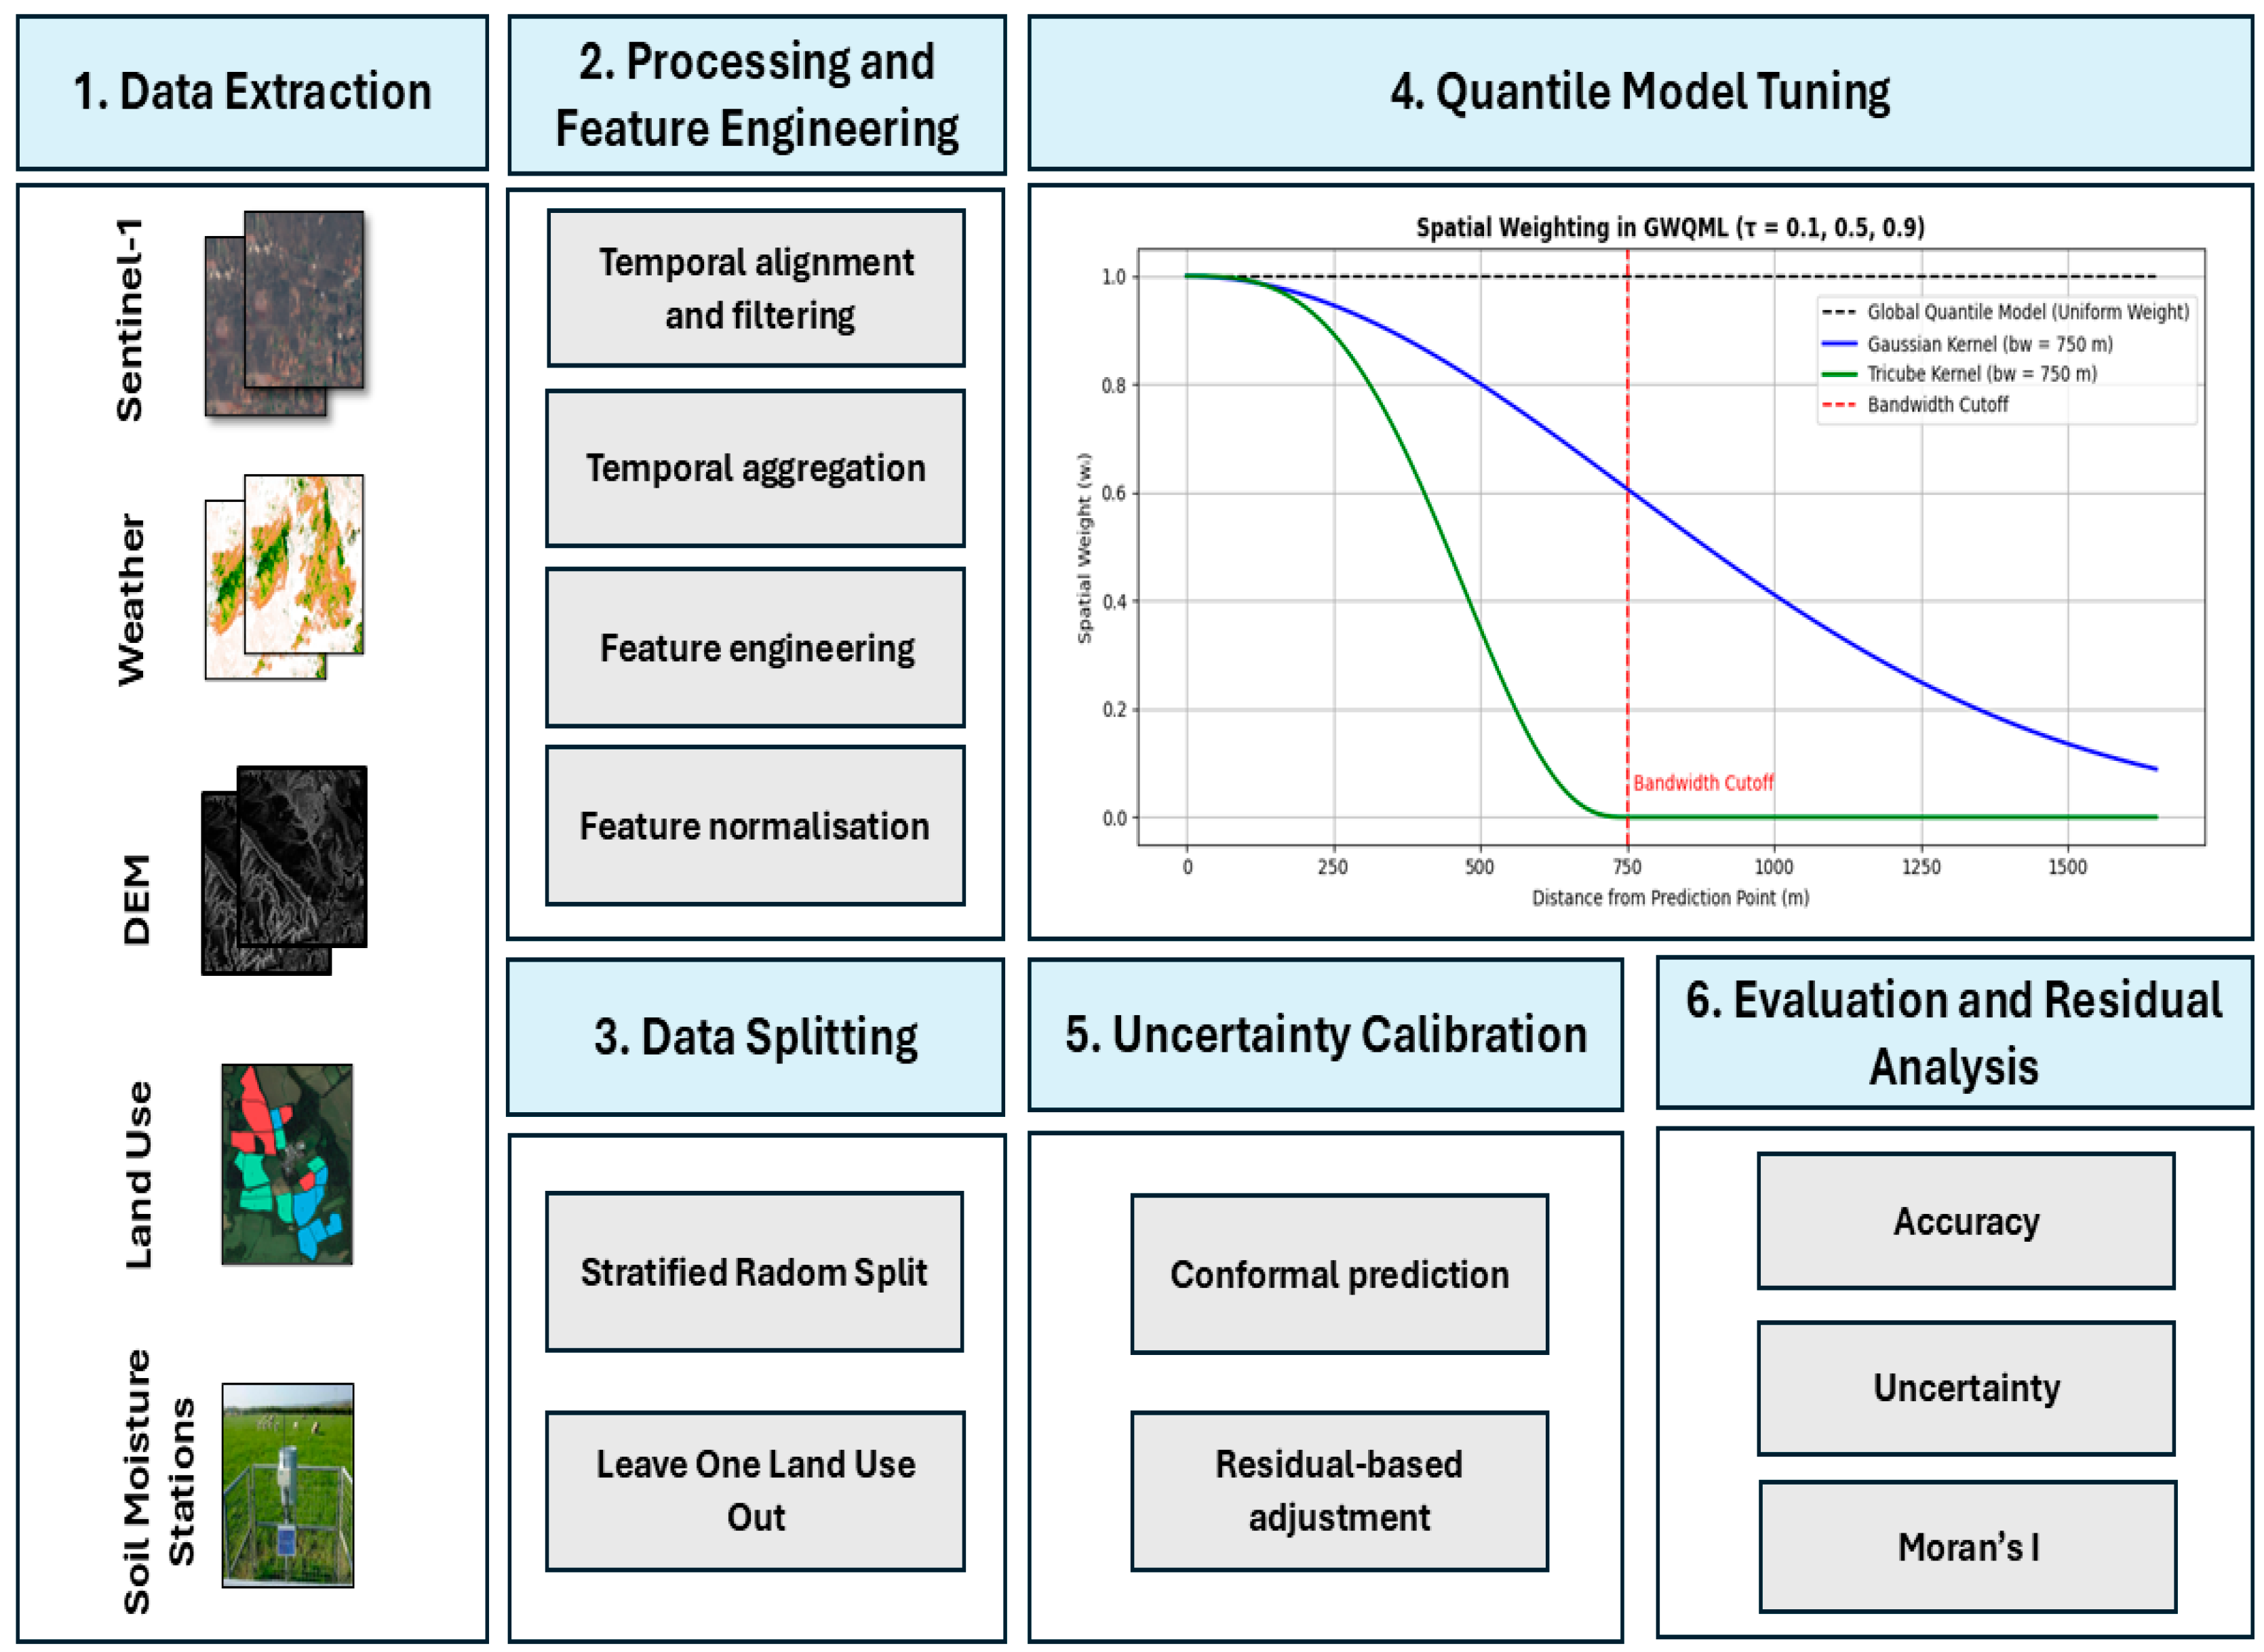
where y ^ 0.1 and y ^ 0.9 are the lower and upper quantile predictions, and ε l o and ε u p are the nonparametric offsets obtained from the empirical distribution of residuals in the calibration set. Model performance was assessed using two complementary validation schemes. In-sample performance was assessed using a stratified random split, maintaining land use proportions in the training and test sets. For model generalisation, we applied a Leave-One-Land-Use-Out (LOLUO) cross-validation strategy. In each fold, all samples from one of the six land use classes (PP, HSG, HSG-C, DRG, DRG-C, and wheat) was excluded entirely from model training and used only for testing. This allowed us to quantify the model’s ability to extrapolate to land use types not seen during training. The stratified random split provides an estimate of model accuracy under typical data distributions where all land use types are represented in both training and test sets. In contrast, the LOLUO scheme represents a more challenging test of generalisability, simulating the model’s predictive robustness when exposed to entirely unseen land use conditions. All validation experiments, including the stratified random split and the LOLUO strategy, were conducted under consistent kernel and bandwidth configurations. Each kernel type (Gaussian and Tricube) was evaluated independently across the five selected bandwidths. An overview of the full modelling workflow is presented in Figure 5. As the models were trained and evaluated exclusively at the sensor locations, and this study focuses on probabilistic point-level predictions rather than spatial interpolation across continuous surfaces.
To ensure consistency across data sources, all predictor variables were temporally matched at the daily scale. The input datasets included Sentinel-1 radar data (acquired on non-uniform observation dates), ERA5-Land meteorological re-analysis at hourly resolution, and SRTM terrain indices derived from static elevation data. These sources differ in their native temporal resolutions. To maintain consistency, only those dates for which all required variables were available across the 15 soil moisture stations were retained. This filtering ensured that each record used in model training corresponded to a complete and temporally aligned set of predictors. No temporal interpolation or imputation was applied in order to preserve data integrity.

2.5. Model Performance

Model performance was evaluated using both accuracy and uncertainty quantification metrics, computed separately for the in-sample and LOLUO validation schemes. Accuracy was assessed using the coefficient of determination (R2) and the root mean square error (RMSE), all computed on the predicted mean (τ = 0.5) quantile:
R 2 = 1   i = 1 n (   y i   y ~ i ) 2 i = 1 n (   y i   y ¯ ) 2
R M S E = 1 n i = 1 n (   y i y ~ i ) 2
where   y i denotes the observed SM, y ~ i the predicted median, and y ¯ the sample mean. To quantify the predictive uncertainty, we computed the Prediction Interval Coverage Probability (PICP) and the Mean Prediction Interval Width (MPIW) using the predicted lower and upper quantiles at τ = 0.1 and τ = 0.9, respectively. The PICP measures the proportion of true observations that fall within the predicted interval. It is defined as
P I C P = 1 n   i = 1 n 1   [ y i ^ 0.1         y i     y i ^ 0.9   ]
where n is the number of test samples, y i is the observed SM for sample i , and y i ^ 0.1 and y i ^ 0.9 are the predicted 10th and 90th quantiles of SM and 1[.] is the indicator returning 1 if the condition is satisfied and 0 otherwise. The MPIW quantifies the average width of the predicted uncertainty intervals for SM and defined as
M I P W = 1 n   i = 1 n ( y i ^ 0.9 y i ^ 0.1 )  
where the difference y i ^ 0.9   y i ^ 0.1 represents the predictive interval width for sample i . In the context of soil quantile modelling, a high PICP value close to the nominal level (e.g., 0.8 for an 80% interval) indicates well-calibrated predictive intervals, meaning the model appropriately accounts for uncertainty. At the same time, a narrow MPIW suggests sharper, more informative estimates. Together, PICP and MPIW represent a reliable assessment of the model’s ability to represent uncertainty in SM predictions and balance coverage and interval width.

2.6. Spatial Autocorrelation Analysis

To assess whether the residuals of the SM predictions showed latent spatial structure, we computed Moran’s I statistic for each model configuration. Moran’s I is a global measure of spatial autocorrelation that quantifies the degree of similarity between data (in this case, residuals) at geographically proximate locations [53]. Residuals were calculated as the difference between the observed and predicted median values using in-sample test predictions. Spatial weights were encoded using a fixed-distance threshold of 0.01 decimal degrees applied to the coordinates of the 15 SM stations. A binary and symmetric spatial weights matrix W was constructed, in which w i j entries were set to 1 if locations i and j lay within the defined threshold distance and 0 otherwise. Moran’s I was then computed as
I = n i = 1 n j = 1 n w i j ·     i = 1 n j = 1 n w i j ( r i r ¯ ) ( r j r ¯ ) i = 1 n ( r i r ¯ ) 2
where n is the number of spatial units, r i is the residual at location i , r ¯ is mean of all residuals, and w i j is the element of the spatial weight matrix representing the spatial relationships between observations i and j . A residual spatial autocorrelation analysis is recommended in any GW-based analysis [54,55].

3. Results

3.1. Feature Correlation Analysis

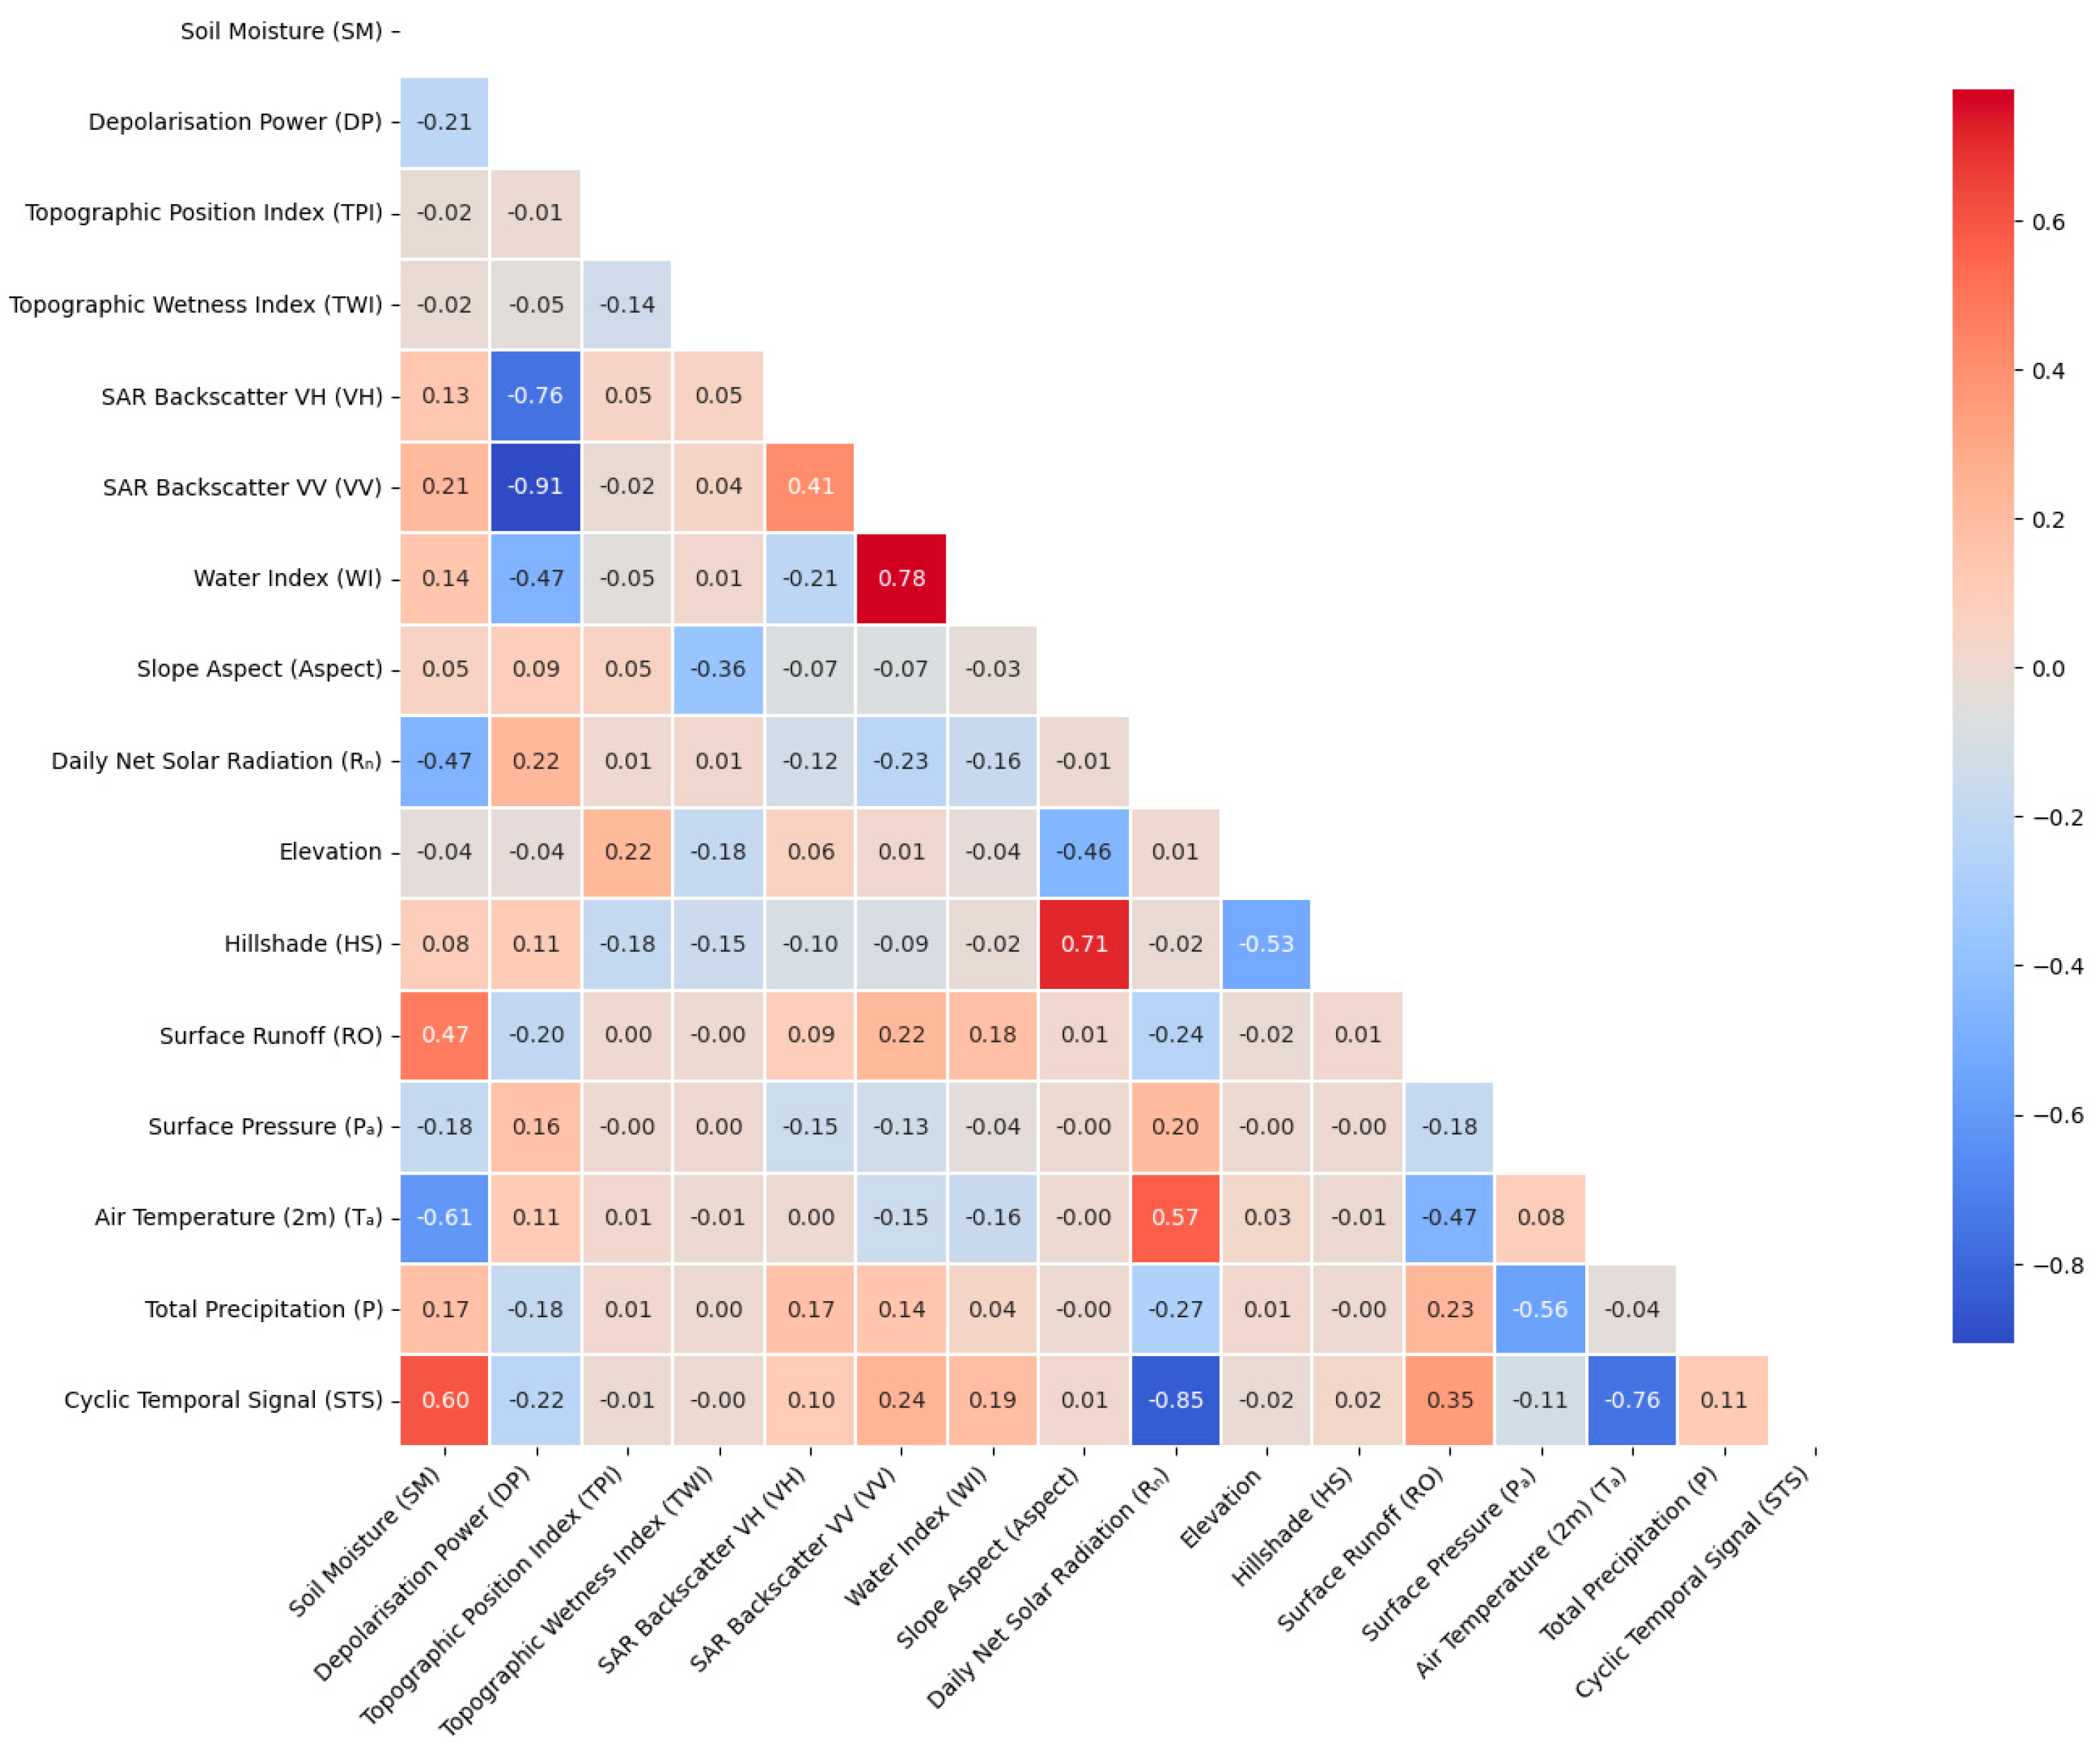
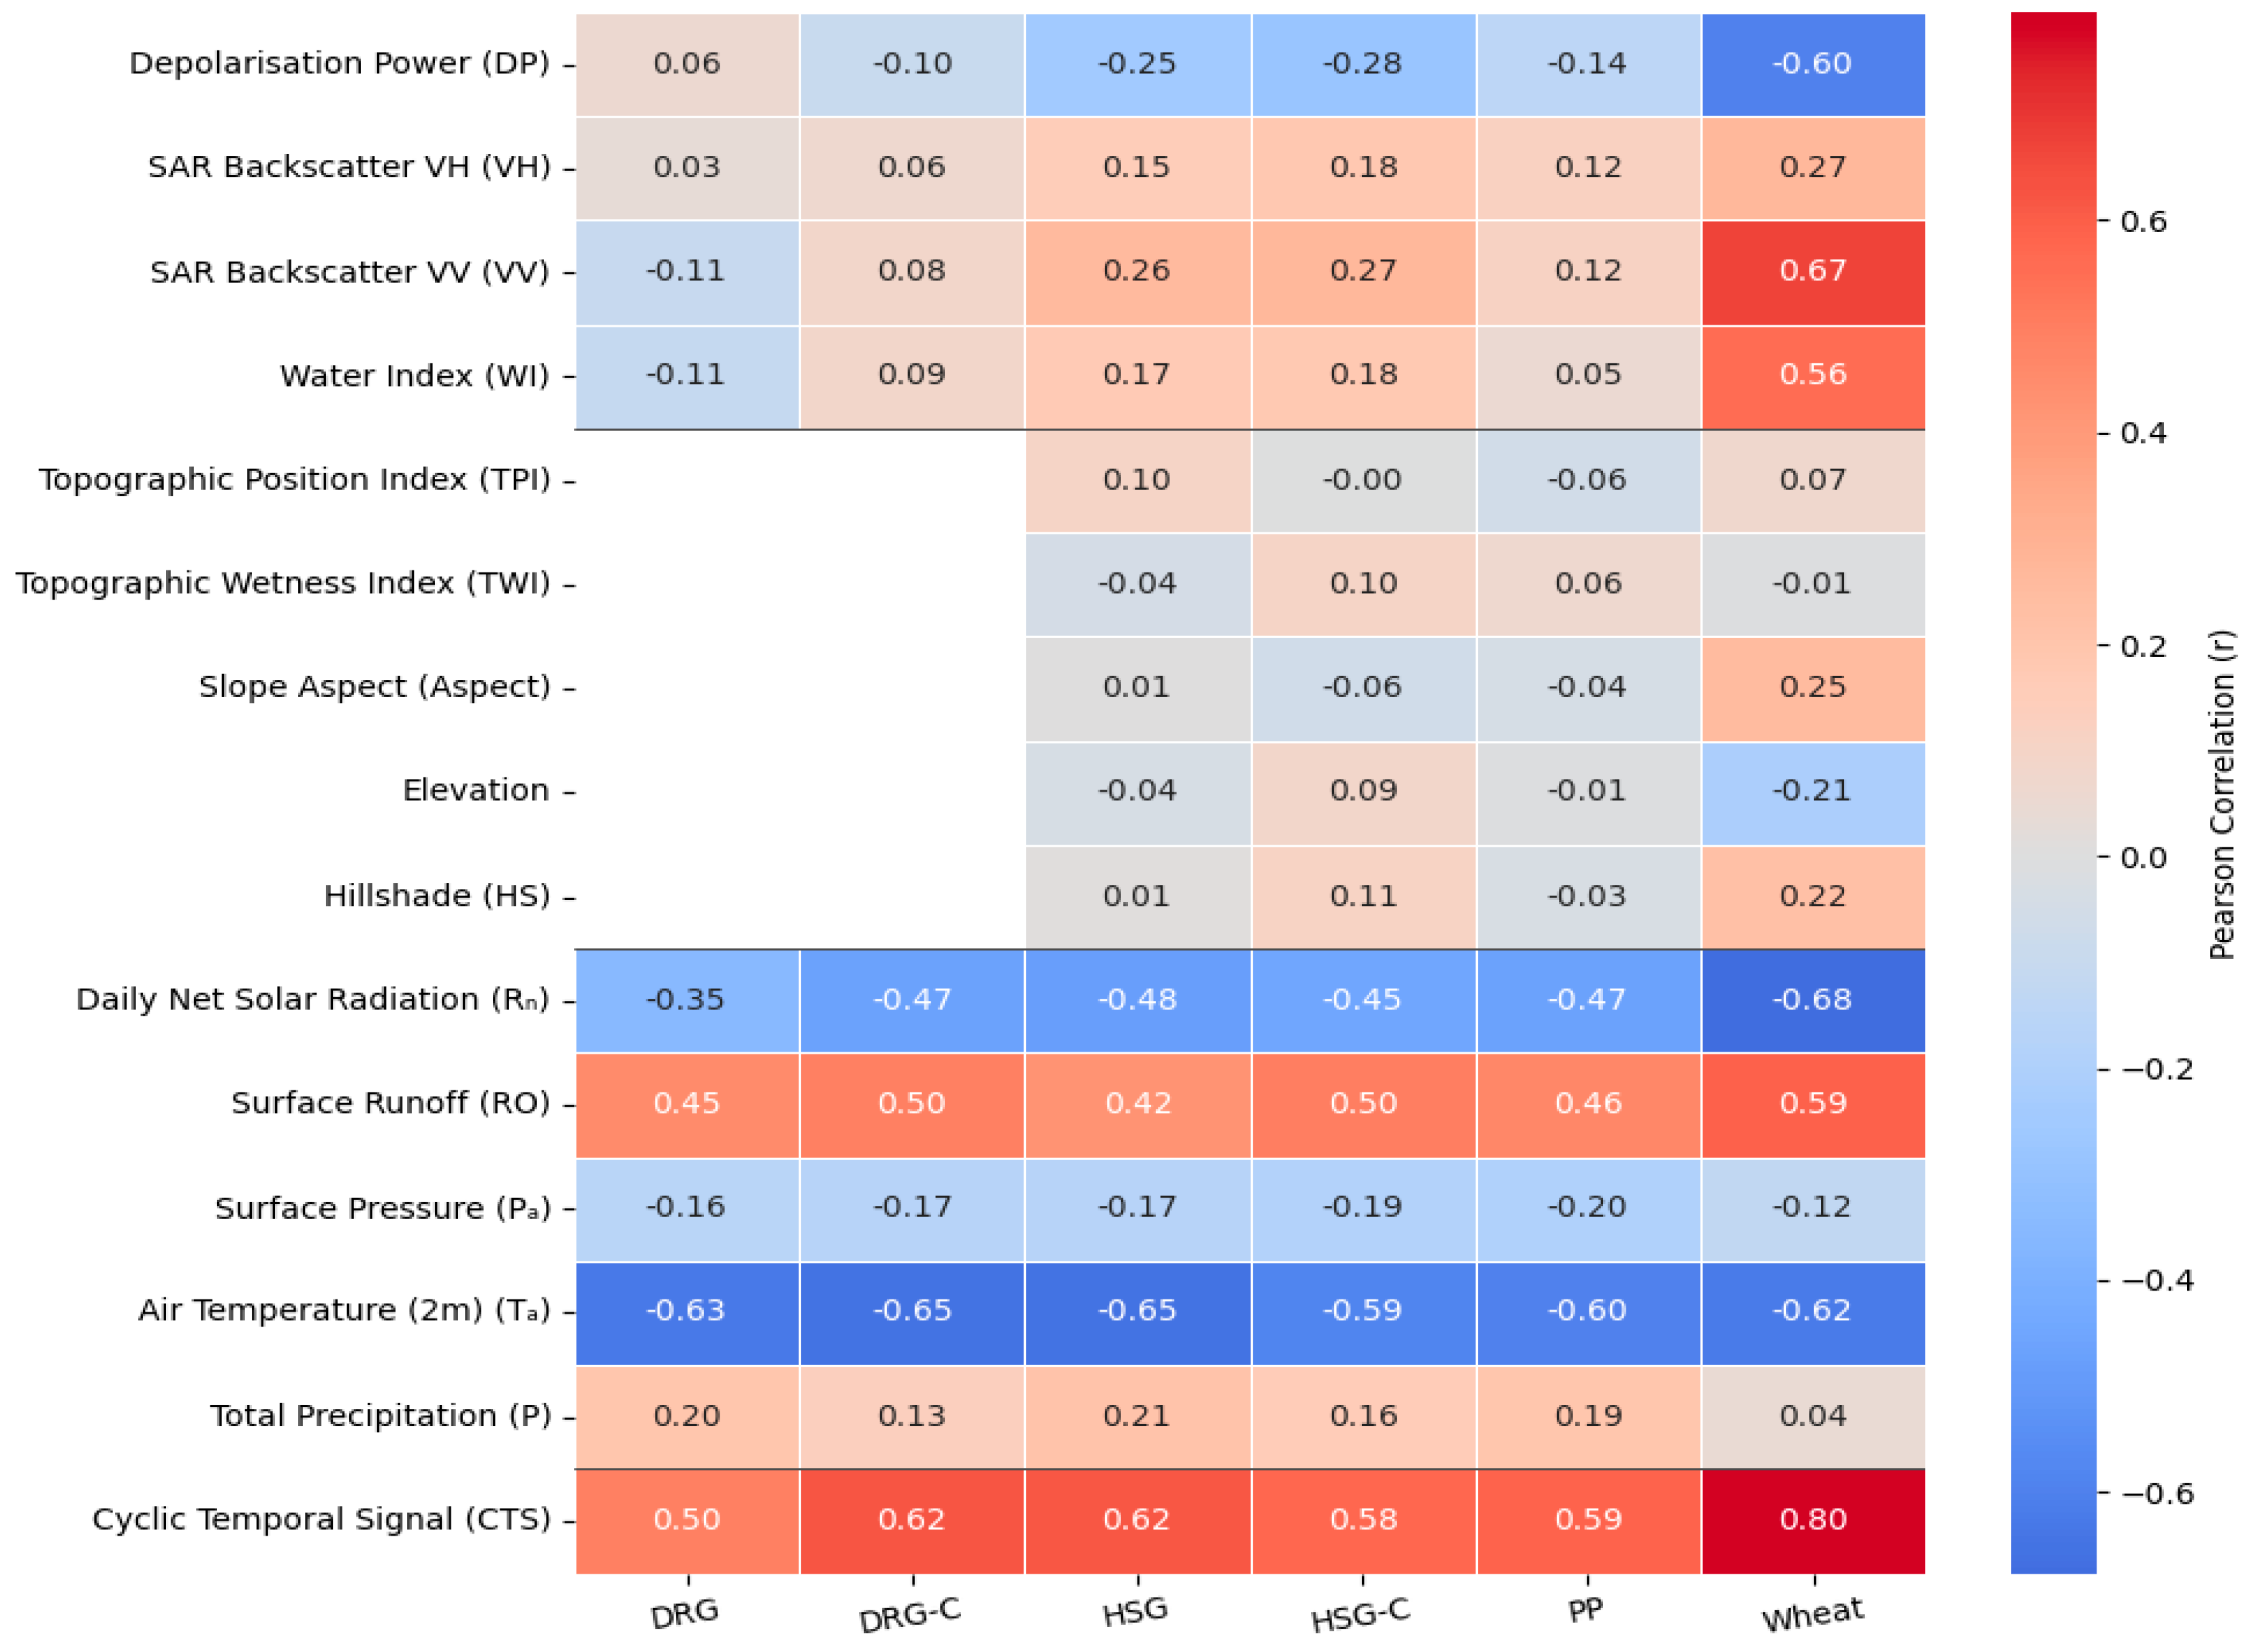
The relationship between environmental predictors and daily SM was assessed using stratified Pearson correlation coefficients (r) across the six land use systems (Figure 6). The CTS showed the strongest positive correlation with SM across all systems, ranging from coefficients of 0.5 in the DRG land use to 0.8 in the wheat land use. Surface runoff (RO) also displayed consistently positive correlations with coefficients between 0.42 and 0.59. Air temperature was negatively correlated with SM in all land uses with coefficients ranging between −0.59 and −0.65. Among the radar-based features, the Water Index (WI) and VV backscatter demonstrated positive correlations with SM, particularly in HSG, HSG-C and wheat systems. Maximum correlations reached 0.56 for WI and 0.67 for VV in wheat. Depolarisation Power (DP) showed variable correlations with SM across land use types, ranging from a weak positive association in DRG (r = 0.06) to a strong negative correlation in wheat (r = −0.6). Topographic features such as TWI, TPI, slope aspect, and elevation showed weak correlations with SM, generally with an absolute value below 0.25 across all land uses. Correlation values are not reported for topographic predictors in DRG and DRG-C systems as these land uses were present only in one catchment each (Figure 2). A detailed correlation matrix is included in Appendix B (Figure A1).

3.2. Model Evaluation and Bandwidth Analysis

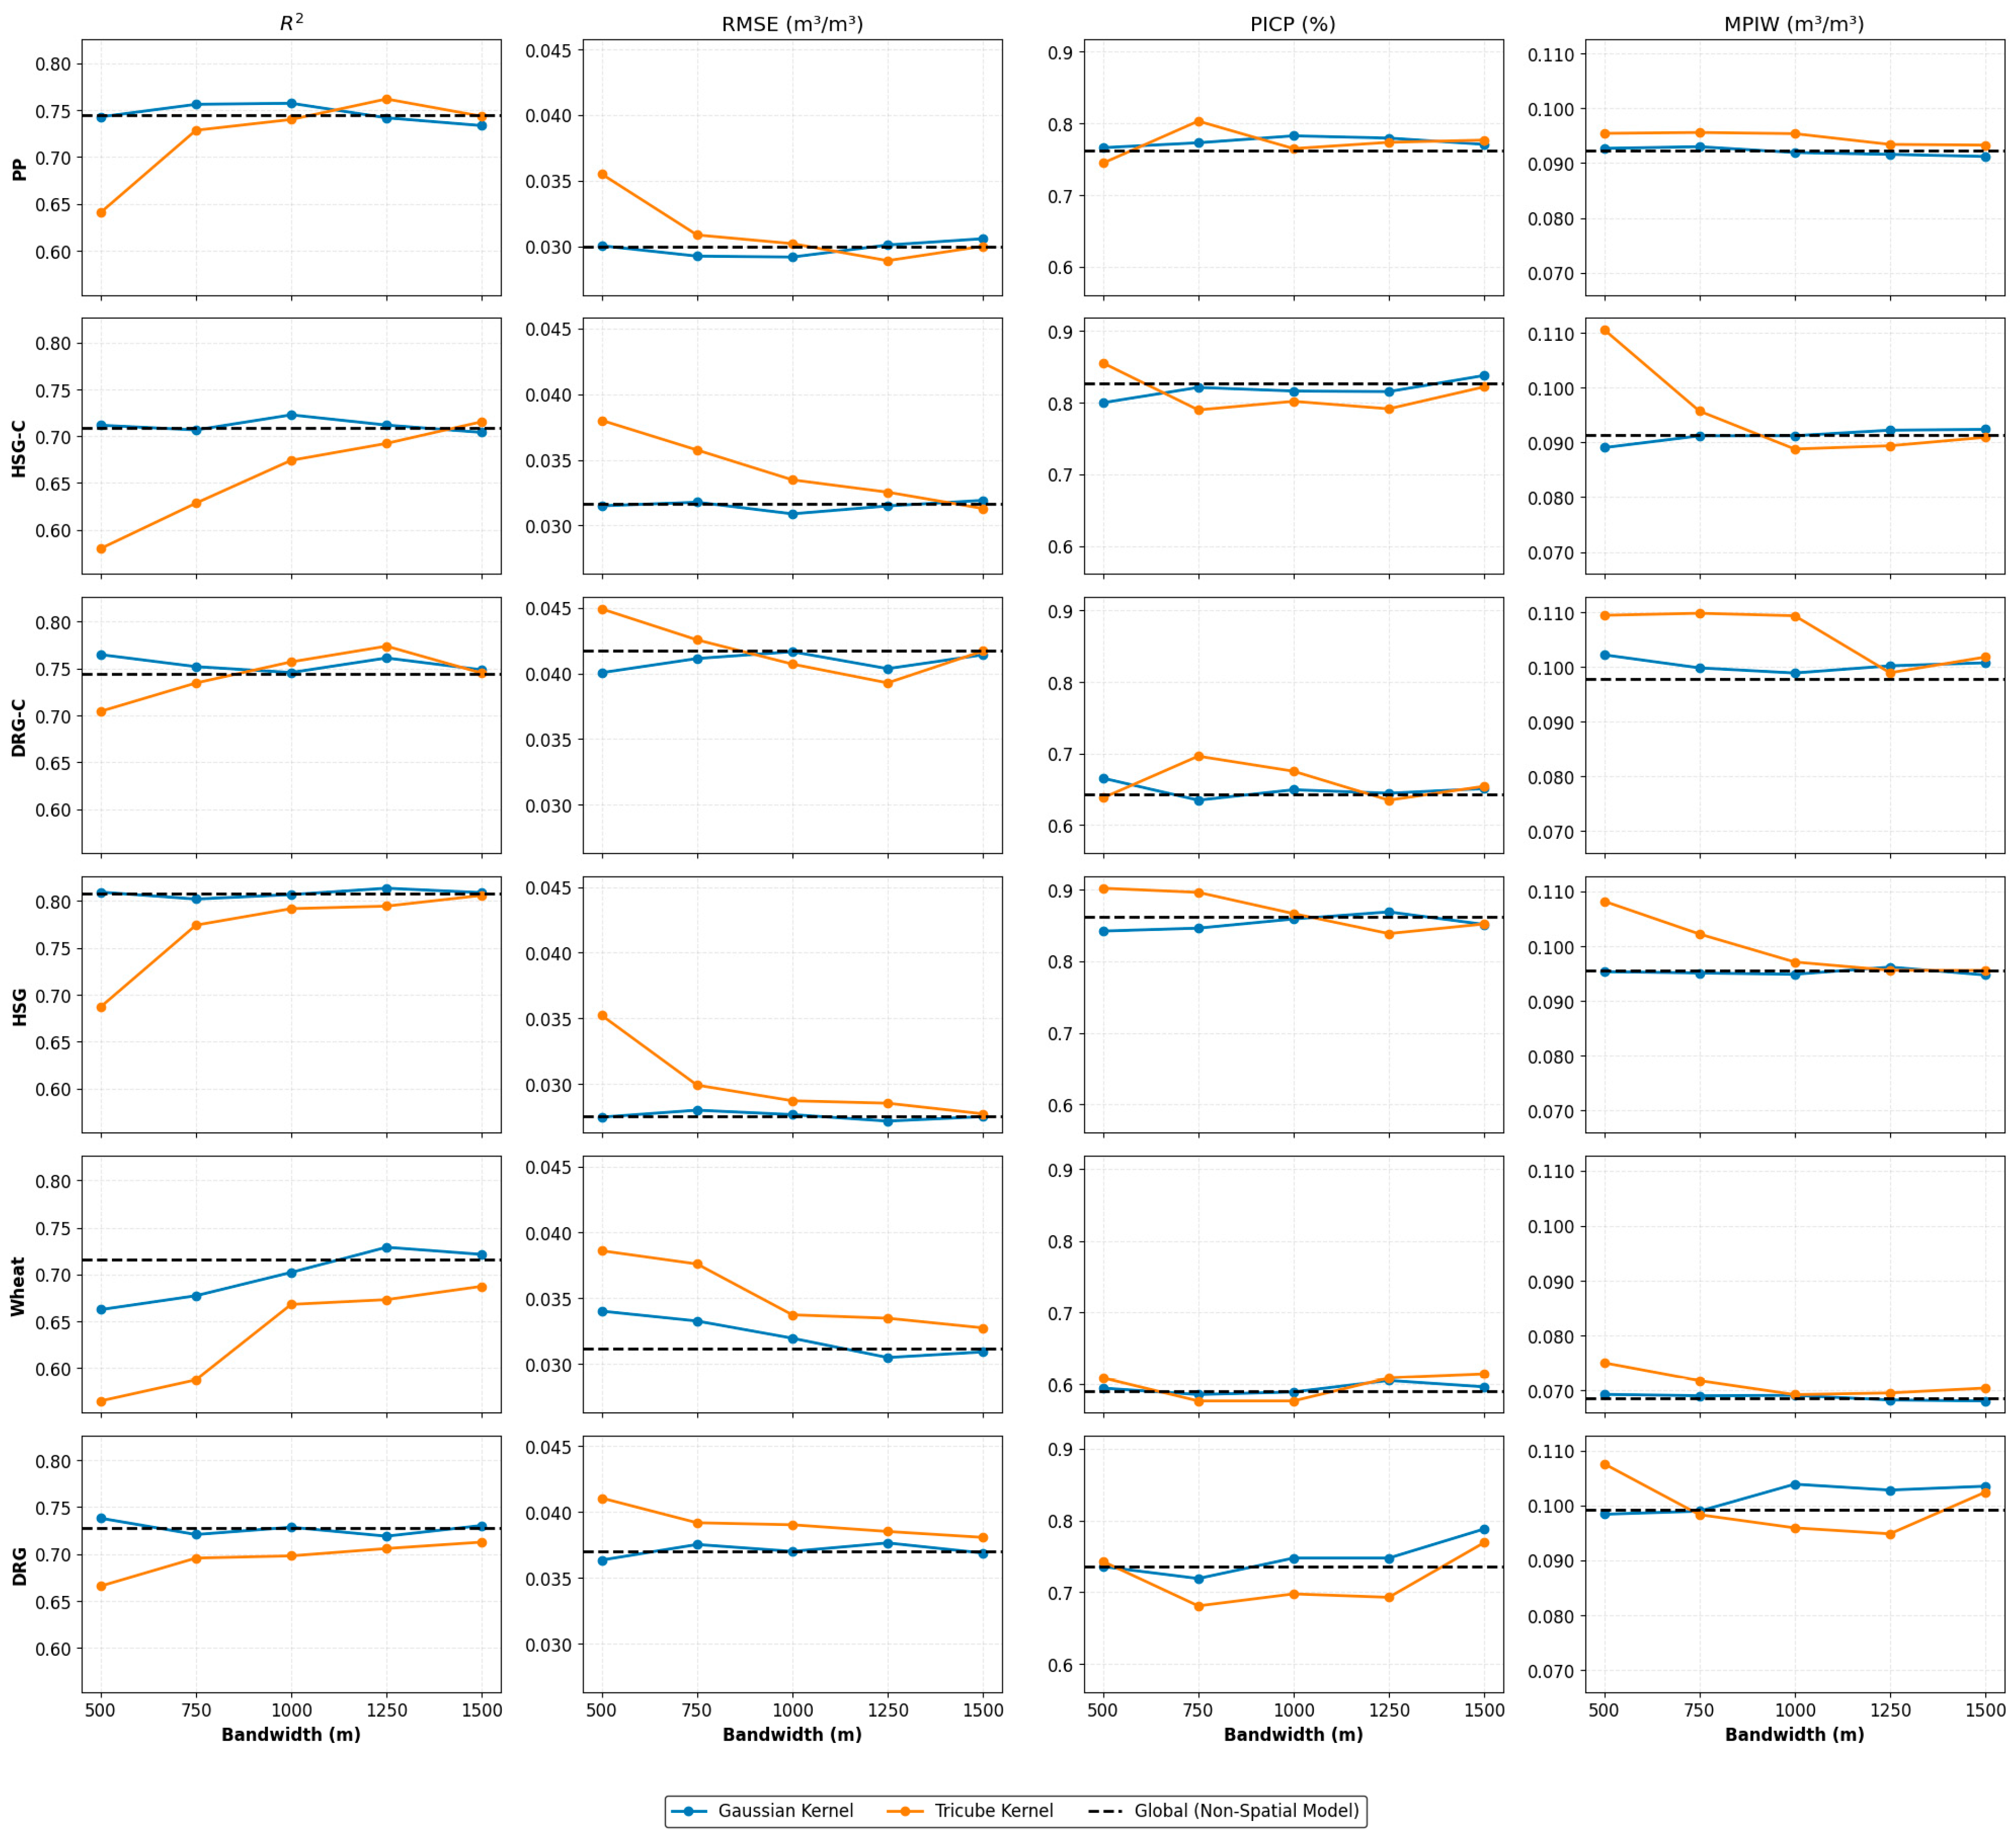
In-sample performance of the global model (QML) and the local, GW model (GWQML) was evaluated across the six land uses. Results are summarised in Figure 7. Accuracy metrics are based on the median prediction (τ = 0.5), while uncertainty metrics use the 80% interval between the τ = 0.1 and τ = 0.9 quantiles, as described in Section 2.4. Across all systems, GWQMLs outperformed the global baseline in terms of R2 and RMSE. In the DRG system, GWQML using a Gaussian kernel achieved a maximum of R2 of 0.81 and a minimum RMSE of 0.0306 m3/m3. Similarly, in the DRG-C system, the highest R2 was obtained using the Tricube kernel (0.82), with a corresponding RMSE OF 0.0322 m3/m3. In the HSG system, the Gaussian kernel led to the highest observed R2 of 0.85, with a minimum RMSE of 0.0241 m3/m3. Across all systems, the global model performed consistently poorer to the GWQML configurations—both in terms of explained variance and the prediction errors.
Prediction interval coverage probabilities (PICP) were consistently higher (and thus better) for the GWQML models compared to the global baselines. The highest PICP was recorded for the HSG system with GWQML under a Gaussian kernel at 750 m (PICP of 0.9), followed by the DRG (0.88 at 1500 m) and DRG-C systems (0.87 at 1500 m) under the same kernel. While the GWQMLs provided broader coverage, spatial weighting did not consistently enhance prediction sharpness with lower MPIW in wheat and HSG under the global model. Model performance was sensitive to the choice of bandwidth. At low bandwidths (e.g., 500 m), both predictive accuracy and interval coverage declined, likely due to sparse spatial support. At high bandwidths (e.g., 1500 m), GWQML performance resembled the global model. The best-performing GWQML configurations were typically at intermediate bandwidths (750–1250 m).
To evaluate generalisation to unseen land use systems, model performance was assessed using a LOLUO strategy. In each fold, one of the six land use classes was excluded from training and used exclusively for testing. Results are shown in Figure 8 (τ = 0.5 for accuracy metrics, τ = 0.1–0.9 for 80% uncertainty intervals). The GWQML model consistently provided higher performance compared to the global baseline model across all held-out systems. Among the six land uses, HSG was the most predictable when excluded from training with a maximum R2 of 0.81 and a minimum RMSE of 0.0272 m3/m3 (Gaussian kernel, 1250 m bandwidth). Permanent pasture (PP) and DRG-C also showed relatively strong generalisation performance, with R2 values of 0.76 and 0.77 and RMSE values below 0.033 m3/m3. These land uses appear to be well represented by information learned from the remaining land uses. In contrast, lower out-of-sample performance was observed when DRG and wheat were held out, with maximum R2 values of 0.74 and 0.71, respectively. In terms of prediction uncertainty, PICP values ranged from 0.63 to 0.87, with highest interval coverage observed in HSG, HSG-C, and PP. These values suggest that the GWQML model was well calibrated in those systems, closely matching the nominal 80% coverage level. However, the lower PICP scores in DRG (0.67) and wheat (0.63) indicate under-coverage and less reliable uncertainty estimates in these cases. Across both kernel types, the most reliable generalisation performances were generally attained at intermediate bandwidths (1000–1250 m).

3.3. Spatial Autocorrelation of Residuals

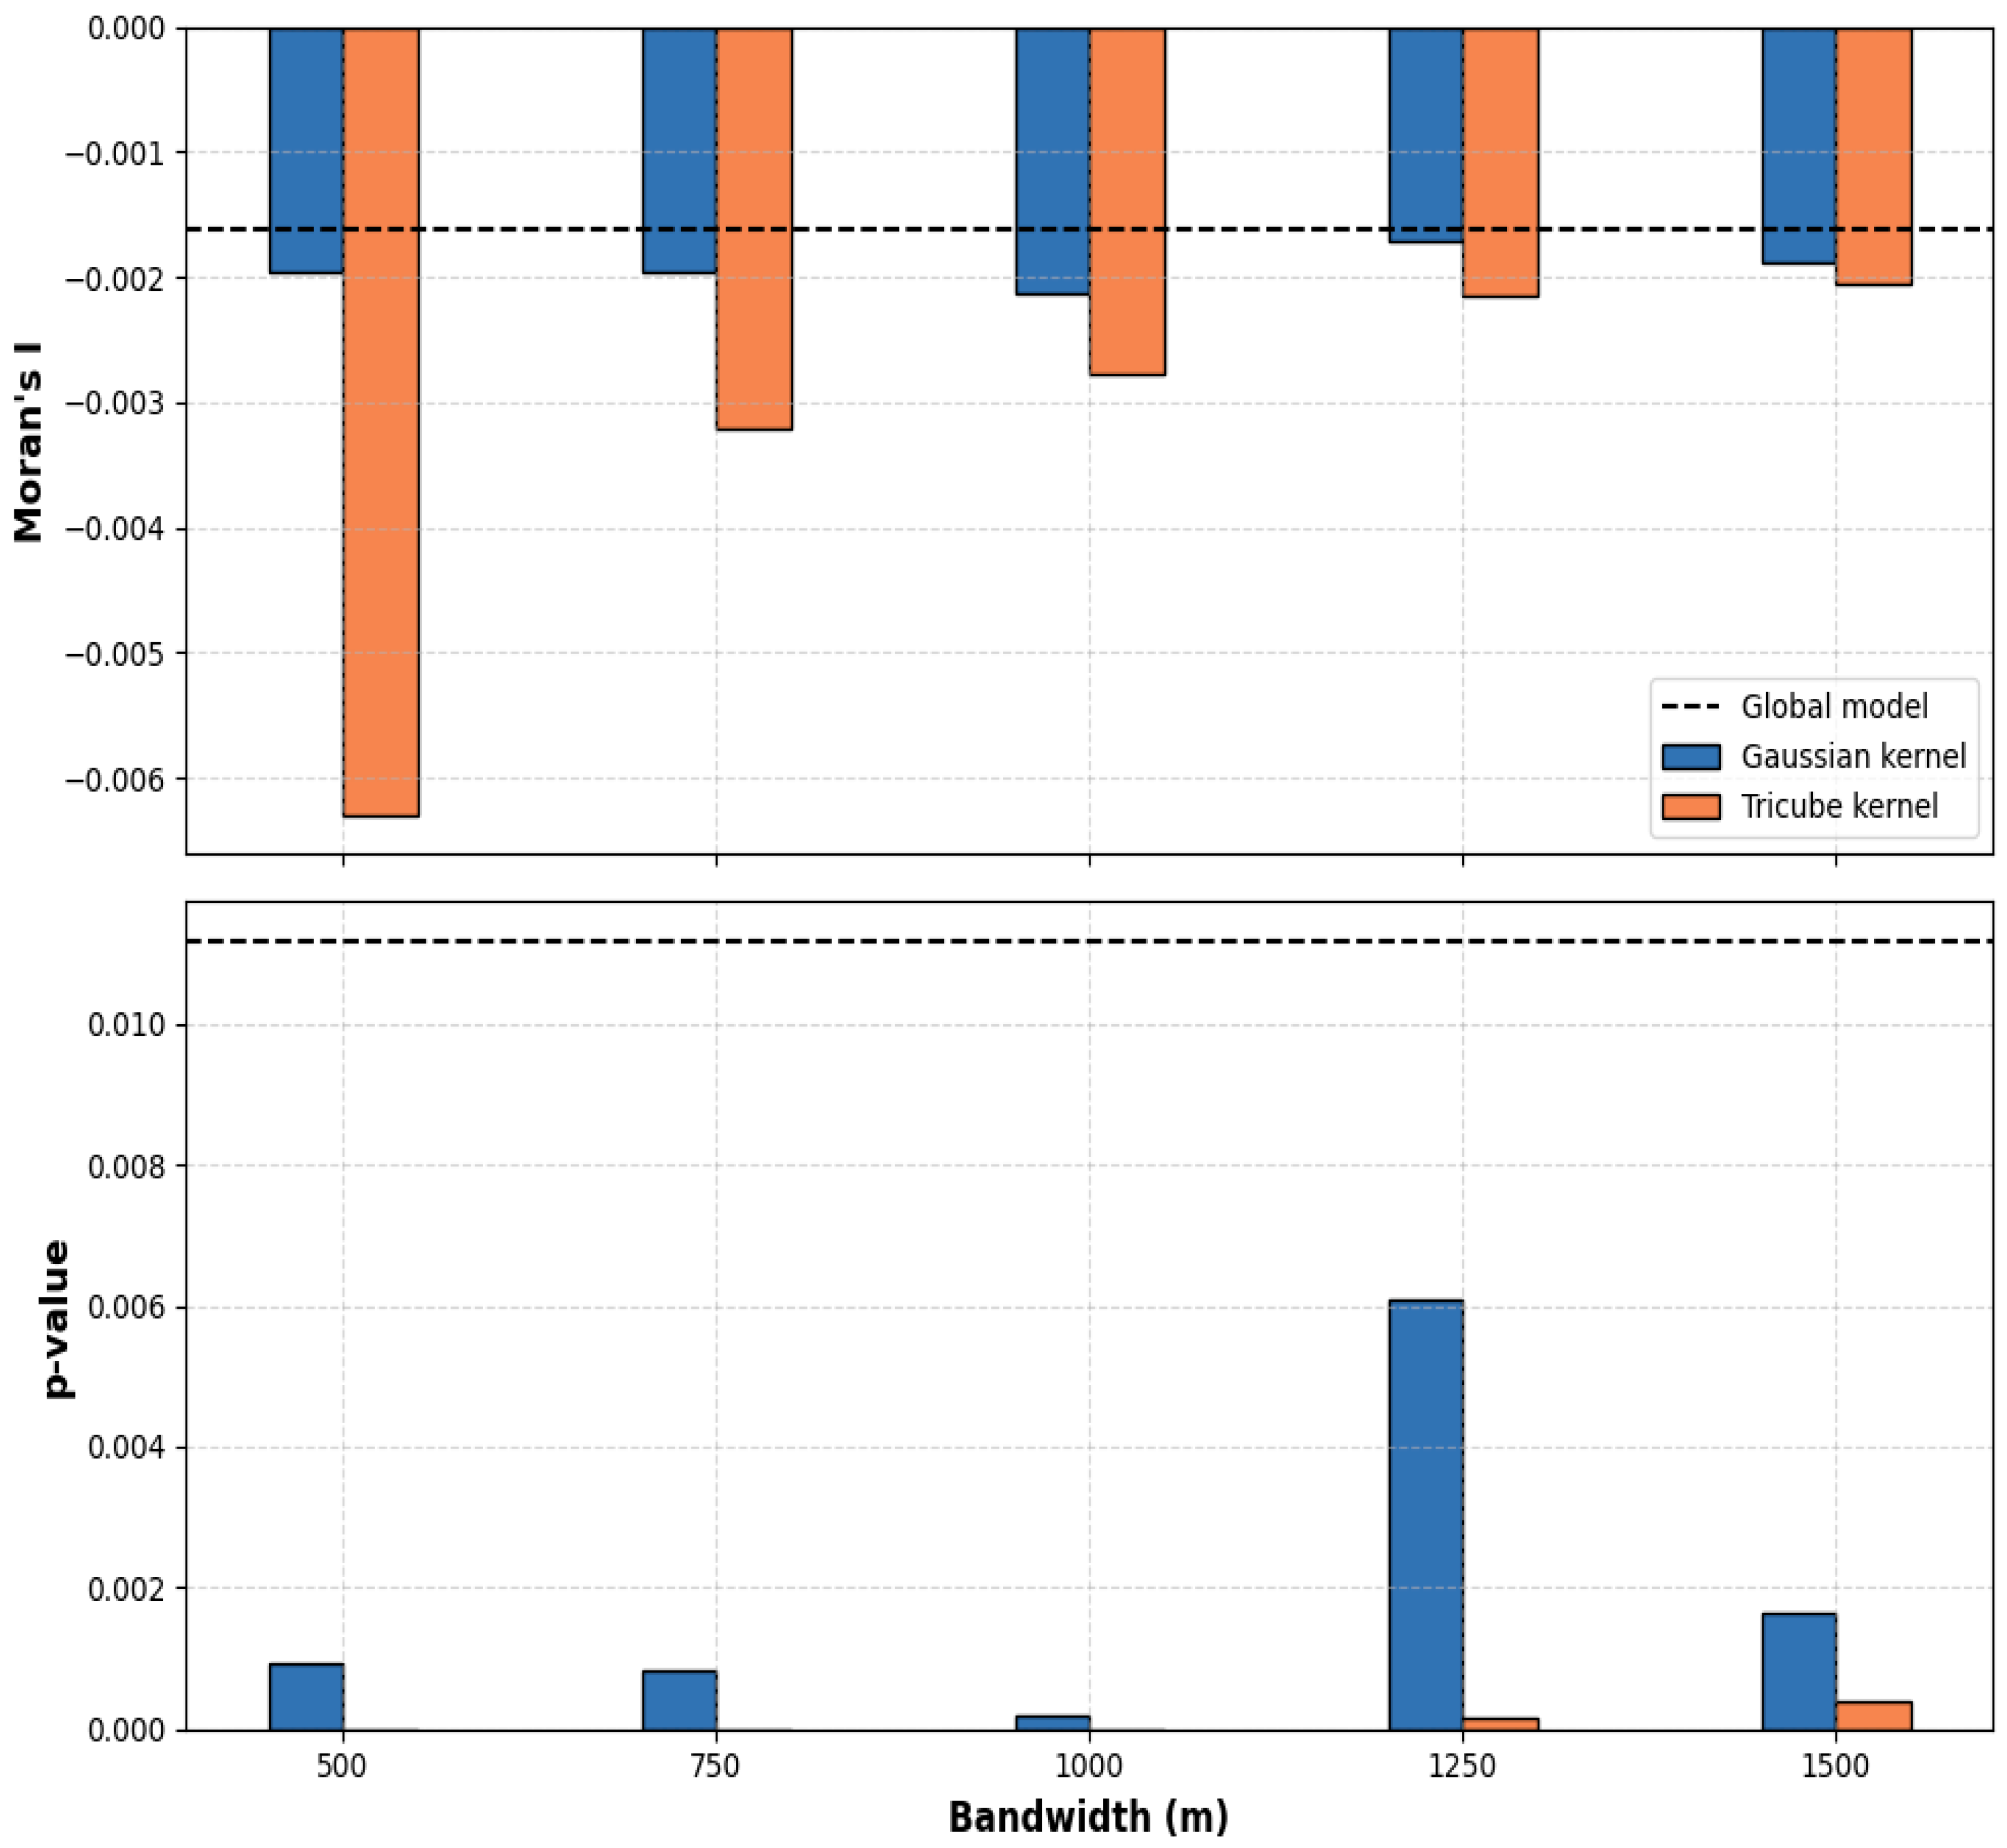
The spatial dependence of model residuals was assessed using the Moran’s I statistic across bandwidths for GWQMLs using Gaussian and Tricube kernels (Figure 9). In all cases, residuals displayed significant negative spatial autocorrelation, confirming the absence of spatial clustering. For both kernels. Moran’s I values tended to decrease (i.e., become more negative) as the bandwidth decreased, particularly for the Tricube kernel at 500 m (Moran’s I of 0.0063 and p < 0.001). This indicates a stronger decorrelation of residuals at narrower spatial contexts. However, at wider bandwidths (e.g., 1250–1500 m), Moran’s I values converged toward the global model reference line. Corresponding p-values aligned with these trends, showing highly significant spatial independence for all Tricube configurations (p < 0.001) and most Gaussian ones, except at 1250 (p = 0.006). Compared to the global model, which retained moderate spatial autocorrelation (p = 0.011), spatial weighting in GWQML clearly reduced residual spatial dependence in smaller to intermediate bandwidths.

4. Discussion

4.1. Bandwidth Sensitivity and Kernel Effect in Geographically Weighted Quantile Models

This study evaluated the performance of a GW Quantile Machine Learning framework for probabilistic SM estimation at the NWFP, focusing on performance trends across different land use systems, kernel types, and spatial bandwidths. The results highlight key implications for when spatial weighting benefit SM prediction and where its core assumptions may not hold. Across all evaluated pasture systems, GWQML consistently outperformed the global non-spatial baseline model, achieving R2 values up to 0.84 and PICPs nearing 0.8. These improvements confirm the importance of capturing spatial heterogeneity in SM processes, particularly in pasture systems where predictor–response relationships remained spatially consistent (Figure 6). Similar patterns of spatial variability in SM have been reported in sloped agroecosystems by Zhang et al. [56] who found that vegetation cover, topographic position, and soil physical properties jointly influence SM distribution across forest, terraced, and ridge-tilled systems. This highlights the importance of considering land use and terrain-driven hydrological dynamics in spatial modelling approaches. In pasture systems, such as HSG, where vegetation is perennial and management is relatively stable, the spatial weighting mechanism of GWQML effectively captured local relationships between predictors and SM, leading to more accurate and better-calibrated predictions. Although LightGBM is typically regarded as a black-box algorithm, the GWQML framework introduces a degree of interpretability through its kernel-based weighting structure, which explicitly quantifies how the influence of observations decays with spatial distance. This spatial weighting mechanism clarifies localised predictive relationships, a property absent in conventional, global machine learning models. Performance trends across bandwidths revealed that intermediate spatial scales, specifically between 750 and 1250 m, produced the best balance between local adaptivity and data support. These scales align with the 75th percentile of pairwise distance between SM stations (i.e., 813 m) and remain within the maximum observed distance across the platform (i.e., 1538 m). This range captures a significant portion of spatial structure at the NWFP while remaining narrow enough to preserve local information. At these scales, the model appears to include enough nearby observations to stabilise local learning without overly smoothing. This balance is essential in GW models, where bandwidth selection governs the trade-off between capturing local variation and maintaining model robustness [57]. At smaller bandwidths (<750 m), performance declined, particularly with the Tricube kernel. This is attributed to the Tricube kernel’s finite support, which excludes all training points beyond the specified bandwidth. In spatially fragmented systems or where monitoring stations are sparsely distributed, this leads to under-sampling and high-variance model behaviour [58,59]. The Gaussian kernel, which has an infinite support, retained performance even at smaller bandwidths by assigning low weights to more distant observations. This distinction aligns with the theoretical expectations in spatial statistics, as shown by Alberto et al. [60], who demonstrated that Gaussian kernels maintain robust generalisation at small bandwidths due to their smooth decay and infinite support. As a result, under narrow bandwidths and limited local sample support, particularly with the Tricube kernel, GWQML occasionally showed a lower predictive accuracy than the global QML model due to increased variance.
Performances at larger bandwidths (>1250 m) also declined, though the mechanisms differ. While larger bandwidths include more training data and often improve uncertainty coverage, they risk over smoothing. In our results, this trend was particularly evident with the Gaussian kernel, where wider bandwidths caused the model to converge towards the global behaviour, thereby diminishing the benefits of spatial adaptivity. This is consistent with previous findings by [61,62] who showed that higher bandwidths in GW regressions lead to coefficient estimates increasingly similar to those of global regression, with spatial patterns appearing smooth across geographic space. Although PICP values remained high at high scales, the explained variance declined. This suggests that the model compensated for increased uncertainty by producing broader intervals. This trade-off reflects the differing behaviour of coverage and accuracy under kernel smoothing. Sun et al. [63] showed that bandwidths which optimise prediction interval coverage do not coincide with those minimizing interval width, as the former favour variance reduction while the latter are more sensitive to bias. These opposing objectives imply that interval reliability and sharpness cannot be simultaneously optimised by a single bandwidth choice.

4.2. Generalisation Across Land Use Systems

To evaluate the capacity of the GWQML framework to generalise across ecologically distinct systems, a LOLUO cross-validation strategy was implemented. This approach tests the model’s ability to make reliable SM predictions for a land use system that is entirely excluded during training. When HSG and PP land uses were held out, GWQML achieved the highest generalisation performance across all evaluated systems. HSG produced an out-of-sample R2 of 0.79 and PICP of 0.86, while PP achieved an R2 and PICP of 0.74 and 0.77, respectively. This comparatively high out-of-sample performance may be attributed to two key factors. First, the distributions of predictor variables in HSG and PP likely fell within the multivariate range covered by the training data, allowing the model to operate within a familiar domain. This reduced the need for extrapolation, a scenario where prediction accuracy typically deteriorates. Sugiyama et al. [64] demonstrated that when test inputs deviate substantially from the training distribution, model performance tends to decline even if the underlying learning algorithm remains unchanged. Second, the functional relationships between predictors and SM in these systems may have been broadly consistent with those characterising the other land uses. This facilitated the model’s ability to transfer learned patterns across domains. Fang et al. [65] showed that in hydrological settings, successful generalisation depends not only on input similarity, but also on the stability of the predictor–response relationship across spatial units. The comparatively weaker generalisation to clover-mixed systems (HSG-C and DRG-C) highlights limitations in the model’s capacity to extrapolate across differences in vegetation composition. Although both systems share management similarities with their non-clover counterparts, their mixed-species composition introduces biophysical variability not accounted for in the model. Clover inclusion can influence water use efficiency [66], soil [67], and canopy structures [68], factors known to alter the relationships between SM and radar backscatter [69,70]. Yet, the GWQML framework used relies exclusively on continuous remotely sensed and meteorological predictors, with no input representing botanical composition or sward functional traits. As such, the model implicitly assumes that spatial proximity correlates with ecological similarity.
The wheat system showed the lowest generalisation performance, confirming that models trained on pasture-based systems do not reliably transfer to annual arable fields. Unlike perennial pastures, arable systems such as wheat undergo seasonal tillage, sowing, and harvesting, which dynamically alter surface roughness and canopy structure, thereby modulating radar backscatter. As demonstrated by Alemohammad et al. [71], the structural configuration of vegetation plays a significant role in shaping scattering mechanisms, with vertically aligned cereal crops often enhancing double-bounce returns while suppressing random volume scattering. Moreover, this domain shift in biophysical and management characteristics is further compounded by limited model transferability, as shown in tree crop systems where conventional classifiers failed to generalise across heterogeneous planting patterns and field sizes [72]. Such findings highlight the critical need for spatially and contextually informed models that can adapt to varying crop morphologies and landscape configurations.

4.3. Limitations and Future Directions

This study demonstrates that GWQML improves the prediction of SM in spatially heterogeneous agricultural systems. The approach successfully combines spatial weighting with quantile-based uncertainty estimation. A key strength of the method lies in its localised modelling of spatial variation, which helped improve calibration in several land use systems. However, the current implementation can be refined to enhance its broader applicability. First, spatial weighting was based solely on geographic proximity, assuming that neighbouring locations share similar soil–vegetation–climate conditions. This assumption may not hold in heterogeneous landscapes, such as those at the NWFP where abrupt changes in land use or management occur across short distances. More refined weighting functions that incorporate land use similarity or vegetation characteristics alongside spatial distance could better reflect spatial structure, as shown by Comber et al. [54], who integrated land cover and spatial metrics in local models to improve land cover classification. Second, the model relied entirely on continuous variables derived from radar, topography, and re-analysis data. These variables capture large-scale environmental gradients but do not include categorical attributes such as vegetation type or land management regime, which can shape the relationship between remote sensing signals and SM. Research by Wigneron et al. [73] demonstrated that plant functional traits can significantly affect microwave signal responses, highlighting the need to represent these aspects in predictive models. Third, the inclusion of time-sensitive variables such as vegetation indices from optical satellites (e.g., Landsat, Sentinel-2) could strengthen the model’s ability to track temporal dynamics. Shafian and Maas [74] developed a Perpendicular SM Index (PSMI) using raw Landsat reflectance values and showed that it closely matched field-measured SM (R2 = 0.79) in semi-arid croplands. Their findings support the use of multispectral indicators for SM prediction at the field and regional scale. Moreover, using simulation outputs from crop models like AquaCrop [75] or WOFOST [76] to derive biophysically meaningful features may improve generalisation by providing detailed information about soil water fluxes and crop status over time. Future work could explore the integration of feature attribution methods to enhance the interpretability of the models. While our GWQML framework inherently supports spatially and quantile-varying feature importance, presenting such results in a clear and concise manner would require dedicated methodological treatment and visualisation space. As this lies outside the scope of the current study, we recommend it as a promising avenue for future research on interpretable and locally adaptive machine learning in environmental applications. Another limitation of this study is that it does not explicitly incorporate direct information on farming practices (e.g., grazing intensity, mowing, and fertilisation schedules), which can strongly modulate soil moisture dynamics at the field scale. These management activities alter vegetation structure, soil compaction, and evapotranspiration rates, thereby influencing the relationship between remote sensing signals and in situ soil moisture. While the current model indirectly captures some of these effects through radar backscatter and meteorological variables, explicitly incorporating management data or proxies could reduce unexplained variability and improve model generalisation. Integrating farm-level management records or remote sensing-derived indicators of land use intensity would therefore be a valuable extension for future applications. Addressing these methodological gaps would help advance the robustness and transferability of GWQML in support of SM monitoring across dynamic agroecosystems.

5. Conclusions

This study introduced a Geographically Weighted Quantile Machine Learning (GWQML) framework for daily soil moisture prediction across a complex agricultural landscape. The framework delivered improved predictive accuracy and well-calibrated uncertainty intervals. These benefits were most pronounced in perennial pasture systems with stable vegetation conditions, where spatial weighting enhanced the effectiveness of quantile-based estimation. The model consistently outperformed a non-spatial baseline, confirming the advantage of incorporating local spatial structure when modelling environmental variables with known heterogeneity. Performance varied notably across the six evaluated land use systems. The strongest results were achieved in the high-sugar grass (HSG) and permanent pasture (PP) systems, where the model performed well, possibly due to consistent vegetation cover and the presence of comparable training data across sites. The weakest performance occurred in the wheat system, an annual arable land use with distinct temporal and surface characteristics. Intermediate bandwidths achieved the best trade-off between local adaptivity and generalisation, while residual spatial autocorrelation analysis confirmed the added value of spatial weighting for reducing unexplained spatial patterns in the model outputs. This study also identified key opportunities for further development. Incorporating additional predictors that reflect vegetation traits and land management, integrating temporal dynamics, and adopting more rigorous validation strategies would enhance model transferability to broader agricultural settings. The GWQML approach offers a scalable and interpretable pathway for probabilistic soil moisture modelling in support of precision agriculture, hydrological forecasting, and environmental monitoring.

Author Contributions

Conceptualization, B.O., P.H., I.A.F., E.M. and C.B.; methodology, B.O., P.H. and C.B.; software, B.O.; validation, B.O., P.H. and C.B.; formal analysis, B.O., P.H. and C.B.; investigation, B.O., P.H. and C.B.; resources, P.H. and C.B.; data curation, B.O.; writing—original draft preparation, B.O., P.H., I.A.F., E.M. and C.B.; writing—review and editing, B.O., P.H., I.A.F., E.M. and C.B.; visualization, B.O.; supervision, P.H. and C.B.; project administration, P.H. and C.B.; funding acquisition, P.H. and C.B. All authors have read and agreed to the published version of the manuscript.

Funding

This research was funded by the Alan Turing Institute and the Engineering and Physical Sciences Research Council (EPSRC) under grant Y028880/1 and by the Biotechnology and Biological Sciences Research Council (BBSRC) under grants BBS/E/RH/23NB0008 and BBS/E/RH/230004C.

Data Availability Statement

The soil moisture data used in the study were obtained from the North Wyke Farm Platform (NWFP) and are available through the NWFP Data Portal (https://nwfp.rothamsted.ac.uk/, accessed on 15 March 2025) upon registration and in accordance with the platform’s data sharing policy. Remotely sensed data were derived from publicly accessible datasets via Google Earth Engine (https://developers.google.com/earth-engine/datasets, accessed on 02 March 2025).

Acknowledgments

We thank the Alan Turing Institute, EPSRC, and BBSRC for supporting this work and enabling access to the North Wyke Farm Platform.

Conflicts of Interest

The authors declare no conflicts of interest.

Abbreviations

The following abbreviations are used in this manuscript:
CTSCyclic Temporal Signal
DEMDigital Elevation Model
DRGDeep-Rooted Grass
DRG-CDeep-Rooted Grass with Clover
ERA5ECMWF Re-analysis V5
GEEGoogle Earth Engine
GWMLGeographically Weighted Machine Learning
GWQMLGeographically Weighted Quantile Machine Learning
HSGHigh-Sugar Grass
HSG-CHigh-Sugar Grass with Clover
LOLUOLeave-One-Land-Use-Out
PPPermanent Pasture

Appendix A

Table A1. Year-wise distribution of daily soil moisture (m3/m3) observations by land use from 2015 to 2021. For each land use class, the number of valid daily observations is reported annually. Land use abbreviations: PP—Permanent Pasture; HSG—High-Sugar Grass; DRG—Deep-Rooted Grass; HSG-C—High-Sugar Grass with Clover; DRG-C—Deep-Rooted Grass with Clover; Wheat—Rotational Cropland with Winter Wheat.
Land UseYearN
(obs.)
Mean
(m3/m3)
SD
(m3/m3)
Min
(m3/m3)
Q1
(m3/m3)
Median
(m3/m3)
Q3
(m3/m3)
Max
(m3/m3)
DRG2015340.3510.0430.230.3350.3720.3790.395
DRG2016700.3380.0470.2210.3050.3490.3830.399
DRG20171060.3630.0470.1810.3610.3850.3880.398
DRG20181650.2770.0870.150.1860.2790.360.393
DRG2019640.3430.0350.2580.3290.3580.3670.39
DRG-C2015340.3410.0680.2030.3070.3790.390.412
DRG-C2016700.3550.0380.2670.3370.3690.390.393
DRG-C20171060.3720.0330.2690.3610.3860.3920.404
DRG-C20181650.2910.1030.1570.1780.2880.4010.417
DRG-C2019880.3450.0730.1760.2870.3860.4040.452
DRG-C2020950.3450.0950.1610.250.4040.4240.429
DRG-C2021910.3550.0690.2110.3060.3760.420.43
HSG20151050.3490.070.1270.340.3820.3940.432
HSG20162760.3580.0430.2350.3350.3680.3930.404
HSG20174620.3720.0350.2250.360.3860.3970.405
HSG20186560.3210.0780.1760.250.3420.3990.406
HSG20193100.3460.0530.2120.3060.3680.3920.404
HSG-C20151060.3550.0440.2170.330.3670.3910.403
HSG-C20162680.3390.0450.2430.3060.3430.3720.406
HSG-C20174800.3560.0350.2250.3440.3690.3790.401
HSG-C20186600.3020.0780.1620.2310.3110.3810.417
HSG-C20194480.350.0460.240.3130.3690.3820.413
HSG-C20203990.3470.0550.2120.3080.3720.3880.41
HSG-C20213460.3490.0420.250.3180.3580.3830.409
PP20152340.3480.0530.1670.3170.3640.3880.427
PP20163480.3390.0530.2230.2910.3490.390.41
PP20175890.370.0360.210.3570.3790.3950.409
PP20188150.3190.080.1630.2440.3420.3970.41
PP20195840.3580.0490.1830.3340.3730.3940.426
PP20204860.3660.0450.2320.3410.3830.4030.411
PP20213860.3660.0340.2740.3450.3740.3950.408
Wheat2019950.3910.0220.3250.370.4020.4040.414
Wheat20203500.3550.070.1940.2810.3960.4060.416
Wheat20212160.3610.0440.2370.3360.3710.3950.413

Appendix B

Figure A1. Pairwise Pearson correlation matrix among all environmental variables, including soil moisture, radar backscatter indices, climate and topographic features, and temporal signals.
Remotesensing 17 02907 g0a1

References

  1. Brocca, L.; Ciabatta, L.; Massari, C.; Camici, S.; Tarpanelli, A. Soil Moisture for Hydrological Applications: Open Questions and New Opportunities. Water 2017, 9, 140. [Google Scholar] [CrossRef]
  2. Sun, W.; Zhou, S.; Yu, B.; Zhang, Y.; Keenan, T.; Fu, B. Soil Moisture-Atmosphere Interactions Drive Terrestrial Carbon-Water Trade-Offs. Commun. Earth Environ. 2025, 6, 169. [Google Scholar] [CrossRef]
  3. Berg, A.; Sheffield, J. Climate Change and Drought: The Soil Moisture Perspective. Curr. Clim. Change Rep. 2018, 4, 180–191. [Google Scholar] [CrossRef]
  4. Lin, Z.; Wang, Q.; Xu, Y.; Luo, S.; Zhou, C.; Yu, Z.; Xu, C.-Y. Soil Moisture Dynamics and Associated Rainfall-Runoff Processes under Different Land Uses and Land Covers in a Humid Mountainous Watershed. J. Hydrol. 2024, 636, 131249. [Google Scholar] [CrossRef]
  5. Soothar, R.K.; Singha, A.; Soomro, S.A.; Chachar, A.; Kalhoro, F.; Rahaman, M.A. Effect of Different Soil Moisture Regimes on Plant Growth and Water Use Efficiency of Sunflower: Experimental Study and Modeling. Bull. Natl. Res. Cent. 2021, 45, 121. [Google Scholar] [CrossRef]
  6. Rodriguez-Iturbe, I.; D’Odorico, P.; Porporato, A.; Ridolfi, L. On the Spatial and Temporal Links between Vegetation, Climate, and Soil Moisture. Water Resour. Res. 1999, 35, 3709–3722. [Google Scholar] [CrossRef]
  7. Peng, J.; Albergel, C.; Balenzano, A.; Brocca, L.; Cartus, O.; Cosh, M.H.; Crow, W.T.; Dabrowska-Zielinska, K.; Dadson, S.; Davidson, M.W.J.; et al. A Roadmap for High-Resolution Satellite Soil Moisture Applications—Confronting Product Characteristics with User Requirements. Remote Sens. Environ. 2021, 252, 112162. [Google Scholar] [CrossRef]
  8. Ma, H.; Zeng, J.; Chen, N.; Zhang, X.; Cosh, M.H.; Wang, W. Satellite Surface Soil Moisture from SMAP, SMOS, AMSR2 and ESA CCI: A Comprehensive Assessment Using Global Ground-Based Observations. Remote Sens. Environ. 2019, 231, 111215. [Google Scholar] [CrossRef]
  9. Kerr, Y.H.; Al-Yaari, A.; Rodriguez-Fernandez, N.; Parrens, M.; Molero, B.; Leroux, D.; Bircher, S.; Mahmoodi, A.; Mialon, A.; Richaume, P.; et al. Overview of SMOS Performance in Terms of Global Soil Moisture Monitoring after Six Years in Operation. Remote Sens. Environ. 2016, 180, 40–63. [Google Scholar] [CrossRef]
  10. Farahani, A.; Moradikhaneghahi, M.; Ghayoomi, M.; Jacobs, J.M. Application of Soil Moisture Active Passive (SMAP) Satellite Data in Seismic Response Assessment. Remote Sens. 2022, 14, 4375. [Google Scholar] [CrossRef]
  11. Meng, X.; Zeng, J.; Yang, Y.; Zhao, W.; Ma, H.; Letu, H.; Zhu, Q.; Liu, Y.; Wang, P.; Peng, J. High-Resolution Soil Moisture Mapping through Passive Microwave Remote Sensing Downscaling. Innov. Geosci. 2024, 2, 100105-1. [Google Scholar] [CrossRef]
  12. Fan, D.; Zhao, T.; Jiang, X.; García-García, A.; Schmidt, T.; Samaniego, L.; Attinger, S.; Wu, H.; Jiang, Y.; Shi, J.; et al. A Sentinel-1 SAR-Based Global 1-Km Resolution Soil Moisture Data Product: Algorithm and Preliminary Assessment. Remote Sens. Environ. 2025, 318, 114579. [Google Scholar] [CrossRef]
  13. Atun, R.; Gürsoy, Ö.; Koşaroğlu, S. Field Scale Soil Moisture Estimation with Ground Penetrating Radar and Sentinel 1 Data. Sustainability 2024, 16, 10995. [Google Scholar] [CrossRef]
  14. Wang, L.; Qu, J.J.; Zhang, S.; Hao, X.; Dasgupta, S. Soil Moisture Estimation Using MODIS and Ground Measurements in Eastern China. Int. J. Remote Sens. 2007, 28, 1413–1418. [Google Scholar] [CrossRef]
  15. Zhang, Y.; Liang, S.; Zhu, Z.; Ma, H.; He, T. Soil Moisture Content Retrieval from Landsat 8 Data Using Ensemble Learning. ISPRS J. Photogramm. Remote Sens. 2022, 185, 32–47. [Google Scholar] [CrossRef]
  16. Zou, X.; Wang, G.; Hagan, D.F.T.; Li, S.; Wei, J.; Lu, J.; Qiao, Y.; Zhu, C.; Ullah, W.; Yeboah, E. Precipitation Sensitivity to Soil Moisture Changes in Multiple Global Climate Models. Atmosphere 2023, 14, 1531. [Google Scholar] [CrossRef]
  17. Koohikeradeh, E.; Jose Gumiere, S.; Bonakdari, H. NDMI-Derived Field-Scale Soil Moisture Prediction Using ERA5 and LSTM for Precision Agriculture. Sustainability 2025, 17, 2399. [Google Scholar] [CrossRef]
  18. Schönauer, M.; Asabere, S.B.; Sauer, D.; Drollinger, S. Topographic Indices and ERA5-Land Data to Describe Soil Moisture Variability in a Central European Beech Forest. J. Hydrol. Reg. Stud. 2025, 59, 102456. [Google Scholar] [CrossRef]
  19. Wanders, N.; Karssenberg, D.; Bierkens, M.; Parinussa, R.; de Jeu, R.; van Dam, J.; de Jong, S. Observation Uncertainty of Satellite Soil Moisture Products Determined with Physically-Based Modeling. Remote Sens. Environ. 2012, 127, 341–356. [Google Scholar] [CrossRef]
  20. Douglas-Mankin, K.R.; Srinivasan, R.; Arnold, J.G. Soil and Water Assessment Tool (SWAT) Model: Current Developments and Applications. Trans. ASABE 2010, 53, 1423–1431. [Google Scholar] [CrossRef]
  21. Pignotti, G.; Crawford, M.; Han, E.; Williams, M.R.; Chaubey, I. SMAP Soil Moisture Data Assimilation Impacts on Water Quality and Crop Yield Predictions in Watershed Modeling. J. Hydrol. 2023, 617, 129122. [Google Scholar] [CrossRef]
  22. Bwambale, E.; Abagale, F.K.; Anornu, G.K. Data-Driven Modelling of Soil Moisture Dynamics for Smart Irrigation Scheduling. Smart Agric. Technol. 2023, 5, 100251. [Google Scholar] [CrossRef]
  23. Kolassa, J.; Reichle, R.H.; Liu, Q.; Alemohammad, S.H.; Gentine, P.; Aida, K.; Asanuma, J.; Bircher, S.; Caldwell, T.; Colliander, A.; et al. Estimating Surface Soil Moisture from SMAP Observations Using a Neural Network Technique. Remote Sens. Environ. 2018, 204, 43–59. [Google Scholar] [CrossRef] [PubMed]
  24. Parada, L.M.; Liang, X. Impacts of Spatial Resolutions and Data Quality on Soil Moisture Data Assimilation. J. Geophys. Res. Atmos. 2008, 113, D10101. [Google Scholar] [CrossRef]
  25. Behrens, T.; Schmidt, K.; Viscarra Rossel, R.; Gries, P.; Scholten, T.; Macmillan, R.A. Spatial Modelling with Euclidean Distance Fields and Machine Learning. Eur. J. Soil. Sci. 2018, 69, 757–770. [Google Scholar] [CrossRef]
  26. Price, A.G.; Bauer, B.O. Small-Scale Heterogeneity and Soil-Moisture Variability in the Unsaturated Zone. J. Hydrol. 1984, 70, 277–293. [Google Scholar] [CrossRef]
  27. Yetbarek, E.; Kumar, S.; Ojha, R. Effects of Soil Heterogeneity on Subsurface Water Movement in Agricultural Fields: A Numerical Study. J. Hydrol. 2020, 590, 125420. [Google Scholar] [CrossRef]
  28. Western, A.W.; Blöschl, G. On the Spatial Scaling of Soil Moisture. J. Hydrol. 1999, 217, 203–224. [Google Scholar] [CrossRef]
  29. Song, P.; Huang, J.; Mansaray, L.R. An Improved Surface Soil Moisture Downscaling Approach over Cloudy Areas Based on Geographically Weighted Regression. Agric. Meteorol. 2019, 275, 146–158. [Google Scholar] [CrossRef]
  30. Jia, Y.; Zou, J.; Jin, S.; Yan, Q.; Chen, Y.; Jin, Y.; Savi, P. Multiresolution Soil Moisture Products Based on a Spatially Adaptive Estimation Model and CYGNSS Data. GIsci. Remote Sens. 2024, 61, 2313812. [Google Scholar] [CrossRef]
  31. Zhong, Y.; Hong, S.; Wei, Z.; Walker, J.P.; Wang, Y.; Huang, C. Spatial Downscaling of SMAP Soil Moisture Estimation Using Multiscale Geographically Weighted Regression during SMAPVEX16. J. Hydrol. 2024, 637, 131348. [Google Scholar] [CrossRef]
  32. Tong, C.; Ye, Y.; Zhao, T.; Bao, H.; Wang, H. Soil Moisture Disaggregation via Coupling Geographically Weighted Regression and Radiative Transfer Model. J Hydrol 2024, 634, 131053. [Google Scholar] [CrossRef]
  33. Jung, C.; Lee, Y.; Lee, J.; Kim, S. Performance Evaluation of the Multiple Quantile Regression Model for Estimating Spatial Soil Moisture after Filtering Soil Moisture Outliers. Remote Sens. 2020, 12, 1678. [Google Scholar] [CrossRef]
  34. Yu, C.; Wang, D.; Singh, V.P.; Xu, P.; Zhang, A.; Yang, Z.; Wang, Z.; Zeng, X.; Jiang, J.; Wu, J. An Ensemble Vine Copula Quantile Regression Model with Non-Stationary Margins (EVQR-NS) for Soil Moisture Prediction. J. Hydrol. 2025, 659, 133248. [Google Scholar] [CrossRef]
  35. Zare, S.; Abtahi, A.; Dehghani, M.; Fallah Shamsi, S.R.; Baghernejad, M.; Lagacherie, P. Chapter 21—Quantile Random Forest Technique for Soil Moisture Contents Digital Mapping, Sarvestan Plain, Iran. In Advanced Tools for Studying Soil Erosion Processes; Pourghasemi, H.R., Kariminejad, N., Eds.; Elsevier: Amsterdam, The Netherlands, 2024; pp. 351–368. ISBN 978-0-443-22262-7. [Google Scholar] [CrossRef]
  36. Dega, S.; Dietrich, P.; Schrön, M.; Paasche, H. Probabilistic Prediction by Means of the Propagation of Response Variable Uncertainty through a Monte Carlo Approach in Regression Random Forest: Application to Soil Moisture Regionalization. Front. Environ. Sci. 2023, 11, 1009191. [Google Scholar] [CrossRef]
  37. Murray, P.J.; Griffith, B.A.; Research, R.; Shepherd, A. The North Wyke Farm Platform: A New UK National Capability for Research into Sustainability of Agricultural Temperate Grassland Management. In Proceedings of the 22nd International Grassland Congress, Sydney, Australia, 15–19 September 2013. [Google Scholar]
  38. Takahashi, T.; Harris, P.; Blackwell, M.S.A.; Cardenas, L.M.; Collins, A.L.; Dungait, J.A.J.; Hawkins, J.M.B.; Misselbrook, T.H.; McAuliffe, G.A.; McFadzean, J.N.; et al. Roles of Instrumented Farm-Scale Trials in Trade-off Assessments of Pasture-Based Ruminant Production Systems. Animal 2018, 12, 1766–1776. [Google Scholar] [CrossRef]
  39. Orr, R.J.; Murray, P.J.; Eyles, C.J.; Blackwell, M.S.A.; Cardenas, L.M.; Collins, A.L.; Dungait, J.A.J.; Goulding, K.W.T.; Griffith, B.A.; Gurr, S.J.; et al. The North Wyke Farm Platform: Effect of Temperate Grassland Farming Systems on Soil Moisture Contents, Runoff and Associated Water Quality Dynamics. Eur. J. Soil. Sci. 2016, 67, 374–385. [Google Scholar] [CrossRef]
  40. Harrod, T.R.; Hogan, D.V. The Soils of North Wyke and Rowden. Soil Surv. Engl. Wales 2008, 1–54. Available online: https://repository.rothamsted.ac.uk/item/96xqw/the-soils-of-north-wyke-and-rowden (accessed on 15 March 2025).
  41. Pulley, S.; Collins, A.L. Field-Based Determination of Controls on Runoff and Fine Sediment Generation from Lowland Grazing Livestock Fields. J. Environ. Manag. 2019, 249, 109365. [Google Scholar] [CrossRef]
  42. Hawkins, J.M.B.; Harris, P. North Wyke Farm Platform User Guide: Fine Resolution (15-Minute) Soil Moisture Station Data; Rothamsted Research: Harpenden, UK, 2023. [Google Scholar] [CrossRef]
  43. Hawkins, J.M.B.; Griffith, B.A.; Sint, H.M.; Harris, P. The North Wyke Farm Platform: Design, Establishment and Development; Rothamsted Research: Harpenden, UK, 2023. [Google Scholar] [CrossRef]
  44. Gorelick, N.; Hancher, M.; Dixon, M.; Ilyushchenko, S.; Thau, D.; Moore, R. Google Earth Engine: Planetary-Scale Geospatial Analysis for Everyone. Remote Sens. Environ. 2017, 202, 18–27. [Google Scholar] [CrossRef]
  45. Vanderhoof, M.K.; Alexander, L.; Christensen, J.; Solvik, K.; Nieuwlandt, P.; Sagehorn, M. High-Frequency Time Series Comparison of Sentinel-1 and Sentinel-2 Satellites for Mapping Open and Vegetated Water across the United States (2017–2021). Remote Sens. Environ. 2023, 288, 113498. [Google Scholar] [CrossRef]
  46. Skentos, A. TOPOGRAPHIC POSITION INDEX BASED LANDFORM ANALYSIS OF MESSARIA (IKARIA ISLAND, GREECE). Acta Geobalc. 2017, 4, 7–15. [Google Scholar] [CrossRef]
  47. Winzeler, H.E.; Owens, P.R.; Read, Q.D.; Libohova, Z.; Ashworth, A.; Sauer, T. Topographic Wetness Index as a Proxy for Soil Moisture in a Hillslope Catena: Flow Algorithms and Map Generalization. Land 2022, 11, 2018. [Google Scholar] [CrossRef]
  48. Kopecký, M.; Macek, M.; Wild, J. Topographic Wetness Index Calculation Guidelines Based on Measured Soil Moisture and Plant Species Composition. Sci. Total Environ. 2021, 757, 143785. [Google Scholar] [CrossRef] [PubMed]
  49. Eskandari, H.; Saadatmand, H.; Ramzan, M.; Mousapour, M. Innovative Framework for Accurate and Transparent Forecasting of Energy Consumption: A Fusion of Feature Selection and Interpretable Machine Learning. Appl. Energy 2024, 366, 123314. [Google Scholar] [CrossRef]
  50. Li, M.; Yan, Y. Comparative Analysis of Machine-Learning Models for Soil Moisture Estimation Using High-Resolution Remote-Sensing Data. Land 2024, 13, 1331. [Google Scholar] [CrossRef]
  51. Ke, G.; Meng, Q.; Finley, T.; Wang, T.; Chen, W.; Ma, W.; Ye, Q.; Liu, T.-Y. LightGBM: A Highly Efficient Gradient Boosting Decision Tree. In Proceedings of the 31st International Conference on Neural Information Processing Systems, Long Beach, CA, USA, 9 December 2017. [Google Scholar]
  52. Han, J.; Kamber, M.; Pei, J. 3—Data Preprocessing. In Data Mining: Concepts and Techniques, 3rd ed.; Han, J., Kamber, M., Pei, J., Eds.; Morgan Kaufmann: Boston, MA, USA, 2012; pp. 83–124. ISBN 978-0-12-381479-1. [Google Scholar]
  53. Moran, P.A.P. Notes on Continuous Stochastic Phenomena. Biometrika 1950, 37, 17–23. [Google Scholar] [CrossRef]
  54. Comber, A.; Wulder, M. Considering Spatiotemporal Processes in Big Data Analysis: Insights from Remote Sensing of Land Cover and Land Use. Trans. GIS 2019, 23, 879–891. [Google Scholar] [CrossRef]
  55. Comber, A.; Brunsdon, C.; Charlton, M.; Dong, G.; Harris, R.; Lu, B.; Lü, Y.; Murakami, D.; Nakaya, T.; Wang, Y.; et al. A Route Map for Successful Applications of Geographically Weighted Regression. Geogr. Anal. 2023, 55, 155–178. [Google Scholar] [CrossRef]
  56. Zhang, Z.; Zhang, Y.; Henderson, M.; Wang, G.; Chen, M.; Fu, Y.; Dou, Z.; Zhou, W.; Huang, W.; Liu, B. Effect of Land Use Type on Soil Moisture Dynamics in the Sloping Lands of the Black Soil (Mollisols) Region of Northeast China. Agriculture 2024, 14, 1261. [Google Scholar] [CrossRef]
  57. Lu, B.; Charlton, M.; Harris, P.; Fotheringham, A.S. Geographically Weighted Regression with a Non-Euclidean Distance Metric: A Case Study Using Hedonic House Price Data. Int. J. Geogr. Inf. Sci. 2014, 28, 660–681. [Google Scholar] [CrossRef]
  58. Srisuradetchai, P.; Suksrikran, K. Random Kernel K-Nearest Neighbors Regression. Front. Big Data 2024, 7, 1402384. [Google Scholar] [CrossRef] [PubMed]
  59. Pan, B.; Ni, Y.; Ma, Y.; Lu, P. Smoothing Homotopy Methods for Solving Nonlinear Optimal Control Problems. J. Guid. Control Dyn. 2023, 46, 1470–1484. [Google Scholar] [CrossRef]
  60. Allerbo, O.; Jörnsten, R. Bandwidth Selection for Gaussian Kernel Ridge Regression via Jacobian Control. arXiv 2022, arXiv:2205.11956. [Google Scholar]
  61. Guo, L.; Ma, Z.; Zhang, L. Comparison of Bandwidth Selection in Application of Geographically Weighted Regression: A Case Study. Can. J. For. Res. 2008, 38, 2526–2534. [Google Scholar] [CrossRef]
  62. Bitter, C.; Mulligan, G.F.; Dall’erba, S. Incorporating Spatial Variation in Housing Attribute Prices: A Comparison of Geographically Weighted Regression and the Spatial Expansion Method. J. Geogr. Syst. 2007, 9, 7–27. [Google Scholar] [CrossRef]
  63. Sun, Y.; Phillips, P.C.B. Optimal Bandwidth Choice for Interval Estimation in GMM Regression; Cowles Foundation Discussion Paper No. 1965; Cowles Foundation for Research in Economics, Yale University: New Haven, CT, USA, 2008; Available online: https://elischolar.library.yale.edu/cowles-discussion-paper-series/1965 (accessed on 1 March 2025).
  64. Sugiyama, M.; Krauledat, M.; Müller, K.-R. Covariate Shift Adaptation by Importance Weighted Cross Validation. J. Mach. Learn. Res. 2007, 8, 985–1005. [Google Scholar]
  65. Fang, K.; Kifer, D.; Lawson, K.; Feng, D.; Shen, C. The Data Synergy Effects of Time-Series Deep Learning Models in Hydrology. Water Resour. Res. 2022, 58, e2021WR029583. [Google Scholar] [CrossRef]
  66. Gaudin, A.C.M.; Westra, S.; Loucks, C.E.S.; Janovicek, K.; Martin, R.C.; Deen, W. Improving Resilience of Northern Field Crop Systems Using Inter-Seeded Red Clover: A Review. Agronomy 2013, 3, 148–180. [Google Scholar] [CrossRef]
  67. Haynes, R.J.; Beare, M.H. Influence of Six Crop Species on Aggregate Stability and Some Labile Organic Matter Fractions. Soil Biol. Biochem. 1997, 29, 1647–1653. [Google Scholar] [CrossRef]
  68. Black, A.D.; Laidlaw, A.S.; Moot, D.J.; O’Kiely, P. Comparative growth and management of white and red clovers. Ir. J. Agric. Food Res. 2009, 48, 149–166. [Google Scholar]
  69. Zribi, M.; Ciarletti, V.; Taconet, O.; Paillé, J.; Boissard, P. Characterisation of the Soil Structure and Microwave Backscattering Based on Numerical Three-Dimensional Surface Representation: Analysis with a Fractional Brownian Model. Remote Sens. Environ. 2000, 72, 159–169. [Google Scholar] [CrossRef]
  70. Khabbazan, S.; Steele-Dunne, S.C.; Vermunt, P.; Judge, J.; Vreugdenhil, M.; Gao, G. The Influence of Surface Canopy Water on the Relationship between L-Band Backscatter and Biophysical Variables in Agricultural Monitoring. Remote Sens. Environ. 2022, 268, 112789. [Google Scholar] [CrossRef]
  71. Alemohammad, S.H.; Konings, A.G.; Jagdhuber, T.; Moghaddam, M.; Entekhabi, D. Characterization of vegetation and soil scattering mechanisms across different biomes using P-band SAR polarimetry. Remote Sens. Environ. 2018, 209, 107–117. [Google Scholar] [CrossRef]
  72. Yin, L.; Ghosh, R.; Lin, C.; Hale, D.; Weigl, C.; Obarowski, J.; Zhou, J.; Till, J.; Jia, X.; You, N.; et al. Mapping Smallholder Cashew Plantations to Inform Sustainable Tree Crop Expansion in Benin. Remote Sens. Environ. 2023, 295, 113695. [Google Scholar] [CrossRef]
  73. Wigneron, J.P.; Jackson, T.J.; O’Neill, P.; De Lannoy, G.; de Rosnay, P.; Walker, J.P.; Ferrazzoli, P.; Mironov, V.; Bircher, S.; Grant, J.P.; et al. Modelling the Passive Microwave Signature from Land Surfaces: A Review of Recent Results and Application to the L-Band SMOS & SMAP Soil Moisture Retrieval Algorithms. Remote Sens. Environ. 2017, 192, 238–262. [Google Scholar]
  74. Shafian, S.; Maas, S.J. Index of Soil Moisture Using Raw Landsat Image Digital Count Data in Texas High Plains. Remote Sens. 2015, 7, 2352–2372. [Google Scholar] [CrossRef]
  75. Steduto, P.; Hsiao, T.C.; Raes, D.; Fereres, E. Aquacrop-the FAO Crop Model to Simulate Yield Response to Water: I. Concepts Underlying Principles. Agron. J. 2009, 101, 426–437. [Google Scholar] [CrossRef]
  76. van Diepen, C.A.; Wolf, J.; van Keulen, H.; Rappoldt, C. WOFOST: A Simulation Model of Crop Production. Soil Use Manag. 1989, 5, 16–24. [Google Scholar] [CrossRef]
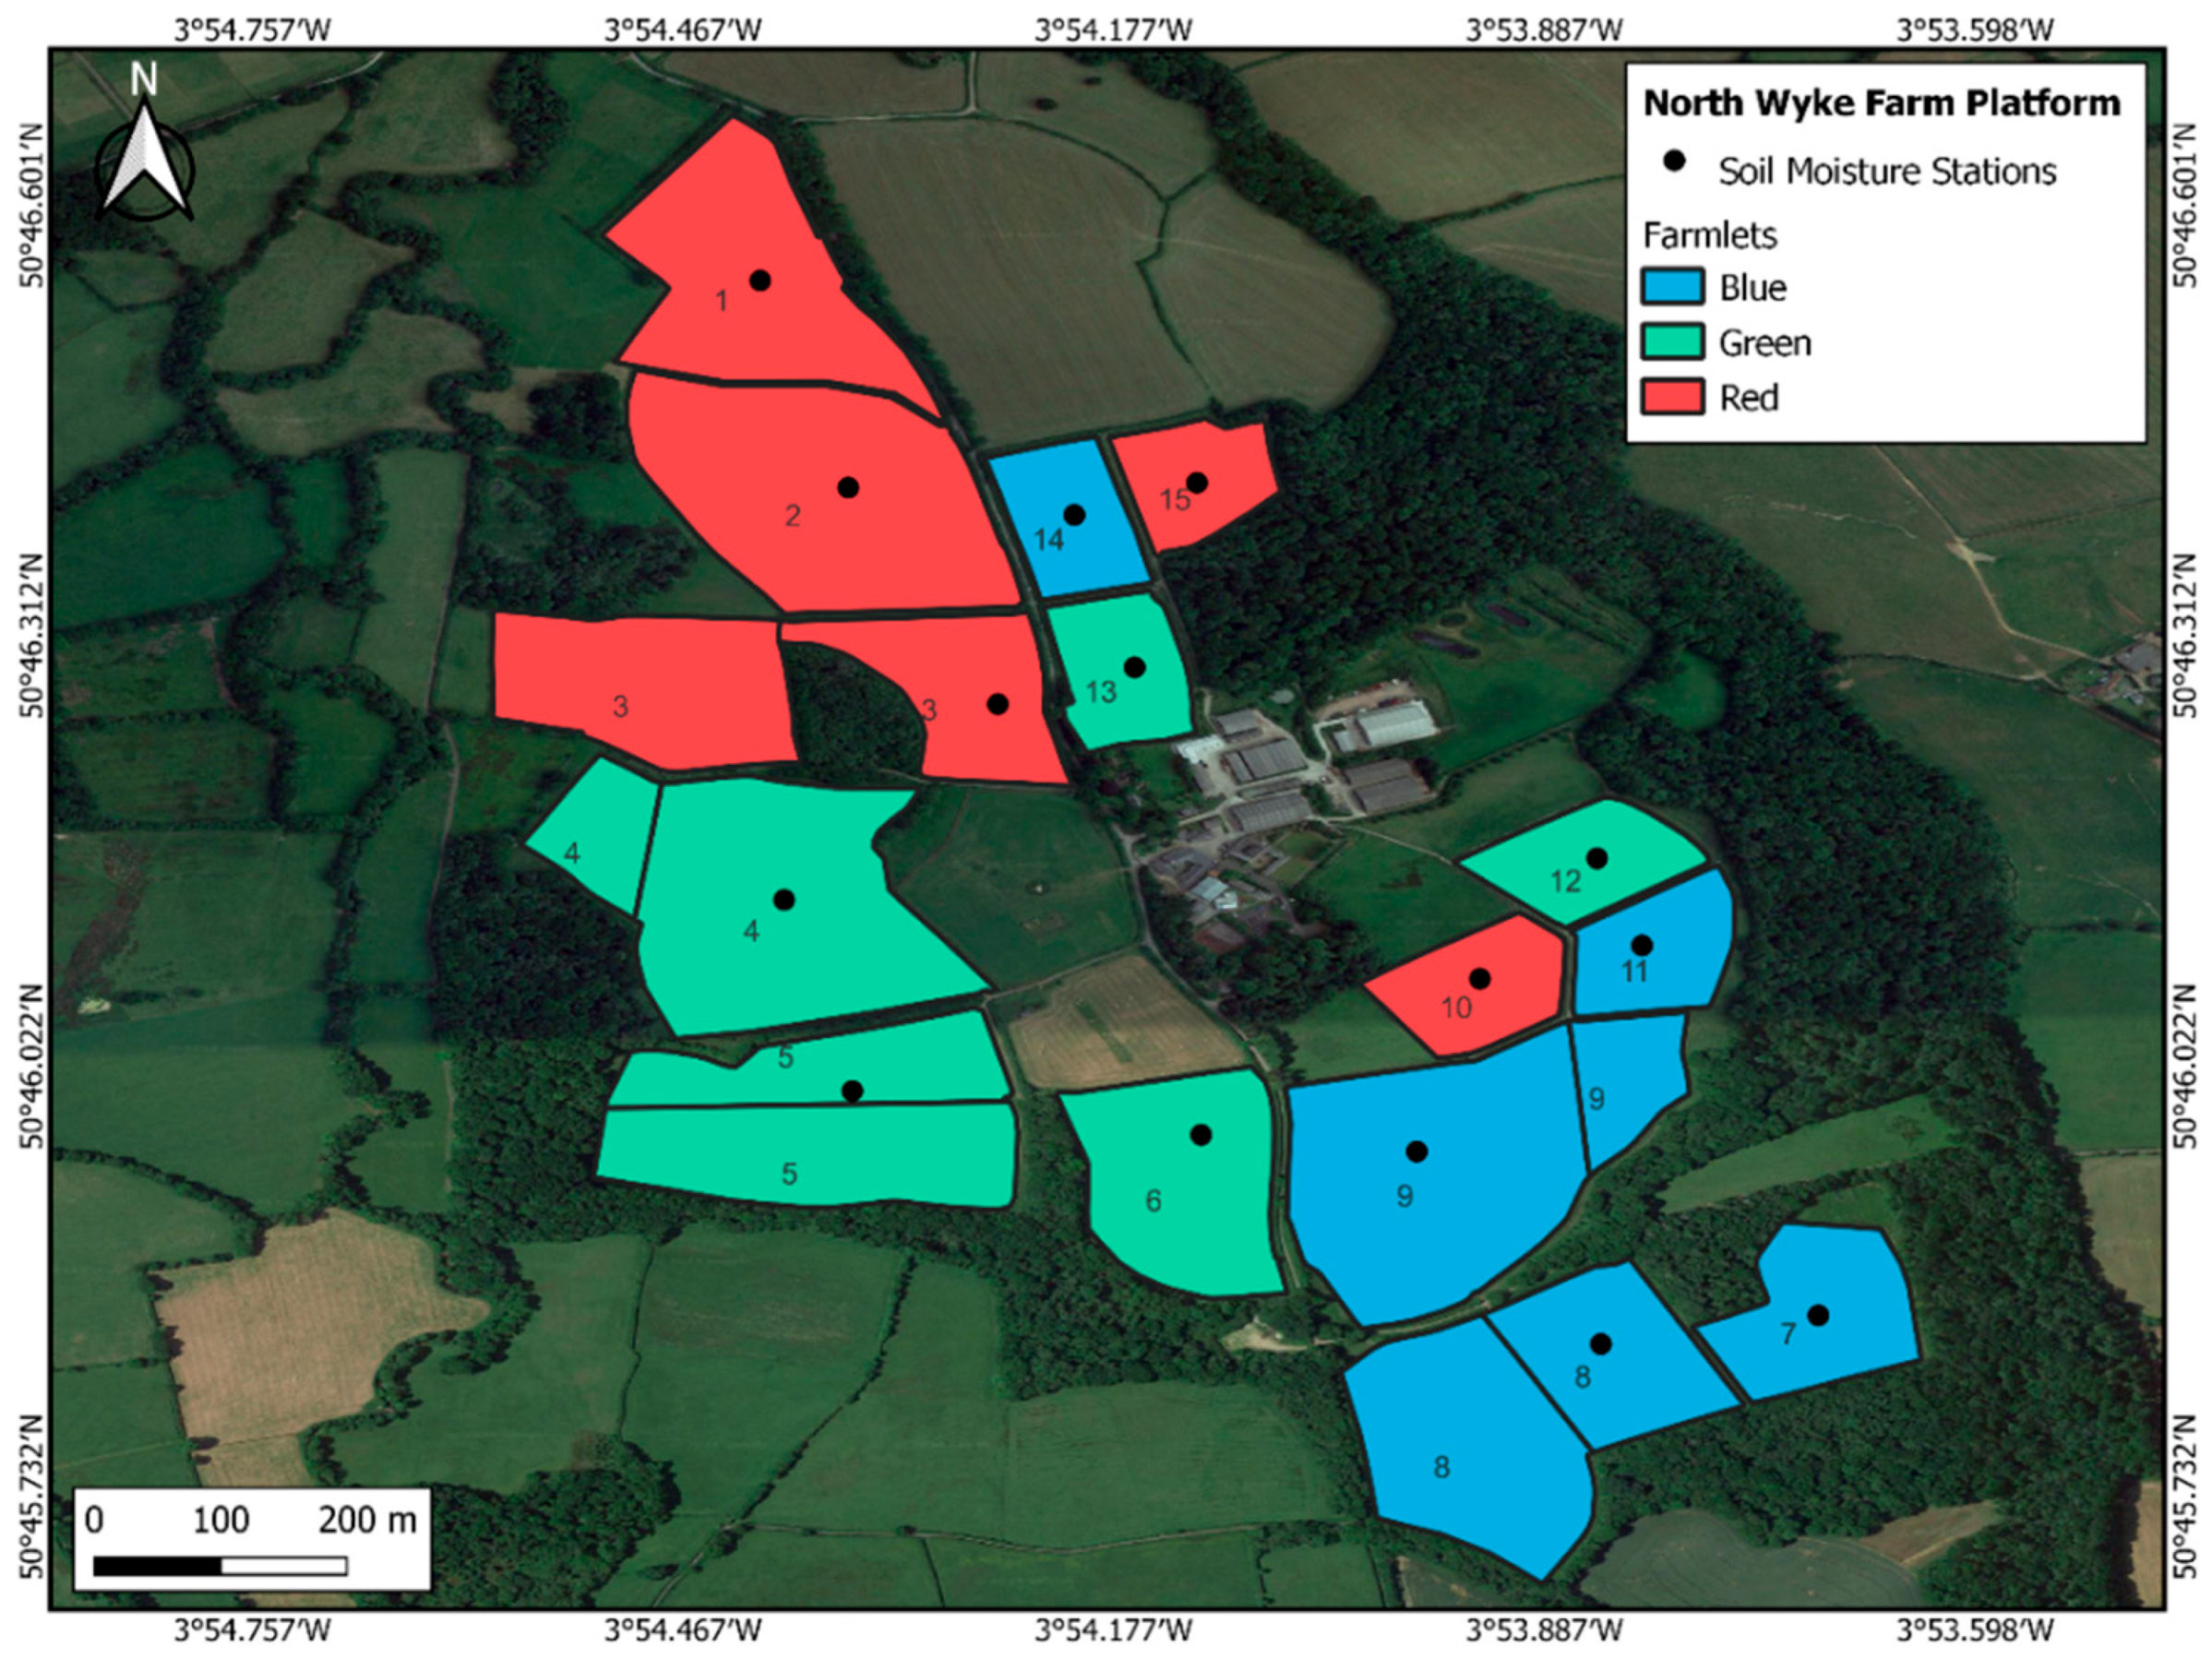
Figure 1. Location of the 15 study catchments, 15 soil moisture stations, and 3 farmlets at the North Wyke Farm Platform, southwest England, UK.
Remotesensing 17 02907 g001
Figure 2. Temporal allocation of six land uses across the 15 catchments at the North Wyke Farm Platform from 2015 to 2021. PP—Permanent Pasture; HSG—High-Sugar Grass; DRG—Deep-Rooted Grass; HSG-C—High-Sugar Grass with Clover; DRG-C—Deep-Rooted Grass with Clover.
Remotesensing 17 02907 g002
Figure 3. Daily mean soil moisture (m3/m3) by land use from 2015 to 2021 at the North Wyke Farm Platform. PP—Permanent Pasture; HSG—High-Sugar Grass; DRG—Deep-Rooted Grass; HSG-C—High-Sugar Grass with Clover; DRG-C—Deep-Rooted Grass with Clover.
Remotesensing 17 02907 g003
Figure 4. Behaviour of the two kernel weight functions (Tricube and Gaussian) used in the Geographically Weighted Quantile Machine Learning Model (GWQML). Each panel shows how weights decay with distance for five bandwidths (500, 750, 1000, 1250, and 1500 m). The Tricube kernel (top) exhibits finite support, assigning zero weight beyond the specified bandwidth, while the Gaussian kernel (bottom) decays smoothly with infinite support.
Remotesensing 17 02907 g004
Figure 5. Methodological workflow for probabilistic soil moisture prediction using Geographically Weighted Quantile Machine Learning (GWQML). The plot in step 4 illustrates spatial weighting applied during model tuning, comparing decay behaviour of Gaussian and Tricube kernels at a bandwidth of 750. The vertical red line indicates the bandwidth cutoff used for visualization purposes only and does not represent the fixes threshold across modelling steps.
Remotesensing 17 02907 g005
Figure 6. Stratified Pearson correlations between soil moisture and environmental predictors across land use systems. PP—Permanent Pasture; HSG—High-Sugar Grass; DRG—Deep-Rooted Grass; HSG-C—High-Sugar Grass with Clover; DRG-C—Deep-Rooted Grass with Clover.
Remotesensing 17 02907 g006
Figure 7. In-sample model evaluation of the global (QML) and Geographically Weighted Quantile Machine Learning (GWQML) models across the investigated land uses. R2 and RMSE are computed based on the median prediction (τ = 0.5). Prediction Interval Coverage Probability (PICP) is evaluated at the nominal level of 0.8. Mean Prediction Interval Width (MPIW) represents the width of the 80% prediction intervals.
Remotesensing 17 02907 g007
Figure 8. Out-of-sample predictive performance and uncertainty quantification across land use systems under Leave-One-Land-Use-Out (LOLUO) for the global (QML) and Geographically Weighted Quantile Machine Learning (GWQML) models. R2 and RMSE are computed based on the median prediction (τ = 0.5). Prediction Interval Coverage Probability (PICP) is evaluated at the nominal level of 0.8. Mean Prediction Interval Width (MPIW) represents the width of the 80% prediction intervals.
Remotesensing 17 02907 g008
Figure 9. Spatial autocorrelation in model residuals across bandwidths for the Gaussian and Tricube kernels used in GWQML. Moran’s I (top) and corresponding p-values (bottom) are displayed for each configuration, with the global model (QML) shown as a dashed reference line.
Remotesensing 17 02907 g009
Table 1. Descriptive statistics of daily soil moisture (m3/m3) by land use. Summary includes number of observations (N), standard deviation, minimum, first quartile (Q1), median third quartile (Q3), and maximum values for the period 2015–2021. PP—Permanent Pasture; HSG—High-Sugar Grass; DRG—Deep-Rooted Grass; HSG-C—High-Sugar Grass with Clover; DRG-C—Deep-Rooted Grass with Clover.
Land UseN
(obs.)
Mean
(m3/m3)
SD
(m3/m3)
Min
(m3/m3)
Q1
(m3/m3)
Median
(m3/m3)
Q3
(m3/m3)
Max
(m3/m3)
DRG4390.320.070.150.270.350.380.39
DRG-C6490.330.080.150.280.370.400.45
HSG18090.340.060.120.300.370.390.43
HSG-C27070.330.050.160.300.350.380.41
PP34420.350.050.160.310.370.390.42
Wheat6610.360.050.190.340.390.400.41
Disclaimer/Publisher’s Note: The statements, opinions and data contained in all publications are solely those of the individual author(s) and contributor(s) and not of MDPI and/or the editor(s). MDPI and/or the editor(s) disclaim responsibility for any injury to people or property resulting from any ideas, methods, instructions or products referred to in the content.