Article

Projections of Urban Heat Island Effects Under Future Climate Scenarios: A Case Study in Zhengzhou, China

1
State Key Laboratory of Spatial Datum, Henan Key Laboratory of Air Pollution Control and Ecological Security, Faculty of Geographical Science and Engineering, Henan University, Zhengzhou 450046, China
2
Key Research Institute of Yellow River Civilization and Sustainable Development Collaborative Innovation Center on Yellow River Civilization of Henan Province, Henan University, Kaifeng 475004, China
3
School of Software, Henan University, Kaifeng 475004, China
4
School of Civil Engineering and Architecture, Henan University, Kaifeng 475004, China
*
Author to whom correspondence should be addressed.
These authors contributed equally to this work.
Remote Sens. 2025, 17(15), 2660; https://doi.org/10.3390/rs17152660
Submission received: 9 June 2025 / Revised: 24 July 2025 / Accepted: 25 July 2025 / Published: 1 August 2025

Abstract

As global climate change accelerates, the urban heat island (UHI) phenomenon has become increasingly pronounced, posing significant challenges to urban energy balance, atmospheric processes, and public health. This study used the Weather Research and Forecasting (WRF) model to dynamically downscale two CMIP6 scenarios—moderate forcing (SSP245) and high forcing (SSP585)—focusing on Zhengzhou, a rapidly urbanizing city in central China. High-resolution simulations captured fine-scale intra-urban temperature patterns and analyze the spatial and seasonal variations in UHI intensity in 2030 and 2060. The results demonstrated significant seasonal variations in UHI effects in Zhengzhou for both 2030 and 2060 under SSP245 and SSP585 scenarios, with the most pronounced warming in summer. Notably, under the SSP245 scenario, elevated autumn temperatures in suburban areas reduced the urban–rural temperature gradient, while intensified rural cooling during winter enhanced the UHI effect. These findings underscore the importance of integrating high-resolution climate modeling into urban planning and developing targeted adaptation strategies based on future UHI patterns to address climate challenges.

1. Introduction

As global climate change accelerates, the Urban Heat Island (UHI) effect has emerged as a distinctive characteristic of urban climates across the world [1,2,3]. Characterized by elevated urban temperatures relative to surrounding rural areas, the UHI phenomenon arises from anthropogenic land surface modifications, increased air pollution, and greenhouse gas emissions. While UHI itself does not directly cause large-scale natural disasters, it significantly alters local energy balances, disrupts hydrological cycles, and reshapes atmospheric boundary layer structures, thereby influencing pollution dispersion, urban ecosystems, and public health [4,5]. With global warming intensifying, cities are increasingly experiencing rising temperatures, more frequent extreme weather events, and shifting precipitation patterns. These changes exacerbate severity, spatial extent, and persistence of UHIs, posing critical challenges to urban ecology, public health, and socioeconomic systems [6,7]. Understanding how climate change amplifies or reshapes UHI dynamics is essential for developing effective mitigation and adaptation strategies [8].
Substantial progress has been made in understanding the UHI phenomenon through meteorological observations, remote sensing, and regional climate modeling [9,10]. Previous studies primarily relied on meteorological station data to analyze temporal trends in UHI intensity [11]. Morris [12] revealed the UHI varied seasonally between seasons and the intensity of UHI is closely related to wind speed and cloud cover in the large city of Melbourne, Australia, by taking over all observed data. However, due to the sparse distribution of meteorological stations and the challenges in accurately representing the complex underlying surface characteristics of urban areas with limited station data, the conventional approach of deriving UHI patterns solely based on land surface temperature observations from urban and suburban stations has significant limitations. With the advancement of remote sensing technology, satellite-based observations have become a crucial approach for monitoring urban climates across large areas, effectively addressing the spatial and temporal limitations of ground-based measurements and advancing insights into the spatial variability of UHI effects [13]. Liang [14] investigated the inter-annual and seasonal variations in the UHI effect in the Pearl River Delta (PRD) urban agglomeration from 2005 to 2019 using MODIS data. The results indicate that the UHI in the PRD region exhibits distinct seasonal variations and follows an inverted “U”-shaped trend in annual intensity over the study period. In addition, regional climate models (RCMs) have become indispensable tools for investigating UHI dynamics due to their ability to capture fine-scale atmospheric processes and urban–rural interactions [15,16]. By integrating detailed land surface parameters, urban canopy models, and high-resolution climate data, RCMs provide valuable insights into the spatial and temporal variability of UHI patterns [17]. Prominent models, such as the Fifth-Generation Mesoscale Model (MM5) [18], the Regional Atmospheric Modeling System (RAMS) [19], and the Weather Research and Forecasting model (WRF) [20], have significantly advanced the study of UHI. Taking Hangzhou as a case study, Zhang [21] employed land use classification data of underlying surfaces in the urban canopy model (WRF-UCM) to analyze and quantify the influence of historical urbanization on the urban thermal environment at a monthly scale. The results demonstrate that between 2010 and 2017, urban expansion in Hangzhou contributed to a notable enlargement of the UHI area, with this warming effect becoming significantly more pronounced when the urban extent approximately doubled.
Despite these advancements, most UHI studies have focused on historical or present-day conditions, with limited emphasis on how future climate scenarios might influence UHI patterns. Projections using Representative Concentration Pathways (RCPs) or Shared Socioeconomic Pathways (SSPs) have demonstrated that urbanization and greenhouse gas emissions will likely intensify UHI [22]. For example, Kusaka [23], Argüeso [24], and Hamdi [25] investigated urban temperatures and UHI intensity under future climate scenarios. Their studies revealed that future urbanization will significantly influence urban minimum temperatures, with particularly pronounced effects during winter and spring seasons. Similarly, Nazarenko [26] and Lee [27] demonstrated that different RCP emission scenarios exert distinct influences on global mean temperature variations. Their research further indicated that East Asia will likely experience increased frequency and intensity of both extreme heat events and heavy precipitation under these scenarios. However, the relatively coarse spatial resolution of global climate models, such as those in the Coupled Model Intercomparison Project Phase 6 (CMIP6) dataset (≥25 km), limits their ability to resolve the fine-scale heterogeneity of urban climates [28]. Urban climate dynamics are shaped by localized factors, including urban morphology, building density, and vegetation cover, which cannot be captured adequately at such scales. Consequently, critical drivers and localized impacts of climate change on UHI dynamics remain obscured.
To address these challenges and respond to China’s carbon peaking and carbon neutrality goals, 2030 and 2060 were selected as the simulation years for assessing the impact of future climate change on the UHI effect in Zhengzhou, a major city in central China. The WRF model was used to dynamically downscale two CMIP6 scenarios, moderate forcing (SSP245) and high forcing (SSP585), to investigate the future climate data of Zhengzhou in 2030 and 2060 under the SSP245 and SSP585 scenarios. Through high-resolution simulations, we analyzed the spatial and temporal variations in UHI intensity under these scenarios, addressing limitations in coarse-scale projections and offering fine-scale assessments specific to urban environments.

2. Materials and Methods
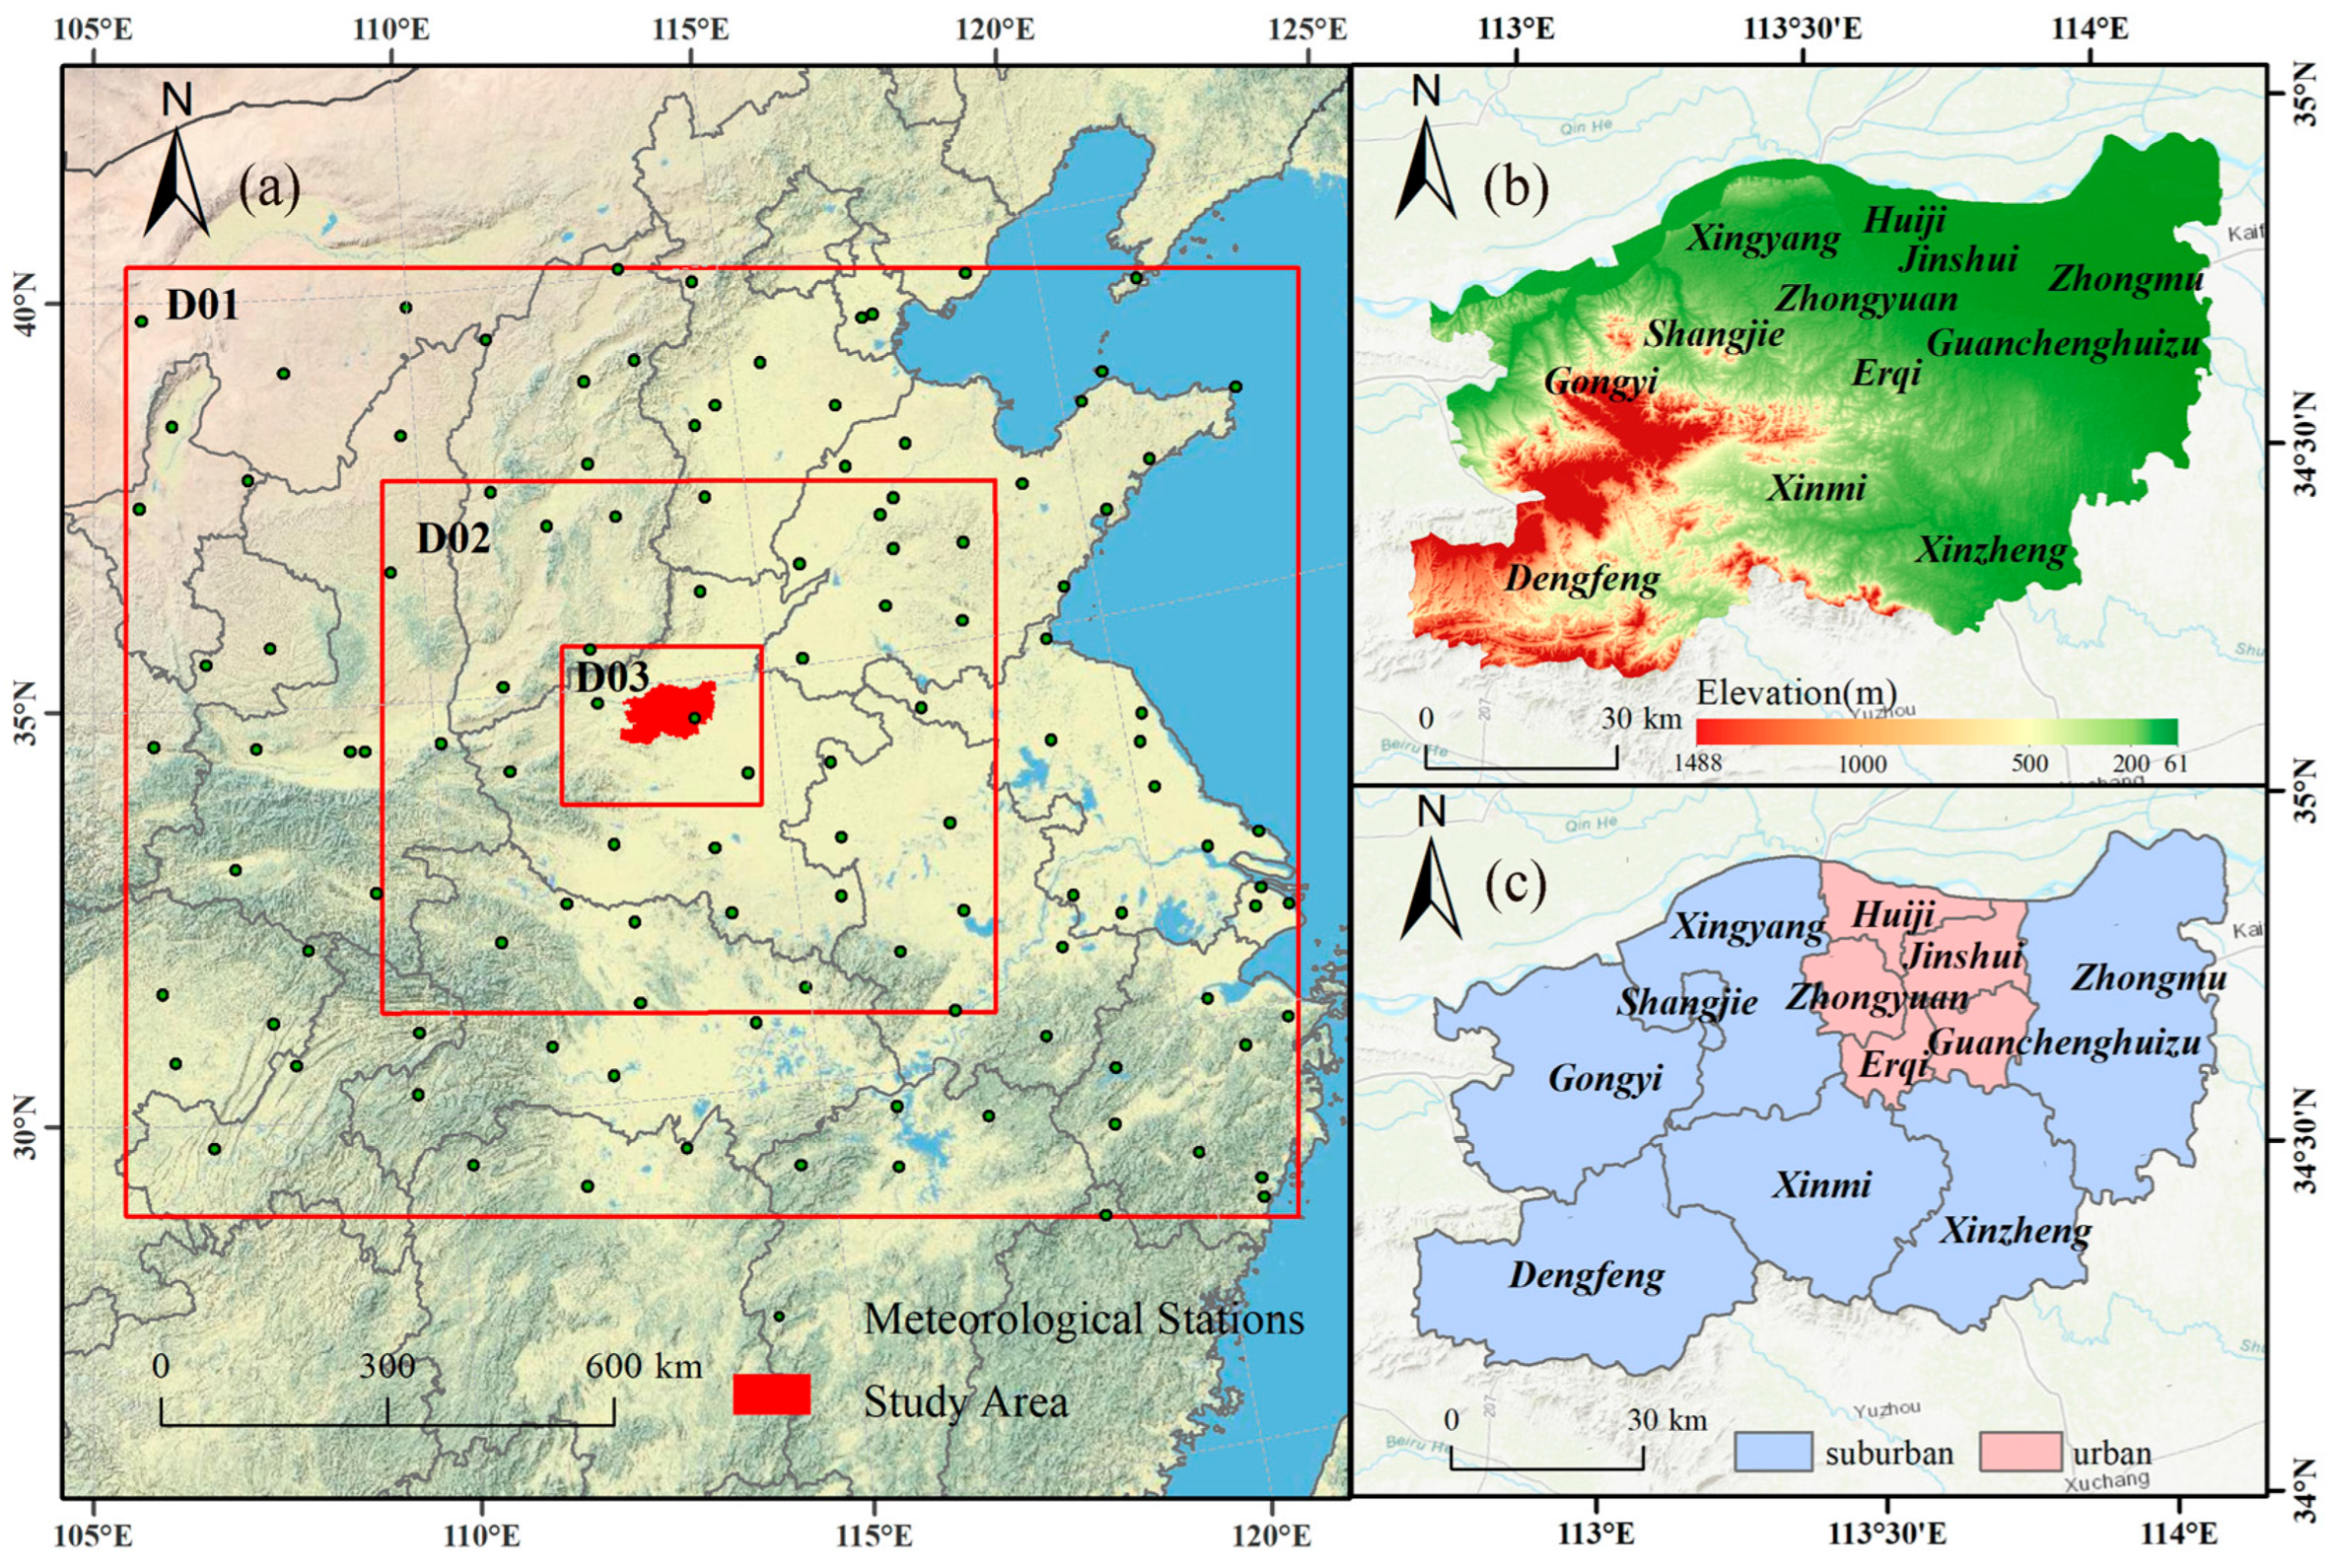
2.1. Study Area

Zhengzhou, situated in the central region of China (112°42′E–114°14′E, 34°16′N–34°58′N), serves as the capital of Henan Province and a pivotal center of the Central Plains urban agglomeration. Spanning an area of approximately 7446.2 km2, Zhengzhou comprises six municipal districts (Erqi, Zhongyuan, Shangjie, Guancheng Hui, Jinshui, and Huiji), five county-level cities (Xingyang, Gongyi, Dengfeng, Xinmi, and Xinzheng), and one county (Zhongmu). The Yellow River traverses the northern region, marking the city’s northern boundary. An overview of the study area is presented in Figure 1. At the end of 2023, Zhengzhou’s permanent population reached 13.01 million, with 10.41 million residing in urban areas and 2.60 million in rural areas, resulting in an urbanization rate of 80%, significantly exceeding the national average [29]. Future urban expansion and increased population density in the city’s downtown area further solidify Zhengzhou’s role as a key urban center in the region.

2.2. Model Setup

The numerical simulation model used in this study was the WRF model, version 3.8.1. The WRF model is a widely used mesoscale weather forecast model developed by the National Centers for Environmental Prediction (NCEP), the National Center for Atmospheric Research (NCAR), and other institutions [30,31]. Previous studies have demonstrated its ability to effectively simulate regional climates across varying spatial resolutions [32,33]. At present, the WRF model has become common in air quality, regional climate, radiative forcing, and other aspects [34,35,36,37].
In this study, the WRF model was used to simulate 2 m air temperature (T2, °C) through dynamical downscaling to obtain high-resolution temperature data at 1 km spatial resolution. The simulation employed a three nested domains configuration. All domains utilized a Lambert conformal projection centered at 34°N and 114°E. Domain1 (D01) and Domain2 (D02) featured horizontal resolutions of 25 km and 5 km, respectively, while Domain3 (D03) focused on Zhengzhou with a 1 km resolution and 201 × 136 grid points (Figure 1a).
The WRF model offers multiple configurable physical parameterization schemes that can be flexibly combined. Through extensive parameter optimization and sensitivity experiments, the parameterization schemes utilized in this study are summarized in Table 1. The initial one-week simulation was treated as a spin-up period and excluded from the analysis. Seasons were defined as follows: winter (December, January, February), spring (March, April, May), summer (June, July, August), and autumn (September, October, November).

2.3. Future Climate Scenarios

To evaluate the impact of future climate change, this study adopted the SSP framework, which integrates climate and societal trends [45,46]. SSP scenarios describe land use changes driven by societal demands for food, timber, and bioenergy, alongside population, technological, and governance developments [45,47]. Radiative forcing pathways, represented by RCPs, provide potential emission trajectories affecting Earth’s energy balance [48]. The combination of SSPs and RCPs in CMIP6 enables more nuanced scenario modeling, with projections extending to 2100 [45].
This study analyzed two SSP-RCP scenarios of SSP245 and SSP585. SSP245 combines moderate socioeconomic development (SSP2) with RCP4.5, representing a scenario of moderate radiative forcing at 4.5 Wm−2. It assumes a continuation of historical trends, moderate land use changes, and balanced greenhouse gas (GHG) emissions, reflecting a trajectory of moderate socioeconomic development and environmental impacts [49]. In contrast, SSP585 represents a highly forced future scenario, integrating SSP5 with RCP8.5, characterized by rapid fossil fuel consumption, high GHG emissions, and radiative forcing of 8.5 Wm−2 by 2100. This scenario projects significant land use changes and substantial environmental transformations driven by intensive fossil fuel usage and associated socioeconomic developments.

2.4. Experimental Design

We set up five scenarios (Table 2), so as to quantify the impact of different SSP-RCP scenarios on the future climate change in Zhengzhou. The baseline experiment used land use and cover data (LULC) for climate change from 2020 and the reanalysis data provided by the NCEP. It was mainly applied in appraisal of the imitation results of the WRF model.

2.5. Datasets

Surface data in the baseline scenario were sourced from the European Space Agency (ESA) via the WRF repository, including land use types, surface albedo, vegetation characteristics, and water body coverage.
Future LULC was obtained from the global land forecast dataset by Chen [50]. This dataset employed the future land use simulation (FLUS) model to simulate LULC in future SSP-RCP scenarios through the land use constraints provided by CMIP6. It covered the period from 2015 to 2100 with 20 land use types and a resolution of 1 km.
Future climate data was acquired from the CMIP6 global dataset by Xu [51]. This dataset is based on 18 models in CMIP6 and the European Center for Medium-range Weather Forecasts (ERA5) dataset after deviation correction. It covers both historical (1979–2014) and future (2015–2100) periods with a spatial resolution of 1.25° × 1.25° and a 6-hour temporal interval.
Observational data (OBS) used to verify the temperature simulated by WRF is hourly station observation data supplied by the National Oceanic and Atmospheric Administration (NOAA).

2.6. Method of Model Evaluation

A total of 116, 37, and 4 surface meteorological stations (Figure 1a) were used for validation in Domains D01, D02, and D03, respectively. Five statistical indicators were used to assess model performance: mean bias (MB), normalized mean bias (NMB), normalized mean error (NME), root mean square error (RMSE), and correlation coefficient (R). Their formulations refer to Song [52] are as follows:
M B =   1 n i = 1 n S i O i
N M B = i = 1 n S i O i i = 1 n O i × 100 %
N M E = i = 1 n S i O i i = 1 n O i × 100 %
R S M E = 1 n i = 1 n S i O i 2
R = i = 1 n S i S ¯ O i O ¯ i = 1 n S i S ¯ 2 O i O ¯ 2
In the above formulas, S i is the simulated value from the WRF model; O i represents the corresponding observed value; S ¯ and O ¯ are the mean values of the simulated and observed data, respectively; and n is the total number of samples.

3. Results

3.1. Model Performance

The model’s performance in simulating near-surface air temperature was assessed at both annual and seasonal scales, with evaluation results summarized in Table 3 and Table 4. At the annual scale (Table 3), the WRF model exhibits strong agreement with observations across all three nested domains. Notably, the innermost domain (D03), which focused on the urban core at a fine spatial resolution of 1 km, demonstrated the highest accuracy among the three. Specifically, the MB for D03 is only 0.08 °C, indicating minimal systematic error. The NMB and NME are 0.50% and 10.27%, respectively, suggesting that the model captures the overall magnitude of temperature with low relative deviation. The RMSE remains at a reasonable level of 2.11 °C, while the correlation coefficient reaches 0.98, implying excellent temporal consistency between the simulated and observed temperature patterns.
Seasonal validation for D03 further confirms the model’s robustness in capturing intra-annual temperature variability (Table 4). Across all seasons, correlation coefficients remain above 0.87, with the highest values in spring (0.95) and autumn (0.97), reflecting strong agreement in transitional seasons. Although the performance in summer shows a slightly lower correlation (R = 0.87), the RMSE remains acceptable at 2.25 °C and the NME is only 6.98%, indicating that the model still reproduces daily variations reasonably well despite the challenges posed by intense radiative forcing and higher atmospheric instability in this season. Overall, these results demonstrate that the WRF model performs well in reproducing both the annual mean state and the seasonal dynamics of near-surface air temperature in the study area.
In the innermost domain (D03, 1 km resolution), T2 was validated using four surface meteorological stations with reliable and continuous hourly observations. These were the only stations within the domain for which such data were accessible, due to limitations in the availability of other datasets. Although the number of stations is limited, their spatial distribution spans key urban, suburban, and transitional areas, offering a reasonable and representative foundation for evaluating model performance.

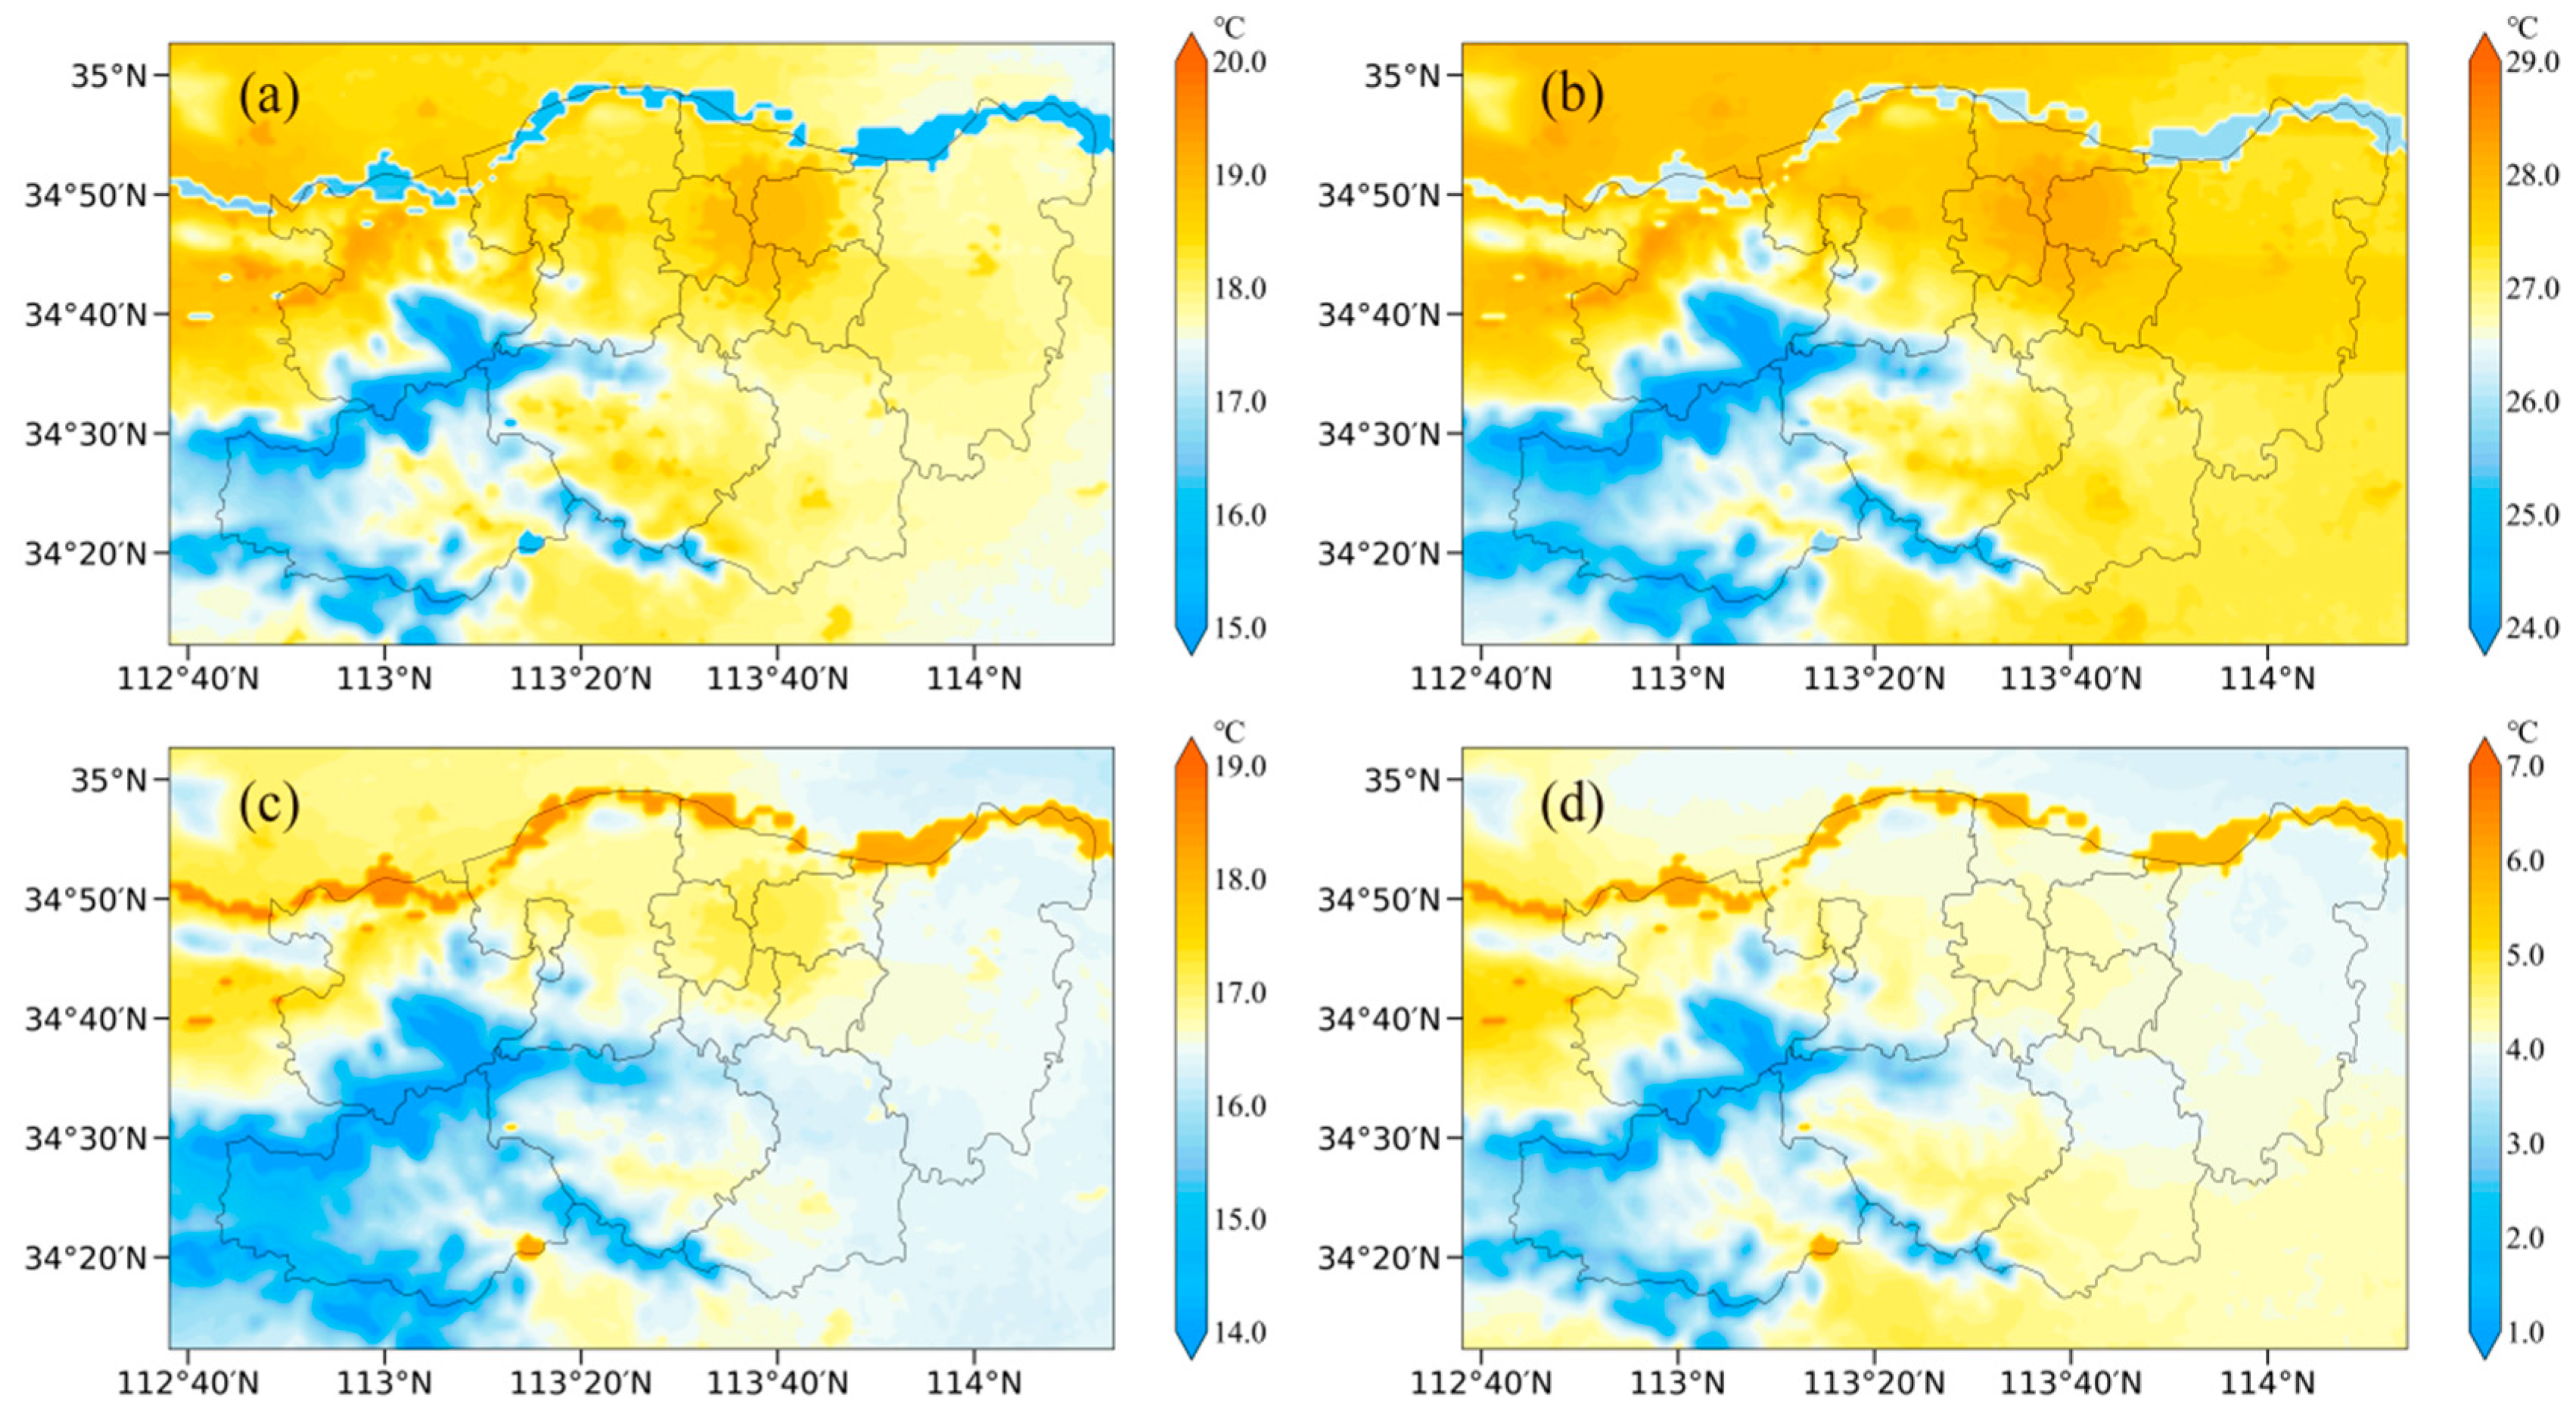
3.2. Spatial and Seasonal Variations in Temperature

Figure 2 shows the average seasonal temperatures in Zhengzhou for 2020. Overall, the average temperature of the four seasons has a similar spatial distribution pattern. Notably, during spring, summer, and autumn seasons, distinct high-temperature zones emerged in the northern Erqi District, eastern Zhongyuan District, northwestern Guancheng Hui District, western Jinshui District, and southern Huiji District. By contrast, the southwestern region consistently exhibited lower temperatures in all seasons due to its mountainous terrain. Along the northern Yellow River boundary, the water’s higher specific heat capacity created a linear temperature belt, contrasting with the overall temperature pattern each season.
Under the SSP245 scenario (Figure 3), the 2030 and 2060 temperature distributions in Zhengzhou largely mirror the spatial patterns of 2020, albeit with generally higher temperatures in 2060. The same high-temperature zones persist in each season, and the southwestern region remains cooler. Meanwhile, the Yellow River basin continues to display a distinct thermal contrast, similar to 2020. Across all seasons, urban areas of Zhengzhou exhibited significantly elevated temperatures compared to adjacent non-urban regions, unequivocally indicating the presence of a pronounced UHI effect characterized by sustained thermal disparities between built-up and rural zones.
Under the SSP585 scenario (Figure 4), temperatures in 2060 exceed those in 2030 across all seasons, with high-temperature zones persisting in the same urban areas. This effect is particularly pronounced during the summer of 2030, where notable warming is observed. Additionally, an anomalously high-temperature region emerges in western Gongyi during the summer months of both 2030 and 2060. Consistent with historical patterns, the southwestern mountainous region remains a thermal anomaly, characterized by consistently lower temperatures due to its topographic features. Similarly, the Yellow River basin retains its distinct thermal gradient, with contrasting temperatures between river-adjacent and inland zones, driven by the river’s high specific heat capacity. Under the high-emission SSP585 scenario, Zhengzhou demonstrates a pronounced UHI effect, marked by intensified thermal contrasts between urban cores and suburban areas.

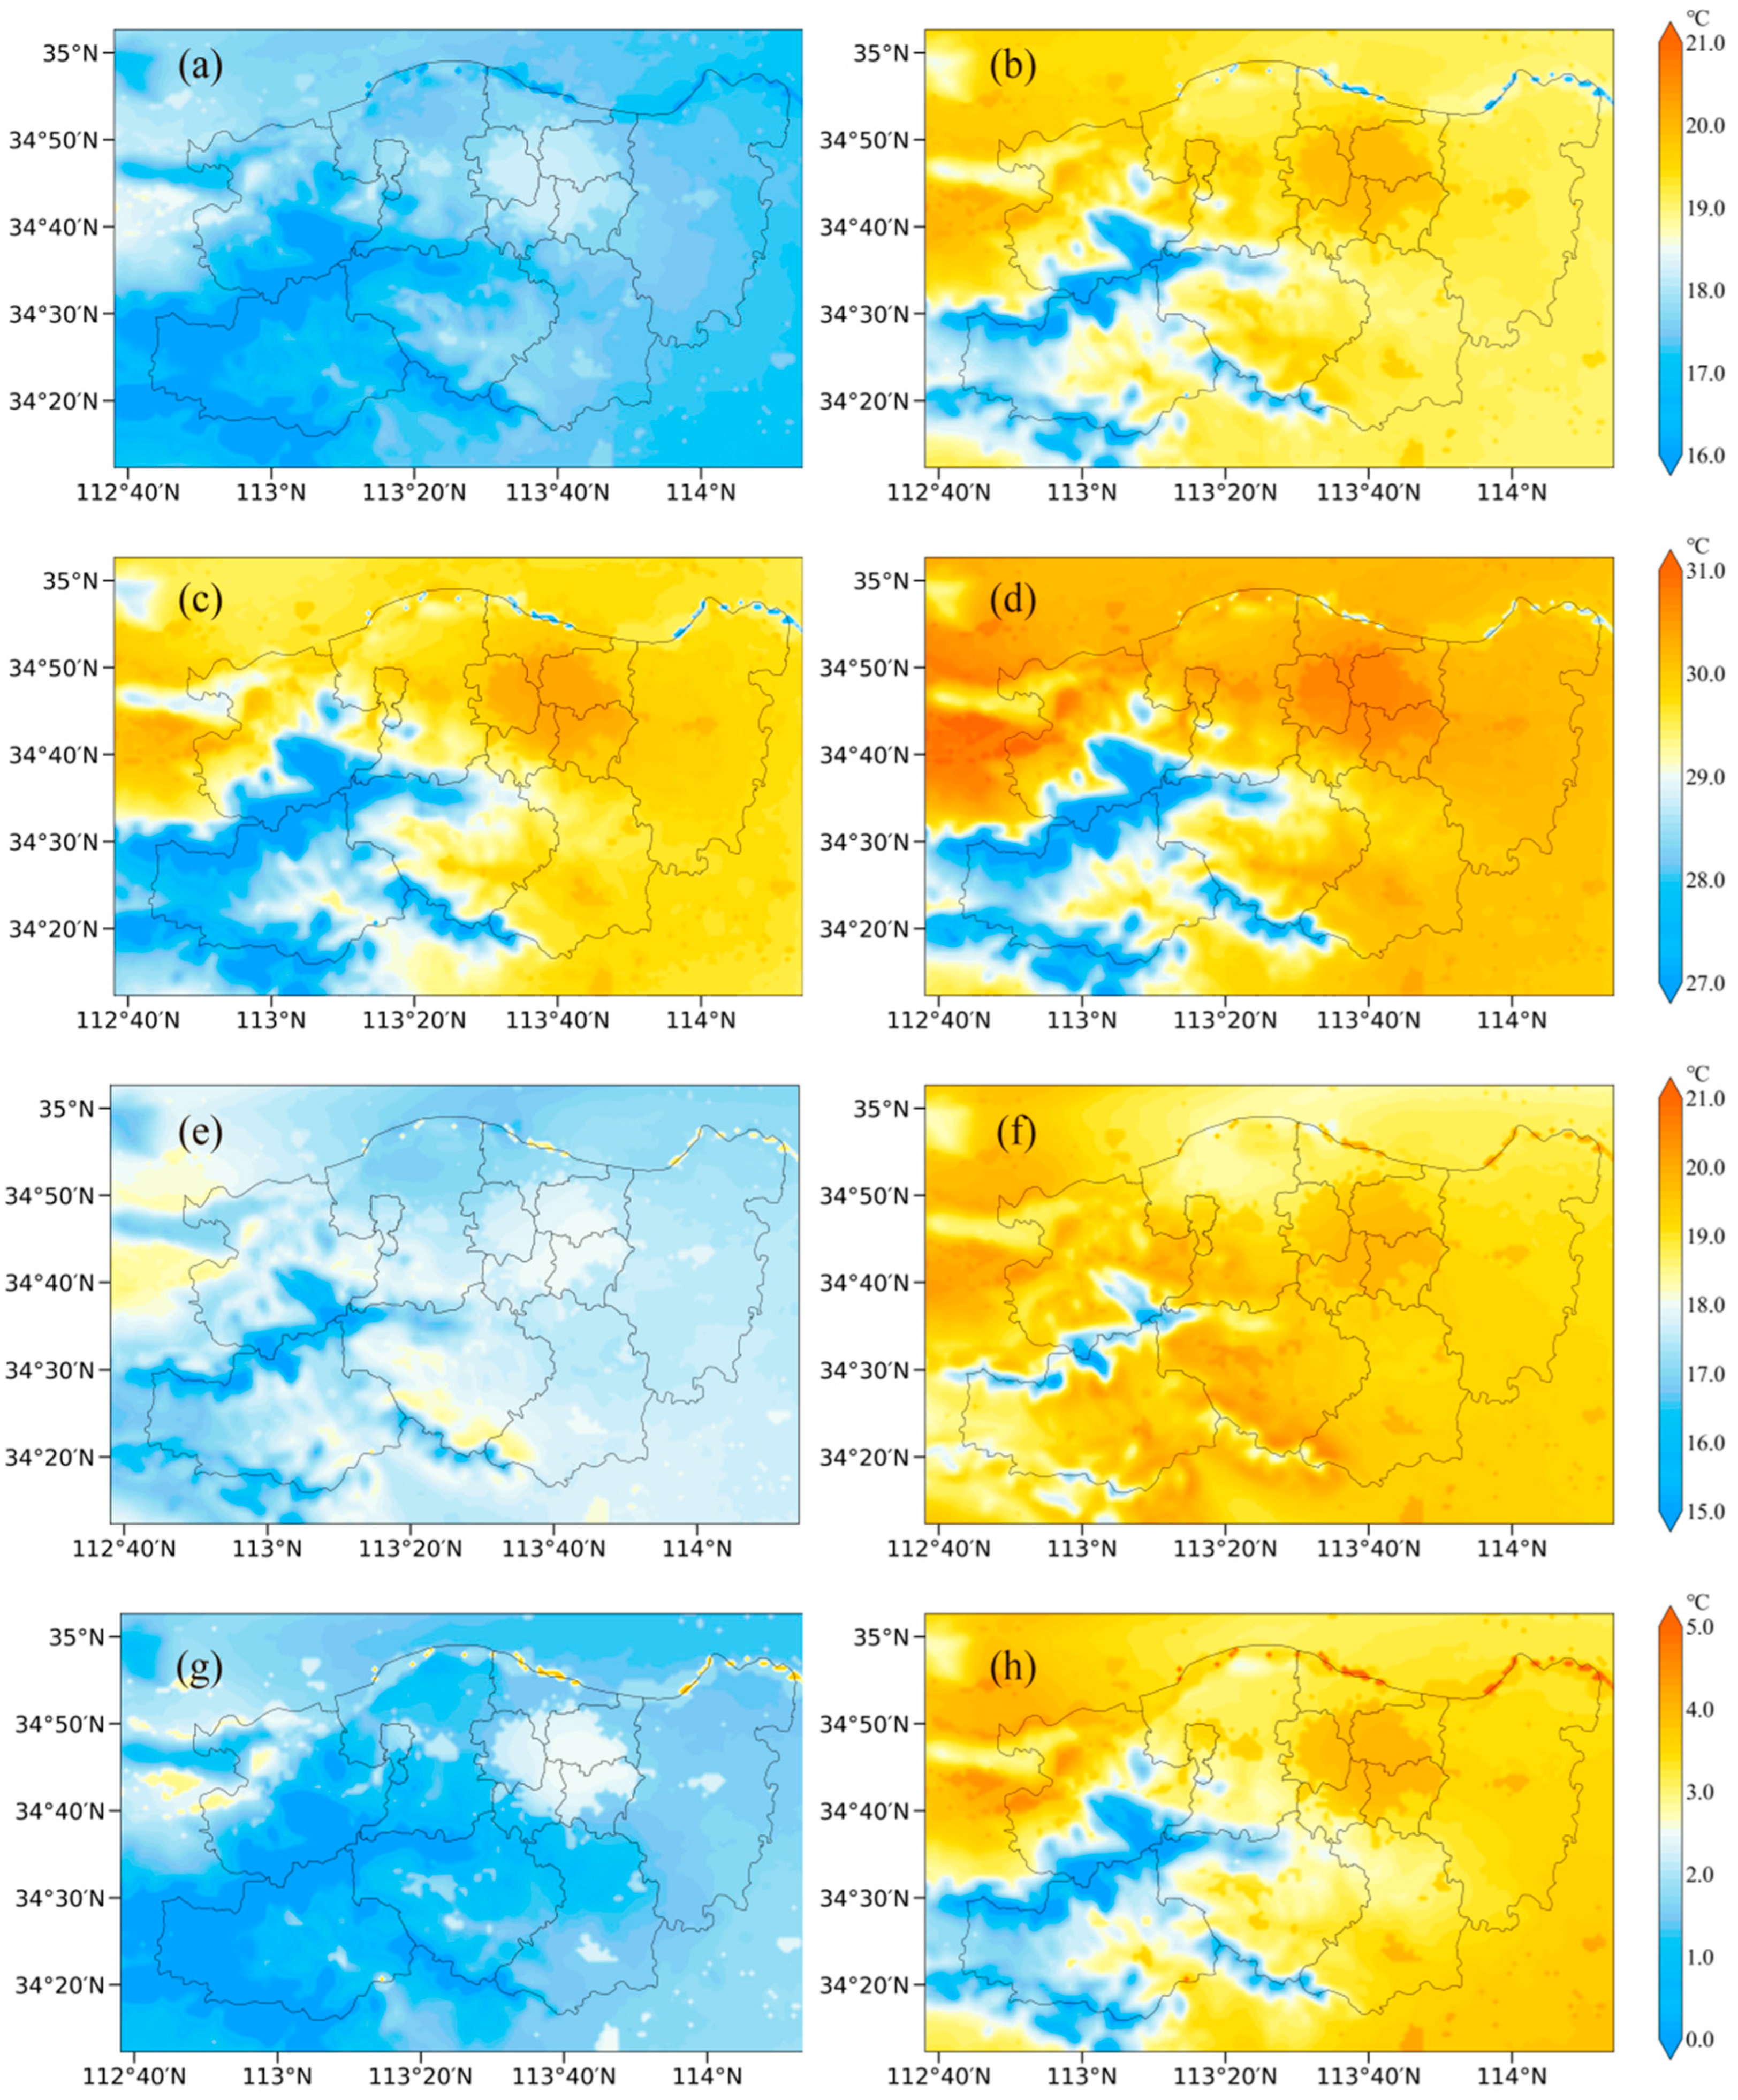
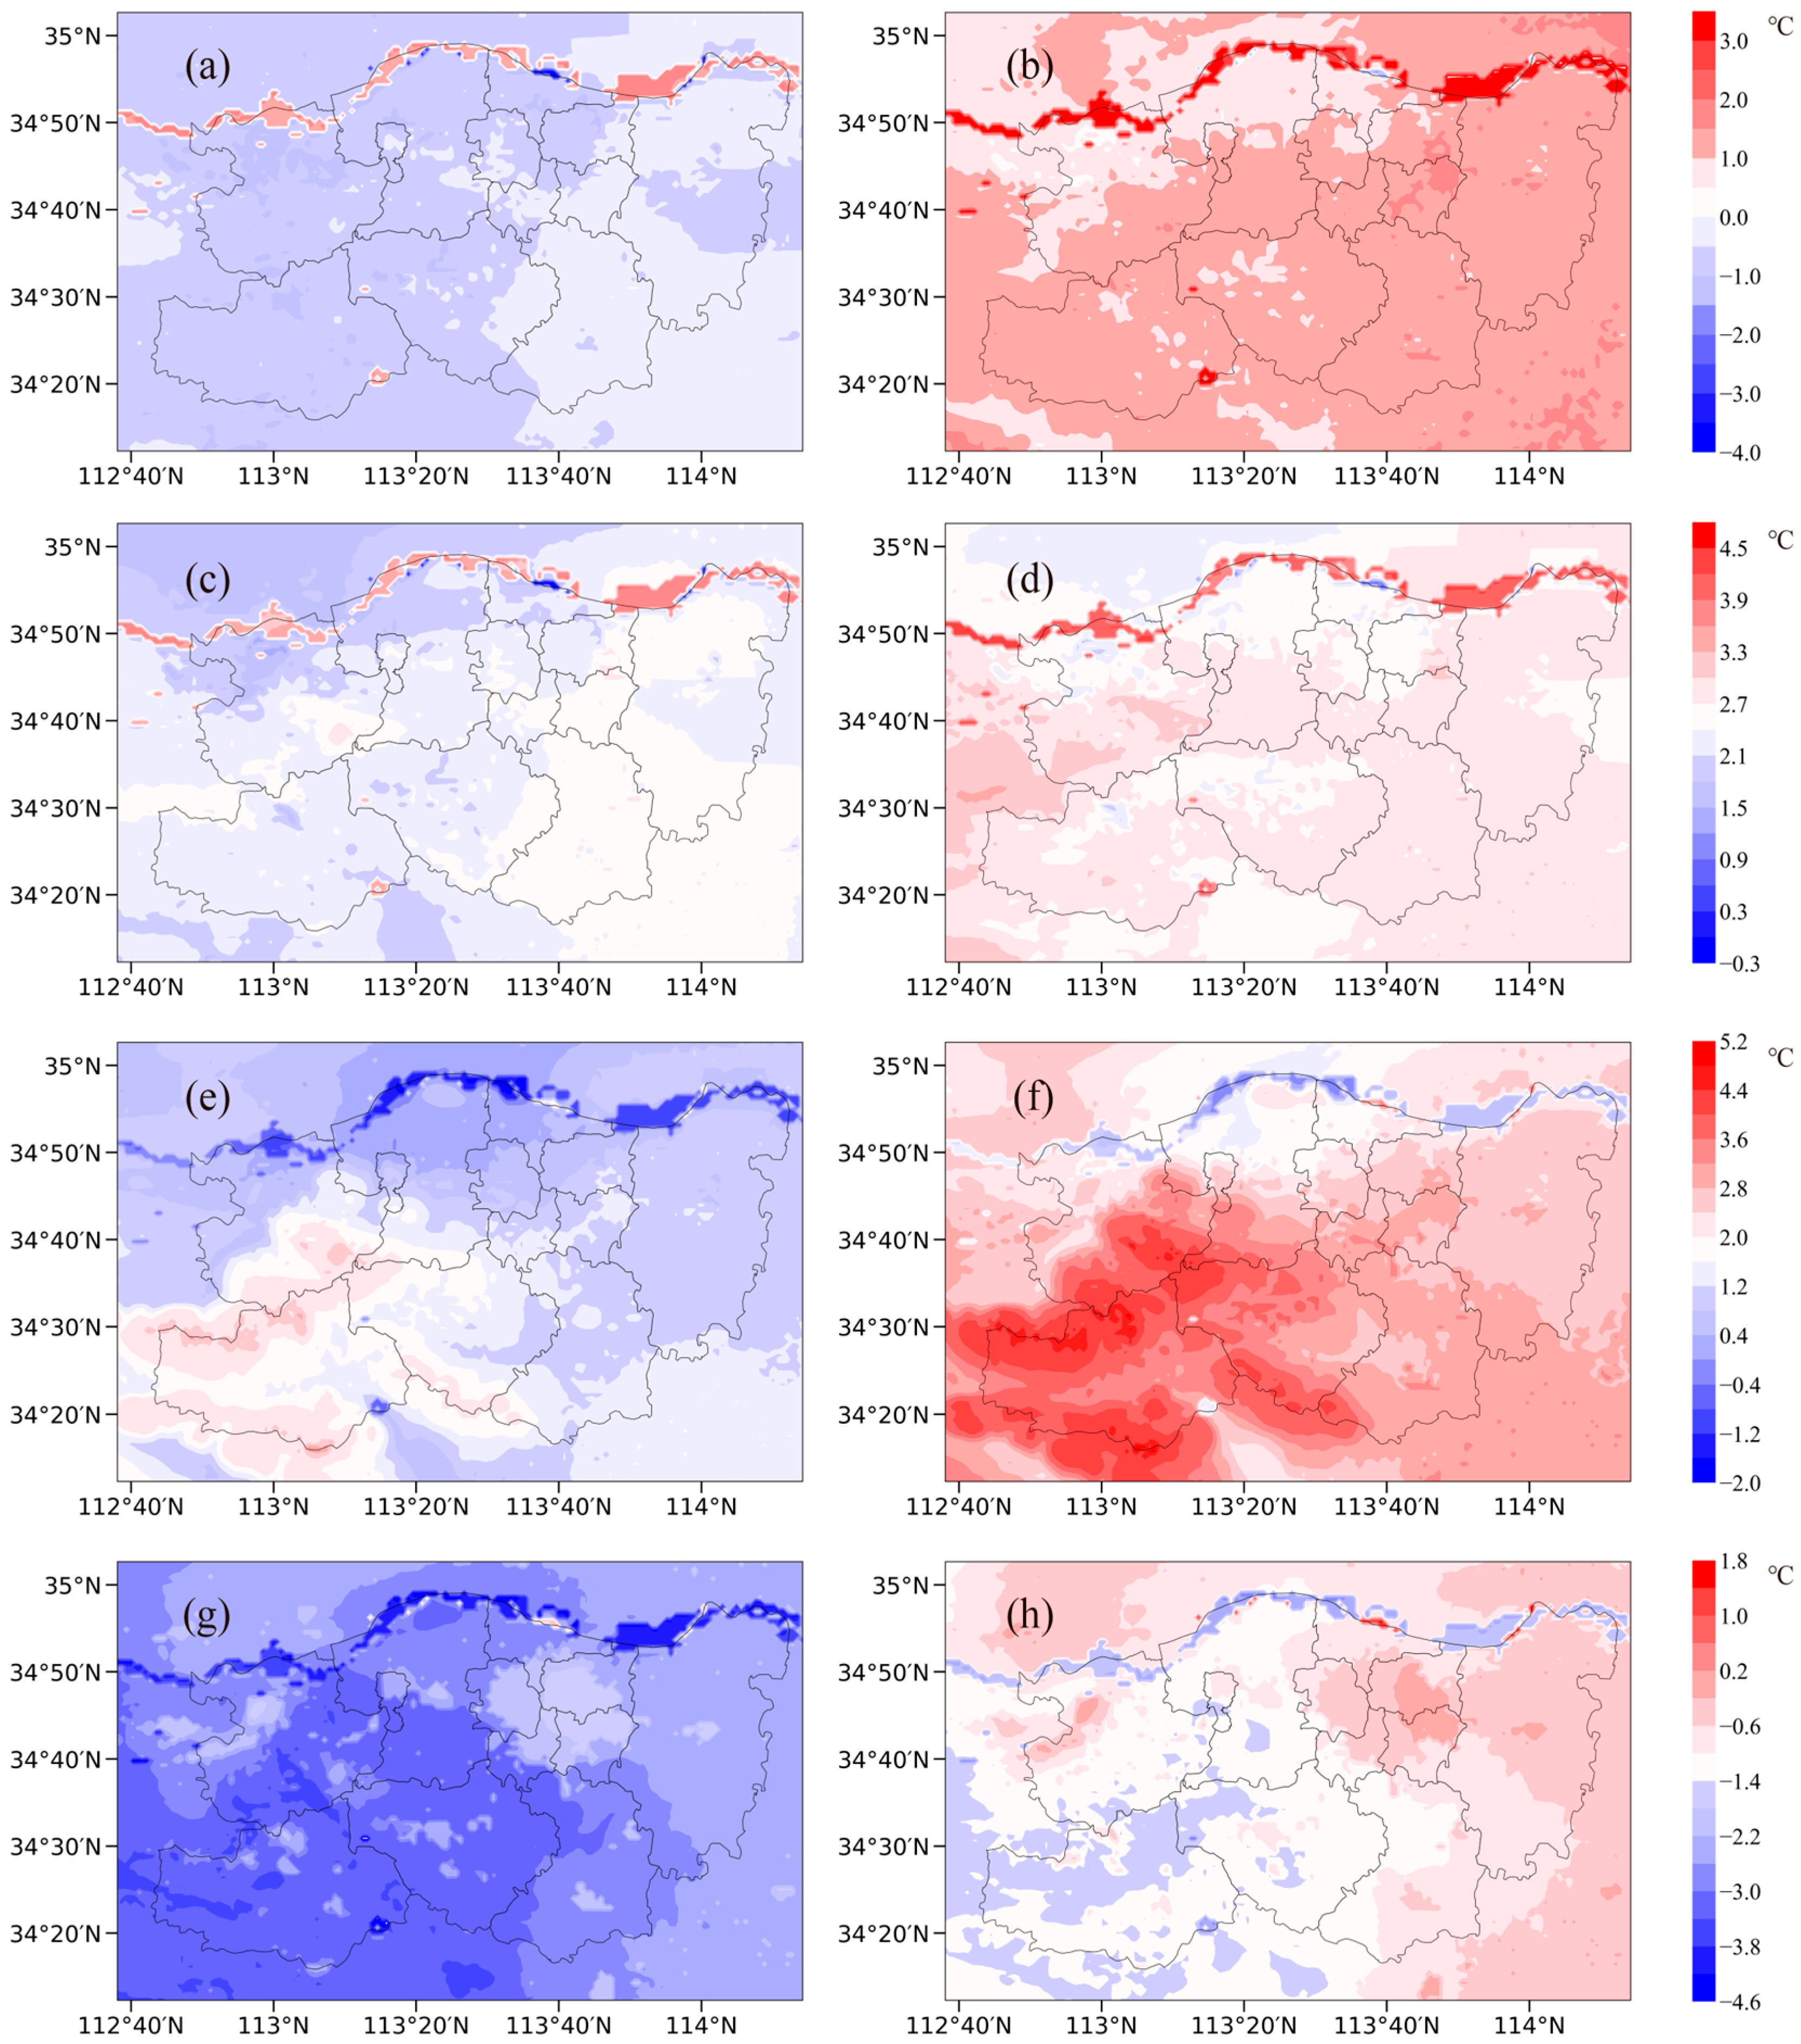
3.3. Temperature Changes Under SSP Scenarios

Figure 5 shows the average seasonal temperature differences under the SSP245 scenario in Zhengzhou between 2030 and 2020, as well as 2060 and 2020. Temperature changes in 2060 are more pronounced than in 2030, with a consistent spatial distribution of differences across both years. The northern Yellow River region experiences more significant temperature changes than other areas in all seasons. Most of Zhengzhou shows a warming trend in spring and summer, while autumn temperatures rise across the city, except for parts of the northern Yellow River basin. The southwestern regions, including Dengfeng and its borders with Gongyi and Xinmi, show greater warming due to their complex topography. In contrast, winter temperatures in both 2030 and 2060 decrease relative to 2020, with the most notable cooling in the southwestern regions. These variations are likely influenced by enhanced radiative cooling and inversion effects. Overall, the SSP245 scenario leads to an expanded seasonal temperature range, with hotter summers and colder winters.
Under the SSP585 scenario (Figure 6), temperature changes exhibit similar spatial patterns but with generally larger magnitudes than under SSP245. In spring, temperatures in 2030 rise in the northern Yellow River region while declining in the western and central areas, whereas by 2060, nearly the entire city shows a warming trend. Summer warming is more pronounced in southern Zhengzhou compared to the north, with the northern Yellow River basin exhibiting an opposite trend where it cools in 2030 but warms in 2060. Autumn warming in 2030 is minimal overall, whereas northwest Zhengzhou experiences more pronounced warming by 2060. In winter, northern Zhengzhou experiences cooling in 2030 while the southwest shows warming, with these patterns becoming even more pronounced by 2060. Hence, under SSP585, more substantial temperature increases occur in 2060 compared to 2030, showing marked seasonal variations.

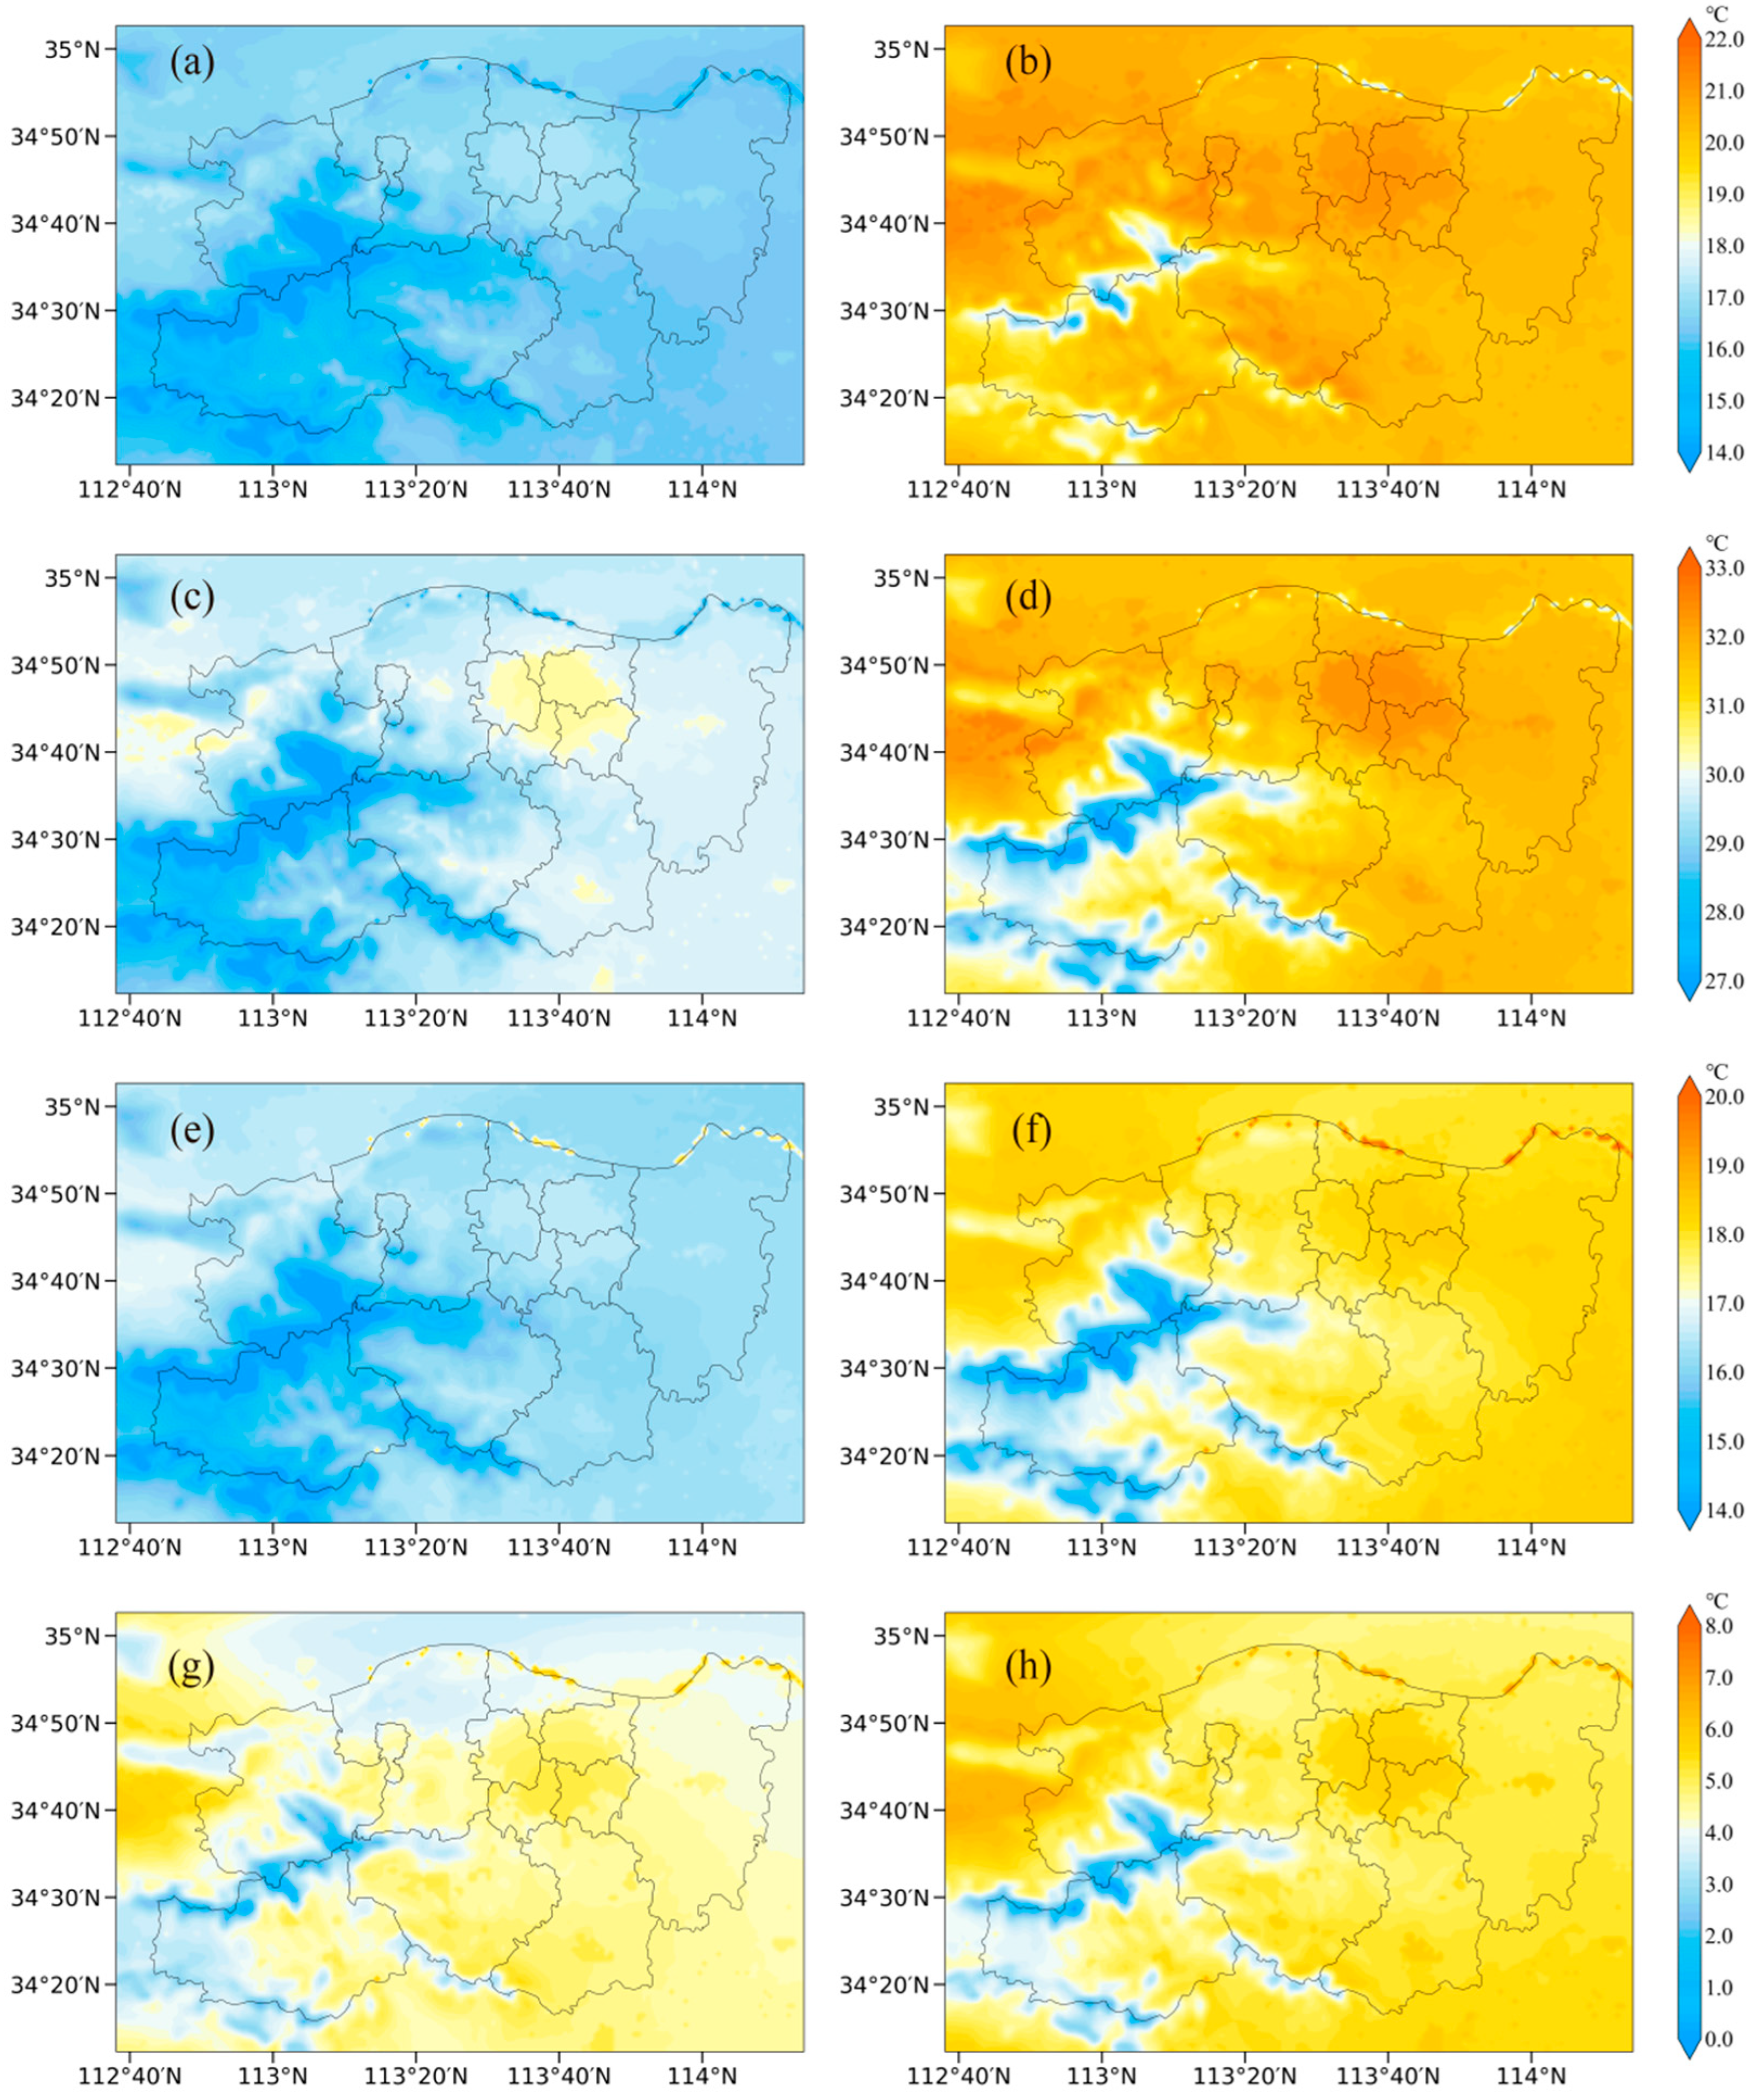
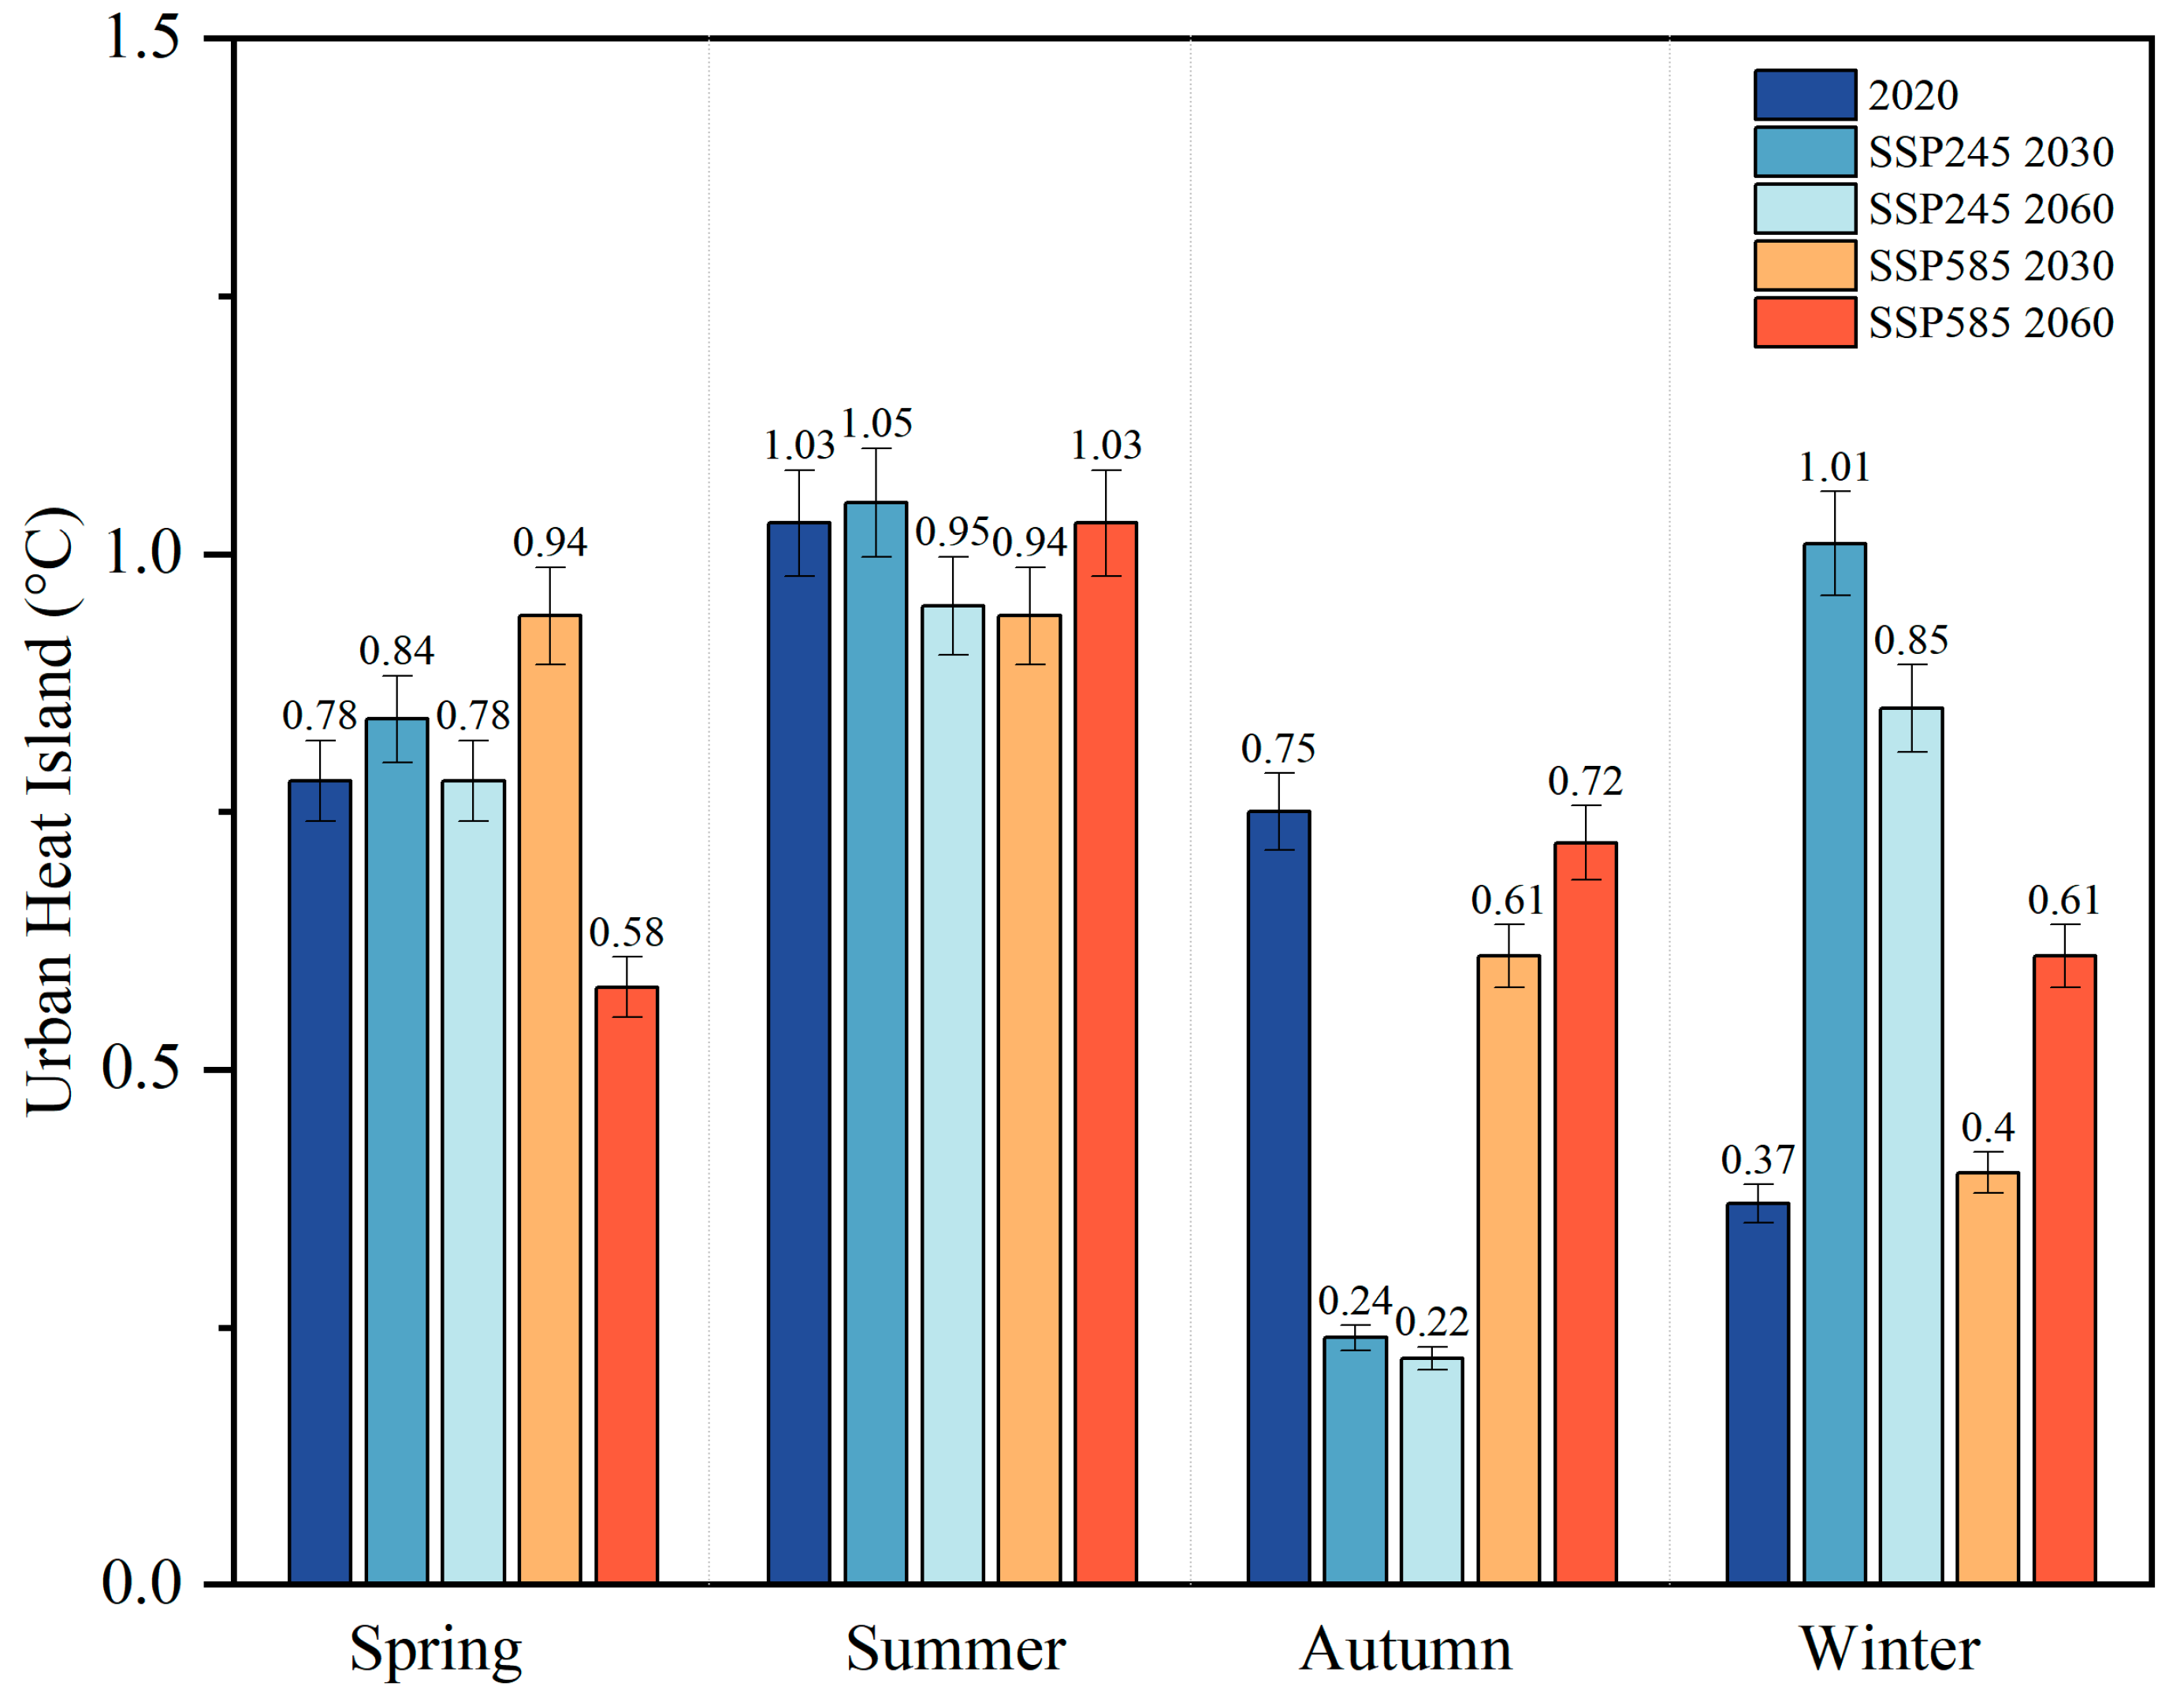
3.4. Impact of Future Climate on the UHI Effect

The UHI intensity was quantified as the temperature differential between urban and suburban zones (Table 5) calculated by Equation (6). The urban core of Zhengzhou comprises Huiji, Jinshui, Guancheng Hui, Erqi, and Zhongyuan Districts, while the surrounding districts and counties are classified as suburban areas. The spatial demarcation of these areas in Zhengzhou is illustrated in Figure 1c.
U H I = T u r b a n T s u b u r b a n  
In the above formula, T u r b a n represents the average temperature of the urban areas, while T s u b u r b a n represents the average temperature in the suburban areas.
Figure 7 illustrates the seasonal UHI effects in Zhengzhou for 2030 and 2060 under the 2020 baseline and two future scenarios, SSP245 and SSP585. The results revealed notable seasonal variations in UHI effects. Changes in spring and summer are relatively minor, UHI in 2030 has increased compared to 2020 under two scenarios in spring, and summer consistently shows the most pronounced UHI effects across all scenarios and years due to the concentration of heat retention in urban areas. In contrast, autumn UHI intensity under both scenarios showed significant decreases in 2030 and 2060 compared to 2020 baseline levels. The reduction was particularly significant under SSP245, with UHI values declining from 0.24 °C in 2030 to 0.22 °C in 2060. This reduction is attributed to a more significant temperature increase in the southwestern suburban regions compared to the urban area, resulting in suburban temperatures exceeding those in urban areas. Consequently, the temperature gradient narrows, leading to a downward trend in autumn UHI under SSP245. In winter, the UHI in 2030 and 2060 under two scenarios has increased compared to 2020 as cooling in peripheral zones exceeds that of urban centers. Notably, UHI intensification was more pronounced under the SSP245 scenario, with projected values reaching 1.01 °C in 2030 and 0.85 °C in 2060. Overall, the SSP245 scenario projects a reduction in UHI intensity from 2030 to 2060, aligning with China’s climate targets of carbon peaking by 2030 and carbon neutrality by 2060. In contrast, under the SSP585 scenario, UHI intensification persists across multiple seasons, with summer, autumn, and winter in 2060 exhibiting stronger heat island effects compared to 2030 levels except for spring.

4. Discussion

Our high-resolution simulations revealed clear seasonal and spatial variations in Zhengzhou’s UHI under the SSP245 and SSP585 scenarios. In each scenario, the UHI is consistently high in summer, driven by reduced evapotranspiration, strong solar radiation, and the thermal properties of urban surfaces [53]. In contrast, autumn UHI declines under both scenarios as suburban warming reduces the urban–rural temperature gap, while it remains higher under the SSP585 scenario. Notably, UHI increases significantly in winter by 2060 and in spring by 2030 under the SSP585 scenario, driven by stronger rural cooling, urban thermal inertia, and sustained anthropogenic heat. These patterns suggest that UHI may become a year-round issue under high-emission conditions. These results underscore the importance of fine-scale climate modeling and highlight the vulnerability of rapidly urbanizing regions to seasonally shifting temperature extremes.
These findings align with previous modeling and observational studies indicating that rapid urbanization and global warming act synergistically to amplify UHI phenomena [8]. Similarly to Barkhordarian [54], we observed that greenhouse gas forcing scenarios induce differentiated warming patterns across seasons and land surfaces, emphasizing the need to incorporate local-scale processes. The distinct signatures of UHI during the transitional seasons echo observations by Kotharkar [55], who underscored the pivotal role of urban morphology and surface characteristics. Furthermore, our conclusion that higher emissions (SSP585) substantially exacerbate intra-urban temperature disparities aligns with the global multi-decadal urban heating trends documented by Zhao [16] and broader climate projections reported by the IPCC [56]. It is important to note that our model incorporates both future climate change and land use projections under each SSP scenario. Therefore, the amplified intra-urban temperature differences reflect the combined effects of intensified greenhouse gas forcing and urban land expansion. A detailed separation of the relative contributions of land use change versus emission-driven climate change is beyond the current scope but represents an important direction for future research.
The southwestern mountainous regions of Zhengzhou and the riverine areas along the Yellow River exhibit particularly strong spatial gradients under both scenarios. Complex terrain can enhance radiative cooling at night, while the presence of water bodies moderate temperature extremes [57]. These local effects occasionally offset the broader warming trend or even invert expected urban–rural temperature differentials in certain seasons. The findings mirrored earlier observations that topographically diverse urban areas can display large temperature contrasts at fine spatial scales [58]. Additionally, the interplay between topographic features and rising greenhouse gas emissions suggests that mountainous suburbs and low-lying regions experience heterogeneous warming patterns, emphasizing the need for localized adaptation approaches [45].
Given the projected intensification of UHI, especially under SSP585, adopting targeted mitigation measures is imperative. Increasing vegetative cover, promoting urban greening, and strategically positioning water bodies can help moderate high summer temperatures [59]. Urban design guidelines should also account for topographic variations, ensuring that mountainous and river-adjacent zones maintain sufficient green infrastructure to alleviate potential heat risks. As winter UHIs also intensify—partly due to stronger suburban radiative cooling—energy demand for heating could rise, highlighting the potential co-benefits of improved building insulation and clean energy sources [60]. Moreover, land use policies that prevent overdevelopment in topographically sensitive areas could reduce temperature inversions and mitigate adverse health impacts [61].
In this study, UHI intensity is calculated as the temperature difference between urban and suburban–rural grid cells within the same domain. Because both temperature series are subject to identical synoptic forcing, inter-annual climate variability influences them equally and is effectively removed by differencing. Consequently, the UHI patterns presented here primarily represent the thermal impact of urban land cover and anthropogenic heat, rather than background climatic fluctuations.
This study primarily focused on the UHI effect at seasonal scales, without delving into the notable differences between day and night. However, it is well established that the nighttime UHI effect is typically more pronounced due to the high heat capacity of urban areas [62,63]. Additionally, the role of energy sources, such as wind, in modulating UHI intensity was not included in our analyses. Previous studies have demonstrated that wind speed influences local climate by facilitating heat diffusion, with low wind speeds in densely built-up areas potentially amplifying the UHI effect [64,65]. Future studies should incorporate diurnal variations, wind energy dynamics, and other energy consumption factors to better understand the mechanisms driving UHI formation and to optimize regulatory strategies.

5. Conclusions

In this study, we simulated future temperature patterns in Zhengzhou under the SSP245 and SSP585 scenarios for 2030 and 2060 using the WRF model and quantified the impact of UHI on future climate change. The results revealed pronounced seasonal and spatial variations in the UHI effect for both 2030 and 2060. Summer consistently exhibits the strongest UHI, driven by the thermal properties of dense built-up areas and limited evapotranspiration, whereas autumn under SSP245 displays a reduced urban–rural temperature gradient due to higher suburban warming. In winter, UHI intensification becomes evident as cooling in peripheral zones exceeds that of urban centers. These findings underscore the need for targeted climate adaptation, including expanded green infrastructure, reduced impervious surfaces, and enhanced energy-efficient building design.

Author Contributions

X.N.: Writing—Original Draft, Data Curation, and Visualization; Y.C.: Writing—Original Draft, Visualization, and Software; T.B.: Investigation and Formal Analysis; P.L.: Writing—Review and Editing and Resources; H.S.: Writing—Review and Editing and Funding Acquisition; M.J.: Supervision and Editing; F.W.: Supervision and Project administration. All authors have read and agreed to the published version of the manuscript.

Funding

This study was funded by the Natural Science Foundation of Henan Province, China (252300420830, 242300421143), as well as the Technological Innovation Talents in Henan Higher Education Institutions of China (24HASTIT016).

Data Availability Statement

The original contributions presented in this study are included in the article. Further inquiries can be directed to the corresponding author.

Conflicts of Interest

The authors declare no conflicts of interest.

References

  1. Diem, P.K.; Nguyen, C.T.; Diem, N.K.; Diep, N.T.H.; Thao, P.T.B.; Hong, T.G.; Phan, T.N. Remote sensing for urban heat island research: Progress, current issues, and perspectives. Remote Sens. Appl. Soc. Environ. 2024, 33, 101081. [Google Scholar] [CrossRef]
  2. Elnabawi, M.H.; Raveendran, R. Meta-pragmatic investigation of passive strategies from ‘UHI– climatology’ nexus perspective with digital twin as assessment mechanism. J. Urban Manag. 2024, 13, 332–356. [Google Scholar] [CrossRef]
  3. Xu, X.; Dong, Q.; Zhen, M. Assessing effects of future climate change on outdoor thermal stress and building energy performance in severe cold region of China. Build. Environ. 2024, 251, 111236. [Google Scholar] [CrossRef]
  4. Xu, D.; Wang, Y.; Zhou, D.; Wang, Y.; Zhang, Q.; Yang, Y. Influences of urban spatial factors on surface urban heat island effect and its spatial heterogeneity: A case study of Xi’an. Build. Environ. 2024, 248, 111072. [Google Scholar] [CrossRef]
  5. Zhong, Y.; Li, S.; Liang, X.; Guan, Q. Causal inference of urban heat island effect and its spatial heterogeneity: A case study of Wuhan, China. Sustain. Cities Soc. 2024, 115, 105850. [Google Scholar] [CrossRef]
  6. Alexander, C. Influence of the proportion, height and proximity of vegetation and buildings on urban land surface temperature. Int. J. Appl. Earth Obs. Geoinf. 2021, 95, 102265. [Google Scholar] [CrossRef]
  7. Gao, Y.; Zhao, J.; Yu, K. Effects of block morphology on the surface thermal environment and the corresponding planning strategy using the geographically weighted regression model. Build. Environ. 2022, 216, 109037. [Google Scholar] [CrossRef]
  8. Deilami, K.; Kamruzzaman, M.; Liu, Y. Urban heat island effect: A systematic review of spatio-temporal factors, data, methods, and mitigation measures. Int. J. Appl. Earth Obs. Geoinf. 2018, 67, 30–42. [Google Scholar] [CrossRef]
  9. Kwok, Y.T.; Ng, E.Y.Y. Trends, topics, and lessons learnt from real case studies using mesoscale atmospheric models for urban climate applications in 2000–2019. Urban Clim. 2021, 36, 100785. [Google Scholar] [CrossRef]
  10. Sahoo, S.; Majumder, A.; Swain, S.; Gareema; Pateriya, B.; Al-Ansari, N. Analysis of Decadal Land Use Changes and Its Impacts on Urban Heat Island (UHI) Using Remote Sensing-Based Approach: A Smart City Perspective. Sustainability 2022, 14, 11892. [Google Scholar] [CrossRef]
  11. Zhou, D.; Sun, S.; Li, Y.; Zhang, L.; Huang, L. A multi-perspective study of atmospheric urban heat island effect in China based on national meteorological observations: Facts and uncertainties. Sci. Total Environ. 2023, 854, 158638. [Google Scholar] [CrossRef]
  12. Morris, C.J.G.; Simmonds, I.; Plummer, N. Quantification of the influences of wind and cloud on the nocturnal urban heat island of a large city. J. Appl. Meteorol. 2001, 40, 169–182. [Google Scholar] [CrossRef]
  13. Zhou, D.; Xiao, J.; Bonafoni, S.; Berger, C.; Deilami, K.; Zhou, Y.; Frolking, S.; Yao, R.; Qiao, Z.; Sobrino, J.A. Satellite Remote Sensing of Surface Urban Heat Islands: Progress, Challenges, and Perspectives. Remote Sens. 2019, 11, 48. [Google Scholar] [CrossRef]
  14. Liang, K.; Ren, X.; Zhang, Y.; Liu, W.; Li, H. Analysis of urban heat island and land cover spatiotemporal changes in the Pearl River Delta urban agglomeration. Geospat. Inf. 2022, 20, 36–40. [Google Scholar] [CrossRef]
  15. Michau, Y.; Lemonsu, A.; Lucas-Picher, P.; Caillaud, C. Evaluation of the Urban Heat Island of 12 cities of France in a high-resolution regional climate model simulation. Urban Clim. 2023, 47, 101386. [Google Scholar] [CrossRef]
  16. Zhao, Y.; Zhong, L.; Ma, Y.; Fu, Y.; Chen, M.; Ma, W.; Zhao, C.; Huang, Z.; Zhou, K. WRF/UCM simulations of the impacts of urban expansion and future climate change on atmospheric thermal environment in a Chinese megacity. Clim. Change 2021, 169, 38. [Google Scholar] [CrossRef]
  17. Schwingshackl, C.; Daloz, A.S.; Iles, C.; Aunan, K.; Sillmann, J. High-resolution projections of ambient heat for major European cities using different heat metrics. Nat. Hazards Earth Syst. Sci. 2024, 24, 331–354. [Google Scholar] [CrossRef]
  18. Ilhamsyah, Y. A Mesoscale Meteorological Model of Modified Land Cover to the Effect of Urban Heat Island in Jakarta, Indonesia. Aceh Int. J. Sci. Technol. 2012, 1, 60–66. [Google Scholar] [CrossRef]
  19. He, Y.; Yuan, C.; Ren, C.; Wang, W.; Shi, Y.; Ng, E. Urban ventilation assessment with improved vertical wind profile in high-density cities—Investigations in nighttime extreme heat. Build. Environ. 2022, 216, 109018. [Google Scholar] [CrossRef]
  20. Park, K.; Baik, J.-J.; Jin, H.-G.; Tabassum, A. Changes in urban heat island intensity with background temperature and humidity and their associations with near-surface thermodynamic processes. Urban Clim. 2024, 58, 102191. [Google Scholar] [CrossRef]
  21. Zhang, H.; Zhang, X.; Fan, G. Numerical simulation study on the impact of urbanization on the thermal environment of Hangzhou city. Chin. Environ. Sci. 2021, 41, 4107–4119. [Google Scholar] [CrossRef]
  22. Wu, S.; Wang, P.; Tong, X.; Tian, H.; Zhao, Y.; Luo, M. Urbanization-driven increases in summertime compound heat extremes across China. Sci. Total Environ. 2021, 799, 149166. [Google Scholar] [CrossRef]
  23. Kusaka, H.; Suzuki-Parker, A.; Aoyagi, T.; Adachi, S.A.; Yamagata, Y. Assessment of RCM and urban scenarios uncertainties in the climate projections for August in the 2050s in Tokyo. Clim. Change 2016, 137, 427–438. [Google Scholar] [CrossRef]
  24. Argüeso, D.; Evans, J.P.; Fita, L.; Bormann, K.J. Temperature response to future urbanization and climate change. Clim. Dyn. 2014, 42, 2183–2199. [Google Scholar] [CrossRef]
  25. Hamdi, R.; Van de Vyver, H.; De Troch, R.; Termonia, P. Assessment of three dynamical urban climate downscaling methods: Brussels’s future urban heat island under an A1B emission scenario. Int. J. Clim. 2014, 34, 978–999. [Google Scholar] [CrossRef]
  26. Nazarenko, L.; Schmidt, G.A.; Miller, R.L.; Tausnev, N.; Kelley, M.; Ruedy, R.; Russell, G.L.; Aleinov, I.; Bauer, M.; Bauer, S.; et al. Future climate change under RCP emission scenarios with GISS M odelE2. J. Adv. Model. Earth Syst. 2015, 7, 244–267. [Google Scholar] [CrossRef]
  27. Lee, J.W.; Hong, S.Y.; Chang, E.C.; Suh, M.-S.; Kang, H.-S. Assessment of future climate change over East Asia due to the RCP scenarios downscaled by GRIMs-RMP. Clim. Dyn. 2014, 42, 733–747. [Google Scholar] [CrossRef]
  28. Zou, J.; Lu, H.; Shu, C.; Ji, L.; Gaur, A.; Wang, L. Multiscale numerical assessment of urban overheating under climate projections: A review. Urban Clim. 2023, 49, 101551. [Google Scholar] [CrossRef]
  29. Henan Provincial People’s Government. Statistical Bulletin on National Economic and Social Development of Zhengzhou City. Available online: www.henan.gov.cn (accessed on 15 April 2024).
  30. Dayal, K.K.; Bellon, G.; Cater, J.E.; Kingan, M.J.; Sharma, R.N. High-resolution mesoscale wind-resource assessment of Fiji using the Weather Research and Forecasting (WRF) model. Energy 2021, 232, 121047. [Google Scholar] [CrossRef]
  31. Nooni, I.K.; Tan, G.; Hongming, Y.; Saidou Chaibou, A.A.; Habtemicheal, B.A.; Gnitou, G.T.; Lim Kam Sian, K.T.C. Assessing the Performance of WRF Model in Simulating Heavy Precipitation Events over East Africa Using Satellite-Based Precipitation Product. Remote Sens. 2022, 14, 1964. [Google Scholar] [CrossRef]
  32. Ma, M.; Tang, J.; Ou, T.; Zhou, P. High-resolution climate projection over the Tibetan Plateau using WRF forced by bias-corrected CESM. Atmos. Res. 2023, 286, 106670. [Google Scholar] [CrossRef]
  33. Schumacher, V.; Fernández, A.; Justino, F.; Comin, A. WRF High Resolution Dynamical Downscaling of Precipitation for the Central Andes of Chile and Argentina. Front. Earth Sci. 2020, 8, 328. [Google Scholar] [CrossRef]
  34. Liu, X.; Min, R.; Zhang, H.; Wang, Q.; Song, H. Land cover changes reduce dust aerosol concentrations in northern China (2000–2020). Environ. Res. 2025, 268, 120823. [Google Scholar] [CrossRef]
  35. Wang, T.H.; Zhang, L.; Zhou, S.H.; Zhang, T.N.; Zhai, S.Y.; Yang, Z.L.; Wang, D.; Song, H.Q. Effects of ground-level ozone pollution on yield and economic losses of winter wheat in Henan, China. Atmos. Environ. 2021, 262, 118654. [Google Scholar] [CrossRef]
  36. Wang, W.; Wang, Y.; Zhai, S.; Xia, H.; Wang, D.; Song, H. Climate change driven by LUCC reduced NPP in the Yellow River Basin, China. Glob. Planet. Change 2024, 242, 104586. [Google Scholar] [CrossRef]
  37. Zhang, H.; Wang, F.; Zhou, S.; Zhang, T.; Qi, M.; Song, H. Contribution of dust emissions from farmland to particulate matter concentrations in North China Plain: Integration of WRF-Chem and WEPS model. Environ. Int. 2025, 195, 109191. [Google Scholar] [CrossRef]
  38. Xu, H.; Li, X.; Yin, J.; Zhou, L.; Song, Y.; Hu, T. Microphysics affect the sensitivities of rainfall to different horizontal-resolution simulations: Evidence from a case study of the Weather Research and Forecasting model runs. Atmos. Res. 2023, 296, 107022. [Google Scholar] [CrossRef]
  39. Rizza, U.; Avolio, E.; Morichetti, M.; Di Liberto, L.; Bellini, A.; Barnaba, F.; Virgili, S.; Passerini, G.; Mancinelli, E. On the Interplay between Desert Dust and Meteorology Based on WRF-Chem Simulations and Remote Sensing Observations in the Mediterranean Basin. Remote Sens. 2023, 15, 435. [Google Scholar] [CrossRef]
  40. Khamees, A.S.; Sayad, T.; Morsy, M.; Ali Rahoma, U. Evaluation of three radiation schemes of the WRF-Solar model for global surface solar radiation forecast: A case study in Egypt. Adv. Space Res. 2024, 73, 2880–2891. [Google Scholar] [CrossRef]
  41. Parra, R. Assessment of Land Surface Schemes from the WRF-Chem for Atmospheric Modeling in the Andean Region of Ecuador. Atmosphere 2023, 14, 508. [Google Scholar] [CrossRef]
  42. Zhang, T.; Cao, L.; Li, S.; Zhan, C.; Wang, J.; Zhao, T. Comprehensive sensitivity analysis of the WRF model for meteorological simulations in the Arctic. Atmos. Res. 2024, 299, 107200. [Google Scholar] [CrossRef]
  43. Yang, J.; Tang, Y.; Han, S.; Liu, J.; Yang, X.; Hao, J. Evaluation and improvement study of the Planetary Boundary-Layer schemes during a high PM2.5 episode in a core city of BTH region, China. Sci. Total Environ. 2021, 765, 142756. [Google Scholar] [CrossRef]
  44. Hoque, M.M.; Afsar, M.S.U.; Faruque, M.R.I.; Ahmed, S.J.; Jamil, A.T.M.K.; Mallik, M.A.K.; Hassan, S.M.Q. Sensitivity analysis of cumulus parameterization scheme and data sources to simulate thunderstorms over Bangladesh using WRF model. Adv. Space Res. 2024, 74, 5383–5394. [Google Scholar] [CrossRef]
  45. Ru, X.; Qiao, L.; Zhang, H.; Bai, T.; Min, R.; Wang, Y.; Wang, Q.; Song, H. Effects of land use and land cover change under shared socioeconomic pathways on future climate in the Yellow River basin, China. Urban Clim. 2024, 55, 101867. [Google Scholar] [CrossRef]
  46. Zhang, L.; Wang, F.; Song, H.Q.; Zhang, T.N.; Wang, D.; Xia, H.M.; Zhai, S.Y.; Liu, Y.Z.; Wang, T.H.; Wang, Y.B.; et al. Effects of projected climate change on winter wheat yield in Henan, China. J. Clean. Prod. 2022, 379, 134734. [Google Scholar] [CrossRef]
  47. Riahi, K.; van Vuuren, D.P.; Kriegler, E.; Edmonds, J.; O’Neill, B.C.; Fujimori, S.; Bauer, N.; Calvin, K.; Dellink, R.; Fricko, O.; et al. The Shared Socioeconomic Pathways and their energy, land use, and greenhouse gas emissions implications: An overview. Glob. Environ. Change 2017, 42, 153–168. [Google Scholar] [CrossRef]
  48. Van Vuuren, D.P.; Edmonds, J.; Kainuma, M.; Riahi, K.; Thomson, A.; Hibbard, K.; Hurtt, G.C.; Kram, T.; Krey, V.; Lamarque, J.F.; et al. The representative concentration pathways: An overview. Clim. Change 2011, 109, 5–31. [Google Scholar] [CrossRef]
  49. Mora, C.; Spirandelli, D.J.; Franklin, E.C.; Lynham, J.M.; Kantar, M.B.; Miles, W.B.; Smith, C.Z.; Freel, K.C.; Moy, J.; Louis, L.V.; et al. Broad threat to humanity from cumulative climate hazards intensified by greenhouse gas emissions. Nat. Clim. Change 2018, 8, 1062–1071. [Google Scholar] [CrossRef]
  50. Chen, G.; Li, X.; Liu, X. Global land projection based on plant functional types with a 1-km resolution under socio-climatic scenarios. Sci. Data 2022, 9, 125. [Google Scholar] [CrossRef]
  51. Xu, Z.; Han, Y.; Tam, C.Y.; Yang, Z.L.; Fu, C. Bias-corrected CMIP6 global dataset for dynamical downscaling of the historical and future climate (1979–2100). Sci. Data 2021, 8, 293. [Google Scholar] [CrossRef]
  52. Song, H.; Wang, K.; Zhang, Y.; Hong, C.; Zhou, S. Simulation and evaluation of dust emissions with WRF-Chem (v3.7.1) and its relationship to the changing climate over East Asia from 1980 to 2015. Atmos. Environ. 2017, 167, 511–522. [Google Scholar] [CrossRef]
  53. Zhao, L.; Oppenheimer, M.; Zhu, Q.; Baldwin, J.W.; Ebi, K.L.; Bou-Zeid, E.R.; Guan, K.; Liu, X. Interactions between urban heat islands and heat waves. Environ. Res. Lett. 2018, 13, 034003. [Google Scholar] [CrossRef]
  54. Barkhordarian, A. Attribution of extremes to greenhouse gas-induced changes in regional climate variability, distinct from changes in mean climate. Environ. Res. Lett. 2024, 19, 104022. [Google Scholar] [CrossRef]
  55. Kotharkar, R.; Bagade, A.; Ramesh, A. Assessing urban drivers of canopy layer urban heat island: A numerical modeling approach. Landsc. Urban Plan. 2019, 190, 103586. [Google Scholar] [CrossRef]
  56. IPCC. Climate Change 2021: The Physical Science Basis. In Contribution of Working Group I to the Sixth Assessment Report of the IPCC; Cambridge University Press: Cambridge, UK, 2021. [Google Scholar]
  57. Krayenhoff, E.S.; Broadbent, A.M.; Zhao, L.; Georgescu, M.; Middel, A.; Voogt, J.A.; Martilli, A.; Sailor, D.J.; Erell, E. Cooling hot cities: A systematic and critical review of the numerical modelling literature. Environ. Res. Lett. 2021, 16, 053007. [Google Scholar] [CrossRef]
  58. Li, Y.; Sun, Y.; Li, J.; Gao, C. Socioeconomic drivers of urban heat island effect: Empirical evidence from major Chinese cities. Sustain. Cities Soc. 2020, 63, 102425. [Google Scholar] [CrossRef]
  59. Santamouris, M. On the energy impact of urban heat island and global warming on buildings. Energy Build. 2014, 82, 100–113. [Google Scholar] [CrossRef]
  60. Santamouris, M. Analyzing the heat island magnitude and characteristics in one hundred Asian and Australian cities and regions. Sci. Total Environ. 2015, 512–513, 582–598. [Google Scholar] [CrossRef]
  61. Li, Y.; Yang, T.; Zhao, G.; Ma, C.; Yan, Y.; Xu, Y.; Wang, L.; Wang, L. A systematic review of studies involving canopy layer urban heat island: Monitoring and associated factors. Ecol. Indic. 2024, 158, 111424. [Google Scholar] [CrossRef]
  62. Samra, R.M.A. Investigating and mapping day-night urban heat island and its driving factors using Sentinel/MODIS data and Google Earth Engine. Case study: Greater Cairo, Egypt. Urban Clim. 2023, 52, 101729. [Google Scholar] [CrossRef]
  63. Siddiqui, A.; Kushwaha, G.; Nikam, B.; Srivastav, S.K.; Shelar, A.; Kumar, P. Analysing the day/night seasonal and annual changes and trends in land surface temperature and surface urban heat island intensity (SUHII) for Indian cities. Sustain. Cities Soc. 2021, 75, 103374. [Google Scholar] [CrossRef]
  64. Abbassi, Y.; Ahmadikia, H.; Baniasadi, E. Impact of wind speed on urban heat and pollution islands. Urban Clim. 2022, 44, 101200. [Google Scholar] [CrossRef]
  65. Du, R.; Liu, C.H.; Li, X.; Lin, C.Y. Interaction among local flows, UHI, coastal winds, and complex terrain: Effect on urban-scale temperature and building energy consumption during heatwaves. Energy Build. 2024, 303, 113763. [Google Scholar] [CrossRef]
Figure 1. Location of the study area and the WRF model simulation domains ((a) shows the location of study area, nested domains and meteorological stations. D01, D02, and D03 represent the nested domains set in the WRF model; (b) displays the digital elevation model (DEM) of Zhengzhou; (c) illustrates the urban-suburban boundary division in Zhengzhou).
Remotesensing 17 02660 g001
Figure 2. Spatial distributions of seasonal average temperature in Zhengzhou for 2020 (ad) represent the average temperature in spring, summer, autumn, and winter in 2020, respectively).
Remotesensing 17 02660 g002
Figure 3. Spatial distribution of average seasonal temperature in Zhengzhou under the SSP245 scenario for 2030 and 2060 ((a), (c), (e), and (g) represent the average temperature in spring, summer, autumn, and winter in 2030, respectively; (b), (d), (f), and (h) represent the average temperature in spring, summer, autumn, and winter in 2060, respectively).
Remotesensing 17 02660 g003
Figure 4. Spatial distribution of average seasonal temperature in Zhengzhou under the SSP585 scenario for 2030 and 2060 ((a), (c), (e), and (g) represent the average temperature in spring, summer, autumn, and winter in 2030, respectively; (b), (d), (f), and (h) represent the average temperature in spring, summer, autumn, and winter in 2060, respectively).
Remotesensing 17 02660 g004
Figure 5. Spatial distribution of average temperature differences in Zhengzhou under SSP245 scenario ((a), (c), (e), and (g) represent temperature changes in spring, summer, autumn, and winter of 2030 relative to 2020, respectively; (b), (d), (f), and (h) represent temperature changes in spring, summer, autumn, and winter of 2060 relative to 2020, respectively).
Remotesensing 17 02660 g005
Figure 6. Spatial distribution of average temperature differences in Zhengzhou under the SSP585 scenario ((a), (c), (e), and (g) represent temperature changes in spring, summer, autumn, and winter of 2030 relative to 2020, respectively; (b), (d), (f), and (h) represent temperature changes in spring, summer, autumn, and winter of 2060 relative to 2020, respectively).
Remotesensing 17 02660 g006
Figure 7. Seasonal variations in UHI in Zhengzhou under different scenarios and years.
Remotesensing 17 02660 g007
Table 1. Configuration of the physical options in the WRF model.
Physical OptionsParameterization Schemes
MicrophysicsLin [38]
Longwave radiationGoddard [39]
Shortwave radiationGoddard [40]
Land surfaceUnified Noah [41]
Surface layerEta [42]
Planetary boundaryMellor–Yamada–Janjic TKE [43]
CumulusKain–Fritsch (new Eta) [44]
Table 2. Experimental design.
ExperimentLand Use and Cover DataClimate Data
Baseline20202020 (NCEP)
12030 (SSP245)2030 (SSP245)
22030 (SSP585)2030 (SSP585)
32060 (SSP245)2060 (SSP245)
42060 (SSP585)2060 (SSP585)
Table 3. Annual validation statistics of T2 for each domain in 2020.
DomainMB (°C)NMB (%)NME (%)RMSE (°C)R
D010.60 4.13 8.70 2.47 0.97
D021.15 7.83 10.39 4.16 0.92
D030.08 0.50 10.27 2.11 0.98
Table 4. Seasonal validation statistics of T2 for D03.
TimeMB (°C)NMB (%)NME (%)RMSE (°C)R
Spring−0.05−0.2811.412.530.95
Summer0.712.736.982.250.87
Autumn−0.24−1.458.511.830.97
Winter−0.11−2.7734.681.710.92
Table 5. Seasonal temperature in urban and suburban areas (°C).
ExperimentSpringSummerAutumnWinter
T u r b a n T s u b u r b a n T u r b a n T s u b u r b a n T u r b a n T s u b u r b a n T u r b a n T s u b u r b a n
2020
Baseline
18.4017.6227.7126.6816.8916.144.223.85
2030 (SSP245)17.8517.0130.0629.0117.6417.401.930.92
2030 (SSP585)16.8715.9330.0029.0616.3715.764.624.20
2060 (SSP245)19.5918.8130.4229.4719.3619.143.632.78
2060 (SSP585)20.7220.1432.0130.9818.1217.405.384.77
Disclaimer/Publisher’s Note: The statements, opinions and data contained in all publications are solely those of the individual author(s) and contributor(s) and not of MDPI and/or the editor(s). MDPI and/or the editor(s) disclaim responsibility for any injury to people or property resulting from any ideas, methods, instructions or products referred to in the content.

