Article

Validation of Global Moderate-Resolution FAPAR Products over Boreal Forests in North America Using Harmonized Landsat and Sentinel-2 Data

by
Yinghui Zhang
1,2,3,4,
Hongliang Fang
2,3,
Zhongwen Hu
1,4,*,
Yao Wang
2,3,
Sijia Li
2,3 and
Guofeng Wu
1,4
1
MNR Key Laboratory for Geo-Environmental Monitoring of Great Bay Area & Guangdong Key Laboratory of Urban Informatics & Shenzhen Key Laboratory of Spatial Smart Sensing and Services, Shenzhen University, Shenzhen 518060, China
2
LREIS, Institute of Geographic Sciences and Natural Resources Research, Chinese Academy of Sciences, Beijing 100101, China
3
College of Resources and Environment, University of Chinese Academy of Sciences, Beijing 100049, China
4
School of Architecture and Urban Planning, Shenzhen University, Shenzhen 518060, China
*
Author to whom correspondence should be addressed.
Remote Sens. 2025, 17(15), 2658; https://doi.org/10.3390/rs17152658 (registering DOI)
Submission received: 16 June 2025 / Revised: 28 July 2025 / Accepted: 29 July 2025 / Published: 1 August 2025

Abstract

The fraction of absorbed photosynthetically active radiation (FAPAR) stands as a pivotal parameter within the Earth system, quantifying the energy exchange between vegetation and solar radiation. Accordingly, there is an urgent need for comprehensive validation studies to accurately quantify uncertainties and improve the reliability of FAPAR-based applications. This study validated five global FAPAR products, MOD15A2H, MYD15A2H, VNP15A2H, GEOV2, and GEOV3, over four boreal forest sites in North America. Qualitative quality flags (QQFs) and quantitative quality indicators (QQIs) of each product were analyzed. Time series high-resolution reference FAPAR maps were developed using the Harmonized Landsat and Sentinel-2 dataset. The reference FAPAR maps revealed a strong agreement with the in situ FAPAR from AmeriFlux (correlation coefficient (R) = 0.91; root mean square error (RMSE) = 0.06). The results revealed that global FAPAR products show similar uncertainties (RMSE: 0.16 ± 0.04) and moderate agreement with the reference FAPAR (R = 0.75 ± 0.10). On average, 34.47 ± 6.91% of the FAPAR data met the goal requirements of the Global Climate Observing System (GCOS), while 54.41 ± 6.89% met the threshold requirements of the GCOS. Deciduous forests perform better than evergreen forests, and the products tend to underestimate the reference data, especially for the beginning and end of growing seasons in evergreen forests. There are no obvious quality differences at different QQFs, and the relative QQI can be used to filter high-quality values. To enhance the regional applicability of global FAPAR products, further algorithm improvements and expanded validation efforts are essential.

1. Introduction

The fraction of photosynthetically active radiation absorbed by the vegetation canopy (FAPAR) serves as a pivotal input parameter in agriculture and forest management practices and terrestrial carbon models [1,2]. Consequently, the Global Climate Observing System (GCOS) has designated it as an essential climate variable [3]. In the past twenty years, numerous global moderate-resolution FAPAR products have been produced operationally, including MOD15A2H, MYD15A2H, VNP15A2H, GEOV2, and GEOV3 [4,5,6]. These products have revealed the spatio-temporal change pattern of vegetation FAPAR and are widely applied in global change research, crop yield estimation, and carbon cycle assessment. However, due to issues with sensors and algorithms, these products are characterized by extensive uncertainties, which have important impacts on related applications [7]. Thus, clarifying the uncertainties of these products will not only facilitate the improvement of product algorithms but also assist in analyzing the uncertainties of applications [8,9].
The Committee on Earth Observation Satellites (CEOS) Land Product Validation (LPV) subgroup has developed a standardized framework with the aim of systematically orchestrating the quantitative validation of satellite-generated land products among various agencies and algorithms [10]. There are three common validation methods, including (1) intercomparisons with existing FAPAR products or other related variables [7,11], (2) direct field-to-satellite FAPAR comparison [8,12], and (3) comparison with upscaled high-resolution reference data temporally and spatially [13]. Among the methods, the third method serves to reduce the scale disparity between the true values and the products [14,15,16]. Nevertheless, the validation results are influenced by the quality of the field measurements and the seasonal variations in the time series images [10].
The generation of field measurement data is a key factor in the validation process. Two methods are frequently employed to obtain field measurement data, including the digital hemispherical photography (DHP) method and the direct calculation of PAR observation using multiple fluxes (multi-flux FAPAR). The widely used validation data obtained by the DHP method typically overestimated true FAPAR values [17]. On the contrary, the FAPAR obtained by the multi-flux method is closer to the true value. Therefore, validations using multi-flux FAPAR data is preferred in obtaining more reliable validation results.
The seasonal variation in quality is another important aspect for evaluating product quality. Therefore, time series reference data are widely used for this purpose, which are usually generated from time series Landsat, Sentinel, and other data [14]. However, the inconsistency of results caused by a different observation geometry of the same sensor, as well as different spectral response and spatial resolution between different sensors, poses challenges to the validation of seasonal variation characteristics of FAPAR products [18]. Harmonized Landsat and Sentinel-2 (HLS) imagery yields more dependable and dense time series data [19]. However, it has not yet been employed for the validation of FAPAR products.
Beyond the efforts in validation methods, remote sensing communities have also proposed quality requirements according to their specific requirements. The GCOS has set out target (max (5%, 0.0025)) and threshold (max (10%, 0.005)) criteria regarding the uncertainty of FAPAR products [3]. The Copernicus Global Land Service (CGLS) divided FAPAR’s uncertainty requirements into the following three levels: optimal, 5%; target, 10%; and threshold, 20% [20]. However, it remains unclear to what extent existing products can meet the requirements put forward by scientific communities.
Numerous FAPAR products integrate both qualitative quality flags (QQFs) and quantitative quality indicators (QQIs) [21]. The QQF layer generally illustrates the algorithm employed in product processing, including the main algorithm and backup algorithm. The inversion results of the main algorithm, as indicated by QQFs, are generally selected and applied to global research [22]. However, the quality differences between the inversion results of the main algorithm and the backup algorithm has not been clearly expounded yet. The QQI layer mirrors the theoretical uncertainties of the product but is insufficient for comprehensively depicting the uncertainties of the product [23]. The relationship between QQIs and QQFs and the quality of FAPAR products remains unverified.
This study conducts a comprehensive validation of five moderate-resolution global FAPAR products, MOD15A2H, MYD15A2H, VNP15A2H, GEOV2, and GEOV3, over four boreal forest sites in North America. We aim to answer several key questions: (1) What are the uncertainties of the current FAPAR products over boreal forests? (2) How do current FAPAR products perform, and do they meet the quality requirements of scientific communities? (3) What are the differences in the quality of FAPAR products at different QQF and QQI levels?
To answer the questions and to address the aforementioned limitations, we generated time series reference maps from the HLS data and then validated it with the field multi-flux FAPAR measurements. The reference time series data were upscaled and then compared to the moderate-resolution products to reveal the seasonal variation in product quality and determine whether the products meet the quality requirements of the scientific communities. Moreover, the relationship between QQIs and QQFs and the quality of the FAPAR products were analyzed.

2. Study Area and Data

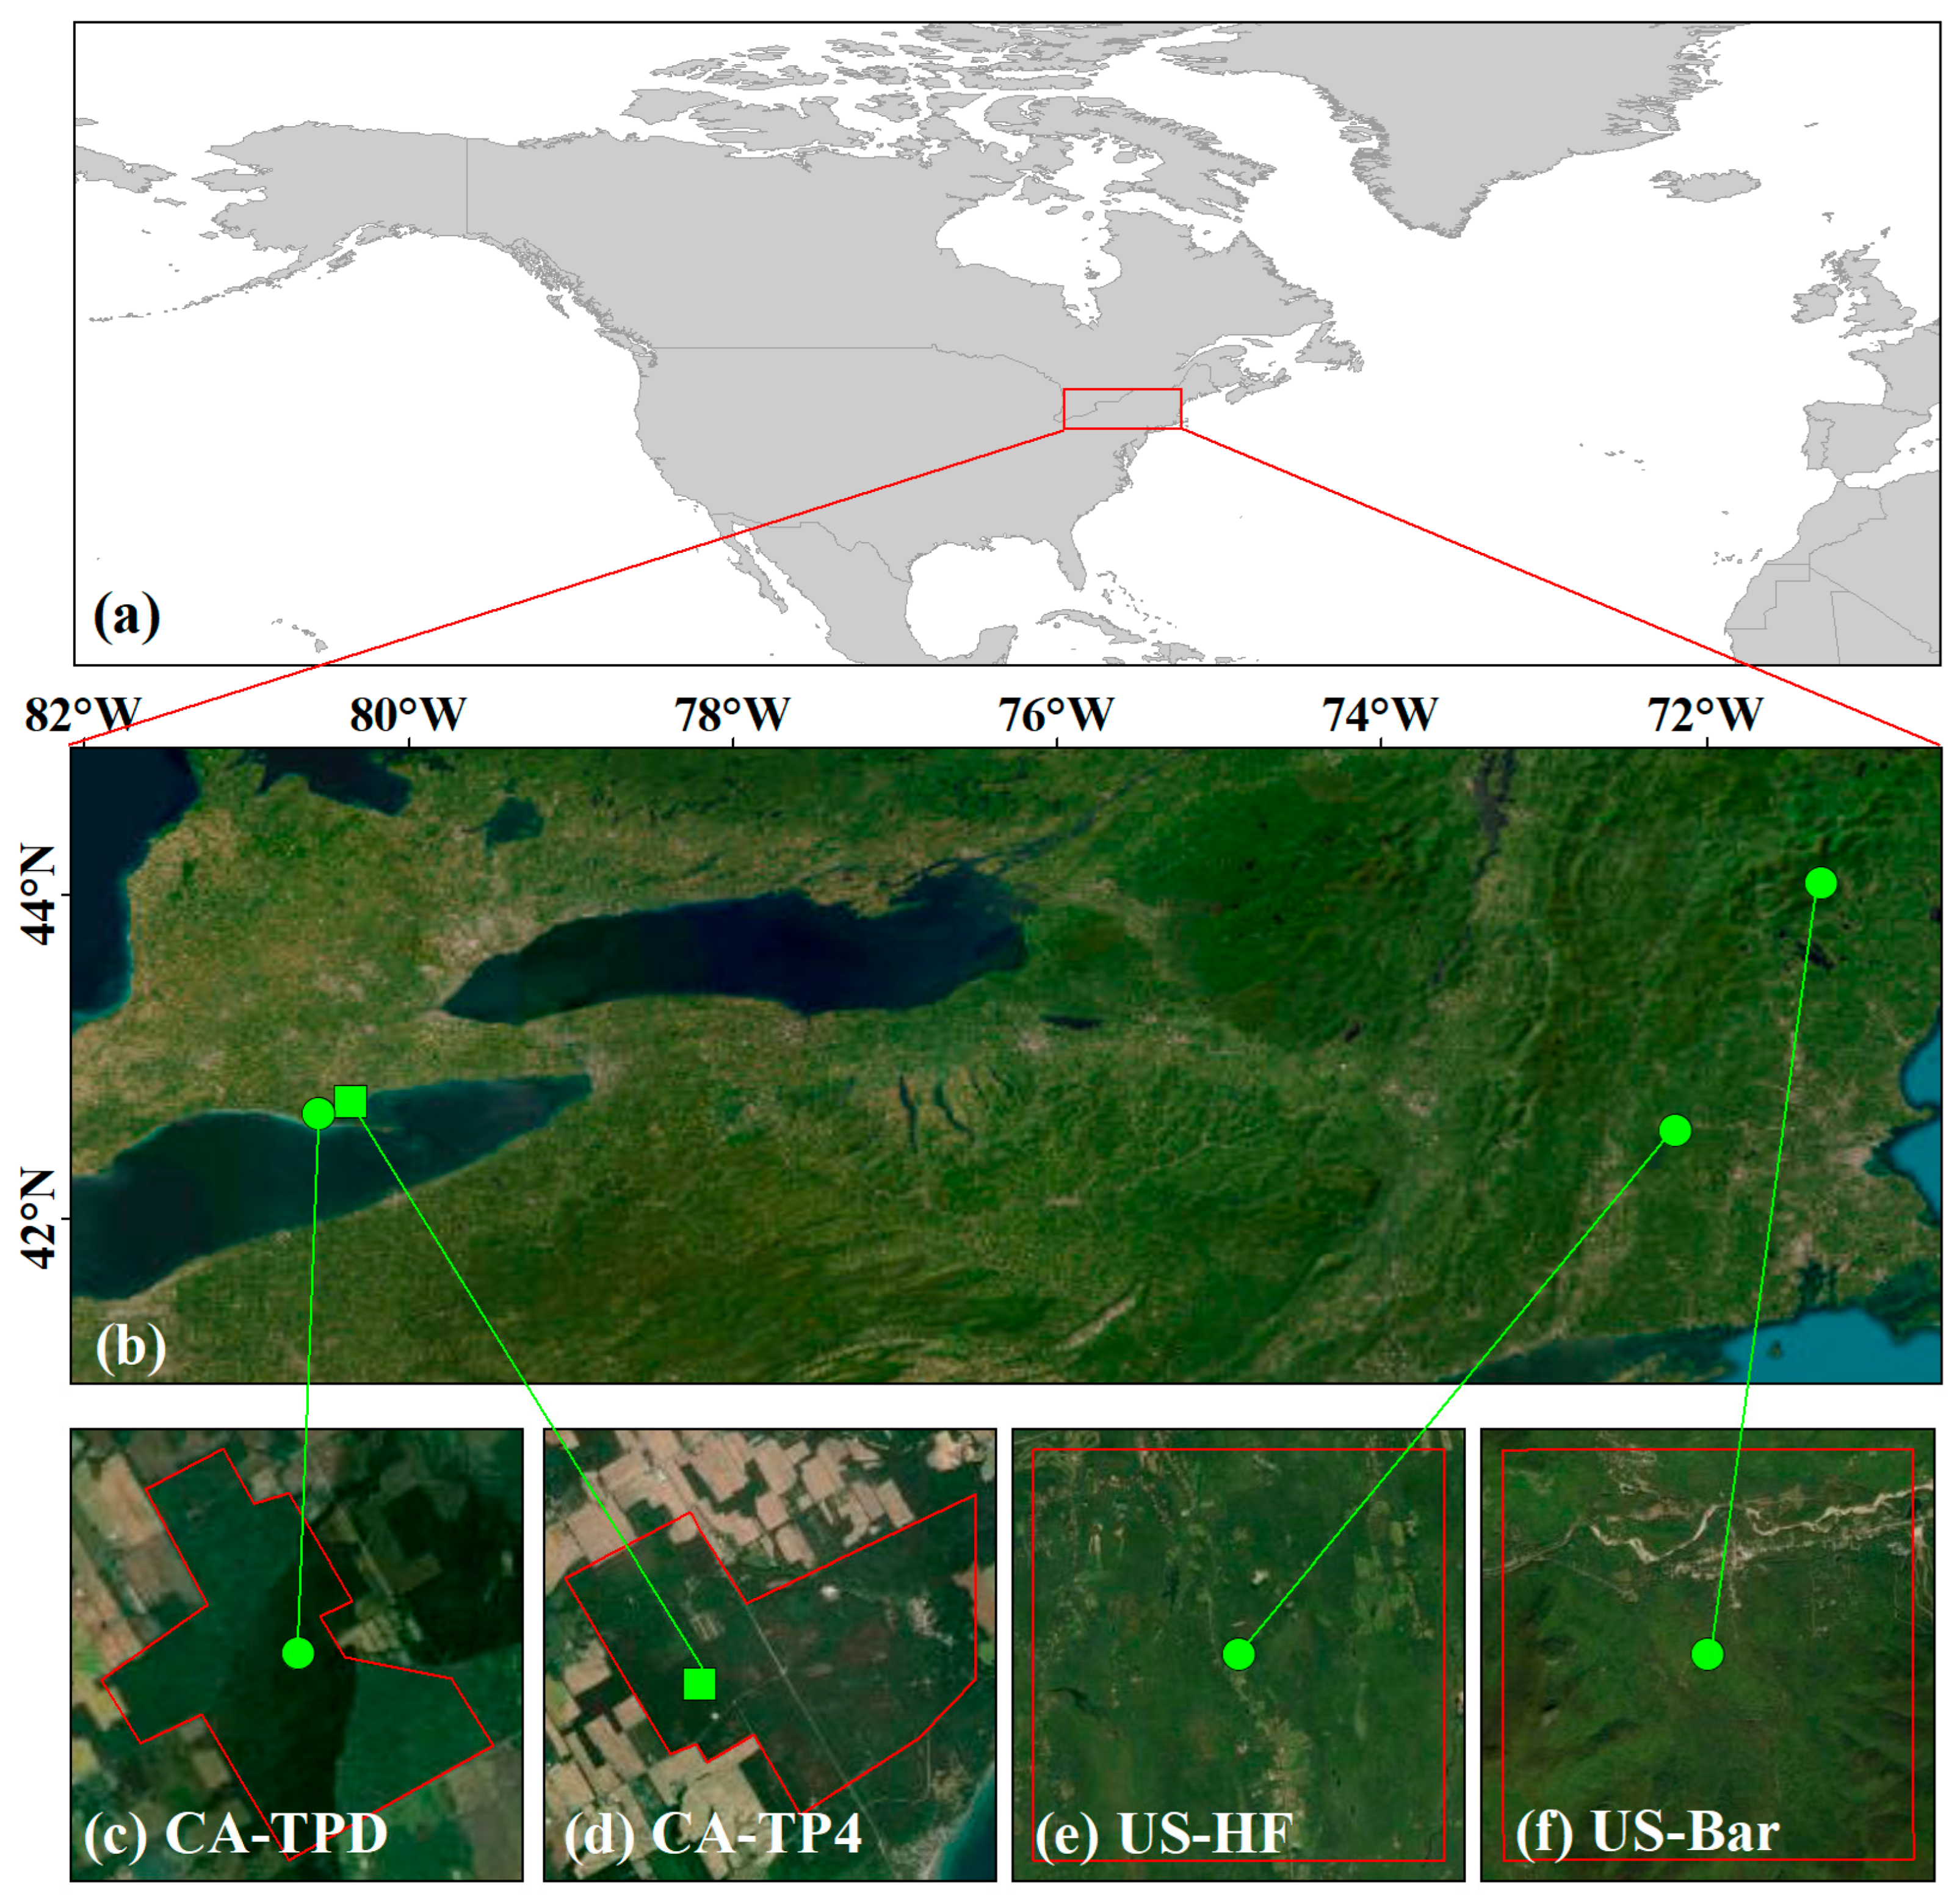
2.1. Study Area and In Situ Data

In situ FAPAR data were collected from four forest sites located across North America [24]. Detailed site characteristics are provided in Table 1, and the spatial distribution of these sites is presented in Figure 1. All sites are characterized by open, flat terrain and homogeneous coverage of either deciduous or evergreen forests. Depending on the conditions of each site, various types and numbers of photosynthetically active radiation (PAR) sensors were installed in both the upper and lower parts of the canopies at each location [25,26,27]. In order to eliminate low-light (night-time) data, any data that were measured when the solar zenith angles exceeded 85° were excluded. Additionally, data for which the ratio of below-canopy PAR to above-canopy PAR was greater than 1 were filtered out. This is because the below-canopy PAR sensor is frequently partially blocked by snow accumulation or other impediments [28]. Ultimately, only those days with entirely continuous observations of the FAPAR were incorporated into this study.

2.2. Moderate-Resolution FAPAR Products

2.2.1. MODIS and VIIRS FAPAR Products

The FAPAR products generated by MODIS and VIIRS include MOD15A2H.061 (MOD), MYD15A2H.061 (MOD), and VNP15A2H v002 (VNP) at a spatial resolution of 500 m and a temporal resolution of 8 days (Table 2). The main algorithm makes use of a look-up table (LUT) approach, which is derived from simulations of a three-dimensional vegetation canopy radiative transfer model. Simultaneously, the backup algorithm determines the FAPAR values by depending on the empirical correlations between the FAPAR and the Normalized Difference Vegetation Index [5,29]. The relationships are specific to different biomes. The product QQF layer reveals five different quality markers, and the QQI indicates the standard deviation of inversion results [30]. MOD15A2H and MYD15A2H, respectively, signify the total FAPAR at the equatorial crossing moments of 10:30 in the morning and 13:30 in the afternoon. Meanwhile, VNP15A2H represents the total FAPAR value at the equatorial crossing time of 13:30 in the afternoon [31].

2.2.2. CGLS FAPAR Products

The CGLS FAPAR products, GEOV2 and GEOV3, are generated from the PROBA-V data [32] with a temporal resolution of 10 days and spatial resolutions of 1000 m and 300 m, respectively (Table 3). An artificial neural network is initially trained with the reflectance values of the red and near-infrared (NIR) bands. In addition, it utilizes the relevant viewing and illumination geometries. Moreover, it employs a weighted average of the contemporary FAPAR estimates sourced from CYCLOPES and the Collection 5 MOD15A2 product [33]. During the training procedure, the pixels of the evergreen broadleaf forest (EBF) and those of the non-EBF are differentiated. Initially, the daily FAPAR variables are estimated. Then, the decadal FAPAR values are generated from these daily estimations. A multistep filtering method is utilized to remove the noisy data that is influenced by the atmosphere and snow (Table 2). The quantitative uncertainties are calculated as the RMSE between the final value and the daily estimations within the compositing period [34].

2.3. The Harmonized Landsat and Sentinel-2 (HLS) Imagery

The HLS dataset delivers radiometrically standardized surface reflectance products derived from Landsat-8 Operational Land Imager and Sentinel-2 Multi-Spectral Instrument observations through a sophisticated processing chain [19]. This harmonization framework combines algorithms for atmospheric correction, cloud and shadow masking, cross-sensor spatial alignment, nadir-normalized bidirectional reflectance distribution function correction, and spectral bandpass adjustment [19]. These components work together to guarantee temporal consistency among different sensors. The combined constellation achieves sub-weekly temporal resolution (1–4 day revisit cycle) with a 30 m spatial resolution across North America, with acquisition frequency varying latitudinally due to orbital convergence patterns [23]. All pixels were normalized to nadir view geometry using sensor-specific view angle metadata. Per-tile illumination angles were calculated as the mean solar zenith angle at the tile centroid during respective Landsat-8 and Sentinel-2 overpasses.

3. Method

The research utilizes an evaluation approach suggested by the CEOS LPV subgroup [35]. This methodology enables the creation of upscaled reference FAPAR maps that consider the spatial variability existing within moderate-resolution pixels. As depicted in Figure 2, the framework is composed of two main stages: (1) determining the reference FAPAR values by using high-resolution images and (2) methodically comparing moderate-resolution FAPAR products with the upscaled reference dataset via pixel-by-pixel validation.

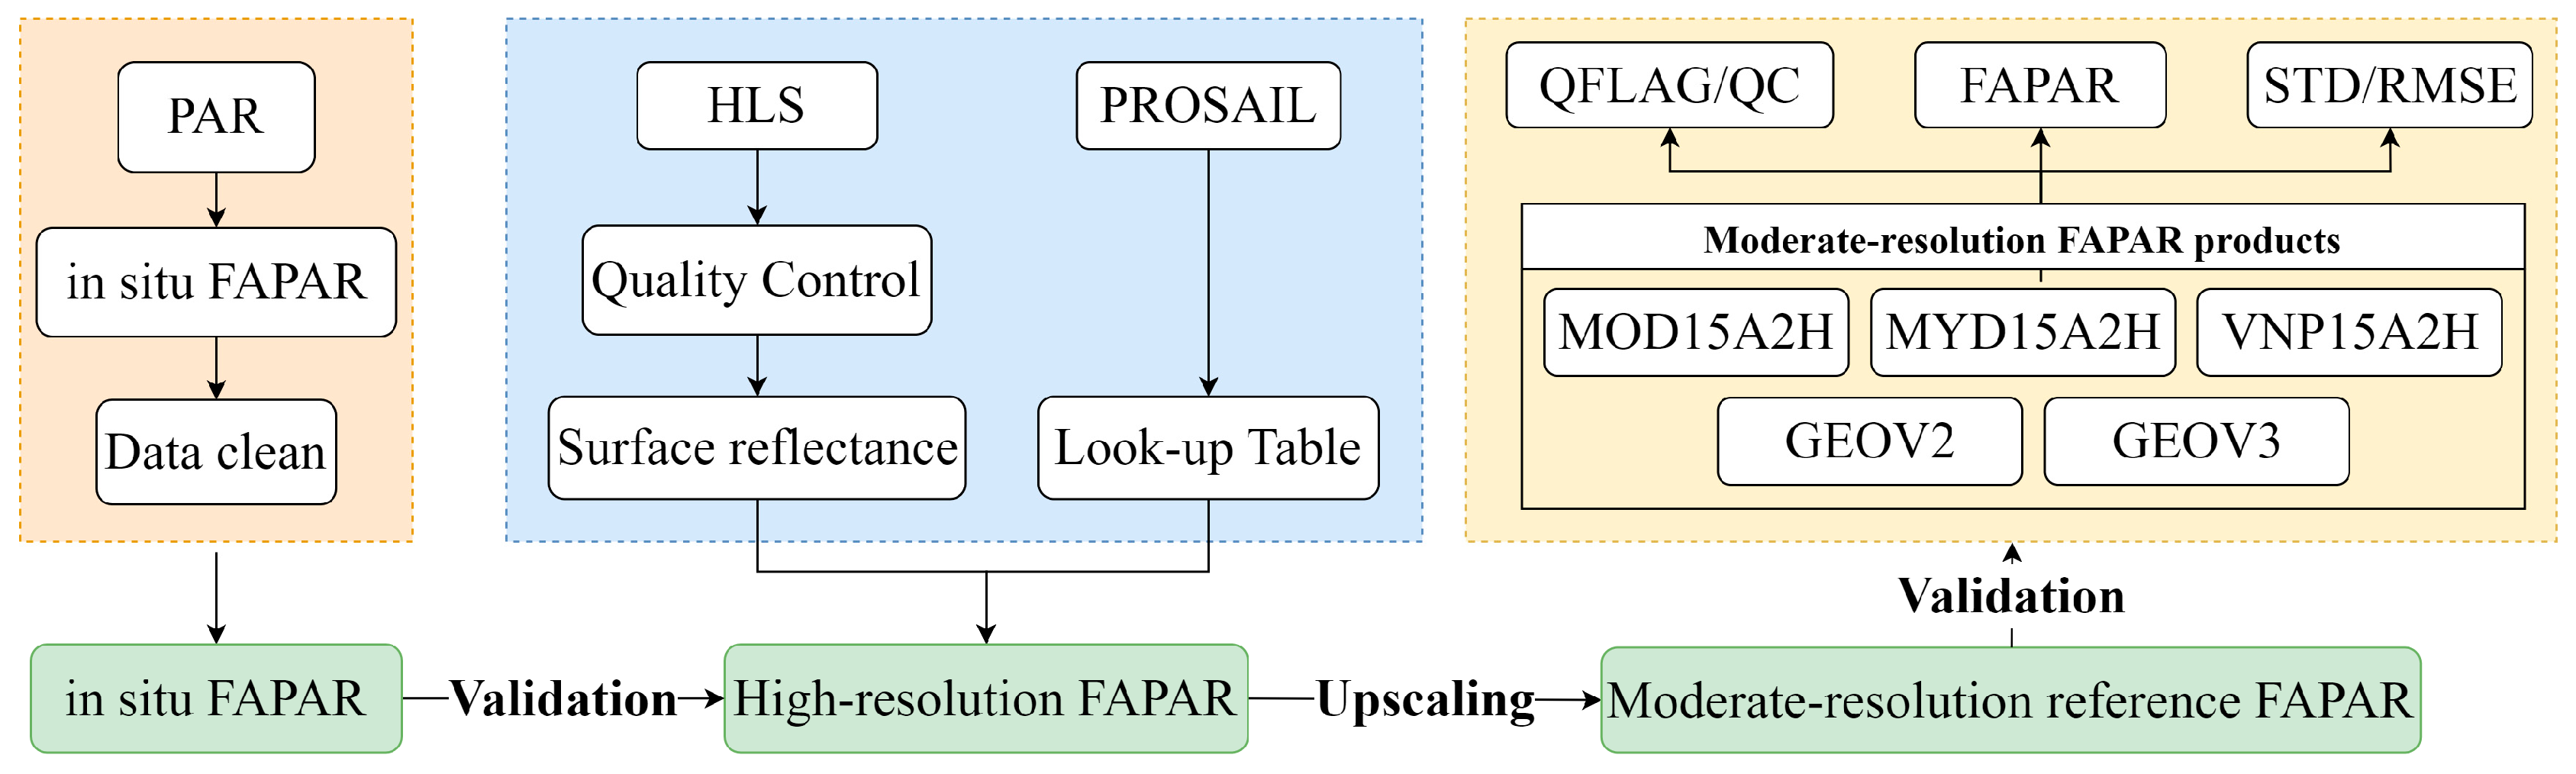
3.1. Derivation of High-Resolution FAPAR from HLS

Upscaling the ground truth data to high-resolution reference data is a crucial process in product validation. Empirical upscaling methods with the vegetation index, radiation transfer models, and machine learning methods were frequently applied in estimating reference data [36]. Among them, the radiation transfer model method is less dependent on the ground-measured data and is more suitable for the generation of reference data. In the study, the LUT technique was utilized to derive the FAPAR from the red and NIR reflectance information. The LUT was produced by conducting thorough simulations with the PROSAIL canopy radiative transfer model. This model combines the PROSPECT (Leaf Optical Properties Spectra) leaf optical properties model, which describes the biochemistry and internal structure of leaves, and the SAIL (Scattering by Arbitrarily Inclined Leaves) canopy bidirectional reflectance model, which considers the impacts of the canopy’s structure and the soil background [37]. The FAPAR was estimated following the method in [38].
The free parameters used in this study are detailed in Table 3. Parameter configurations were customized across different study sites according to their dominant vegetation types. All input variables followed uniform distributions with ranges and sampling intervals [39]. The ranges and steps of the free parameters are derived from former studies on boreal forests [40,41,42] and the recommended value [37,43]. LUTs were generated site-specifically, covering solar zenith angles from 20° to 84° with 2° increments to account for diurnal and seasonal variations in illumination conditions.
The LUT inversion was performed by directly comparing the satellite spectra with the simulated spectra. A cost function (J) was applied:
J = 1 N i = 1 N ρ i o b s ρ i s i m 2 ,
where N signifies the overall quantity of spectral bands utilized in the inversion process. In this case, N = 2, which corresponds to the red and near-infrared bands. ρiobs and ρisim, respectively, denote the observed and simulated reflectance values for the ith spectral band. In the retrieval procedure, the LUT was initially filtered based on the observed solar zenith angle. To minimize the uncertainties associated with the retrieval process, the top 100 solutions with the smallest values of J were selected. Subsequently, the FAPAR values of these selected solutions were averaged to obtain the final retrieval value [38]. The retrieved data were validated using the in situ FAPAR.

3.2. Evaluation and Validation of FAPAR Products

The product quality control information was first explored at four sites. We analyzed the composition of the QQF and the seasonal pattern of the QQI. The high-resolution reference FAPAR datasets were spatially aggregated to match the spatial resolutions of various satellite-derived FAPAR products (Table 2) using a spatial aggregation approach. Site-pixel validation and plot-level validation were also conducted. The data quality at different QQFs and the relationship between the QQI and data accuracy were also analyzed. All comparisons were performed on the basis of the HLS projection system. A quality assessment was conducted using the metrics defined in Table 4.
The overall uncertainty, accuracy, and precision were indicated by the Root Mean Squared Error (RMSE), bias, and the standard deviation (SD) between the upscaled reference data and the FAPAR products. Pearson’s coefficient (R) was used to indicate the strength of the relationship between the two variables. In addition, the percentages of pixels meeting the CGLS and GCOS requirements were assessed (Table 4). This study calculated the percentage of the optimal requirements of the CGLS and the goal requirements of the GCOS (PO, 5%), as well as the target requirements of the CGLS and the threshold requirements of the GCOS (PT, 10%).

4. Results

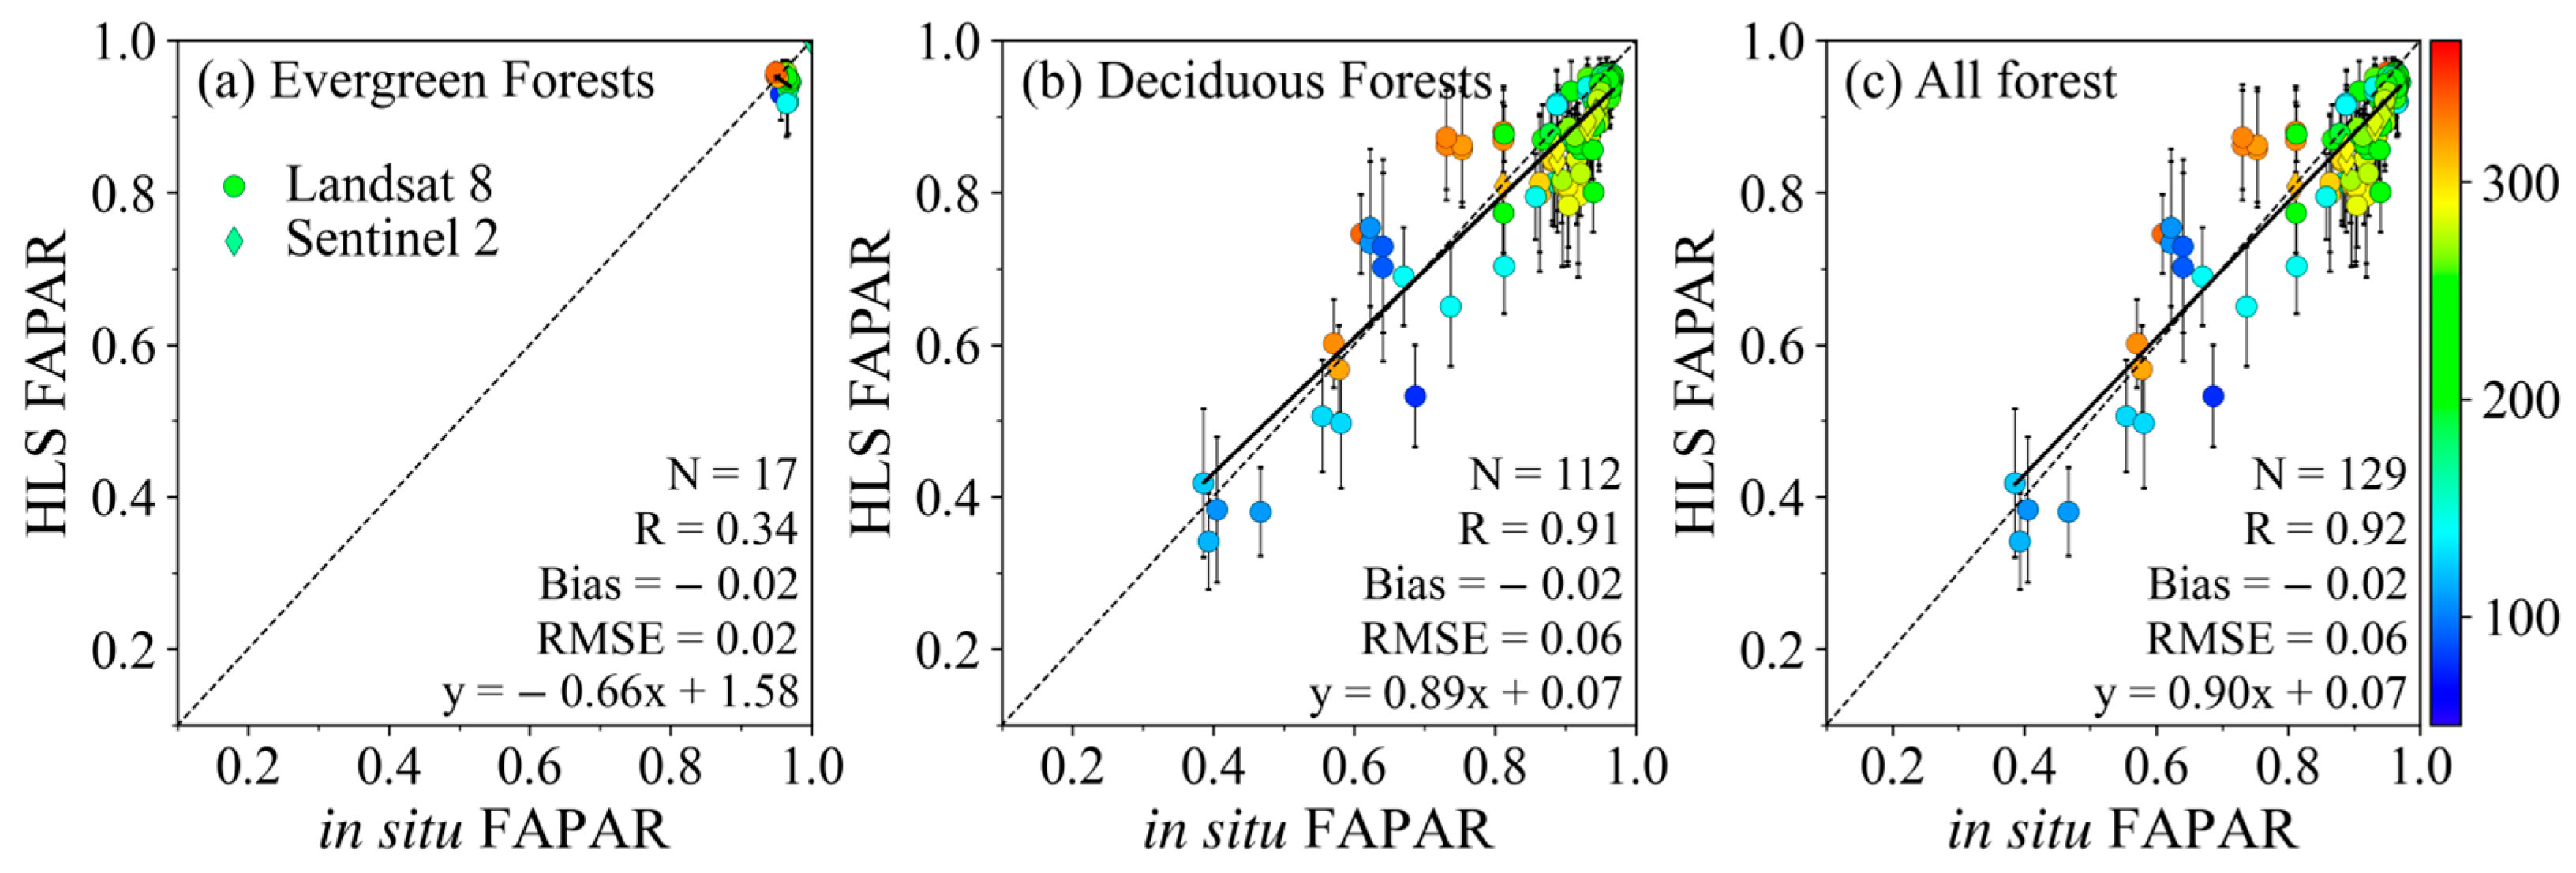
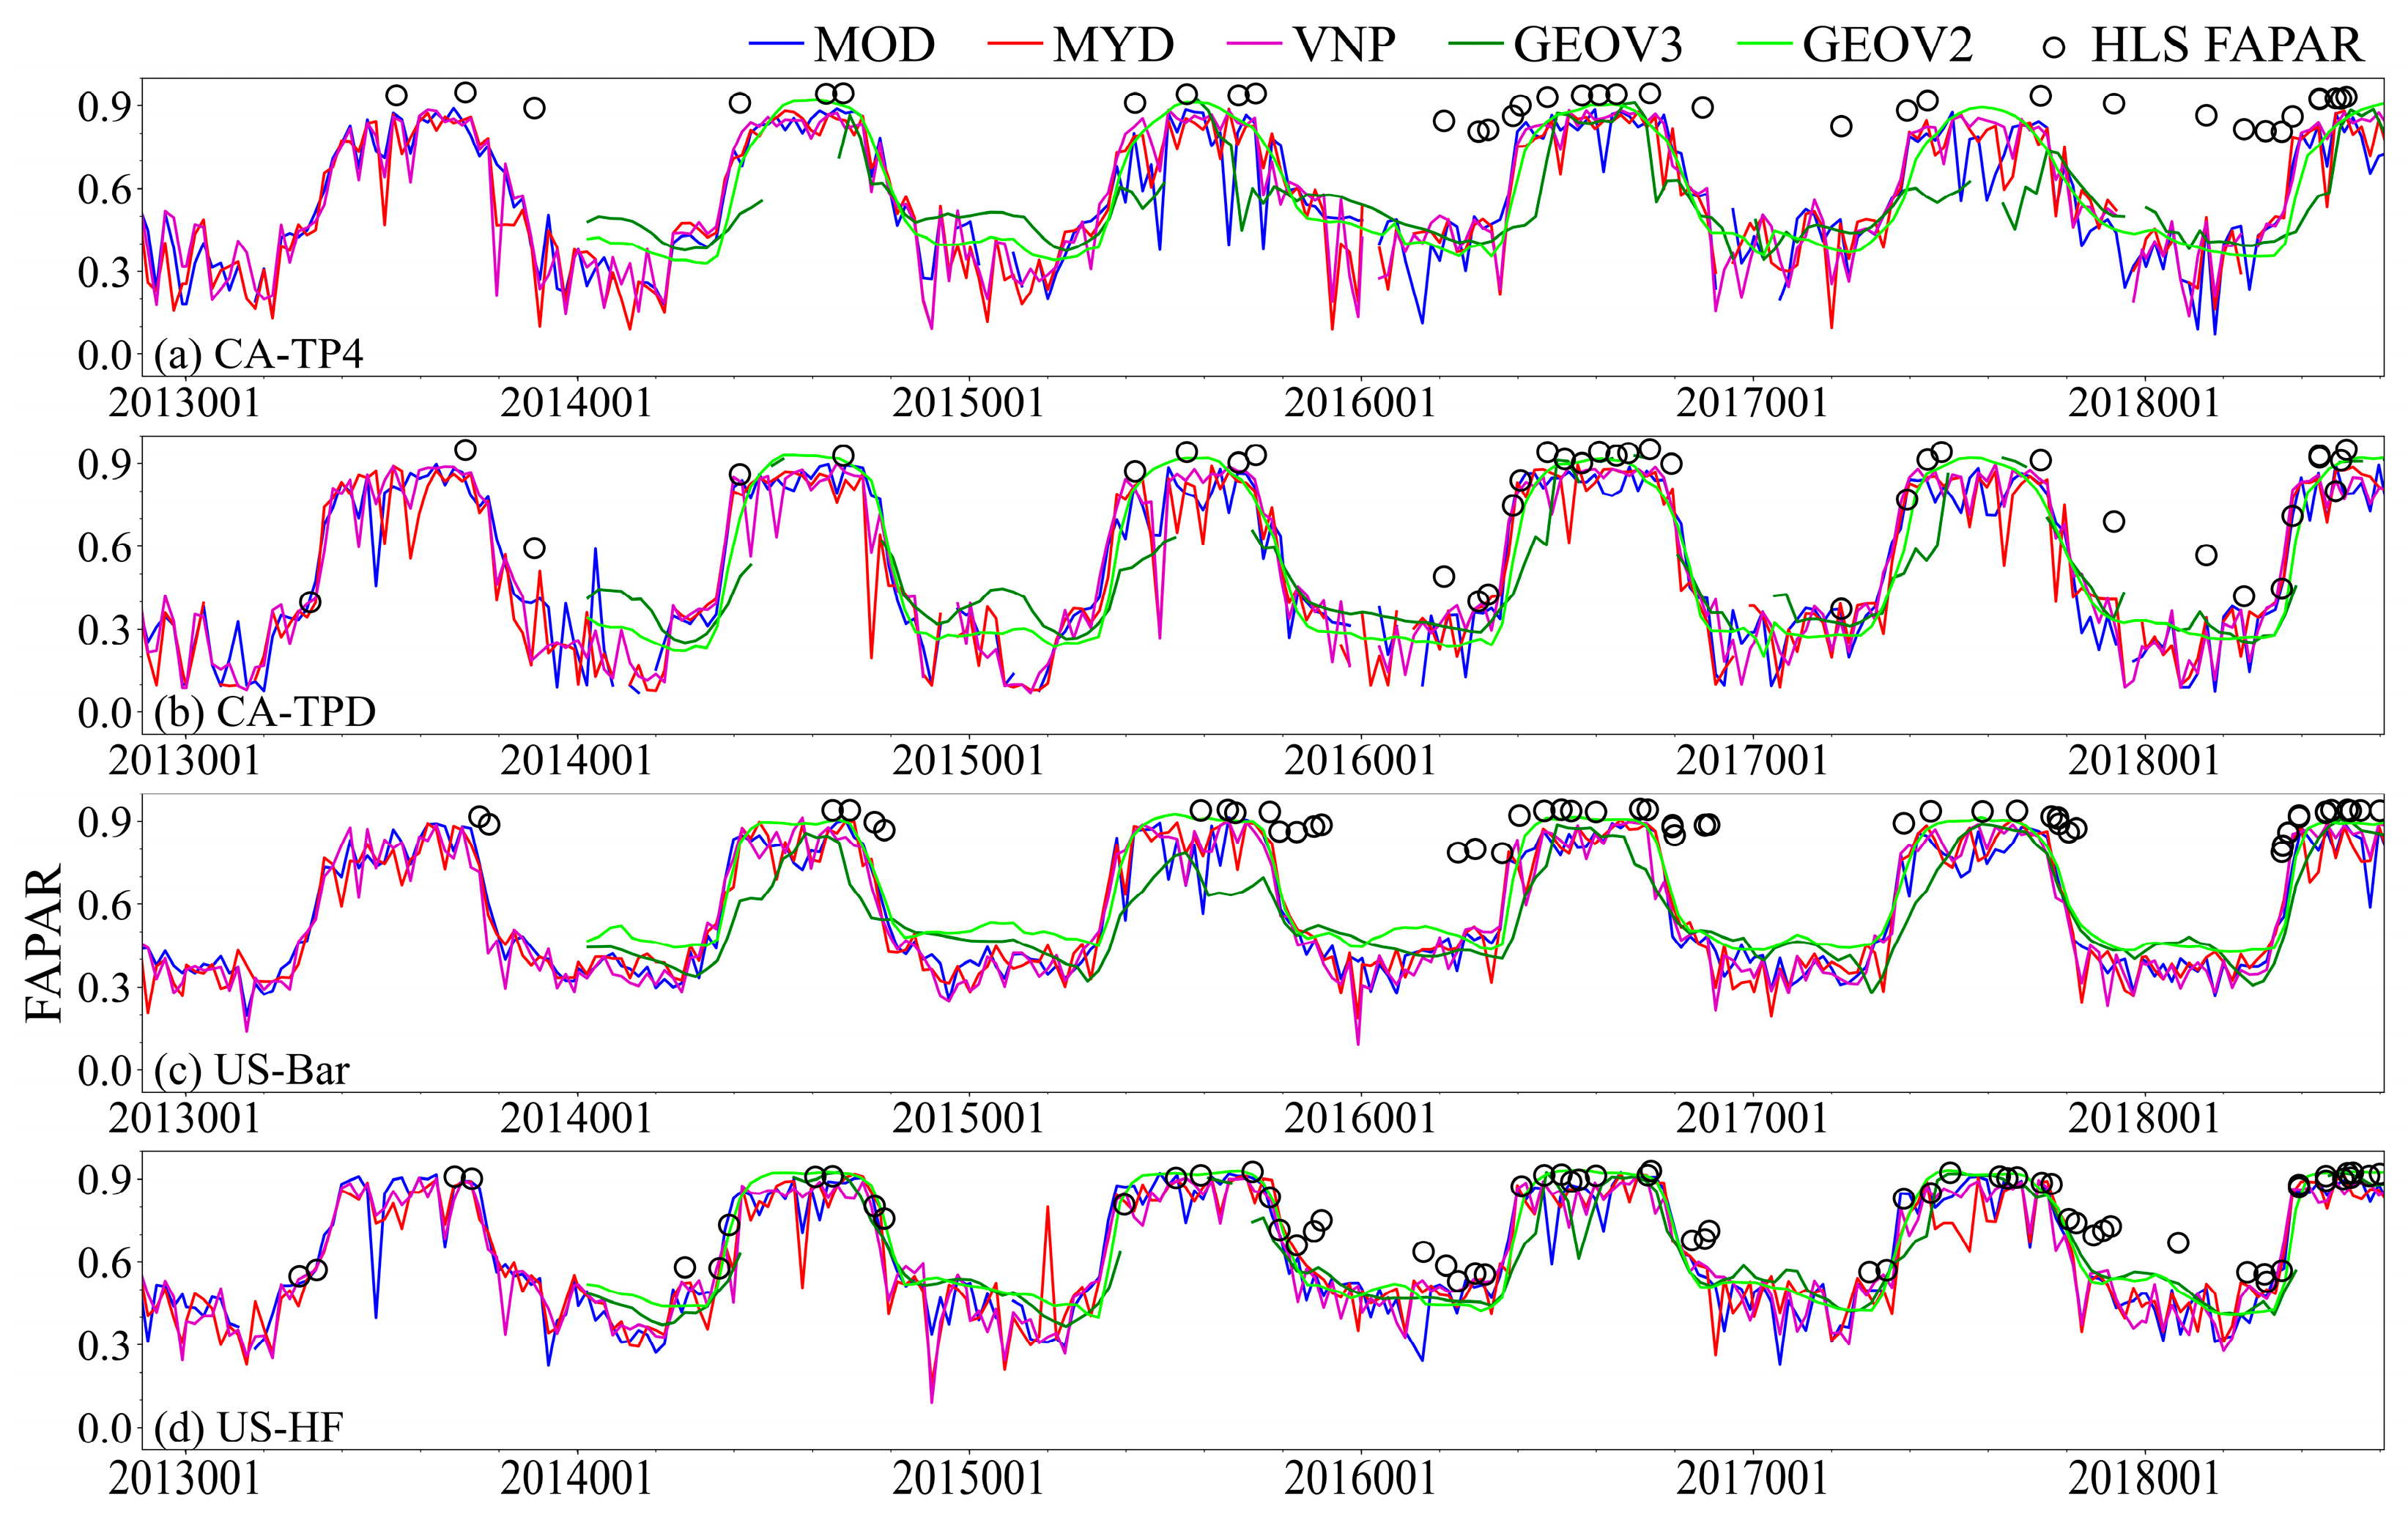
4.1. High-Resolution Instantaneous FAPAR

The high-resolution FAPAR data from HLS (Figure S1) clearly shows the FAPAR distributions around the four sites. At deciduous forest sites, seasonal variation is observed as the FAPAR changes with leaf growth and shedding. In contrast, the FAPAR at evergreen forest sites remains relatively stable throughout the year due to persistent foliage cover. Areas such as roads and residential zones exhibit low FAPAR values because they have little or sparse vegetation, resulting in minimal absorption of photosynthetically active radiation.
Figure 3 shows that the high-resolution reference FAPAR is consistent with the in situ FAPAR, characterized by a slope close to the 1:1 line and low uncertainty and accuracy (RMSE <= 0.06, bias ~ −0.02). The reference FAPAR is calculated as the average value of the 3 × 3 pixels that are situated around the locations of the field plots. The correlation (R) exceeded 0.9 at deciduous forest sites. The FAPAR values estimated from Landsat-8 and Sentinel-2 both also exhibited high accuracy.
The temporal variation in the high-resolution FAPAR and the corresponding in situ FAPAR are shown in Figure 4. The high-resolution FAPAR obtained from HLS data maintained the same seasonal variation with the in situ data. The seasonal variation at the evergreen forest site remained consistent throughout the year, with a value of approximately 0.94 across all seasons. The FAPAR displayed distinct seasonal variation patterns at deciduous forest sites (0.74). Prior to DOY 100, the FAPAR showed minor fluctuations likely attributable to observational noise and residual atmospheric effects and gradually decreased until reaching its minimum value. Subsequently, it gradually increased and attained its peak value in the middle of the growing season, where it remained stable. After DOY 280, the FAPAR began to decline again and reached its lowest value on DOY 300, after which it fluctuated again. Notably, the high-resolution inversion results were concentrated between DOY 100 and DOY 300, which corresponded well with the changes observed in the ground-measured data.

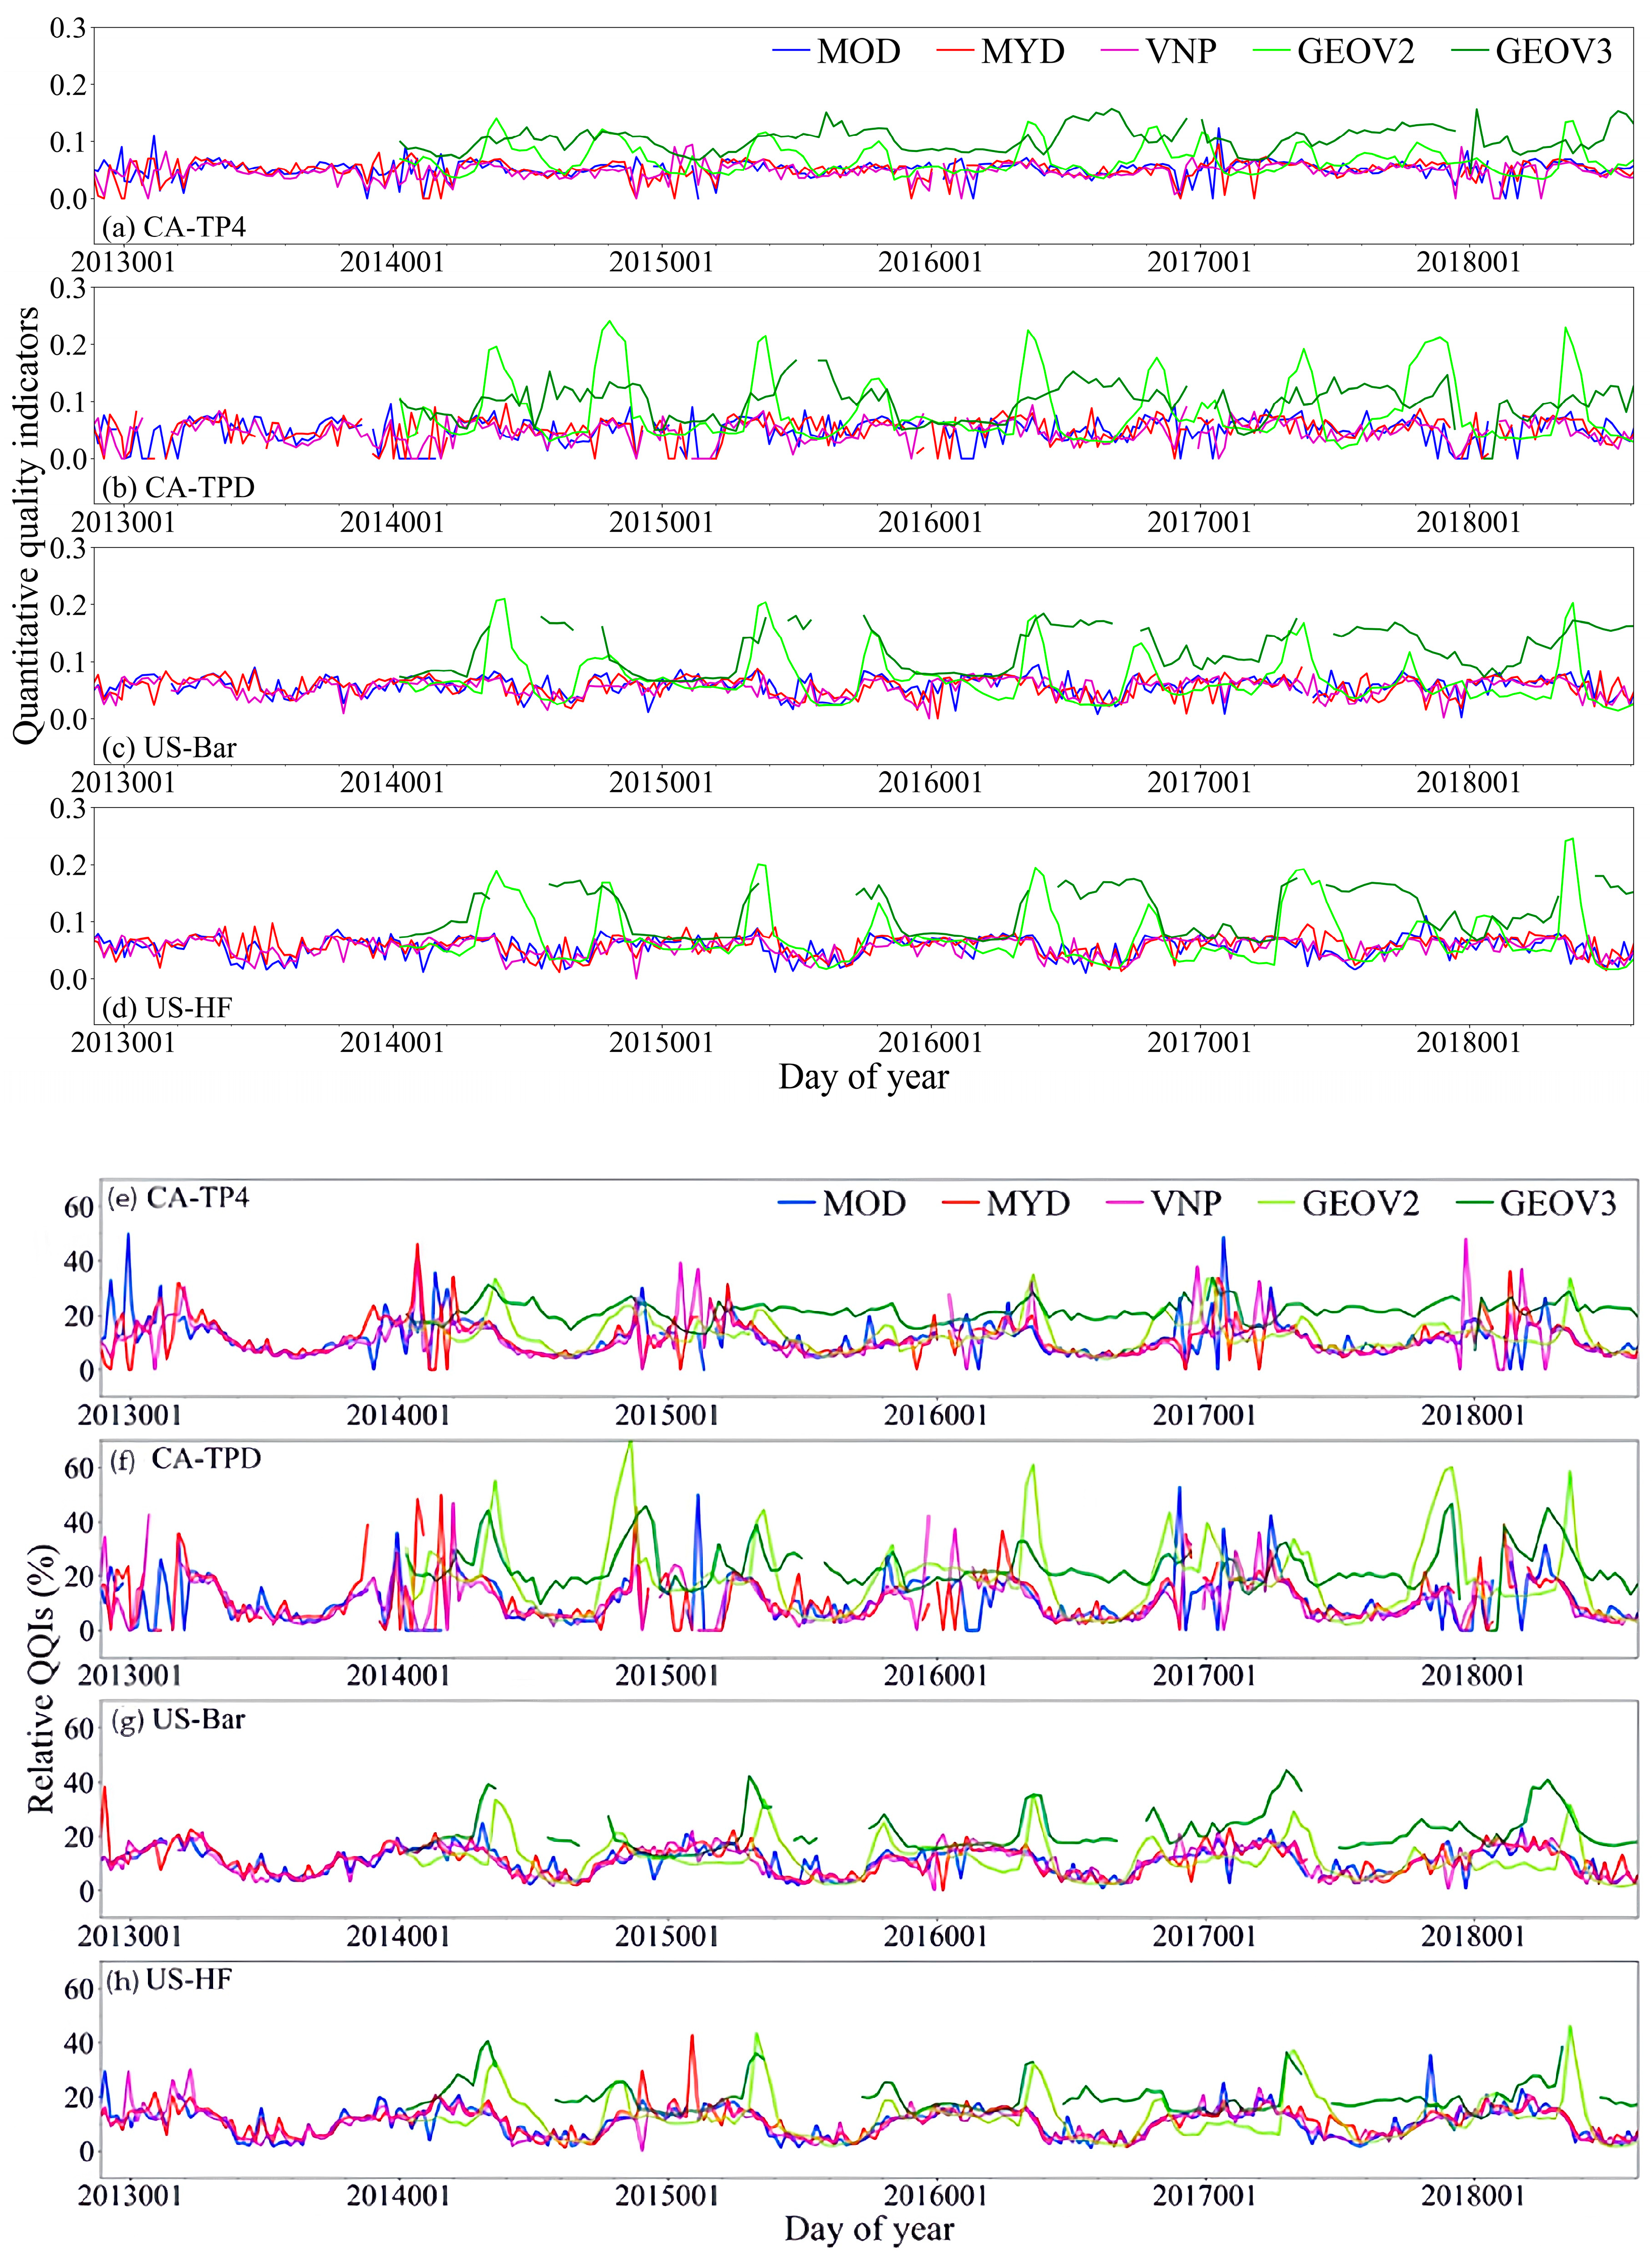
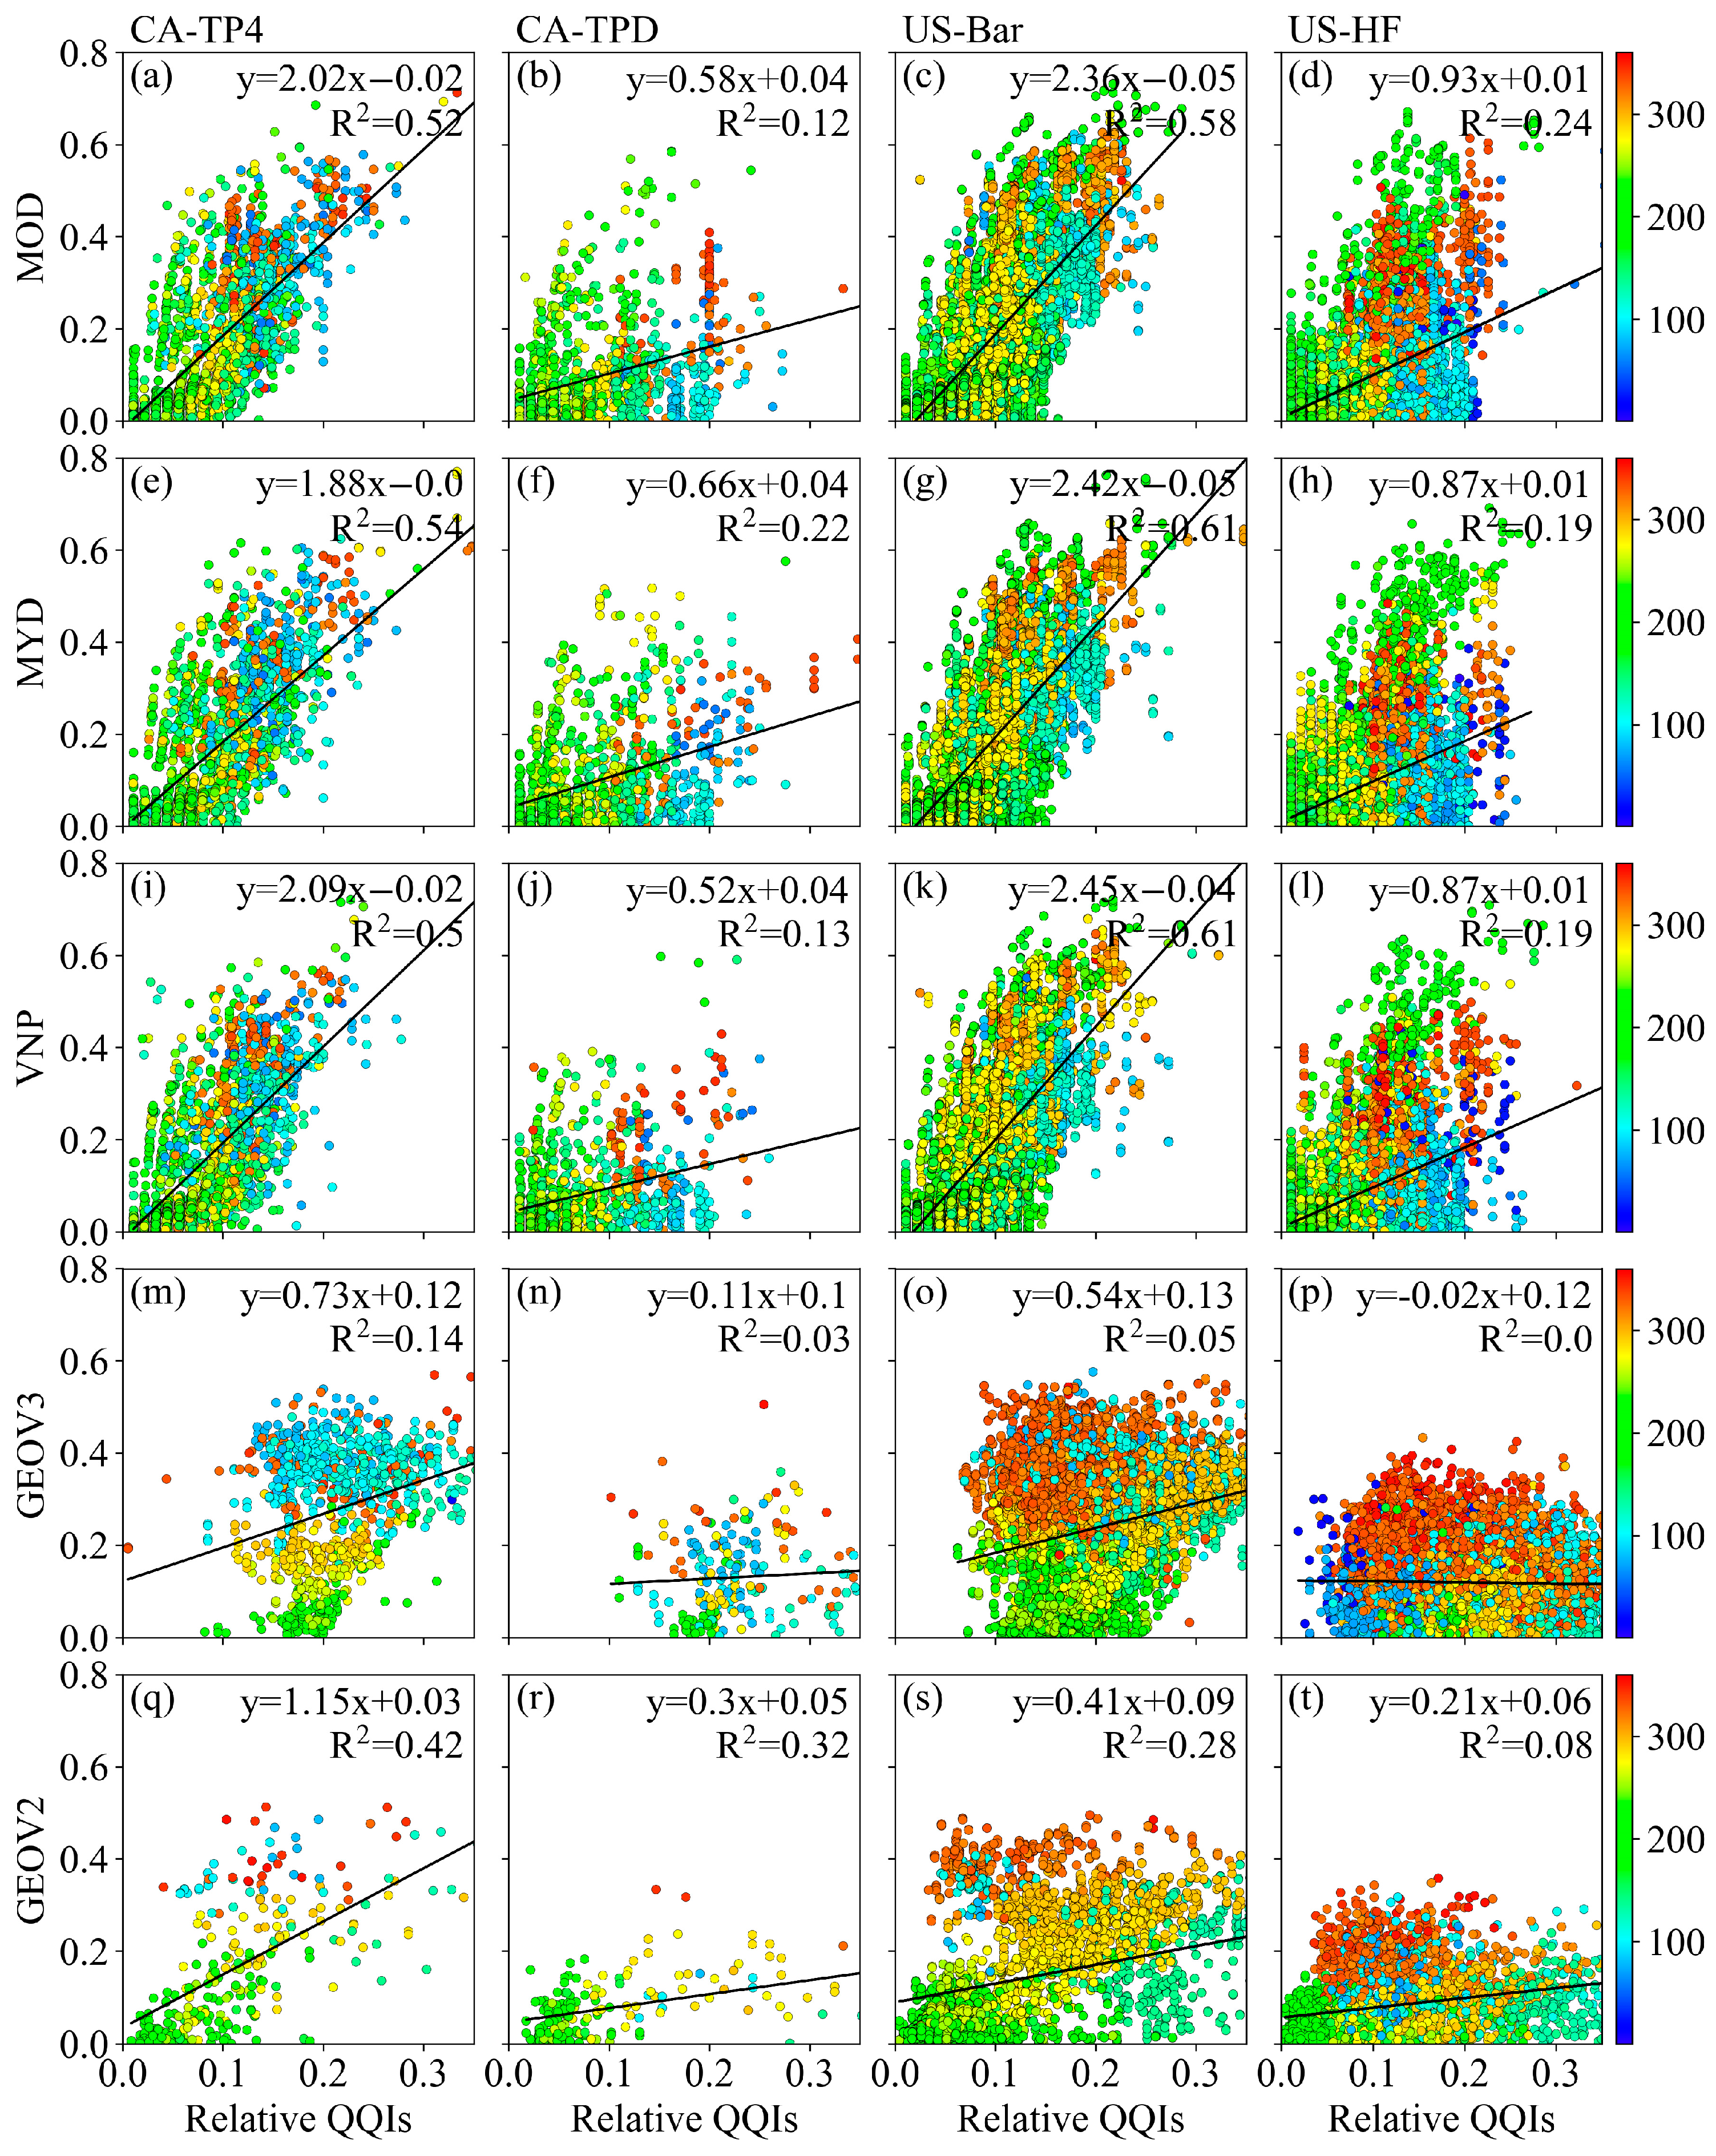
4.2. Product Quality Control Information

Figure 5 illustrates the seasonal fluctuations in the proportion of FAPAR retrievals corresponding to different quality statuses as denoted by QQFs. The MOD, MYD, and VNP exhibited similar patterns at the same location. Throughout the entire growing season (DOY100–DOY280), nearly all FAPAR values were retrieved using the main algorithm, although some values were identified as saturated values during the peak growing season (DOY120–250). The proportion of the main algorithm retrievals was considerably lower during the non-growing season (DOY = 1–80, 320–365) when the empirical backup algorithm was predominantly utilized. During the peak growing season (DOY120–280), 20–30% of the pixels were retrieved by the empirical backup algorithm.
The percentages of unsaturated values from the main algorithm in the VNP product were higher than those in the MOD and MYD at the CA-TP4 and CA-TPD sites, particularly during DOY 150–280 (Figure 5c,h). For MOD and MYD, more than 50% of the FAPAR at CA-TP4 and CA-TPD and around 20% at US-Bar and US-HF were retrieved by the empirical backup algorithm during DOY 1–80. For VNP, approximately 50% retrievals at US-Bar and US-HF sites and 10–20% at CA-TPD and CA-TP4 sites were obtained using the main algorithm but flagged as saturated during the peak growing season (DOY 120–280).
Over 80% of GEOV2 data were obtained through the direct retrieval method, and approximately 20% were obtained using the interpolation method with a negligible climatological retrieval point. The interpolation results were generally obtained during the DOY 1–120 (more than 60%) and DOY 200–240 (10–20%) periods. The CA-TP4 and CA-TPD sites exhibited a higher proportion of interpolated values (90%) than the US-Bar and US-HF sites (50%) during the DOY 1–120 period but fewer than the latter sites during the DOY 200–240 (10%) period, whereas the US-Bar and US-HF sites had 20% during the DOY 200–240 period. For the GEOV3 data, over 90% were fitted using second-degree polynomials, and approximately 10% had no valid retrievals. The interpolation results occasionally occurred at four sites, especially during the DOY 1–80 (more than 60%) and DOY 180–220 (10%) periods.
Figure 6 illustrates that the time series patterns of the QQI and the relative QQI (RQQI) at the four respective sites exhibit a high degree of similarity. The QQI and RQQI values for MOD, MYD, and VNP were relatively consistent, with slight intra-annual variation in QQI and some fluctuations in winter at the CA-TP4 site. The RQQI was lower in the growing season and higher in the winter, with marked fluctuations. The GEOV2 QQI had two peaks around DOY 200 and DOY 320, and a trough from DOY 200 to 320. In contrast, the GEOV3 QQI shows a single peak in the DOY 200–320 period. Both GEOV2 and GEOV3 RQQI show a trough at the DOY 200–320 period, while the GEOV2 RQQI exhibits greater variability.

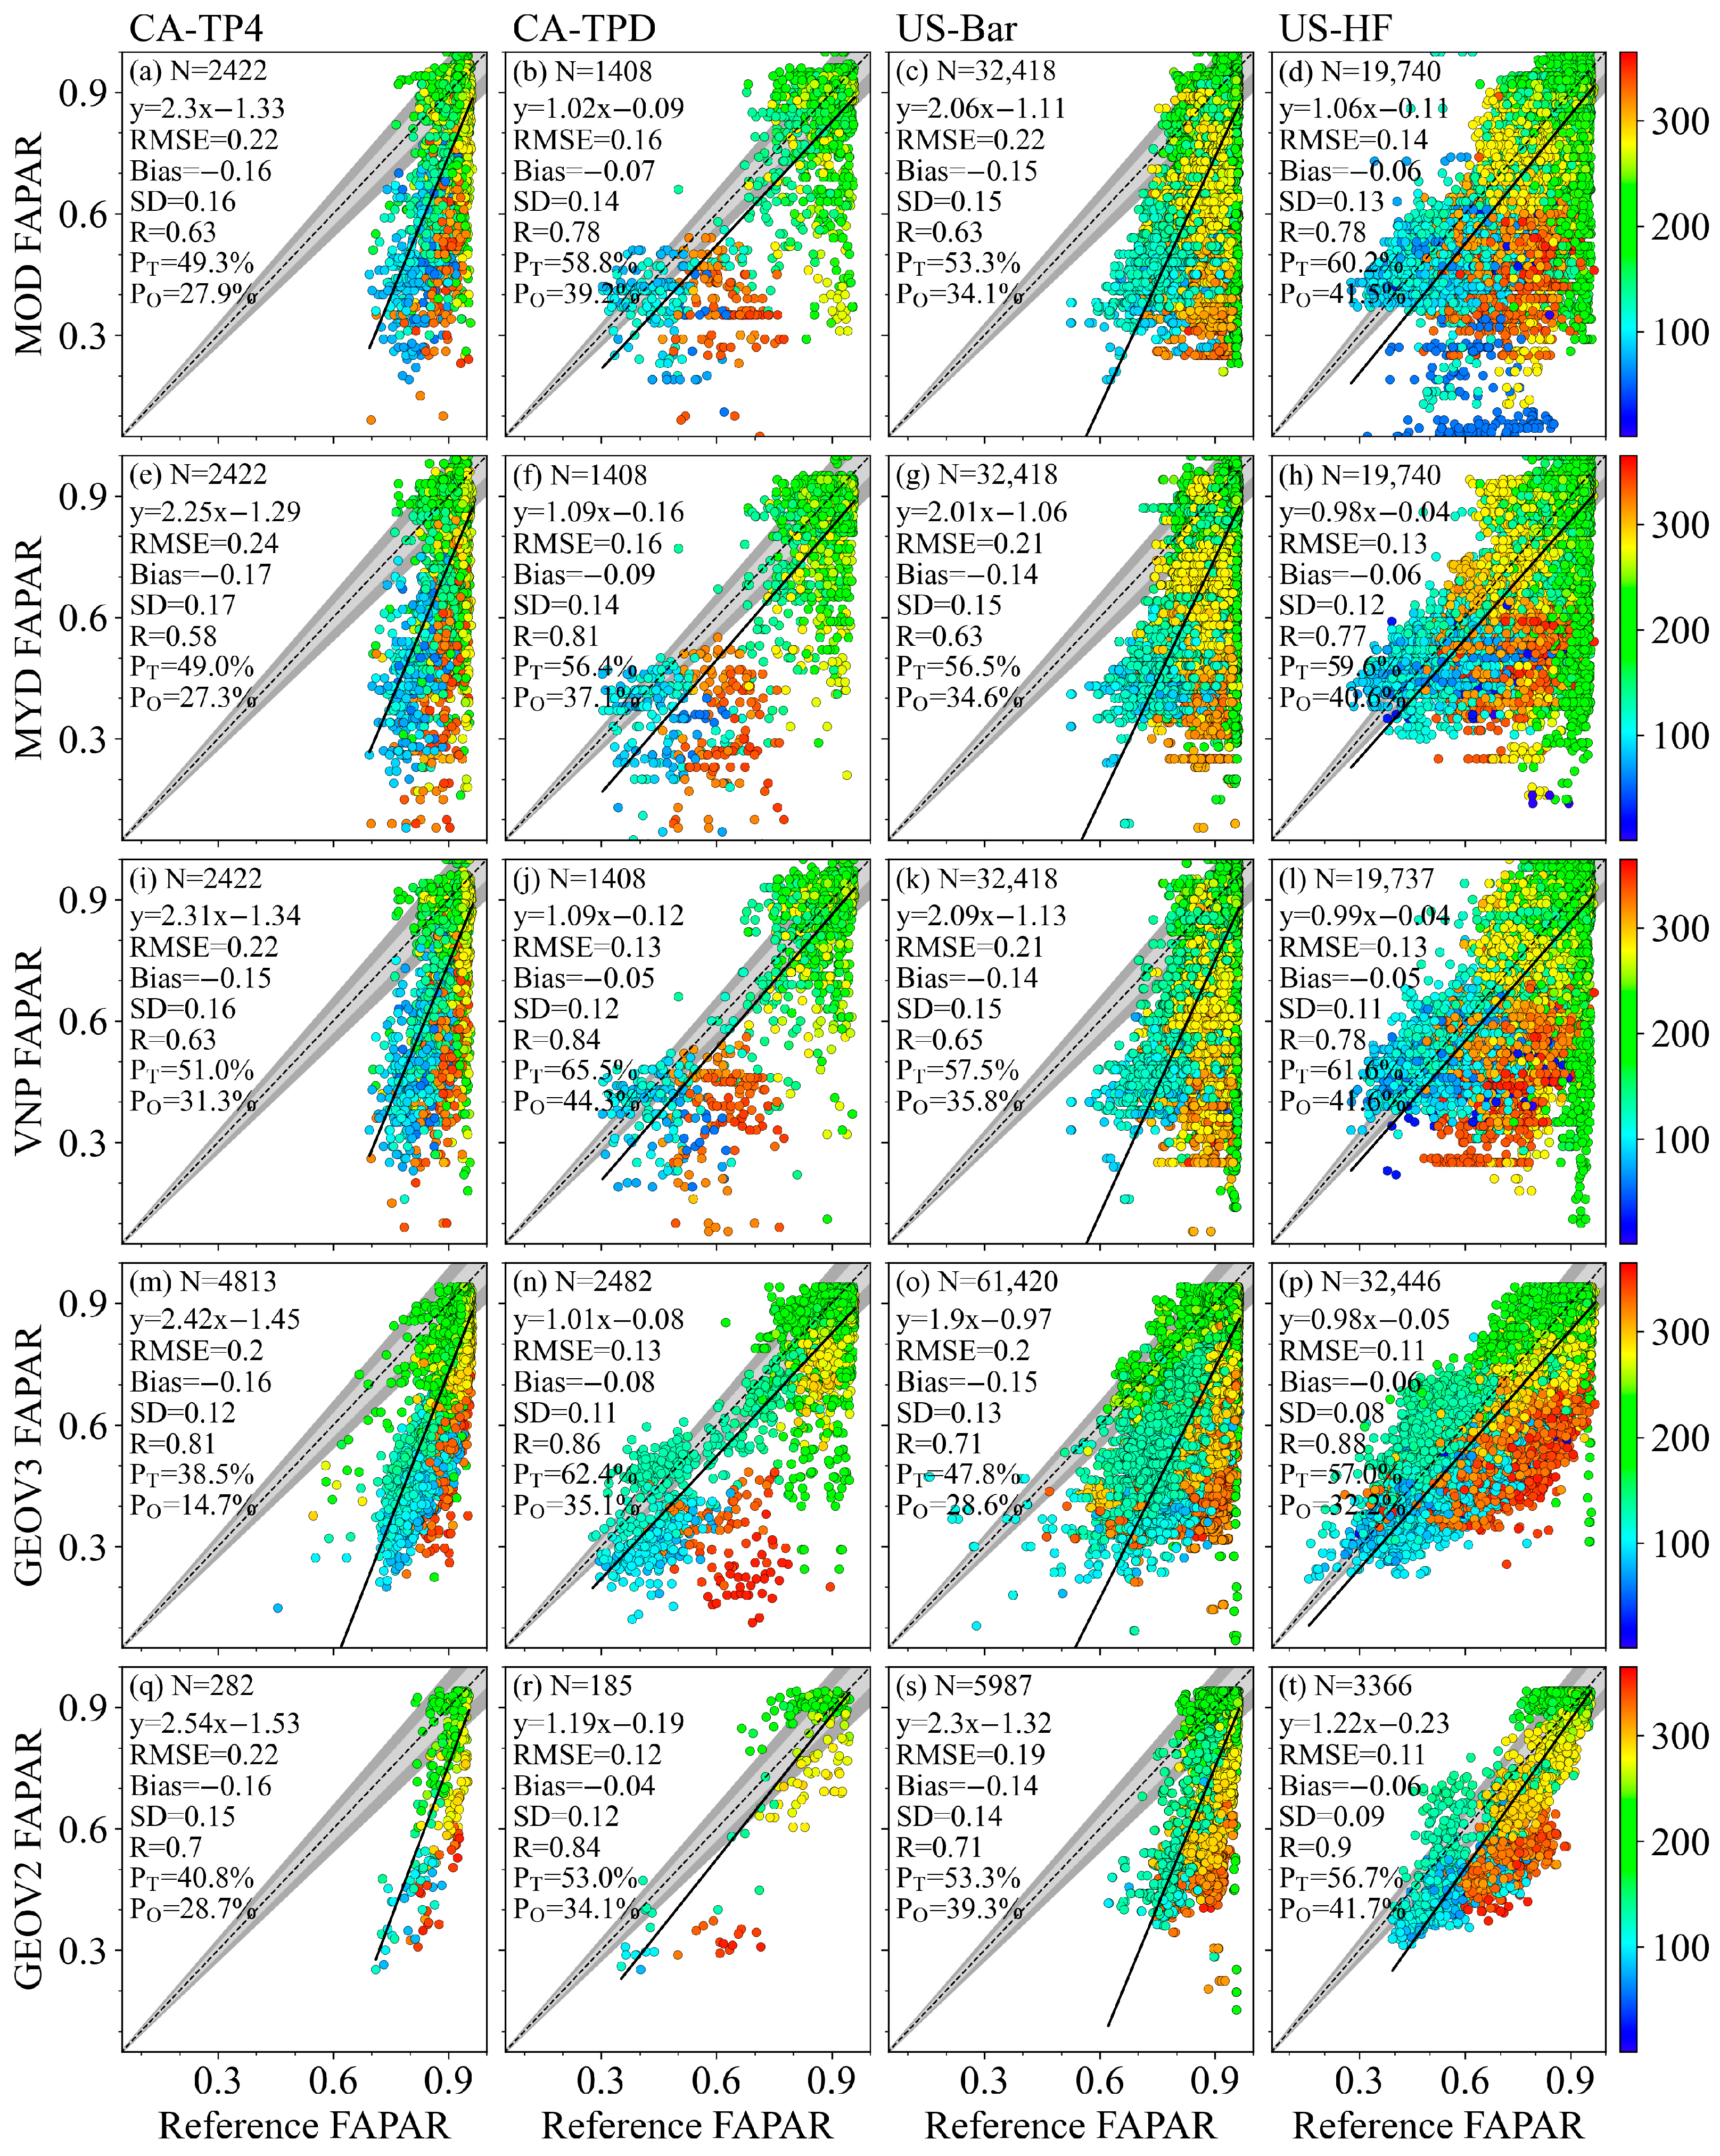
4.3. Validation of FAPAR Products

Temporal variations in moderate-resolution FAPAR products and the reference FAPAR at the four sites are presented in Figure 7. Both the FAPAR products and the reference data are generally stable from 2014 to 2020. The MOD, MYD, and VNP products exhibited notable fluctuations, especially during winter (DOY = 1–100 and 320–365) and the middle of the growing season (DOY200). In contrast, both GEOV2, GEOV3, and the reference FAPAR showed smooth curves. At the evergreen CA-TP4 site, the FAPAR products increased and then decreased throughout the year, whereas the reference FAPAR remained stable throughout the year. At CA-TPD and US-HF, the FAPAR product and the reference FAPAR exhibited the same seasonal pattern. However, at the US-Bar site, the FAPAR products were consistent with the reference data during the middle of the growing season but were lower than the latter at the beginning and end of the non-growing season. For deciduous forests, MOD, MYD, and VNP exhibit considerable fluctuations in both winter and summer, so outlier detection is necessary when using these products. GEOV2 and GEOV3, with their smoother temporal profiles, are more suitable for monitoring changes. For evergreen forests, all products show significant underestimation outside of the summer season and should thus be used with caution.
Figure 8 shows the validation results of the FAPAR products against the upscaled reference FAPAR values. All FAPAR products underestimated the reference FAPAR (bias = −0.04–−0.16), especially in the summer. GEOV2 shows better correlation with the reference FAPAR than MOD, MYD, and VNP. Moreover, statistics also show that GEOV2 is superior to the other products (bold cells in Table 5). MOD and MYD exhibited similar qualities at all four sites. Similar results were found from other alternative comparison schemes made at the plot levels (Figure S2 and Table 5). The different products demonstrated comparable quality at the same site, with the RMSE varying by less than 0.05. The product quality at the CA-TPD and US-HF sites was better than that at the US-Bar and CA-TP4 sites, as indicated by the former’s lower uncertainty, precision, and bias (Table 5).
Figure 8 also shows that a total of 34.47 ± 6.91% of the FAPAR data meet the optimal requirements of the CGLS and the goal requirements of the GCOS, while 54.41 ± 6.89% meet the target requirements of the CGLS and the threshold requirements of the GCOS. A higher percentage of VNP data meets accuracy requirements than other products (PO = 38.25% and PT = 58.90%).
The performance of different algorithms was separately evaluated for evergreen and deciduous forests (Figure 9). At the evergreen forest site, the main algorithm output shows better correlation with the reference data than that of the backup algorithm for the MOD, MYD, and VNP data (Figure 9I). The precision, accuracy, and uncertainty of the results obtained by the backup algorithm are lower than those obtained using the main algorithm (Table 5). In contrast, opposite trends are observed for GEOV2 and GEOV3 data. Moreover, a higher proportion of FAPAR values retrieved by the backup algorithm met the CGLS and GCOS quality requirements compared to those retrieved by the main algorithm, except in the case of GEOV3 (Figure 9I(g,h)). At the deciduous forest sites, the GEOV2 backup algorithm outperformed the main algorithm (Figure 9II(g,h)). For the VNP and MYD data, the main algorithm outputs correlated better with the reference FAPAR (higher R) than those from the backup algorithm; however, the backup algorithm’s precision, accuracy, and uncertainty were lower than those of the main algorithm. Nevertheless, the proportion of the backup algorithm results that met the quality requirements of the CGLS or GCOS was higher than that of the main algorithm results, except for GEOV3 data (Table 5). The backup algorithm results yield higher precision and uncertainty. Significant positive correlations are found between the uncertainties of moderate-resolution FAPAR with the relative QQIs at four sites (Figure 10), particularly at CA-TP4 and US-Bar (R2 > 0.5).

5. Discussion

5.1. FAPAR Product Quality

The validation of time series data reveals substantial uncertainties (RMSE > 0.17) across current FAPAR products in North American boreal forests (Table 5). Product accuracy is largely dependent on specific phenological stages during the growing season, primarily attributed to variations in retrieval algorithms and input data quality. FAPAR products are unable to capture boreal forest senescence and tend to underestimate the reference FAPAR of the boreal forests at the end of the growing season for the CA-TP4 and US-Bar sites, respectively. Usually, broadband sensors do not have the capability to detect slight variations in leaf color [44,45]. On the other hand, during the maturity stage, product quality exhibits substantial variability. The primary reason for this is the effect of cloud interference and algorithm saturation issues. The more pronounced disparities suggest that existing global FAPAR retrieval algorithms still have limitations in reflecting the temporal changes in plant properties at a regional level.
No significant differences were observed in the performance of each product quality when compared with the validation metrics from the reference data (Table 5). On average, 34.47 ± 6.91% of the FAPAR data meet the optimal requirements of the CGLS and the goal requirements of the GCOS, while 54.41 ± 6.89% meet the target requirements of the CGLS and the threshold requirements of the GCOS. The uncertainty was 0.17 ± 0.04, the accuracy was −0.1 ± 0.04, and the precision was 0.13 ± 0.02. These results are largely attributed to the MODIS and VIIRS FAPARs being produced by similar algorithms from similar sensors, and CGLS FAPAR products use MODIS data for training [6].
Nevertheless, we can also observe slight differences in the products. The algorithm improvement led to the VNP product producing a higher percentage of pixels meeting the requirements compared to the MOD and MYD data [5]. MODIS and VIIRS FAPAR products tend to exhibit abnormally low values during the peak growing season (DOY = 150–250), which results in an underestimation. A previous study also observed similarly low values at different sites [13]. Heavy rain and clouds contaminate the raw reflectance data, resulting in anomalously low inversion values. A backup algorithm was applied during this period due to the poor imagery quality. The FAPAR inversion results displayed fluctuations during the DOY 300–100 period due to snow. The improved VNP algorithm produced more retrievals from the main algorithm without saturation with greater algorithmic and data robustness.
GEOV2 and GEOV3 FAPAR products showed the best correlation (R > 0.79) and are smoother than MODIS and VIIRS products. Specifically, both datasets are generated using neural networks trained on MODIS FAPAR data combined with post-processing algorithms. This approach preserves the strengths of original MODIS products while reducing outlier values and enhancing overall product quality. The GEOV2 data uses an interpolation algorithm for the DOY 300–100 period with more snow cover and around DOY 220 with more clouds and rain, while GEOV3 data are filled with invalid values. The stability of the product algorithm was affected by snow in winter and by rain or clouds in summer, with large and fluctuating QQI and RQQI values (Figure 6).
Notably, the results varied significantly between sites, mainly because of differences in forest types. Typically, deciduous forest sites have higher quality than evergreen forest sites. Despite being classified as a deciduous forest site, the US-Bar consistently presented high FAPAR values, which is characteristic of evergreen forests, owing to the presence of Acer rubrum (29%) [46].

5.2. Uncertainties and Perspectives

GEOV2 and GEOV3 FAPAR products utilized the MODIS FAPAR results as a training set, which had significant errors. Therefore, with the help of ground truth data, it is worthwhile to filter out high-quality inversion results and establish a standard dataset to support multiple data sources for retrieving high-quality products using machine learning methods [47].
Variations in meteorological conditions, particularly changes in cloud cover, can affect the quality of remote sensing observations. In such cases, backup algorithms are often employed for estimation, which may lead to a decline in product quality. So, the main algorithm results are generally selected when applying products to ensure data quality, which results in quantity reduction [1,48]. However, the back-up algorithm results do not significantly differ in quality from the main algorithm results and may even outperform them in certain metrics (Figure 9). Therefore, we recommend that users do not limit their applications to only the main algorithm results [49] as doing so would result in a significant loss of data during winter when most values are derived from the backup algorithm (Figure 5). Although the QQI is gaining attention, its link to product quality has not yet been thoroughly investigated. In this paper, we present a preliminary exploration demonstrating the establishment of a relatively strong relationship between the QQI and quality at two sites. However, more robust conclusions are necessary to support the high-quality inversion results obtained through the QQI.
Misclassification of vegetation types can lead to inversion errors since all FAPAR products rely on the vegetation information in their algorithms [50]. MODIS and VIIRS use separate look-up tables for each vegetation type [51], while CGLS products use two neural network models for evergreen and non-evergreen broadleaf forests separately [6,52]. The CA-TP4 site is an evergreen needleleaf forest site [53] but was misclassified as a deciduous broadleaf forest site in the MODIS land cover product [54]. Further improvements in the MODIS land cover product, or the use of alternative products such as European Space Agency Climate Change Initiative land cover data [55], are important for FAPAR estimations.
To obtain higher accuracy inversion results for the reference data, different look-up tables for different sites were applied. Hence, incorporating more refined vegetation classifications or additional proxy variables is a promising research direction to further enhance product quality [56]. Additionally, considering the different growth stages of vegetation may improve the accuracy of the reference data, which can be applied to enhance product quality. By classifying different growth stages and sites and setting different look-up table parameters, the accuracy of the look-up table inversion results can be significantly improved. This approach is consistent with ongoing efforts to optimize the MODIS LUT algorithm.
Current instantaneous FAPAR observations from automatic measurements remain limited, with poor data continuity in recent years [28]. Multi-flux PAR measurement to obtain FAPAR is the closest measurement method to the true FAPAR. Automated PAR observations represent a relatively mature technical approach; however, only a limited number of sites currently provide PAR transmission data. Therefore, improvements in data quality and continuity are necessary. Current automatic observations focus mainly on forests and taller crops, and further development of FAPAR observations for low vegetation to validate FAPAR products is required [57].
Two stations, CA-TP4 and CA-TPD, have some heterogeneous vegetation within the surrounding 3 km × 3 km area. Therefore, we delineated homogeneous areas for validation purposes. However, the coarse resolution pixels may still be affected by the surrounding vegetation types, introducing uncertainty in the validation outcomes. Moreover, our study is based on only four boreal sites in North America, which may limit the generalizability of the validation results. To improve both the accuracy and representativeness of the evaluation, additional FAPAR observations are recommended in homogeneous forest regions, such as those provided by superstations.
The HLS dataset provides a robust foundation for the combined application of multi-source remote sensing data with an increased temporal resolution of up to four days. In this study, high-resolution reference data were derived from the HLS dataset, highlighting its exceptional ability to estimate vegetation parameters and broadening its application capability. However, due to cloud effects, significant gaps existed during the study period. Therefore, the integration of other multisource satellite data such as GF, HJ, and SPOT is essential to achieve more continuous and dense temporal coverage for vegetation change detection, in addition to Landsat and Sentinel data [58]. We minimized errors arising from the atmospheric correction of HLS, the identification of clouds and cloud shadows, the PROSAIL modeling process, and the sites’ inhomogeneities and PAR sensors by identifying pure pixels using the HLS quality marker, selecting pure areas, and pre-processing PAR data. Although uncertainties were present, the pixel-scale, point-direct, and plot-level validation yielded similar results, and we are confident that these errors do not affect the study’s conclusions (Table 5).

6. Conclusions

This study conducted a time series validation of five global moderate-resolution FAPAR products over four boreal forest sites in North America. All the FAPAR products underestimate the reference FAPAR (bias = −0.11 ± 0.04) with uncertainties (RMSE: 0.17 ± 0.04). On average, 34.47 ± 6.91% of the FAPAR data meet the optimal requirements of the CGLS and the goal requirements of the GCOS, while 54.41 ± 6.89% meet the target requirements of the CGLS and the threshold requirements of the GCOS. The performance of the FAPAR products differs depending on the type of forest and the phenological stage. The products have a tendency to provide underestimated values during the green-up and senescence stages, especially for evergreen forests. The VIIRS FAPAR is more improved than the MODIS FAPAR, but they all fluctuate and show anomalously low values during the maturity stage. The GEOV2 and GEOV3 products show smoother curves and correlate better with the in situ data than MODIS and VIIRS products. The main or backup algorithms showed nearly identical results. These findings highlight the need to improve the quality of FAPAR products, particularly for evergreen forests. This study underscores the importance of forest-specific and time series validation at the regional scale. In addition, there is a requirement for additional validation studies with sufficient field FAPAR measurements in other regions across the globe. The quality-related information put forward in this study will be of great use for the improvement of products as well as for the application community.

Supplementary Materials

The following supporting information can be downloaded at https://www.mdpi.com/article/10.3390/rs17152658/s1, Figure S1: High resolution reference FAPAR maps derived for CA-TP4 (a) and CA-TPD (b), US-HF (c), and US-Bar (d); Figure S2: Plot-level comparison of the moderate resolution FAPAR products with the average reference values at four plots.

Author Contributions

Conceptualization, Y.Z., Z.H., and H.F.; methodology, Y.Z.; validation, S.L. and Y.W.; writing—original draft preparation, Y.Z. and Z.H.; writing—review and editing, G.W. and H.F.; funding acquisition, Y.Z. and Z.H. All authors have read and agreed to the published version of the manuscript.

Funding

This work was supported by the National Natural Science Foundation of China (42201347), the Shenzhen Science and Technology Program (JCYJ20220818101617037), and the Innovation Team of the Department of Education of Guangdong Province: Unmanned Autonomous Surveying and Mapping (2024KCXTD013).

Data Availability Statement

The HLS reference FAPAR can be made available upon request.

Acknowledgments

We thank AmeriFlux (https://ameriflux.lbl.gov/, accessed on 27 July 2025) and Harvard Forest (https://harvardforest.fas.harvard.edu/, accessed on 27 July 2025) PIs and staff for publishing the in situ FAPAR data. We express our gratitude to the HLS science team (https://hls.gsfc.nasa.gov/, accessed on 27 July 2025) for providing the HLS data used in this study and to various data depositaries for making global FAPAR products accessible (Table 2). MOD15A2H/MYD15A2H/VNP15A2H (https://earthdata.nasa.gov/, accessed on 27 July 2025); GEOV2/GEOV3 (https://land.copernicus.eu/global/products/fapar/, accessed on 27 July 2025).

Conflicts of Interest

The authors declare no conflicts of interest.

References

  1. Zhang, Y.; Hu, Z.; Fang, H.; Gao, X.; Wang, J.; Wu, G. Estimation of daily FAPAR from MODIS instantaneous observations at forest sites. Agric. For. Meteorol. 2023, 331, 109336. [Google Scholar] [CrossRef]
  2. Pilaš, I.; Medved, I.; Medak, J.; Medak, D. Response strategies of the main forest types to climatic anomalies across Croatian biogeographic regions inferred from FAPAR remote sensing data. For. Ecol. Manag. 2014, 326, 58–78. [Google Scholar] [CrossRef]
  3. World Meteorological Organization. The Global Observing System for Climate Implementation Needs; GCOS: Geneva, Switzerland, 2022; p. 316. [Google Scholar]
  4. Knyazikhin, Y.; Martonchik, J.V.; Myneni, R.B.; Diner, D.J.; Running, S.W. Synergistic algorithm for estimating vegetation canopy leaf area index and fraction of absorbed photosynthetically active radiation from MODIS and MISR data. J. Geophys. Res. Atmos. 1998, 103, 32257–32275. [Google Scholar] [CrossRef]
  5. Yan, K.; Park, T.; Chen, C.; Xu, B.; Song, W.; Yang, B.; Zeng, Y.; Liu, Z.; Yan, G.; Knyazikhin, Y.; et al. Generating Global Products of LAI and FPAR From SNPP-VIIRS Data: Theoretical Background and Implementation. IEEE Trans. Geosci. Remote Sens. 2018, 56, 2119–2137. [Google Scholar] [CrossRef]
  6. Verger, A.; Baret, F.; Weiss, M. Near Real-Time Vegetation Monitoring at Global Scale. IEEE J. Sel. Top. Appl. Earth Obs. Remote Sens. 2014, 7, 3473–3481. [Google Scholar] [CrossRef]
  7. Zhang, Z.; Zhang, Y.; Zhang, Y.; Gobron, N.; Frankenberg, C.; Wang, S.; Li, Z. The potential of satellite FPAR product for GPP estimation: An indirect evaluation using solar-induced chlorophyll fluorescence. Remote Sens. Environ. 2020, 240, 111686. [Google Scholar] [CrossRef]
  8. Tao, X.; Liang, S.; Wang, D. Assessment of five global satellite products of fraction of absorbed photosynthetically active radiation: Intercomparison and direct validation against ground-based data. Remote Sens. Environ. 2015, 163, 270–285. [Google Scholar] [CrossRef]
  9. Zhang, Y.; Hu, Z.; Wang, J.; Gao, X.; Yang, C.; Yang, F.; Wu, G. Temporal upscaling of MODIS instantaneous FAPAR improves forest gross primary productivity (GPP) simulation. Int. J. Appl. Earth Obs. Geoinf. 2023, 121, 103360. [Google Scholar] [CrossRef]
  10. Fang, H.L.; Baret, F.; Plummer, S.; Schaepman-Strub, G. An Overview of Global Leaf Area Index (LAI): Methods, Products, Validation, and Applications. Rev. Geophys. 2019, 57, 739–799. [Google Scholar] [CrossRef]
  11. Yan, K.; Park, T.; Yan, G.J.; Liu, Z.; Yang, B.; Chen, C.; Nemani, R.R.; Knyazikhin, Y.; Myneni, R.B. Evaluation of MODIS LAI/FPAR Product Collection 6. Part 2: Validation and Intercomparison. Remote Sens. 2016, 8, 460. [Google Scholar] [CrossRef]
  12. Akitsu, T.K.; Nasahara, K.N. In-situ observations on a moderate resolution scale for validation of the Global Change Observation Mission-Climate ecological products: The uncertainty quantification in ecological reference data. Int. J. Appl. Earth Obs. Geoinf. 2022, 107, 102639. [Google Scholar] [CrossRef]
  13. Brown, L.A.; Meier, C.; Morris, H.; Pastor-Guzman, J.; Bai, G.; Lerebourg, C.; Gobron, N.; Lanconelli, C.; Clerici, M.; Dash, J. Evaluation of global leaf area index and fraction of absorbed photosynthetically active radiation products over North America using Copernicus Ground Based Observations for Validation data. Remote Sens. Environ. 2020, 247, 111935. [Google Scholar] [CrossRef]
  14. Fang, H.; Zhang, Y.; Wei, S.; Li, W.; Ye, Y.; Sun, T.; Liu, W. Validation of global moderate resolution leaf area index (LAI) products over croplands in northeastern China. Remote Sens. Environ. 2019, 233, 111377. [Google Scholar] [CrossRef]
  15. Xiao, Z.Q.; Liang, S.L.; Sun, R. Evaluation of Three Long Time Series for Global Fraction of Absorbed Photosynthetically Active Radiation (FAPAR) Products. IEEE Trans. Geosci. Remote Sens. 2018, 56, 5509–5524. [Google Scholar] [CrossRef]
  16. Fuster, B.; Sánchez-Zapero, J.; Camacho, F.; García-Santos, V.; Verger, A.; Lacaze, R.; Weiss, M.; Baret, F.; Smets, B. Quality Assessment of PROBA-V LAI, fAPAR and fCOVER Collection 300 m Products of Copernicus Global Land Service. Remote Sens. 2020, 12, 1017. [Google Scholar] [CrossRef]
  17. Wojnowski, W.; Wei, S.S.; Li, W.J.; Yin, T.G.; Li, X.X.; Ow, G.L.F.; Yusof, M.L.M.; Whittle, A.J. Comparison of Absorbed and Intercepted Fractions of PAR for Individual Trees Based on Radiative Transfer Model Simulations. Remote Sens. 2021, 13, 1069. [Google Scholar] [CrossRef]
  18. Trishchenko, A.P.; Cihlar, J.; Li, Z. Effects of spectral response function on surface reflectance and NDVI measured with moderate resolution satellite sensors. Remote Sens. Environ. 2002, 81, 1–18. [Google Scholar] [CrossRef]
  19. Claverie, M.; Ju, J.; Masek, J.G.; Dungan, J.L.; Vermote, E.F.; Roger, J.C.; Skakun, S.V.; Justice, C. The Harmonized Landsat and Sentinel-2 surface reflectance data set. Remote Sens. Environ. 2018, 219, 145–161. [Google Scholar] [CrossRef]
  20. Sánchez-Zapero, J.; Pérez, L.; Fuster, B. Copernicus Global Land Operations “Vegetation and Energy” “CGLOPS-1” Scientific Quality Evaluation: LAI, FAPAR FCOVER Collection 300m Version 1; Copernicus: New York, NY, USA, 2018; pp. 1–76. [Google Scholar]
  21. Fang, H.; Wang, Y.; Zhang, Y.; Li, S. Long-Term Variation of Global GEOV2 and MODIS Leaf Area Index (LAI) and Their Uncertainties: An Insight into the Product Stabilities. J. Remote Sens. 2021, 2021, 9842830. [Google Scholar] [CrossRef]
  22. Chen, C.; Park, T.; Wang, X.; Piao, S.; Xu, B.; Chaturvedi, R.K.; Fuchs, R.; Brovkin, V.; Ciais, P.; Fensholt, R.; et al. China and India lead in greening of the world through land-use management. Nat Sustain 2019, 2, 122–129. [Google Scholar] [CrossRef]
  23. Bolton, D.K.; Gray, J.M.; Melaas, E.K.; Moon, M.; Eklundh, L.; Friedl, M.A. Continental-scale land surface phenology from harmonized Landsat 8 and Sentinel-2 imagery. Remote Sens. Environ. 2020, 240, 111685. [Google Scholar] [CrossRef]
  24. Hynes, A.; Hamann, A. Moisture deficits limit growth of white spruce in the west-central boreal forest of North America. For. Ecol. Manag. 2020, 461, 117944. [Google Scholar] [CrossRef]
  25. Beamesderfer, E.R.; Arain, M.A.; Khomik, M.; Brodeur, J.J. The Impact of Seasonal and Annual Climate Variations on the Carbon Uptake Capacity of a Deciduous Forest Within the Great Lakes Region of Canada. J Geophys Res Biogeosci 2020, 125, e2019JG005389. [Google Scholar] [CrossRef]
  26. Jenkins, J.P.; Richardson, A.D.; Braswell, B.H.; Ollinger, S.V.; Hollinger, D.Y.; Smith, M.L. Refining light-use efficiency calculations for a deciduous forest canopy using simultaneous tower-based carbon flux and radiometric measurements. Agric. For. Meteorol. 2007, 143, 64–79. [Google Scholar] [CrossRef]
  27. Pilegaard, K.; Ibrom, A.; Courtney, M.S.; Hummelshøj, P.; Jensen, N.O. Increasing net CO2 uptake by a Danish beech forest during the period from 1996 to 2009. Agric. For. Meteorol. 2011, 151, 934–946. [Google Scholar] [CrossRef]
  28. Rogers, C.; Chen, J.M.; Croft, H.; Gonsamo, A.; Luo, X.; Bartlett, P.; Staebler, R.M. Daily leaf area index from photosynthetically active radiation for long term records of canopy structure and leaf phenology. Agric. For. Meteorol. 2021, 304-305, 108407. [Google Scholar] [CrossRef]
  29. Myneni, R. MODIS Collection 6 (C6) LAI/FPAR Product User’s Guide; NASA: Greenbelt, MD, USA, 2015; p. 13.
  30. Myneni, R.B.; Ramakrishna, R.; Nemani, R.; Running, S.W. Estimation of global leaf area index and absorbed par using radiative transfer models. IEEE Trans. Geosci. Remote Sens. 1997, 35, 1380–1393. [Google Scholar] [CrossRef]
  31. Pickett-Heaps, C.A.; Canadell, J.G.; Briggs, P.R.; Gobron, N.; Haverd, V.; Paget, M.J.; Pinty, B.; Raupach, M.R. Evaluation of six satellite-derived Fraction of Absorbed Photosynthetic Active Radiation (FAPAR) products across the Australian continent. Remote Sens. Environ. 2014, 140, 241–256. [Google Scholar] [CrossRef]
  32. Dierckx, W.; Sterckx, S.; Benhadj, I.; Livens, S.; Duhoux, G.; Van Achteren, T.; Francois, M.; Mellab, K.; Saint, G. PROBA-V mission for global vegetation monitoring: Standard products and image quality. Int. J. Remote Sens. 2014, 35, 2589–2614. [Google Scholar] [CrossRef]
  33. Baret, F.; Weiss, M.; Lacaze, R.; Camacho, F.; Makhmara, H.; Pacholcyzk, P.; Smets, B. GEOV1: LAI and FAPAR essential climate variables and FCOVER global time series capitalizing over existing products. Part1: Principles of development and production. Remote Sens. Environ. 2013, 137, 299–309. [Google Scholar] [CrossRef]
  34. Verger, A.; Sánchez-Zapero, J.; Weiss, M.; Descals, A.; Camacho, F.; Lacaze, R.; Baret, F. GEOV2: Improved smoothed and gap filled time series of LAI, FAPAR and FCover 1 km Copernicus Global Land products. Int. J. Appl. Earth Obs. Geoinf. 2023, 123, 103479. [Google Scholar] [CrossRef]
  35. Morisette, J.T.; Baret, F.; Privette, J.L.; Myneni, R.B.; Nickeson, J.E.; Garrigues, S.; Shabanov, N.V.; Weiss, M.; Fernandes, R.A.; Leblanc, S.G.; et al. Validation of global moderate-resolution LAI products:: A framework proposed within the CEOS Land Product Validation subgroup. IEEE Trans. Geosci. Remote Sens. 2006, 44, 1804–1817. [Google Scholar] [CrossRef]
  36. Li, S.; Fang, H.; Zhang, Y.; Wang, Y. Comprehensive evaluation of global CI, FVC, and LAI products and their relationships using high-resolution reference data. Sci. Remote Sens. 2022, 6, 100066. [Google Scholar] [CrossRef]
  37. Jacquemoud, S.; Verhoef, W.; Baret, F.; Bacour, C.; Zarco-Tejada, P.J.; Asner, G.P.; François, C.; Ustin, S.L. PROSPECT+SAIL models: A review of use for vegetation characterization. Remote Sens. Environ. 2009, 113, S56–S66. [Google Scholar] [CrossRef]
  38. Zhang, Y.; Fang, H.; Wang, Y.; Li, S. Variation of intra-daily instantaneous FAPAR estimated from the geostationary Himawari-8 AHI data. Agric. For. Meteorol. 2021, 307, 108535. [Google Scholar] [CrossRef]
  39. Li, W.J.; Weiss, M.; Garric, B.; Champolivier, L.; Jiang, J.Y.; Wu, W.B.; Baret, F. Mapping Crop Leaf Area Index and Canopy Chlorophyll Content Using UAV Multispectral Imagery: Impacts of Illuminations and Distribution of Input Variables. Remote Sens. 2023, 15, 1539. [Google Scholar] [CrossRef]
  40. Hussain, N.; Gonsamo, A.; Wang, S.; Arain, M.A. Assessment of spongy moth infestation impacts on forest productivity and carbon loss using the Sentinel-2 satellite remote sensing and eddy covariance flux data. Ecol. Process 2024, 13, 37. [Google Scholar] [CrossRef] [PubMed]
  41. Zhang, Q.; Xiao, X.; Braswell, B.; Linder, E.; Ollinger, S.; Smith, M.-L.; Jenkins, J.P.; Baret, F.; Richardson, A.D.; Moore, B.; et al. Characterization of seasonal variation of forest canopy in a temperate deciduous broadleaf forest, using daily MODIS data. Remote Sens. Environ. 2006, 105, 189–203. [Google Scholar] [CrossRef]
  42. Sinha, S.K.; Padalia, H.; Dasgupta, A.; Verrelst, J.; Rivera, J.P. Estimation of leaf area index using PROSAIL based LUT inversion, MLRA-GPR and empirical models: Case study of tropical deciduous forest plantation, North India. Int. J. Appl. Earth Obs. Geoinf. 2020, 86, 102027. [Google Scholar] [CrossRef]
  43. Féret, J.B.; Gitelson, A.A.; Noble, S.D.; Jacquemoud, S. PROSPECT-D: Towards modeling leaf optical properties through a complete lifecycle. Remote Sens. Environ. 2017, 193, 204–215. [Google Scholar] [CrossRef]
  44. Majasalmi, T.; Rautiainen, M.; Stenberg, P. Modeled and measured fPAR in a boreal forest: Validation and application of a new model. Agric. For. Meteorol. 2014, 189-190, 118–124. [Google Scholar] [CrossRef]
  45. Gobron, N.; Pinty, B.; Aussedat, O.; Taberner, M.; Faber, O.; Melin, F.; Lavergne, T.; Robustelli, M.; Snoeij, P. Uncertainty estimates for the FAPAR operational products derived from MERIS—Impact of top-of-atmosphere radiance uncertainties and validation with field data. Remote Sens. Environ. 2008, 112, 1871–1883. [Google Scholar] [CrossRef]
  46. Ouimette, A.P.; Ollinger, S.V.; Richardson, A.D.; Hollinger, D.Y.; Keenan, T.F.; Lepine, L.C.; Vadeboncoeur, M.A. Carbon fluxes and interannual drivers in a temperate forest ecosystem assessed through comparison of top-down and bottom-up approaches. Agric. For. Meteorol. 2018, 256, 420–430. [Google Scholar] [CrossRef]
  47. Ma, H.; Liang, S. Development of the GLASS 250-m leaf area index product (version 6) from MODIS data using the bidirectional LSTM deep learning model. Remote Sens. Environ. 2022, 273, 112985. [Google Scholar] [CrossRef]
  48. Munier, S.; Carrer, D.; Planque, C.; Camacho, F.; Albergel, C.; Calvet, J.C. Satellite Leaf Area Index: Global Scale Analysis of the Tendencies Per Vegetation Type Over the Last 17 Years. Remote Sens. 2018, 10, 424. [Google Scholar] [CrossRef]
  49. Yan, K.; Zhang, X.; Peng, R.; Gao, S.; Liu, J. The Impact of Quality Control Methods on Vegetation Monitoring Using MODIS FPAR Time Series. Forests 2024, 15, 553. [Google Scholar] [CrossRef]
  50. Fang, H.; Li, W.; Myneni, R.B. The Impact of Potential Land Cover Misclassification on MODIS Leaf Area Index (LAI) Estimation: A Statistical Perspective. Remote Sens. 2013, 5, 830–844. [Google Scholar] [CrossRef]
  51. Myneni, R.B.; Hoffman, S.; Knyazikhin, Y.; Privette, J.L.; Glassy, J.; Tian, Y.; Wang, Y.; Song, X.; Zhang, Y.; Smith, G.R.; et al. Global products of vegetation leaf area and fraction absorbed PAR from year one of MODIS data. Remote Sens. Environ. 2002, 83, 214–231. [Google Scholar] [CrossRef]
  52. Camacho, F.; Cernicharo, J.; Lacaze, R.; Baret, F.; Weiss, M. GEOV1: LAI, FAPAR essential climate variables and FCOVER global time series capitalizing over existing products. Part 2: Validation and intercomparison with reference products. Remote Sens. Environ. 2013, 137, 310–329. [Google Scholar] [CrossRef]
  53. Arain, M.A. AmeriFlux BASE CA-TP4 Ontario—Turkey Point 1939 Plantation White Pine. 2018. Available online: https://ameriflux.lbl.gov/sites/siteinfo/CA-TP4 (accessed on 27 July 2025).
  54. Sulla-Menashe, D.; Friedl, M.A. User Guide to Collection 6 MODIS Land Cover (MCD12Q1 and MCD12C1) Product; NASA: Greenbelt, MD, USA, 2018. [CrossRef]
  55. Harper, K.L.; Lamarche, C.; Hartley, A.; Peylin, P.; Ottlé, C.; Bastrikov, V.; San Martín, R.; Bohnenstengel, S.I.; Kirches, G.; Boettcher, M.; et al. A 29-year time series of annual 300 m resolution plant-functional-type maps for climate models. Earth Syst. Sci. Data 2023, 15, 1465–1499. [Google Scholar] [CrossRef]
  56. Camacho, F.; Fuster, B.; Li, W.; Weiss, M.; Ganguly, S.; Lacaze, R.; Baret, F. Crop specific algorithms trained over ground measurements provide the best performance for GAI and fAPAR estimates from Landsat-8 observations. Remote Sens. Environ. 2021, 260, 112453. [Google Scholar] [CrossRef]
  57. Bayat, B.; Camacho, F.; Nickeson, J.; Cosh, M.; Bolten, J.; Vereecken, H.; Montzka, C. Toward operational validation systems for global satellite-based terrestrial essential climate variables. Int. J. Appl. Earth Obs. Geoinf. 2021, 95, 102240. [Google Scholar] [CrossRef]
  58. Wang, M.; Zheng, Y.; Huang, C.; Meng, R.; Pang, Y.; Jia, W.; Zhou, J.; Huang, Z.; Fang, L.; Zhao, F. Assessing Landsat-8 and Sentinel-2 spectral-temporal features for mapping tree species of northern plantation forests in Heilongjiang Province, China. For. Ecosyst. 2022, 9, 100032. [Google Scholar] [CrossRef]
Figure 1. Locations of the four boreal forest sites in North America (a,b). (cf) Sample images of the four sites. The red box shows the selected homogeneous area. All images are from Google Earth®.
Remotesensing 17 02658 g001
Figure 2. Workflow of validation strategy.
Remotesensing 17 02658 g002
Figure 3. A comparison of the high-resolution HLS FAPAR (3 × 3 pixels) with the field-measured data for evergreen forests (a), deciduous forests (b), and all forest sites (c). The error bars represent the standard deviation of HLS FAPAR within the 3 × 3 pixels window. The black dashed line is the 1:1 reference line, while the black solid lines depict the fitted linear regression lines. The vertical color bar indicates the day of the year.
Remotesensing 17 02658 g003
Figure 4. Temporal variation in in situ (red) and high-resolution reference (green and blue) FAPARs. The in situ FAPAR is the instantaneous FAPAR at the HLS solar zenith angle. The reference FAPAR is extracted from the 3 × 3 pixels around the sites.
Remotesensing 17 02658 g004
Figure 5. Temporal variation in the FAPAR qualitative quality flags (QQFs) over the four sites. RT and RTsat: main radiative transfer (RT) method used with the best result and with saturation, respectively; VIgeo and VIoth: empirical vegetation index (VI) algorithms used due to bad geometry and other problems, respectively; DR: direct retrieve; CF: filled with climatology; IF: filled with interpolation; PF: second degree-polynomial fit; IN: interpolation between the two nearest dates within days; N/A: no valid retrieval.
Remotesensing 17 02658 g005
Figure 6. Temporal variation in the FAPAR quantitative quality indicators (QQIs) and relative QQIs (%) from 2014 to 2020. The relative QQI is calculated as a ratio of the QQI to the average FAPAR.
Remotesensing 17 02658 g006
Figure 7. Temporal variation in moderate-resolution FAPAR products (color lines) and HLS FAPAR (dark circle) at CA-TP4 (a), CA-TPD (b), US-Bar (c), and US-HF (d).
Remotesensing 17 02658 g007
Figure 8. A comparison of moderate-resolution FAPAR products with the upscaled reference FAPAR at the four sites. The shades stand for the uncertainty requirements (5% and 10%) considered for FAPAR products. The black dashed line is the 1:1 reference line, while the black solid lines depict the fitted linear regression lines. The vertical color bar indicates the day of the year.
Remotesensing 17 02658 g008
Figure 9. A comparison of the moderate-resolution FAPAR products with the upscaled reference FAPAR at the four sites distinguishing different algorithms at EF and DF sites. The shades stand for the uncertainty requirements (5% and 10%) considered for FAPAR products. The black dashed line is the 1:1 reference line, while the black solid lines depict the fitted linear regression lines. The vertical color bar indicates the day of the year.
Remotesensing 17 02658 g009
Figure 10. A comparison of the uncertainties of the moderate-resolution FAPAR with the relative QQIs at four sites (at). The black dashed line is the 1:1 reference line, while the black solid lines depict the fitted linear regression lines. The vertical color bar indicates the day of the year.
Remotesensing 17 02658 g010
Table 1. Site information.
Site IDNamesTypeLatitudeLongitudeDurationElevation
CA–TP4Ontario-Turkey Point 1939 Plantation White PineEvergreen Forest42.7102−80.3574 2013/12/2–2017/7/14184 m
CA–TPDOntario-Turkey Point Mature DeciduousDeciduous Forest42.6353−80.55772012/1/5–2017/12/31260 m
US–BarBartlett Experimental ForestDeciduous Forest44.0646−71.28812004/6/10–2017/12/31272 m
US–HFHarvard ForestDeciduous Forest42.5353−72.18992011/11/23–2015/8/14351 m
Table 2. Five FAPAR products validated in this study. LUT, NIR, VI, and NN stand for look-up table, near-infrared, vegetation index method, and neural network method, respectively. EBF: evergreen broadleaf forest; QQFs: qualitative quality flags.
ProductSensorSpatial
Resolution
Temporal
Resolution
PeriodMain
Algorithm
Back Up
Algorithm
QQFs
MOD15A2H.061 MODIS500 m8-day2002+LUT (red, NIR)VI (red, NIR)(1) Main method with best result
(2) Main method with good result (saturation)
(3) Empirical algorithm used due to bad geometry
(4) Empirical algorithm used due to problems other than geometry
MYD15A2H.061
VNP15A2H v002VIIRS500 m8-day2012+
GEOV2PROBA-V1 km10-day1999+NN (blue, red, NIR, observation geometry)Filled with interpolation or climatology(1) Direct retrieve (not filled)
(2) Filled with interpolation
(3) Filled with climatology
GEOV3PROBA-V1/3 km10-day2014+EBF:
NN (blue, red, NIR, observation geometry)
Others:
Second-degree polynomials fit of the NN result
EBF:
Based on previous decadal product
Others:
Filled by linear fit or nearest data
EBF
(1) Based on daily observations
(2) Based on previous dekadal product
Others:
(3) Second-degree polynomials fit
(4) Linear fit
(5) Interpolation between the two nearest dates within days
(6) Nearest data within days
Table 3. Canopy, leaf, and soil parameters used in the PROSAIL model.
ParameterCA-TP4CA-TPD/US-HFUS-Bar
MinMaxMinMaxMinMax
Canopy structureLeaf area index0807010
Leaf structure parameter0.52.750.52.750.52.75
Average leaf angle (◦)308010504080
Leaf propertyChlorophyll A and B (g/cm2)106050801050
Equivalent water thickness (cm)00.200.100.5
Dry matter content (g/cm2)00.200.100.2
Soil reflectance coefficient0.310.310.31
Diffuse fraction 0.010.60.010.60.010.6
Table 4. Metrics computed for product validation; x stands for the reference, and y stands for the FAPAR product. CGLS: Copernicus Global Land Service; GCOS: Global Climate Observing System.
MetricsExplanationInterpretation
RMSEOverall uncertainty R M S E = 1 N i = 1 N y i x i 2 (2)
BiasAccuracy B i a s = 1 N i = 1 N y i x i (3)
SDPrecision S D = 1 N 1 i = 1 N y i x i B i a s 2 (4)
RStrength of relationship between two variables R = i = 1 N ( x i x ¯ ) ( y i y ¯ ) i = 1 N ( x i x ¯ ) 2 i = 1 N ( y i y ¯ ) 2 (5)
PPercentage of pixels meeting requirementsPO: Percentage of pixels meeting the optimal requirements of the CGLS and the goal requirements of the GCOS
PT: Percentage of pixels meeting the target requirements of the CGLS and the threshold requirements of the GCOS
Table 5. Statistics from the validation of satellite FAPAR products with high-resolution reference data with different schemes. The data are from Figure 8 and Figure S2, respectively.
SitesProductsPixel-Level ComparisonPlot-Level Comparison
RRMSEBiasSDPO (%)PT (%)RRMSEBiasSDPO (%)PT (%)
(a) CA-TP4MOD0.630.22−0.160.1627.9149.300.850.21−0.160.1216.8442.11
MYD0.580.24−0.170.1727.2949.010.750.24−0.190.1510.5338.95
VNP0.630.22−0.150.1631.3050.990.840.21−0.170.139.4746.32
GEOV20.700.22−0.160.1528.7240.780.850.21−0.170.121.4730.88
GEOV30.810.20−0.160.1214.7138.480.740.22−0.170.1424.5341.51
(b) CA-TPDMOD0.780.16−0.070.1439.2058.810.890.12−0.070.134.4859.77
MYD0.810.16−0.090.1437.1456.390.890.14−0.080.1132.1857.47
VNP0.840.13−0.050.1244.3265.480.930.1−0.050.0952.8774.71
GEOV20.840.12−0.040.1234.0552.970.890.13−0.080.133.3358.73
GEOV30.860.13−0.080.1135.0962.410.910.12−0.060.1134.7852.17
(c) US-BarMOD0.630.22−0.150.1534.0653.290.790.21−0.160.1421.4749.44
MYD0.630.21−0.140.1534.6156.510.760.21−0.160.1418.0851.98
VNP0.650.21−0.140.1535.8557.510.800.2−0.150.1320.6254.52
GEOV20.710.19−0.140.1439.2553.350.750.21−0.170.1322.1444.66
GEOV30.710.20−0.150.1328.5647.810.750.19−0.140.1343.6554.31
(d) US-HFMOD0.780.14−0.060.1341.4760.240.880.11−0.060.0951.4067.60
MYD0.770.13−0.060.1240.5959.590.850.12−0.070.143.5864.80
VNP0.780.13−0.050.1141.5661.640.900.09−0.050.0752.5170.95
GEOV20.900.11−0.060.0941.6856.740.920.09−0.060.0740.6061.65
GEOV30.880.11−0.060.0832.1657.010.930.1−0.060.0943.2755.77
(e) meanMOD0.710.19−0.110.1535.6655.410.850.16−0.110.1131.0554.73
MYD0.700.19−0.120.1534.9155.380.810.18−0.130.1326.0953.30
VNP0.730.17−0.100.1438.2558.900.870.15−0.110.1133.8761.62
GEOV20.790.16−0.100.1335.9350.960.850.16−0.120.1124.3948.98
GEOV30.820.16−0.110.1127.6351.430.830.16−0.110.1236.5650.94
Disclaimer/Publisher’s Note: The statements, opinions and data contained in all publications are solely those of the individual author(s) and contributor(s) and not of MDPI and/or the editor(s). MDPI and/or the editor(s) disclaim responsibility for any injury to people or property resulting from any ideas, methods, instructions or products referred to in the content.

