
Tracking Lava Flow Cooling from Space: Implications for Erupted Volume Estimation and Cooling Mechanisms


Abstract
1. Introduction
2. Methods
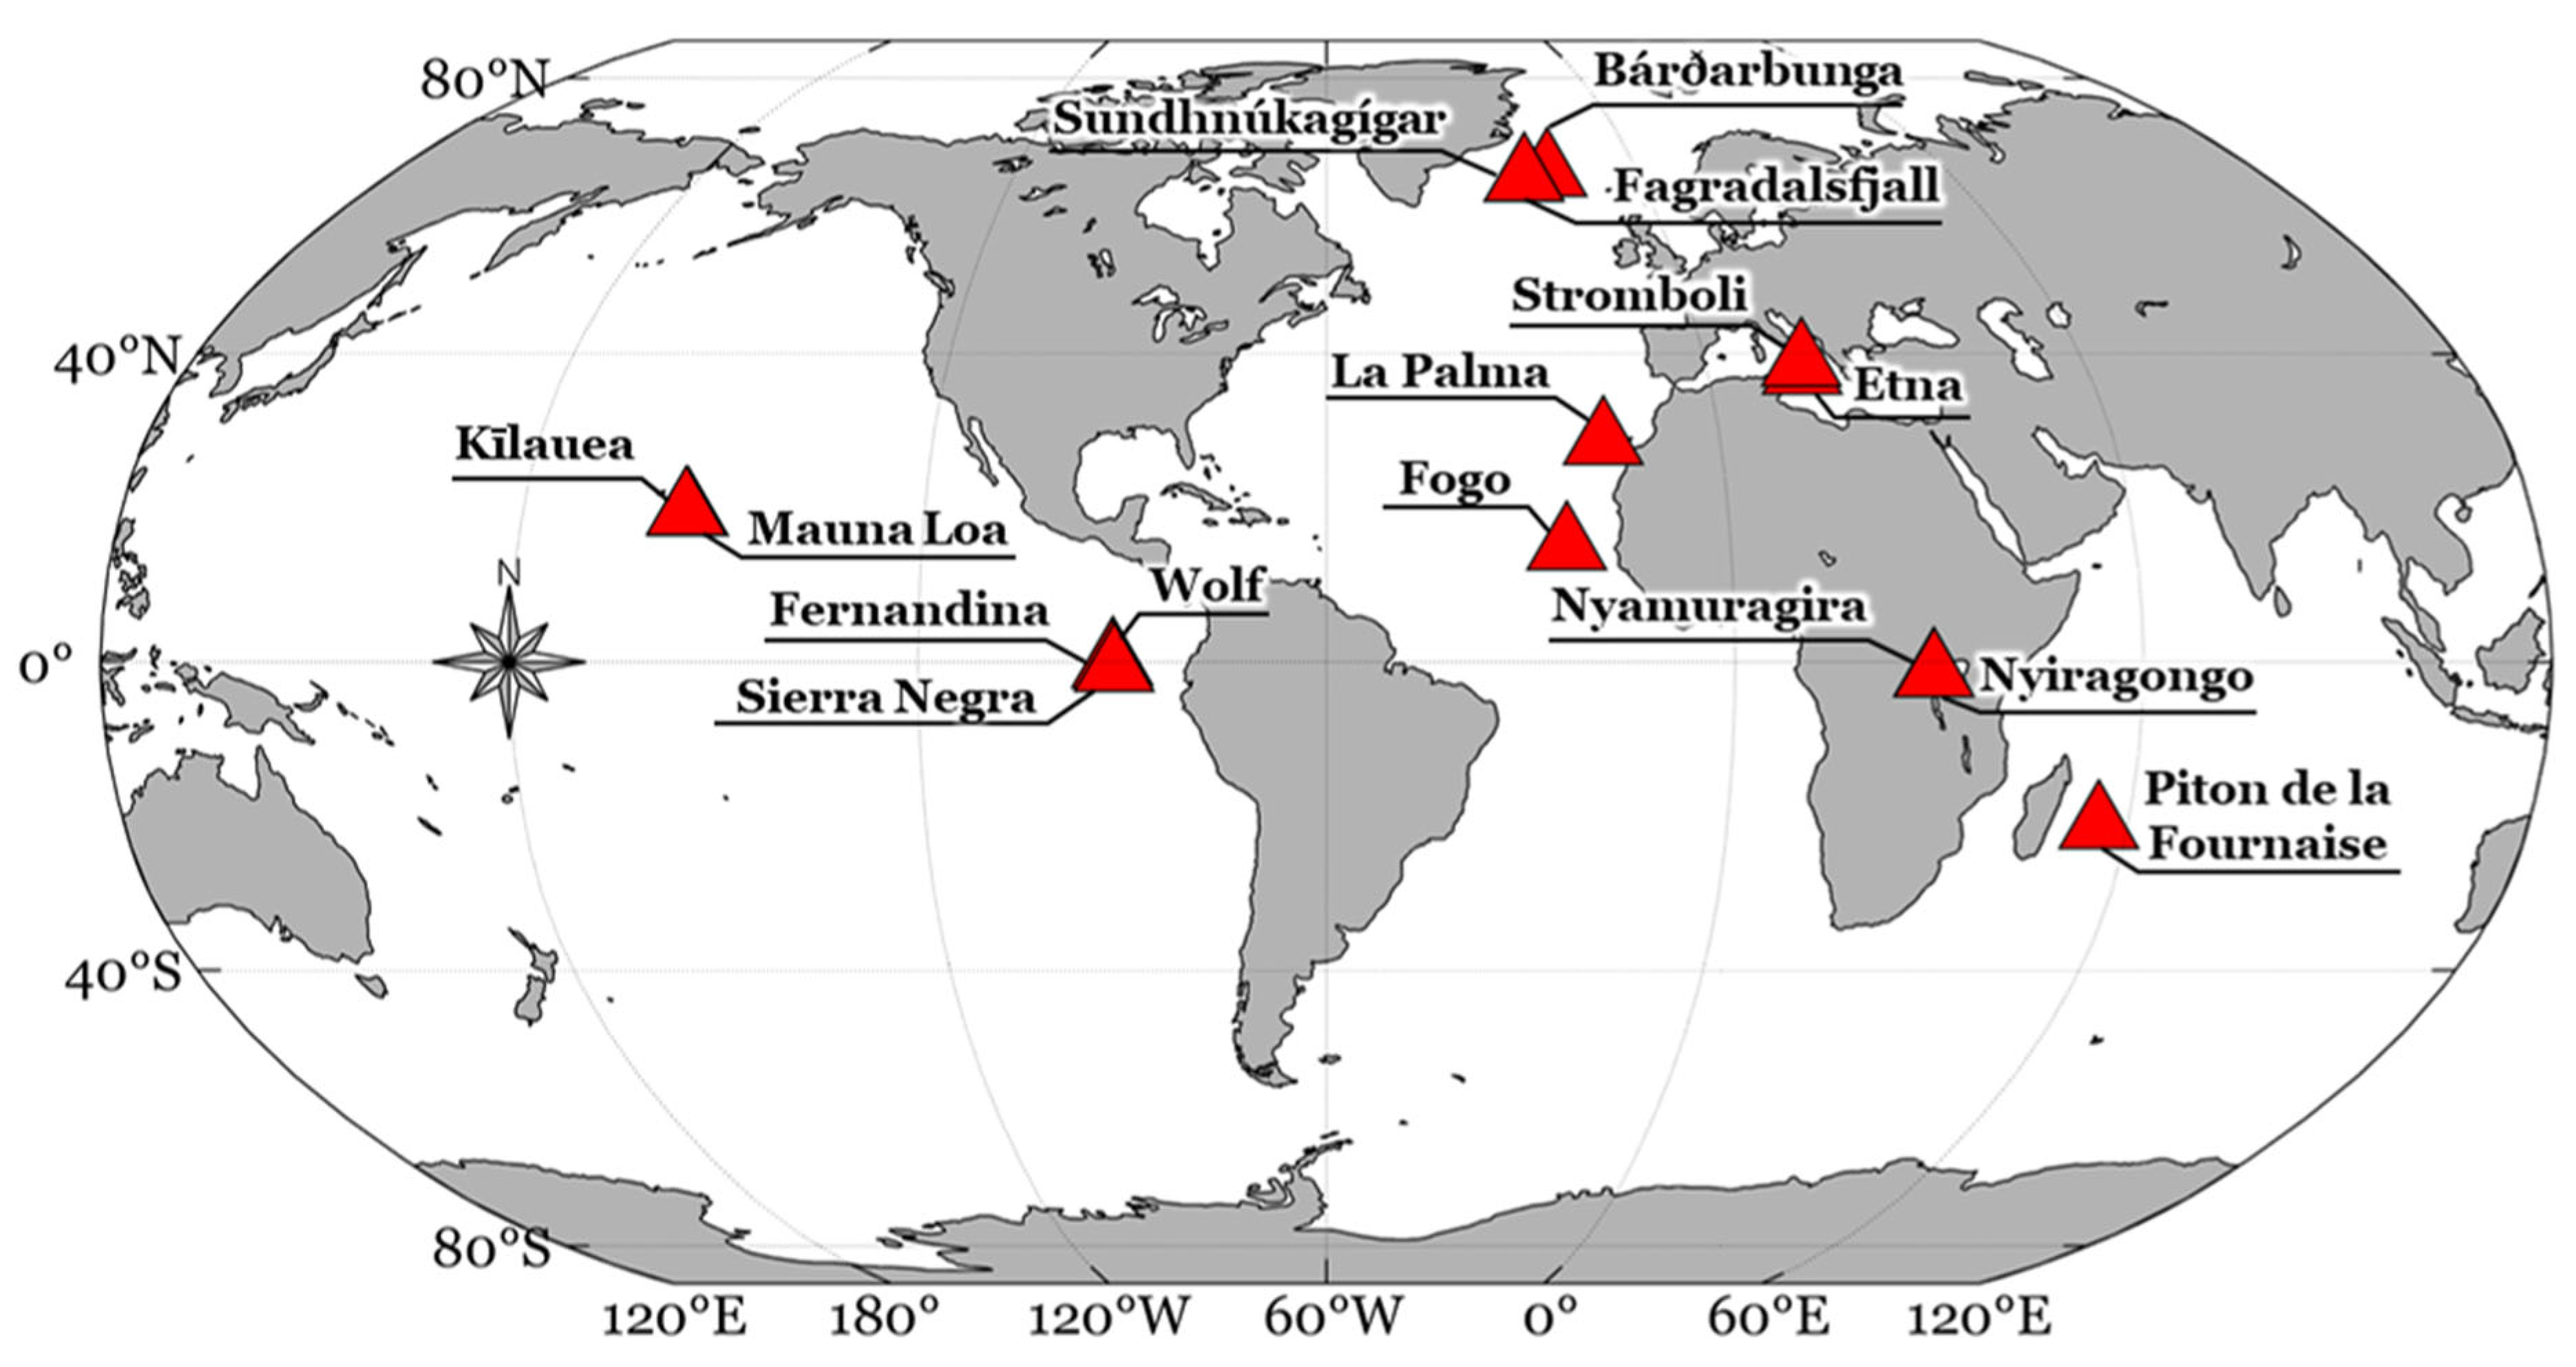
2.1. Catalog of 2010–2025 Basaltic Eruptions
- (i)
- Italy: 137 eruptions, with 134 from Mount Etna and 3 from Stromboli (2014, 2019, 2024).
- (ii)
- France (Réunion Island): 27 eruptions from Piton de la Fournaise.
- (iii)
- Iceland: 11 eruptions, including Bárðarbunga (2014), Fagradalsfjall (Geldingadalir, 2021; Meradalir, 2022; Litli-Hrútur, 2023), and 7 from Sundhnúkagígar (2023–2024).
- (iv)
- United States (Hawaiian Islands): 4 eruptions, including Pu‘u‘ō‘ō, Kīlauea (1983), Kīlauea (2018), Mauna Loa (2022), and Kīlauea (September 2024).
- (v)
- Ecuador (Galápagos Islands): 7 eruptions, including Wolf (2015, 2022), Fernandina (2017, 2018, 2020, 2024), and Sierra Negra (2018).
- (vi)
- Democratic Republic of Congo (DRC): 3 eruptions, from Nyamuragira (2010, 2011–2012) and Nyiragongo (2021).
- (vii)
- Cape Verde: 1 eruption from Fogo (2014).
- (viii)
- Spain (Canary Islands): 1 eruption from La Palma (2021).
2.2. Theoretical Framework
2.2.1. Lava Flow Thickening Curve
2.2.2. Lava Flow Cooling Curve
2.3. Satellite Data
2.3.1. TIRVolcH
2.3.2. VRPTIR
2.3.3. Derivation of Area from Cooling Curves and Parameters Setting
3. Results
3.1. Cooling Curves of Bulk Basaltic Flows
3.2. Area and Volume Retrieval from VRPTIR Cooling Curves
3.3. Applications to the February-March 2025 Etna Effusive Eruption
4. Discussion
5. Conclusions
Supplementary Materials
Author Contributions
Funding
Data Availability Statement
Acknowledgments
Conflicts of Interest
Abbreviations
| BN | Bocca Nuova |
| BT | Brightness Temperature |
| DRC | Democratic Republic of Congo |
| GCOM | Global Change Observation Mission |
| INGV | Istituto Nazionale di Geofisica e Vulcanologia |
| LAADS-DAAC | Level-1 and Atmosphere Archive & Distribution System–Distributed Active Archive Center |
| MAPE | Mean Absolute Percentage Error |
| MIR | Middle InfraRed |
| MPE | Mean Percentage Error |
| MSG | Meteosat Second Generation |
| NASA | National Aeronautics and Space Administration |
| NOAA | National Oceanic and Atmospheric Administration |
| NPP | National Polar-orbiting Partnership |
| RMSE | Root Mean Squared Error |
| SBG | Surface Biology and Geology |
| SEVIRI | Spinning Enhanced Visible and InfraRed Imager |
| TADR | Time-Averaged Discharge Rate |
| TIR | Thermal InfraRed |
| TIRVolcH | Thermal Infrared Recognition of Volcanic Hotspots |
| TRISHNA | Thermal InfraRed Imaging Satellite for High-resolution Natural resource Assessment |
| UTC | Universal Time Coordinated |
| VIIRS | Visible Infrared Imaging Radiometer Suite |
| VRP | Volcanic Radiative Power |
| VRPMIR | MIR-Based Volcanic Radiative Power |
| VRPTIR | TIR-Based Volcanic Radiative Power |
References
- Wadge, G. The variation of magma discharge during basaltic eruptions. J. Volcanol. Geotherm. Res. 1981, 11, 139–168. [Google Scholar] [CrossRef]
- Coppola, D.; Cardone, D.; Laiolo, M.; Aveni, S.; Campus, A.; Massimetti, F. Global radiant flux from active volcanoes: The 2000–2019 MIROVA database. Front. Earth Sci. 2023, 11, 1240107. [Google Scholar] [CrossRef]
- Ganci, G.; Vicari, A.; Cappello, A.; Del Negro, C. An emergent strategy for volcano hazard assessment: From thermal satellite monitoring to lava flow modeling. Remote Sens. Environ. 2012, 119, 197–207. [Google Scholar] [CrossRef]
- Calvari, S.; Nunnari, G. Etna Output Rate during the Last Decade (2011–2022): Insights for Hazard Assessment. Remote Sens. 2022, 14, 6183. [Google Scholar] [CrossRef]
- Coppola, D.; Laiolo, M.; Piscopo, D.; Cigolini, C. Rheological control on the radiant density of active lava flows and domes. J. Volcanol. Geotherm. Res. 2013, 249, 39–48. [Google Scholar] [CrossRef]
- Harris, A.J.L. Thermal Remote Sensing of Active Volcanoes: A User’s Manual; Cambridge University Press: Cambridge, UK, 2013. [Google Scholar]
- Aveni, S.; Laiolo, M.; Campus, A.; Massimetti, F.; Coppola, D. The capabilities of FY-3D/MERSI-II sensor to detect and quantify thermal volcanic activity: The 2020–2023 Mount Etna case study. Remote Sens. 2013, 15, 2528. [Google Scholar] [CrossRef]
- Aveni, S.; Laiolo, M.; Campus, A.; Massimetti, F.; Coppola, D. TIRVolcH: Thermal Infrared Recognition of Volcanic Hotspots. A single band TIR-based algorithm to detect low-to-high thermal anomalies in volcanic regions. Remote Sens. Environ. 2024, 315, 114388. [Google Scholar]
- Massimetti, F.; Laiolo, M.; Aiuppa, A.; Aveni, S.; Bitetto, M.; Campus, A.; Coltelli, M.; Cristaldi, A.; Donne, D.D.; Innocenti, L.; et al. Thermal emissions of active craters at Stromboli Volcano: Spatio-temporal insights from 10 years of satellite observations. J. Geophys. Res. Solid Earth 2024, 129, e2024JB029143. [Google Scholar] [CrossRef]
- Ganci, G.; Harris, A.J.L.; Del Negro, C.; Guéhenneux, Y.; Cappello, A.; Labazuy, P.; Calvari, S.; Gouhier, M. A year of lava fountaining at Etna: Volumes from SEVIRI, Geophys. Res. Lett. 2012, 39, L06305. [Google Scholar] [CrossRef]
- Stefan, J. Über die Theorie der Eisbildung, insbesondere über die Eisbildung im Polarmeere. Ann. Phys. Chem. 1891, 42, 269–286. [Google Scholar] [CrossRef]
- Harris, A.J.; Dehn, J.; James, M.R.; Hamilton, C.; Herd, R.; Lodato, L.; Steffke, A. Correction to “Pāhoehoe Flow Cooling, Discharge and Coverage Rates from Thermal Image Chronometry”, Geophys. Res. Lett. 2008, 35, L23303. [Google Scholar] [CrossRef]
- Harris, A.J.; Dehn, J.; James, M.R.; Hamilton, C.; Herd, R.; Lodato, L.; Steffke, A. Pāhoehoe flow cooling, discharge, and coverage rates from thermal image chronometry. Geophys. Res. Lett. 2007, 34, L19303. [Google Scholar] [CrossRef]
- Wooster, M.J.; Zhukov, B.; Oertel, D. Fire radiative energy for quantitative study of biomass burning: Derivation from the BIRD experimental satellite and comparison to MODIS fire products. Remote Sens. Environ. 2003, 86, 83–107. [Google Scholar] [CrossRef]
- Wooster, M.J.; Roberts, G.; Perry, G.L.W.; Kaufman, Y.J. Retrieval of biomass combustion rates and totals from fire radiative power observations: FRP derivation and calibration relationships between biomass consumption and fire radiative energy release. J. Geophys. Res. 2005, 110, D24311. [Google Scholar] [CrossRef]
- Wooster, M.J.; Wright, R.; Blake, S.; Rothery, D.A. Cooling mechanisms and an approximate thermal budget for the 1991–1993 Mount Etna lava flow. Geophys. Res. Lett. 1997, 24, 3277–3280. [Google Scholar] [CrossRef]
- Aveni, S.; Pailot-Bonnétat, S.; Rouwet, D.; Harris, A.J.L.; Coppola, D. Volcanic radiative power retrieval from moderate-to-low-temperature features using a single TIR band: Validation using volcanic crater lakes and hydrothermal systems. Geophys. Res. Lett. 2025, 52, e2024GL113324. [Google Scholar] [CrossRef]
- Pawlowicz, R. M_Map: A Mapping Package for MATLAB, Version 1.4 m. Computer Software. Available online: www.eoas.ubc.ca/~rich/map.html (accessed on 11 April 2025).
- Hon, K.E.N.; Kauahikaua, J.I.M.; Denlinger, R.; Mackay, K. Emplacement and inflation of pahoehoe sheet flows: Observations and measurements of active lava flows on Kilauea Volcano, Hawaii. Geol. Soc. Am. Bull. 1994, 106, 351–370. [Google Scholar] [CrossRef]
- Huppert, H.E. The propagation of two-dimensional and axisymmetric viscous gravity currents over a rigid horizontal surface. J. Fluid. Mech. 1982, 121, 43–58. [Google Scholar] [CrossRef]
- Griffiths, R.W. The dynamics of lava flows. Annu. Rev. Fluid Mech. 2000, 32, 477–518. [Google Scholar] [CrossRef]
- Turcotte, D.L.; Schubert, G. Geodynamics, 2nd ed.; Cambridge University Press: Cambridge, UK, 2002. [Google Scholar]
- Turcotte, D.L.; Schubert, G. Geodynamics, 3rd ed.; Cambridge University Press: Cambridge, UK, 2014. [Google Scholar]
- Cao, C.; Xiong, X.; Wolfe, R.; DeLuccia, F.; Liu, Q.; Blonski, S.; Lin, G.; Nishihama, M.; Pogorzala, D.; Oudrari, H.; et al. Visible Infrared Imaging Radiometer Suite (VIIRS) Sensor Data Record (SDR) User’s Guide; Version 1.2; NOAA Technical Report NESDIS, 142; NESDIS/NOAA/Department of Commerce: Washington, DC, USA, 2013; p. 43.
- Cao, C.; Xiong, X.; Wolfe, R.; DeLuccia, F.; Liu, Q.; Blonski, S.; Lin, G.; Nishihama, M.; Pogorzala, D.; Oudrari, H.; et al. Visible Infrared Imaging Radiometer Suite (VIIRS) Sensor Data Record (SDR) User’s Guide; Version 1.3; NOAA Technical Report NESDIS; NESDIS: College Park, MD, USA, 2017. Available online: https://ncc.nesdis.noaa.gov/documents/documentation/viirs-users-guide-tech-report-142a-v1.3.pdf (accessed on 30 November 2023).
- Campus, A.; Aveni, S.; Laiolo, M.; Massimetti, F.; Coppola, D. Thermal unrest at La Fossa (Vulcano Island, Italy): The 2021–2023 VIIRS 375 m MIROVA-processed dataset. Bull. Volcanol. 2024, 86, 25. [Google Scholar] [CrossRef]
- Harris, A.; Dehn, J.; Patrick, M.; Calvari, S.; Ripepe, M.; Lodato, L. Lava effusion rates from hand-held thermal infrared imagery: An example from the June 2003 effusive activity at Stromboli. Bull. Volcanol. 2005, 68, 107–117. [Google Scholar] [CrossRef]
- Melnik, O. Flow rate estimation in a lava tube based on surface temperature measurements. Geophys. J. Int. 2017, 208, 1716–1723. [Google Scholar] [CrossRef]
- Castro, J.M.; Feisel, Y. Reply to: Reported ultra-low lava viscosities from the 2021 La Palma eruption are potentially biased. Nat. Commun. 2023, 14, 6452. [Google Scholar] [CrossRef] [PubMed]
- Pieri, D.; Abrams, M. ASTER observations of thermal anomalies preceding the April 2003 eruption of Chikurachki volcano, Kurile Islands, Russia. Remote Sens. Environ. 2005, 99, 84–94. [Google Scholar] [CrossRef]
- Barnie, T.D.; Oppenheimer, C. Inverting Multispectral Thermal Time-Series Images of Volcanic Eruptions for Lava Emplacement Models; Geological Society, London, Special Publications: London, UK, 2015; p. 426. [Google Scholar] [CrossRef]
- Harris, A.J.L.; Favalli, M.; Steffke, A.; Fornaciai, A.; Boschi, E. A relation between lava discharge rate, thermal insulation, and flow area set using lidar data. Geophys. Res. Lett. 2010, 37, L20308. [Google Scholar] [CrossRef]
- Waples, D.W.; Waples, J.S. A Review and Evaluation of Specific Heat Capacities of Rocks, Minerals, and Subsurface Fluids. Part 1: Minerals and Nonporous Rocks. Nat. Resour. Res. 2004, 13, 97–122. [Google Scholar] [CrossRef]
- INGV (2025) Bollettino Settimanale—Settimana di Riferimento 03/02/2025–09/02/2025. Issued 11/02/2025. Rep. N. 07/2025 ETNA. 2025. Available online: www.ct.ingv.it (accessed on 1 May 2025).
- INGV (2025) Bollettino Settimanale—Settimana di Riferimento 24/02/2025–02/03/2025. Issued 04/03/2025. Rep. N. 10/2025 ETNA. 2025. Available online: www.ct.ingv.it (accessed on 1 May 2025).
- González-de-Vallejo, L.; Álvarez-Hernández, A.; Ferrer, M.; Lockwood, J.P.; Pérez, N.M.; Hernández, P.A.; Miranda-Hardisson, A.; Rodríguez-Losada, J.A.; Afonso-Falcón, D.; De-Los-Ríos, H.; et al. La Palma 2021 Eruption (Canary Islands): Measurements and Modelling of Lava Flow Cooling Rates and Applications for Infrastructure Reconstruction and Risk Mitigation. GeoHazards 2024, 5, 1093–1124. [Google Scholar] [CrossRef]
- Davies, A.G.; Matson, D.L.; Veeder, G.J.; Johnson, T.V.; Blaney, D.L. Post-solidification cooling and the age of Io’s lava flows. Icarus 2005, 176, 123–137. [Google Scholar] [CrossRef]
- Davies, A.G.; Matson, D.L.; Veeder, G.J.; Johnson, T.V.; Blaney, D.L. Corrigendum to “Post-solidification cooling and the age of Io’s lava flows” [Icarus 176 (2005) 123–137]. Icarus 2007, 186, 590. [Google Scholar] [CrossRef]
- Griffiths, R.W.; Fink, J.H. The morphology of lava flows in planetary environments: Predictions from analog experiments. J. Geophys. Res. 1992, 97, 19739–19748. [Google Scholar] [CrossRef]
- Snyder, D. Cooling of lava flows on Venus: The coupling of radiative and convective heat transfer. J. Geophys. Res. 2002, 107, 10-1–10-8. [Google Scholar] [CrossRef]
- Flynn, I.T.W.; Chevrel, M.O.; Ramsey, M.S. Adaptation of a thermorheological lava flow model for Venus conditions. J. Geophys. Res. Planets 2023, 128, e2022JE007710. [Google Scholar] [CrossRef]
- D’Incecco, P.; Filiberto, J.; Garvin, J.B.; Arney, G.N.; Getty, S.A.; Ghail, R.; Zelenyi, L.M.; Zasova, L.V.; Ivanov, M.A.; Gorinov, D.A.; et al. Mount Etna as a terrestrial laboratory to investigate recent volcanic activity on Venus by future missions: A comparison with Idunn Mons, Venus. Icarus 2024, 411, 115959. [Google Scholar] [CrossRef]
- D’Incecco, P.; Filiberto, J.; López, I.; Eggers, G.L.; Di Achille, G.; Komatsu, G.; Gorinov, D.A.; Monaco, C.; Aveni, S.; Mari, N.; et al. Geologically recent areas as one key target for identifying active volcanism on Venus. Geophys. Res. Lett. 2022, 49, e2022GL101813. [Google Scholar] [CrossRef]
- Mercogliano, F.; Barone, A.; D’Auria, L.; Castaldo, R.; Silvestri, M.; Bellucci Sessa, E.; Caputo, T.; Stroppiana, D.; Caliro, S.; Minopoli, C.; et al. Thermal Patterns at the Campi Flegrei Caldera Inferred from Satellite Data and Independent Component Analysis. Remote Sens. 2024, 16, 4615. [Google Scholar] [CrossRef]
- Tanaka, K.; Okamura, Y.; Amano, T.; Hiramatsu, M.; Shiratama, K. Operation concept of the second-generation global imager (SGLI). In Earth Observing Missions and Sensors: Development, Implementation, and Characterization; SPIE: Bellingham, WA, USA, 2010; Volume 7862, pp. 56–61. [Google Scholar]
- Tanaka, K.; Okamura, Y.; Amano, T.; Hosokawa, T.; Uchikata, T. The development status of Second Generation Global Imager (SGLI), Infrared Scanning Radiometer (SGLI-IRS). In Earth Observing Missions and Sensors: Development, Implementation, and Characterization III; SPIE: Bellingham, WA, USA, 2014; Volume 9264, pp. 89–94. [Google Scholar]
- Shreevastava, A.; Hulley, G.; Thompson, J. Algorithms for Detecting Sub-Pixel Elevated Temperature Features for the NASA Surface Biology and Geology (SBG) Designated Observable. J. Geophys. Res. Biogeosci. 2023, 128, e2022JG007370. [Google Scholar] [CrossRef]
- Thompson, J.O.; Williams, D.B.; Ramsey, M.S. The expectations and prospects for quantitative volcanology in the upcoming Surface Biology and Geology (SBG) era. Earth Space Sci. 2023, 10, e2022EA002817. [Google Scholar] [CrossRef]
- Lagouarde, J.P.; Bhattacharya, B.K.; Crebassol, P.; Gamet, P.; Babu, S.S.; Boulet, G.; Briottet, X.; Buddhiraju, K.M.; Cherchali, S.; Dadou, I.; et al. The Indian-French Trishna mission: Earth observation in the thermal infrared with high spatio-temporal resolution. In Proceedings of the IGARSS 2018–2018 IEEE International Geoscience and Remote Sensing Symposium, Valencia, Spain, 22–27 July 2018; IEEE: New York City, NY, USA, 2018; pp. 4078–4081. [Google Scholar]
- Buffet, L.; Gamet, P.; Maisongrande, P.; Salcedo, C.; Crebassol, P. The TIR instrument on TRISHNA satellite: A precursor of high resolution observation missions in the thermal infrared domain. In Proceedings of the International Conference on Space Optics—ICSO 2020, Virtual, 30 March–2 April 2021; SPIE: Bellingham, WA, USA, 2021; Volume 11852, pp. 300–310. [Google Scholar]
- Roujean, J.L.; Bhattacharya, B.; Gamet, P.; Pandya, M.R.; Boulet, G.; Olioso, A.; Singh, S.K.; Shukla, M.V.; Mishra, M.; Babu, S.; et al. TRISHNA: An Indo-French space mission to study the thermography of the earth at fine spatio-temporal resolution. In Proceedings of the 2021 IEEE International India Geoscience and Remote Sensing Symposium (InGARSS), Virtual, 6–10 December 2021; IEEE: New York City, NY, USA, 2021; pp. 49–52. [Google Scholar]
- Vidal, T.H.; Gamet, P.; Olioso, A.; Jacob, F. Optimizing TRISHNA TIR channels configuration for improved land surface temperature and emissivity measurements. Remote Sens. Environ. 2022, 272, 112939. [Google Scholar] [CrossRef]
- Buongiorno, M.F.; Lavagna, M.R.; Labate, D.; Tudor, S.V.; Masini, A.; De Carlo, P.; Romaniello, V.; Silvestri, M.; Pirat, C. Vulcain: A Cubesat Mission for Monitoring Volcanoes and Active Thermal Areas. In Proceedings of the IGARSS 2023-2023 IEEE International Geoscience and Remote Sensing Symposium, Pasadena, CA, USA, 16–21 July 2023; IEEE: New York City, NY, USA, 2023; pp. 265–267. [Google Scholar]
- Behncke, B.; Branca, S.; Corsaro, R.A.; De Beni, E.; Miraglia, L.; Proietti, C. The 2011–2012 summit activity of Mount Etna: Birth, growth and products of the new SE crater. J. Volcanol. Geotherm. Res. 2014, 270, 10–21. [Google Scholar] [CrossRef]
- Cappello, A.; Ganci, G.; Bilotta, G.; Corradino, C.; Hérault, A.; Del Negro, C. Changing eruptive styles at the south-east crater of Mount Etna: Implications for assessing lava flow hazards. Front. Earth Sci. 2019, 7, 213. [Google Scholar] [CrossRef]
- De Beni, E.; Behncke, B.; Branca, S.; Nicolosi, I.; Carluccio, R.; Caracciolo, F.A.; Chiappini, M. The continuing story of Etna’s New Southeast Crater (2012–2014): Evolution and volume calculations based on field surveys and aerophotogrammetry. J. Volcanol. Geotherm. Res. 2015, 303, 175–186. [Google Scholar] [CrossRef]
- Gambino, S.; Cannata, A.; Cannavò, F.; La Spina, A.; Palano, M.; Sciotto, M.; Spampinato, L.; Barberi, G. The unusual 28 December 2014 dike-fed paroxysm at Mount Etna: Timing and mechanism from a multidisciplinary perspective. J. Geophys. Res. Solid. Earth 2016, 121, 2037–2053. [Google Scholar] [CrossRef]
- Corsaro, R.A.; Andronico, D.; Behncke, B.; Branca, S.; Caltabiano, T.; Ciancitto, F.; Cristaldi, A.; De Beni, E.; La Spina, A.; Lodato, L.; et al. Monitoring the December 2015 summit eruptions of Mt. Etna (Italy): Implications on eruptive dynamics. J. Volcanol. Geotherm. Res. 2017, 341, 53–69. [Google Scholar] [CrossRef]
- Ferlito, C.; Bruno, V.; Salerno, G.; Caltabiano, T.; Scandura, D.; Mattia, M.; Coltorti, M. Dome-like behaviour at Mt. Etna: The case of the 28 December 2014 South East Crater paroxysm. Sci. Rep. 2017, 7, 5361. [Google Scholar] [CrossRef] [PubMed]
- INGV (2015) Bollettino Settimanale ETNA—Settimana di Riferimento 03/02/2015–09/02/2015. Available online: www.ct.ingv.it (accessed on 1 May 2025).
- INGV (2015) Bollettino Settimanale ETNA—Settimana di Riferimento 10/02/2015–16/02/2015. Available online: www.ct.ingv.it (accessed on 1 May 2025).
- Edwards, M.J.; Pioli, L.; Andronico, D.; Scollo, S.; Ferrari, F.; Cristaldi, A. Shallow factors controlling the explosivity of basaltic magmas: The 17–25 May 2016 eruption of Etna Volcano (Italy). J. Volcanol. Geotherm. Res. 2018, 357, 425–436. [Google Scholar] [CrossRef]
- Ganci, G.; Cappello, A.; Zago, V.; Bilotta, G.; Herault, A.; Del Negro, C. 3D Lava flow mapping of the 17–25 May 2016 Etna eruption using tri-stereo optical satellite data. Ann. Geophys. 2019, 62, VO220. [Google Scholar] [CrossRef]
- INGV (2016) Bollettino Settimanale ETNA—Settimana di Riferimento 24/05/2016–30/05/2016. Available online: www.ct.ingv.it (accessed on 1 May 2025).
- Cappello, A.; Ganci, G.; Bilotta, G.; Herault, A.; Zago, V.; Del Negro, C. Satellite-driven modeling approach for monitoring lava flow hazards during the 2017 Etna eruption. Ann. Geophys. 2019, 62, VO227. [Google Scholar] [CrossRef]
- De Beni, E.; Cantarero, M.; Messina, A. UAVs for volcano monitoring: A new approach applied on an active lava flow on Mt. Etna (Italy), during the 27 February–02 March 2017 eruption. J. Volcanol. Geotherm. Res. 2019, 369, 250–262. [Google Scholar] [CrossRef]
- Corradino, C.; Ganci, G.; Cappello, A.; Bilotta, G.; Hérault, A.; Del Negro, C. Mapping Recent Lava Flows at Mount Etna Using Multispectral Sentinel-2 Images and Machine Learning Techniques. Remote Sens. 2019, 11, 1916. [Google Scholar] [CrossRef]
- INGV (2016) Bollettino Settimanale ETNA—Settimana di Riferimento 28/08/2018–03/09/2018. Available online: www.ct.ingv.it (accessed on 1 May 2025).
- Laiolo, M.; Ripepe, M.; Cigolini, C.; Coppola, D.; Della Schiava, M.; Genco, R.; Innocenti, L.; Lacanna, G.; Marchetti, E.; Massimetti, F.; et al. Space- and Ground-Based Geophysical Data Tracking of Magma Migration in Shallow Feeding System of Mount Etna Volcano. Remote Sens. 2019, 11, 1182. [Google Scholar] [CrossRef]
- Calvari, S.; Bilotta, G.; Bonaccorso, A.; Caltabiano, T.; Cappello, A.; Corradino, C.; Del Negro, C.; Ganci, G.; Neri, M.; Pecora, E.; et al. The VEI 2 Christmas 2018 Etna Eruption: A Small But Intense Eruptive Event or the Starting Phase of a Larger One? Remote Sens. 2020, 12, 905. [Google Scholar] [CrossRef]
- Zuccarello, F.; Bilotta, G.; Cappello, A.; Ganci, G. Effusion Rates on Mt. Etna and Their Influence on Lava Flow Hazard Assessment. Remote Sens. 2022, 14, 1366. [Google Scholar] [CrossRef]
- De Beni, E.; Cantarero, M.; Neri, M.; Messina, A. Lava flows of Mt Etna, Italy: The 2019 eruption within the context of the last two decades (1999–2019). J. Maps 2020, 17, 65–76. [Google Scholar] [CrossRef]
- INGV (2019) Bollettino Settimanale ETNA—Settimana di Riferimento 04/06/2019–10/06/2019. Available online: www.ct.ingv.it (accessed on 1 May 2025).
- INGV (2019) Bollettino Settimanale ETNA—Settimana di Riferimento 11/06/2019–17/06/2019. Available online: www.ct.ingv.it (accessed on 1 May 2025).
- Proietti, C.; De Beni, E.; Cantarero, M. One hundred lava flows of Mt. Etna, Italy: July 2019–December 2023 update. J. Maps 2024, 20. [Google Scholar] [CrossRef]
- Aveni, S.; Blackett, M. The first evaluation of the FY-3D/MERSI-2 sensor’s thermal infrared capabilities for deriving land surface temperature in volcanic regions: A case study of Mount Etna. Int. J. Remote Sens. 2022, 43, 2777–2792. [Google Scholar] [CrossRef]
- INGV (2019) Bollettino Settimanale ETNA—Settimana di Riferimento 23/07/2019–29/07/2019. Available online: www.ct.ingv.it (accessed on 1 May 2025).
- INGV (2019) Bollettino Settimanale ETNA—Settimana di Riferimento 30/07/2019–05/08/2019. Available online: www.ct.ingv.it (accessed on 1 May 2025).
- Calvari, S.; Biale, E.; Bonaccorso, A.; Cannata, A.; Carleo, L.; Currenti, G.; Di Grazia, G.; Ganci, G.; Iozzia, A.; Pecora, E.; et al. Explosive Paroxysmal Events at Etna Volcano of Different Magnitude and Intensity Explored through a Multidisciplinary Monitoring System. Remote Sens. 2022, 14, 4006. [Google Scholar] [CrossRef]
- INGV (2020) Bollettino Settimanale ETNA—Settimana di Riferimento 15/12/2020–21/12/2020. Available online: www.ct.ingv.it (accessed on 1 May 2025).
- INGV (2021) Bollettino Settimanale ETNA—Settimana di Riferimento 29/12/2020–04/01/2021. Available online: www.ct.ingv.it (accessed on 1 May 2025).
- INGV (2021) Bollettino Settimanale ETNA—Settimana di Riferimento 19/01/2021–25/01/2021. Available online: www.ct.ingv.it (accessed on 1 May 2025).
- INGV (2021) Bollettino Settimanale ETNA—Settimana di Riferimento 26/01/2021–01/02/2021. Available online: www.ct.ingv.it (accessed on 1 May 2025).
- Proietti, C.; De Beni, E.; Cantarero, M.; Ricci, T.; Ganci, G. Rapid provision of maps and volcanological parameters: Quantification of the 2021 Etna volcano lava flows through the integration of multiple remote sensing techniques. Bull. Volcanol. 2023, 85, 58. [Google Scholar] [CrossRef]
- INGV (2021) Bollettino Settimanale ETNA—Settimana di Riferimento 21/12/2021–27/12/2021. Available online: www.ct.ingv.it (accessed on 1 May 2025).
- INGV (2022) Bollettino Settimanale ETNA—Settimana di Riferimento 15/02/2022–21/02/2022. Available online: www.ct.ingv.it (accessed on 1 May 2025).
- INGV (2022) Bollettino Settimanale ETNA—Settimana di Riferimento 01/03/2022–07/03/2022. Available online: www.ct.ingv.it (accessed on 1 May 2025).
- INGV (2022) Bollettino Settimanale ETNA—Settimana di Riferimento 14/06/2022–20/06/2022. Available online: www.ct.ingv.it (accessed on 1 May 2025).
- INGV (2022) Bollettino Settimanale ETNA—Settimana di Riferimento 06/12/2022–12/12/2022. Available online: www.ct.ingv.it (accessed on 1 May 2025).
- INGV (2023) Bollettino Settimanale ETNA—Settimana di Riferimento 23/05/2023–29/05/2023. Available online: www.ct.ingv.it (accessed on 1 May 2025).
- INGV (2023) Bollettino Settimanale ETNA—Settimana di Riferimento 16/08/2023–22/08/2023. Available online: www.ct.ingv.it (accessed on 1 May 2025).
- INGV (2023) Bollettino Settimanale ETNA—Settimana di Riferimento 21/11/2023–27/11/2023. Available online: www.ct.ingv.it (accessed on 1 May 2025).
- INGV (2023) Bollettino Settimanale ETNA—Settimana di Riferimento 05/12/2023–11/12/2023. Available online: www.ct.ingv.it (accessed on 1 May 2025).
- Calvari, S.; Nunnari, G. Reawakening of Voragine, the Oldest of Etna’s Summit Craters: Insights from a Recurrent Episodic Eruptive Behavior. Remote Sens. 2024, 16, 4278. [Google Scholar] [CrossRef]
- INGV (2024) Bollettino Settimanale ETNA—Settimana di Riferimento 09/07/2024–15/07/2024. Available online: www.ct.ingv.it (accessed on 1 May 2025).
- INGV (2024) Bollettino Settimanale ETNA—Settimana di Riferimento 23/07/2024–29/07/2024. Available online: www.ct.ingv.it (accessed on 1 May 2025).
- INGV (2024) Bollettino Settimanale ETNA—Settimana di Riferimento 30/07/2024–05/08/2024. Available online: www.ct.ingv.it (accessed on 1 May 2025).
- INGV (2024) Bollettino Settimanale ETNA—Settimana di Riferimento 13/08/2024–19/08/2024. Available online: www.ct.ingv.it (accessed on 1 May 2025).
- INGV (2025) Bollettino Settimanale ETNA—Settimana di Riferimento 11/02/2025–17/02/2025. Available online: www.ct.ingv.it (accessed on 1 May 2025).
- INGV (2025) Bollettino Settimanale ETNA—Settimana di Riferimento 18/02/2025–24/02/2025. Available online: www.ct.ingv.it (accessed on 1 May 2025).
- INGV (2025) Bollettino Settimanale ETNA—Settimana di Riferimento 04/03/2025–10/03/2025. Available online: www.ct.ingv.it (accessed on 1 May 2025).
- INGV (2025) Comunicato di Fine Fenomeno ETNA. Issued on 05/03/2025 at 11:13 (UTC). Available online: www.ct.ingv.it (accessed on 1 May 2025).
- Campus, A.; Villeneuve, N.; Chevrel, O.; Peltier, A.; Di Muro, A.; Coppola, D. Effusion rate trends at Piton de la Fournaise: A review of 24 years of space-based thermal observation. J. Geophys. Res. Solid Earth 2025, 130, e2024JB030962. [Google Scholar] [CrossRef]
- Coppola, D.; Barsotti, S.; Cigolini, C.; Laiolo, M.; Pfeffer, M.; Ripepe, M. Monitoring the time-averaged discharge rates, volumes and emplacement style of large lava flows by using MIROVA system: The case of the 2014-2015 eruption at Holuhraun (Iceland). Ann. Geophys. 2019, 61, 1–29. [Google Scholar] [CrossRef]
- Gíslason, S.R.; Stefansdottir, G.; Pfeffer, M.; Barsotti, S.; Jóhannsson, T.; Galeczka, I.M.; Bali, E.; Sigmarsson, O.; Stefánsson, A.; Keller, N.S.; et al. 2015. Environmental pressure from the 2014–15 eruption of Bárðarbunga volcano, Iceland. Geochem. Perspect. Lett. 2015, 1, 84–93. [Google Scholar] [CrossRef]
- Pedersen, G.B.M.; Höskuldsson, A.; Dürig, T.; Thordarson, T.; Jonsdottir, I.; Riishuus, M.S.; Óskarsson, B.V.; Dumont, S.; Magnússon, E.; Gudmundsson, M.T.; et al. Lava field evolution and emplacement dynamics of the 2014–2015 basaltic fissure eruption at Holuhraun, Iceland. J. Volcanol. Geotherm. Res. 2017, 340, 155–169. [Google Scholar] [CrossRef]
- Bonny, E.; Thordarson, T.; Wright, R.; Höskuldsson, A.; Jónsdóttir, I. The volume of lava erupted during the 2014 to 2015 eruption at Holuhraun, Iceland: A comparison between satellite- and ground-based measurements. J. Geophys. Res. Solid. Earth 2018, 123, 5412–5426. [Google Scholar] [CrossRef]
- National Commissioner of the Icelandic Police (Scientific Advisory Board of the Icelandic Civil Protection). Issued on 28/02/2015 at 10:00 (UTC). Crisis Coordination Centre, Skogarhlid. Available online: https://en.vedur.is/media/jar/Factsheet_Bardarbunga_20150228.pdf (accessed on 8 July 2025).
- Barsotti, S.; Parks, M.M.; Pfeffer, M.A.; Óladóttir, B.A.; Barnie, T.; Titos, M.M.; Jónsdóttir, K.; Pedersen, G.B.M.; Hjartardóttir, Á.R.; Stefansdóttir, G.; et al. The eruption in Fagradalsfjall (2021, Iceland): How the operational monitoring and the volcanic hazard assessment contributed to its safe access. Nat. Hazards 2023, 116, 3063–3092. [Google Scholar] [CrossRef]
- Pedersen, G.B.M.; Belart, J.M.C.; Óskarsson, B.V.; Gudmundsson, M.T.; Gies, N.; Högnadóttir, T.; Hjartardóttir, Á.R.; Pinel, V.; Berthier, E.; Dürig, T.; et al. Volume, effusion rate, and lava transport during the 2021 Fagradalsfjall eruption: Results from near real-time photogrammetric monitoring. Geophys. Res. Lett. 2022, 49, e2021GL097125. [Google Scholar] [CrossRef]
- Pedersen, G.; Belart, J.; Óskarsson, B.V.; Gunnarson, S.R.; Gudmundsson, M.T.; Reynolds, H.I.; Valsson, G.; Högnadóttir, T.; Pinel, V.; Parks, M.M.; et al. Volume, effusion rates and lava hazards of the 2021, 2022 and 2023 Reykjanes fires: Lessons learned from near real-time photogrammetric monitoring. In Proceedings of the EGU General Assembly Conference Abstracts, Vienna, Austria, 14–19 April 2024; p. 10724. [Google Scholar]
- Thordarson, T.; Hoskuldsson, A.; Jónsdottir, I.; Moreland, W.; Houghton, B.F.; Pálmadóttir, J.S.; Valdimarsdóttir, I.K.; Alvarez, D.B.; Grech-Licari, J.; Gallagher, C.R.; et al. The 2021, 2022 and 2023 eruptions of Fagradalsfjall Fires, Reykjanes Peninsula Iceland. In Proceedings of the AGU Fall Meeting Abstracts 2023, San Francisco, CA, USA, 11–15 December 2023; p. V32A-02. [Google Scholar]
- Moreland, W.M.; Thordarson, T.; Höskuldsson, A.; Jónsdóttir, I.; Torfadóttir, H.K.; Payet—Clerc, M.; Valdimarsdóttir, I.K.; Licari, J.G.; Pálmadóttir, J.S.; Da Silveira, B.; et al. The 2022 Meradalir eruption of the 2021-23 Fagradalsfjall Fires, Reykjanes Peninsula, and associated phenomena. In Proceedings of the AGU Fall Meeting Abstracts 2023, San Francisco, CA, USA, 11–15 December 2023; p. V32A-02. [Google Scholar]
- Global Volcanism Program. Report on Fagradalsfjall (Iceland). In Bulletin of the Global Volcanism Network; Bennis, K.L., Venzke, E., Eds.; Smithsonian Institution: Washington, DC, USA, 2022; Volume 47, p. 9. [Google Scholar] [CrossRef]
- Caracciolo, A.; Bali, E.; Ranta, E.; Halldórsson, S.A.; Guðfinnsson, G.H. Medieval and recent SO2 budgets in the Reykjanes Peninsula: Implication for future hazard. Geochem. Perspect. Lett. 2024, 30, 20–27. [Google Scholar] [CrossRef]
- Icelandic Meteorological Office (IMO). The Activity in the Reykjanes Peninsula has Entered a New Phase. 2023. Available online: https://en.vedur.is/about-imo/news/earthquake-activity-in-fagradalsfjall-area (accessed on 1 May 2025).
- Icelandic Meteorological Office (IMO). Volcanic Unrest Grindavík–Older Updates. 2024. Available online: https://en.vedur.is/about-imo/news/volcanic-unrest-grindavik-older-updates (accessed on 1 May 2025).
- Icelandic Meteorological Office (IMO). Ground Uplift and Magma Accumulation Continue Beneath Svartsengi. 2024. Available online: https://en.vedur.is/about-imo/news/volcanic-unrest-grindavik (accessed on 1 May 2025).
- Icelandic Meteorological Office (IMO). Ground Uplift Under Svartsengi Area Continues at a Stable Rate. 2024. Available online: https://en.vedur.is/about-imo/news/eruption-begins-on-the-sundhnukur-fissure-swarm (accessed on 1 May 2025).
- Jarðvísindastofnun Hía. Eldgos Norðan Grindavíkur, Niðurstöður Mælinga 14. Janúar 2024–Uppfært. 2024. Available online: https://jardvis.hi.is/is/eldgos-nordan-grindavikur-nidurstodur-maelinga-14-januar-2024-uppfaert (accessed on 1 May 2025).
- Garcia, M.O.; Pietruszka, A.J.; Norman, M.D.; Rhodes, J.M. Kīlauea’s Pu ‘u ‘Ō ‘ō Eruption (1983–2018): A synthesis of magmatic processes during a prolonged basaltic event. Chem. Geol. 2021, 581, 120391. [Google Scholar] [CrossRef]
- Lundgren, P.R.; Bagnardi, M.; Dietterich, H. Topographic changes during the 2018 Kīlauea eruption from single-pass airborne InSAR. Geophys. Res. Lett. 2019, 46, 9554–9562. [Google Scholar] [CrossRef]
- Lee, J.Y.; Jung, S.W.; Hong, S.H. Mapping lava flow from the Kilauea eruption of 2018 in the east rift zone using space-based synthetic aperture radar. GIScience Remote Sens. 2023, 60, 2176275. [Google Scholar] [CrossRef]
- Dietterich, H.R.; Diefenbach, A.K.; Soule, S.A.; Zoeller, M.H.; Patrick, M.P.; Major, J.J.; Lundgren, P.R. Lava effusion rate evolution and erupted volume during the 2018 Kīlauea lower East Rift Zone eruption. Bull. Volcanol. 2021, 83, 25. [Google Scholar] [CrossRef]
- United States Geological Survey (USGS). Kīlauea Volcano–2018 Summit and Lower East Rift Zone (LERZ). 2019. Available online: https://volcanoes.usgs.gov/vsc/file_mngr/file-179/Chronology%20of%20events%202018.pdf (accessed on 1 May 2025).
- Lynn, K.J.; Trusdell, F.A.; Downs, D.T.; Rhodes, J.M.; Chang, J.M.; Nadeau, P.A.; Bennington, N.; Lundblad, S.; Gansecki, C.; McDade, B.; et al. Time-series petrologic and geochemical monitoring of the 2022 eruption of Mauna Loa, Hawai ‘i. In Proceedings of the Goldschmidt 2023 Conference, Lyon, France, 9–14 July 2023. GOLDSCHMIDT. [Google Scholar]
- Lynn, K.J.; Downs, D.T.; Trusdell, F.A.; Wieser, P.E.; Rangel, B.; McDade, B.; Hotovec-Ellis, A.J.; Bennington, N.; Anderson, K.R.; Ruth, D.C.S.; et al. Triggering the 2022 eruption of Mauna Loa. Nat. Commun. 2024, 15, 9451. [Google Scholar] [CrossRef]
- Trusdell, F. Summary of the Mauna Loa 2022 eruption: Comparison and contrast with past eruptions. In Proceedings of the AGU Fall Meeting Abstracts 2023, San Francisco, CA, 11–15 December 2023; p. V22B-06. Available online: https://agu.confex.com/agu/fm23/meetingapp.cgi/Paper/1358779 (accessed on 1 May 2025).
- Trusdell, F.A.; Lockwood, J.P. Geologic Map of the Northwest Flank of Mauna Loa Volcano, Island of Hawai‘i, Hawaii: U.S. Geological Survey Scientific Investigations Map 2932–E, 2 Sheets, Scale 1:50,000, Pamphlet; USGS: Sunrise Valley Drive Reston, VA, USA, 2024; 37p. [Google Scholar] [CrossRef]
- Downs, D.T.; Trusdell, F.T.; Lynn, K.J.; Schmith, J.; Chang, J.M.; Gansecki, C.A.; Lundblad, S.P.; Deligne, N.I.; Orr, T.R.; Gallant, E.; et al. Sample Details and Near-Real-Time ED-XRF, Grain Size, and Grain Shape Data Collected During the November–December 2022 Eruption of Mauna Loa volcano, Island of Hawai ‘i. U.S. Geological Survey Data Release. 2023. Available online: https://www.sciencebase.gov/catalog/item/63ebfbb7d34efa0476af231f (accessed on 1 May 2025).
- Hawaiʻi Volcanoes National Park Service (NPS). September 2024 Middle East Rift Zone Eruption. 2024. Available online: https://www.nps.gov/havo/learn/nature/09152024-middle-east-rift-zone-eruption.htm (accessed on 1 May 2025).
- United States Geological Survey (USGS). 2024—Reference Map of September 2024 Kīlauea Middle East Rift Zone Eruption. 4 October 2024. Available online: https://www.usgs.gov/maps/october-4-2024-reference-map-september-2024-kilauea-middle-east-rift-zone-eruption (accessed on 1 May 2025).
- Wright, H.M.N.; Bernard, B.; Ramon, P.; Guevara, A.; Hidalgo, S.; Pacheco, D.A.; Narvaez, D.; Vasconez, F. Preliminary Results on the 2015 Eruption of Wolf Volcano, Isabela Island, Galápagos: Chronology, Dispersion of the Volcanic Products, and Insight into the Eruptive Dynamics. In Proceedings of the AGU Fall Meeting Abstracts 2015, Francisco, CA, USA, 13–18 December 2015; p. V31B-3022. [Google Scholar]
- Bernard, B.; Stock, M.J.; Coppola, D.; Hidalgo, S.; Bagnardi, M.; Gibson, S.; Hernandez, S.; Ramón, P.; Gleeson, M. Chronology and phenomenology of the 1982 and 2015 Wolf volcano eruptions, Galápagos Archipelago. J. Volcanol. Geotherm. Res. 2019, 374, 26–38. [Google Scholar] [CrossRef]
- Xu, W.; Xie, L.; Bürgmann, R.; Liu, X.; Wang, J. The 2022 eruption of Wolf volcano, Galápagos: The role of caldera ring-faults during magma transfer from InSAR deformation data. Geophys. Res. Lett. 2023, 50, e2023GL103704. [Google Scholar] [CrossRef]
- Reddin, E.; Ebmeier, S.; Bagnardi, M.; Bell, A.F.; Espín Bedón, P. Craters of habit: Patterns of deformation in the western Galápagos. Volcanica 2024, 7, 181–227. [Google Scholar] [CrossRef]
- Instituto Geofísico–Escuela Politécnica Nacional (IGEPN). Informe Especial Volcán Wolf No. 2022-003 Aparente Final del Periodo Eruptivo Quito, 05 de mayo de 2022. 2022. Available online: https://www.igepn.edu.ec/servicios/noticias/1931-informe-especial-volcan-wolf-no-2022-003 (accessed on 1 May 2025).
- Vasconez, F.J.; Ramón, P.; Hernandez, S.; Hidalgo, S.; Bernard, B.; Ruiz, M.; Alvarado, A.; La Femina, P.; Ruiz, G. The different characteristics of the recent eruptions of Fernandina and Sierra Negra volcanoes (Galápagos, Ecuador). Volcanica 2018, 1, 127–133. [Google Scholar] [CrossRef]
- Vasconez, F.J.; Anzieta, J.C.; Vásconez Müller, A.; Bernard, B.; Ramón, P. A Near Real-Time and Free Tool for the Preliminary Mapping of Active Lava Flows during Volcanic Crises: The Case of Hotspot Subaerial Eruptions. Remote Sens. 2022, 14, 3483. [Google Scholar] [CrossRef]
- Galetto, F. Complex paths of magma propagation at Fernandina (Galápagos): The coexistence of circumferential and radial dike intrusion during the January 2020 eruption. Bull. Volcanol. 2023, 85, 71. [Google Scholar] [CrossRef]
- Global Volcanism Program. Report on Fernandina (Ecuador). In Bulletin of the Global Volcanism Network; Krippner, J.B., Venzke, E., Eds.; Smithsonian Institution: Washington, DC, USA, 2022; Volume 45, p. 3. [Google Scholar] [CrossRef]
- Coppola, D.; Aveni, S.; Campus, A.; Laiolo, M.; Massimetti, F.; Bernard, B. Rapid Response to Effusive Eruptions Using Satellite Infrared Data: The March 2024 Eruption of Fernandina (Galápagos). Remote Sens. 2025, 17, 1191. [Google Scholar] [CrossRef]
- Zakšek, K.; Hort, M.; Lorenz, E. Satellite and Ground Based Thermal Observation of the 2014 Effusive Eruption at Stromboli Volcano. Remote Sens. 2015, 7, 17190–17211. [Google Scholar] [CrossRef]
- Di Traglia, F.; Calvari, S.; D’Auria, L.; Nolesini, T.; Bonaccorso, A.; Fornaciai, A.; Esposito, A.; Cristaldi, A.; Favalli, M.; Casagli, N. The 2014 Effusive Eruption at Stromboli: New Insights from In Situ and Remote-Sensing Measurements. Remote Sens. 2018, 10, 2035. [Google Scholar] [CrossRef]
- Plank, S.; Marchese, F.; Filizzola, C.; Pergola, N.; Neri, M.; Nolde, M.; Martinis, S. Lava Flows at the Sciara del Fuoco, Stromboli–Analysis from Multi-Sensor Infrared Satellite Imagery. Remote Sens. 2019, 11, 2879. [Google Scholar] [CrossRef]
- Di Traglia, F.; Fornaciai, A.; Casalbore, D.; Favalli, M.; Manzella, I.; Romagnoli, C.; Chiocci, F.L.; Cole, P.; Nolesini, T.; Casagli, N. Subaerial-submarine morphological changes at Stromboli volcano (Italy) induced by the 2019–2020 eruptive activity. Geomorphology 2022, 400, 108093. [Google Scholar] [CrossRef]
- Civico, R.; Ricci, T.; Cecili, A.; Scarlato, P. High-resolution topography reveals morphological changes of Stromboli volcano following the July 2024 eruption. Sci. Data 2024, 11, 1219. [Google Scholar] [CrossRef]
- INGV (2024) Bollettino Settimanale STROMBOLI—Settimana di Riferimento 16/07/2024–22/07/2024. Available online: www.ct.ingv.it (accessed on 1 May 2025).
- Smets, B.; d’Oreye, N.; Kervyn, F.; Kervyn, M.; Albino, F.; Arellano, S.R.; Bagalwa, M.; Balagizi, C.; Carn, S.A.; Darrah, T.H.; et al. Detailed multidisciplinary monitoring reveals pre- and co-eruptive signals at Nyamulagira volcano (North Kivu, Democratic Republic of Congo). Bull. Volcanol. 2014, 76, 787. [Google Scholar] [CrossRef]
- Coppola, D.; Cigolini, C. Thermal regimes and effusive trends at Nyamuragira volcano (DRC) from MODIS infrared data. Bull. Volcanol. 2013, 75, 744. [Google Scholar] [CrossRef]
- Balagizi, C.; Ganci, G.; Trasatti, E.; Tolomei, C.; Beccaro, L. The 2021 Nyiragongo (DR Congo) Eruptive Crisis Monitored by Multi-sensor Satellite Remote Sensing Data; EGU General Assembly: Vienna, Austria, 27 May 2022. [Google Scholar] [CrossRef]
- Smittarello, D.; Smets, B.; Barrière, J.L.; Michellier, C.; Oth, A.; Shreve, T.; Grandin, R.; Theys, N.; Brenot, H.; Cayol, V.; et al. Precursor-free eruption triggered by edifice rupture at Nyiragongo volcano. Nature 2022, 609, 83–88. [Google Scholar] [CrossRef] [PubMed]
- Copernicus EMS Rapid Mapping Activation [EMSR513] 2021. Nyiragongo Volcano’s Eruption, DR Congo and Rwanda (23 May 2021). Available online: https://mapping.emergency.copernicus.eu/activations/EMSR513/ (accessed on 1 May 2025).
- Global Volcanism Program. Report on Nyiragongo (DR Congo). In Bulletin of the Global Volcanism Network; Bennis, K.L., Venzke, E., Eds.; Smithsonian Institution: Washington, DC, USA, 2021; Volume 46, p. 6. [Google Scholar] [CrossRef]
- Bagnardi; González, P.J.; Hooper, A. High-resolution digital elevation model from tri-stereo Pleiades-1 satellite imagery for lava flow volume estimates at Fogo Volcano. Geophys. Res. Lett. 2016, 43, 6267–6275. [Google Scholar] [CrossRef]
- Cappello, A.; Ganci, G.; Calvari, S.; Pérez, N.M.; Hernández, P.A.; Silva, S.V.; Cabral, J.; Del Negro, C. Lava flow hazard modeling during the 2014–2015 Fogo eruption, Cape Verde. J. Geophys. Res. Solid Earth 2016, 121, 2290–2303. [Google Scholar] [CrossRef]
- Richter, F.; Dalfsen, Z.-V.; Fornaciai, R.M.d.S.; Pérez, N.M.; Levy, J.; Victória, S.S.; Walter, T.R. Lava flow hazard at Fogo Volcano, Cabo Verde, before and after the 2014–2015 eruption. Nat. Hazards Earth Syst. Sci. 2016, 16, 1925–1951. [Google Scholar] [CrossRef]
- Calvari, S.; Ganci, G.; Victória, S.S.; Hernandez, P.A.; Perez, N.M.; Barrancos, J.; Alfama, V.; Dionis, S.; Cabral, J.; Cardoso, N.; et al. Satellite and Ground Remote Sensing Techniques to Trace the Hidden Growth of a Lava Flow Field: The 2014–2015 Effusive Eruption at Fogo Volcano (Cape Verde). Remote Sens. 2018, 10, 1115. [Google Scholar] [CrossRef]
- Global Volcanism Program. Report on Fogo (Cabo Verde). In Bulletin of the Global Volcanism Network; Wunderman, R., Ed.; Smithsonian Institution: Washington, DC, USA, 2014; Volume 39, p. 11. [Google Scholar] [CrossRef]
- Bonadonna, C.; Pistolesi, M.; Biass, S.; Voloschina, M.; Romero, J.; Coppola, D.; Folch, A.; D’Auria, L.; Martin-Lorenzo, A.; Dominguez, L.; et al. Physical characterization of long-lasting hybrid eruptions: The 2021 Tajogaite eruption of Cumbre Vieja (La Palma, Canary Islands). J. Geophys. Res. Solid Earth 2022, 127, e2022JB025302. [Google Scholar] [CrossRef]
- Civico, R.; Ricci, T.; Scarlato, P.; Taddeucci, J.; Andronico, D.; Del Bello, E.; D’Auria, L.; Hernández, P.A. High-resolution Digital Surface Model of the 2021 eruption deposit of Cumbre Vieja volcano, La Palma, Spain. Sci. Data 2022, 9, 435. [Google Scholar] [CrossRef]
- del Fresno, C.; Cesca, S.; Klügel ACerdeña, I.D.; Díaz-Suárez, E.A.; Dahm, T.; García-Cañada, L.; Meletlidis, S.; Milkereit, C.; Valenzuela-Malebrán, C. Magmatic plumbing and dynamic evolution of the 2021 La Palma eruption. Nat. Commun. 2023, 14, 358. [Google Scholar] [CrossRef]
- Gisbert, G.; Troll, V.R.; Day, J.M.D.; Geiger, H.; Perez-Torrado, F.J.; Aulinas, M.; Deegan, F.M.; Albert, H. Reported ultra-low lava viscosities from the 2021 La Palma eruption are potentially biased. Nat. Commun. 2023, 14, 6453. [Google Scholar] [CrossRef]


| Variable | Value | Units | Reference |
|---|---|---|---|
| 273–285 | Kelvin | Variable, based on VIIRS monthly average ambient BT [8]. | |
| 1423 | Kelvin | [29] | |
| 1 | adim. | [30] | |
| 5.6704 × 10⁻⁸ | W m−2 K−4 | [6] | |
| 10–120 | W m−2 K−1 | [6] | |
| 1.5 | W m−1 K−1 | [31] | |
| 0.5 | mm2 s−1 | [10] | |
| 3.5 × 10⁵ | J kg−1 | [32] | |
| 900 | J kg−1 K−1 | [33] |
Disclaimer/Publisher’s Note: The statements, opinions and data contained in all publications are solely those of the individual author(s) and contributor(s) and not of MDPI and/or the editor(s). MDPI and/or the editor(s) disclaim responsibility for any injury to people or property resulting from any ideas, methods, instructions or products referred to in the content. |
© 2025 by the authors. Licensee MDPI, Basel, Switzerland. This article is an open access article distributed under the terms and conditions of the Creative Commons Attribution (CC BY) license (https://creativecommons.org/licenses/by/4.0/).
Share and Cite
Aveni, S.; Ganci, G.; Harris, A.J.L.; Coppola, D. Tracking Lava Flow Cooling from Space: Implications for Erupted Volume Estimation and Cooling Mechanisms. Remote Sens. 2025, 17, 2543. https://doi.org/10.3390/rs17152543
Aveni S, Ganci G, Harris AJL, Coppola D. Tracking Lava Flow Cooling from Space: Implications for Erupted Volume Estimation and Cooling Mechanisms. Remote Sensing. 2025; 17(15):2543. https://doi.org/10.3390/rs17152543
Chicago/Turabian StyleAveni, Simone, Gaetana Ganci, Andrew J. L. Harris, and Diego Coppola. 2025. "Tracking Lava Flow Cooling from Space: Implications for Erupted Volume Estimation and Cooling Mechanisms" Remote Sensing 17, no. 15: 2543. https://doi.org/10.3390/rs17152543
APA StyleAveni, S., Ganci, G., Harris, A. J. L., & Coppola, D. (2025). Tracking Lava Flow Cooling from Space: Implications for Erupted Volume Estimation and Cooling Mechanisms. Remote Sensing, 17(15), 2543. https://doi.org/10.3390/rs17152543