Abstract
The Flexible Combined Imager (FCI) instrument aboard the Meteosat Third Generation (MTG-I) geostationary satellite, launched in December 2022 and operational since September 2024, by providing shortwave infrared (SWIR), medium infrared (MIR) and thermal infrared (TIR) data, with an image refreshing time of 10 min and a spatial resolution ranging between 500 m in the high-resolution (HR) and 1–2 km in the normal-resolution (NR) mode, may represent a very promising instrument for monitoring thermal volcanic activity from space, also in operational contexts. In this work, we assess this potential by investigating the recent Mount Etna (Italy, Sicily) eruption of February–March 2025 through the analysis of daytime and night-time SWIR observations in the NR mode. The time series of a normalized hotspot index retrieved over Mt. Etna indicates that the effusive eruption started on 8 February at 13:40 UTC (14:40 LT), i.e., before information from independent sources. This observation is corroborated by the analysis of the MIR signal performed using an adapted Robust Satellite Technique (RST) approach, also revealing the occurrence of less intense thermal activity over the Mt. Etna area a few hours before (10.50 UTC) the possible start of lava effusion. By analyzing changes in total SWIR radiance (TSR), calculated starting from hot pixels detected using the preliminary NHI algorithm configuration tailored to FCI data, we inferred information about variations in thermal volcanic activity. The results show that the Mt. Etna eruption was particularly intense during 17–19 February, when the radiative power was estimated to be around 1–3 GW from other sensors. These outcomes, which are consistent with Multispectral Instrument (MSI) and Operational Land Imager (OLI) observations at a higher spatial resolution, providing accurate information about areas inundated by the lava, demonstrate that the FCI may provide a relevant contribution to the near-real-time monitoring of Mt. Etna activity. The usage of FCI data, in the HR mode, may further improve the timely identification of high-temperature features in the framework of early warning contexts, devoted to mitigating the social, environmental and economic impacts of effusive eruptions, especially over less monitored volcanic areas.
1. Introduction
Since the end of the 1970s, geostationary satellites, orbiting at 35,800 km above the Earth’s equator at the same rotational speed as Earth and providing information about the same portion of the Earth with frequent coverage (from 30 min to 10 min), have been widely used to monitor active volcanoes and their associated features (e.g., [1,2,3,4]).
Visible and infrared data from the SMS-1 (Synchronous Meteorological Satellite–1) were analyzed to characterize eight major eruptions of the Soufriere (St. Vincent) volcano in April 1979, producing ash fall, minor pyroclastic flows and base surge deposits (e.g., [2,3]). Both GOES (Geostationary Operational Environmental Satellite) and GMS (Geostationary Satellite) observations were then exploited to discriminate ash from meteorological clouds and track their space–time evolution, by using the TIR (thermal infrared) channels at around 11 µm and 12 µm wavelengths (e.g., [5,6,7,8,9,10,11]).
Moreover, the high temporal resolution (15 min) of the GOES Imager coupled with the good sensitivity of the MIR (medium infrared) band (at around 3.9 µm) to active magmatic surfaces enabled the timely identification and monitoring of effusive eruptions (e.g., [11,12,13,14,15,16,17,18]).
Table 1 reports the main literature studies investigating thermal volcanic activity also by means of MTSAT (Multi-functional Transport Satellite) 1R/2, MSG-SEVIRI (Meteosat Second Generation–Spinning Enhanced Visible Infra-Red Imager), Himawari-8 AHI (Advanced Himawari Imager) and GOES-R observations (e.g., [19,20,21,22,23,24,25,26,27,28,29,30,31,32,33,34,35,36,37,38,39,40,41,42,43]).

Table 1.
Main studies in the literature performed to monitor thermal volcanic activity through geostationary satellite data. Note that GOES-8/9/10 had the same resolutions and that GOES-16/17, belonging to GOES-R series, showed similar improved features.
Most of these studies used MSG-SEVIRI data to monitor and characterize (e.g., in terms of radiative power and lava effusion rates) active volcanoes in Europe (e.g., Etna, Stromboli) and Africa (Nyiragongo, Nyamuragira, Ol Doinyo Lengai), starting from hotspot detections automatically performed by systems operating in the MIR/TIR bands such as RST (Robust Satellite Techniques) [20], HOTSAT [22] and HOTVOLC [24].
Recent works have exploited SWIR (shortwave infrared) observations, at 1.6 µm (SWIR1) and/or 2.2 µm (SWIR2), from the Himawari-8 AHI platform to improve the identification of high-temperature features in the night-time, associated with eruptions of some Japanese (e.g., Nishinoshima) and Indonesian (e.g., Mt. Raung) volcanoes (e.g., [35,36,37,38,39]).
The NHI (normalized hotspot indices; [44]) have extended our capacity in investigating high-temperature features in daytime conditions, also through GOES-R ABI SWIR observations (e.g., [40,41,43]).
In this work, we exploit this potential by using MTG (Meteosat Third Generation)–FCI (Flexible Combined Imager) data to analyze and characterize thermal volcanic activity. The FCI, by providing state-of-the-art satellite observations of Europe and Africa, may further improve the near-real-time monitoring of weather events and natural phenomena [45], including volcanic eruptions [46].
To our knowledge, this study, focusing on the Mt. Etna (Sicily, Italy) eruption of February–March 2025, is the first one using this sensor to detect and monitor effusive eruptions from space.
2. Materials and Methods
2.1. The FCI Instrument
The FCI instrument is onboard the geostationary MTG-I satellite, which was launched in December 2022. The FCI, operational since September 2024, has 16 spectral channels, ranging from visible to infrared wavelengths [47].
Visible (VIS) and near-infrared (NIR) channels are delivered in normal resolution (NR) at 1000 m. Among them, VIS centered at 0.6 µm (VIS 0.6) and SWIR_2.2 (central wavelength at 2.2 µm) are also provided at 500 m in the high-resolution (HR) mode. Infrared (IR) channels are distributed at an NR sampling configuration of 2000 m, except for IR channels at 3.8 µm and 10.5 µm (IR 10.5), which are also provided at a resolution of 1000 m in the HR configuration. Table 2 summarizes the main characteristics of the instrument.
Table 2.
Main characteristics of the FCI instrument aboard the MTG-I platform [47]. The NIR 1.6 (SWIR1) and NIR 2.2 (SWIR2) spectral bands were used in this work.
NR is also referred to as Full Disc High Spectral Resolution Imagery (FDHSI) and HR as High Spatial Resolution Fast Imagery (HRFI). FDHSI is delivered by the EUMETCast Satellite and EUMETCast Terrestrial, while HRFI is only distributed by the EUMETCast Terrestrial system [47].
All channels are able to scan the full Earth disc in 10 min (full disc scanning service—FDSS), but future MTG missions will support rapid scanning service (RSS) with the acquisition of the upper quarter of the disc (mainly containing Europe) in 2.5 min [47].
2.2. Mt. Etna Eruptive Events of February–March 2025
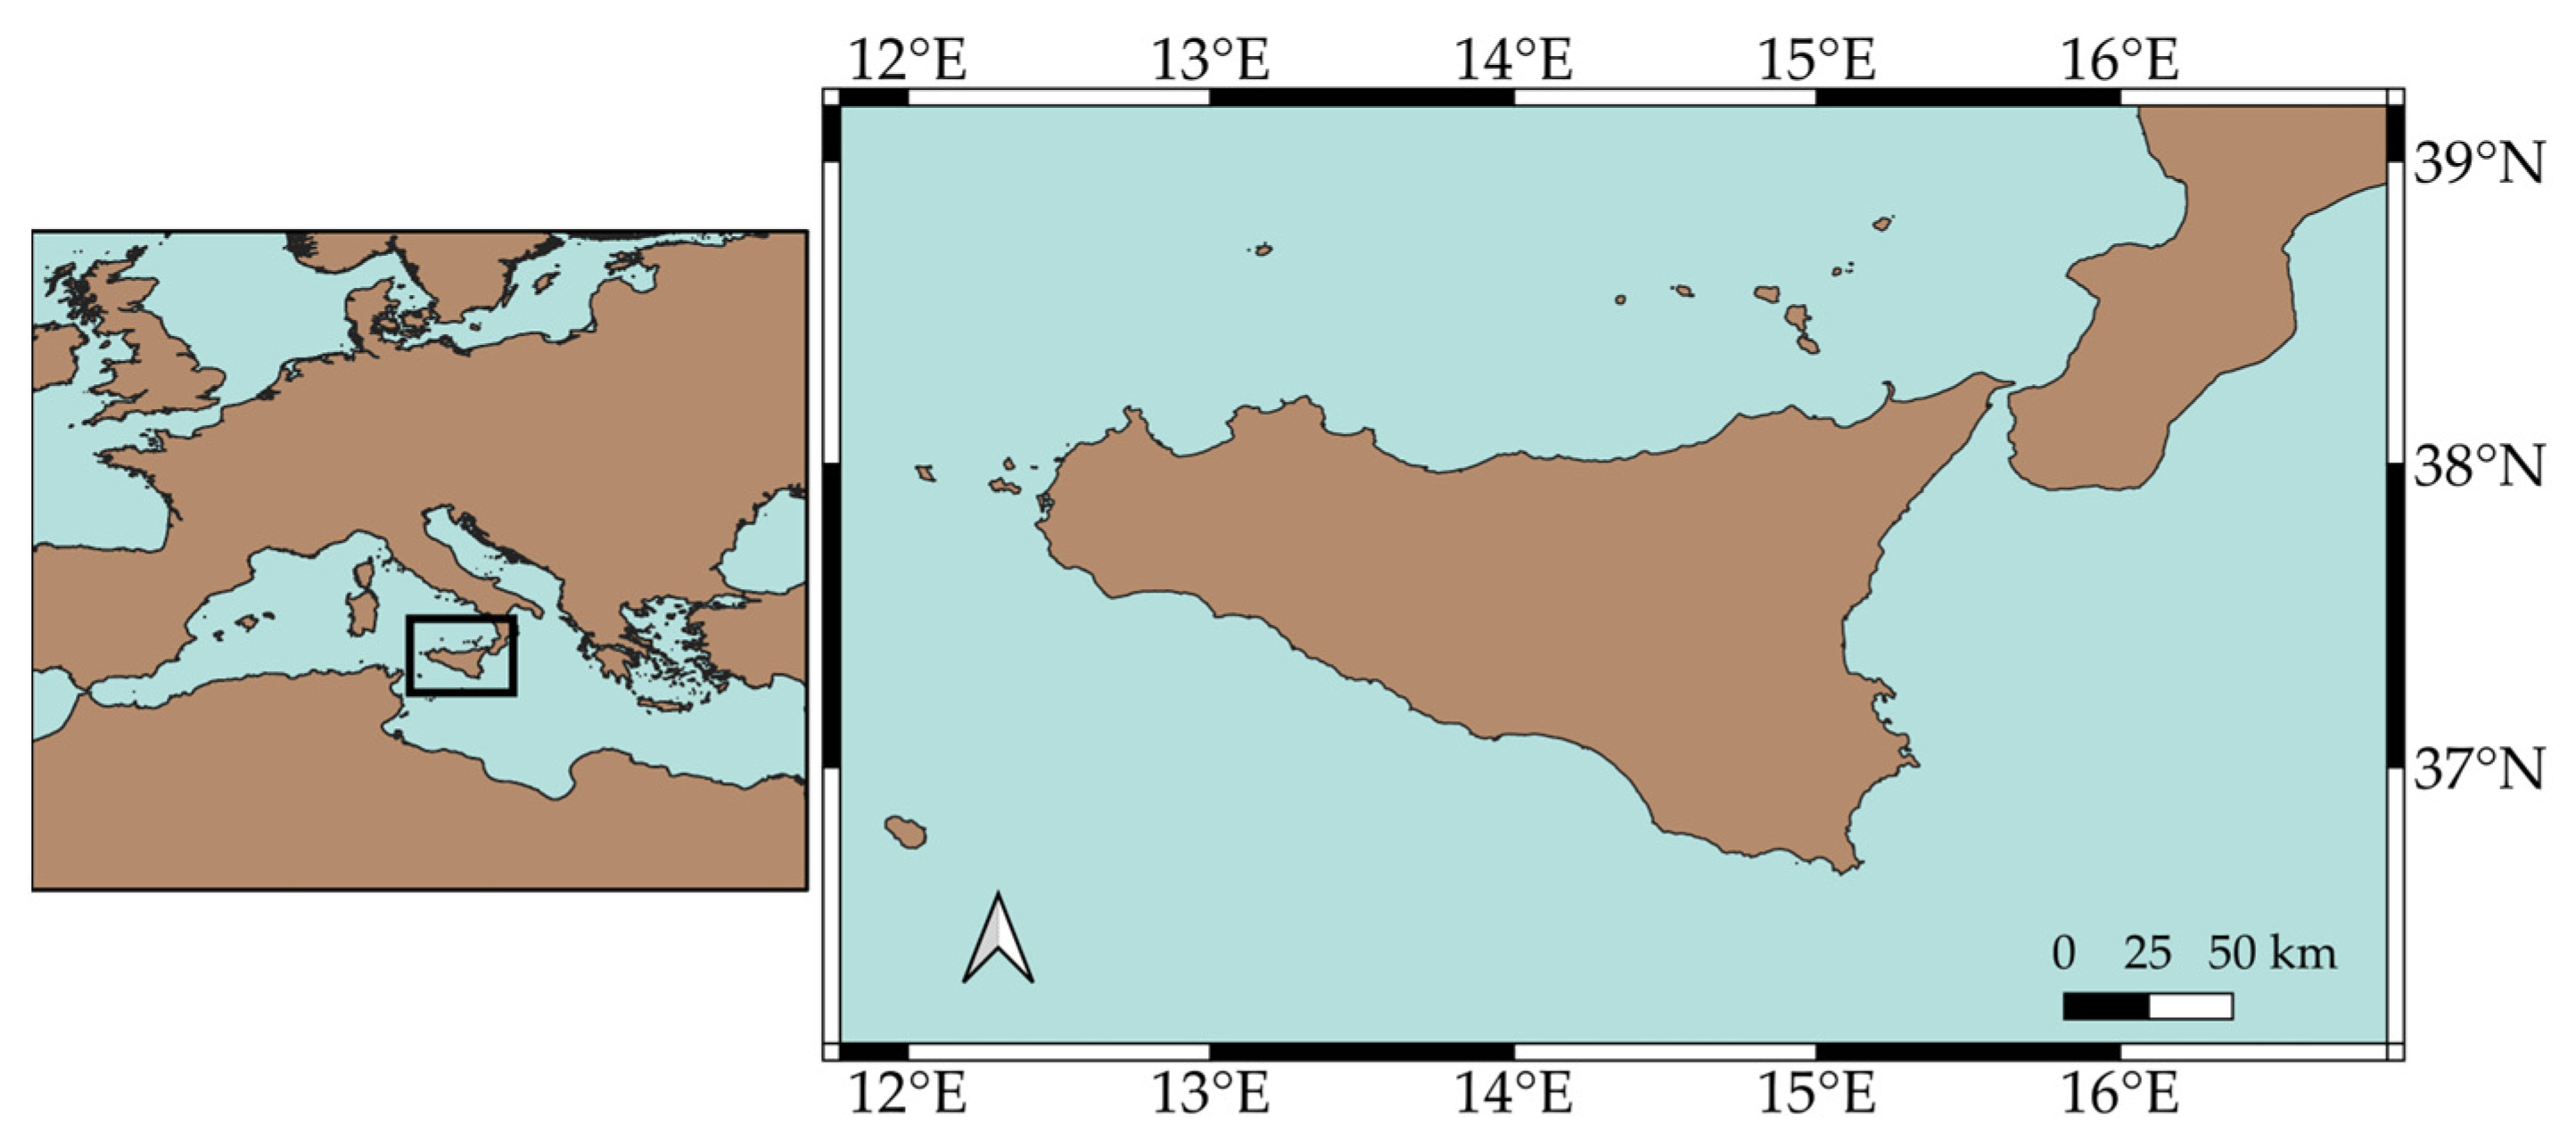
Mt. Etna (Figure 1) is one of the most active volcanoes in the world and one of the best monitored by ground- and satellite-based systems (e.g., [48,49]).

Figure 1.
Mt. Etna (Italy) geographic location, in brown land areas, in blue sea areas.
After some intense flank eruptions widely described in studies in the literature (e.g., [50,51,52,53]), several paroxysmal events took place in more recent years, including those of 2020–2021 [26,44] and 2023 [54].
In February 2025, after a period of variable degassing from all the craters, and lava fountain activity recorded on 10 November 2024, a new eruptive phase occurred [55]. In more detail, on 6 February, a new explosive phase started with episodic and less intense Strombolian activity from the vent located on the SW side of the South-East Crater (SEC). On 8 February a fissure opened at the base of the Bocca Nuova Crater (BN), at around 3050 m elevation, producing a lava flow traveling SW toward Mt. Frumento Supino. Due to weather conditions, the first evidence of lava effusion was provided by the webcams at 17:35 UTC (18:35 LT). However, it was not excluded that the effusive eruption started a few hours earlier. Based on field observations, the lava flow was well fed, and the Strombolian activity was still in progress. The Aviation Color Code (ACC), issued in the Volcano Observatory Notice for Aviation (VONA) messages, was raised to Yellow, the second highest level, at 19:04 UTC. By 11 February the lava flow was about 2.6 km long and had reached an elevation of 2150 m, and two days later it extended up to 1960 m elevation. Explosive activity was observed at the SEC, while an increase in ash emission occurred starting on 12 February 2025, when the VONA became Red [56]. Lava effusion from the eruptive fissure, explosive activity at the summit and gas emissions still occurred between 17 and 23 February 2025 [57]. Effusive activity from the fissure located on the upper S flank of BN ended on 2 March and then began cooling [58], while the Strombolian activity continued in the following weeks [59,60].
2.3. Computation of a Normalized Hotspot Index Using MTG-FCI Data
The normalized hotspot indices proposed in [44] to map high-temperature volcanic features (e.g., lava flows, lava lakes), through Sentinel-2 MSI (Multispectral Instrument) and Landsat 8 OLI (Operational Land Imager) observations, may provide information about hot targets also when sensors (e.g., ABI, AHI) at a coarser spatial resolution are used (e.g, [40,41,43]). The NHISWIR index has been commonly used for this purpose:
where LSWIR1 and LSWIR2 are the radiances measured in the SWIR1 and SWIR2 bands of the above-mentioned sensors. These bands correspond to 1.6 µm and 2.2 µm wavelengths for MSI, OLI and ABI, and 1.6 µm and 2.3 µm for AHI.
In this work, the NHISWIR was computed using, for the first time, the 1.6 µm and 2.2 µm channels of the FCI instrument (see Table 2). The FCI images were directly acquired by the EUMETCAST satellite system installed at the Institute of Methodologies for Environmental Analysis (IMAA) of the National Research Council (CNR). The NR channels were calibrated in radiance (W/m2 sr µm), using the satpy library [61], before the index computation. Moreover, to evaluate the cloudiness conditions and better interpret SWIR observations, we used the MTG FCI Cloud Mask (CLM) product [47]. The latter provides information on cloudy and cloud-free FCI pixels (2 km pixel resolution), based on multispectral threshold techniques. Nearest-neighbor interpolation was used to resample the product at 1 km. Table A1 (Appendix A.1) specifies the categories identified within the CLM product and the classification considered in our analysis.
2.4. Analysis of MIR Signal with an Adapted RST-Based Approach
The Robust Satellite Technique (RST) [62] is a multi-temporal scheme of satellite data analysis using the ALICE (Absolutely Local Index of Change of the Environment) to detect anomalous variations in the signal associated with perturbing events. To detect volcanic hotspots, the MIR spectral band is used, and the ALICE index is then computed:
where BTMIR(x,y,t) is the MIR brightness temperature, measured at the time t and place (x,y). The terms μMIR(x,y) and σMIR(x,y) are the temporal mean and standard deviation, respectively; they represent the expected value and the normal variability of the signal BTMIR(x,y,t) itself under unperturbed conditions. We refer to them as “reference fields”, and they are traditionally computed by using a multi-year time series of homogeneous (e.g., same time of day, month of year) cloud-free satellite records. In this work, due to the lack of sufficiently populated datasets of satellite observations [63], the spectral reference fields were computed by temporally stacking each time slot (144 temporal slots in total for the FCI) for the immediately preceding “non-eruptive” 7-day period (apart from the sporadic Strombolian activity of 6 February; Section 2.2) of 1–7 February 2025. Only the cloud-free pixels selected by using the CLM product and a fixed threshold test on the IR 10.5 signal were considered. Values of ⊗MIR(x,y,t) > 3 were analyzed to search for thermal anomalies over the Mt. Etna area (e.g., [21,26]).
3. Results
3.1. Analysis of Eruption Onset
To investigate the Mt. Etna eruption of February–March 2025, a time series analysis of the NHISWIR index was performed over the Mt. Etna area (11 × 11-pixel box). The ambient background, unlike high-temperature features, provides a negligible contribution to the measured SWIR radiance in the night-time, when negative values of the index are reasonably ascribable to instrumental noise (e.g., [40,41]). On the contrary, negative values of the index in the daytime may also indicate the presence of active lava flows, as indicated by previous studies conducted using Himawari-8 AHI and GOES-R ABI SWIR observations (e.g., [41]). These studies showed that values of NHISWIR > −0.4 retrieved over the Kilauea (Hawaii; USA), Krakatau (Indonesia) and Ambrym (Vanuatu) volcanoes were associated with documented lava flows/lakes [41]. Here, we assess whether these critical values of the index may provide information about Mt. Etna thermal activity even through FCI SWIR data.
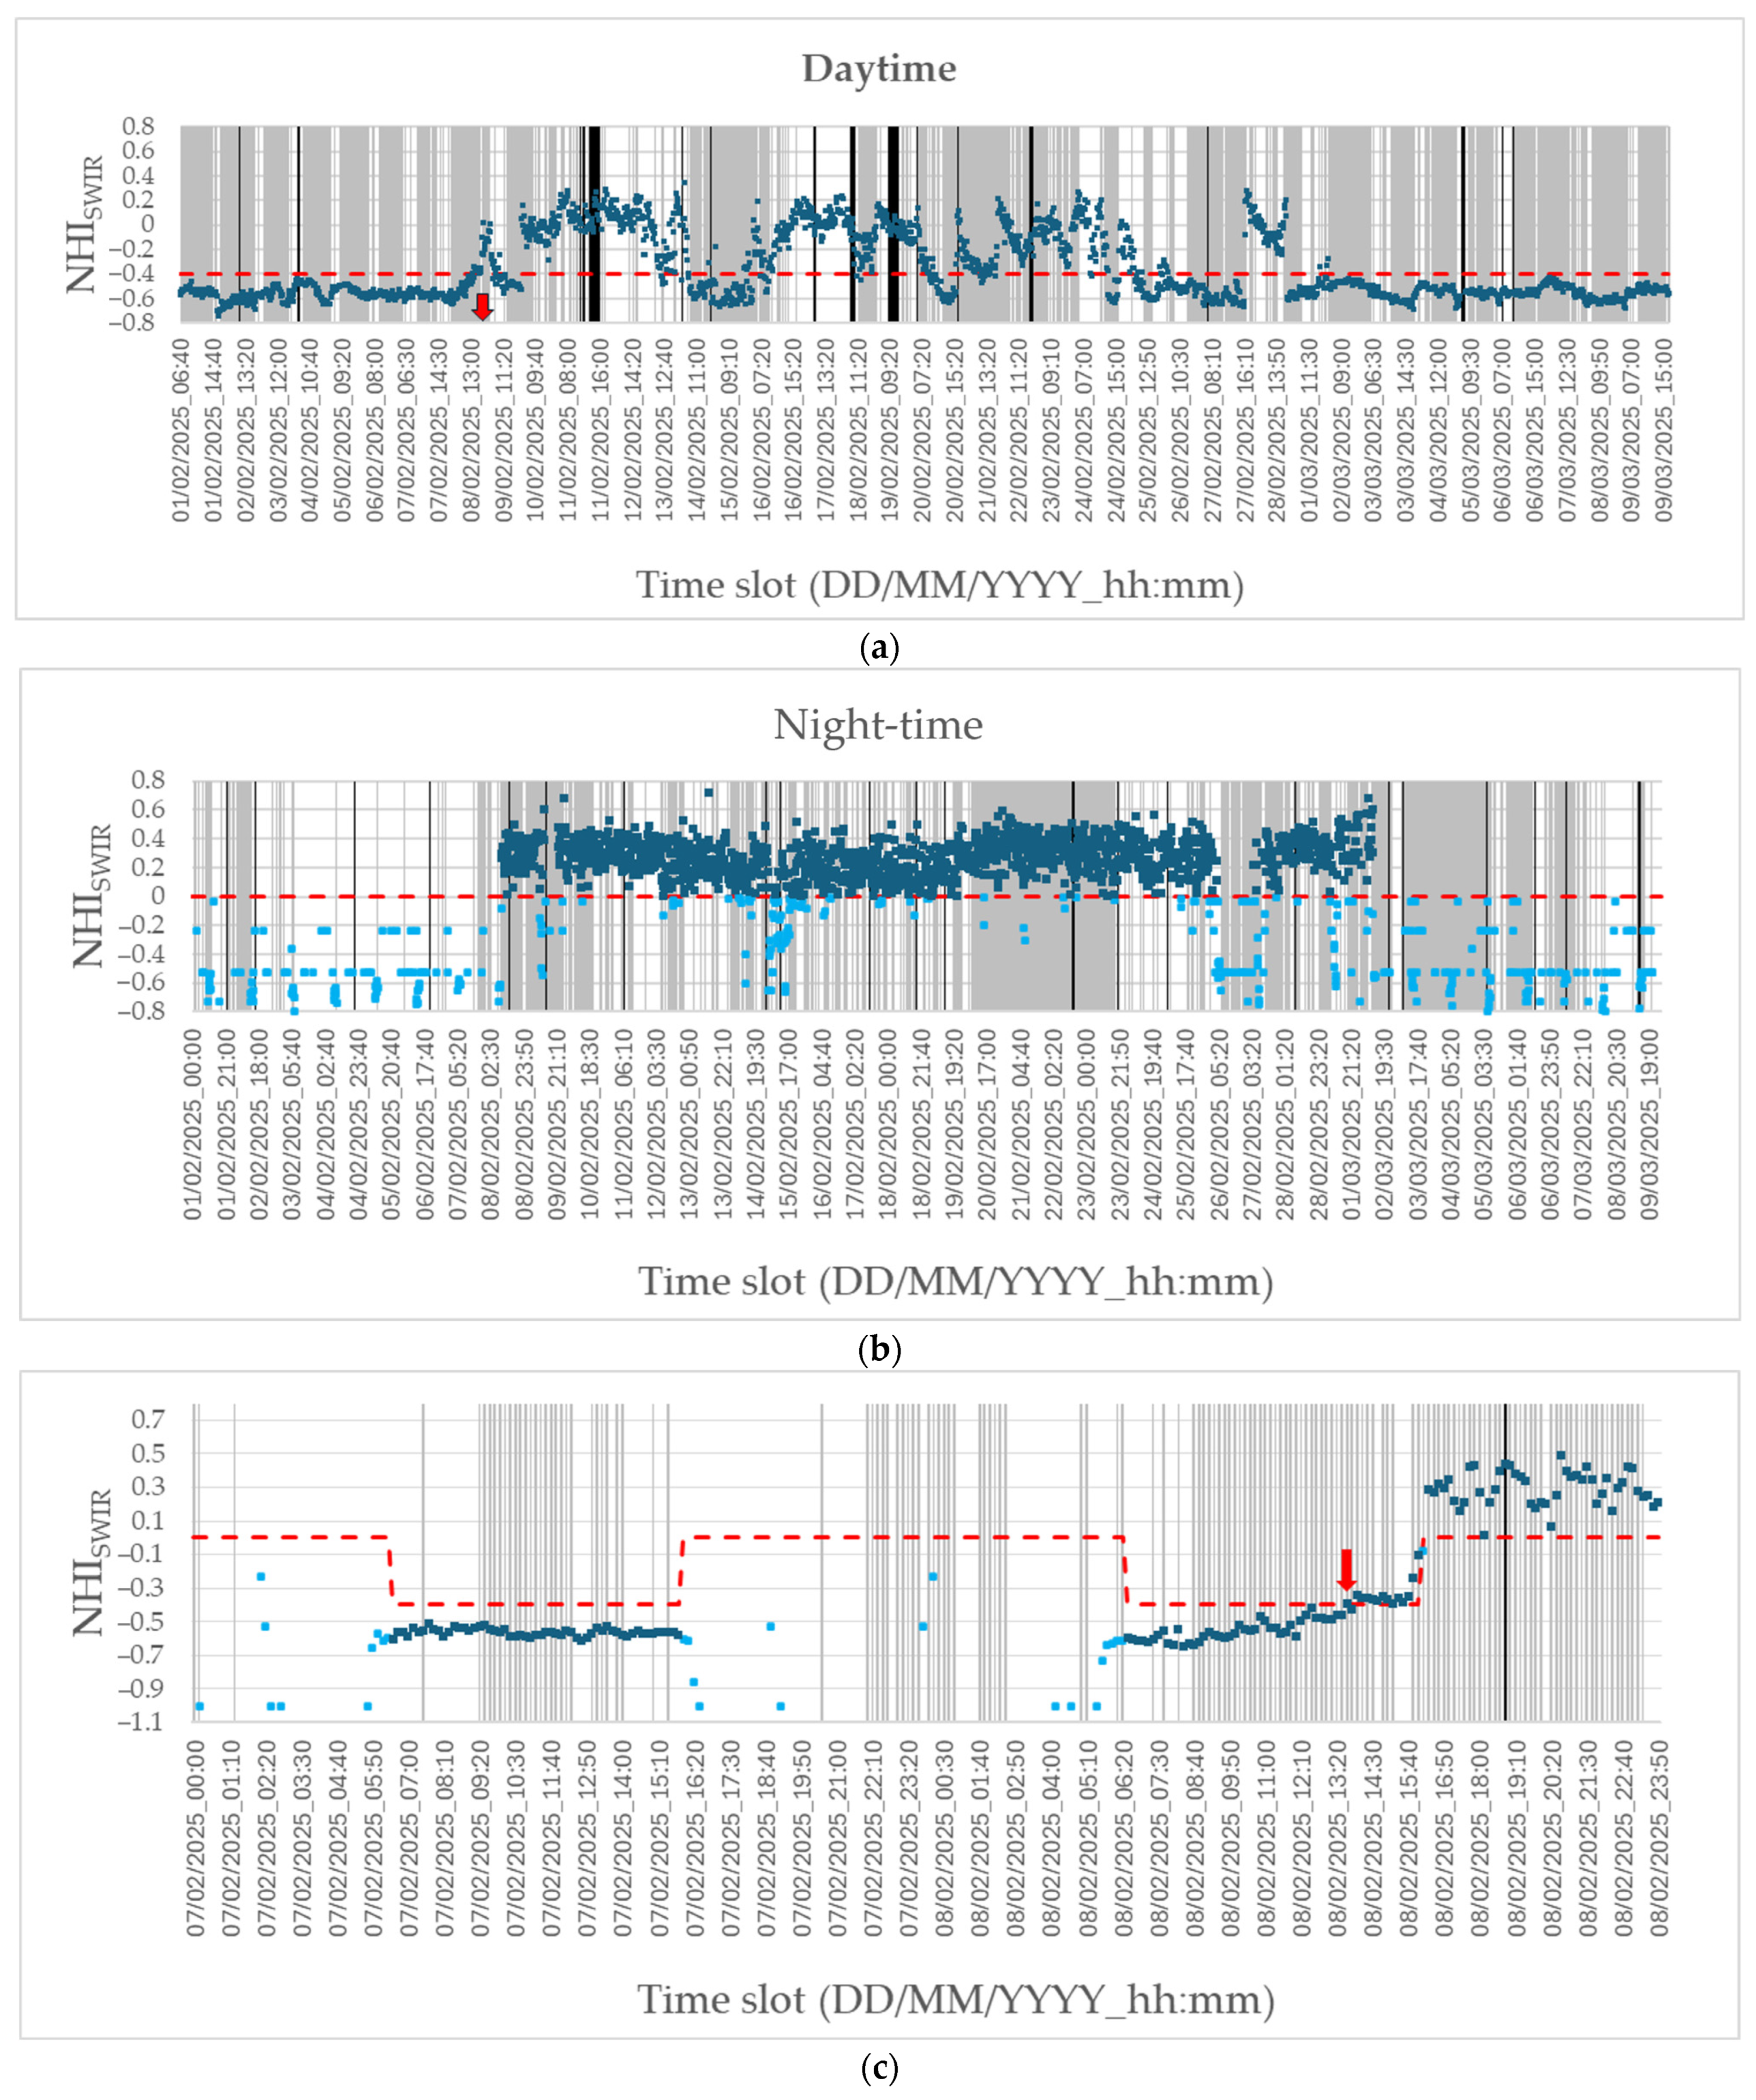
Figure 2 shows the time series of the NHISWIR retrieved from daytime (Figure 2a) and night-time (Figure 2b) FCI data, with indications of cloudy periods (opaque clouds; in gray) and periods when information about cloudiness was not available (in black), over the pixel showing the first evidence of thermal volcanic activity.
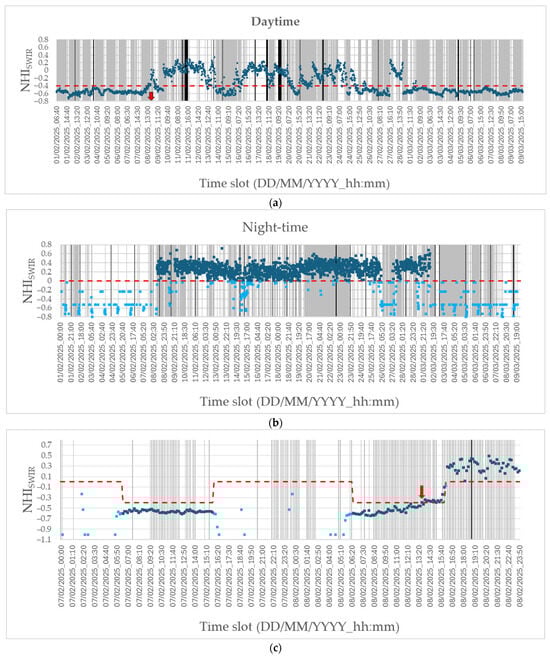
Figure 2.
Time series of the NHISWIR index (blue dots), from MTG-FCI data of 1 February–9 March 2025, retrieved over the crater pixel showing the first evidence of thermal volcanic activity. (a) Daytime observations; (b) night-time observations. Gray bars indicate time slots affected by opaque clouds according to the MTG FCI L2 CLM product [47], black bars indicate missing information about cloudiness, and cyan dots refer to night-time NHISWIR values ascribable to instrumental noise, while NHISWIR values from unrealistic negative SWIR radiances were filtered out. (c) Zoomed-in figure over the period 7–8 February 2025, with indication of the critical levels of the NHISWIR for daytime and night-time observations (red dashed lines). The red arrow indicates the first increment of the index (8 February 2025 at 13:40 UTC) above its critical values.
Before the early afternoon of 8 February 2025, the NHISWIR was always below its critical values, marked by the dotted red lines, regardless of cloudy conditions (see also Figure 2c). From 13:40 UTC (14:40 LT), the index increased for the first time above −0.4 (see red arrow), indicating the possible presence of a high-temperature source, based on the information mentioned above. In the following two hours, the NHISWIR remained almost at the same level. From 15:40 UTC the index further increased, assuming, for the first time, positive values in the night-time. These values were mostly recorded also in the following days, suggesting a lower dependance of the index on cloudy conditions. The highest index value (NHISWIR = 0.72) over the analyzed pixel was recorded on 13 February 2025 at 17:30 UTC (see Figure 2a).
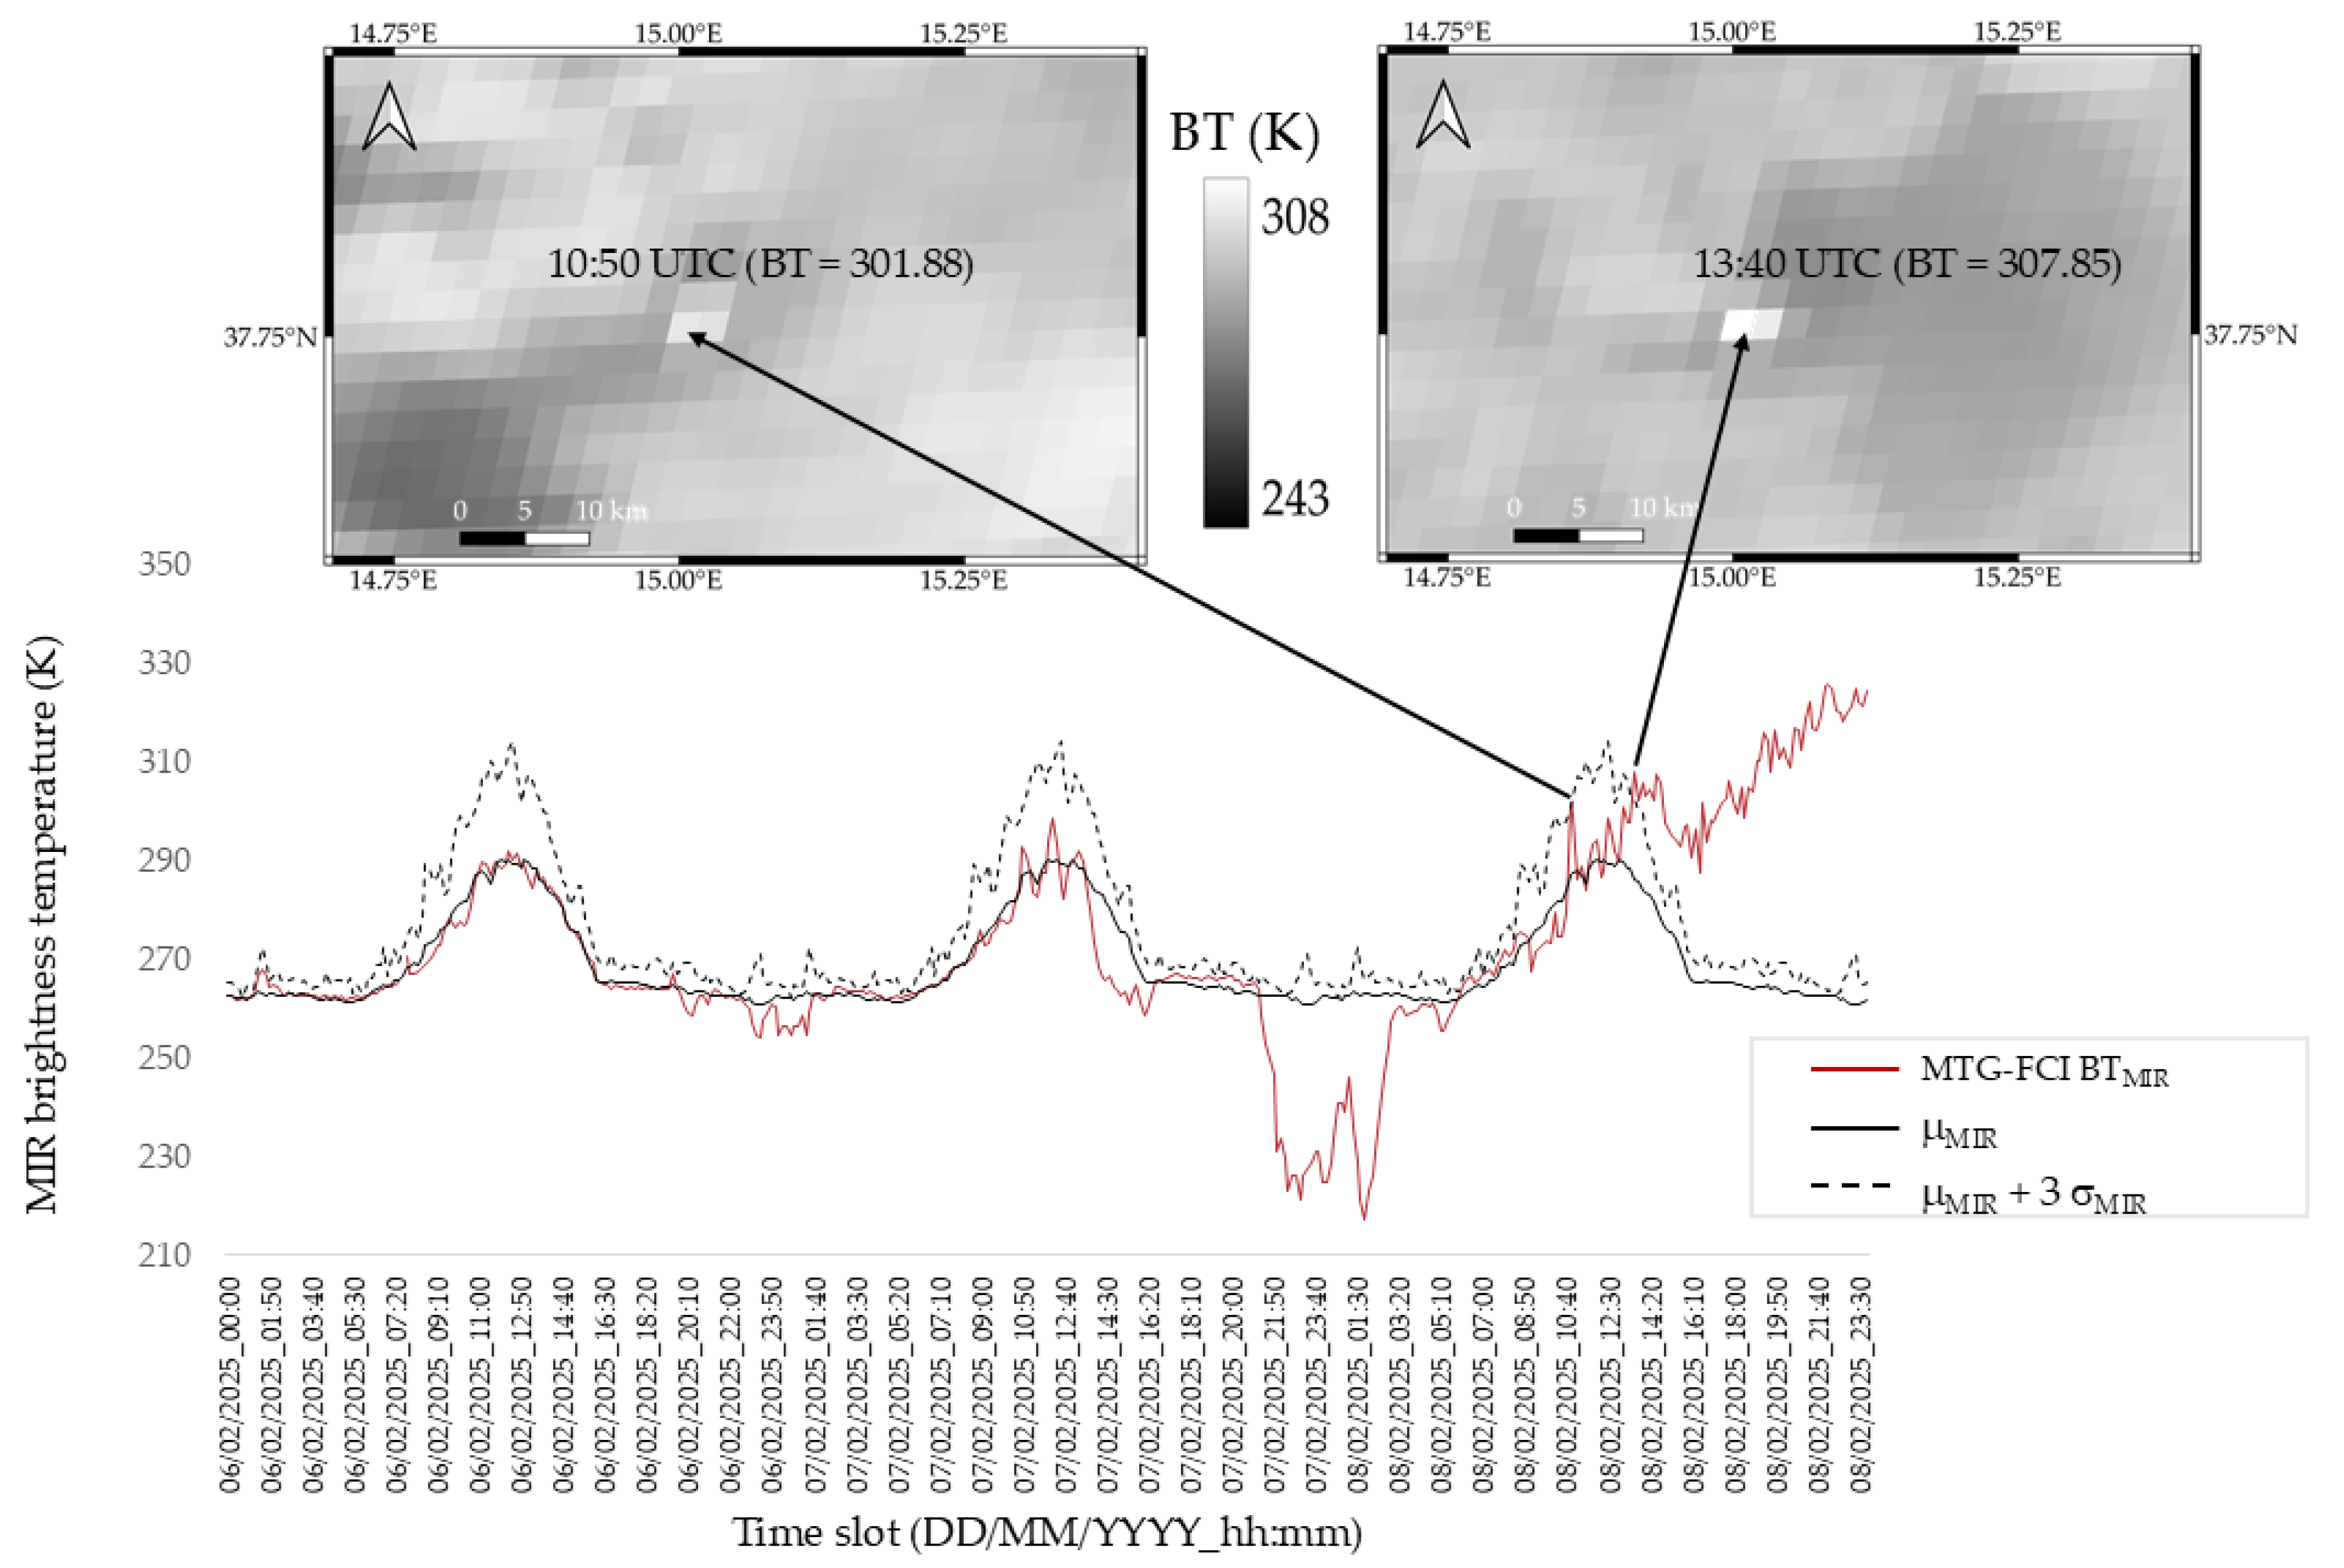
To assess information inferred from Figure 2, we analyzed the temporal trend of BTMIR over the Mt. Etna crater area, by using the adapted RST-based method described in Section 2.4. Figure 3 shows the results of this analysis, which was performed over the pixel, including the area marked as hot by the NHISWIR index. The plot also displays the curves of the temporal mean (μMIR, black line) and mean plus three times the standard deviation (μMIR + 3σMIR, dotted black line) of BTMIR, computed according to the procedure described in Section 2.4. The plot shows that anomalous values of BTMIR (i.e., with ⊗MIR(x,y,t) > 3) occurred from the morning of February 8, 2025. The first one was recorded at 10:50 UTC (see red curve) (⊗MIR(x,y,t) = 3.34). The visual inspection of MIR imagery corroborated the presence of a thermal anomaly over the Mt. Etna area (see top-left panel), which was then masked by meteorological clouds. The second anomalous increment of BTMIR, recorded at 13:40 UTC, was even stronger, as indicated by the higher value of the ALICE index (⊗MIR(x,y,t) = 3.99). This increment was compatible with the start of lava effusion marked by the plot in Figure 2c. Figure 3 shows that Mt. Etna activity continued, with a higher intensity level in the following hours, as highlighted also by the counter trend of BTMIR in comparison with the expected value.
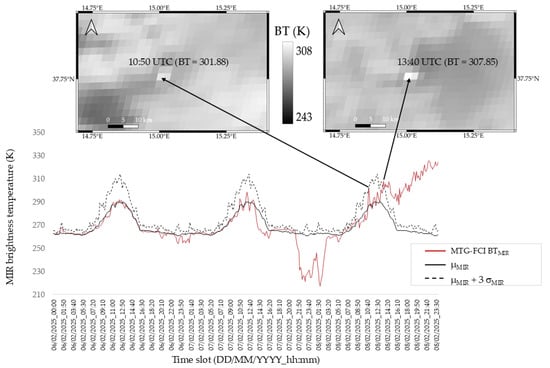
Figure 3.
Time series of BTMIR (red curve) retrieved from MTG-FCI data of 6–8 February 2025 at 00:00–23:50 UTC, over the pixel crater, including the area marked as hot by the NHISWIR index, and curves of the temporal mean (black line) and mean plus three times the standard deviation (dotted black line). The temporal mean and standard deviation were computed, for each time slot, by applying a fixed threshold test (>260 K) on the IR10.5 signal in addition to the selection of categories 1 and 8 of the CLM product (Appendix A.1). The first two anomalous increments of the signal (i.e., ⊗MIR(x,y,t) > 3) over the plot refer to FCI MIR data at 10:50 UTC and 13:40 UTC, indicating the presence of a thermal anomaly over the Mt. Etna area (see pixel marked by the black arrows in the top panels).
3.2. Investigating Intensity of Volcanic Thermal Emissions
To investigate changes in the lava effusion, the NHI algorithm was adapted to FCI SWIR data, by considering “hot” those pixels, within the before-mentioned pixel box, having values of NHISWIR above the critical levels in Figure 2c. A spectral filter (LSWIR2 > 0.5 W/m2 sr µm) was then used to minimize false detections. This configuration was slightly less conservative than that recently implemented on SLSTR SWIR data to investigate the Home Reef (Tonga Islands) 2022–2024 eruptions [64] and was used here to detect hot pixels before retrieving the FRP (Appendix A.3).
Figure 4 displays the plot of total SWIR radiance (TSR), over the period 8 February–3 March, calculated by summing the 2.2 µm radiance of hot pixels detected, on each FCI image, over the selected image window.
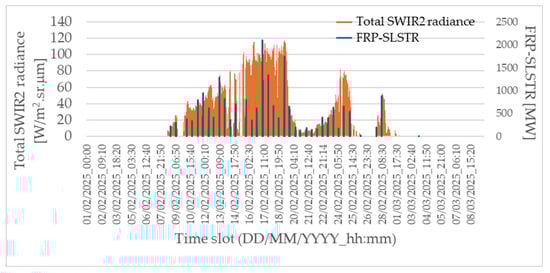
Figure 4.
Temporal trend of the total SWIR2 radiance over the Mt. Etna area calculated by summing the SWIR2 radiance of hot pixels detected in FCI data (orange bars) and FRP (blue bars) retrieved from SLSTR SWIR data starting from daytime (NHISWIR > −0.3 AND LSWIR2 > 0.5 W/m2 sr µm) and night-time (NHISWIR > 0 AND LSWIR2 > 0.5 W/m2 sr µm) detections.
Starting on 8 February 2025, the TSR showed a general increasing trend, marking the increment of volcanic thermal emissions. The latter reached a peak (TSR up to 117.46 W/m2 sr µm) between 17 and 19 February 2025, when the maximum NHISWIR value (0.97) was also retrieved over the Mt. Etna area (18 February 2025 at 05:40 UTC). A less significant increment of TSR was then recorded between 20 and 24 February (~80 W/m2 sr µm) and 27 and 28 February 2025 (~50 W/m2 sr µm). During 1–2 March 2025, the TSR strongly decreased, marking the end of lava effusion.
Information from the FCI is consistent with the temporal trend of FRP derived from SLSTR SWIR data, despite the limitations and the uncertainty introduced by the “SWIR radiance method”, which approximates Planck’s function in the source temperature range of 1600–2200 K, and its general underestimation in characterizing hot targets with temperatures below 1600 K [65]. As an example, although the peak of FRPSWIR, around 2.1 GW, was retrieved from SLSTR data of 17 February 2025 at 08:46 UTC, another strong increment of this parameter was recorded two days after (i.e., in the morning of 19 February), just in concomitance with the peak of TSR from FCI SWIR data. It is worth mentioning that the FRE (fire radiative energy) from SLSTR SWIR data, estimated considering the time elapsed from the first to last satellite overpass, was equal to 5 × 10⁸ MJ; i.e., it was of the same magnitude as previous Mt. Etna eruptions [66].
Despite the possible impact of meteorological clouds on thermal anomaly identification (e.g., as for 26–27 February), and although the TSR was calculated without correcting for the reflected solar component in the daytime, the FCI provided information about the Mt. Etna eruption in good agreement with other sensors (see Section 4).
4. Discussion
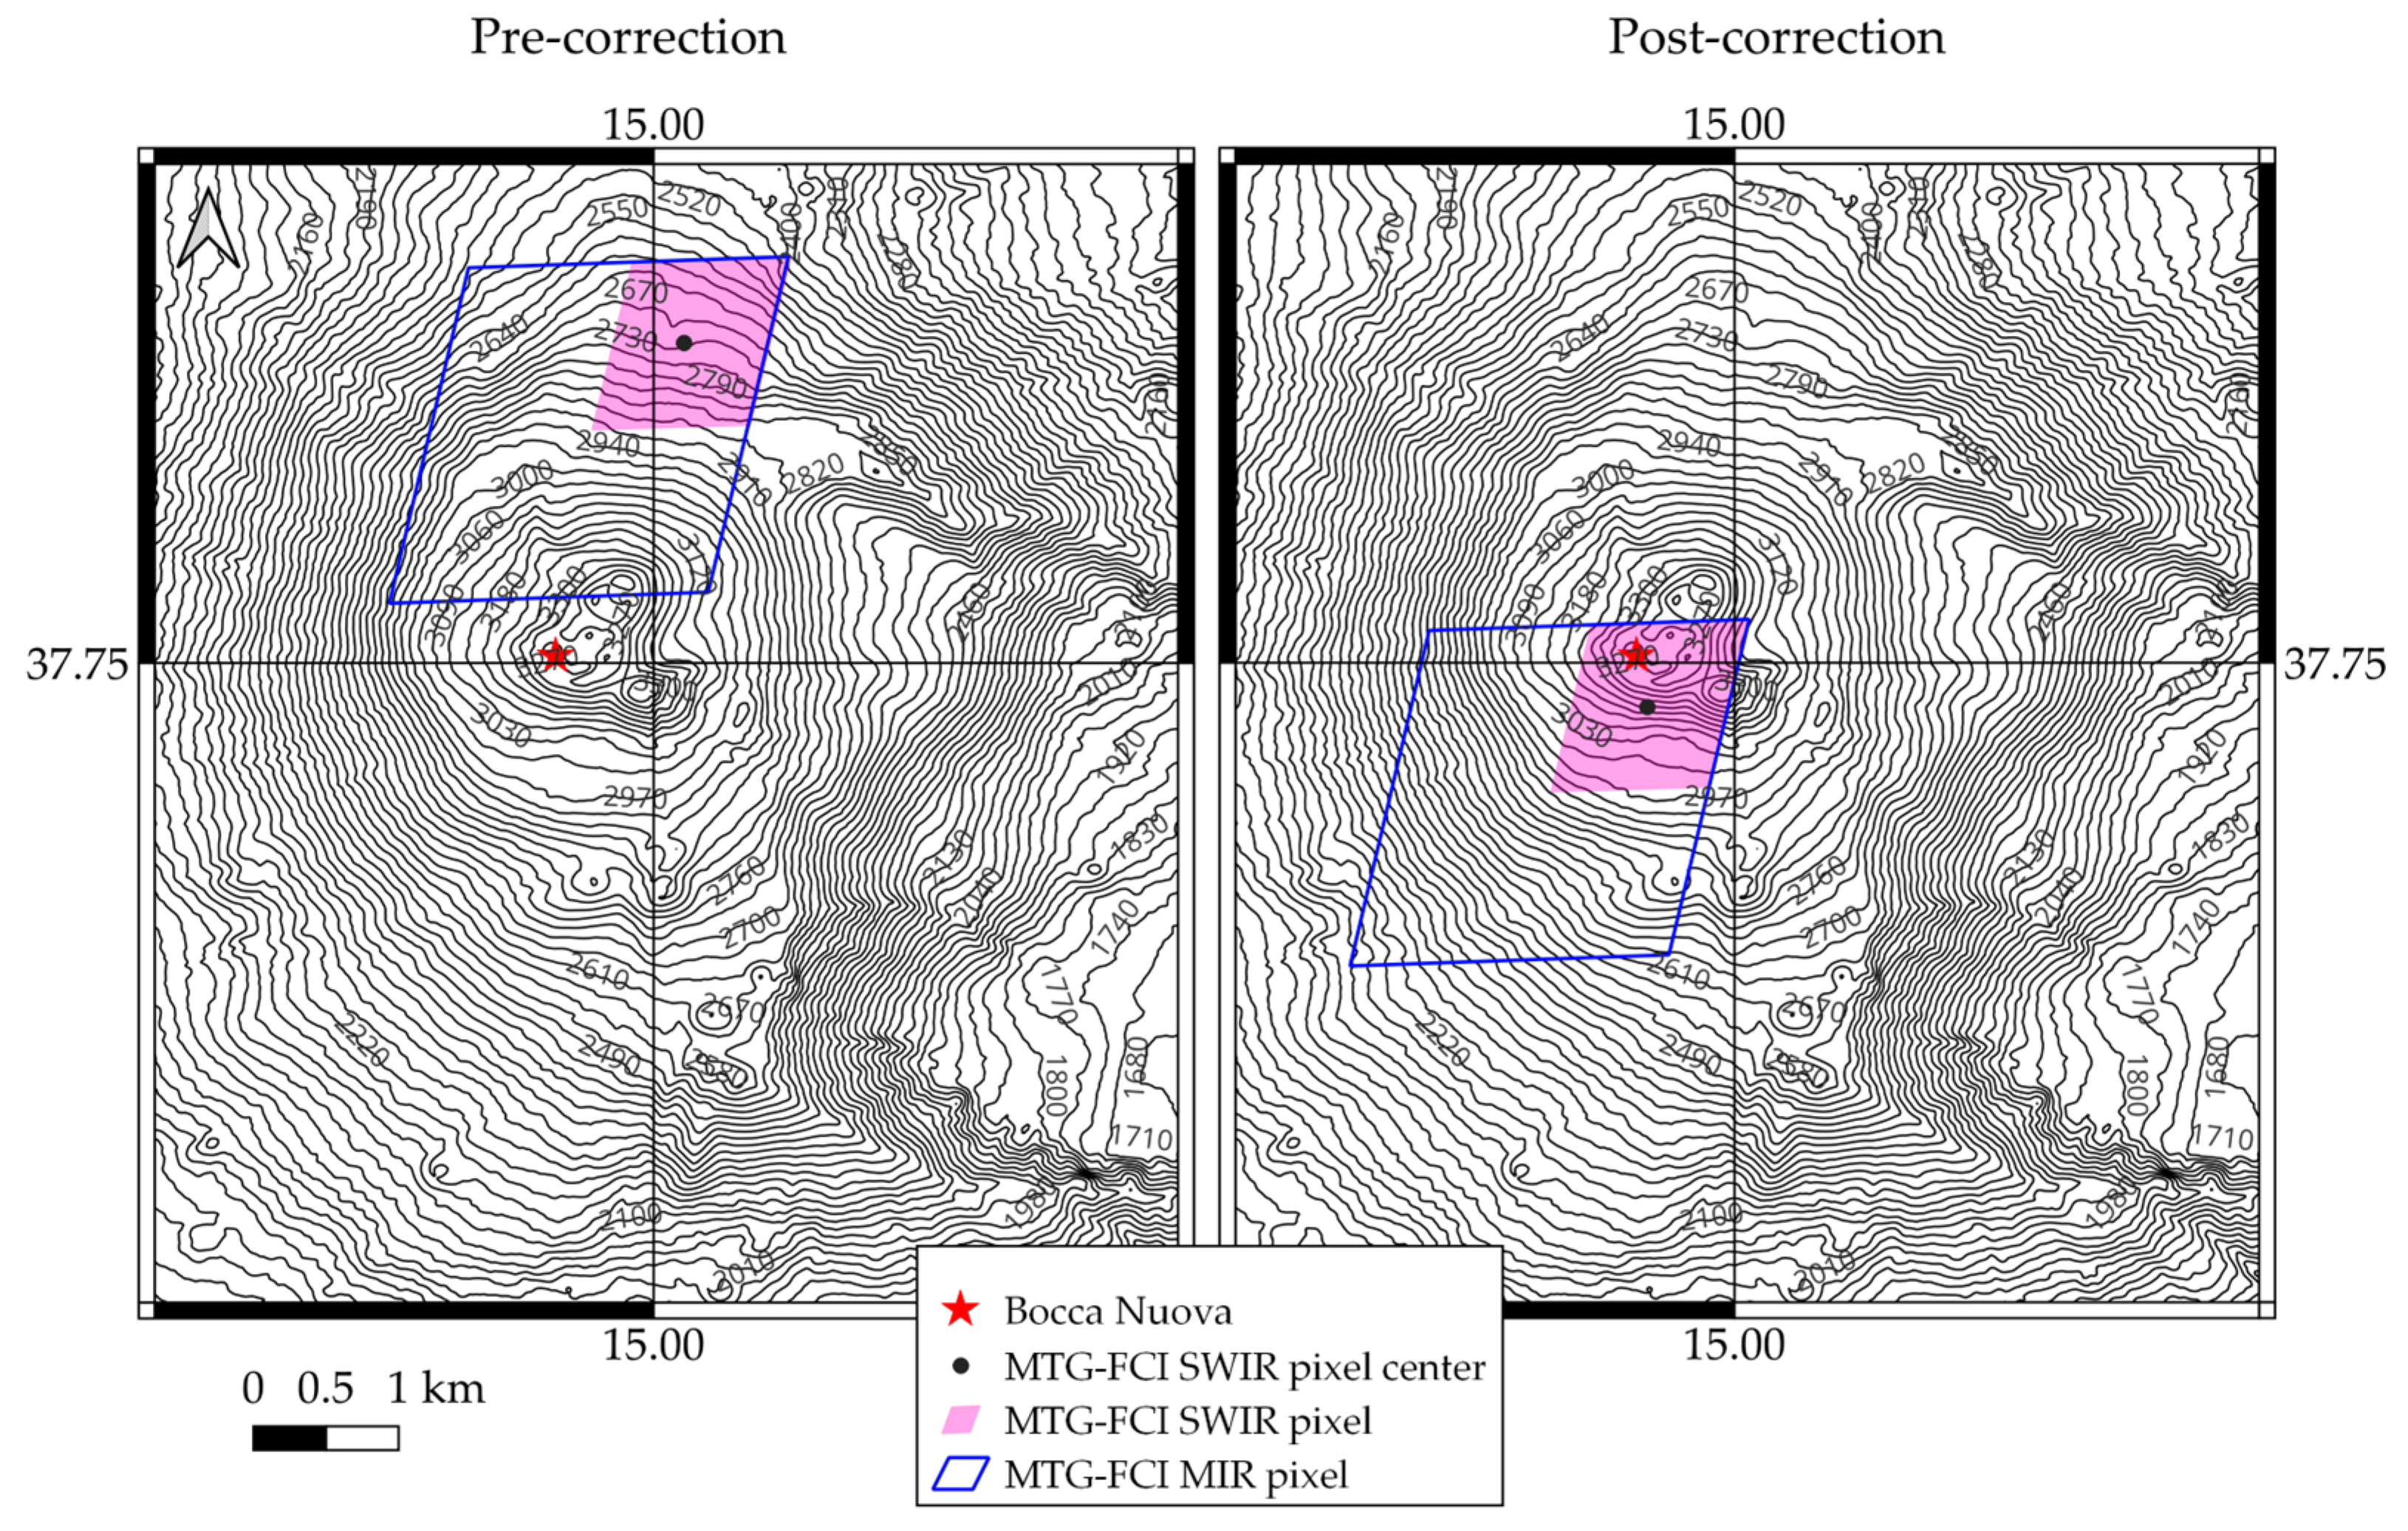
Based on information retrieved from Figure 2, the Mt. Etna lava effusion started on 8 February 2025 at 13:40 UTC, over the pixel marked in magenta in Figure 5 (see pre-correction panel). This pixel identified the area initially affected by the lava flow in a more accurate manner than the pixel depicted in blue, considered anomalous by the retrospective analysis of the MIR signal and revealing the first hotspot over the Mt. Etna area at 10:50 UTC. On the other hand, the hot area did not include BN, where a new fissure opened on 8 February, emitting lava (see Section 2.2), suggesting a possible geolocation error in infrared FCI data. This issue possibly also affected the SEVIRI product from EUMETSAT LSA-SAF (Land Surface Analysis Satellite Application Facility, https://lsa-saf.eumetsat.int/en/data/products/fire-products/, accessed on 22 April 2025), which detected the first hotspot (8 February at 17:15 UTC) just NE of the BN crater (lat 37.79 N, lon 15.01 E).
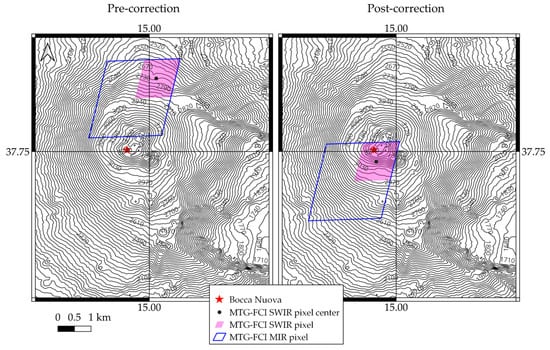
Figure 5.
SWIR MTG-FCI pixel analyzed in Figure 2 (magenta pixel) and MIR pixel analyzed in Figure 3 (blue pixel). Position of the two pixels before (on the left) and after (on the right) applying a parallax correction. Bocca Nuova (BN) is shown as well. The setting parameters of the “satpy.modifiers.parallax” module and corresponding outputs are listed in Table A2 (see Appendix A.2). In the background is the DEM (Digital Elevation Model) at 30 m resolution from Copernicus data. Note the corrected geolocation of the pixel, after the parallax correction, including the eruptive fissure opening at the base of the BN crater on 8 February 2025.
The geolocation of geostationary satellite imagery is calculated with the assumption of a clear view from the satellite to the geoid [61]. The geolocation accuracy is then lower in the presence of clouds or a mountain top. Through the use of a specific module (see Appendix A.2), which includes some routines to correct for the parallax effect, leading to the spatial discrepancy between the location of eruptive fissure and the hot area observed by satellite, the thermal anomaly was flagged in the SWIR band in its correct position (37.747 N; 14.993 E), including the fissure opening at the base of the BN crater, as shown in Figure 5 (see post-correction panel).
It is important to stress that the visual inspection of the SEVIRI 0-Degree MIR data revealed the first thermal anomaly over the Mt. Etna area between 13:45 and 14:00 UTC. Thus, although no MIR-RSS data (5 min refreshing time) were available, due to the interruption of 28 January–27 February 2025 (https://uns.eumetsat.int/uns/, accessed on 22 April 2025), the FCI provided more timely information about the start of lava effusion than SEVIRI.
This may be ascribed to the better instrumental characteristics of the FCI, in terms of temporal, spatial and spectral resolution. Specifically, the 10 min temporal resolution and the availability of the 2.2 µm band make this sensor even more suited to identifying and monitoring high-temperature features (e.g., [42]). In addition, the high-resolution channels (500 m; Table 2) could further improve the identification of small lava flows and other hot targets (e.g., narrow vents, tiny fractures). The launch of the second MTG satellite (MTG-I2), planned for the third quarter of 2026 (https://user.eumetsat.int/data/satellites/meteosat-third-generation, accessed on 22 April 2025), will bring additional benefits, thanks to the 2.5 min image refreshing time of the FCI in the RSS mode.
This study also reveals a certain inaccuracy of the used CLM product, suggested by hot pixels being flagged in the presence of opaque clouds (e.g., see Figure 2). Indeed, thermal anomalies should be detectable in the SWIR band mainly in the presence of semi-transparent clouds [67]. Considering the good agreement between the results from FCI observations and information from other systems, thick clouds appeared to be overestimated (possibly due to the presence of snow, ash/gas emissions in the atmosphere).
Specifically, MODVOLC [68] showed the peak of FRP, around 2.4 GW, from MODIS (Moderate Resolution Imaging Spectroradiometer) data of 19 February 2025 at 03:10 UTC. Similar information about changes in FRP was provided by MIROVA (Middle Infrared Observations of Volcanic Activity [69]). The FIRMS (Fire Information for Resource Management System; https://firms.modaps.eosdis.nasa.gov/, accessed on 22 April 2025) detected the first thermal anomaly over the Mt. Etna area from VIIRS (Visible Infrared Imaging Radiometer Suite) data of 10 February 2025 at 00:37 UTC, while it retrieved the peak of FRP (844 MW) on 17 February 2025 at 01:47 UTC, i.e., as for SLSTR SWIR data (see Section 3.2).
The analysis of S2-MSI and L8/9 OLI/OLI2 imagery (20 m spatial resolution for MSI and 30 m for OLI in the SWIR bands) further corroborates the results of this work.
Figure 6 displays some thermal anomaly maps generated from the outputs of the NHI tool, providing detailed information about the length, shape and direction of active lava flows, which were investigated also in terms of total hotspot area and total SWIR radiance [70].
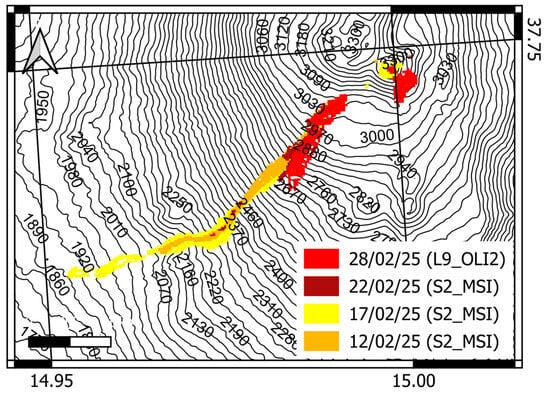
Figure 6.
Lava flow map from S2-MSI (12 February, 17 February and 22 February 2025) and L9-OLI2 (28 February 2025) imagery generated starting from information provided by the Google Earth Engine (GEE) App implementing the standard NHI algorithm [44,69]. In the background is the DEM (Digital Elevation Model) at 30 m resolution from Copernicus data.
The sequence shows that on 12 February 2025 (i.e., four days after the eruption onset), the lava flow front (in orange) was at an around 2050 m elevation. The total hotspot area, including hot pixels flagged close to the SEC, was equal to 338,000 m2 (from S2-MSI scene of 09:41 UTC). Five days later, the active flow (in yellow) extended up to about 1890 m elevation. The total hotspot area, from S2-MSI data of 17 February 2025 at 09:40 UTC, was equal to 564,800 m2 and included a higher number of hot pixels close to the SEC. This increment, like the peak of TSR, suggests an increase in volcanic thermal emissions. On 22 February 2025, the active lava flow (in dark red) was mapped at an around 2720 m elevation (from S2-MSI scene of 09:40 UTC). The total hotspot area was much smaller and equal to 108,400 m2, while only a few hot pixels affected the SEC. A significant portion of the lava flow emitted in the preceding days was probably in the cooling phase, as indicated by the few pixels flagged by the NHI at lower elevation. At the end of the month, the active lava flow (in red) was mapped between 3090 m and 2730 m elevation (from L9 OLI2 scene of 28 February 2025), while the lava cooling continued. The total hotspot area increased to 324,900 m2 also because of hot pixels detected at the base of the SEC (covering an area of about 100,800 m2), indicating the occurrence of a small lava overflow. The maximum lava flow length was estimated to be around 4.2 km on 17 February 2025.
Information from the other sensors, detailed above, corroborates the results retrieved from FCI SWIR data, indicating a possible increase in the lava effusion rate (which was not estimated here) between 17 and 19 February 2025.
Thus, the approach used in this work may highly support the near-real-time monitoring of Mt. Etna and other active volcanoes, despite the limitations affecting FCI-SWIR data (e.g., bias, respectively, around 5% for 1.6 µm and 10% for 2.2 µm channels for absolute radiometric accuracy) [47] and the analysis of negative critical values of the NHISWIR index explored here (e.g., less effective discrimination of hot targets from the background under certain conditions) [41,71]. In this direction, integration with MIR observations is suggested to improve the identification of volcanic thermal features of a different intensity level, as shown in Section 3.
5. Conclusions
By analyzing infrared FCI data, at a 10 min temporal resolution, we retrieved information about the space–time evolution of Mt. Etna lava effusion in February–March 2025.
The results show that the effusive eruption probably started on 8 February at 13:40 UTC, when the NHISWIR index increased, for the first time, above its critical value in daylight conditions. The analysis of the MIR signal seems to corroborate this information and shows that less intense thermal activity occurred a few hours before the start of lava effusion. The latter became more intense during 17–19 February 2025, when the lava flow (~4.2 km in length) extended up to about 1860 m elevation and FRP ranged between 1 and 3 GW, as indicated by satellite observations at different spatial and temporal resolutions.
These outcomes demonstrate that the FCI may support the near-real-time monitoring of Mt. Etna, where an efficient ground-based surveillance system exists [72], through the timely identification and quantitative characterization of volcanic thermal features, especially when SWIR and MIR observations are integrated.
In this context, when a sufficiently populated dataset of FCI observations becomes available, the full application of the RST approach, according to the required rules [62], could further improve the automated identification of subtle hotspots, which may also precede flank eruptions (e.g., [73]). Indeed, the configuration implemented in Section 3.1 adapted to the available dataset could be unusable in the presence of long-lasting cloud-contaminated periods (the same limitation could also affect the analysis of previous longer “unperturbed” periods [74], especially when specific volcanic areas and/or seasonal periods are considered).
The FCI contribution could be particularly significant over less monitored volcanic areas (e.g., African Rift Zone), where the prompt identification of signs of thermal unrest and the continuous monitoring of active lava flows from space could mitigate the social, environmental and economic impacts of future effusive eruptions (e.g., [75]).
Author Contributions
F.M. and C.F. conceived the work and wrote and revised the paper. N.P. contributed to revising the paper. C.F., C.P. and G.M., implemented the procedures used on MTG-FCI and Sentinel-3 SLSTR data. All authors have read and agreed to the published version of the manuscript.
Funding
This research did not receive any funding.
Data Availability Statement
Hotspot products from Sentinel-2 and Landsat-8/9 data processed under the GEE are available at https://sites.google.com/view/nhi-tool/nhi-tool-for-volcanoes accessed on 22 April 2025. Sentinel-3 SLSTR products generated using the NHI algorithm may be provided under request.
Acknowledgments
The authors wish to thank EUMETSAT and the Aeronautica Militare Italiana for their support in gaining access to the MTG-I/FCI data used in this work. The authors also thank Nicola Genzano for support in the Sentinel-2 and Landsat 8/9 data analysis and two anonymous reviewers for the valuable comments which greatly improved the paper.
Conflicts of Interest
The authors declare no conflicts of interest.
Appendix A
Appendix A.1. MTG FCI L2 CLM Product
The netCDF-4 format of the CLM product contains information about the presence of clear, cloud, ash and dust pixels in the “cloud state” dataset [47]. The meaning of the categories included is detailed in Table A1, together with the classification used in this paper.
Table A1.
Information included in the CLM product.
Table A1.
Information included in the CLM product.
| Category | Description | Classification in the Paper |
|---|---|---|
| 0 | Not processed (no/corrupt data) | Missing information |
| 1 | Cloud-free (no snow or ice) | Clear |
| 2 | Cloud-contaminated (partial or semi-transparent cloud) | Clear |
| 3 | Cloud-filled (opaque cloud-filled) | Cloud |
| 4 | Dust-contaminated | Clear |
| 5 | Dust-filled (opaque) | Cloud |
| 6 | Ash-contaminated | Clear |
| 7 | Ash-filled (opaque) | Cloud |
| 8 | Cloud-free (snow- or ice-contaminated) | Clear |
| 9 | Undefined | Missing information |
Appendix A.2. MTG-FCI Analysis of the Crater Area
Table A2.
Input parameters used in satpy.modifiers.parallax module and outputs.
Table A2.
Input parameters used in satpy.modifiers.parallax module and outputs.
| Input | Output | ||
|---|---|---|---|
| Satellite longitude [deg] | 0 | ||
| Satellite latitude [deg] | 0 | ||
| Satellite altitude above the Earth’ surface [m] | 35,786,400 | ||
| Height on which the correction will be based (e.g., mount height) [m] | 3000 | ||
| Latitude of the SWIR pixel to be corrected [deg] | 37.775024 | Corrected latitude of the SWIR pixel [deg] | 37.74654 |
| Longitude of the SWIR pixel to be corrected [deg] | 15.002382 | Corrected longitude of the SWIR pixel [deg] | 14.99319 |
| Latitude of the MIR pixel to be corrected [deg] | 37.768257 | Corrected latitude of the MIR pixel [deg] | 37.73978 |
| Longitude of the MIR pixel to be corrected [deg] | 14.994598 | Corrected longitude of the MIR pixel [deg] | 14.98541 |
Appendix A.3. Estimates of FRP from SLSTR SWIR Data
The NHISWIR hotspots from both SLSTR A stripe and B stripe have been characterized in terms of fire radiative power (FRP) using the following formulation [76]:
where τSWIR is computed using [76]
The meanings of variables in Equations (A1) and (A2) are in Table A3.
Table A3.
Variables in Equations (A1) and (A2).
Table A3.
Variables in Equations (A1) and (A2).
| Symbol | Description, Value and Units |
|---|---|
| FRP | Fire radiative power [MW] |
| P | Constant, depending on the sensor and the channel, 6.1 × 10⁻⁹ [W m−2 sr−1 mm−1 K−4] |
| Apix | Pixel area [m2], depending on the satellite zenith view angle |
| s | Stefan–Boltzmann constant, 5.67 × 10⁻⁸ [W m−2 K−4] |
| tSWIR | SWIR atmospheric transmittance in the SLSTR S6 spectral channel |
| LSWIR | Spectral radiance of the fire pixel in the SWIR S6 channel [mW m−2 sr−1 nm−1] |
| Lb,SWIR | Mean spectral radiance of the valid background window pixels in the SWIR S6 channel [mW m−2 sr−1 nm−1] |
| Q | Constant, p/180 |
| tSWIR | Atmospheric optical depth in the SWIR S6 channel, value linearly interpolated [76] depending on the total column water vapor (TCWV, in kg/m2) |
| ϑv | Satellite zenith view angle [degree] |
| A, B and C | Values linearly interpolated [76] depending on the total column water vapor (TCWV, in kg/m2) |
References
- Kienle, J.; Shaw, G.E. Augustine Volcano Eruption: Initial Explosive Phase, January 1976: Impact on the Atmosphere; Seismological Report No. 1; Alaskan Earthquake Analysis Center: Anchorage, AK, USA, 1977. [Google Scholar]
- Krueger, A.F. Geostationary satellite observations of the April 1979 Soufriere eruptions. Science 1982, 216, 1108–1109. [Google Scholar] [CrossRef] [PubMed]
- Brazier, S.; Davis, A.N.; Sigurdsson, H.; Sparks, R.S.J. Fall-out and deposition of volcanic ash during the 1979 explosive eruption of the Soufriere of St. Vincent. J. Volcanol. Geotherm. Res. 1982, 14, 335–359. [Google Scholar] [CrossRef]
- Wiesnet, D.; Scott, R.; Matson, M. The NOAA satellites: A largely neglected tool in the land sciences. Adv. Space Res. 1983, 3, 215–222. [Google Scholar] [CrossRef]
- Matson, M. The 1982 El Chichon volcano eruptions—A satellite perspective. J. Volcanol. Geotherm. Res. 1984, 23, 1–10. [Google Scholar] [CrossRef]
- Bizzarri, B.; Pagano, P.; Perrone, M. The use of Meteosat for monitoring volcanic ash plumes in the atmosphere. Riv. Meteorol. Aeronautica 1985, 45, 25–40. (In Italian) [Google Scholar]
- Potts, R.J. Satellite observations of Mt Pinatubo ash clouds. Aust. Meteorol. Mag. 1993, 42, 59–68. [Google Scholar]
- Scarpa, R.; Tilling, R.I.; Sawada, Y. Detection of Explosive Eruptions and Regional Tracking of Volcanic Ash Clouds with Geostationary Meteorological Satellite (GMS). In Monitoring and Mitigation of Volcano Hazards; Springer: Berlin/Heidelberg, Germany, 1996; pp. 299–314. [Google Scholar]
- Glaze, L.S.; Francis, P.W.; Self, S.; Rothery, D.A. The 16 September 1986 eruption of Lascar volcano, north Chile: Satellite investigations. Bull. Volcanol. 1989, 51, 149–160. [Google Scholar] [CrossRef]
- Davies, M.A.; Rose, W.I. GOES imagery fills gaps in Montserrat volcanic cloud observations. Eos Trans. Am. Geophys. Union 1998, 79, 505–507. [Google Scholar] [CrossRef]
- Harris, A.J.L.; Keszthelyi, L.; Flynn, L.P.; Mouginis-Mark, P.J.; Thornber, C.; Kauahikaua, J.; Sherrod, D.; Trusdell, F.; Sawyer, M.W.; Flament, P. Chronology of the episode 54 eruption at Kilauea Volcano, Hawaii, from GOES-9 satellite data. Geophys. Res. Lett. 1997, 24, 3281–3284. [Google Scholar] [CrossRef]
- Harris, A.J.L.; Thornber, C.R. Complex effusive events at Kīlauea as documented by the GOES satellite and remote video cameras. Bull. Volcanol. 1999, 61, 382–395. [Google Scholar] [CrossRef]
- Harris, A.J.L.; Pilger, E.; Flynn, L.P.; Garbeil, H.; Mouginis-Mark, P.J.; Kauahikaua, J.; Thornber, C. Automated, high temporal resolution, thermal analysis of Kilauea volcano, Hawai’i, using GOES satellite data. Int. J. Remote Sens. 2001, 22, 945–967. [Google Scholar] [CrossRef]
- Harris, A.J.L.; Flynn, L.P.; Dean, K.; Pilger, E.; Wooster, M.; Okubo, C.; Mouginis-Mark, P.; Garbeil, H.; Thornber, C.; De La Cruz-Reyna, S.; et al. Real-time satellite monitoring of volcanic hot spots. In Remote Sensing of Active Volcanism; Geophysical Monograph Series; Mouginis-Mark, P.J., Crisp, J.A., Fink, J.H., Eds.; American Geophysical Union: Washington, DC, USA, 2000; Volume 116, pp. 139–159. [Google Scholar]
- Mouginis-Mark, P.J.; Snell, H.; Ellisor, R. GOES satellite and field observations of the 1998 eruption of Volcan Cerro Azul, Galapagos Islands. Bull. Volcanol. 2000, 62, 188–198. [Google Scholar] [CrossRef]
- Wright, R.; De La Cruz-Reyna, S.; Harris, A.; Flynn, L.; Jose Gomez-Palacios, J. Infrared satellite monitoring at Popocatépetl: Explosions, exhalations, and cycles of dome growth. J. Geophys. Res. Solid Earth 2002, 107, ECV-2. [Google Scholar] [CrossRef]
- Harris, A.J.L.; Flynn, L.P.; Matías, O.; Rose, W.I. The thermal stealth flows of Santiaguito dome, Guatemala: Implications for the cooling and emplacement of dacitic block-lava flows. Geol. Soc. Am. Bull. 2002, 114, 533–546. [Google Scholar] [CrossRef]
- Calder, E.S.; Harris, A.J.; Peña, P.; Pilger, E.; Flynn, L.P.; Fuentealba, G.; Moreno, H. Combined thermal and seismic analysis of the Villarrica volcano lava lake, Chile. Rev. Geol. Chile 2004, 31, 259–272. [Google Scholar] [CrossRef]
- Marchese, F.; Malvasi, G.; Ciampa, M.; Filizzola, C.; Pergola, N.; Tramutoli, V. A robust multitemporal satellite technique for volcanic activity monitoring: Possible impacts on volcanic hazard mitigation. In Proceedings of the 2007 International Workshop on the Analysis of Multi-Temporal Remote Sensing Images, Leuven, Belgium, 18–20 July 2007; pp. 1–5. [Google Scholar] [CrossRef]
- Pergola, N.; Marchese, F.; Tramutoli, V.; Filizzola, C.; Ciampa, M. Advanced Satellite Technique for Volcanic Activity Monitoring and Early Warning. Ann. Geophys. 2008, 51, 287–301. [Google Scholar] [CrossRef]
- Marchese, F.; Ciampa, M.; Filizzola, C.; Lacava, T.; Mazzeo, G.; Pergola, N.; Tramutoli, V. On the exportability of robust satellite techniques (RST) for active volcano monitoring. Remote Sens. 2010, 2, 1575–1588. [Google Scholar] [CrossRef]
- Ganci, G.; Vicari, A.; Fortuna, L.; Del Negro, C. The HOTSAT volcano monitoring system based on combined use of SEVIRI and MODIS multispectral data. Ann. Geophys. 2011, 54, 544–550. [Google Scholar]
- Ganci, G.; Harris, A.J.L.; Del Negro, C.; Guehenneux, Y.; Cappello, A.; Labazuy, P.; Calvari, S.; Gouhier, M. A year of lava fountaining at Etna: Volumes from SEVIRI. Geophys. Res. Lett. 2012, 39, L06305. [Google Scholar] [CrossRef]
- Gouhier, M.; Harris, A.; Calvari, S.; Labazuy, P.; Guéhenneux, Y.; Donnadieu, F.; Valade, S. Lava discharge during Etna’s January 2011 fire fountain tracked using MSG-SEVIRI. Bull. Volcanol. 2012, 74, 787–793. [Google Scholar] [CrossRef]
- Cappello, A.; Ganci, G.; Bilotta, G.; Herault, A.; Zago, V.; Del Negro, C. Satellite-driven modeling approach for monitoring lava flow hazards during the 2017 Etna eruption. Ann. Geophys. 2019, 62, VO227. [Google Scholar] [CrossRef]
- Marchese, F.; Filizzola, C.; Lacava, T.; Falconieri, A.; Faruolo, M.; Genzano, N.; Mazzeo, G.; Pietrapertosa, C.; Pergola, N.; Tramutoli, V.; et al. Mt. Etna paroxysms of February–April 2021 monitored and quantified through a multi-platform satellite observing system. Remote Sens. 2021, 13, 3074. [Google Scholar] [CrossRef]
- Alonso, C.; Durão, R.; Gouveia, C.M. A Year of Volcanic Hot-Spot Detection over Mediterranean Europe Using SEVIRI/MSG. Remote Sens. 2023, 15, 5219. [Google Scholar] [CrossRef]
- Di Bella, G.S.; Corradino, C.; Cariello, S.; Torrisi, F.; Del Negro, C. Advancing volcanic activity monitoring: A near-real-time approach with remote sensing data fusion for radiative power estimation. Remote Sens. 2024, 16, 2879. [Google Scholar] [CrossRef]
- Plank, S.; Marchese, F.; Filizzola, C.; Pergola, N.; Neri, M.; Nolde, M.; Martinis, S. The July/August 2019 lava flows at the Sciara del Fuoco, Stromboli–Analysis from multi-sensor infrared satellite imagery. Remote Sens. 2019, 11, 2879. [Google Scholar] [CrossRef]
- Mattia, M.; Di Lieto, B.; Ganci, G.; Bruno, V.; Romano, P.; Ciancitto, F.; De Martino, P.; Gambino, S.; Aloisi, M.; Sciotto, M.; et al. The 2019 eruptive activity at Stromboli volcano: A multidisciplinary approach to reveal hidden features of the “unexpected” 3 July paroxysm. Remote Sens. 2021, 13, 4064. [Google Scholar] [CrossRef]
- Marchese, F.; Filizzola, C.; Mazzeo, G.; Paciello, R.; Pergola, N.; Tramutoli, V. Robust satellite techniques for thermal volcanic activity monitoring, early warning and possible prediction of new eruptive events. In Proceedings of the 2009 IEEE International Geoscience and Remote Sensing Symposium, Cape Town, South Africa, 12–17 July 2009; pp. II-953–II-956. [Google Scholar] [CrossRef]
- Hirn, B.; Di Bartola, C.; Ferrucci, F. Synergetic exploitation of meteorological geostationary payloads «SEVIRI» and «JAMI» for quantitative, real-time, global volcano monitoring. In Proceedings of the 2010 IEEE International Geoscience and Remote Sensing Symposium, Honolulu, HI, USA, 25–30 July 2010; pp. 1549–1552. [Google Scholar]
- Ganci, G.; Cappello, A.; Bilotta, G.; Del Negro, C. How the variety of satellite remote sensing data over volcanoes can assist hazard monitoring efforts: The 2011 eruption of Nabro volcano. Remote Sens. Environ. 2020, 236, 111426. [Google Scholar] [CrossRef]
- Marchese, F.; Falconieri, A.; Pergola, N.; Tramutoli, V. A retrospective analysis of the Shinmoedake (Japan) eruption of 26–27 January 2011 by means of Japanese geostationary satellite data. J. Volcanol. Geotherm. Res. 2014, 269, 1–13. [Google Scholar] [CrossRef]
- Kaneko, T.; Maeno, F.; Yasuda, A. Observation of the eruption sequence and formation process of a temporary lava lake during the June–August 2015 Mt. Raung eruption, Indonesia, using high-resolution and high-frequency satellite image datasets. J. Volcanol. Geotherm. Res. 2019, 377, 17–32. [Google Scholar] [CrossRef]
- Kaneko, T.; Takasaki, K.; Maeno, F.; Wooster, M.J.; Yasuda, A. Himawari-8 infrared observations of the June–August 2015 Mt Raung eruption, Indonesia. Earth Planets Space 2018, 70, 89. [Google Scholar] [CrossRef]
- Kaneko, T.; Maeno, F.; Yasuda, A.; Takeo, M.; Takasaki, K. The 2017 Nishinoshima eruption: Combined analysis using Himawari-8 and multiple high-resolution satellite images. Earth Planets Space 2019, 71, 140. [Google Scholar] [CrossRef]
- Kaneko, T.; Maeno, F.; Ichihara, M.; Yasuda, A.; Ohminato, T.; Nogami, K.; Nakada, S.; Honda, Y.; Murakami, H. Episode 4 (2019–2020) Nishinoshima activity: Abrupt transitions in the eruptive style observed by image datasets from multiple satellites. Earth Planets Space 2022, 74, 34. [Google Scholar] [CrossRef]
- Kaneko, T.; Yasuda, A.; Fujii, T. Simple empirical method for estimating lava-effusion rate using nighttime Himawari-8 1.6-µm infrared images. Earth Planets Space 2019, 73, 37. [Google Scholar] [CrossRef]
- Marchese, F.; Coppola, D.; Falconieri, A.; Genzano, N.; Pergola, N. Investigating phases of thermal unrest at Ambrym (Vanuatu) Volcano through the normalized hot spot indices tool and the integration with the MIROVA system. Remote Sens. 2022, 14, 3136. [Google Scholar] [CrossRef]
- Falconieri, A.; Genzano, N.; Mazzeo, G.; Pergola, N.; Marchese, F. First implementation of a normalized hotspot index on himawari-8 and GOES-R data for the active volcanoes monitoring: Results and future developments. Remote Sens. 2022, 14, 5481. [Google Scholar] [CrossRef]
- Thompson, J.O.; Contreras-Arratia, R.; Befus, K.S.; Ramsey, M.S. Thermal and seismic precursors to the explosive eruption at La Soufrière Volcano, St. Vincent in April 2021. Earth Planet. Sci. Lett. 2022, 592, 117621. [Google Scholar] [CrossRef]
- Genzano, N.; Marchese, F.; Plank, S.; Pergola, N. Monitoring the Mauna Loa (Hawaii) eruption of November–December 2022 from space: Results from goes-r, sentinel-2 and Landsat-8/9 observations. Int. J. Appl. Earth Obs. Geoinf. 2023, 122, 103388. [Google Scholar] [CrossRef]
- Marchese, F.; Genzano, N.; Neri, M.; Falconieri, A.; Mazzeo, G.; Pergola, N. A multi-channel algorithm for mapping volcanic thermal anomalies by means of Sentinel-2 MSI and Landsat-8 OLI data. Remote Sens. 2019, 11, 2876. [Google Scholar] [CrossRef]
- EUMETSAT, Meteosat Third Generation Instruments. Available online: https://www.eumetsat.int/meteosat-third-generation-instruments (accessed on 4 April 2025).
- Ganci, G.; Bilotta, G.; Zuccarello, F.; Cappello, A. Opportunities Offered by the MTG Flexible Combined Imager for Volcano Monitoring. In Proceedings of the IGARSS 2023–2023 IEEE International Geoscience and Remote Sensing Symposium, Pasadena, CA, USA, 16–21 July 2023; pp. 4746–4747. [Google Scholar] [CrossRef]
- EUMETSAT, MTG FCI Level 1c Data Guide. 2025. Available online: https://user.eumetsat.int/resources/user-guides/mtg-fci-level-1c-data-guide (accessed on 2 May 2025).
- Giuffrida, M.; Cardone, M.; Zuccarello, F.; Viccaro, M. Etna 2011–2022: Discoveries from a decade of activity at the volcano. Earth Sci. Rev. 2023, 245, 104563. [Google Scholar] [CrossRef]
- D’Incecco, P.; Filiberto, J.; Garvin, J.B.; Arney, G.N.; Getty, S.A.; Ghail, R.; Zelenyi, L.M.; Zasova, L.V.; Ivanov, M.A.; Gorinov, D.A.; et al. Gorinov Mount Etna as a terrestrial laboratory to investigate recent volcanic activity on Venus by future missions: A comparison with Idunn Mons, Venus. Icarus 2024, 411, 115959. [Google Scholar] [CrossRef]
- Neri, M.; Acocella, V.; Behncke, B.; Maiolino, V.; Ursino, A.; Velardita, R. Contrasting triggering mechanisms of the 2001 and 2002–2003 eruptions of Mount Etna (Italy). J. Volcanol. Geotherm. Res. 2005, 144, 235–255. [Google Scholar] [CrossRef]
- Neri, M.; Acocella, V. The 2004–2005 Etna eruption: Implications for flank deformation and structural behavior of the volcano. J. Volcanol. Geotherm. Res. 2006, 158, 195–206. [Google Scholar] [CrossRef]
- Corsaro, R.A.; Miraglia, L. The transition from summit to flank activity at Mt. Etna, Sicily (Italy): Inferences from the petrology of products erupted in 2007–2009. J. Volcanol. Geotherm. Res. 2014, 275, 51–60. [Google Scholar] [CrossRef]
- Aiuppa, A.; Trisciuzzi, G.L.B.; Alparone, S.; Bitetto, M.; Coltelli, M.; Donne, D.D.; Ganci, G.; Pecora, E. A SO2 flux study of the Etna volcano 2020–2021 paroxysmal sequences. Front. Earth Sci. 2023, 11, 1115111. [Google Scholar] [CrossRef]
- De Beni, E.; Proietti, C.; Scollo, S.; Cantarero, M.; Mereu, L.; Romeo, F.; Pioli, L.; Sciotto, M.; Alparone, S. A hidden eruption: The 21 May 2023 paroxysm of the Etna volcano (Italy). Remote Sens. 2024, 16, 1555. [Google Scholar] [CrossRef]
- Istituto Nazionale di Geofisica e Vulcanologia. Etna, Bollettino Settimanale, Settimana di Riferimento 3–9 February 2025. Available online: https://www.ct.ingv.it/index.php/monitoraggio-e-sorveglianza/prodotti-del-monitoraggio/bollettini-settimanali-multidisciplinari/986-bollettino-Settimanale-sul-monitoraggio-vulcanico-geochimico-e-sismico-del-vulcano-Etna-del-2025-02-11/file (accessed on 22 April 2025). (In Italian).
- Sennert, S. (Ed.) Global Volcanism Program, Report on Etna (Italy) Weekly Volcanic Activity Report, 12–18 February 2025; Smithsonian Institution and US Geological Survey: Washington, DC, USA, 2025. [Google Scholar]
- Sennert, S. (Ed.) Global Volcanism Program, Report on Etna (Italy) Weekly Volcanic Activity Report, 19–25 February 2025; Smithsonian Institution and US Geological Survey: Washington, DC, USA, 2025. [Google Scholar]
- Sennert, S. (Ed.) Global Volcanism Program, Report on Etna (Italy) Weekly Volcanic Activity Report, 26 February–4 March 2025; Smithsonian Institution and US Geological Survey: Washington, DC, USA, 2025. [Google Scholar]
- Sennert, S. (Ed.) Global Volcanism Program, Report on Etna (Italy) Weekly Volcanic Activity Report, 5–11 March 2025; Smithsonian Institution and US Geological Survey: Washington, DC, USA, 2025. [Google Scholar]
- Sennert, S. (Ed.) Global Volcanism Program, Report on Etna (Italy) Weekly Volcanic Activity Report, 19–25 March 2025; Smithsonian Institution and US Geological Survey: Washington, DC, USA, 2025. [Google Scholar]
- Raspaud, M.; Hoese, D.; Lahtinen, P.; Holl, G.; Proud, S.; Finkensieper, S.; Meraner, A.; Dybbroe, A.; Strandgren, J.; Yukaribbba; et al. Pytroll/Satpy, Version 0.52.0 (18 October 2024) (v0.52.0); Zenodo: Geneva, Switzerland, 2024. [CrossRef]
- Tramutoli, V. Robust Satellite Techniques (RST) for natural and environmental hazards monitoring and mitigation: Theory and applications. In Proceedings of the 2007 International Workshop on the Analysis of Multi-Temporal Remote Sensing Images, Leuven, Belgium, 18–20 July 2007. [Google Scholar]
- Koeppen, W.C.; Pilger, E.; Wright, R. Time series analysis of infrared satellite data for detecting thermal anomalies: A hybrid approach. Bull. Volcanol. 2011, 73, 577–593. [Google Scholar] [CrossRef]
- Falconieri, A.; Marchese, F.; Ciancia, E.; Genzano, N.; Mazzeo, G.; Pietrapertosa, C.; Pergola, N.; Plank, S.; Filizzola, C. Exploring the Potential of a Normalized Hotspot Index in Supporting the Monitoring of Active Volcanoes Through Sea and Land Surface Temperature Radiometer Shortwave Infrared (SLSTR SWIR) Data. Sensors 2025, 25, 1658. [Google Scholar] [CrossRef]
- Fisher, D.; Wooster, M.J. Shortwave IR Adaption of the Mid-Infrared Radiance Method of Fire Radiative Power (FRP) Retrieval for Assessing Industrial Gas Flaring Output. Remote Sens. 2018, 10, 305. [Google Scholar] [CrossRef]
- Aveni, S.; Laiolo, M.; Adele Campus; Massimetti, F.; Coppola, D. The capabilities of FY-3D/MERSI-II sensor to detect and quantify thermal volcanic activity: The 2020–2023 Mount Etna case study. Remote Sens. 2023, 15, 2528. [Google Scholar] [CrossRef]
- Gibson, R.K.; Mitchell, A.; Chang, H.-C. Image texture analysis enhances classification of fire extent and severity using Sentinel 1 and 2 satellite imagery. Remote Sens. 2023, 15, 3512. [Google Scholar] [CrossRef]
- Wright, R.; Flynn, L.P.; Garbeil, H.; Harris, A.J.; Pilger, E. MODVOLC: Near-real-time thermal monitoring of global volcanism. J. Volcanol. Geotherm. Res. 2004, 135, 29–49. [Google Scholar] [CrossRef]
- Adele Campus; Laiolo, M.; Massimetti, F.; Coppola, D. The Transition from MODIS to VIIRS for Global Volcano Thermal Monitoring. Sensors 2022, 22, 1713. [Google Scholar] [CrossRef]
- Genzano, N.; Pergola, N.; Marchese, F. A Google Earth Engine tool to investigate, map and monitor volcanic thermal anomalies at global scale by means of mid-high spatial resolution satellite data. Remote Sens. 2020, 12, 3232. [Google Scholar] [CrossRef]
- Mazzeo, G.; Falconieri, A.; Filizzola, C.; Genzano, N.; Pergola, N.; Marchese, F. Wildfire detection and mapping by satellite with an enhanced configuration of the Normalized Hotspot Indices: Results from Sentinel-2 and Landsat 8/9 data integration. IEEE Trans. Geosci. Remote Sens. 2025, 63, 5606121. [Google Scholar] [CrossRef]
- Istituto Nazionale di Geofisica e Vulcanologia (INGV). Survelliance of Sicilian Areas. Available online: https://www.ingv.it/en/monitoraggio-e-infrastrutture/sorveglianza/servizio-di-sorveglianza-vulcani-attivi/sorveglianza-aree-siciliane (accessed on 22 April 2025).
- Pergola, N.; Marchese, F.; Tramutoli, V. Automated detection of thermal features of active volcanoes by means of infrared AVHRR records. Remote Sens. Environ. 2004, 93, 311–327. [Google Scholar] [CrossRef]
- Filizzola, C.; Corrado, R.; Marchese, F.; Mazzeo, G.; Paciello, R.; Pergola, N.; Tramutoli, V. RST-FIRES, an exportable algorithm for early-fire detection and monitoring: Description, implementation, and field validation in the case of the MSG-SEVIRI sensor. Remote Sens. Environ. 2017, 192, e2–e25. [Google Scholar] [CrossRef]
- Balagizi, C.M.; Kies, A.; Kasereka, M.M.; Tedesco, D.; Yalire, M.M.; McCausland, W.A. Natural hazards in Goma and the surrounding villages, East African Rift System. Nat. Hazards 2018, 93, 31–66. [Google Scholar] [CrossRef]
- Wooster, M.J.; Xu, W. Sentinel-3 SLSTR Level 2 Active Fire Detection and FRP Product Algorithm. DOCUMENT REF. S3-L2-SD-03-T04-KCL-ATBD_FIREPRODUCT. Last Modified: 15 February 2022. Available online: https://sentiwiki.copernicus.eu/__attachments/1672112/S3-L2-SD-03-T04-KCL-ATBD_FIREPRODUCT%20-%20Sentinel-3%20SLSTR%20Level%202%20Active%20Fire%20Detection%20and%20FRP2022%20-%205.1.pdf?inst-v=08ab86b7-7826-42f7-bfed-a5ce0704f555 (accessed on 5 May 2025).


Disclaimer/Publisher’s Note: The statements, opinions and data contained in all publications are solely those of the individual author(s) and contributor(s) and not of MDPI and/or the editor(s). MDPI and/or the editor(s) disclaim responsibility for any injury to people or property resulting from any ideas, methods, instructions or products referred to in the content. |
© 2025 by the authors. Licensee MDPI, Basel, Switzerland. This article is an open access article distributed under the terms and conditions of the Creative Commons Attribution (CC BY) license (https://creativecommons.org/licenses/by/4.0/).