Article

Integrating UAV-Based RGB Imagery with Semi-Supervised Learning for Tree Species Identification in Heterogeneous Forests

1
College of Biosystems Engineering and Food Science, Zhejiang University, Hangzhou 310058, China
2
State Key Laboratory for Vegetation Structure, Function and Construction (VegLab), MOE Key Laboratory of Biosystem Homeostasis and Protection, College of Life Sciences, Zhejiang University, Hangzhou 310058, China
3
Department of Nutrition & Food Science, National Research Centre, Dokki, Giza 12622, Egypt
4
Zhejiang Branch of Chinese Academy of Agricultural Mechanization Sciences Group Co., Ltd., Shaoxing 312039, China
*
Author to whom correspondence should be addressed.
Remote Sens. 2025, 17(15), 2541; https://doi.org/10.3390/rs17152541
Submission received: 6 June 2025 / Revised: 16 July 2025 / Accepted: 17 July 2025 / Published: 22 July 2025
(This article belongs to the Special Issue Remote Sensing-Assisted Forest Inventory Planning)

Abstract

The integration of unmanned aerial vehicle (UAV) remote sensing and deep learning has emerged as a highly effective strategy for inventorying forest resources. However, the spatiotemporal variability of forest environments and the scarcity of annotated data hinder the performance of conventional supervised deep-learning models. To overcome these challenges, this study has developed efficient tree (ET), a semi-supervised tree detector designed for forest scenes. ET employed an enhanced YOLO model (YOLO-Tree) as a base detector and incorporated a teacher–student semi-supervised learning (SSL) framework based on pseudo-labeling, effectively leveraging abundant unlabeled data to bolster model robustness. The results revealed that SSL significantly improved outcomes in scenarios with sparse labeled data, specifically when the annotation proportion was below 50%. Additionally, employing overlapping cropping as a data augmentation strategy mitigated instability during semi-supervised training under conditions of limited sample size. Notably, introducing unlabeled data from external sites enhances the accuracy and cross-site generalization of models trained on diverse datasets, achieving impressive results with F1, mAP50, and mAP50-95 scores of 0.979, 0.992, and 0.871, respectively. In conclusion, this study highlights the potential of combining UAV-based RGB imagery with SSL to advance tree species identification in heterogeneous forests.

1. Introduction

Trees are the primary components of forest vegetation and play a crucial role in influencing the stability, productivity, and carbon stocks of forest ecosystems. The diversity of trees represents the forest biodiversity level at the stand scale [1]. Identifying tree species at the single-tree level contributes significantly to the further refinement of forest composition and is the primary step in forest monitoring. It is essential for forestry, biogeographic assessment, and biodiversity monitoring [2]. Yet, the traditional approach to tree species identification relies on labor-intensive fieldwork, which is often constrained by complex forest topography, thus hindering rapid macro-scale monitoring and the timely observation of species’ spatiotemporal dynamics.
In recent years, remote-sensing technology has undergone continuous and rapid development. Various remote-sensing platforms, including drones, airplanes, and satellites, are widely used for forest monitoring at different scales. In particular, UAVs are extensively used to obtain multi-temporal high-resolution data due to their flexibility [3,4]. The widespread cross-disciplinary application of some state-of-the-art (SOTA) models from the field of object detection or semantic segmentation has confirmed the effectiveness of implementing tree species mapping based on various remote-sensing images [5,6,7,8].
Currently, studies on the UAV-based identification of forest tree species are still based on passive remote-sensing methods, such as visible, multispectral, and hyperspectral imaging. Particularly, RGB images are widely used in mapping forest tree species due to their advantages of low cost and high resolution. Extensive research has assessed the potential of integrating supervised deep-learning models with high-resolution RGB imagery for mapping tree species at the individual and stand level [9,10,11]. However, forest structures usually exhibit remarkable diversity across locations and temporal periods. The heterogeneity of forests presents significant challenges to the development of supervised models, as these models may struggle to generalize to other regions beyond the distribution of the training data [12]. Consequently, it is necessary to build comprehensive datasets comprising various locations, years, seasons, illumination conditions, and forest stand compositions for training robust models [13]. With the continuous advancement of sensor technology, acquiring high-resolution aerial imagery has become more efficient and economical. At the same time, ground-truth labeling relies on labor-intensive field surveys and visual interpretation. The complex geographical conditions and the unique community architectures of certain forests may restrict the accessibility of in situ data. Furthermore, ensuring the consistency and accuracy of data annotation would be challenging due to the complex forest stand structures (e.g., vertical stratification), intra-species variations (e.g., morphological changes in crown size), and dynamic weather [14,15].
To overcome the limitations of labeled datasets, many studies have adopted a transfer-learning strategy based on the “pre-training and fine-tuning” paradigm. The approach can enable effective cross-domain knowledge transfer by learning general features from large-scale datasets (such as crowdsourced datasets like iNaturalist or various forest datasets) and subsequently adapting to small domain-specific datasets [16,17,18]. Although this method enables models to achieve competitive performance with a fraction of the data required for training from scratch, its effectiveness is dependent on the representativeness of the source–domain dataset used for pre-training. Fine-tuning is often insufficient to bridge the significant domain gap between the source and target domains, leading to limited performance improvements. As another effective method to address the data annotation bottleneck, SSL has garnered considerable attention in the field of remote sensing [19]. Through strategies such as pseudo-label refinement, SSL can effectively leverage the abundant unlabeled data to facilitate the learning of more robust feature representations, thereby enhancing the model’s performance and generalization capability. Recently, researchers have conducted extensive work on land cover classification [20,21,22] and small-object detection [23,24]. However, there are very few studies that apply SSL to forest monitoring tasks. In a recent survey, Luo et al. [25] proposed an attention-enhanced learning and adaptive threshold semi-supervised object detection method for accurately detecting dead pine trees. This innovative methodology achieved comparable performance to fully supervised learning benchmarks while utilizing merely 25% of the annotated training data.
The inherent spatiotemporal variability of forest ecosystems, coupled with the general scarcity of large-scale annotated data, has posed significant challenges to the effective application of conventional supervised deep learning models in forest monitoring. Therefore, this study aims to investigate the feasibility of integrating UAV-based RGB imagery with SSL for identifying multiple tree species in heterogeneous forests. To achieve this target, a semi-supervised ET was developed for recognizing various species at the single-tree level. In addition, a systematic analysis was conducted to assess the impacts of variables such as flight altitude, overlap ratio, and site on the model’s performance. Furthermore, the performance of ET was compared with that of YOLO-Tree across datasets with varying annotation proportions, thereby validating the efficacy of the SSL applied model.

2. Materials and Methods

2.1. Study Area

Tian-mu Mountain National Nature Reserve (119°24′11″~119°28′21″E, 30°18′30″~30°24′55″N) is located in Lin’an District, Northwestern Hangzhou City, Zhejiang Province, China. It lies in the transitional area between the northern edge of the mid-subtropical zone and the north subtropical zone, with an elevation ranging from 300 to 1556 m. The reserve is part of the Huangshan–Huaiyu mountains biodiversity conservation priority area and harbors a rich diversity of wild plant resources. It serves as a critical habitat for wild populations of species such as China cedar (Cryptomeria fortunei), ginkgo (Ginkgo biloba), and golden larch (Pseudolarix amabilis). In this study, three sites were selected near the Chan-yuan Temple (foothill zone), San-li Pavilion (mid-slope), and Ancient Hall (summit area) on the southern slope of West Tian-mu Mountain (Figure 1). The elevation ranges of the three regions are 343~405 m, 631~735 m, and 1000~1158 m, respectively. The main vegetation types for the Chan-yuan Temple and Ancient Hall regions are evergreen coniferous forests and evergreen deciduous broad-leaved mixed forests, respectively, with the China cedar serving as the dominant species in both areas.

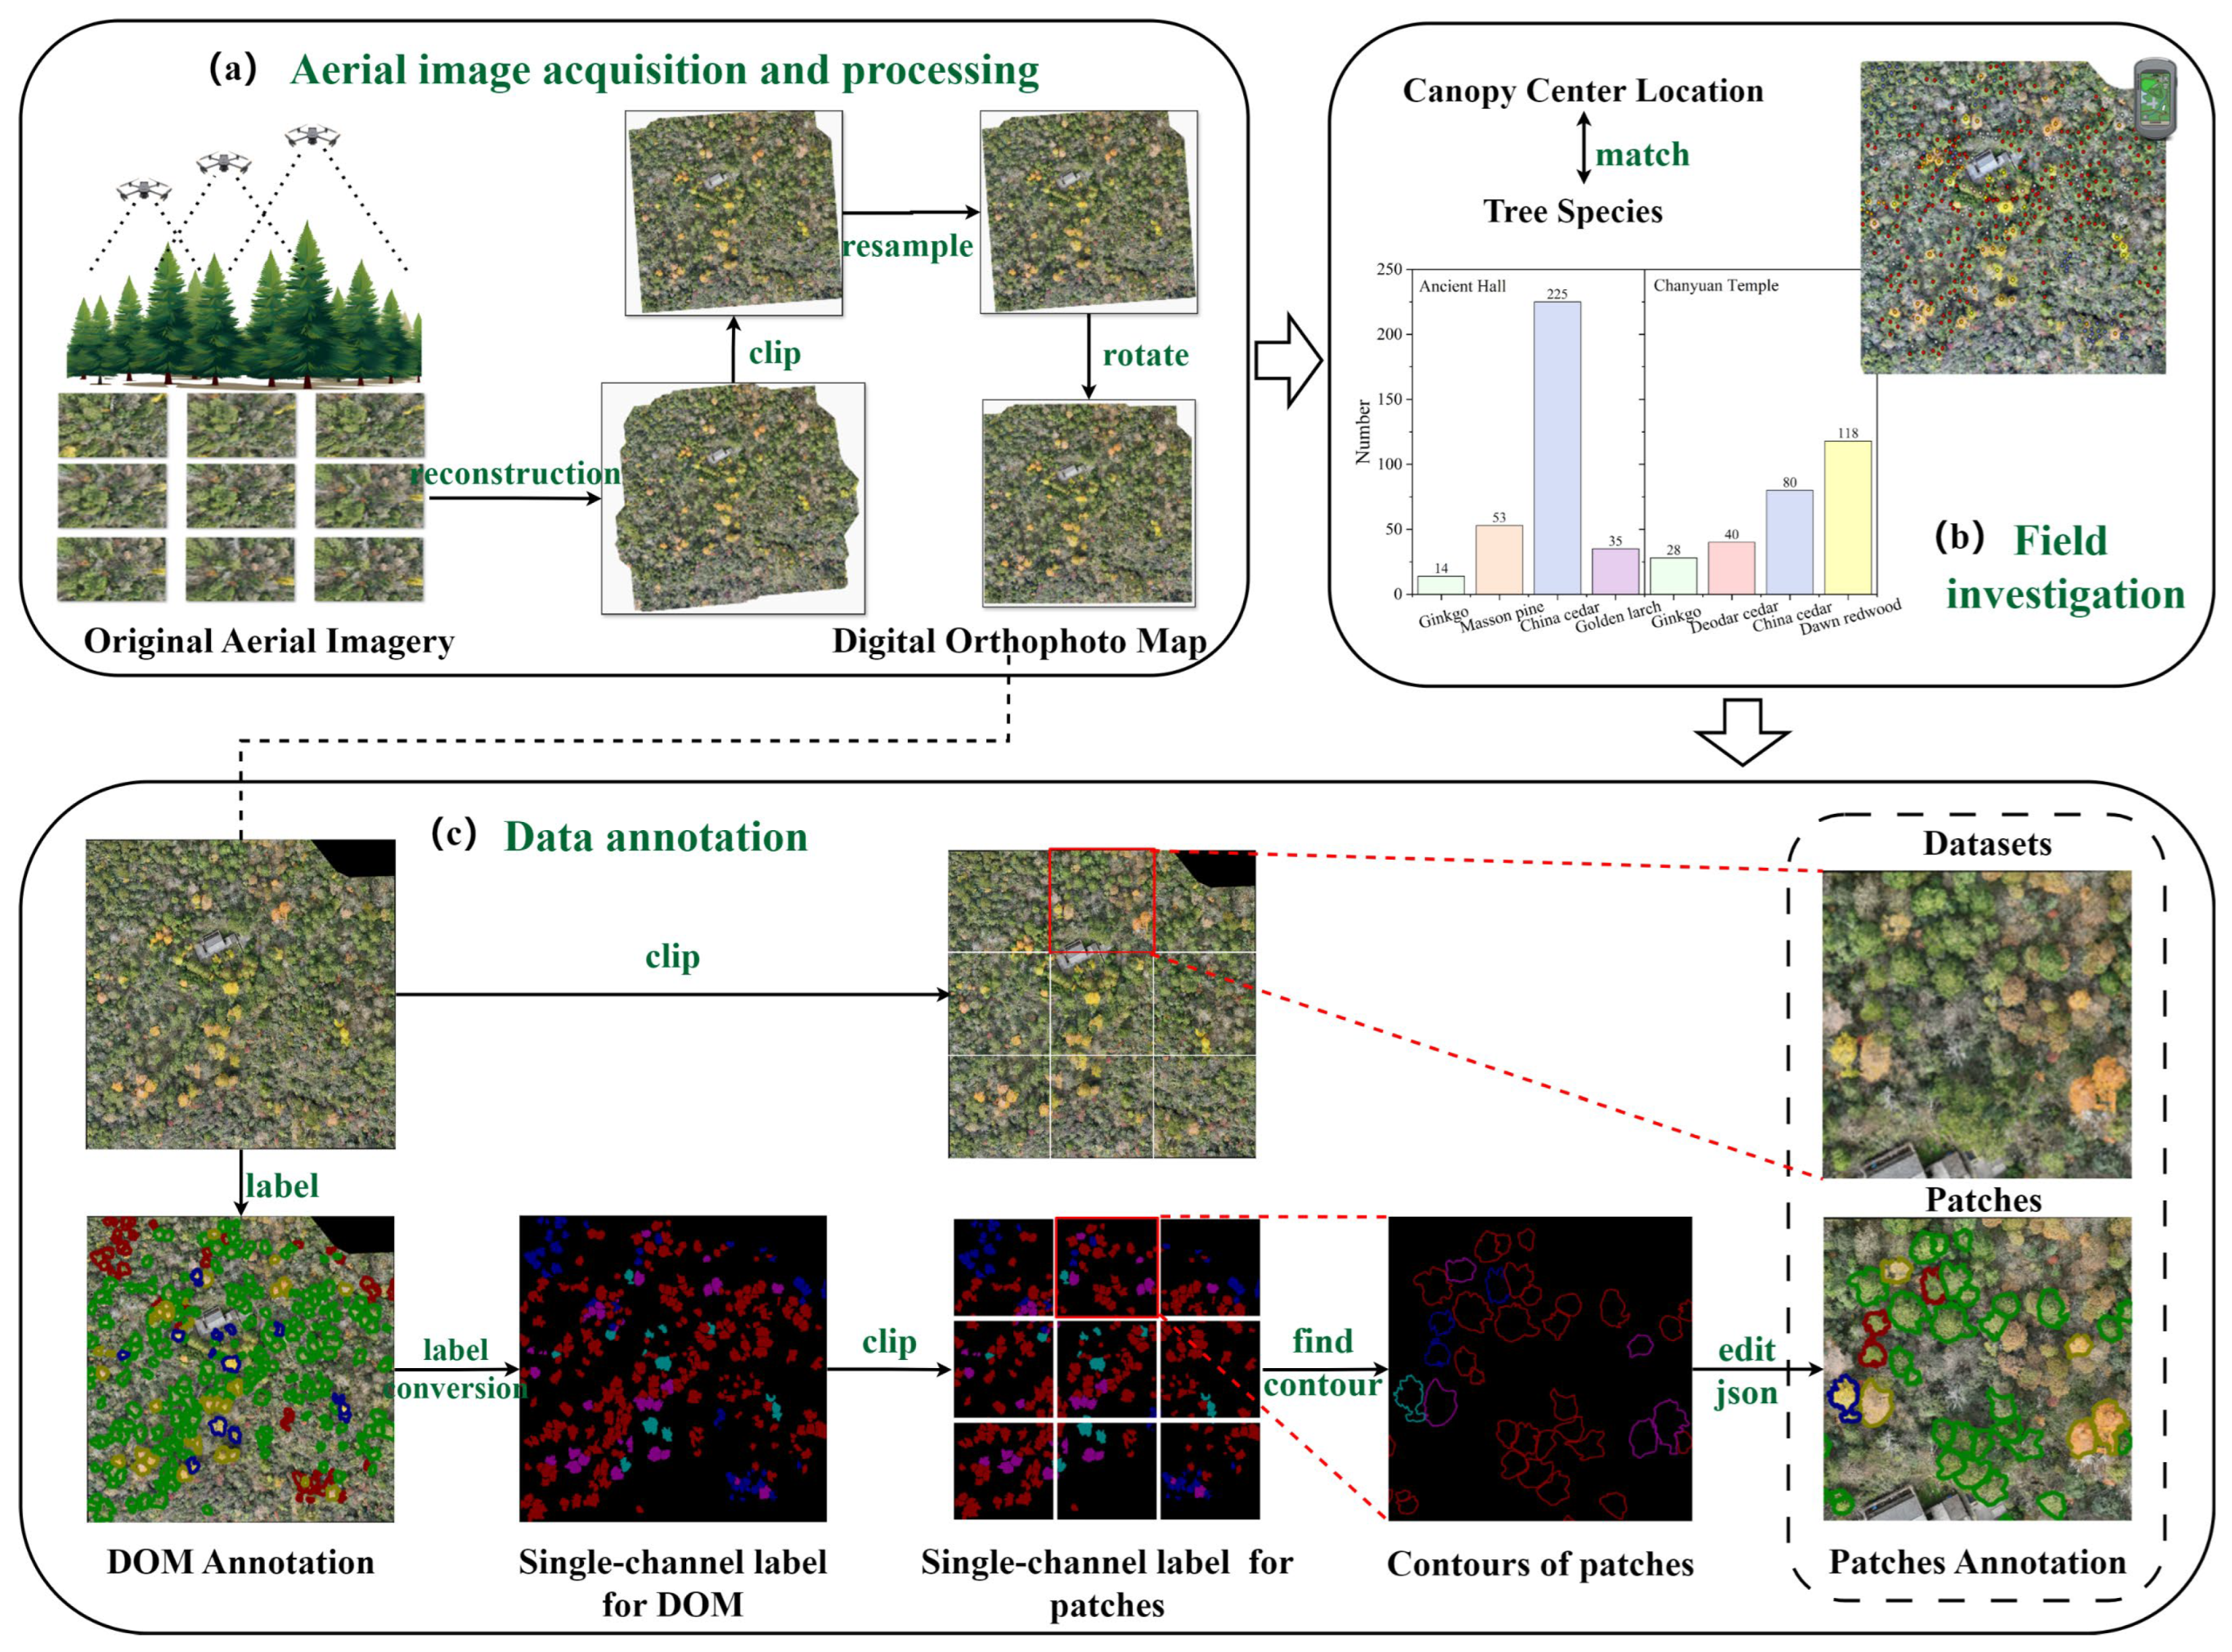
2.2. Data Acquisition and Processing

The overall workflow of data acquisition and processing is illustrated in Figure 2, which involves (a) aerial image acquisition and processing, (b) field investigation, and (c) data annotation.

2.2.1. Aerial Image Acquisition and Processing

From June 2023 to April 2024, a DJI Mavic 3E platform (DJI Innovation Technology Co., Ltd., Shenzhen, China) was utilized to collect aerial imagery of the forest canopy in the three regions at monthly intervals. Altogether, the flight missions were not conducted in September and October 2023, nor in February 2024, resulting in a total of eight months of aerial imagery being obtained. Due to the altitude differences within the study area, particularly in the Ancient Hall region, the terrain following the flight mode was adopted to ensure the safety and accuracy of the aerial surveys. Flight altitudes of 60, 100, and 150 m were set to obtain various ground resolution images, with corresponding flight speeds of 3, 6, and 8 m/s. A forward and lateral overlap rate of 80% was maintained. The ground sample distance (GSD) of the aerial imagery collected during each flight mission is presented in Table S1. The GSD ranges for the three study areas are 1.9~4.4 cm/px (Chan-yuan Temple), 2.0~4.4 cm/px (San-li Pavilion), and 2.3~5.2 cm/px (Ancient Hall), respectively.
More importantly, the DJI Terra (V4.2.5) software was used for the 2D reconstruction to generate the digital orthophotography maps (DOMs). Although the flight missions were conducted at consistent altitudes across different months, the use of the terrain-following flight mode caused minor variations in the GSD due to seasonal variations in vegetation and fluctuations in topography. Consequently, the DOMs were resampled to a uniform spatial resolution and cropped into tiles of 640 × 640 pixels for model training. The sliding window method was used for clipping, and datasets of different sizes were created by adjusting the overlap ratio (0%, 25%, and 50%). Additionally, since the orthophoto boundaries are not oriented in a north–south direction, geometric rectification is required before the tiling process. This step effectively mitigated the occurrence of extensive black margins along the patch boundaries. The resampling and geometric correction procedures for the DOMs were performed using ArcGIS Pro 3.0 software (ESRI, CA, USA).

2.2.2. Field Investigation

All trees with discernible canopies were first marked in ArcGIS Pro, with their geographic coordinates recorded at the centroid of each crown polygon. Subsequently, the ground survey was conducted in April 2024, during which a handheld GPS device was utilized to verify the spatial correspondence between the field-observed trees and the canopies in remote-sensing imagery. Tree species were identified based on their morphological characteristics, including bark, branches, and leaves. Due to the complex topography and diverse species composition within the study area, recognizable tree species near the trails in the Chan-yuan Temple and Ancient Hall regions were only inventoried. The two zones encompass 19 species of arbors, totaling approximately 666 trees. China cedar, dawn redwood (Metasequoia glyptostroboides), masson pine (Pinus massoniana), ginkgo, deodar cedar (Cedrus deodara), and golden larch are the dominant species, with high abundance (>30 individuals per plot). The three tree species, including golden larch, dawn redwood, and ginkgo, have been classified as endangered by the International Union for Conservation of Nature (IUCN). Figure S1 provides the canopy images of the dominant tree species in the two regions during distinct phenological phases.

2.2.3. Data Annotation

The canopy contours of six dominant tree species were annotated using the LabelMe tool. To enhance the annotation efficiency, the DOMs from November 2023, which exhibited obvious canopy boundaries, were initially labeled, and these annotations served as reference templates for all other monthly DOMs. Then, each contour was manually adjusted to minimize slight shape changes caused by seasonal variations. For instance, deciduous trees such as dawn redwood, ginkgo, and golden larch gradually shed their leaves during autumn and winter, leading to smaller contours compared to those in spring and summer. The leaves of the three tree species almost completely fell off, leaving only bare branches during December, January, and March, so the annotations for deciduous trees in these three months were removed. The annotation count for each tree species is detailed in Table S2, with a total of 10,450 tree crowns labeled.
Data annotation was performed with full-resolution orthophotography. After cropping the DOM into sub-images, matched annotations must be generated for each patch, necessitating the systematic post-processing of the JSON files. The label conversion process is illustrated in Figure 2c. Initially, a single-channel mask was generated based on the entire DOM’s JSON file and then clipped into small patches. The positional coordinates and label information of all contours were subsequently extracted based on the plot mask and recorded in the corresponding annotations. Finally, the JSON files containing patch-level annotations were converted into standardized formats compatible with target detection frameworks.

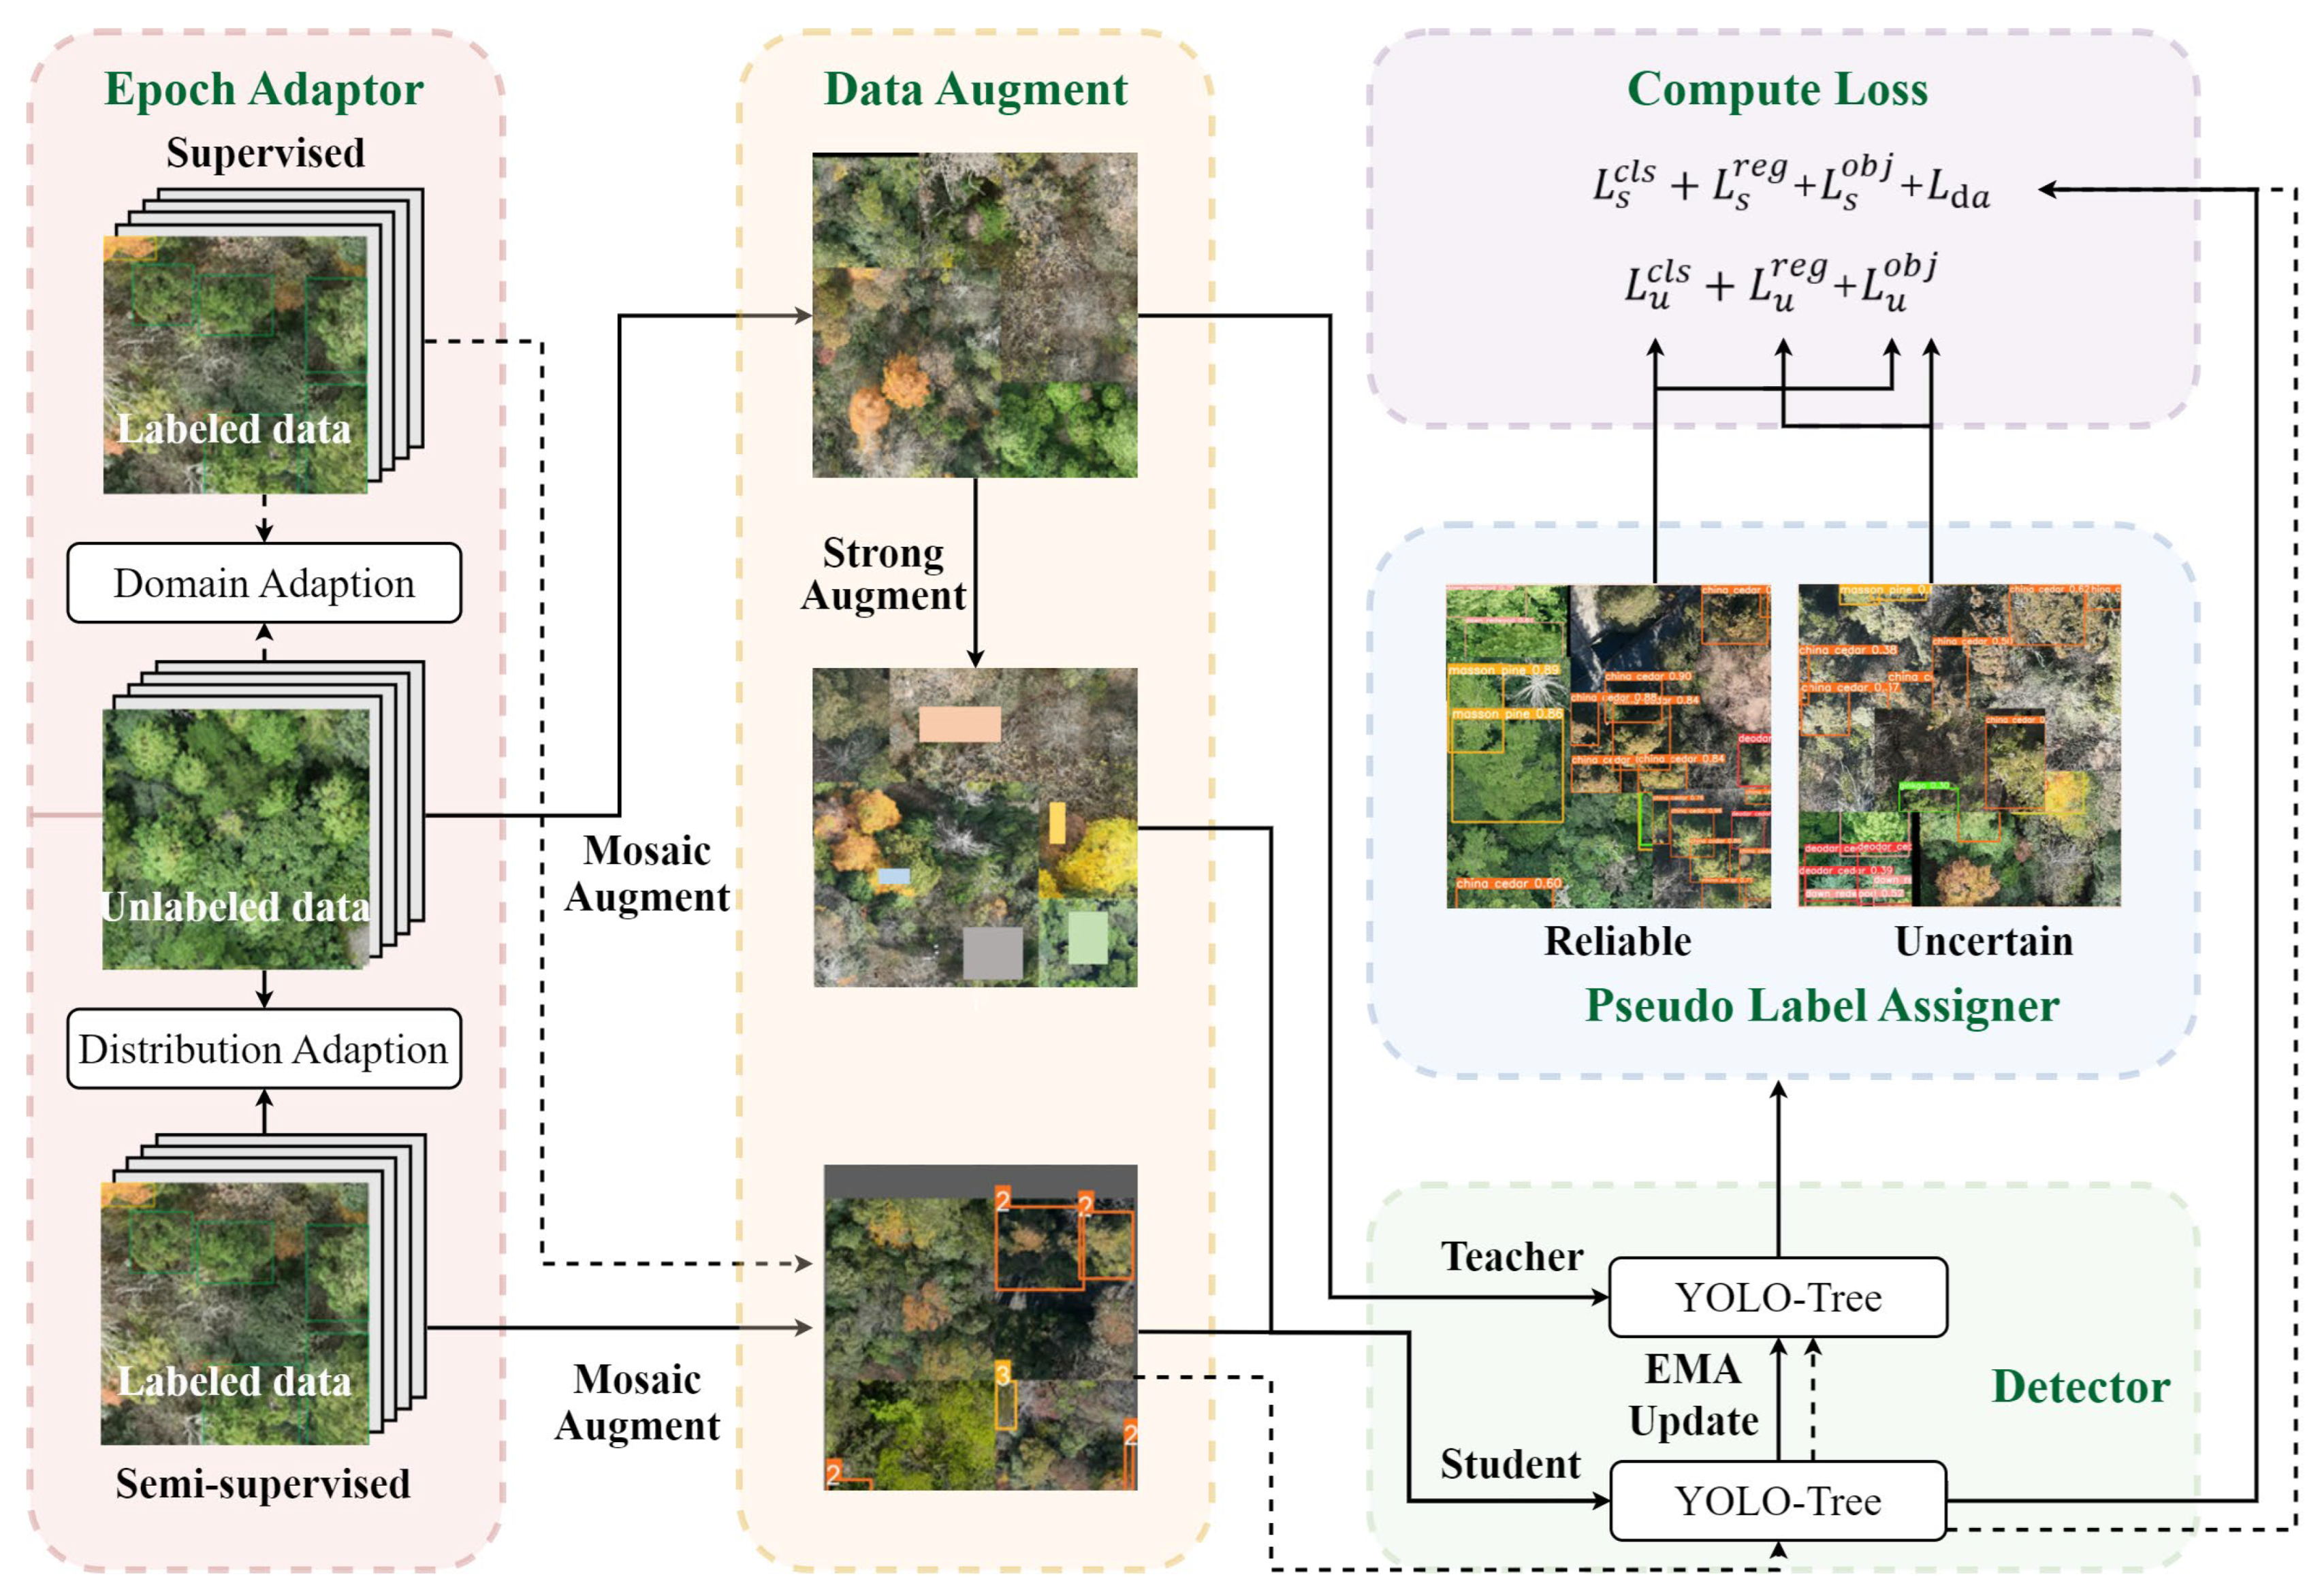
2.3. Semi-Supervised Object Detection

To address the constraints on supervised model performance imposed by heterogeneous data and insufficient labeled data in forest monitoring, a semi-supervised tree detector (ET) for multi-species identification at the single-tree level was developed. Efficient tree employs a teacher-student SSL framework based on pseudo-labeling (Figure 3), aiming to enhance detection accuracy and generalization capability in heterogeneous forest environments.
Following the framework reported by Xu et al. [26], this whole training process was divided into supervised (burn-in) and semi-supervised phases. During training, the student model was directly optimized, whereas the teacher model was updated according to the weights of the student model through the exponential moving average (EMA) technique. The burn-in phase was an initialization process to equip the student and teacher models with initial detection capabilities through supervised learning. In the following semi-supervised phase, unlabeled images augmented with mosaic enhancement are input into the teacher model to generate pseudo-labels. The pseudo-label assigner (PLA) employs a dual-threshold to classify the pseudo-labels after non-maximum suppression into reliable and uncertain categories. The uncertain pseudo-labels are further refined into those with high classification scores or high objectness scores, based on the confidence scores. PLA also introduces a consistency constraint by incorporating a soft loss, which was designed to handle uncertain pseudo-labels separately. Specifically, the objectness loss was calculated for uncertain pseudo-labels with high classification scores, whereas the regression loss was computed when the objectness score exceeded 0.99. This pseudo-label assignment mechanism, combined with the soft loss computation method, helps alleviate the issue of pseudo-label inconsistency that arises during semi-supervised object detection training. Afterwards, the strongly augmented unlabeled data (with pseudo-labels) and the mosaic-augmented labeled data are jointly served as supervisory signals to guide the student model’s parameter updates. In addition, the epoch adaptor was designed to stabilize and accelerate the training process. A domain adaptation approach was employed in the burn-in phase to reduce the distributional gap between the labeled and unlabeled datasets, thereby preventing the student model from overfitting to the labeled data. During the semi-supervised phase, a redistribution-based distribution adaptation method was implemented to compute the dual-threshold at each epoch dynamically.
The base detector influences the extent to which semi-supervised object detection enhances performance because the detector’s performance directly impacts both the quality of the pseudo-labels and the stability of the training process [27,28,29]. Therefore, the proposed anchor-based YOLO model (YOLO-Tree) was adapted to the aforementioned SSL framework, with the model architecture shown in Figure 4. YOLO-Tree utilizes ResNet-34 as the backbone. At the same time, the neck component is primarily inherited from YOLOv8. Inspired by the attention feature fusion [30], we embedded the channel attention module (CAM) and the multi-scale attention module (MSAM) into the neck structure to alleviate the semantic mismatch problem caused by up- and down-sampling operations during the progressive fusion of multi-level features. In CAM, global average pooling is applied to extract global information from the channels, which is then passed through two 1 × 1 convolutional layers and a sigmoid activation function to generate channel-wise weights, thereby dynamically regulating the feature responses among the channels. CAM has low computational complexity and supports flexible input sizes, making it more suitable for processing multi-scale features from layers at different hierarchical levels. MSAM adopts a parallel multi-branch framework utilizing several depth-wise separable convolutional layers to capture multi-scale features. It employs small-kernel (3 × 3) layers for extracting local details and large-kernel (5 × 5 and 7 × 7) layers for expanding the receptive field and aggregating broader contextual information. A 1 × 1 convolutional layer was then followed to compress the channel dimension, thereby generating a spatial attention mask. Through the adaptive weighted integration of multi-branch outputs via element-wise multiplication, the module achieves soft feature selection across different scale-specific feature maps. It was noteworthy that CAM and MSAM alternately process high-level and low-level features through top–down and bottom–up pathways in the neck structure. During the up-sampling process, MSAM dynamically adjusts the spatial distribution of high-level features to correct positional deviations induced by interpolation, while CAM suppresses the noise inherent in low-level features through channel-wise feature recalibration. At the down-sampling stage, MSAM expands the receptive field of low-level features and effectively avoids detail loss by integrating global information. At the same time, CAM focuses on salient regions within high-level semantic features. To address channel dimensionality mismatch in feature fusion across layers without adding learnable parameters, features are concatenated along the channel dimension.

2.4. Experimental Setup

2.4.1. Datasets

The DOMs of all months at both sites were cropped into non-overlapping slices of 640 × 640 pixels. The sub-images, along with their corresponding annotations, constitute three datasets: Ancient Hall, Chan-yuan Temple, and All (comprising two regions mixed), respectively. The datasets were split into training, validation, and test sets in a ratio of 8:1:1.

2.4.2. Implementation Details

The image size for YOLO-Tree training was set to 640. The initial learning rate was set to 0.01. The batch size was set to 32, and the number of training epochs was set to 100. Efficient tree was trained for 100 epochs in both the burn-in and semi-supervised stages, and the cutout method was applied in the semi-supervised phase to achieve substantial data augmentation. Both YOLO-Tree and ET were fine-tuned based on the YOLOv8s pre-trained model to accelerate convergence and improve performance.
All experiments were conducted on a computer equipped with an Intel (R) Core (TM) i9-14900K CPU and an NVIDIA GeForce RTX 4090D GPU (24 GB RAM). Both model training and inference were implemented using PyTorch 2.0.0, with the underlying computational acceleration provided by CUDA 11.8 and cuDNN 8.9.2 libraries.

2.5. Evaluation Metrics

The performances of the models were evaluated using several widely adopted accuracy metrics in object detection, including precision (P), recall (R), F1-Score (F1), mAP50, and mAP50-95. Precision quantifies the proportion of true positives among all positive predictions, while recall calculates the proportion of true positives among all actual positives. The F1 Score is the harmonic mean of precision and recall, providing a balanced assessment of a model’s performance. The mAP50 is the mean average precision calculated at an intersection over union (IoU) threshold of 0.50. The mAP50-95 is the average of the mean average precision calculated at varying IoU thresholds ranging from 0.5 to 0.95, which comprehensively reflects the model’s performance across different levels of detection difficulty. The formulas for these evaluation metrics are as follows:
P = T P T P + F P
R = T P T P + F N
F 1 = 2 P R P + R
m A P 50 = 1 C c = 1 C 0 1 P c ( R I o U = 0.5 )   d R
m A P 50 95 = 1 C 1 10 c = 1 C t = 0.5 0.95 0 1 P c ( R I o U = t )   d R
where C is the number of tree species categories; Pc is the precision for class c; t is the IoU threshold ranging from 0.50 to 0.95; and TP, FP, TN, and FN are the numbers of true-positive, false-positive, true-negative, and false-negative instances corresponding to each category, respectively.

3. Results

3.1. Performance Comparison of YOLO-Tree with Other Supervised Models

The basic detection capabilities of YOLO-Tree were evaluated through a performance comparison with four mainstream single-stage object detection models (RetinaNet, YOLOv5, YOLOv8, and YOLO11) across three datasets (Table 1). YOLO-Tree achieved the best performance on the Ancient Hall dataset, with P, R, F1, mAP50, and mAP50-95 metrics of 0.934, 0.852, 0.891, 0.930, and 0.684, respectively. The improvements were 3.1%, 2.3%, 2.7%, 2.7%, and 0.4%, respectively, relative to the state-of-the-art YOLOv11 model. On the other two datasets, YOLO-Tree demonstrated superior performance over anchor-based models (RetinaNet and YOLOv5), showing particularly significant improvements in the mAP50-95 metric, with average increases of 5.8% and 13.2%, respectively. In comparison with anchor-free models like YOLOv8 and YOLOv11, although there was a decrease in mAP50-95, the proposed model sustained competitive performances in both F1-score and mAP50.
The detection results of YOLO-Tree were further compared with those of other mainstream YOLO models in complex forest scenarios (Figure 5). Greater performance stability for YOLO-Tree under conditions involving complex terrain and cluttered canopies could be observed in Figure 5a,b,e. In contrast, other models displayed obvious issues in terms of missed detections. In scenes with high tree density and severe occlusion (Figure 5c,d), YOLOv5 and YOLOv11 showed limited capability in differentiating adjacent or partially overlapped targets. They were prone to failing to detect targets or mistakenly identifying multiple objects as a single entity. However, a notable common observation was that all models maintained high detection accuracy in multi-species mixed areas (Figure 5f,g), with minor false or missed detections primarily occurring near image edges. This indicated that these models possessed robust feature extraction and classification capabilities, enabling them to effectively handle scenes with mixed vegetation. The quantitative performance and visual comparison results thoroughly proved that YOLO-Tree exhibited outstanding multi-scale detection capability and environmental adaptability in complex natural scenes.
The effectiveness of YOLO-Tree was verified by systematically assessing the contributions of key modules within the model to the overall performance through ablation studies. As shown in Table 2, integrating the ResNet34 backbone and YOLOv8 neck led to a substantial performance enhancement over the baseline model, with F1, mAP50, and mAP50-95 increasing by 5.0%, 4.8%, and 6.5% respectively, on the Ancient Hall dataset. The addition of MSAM and CAM resulted in further improvements in detection accuracy, suggesting their positive impact on the multi-scale feature fusion process. The model heatmaps (Figure 6) generated by GradCAM [31] revealed that the model exhibited a stronger response to targets after incorporating MSAM and CAM, as reflected by wider and brighter focal regions. These results clearly showed that each component contributed to the overall model performance, and their synergistic combination led to the most significant improvements.

3.2. Impact of Multiple Factors on the Performance of YOLO-Tree

The necessity of heterogeneous data for enhancing model robustness was assessed by analyzing the influence of flight altitudes, overlap ratios, and sites on YOLO-Tree performance (Table 3). The results indicated that model performance varied according to these three factors. A general upward trend was observed across the model’s performance metrics as the flight altitude increased. Although the least amount of valid data was obtained during data acquisition at an altitude of 150 m among all flight missions, the model achieved optimal performance under this configuration. Increasing the overlap ratio also contributed to enhancing the model accuracy. With a 50% overlap ratio, the dataset sizes were amplified to approximately 3.6 times that of non-overlapping datasets, accompanied by an average rise of 9.3% in mAP50 and 25.4% in mAP50-95. Since the species compositions in Chan-yuan Temple and Ancient Hall were not identical, the influence of site conditions was assessed by comparing the model’s average detection performance for China cedar and ginkgo, with detailed metrics provided in Table S3. It was observable that the Chan-yuan Temple area retained relatively higher accuracy under most combinations of overlap ratios and flight altitudes. The performance gap between the two sites significantly narrowed when employing combinations of high overlap ratios with mixed flight altitudes. However, YOLO-Tree exhibited limited cross-site generalization, evidenced by substantial declines in detection performance when single-site-trained models were tested on new locations (Figure 7a,b). The application of an overlapping cropping strategy might exacerbate the problem of poor transferability. Generally, the models failed to effectively detect ginkgoes, which was reflected in a very low mAP50, typically below 0.1. In contrast, the models trained on data from the Ancient Hall site generally performed better in generalizing to China cedar at the Chan-yuan Temple site, with a maximum mAP50 of up to 0.573.

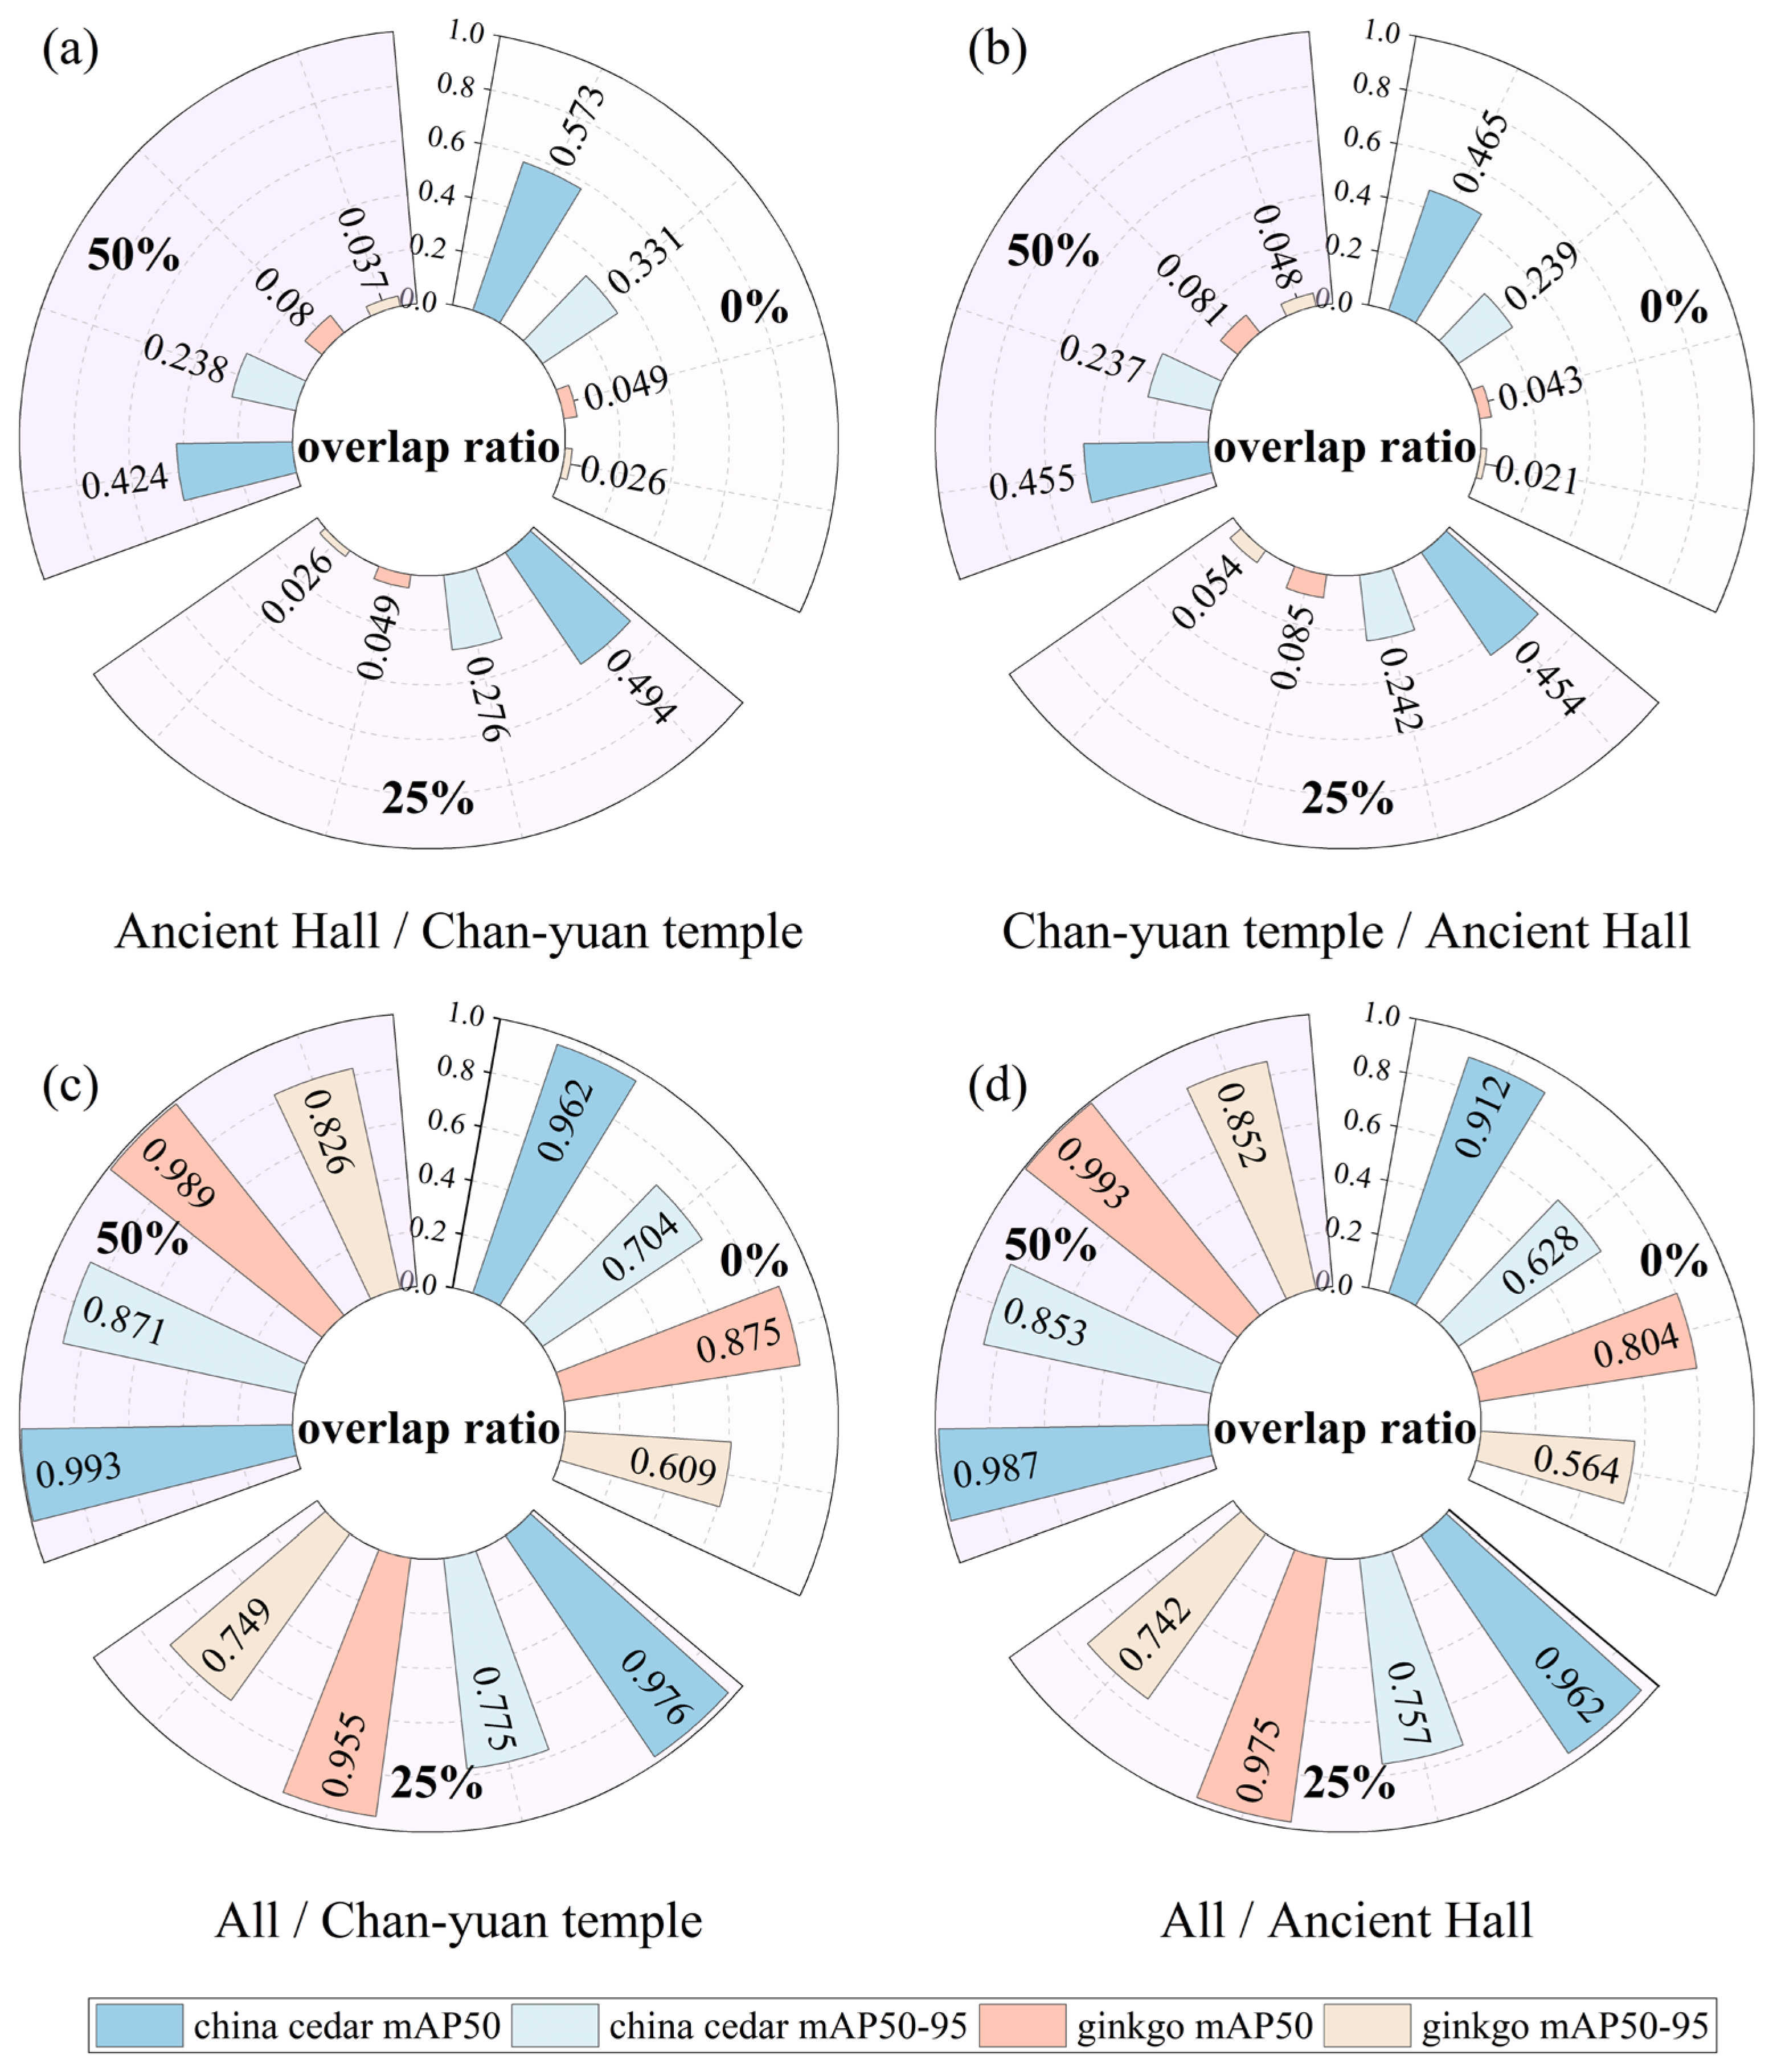
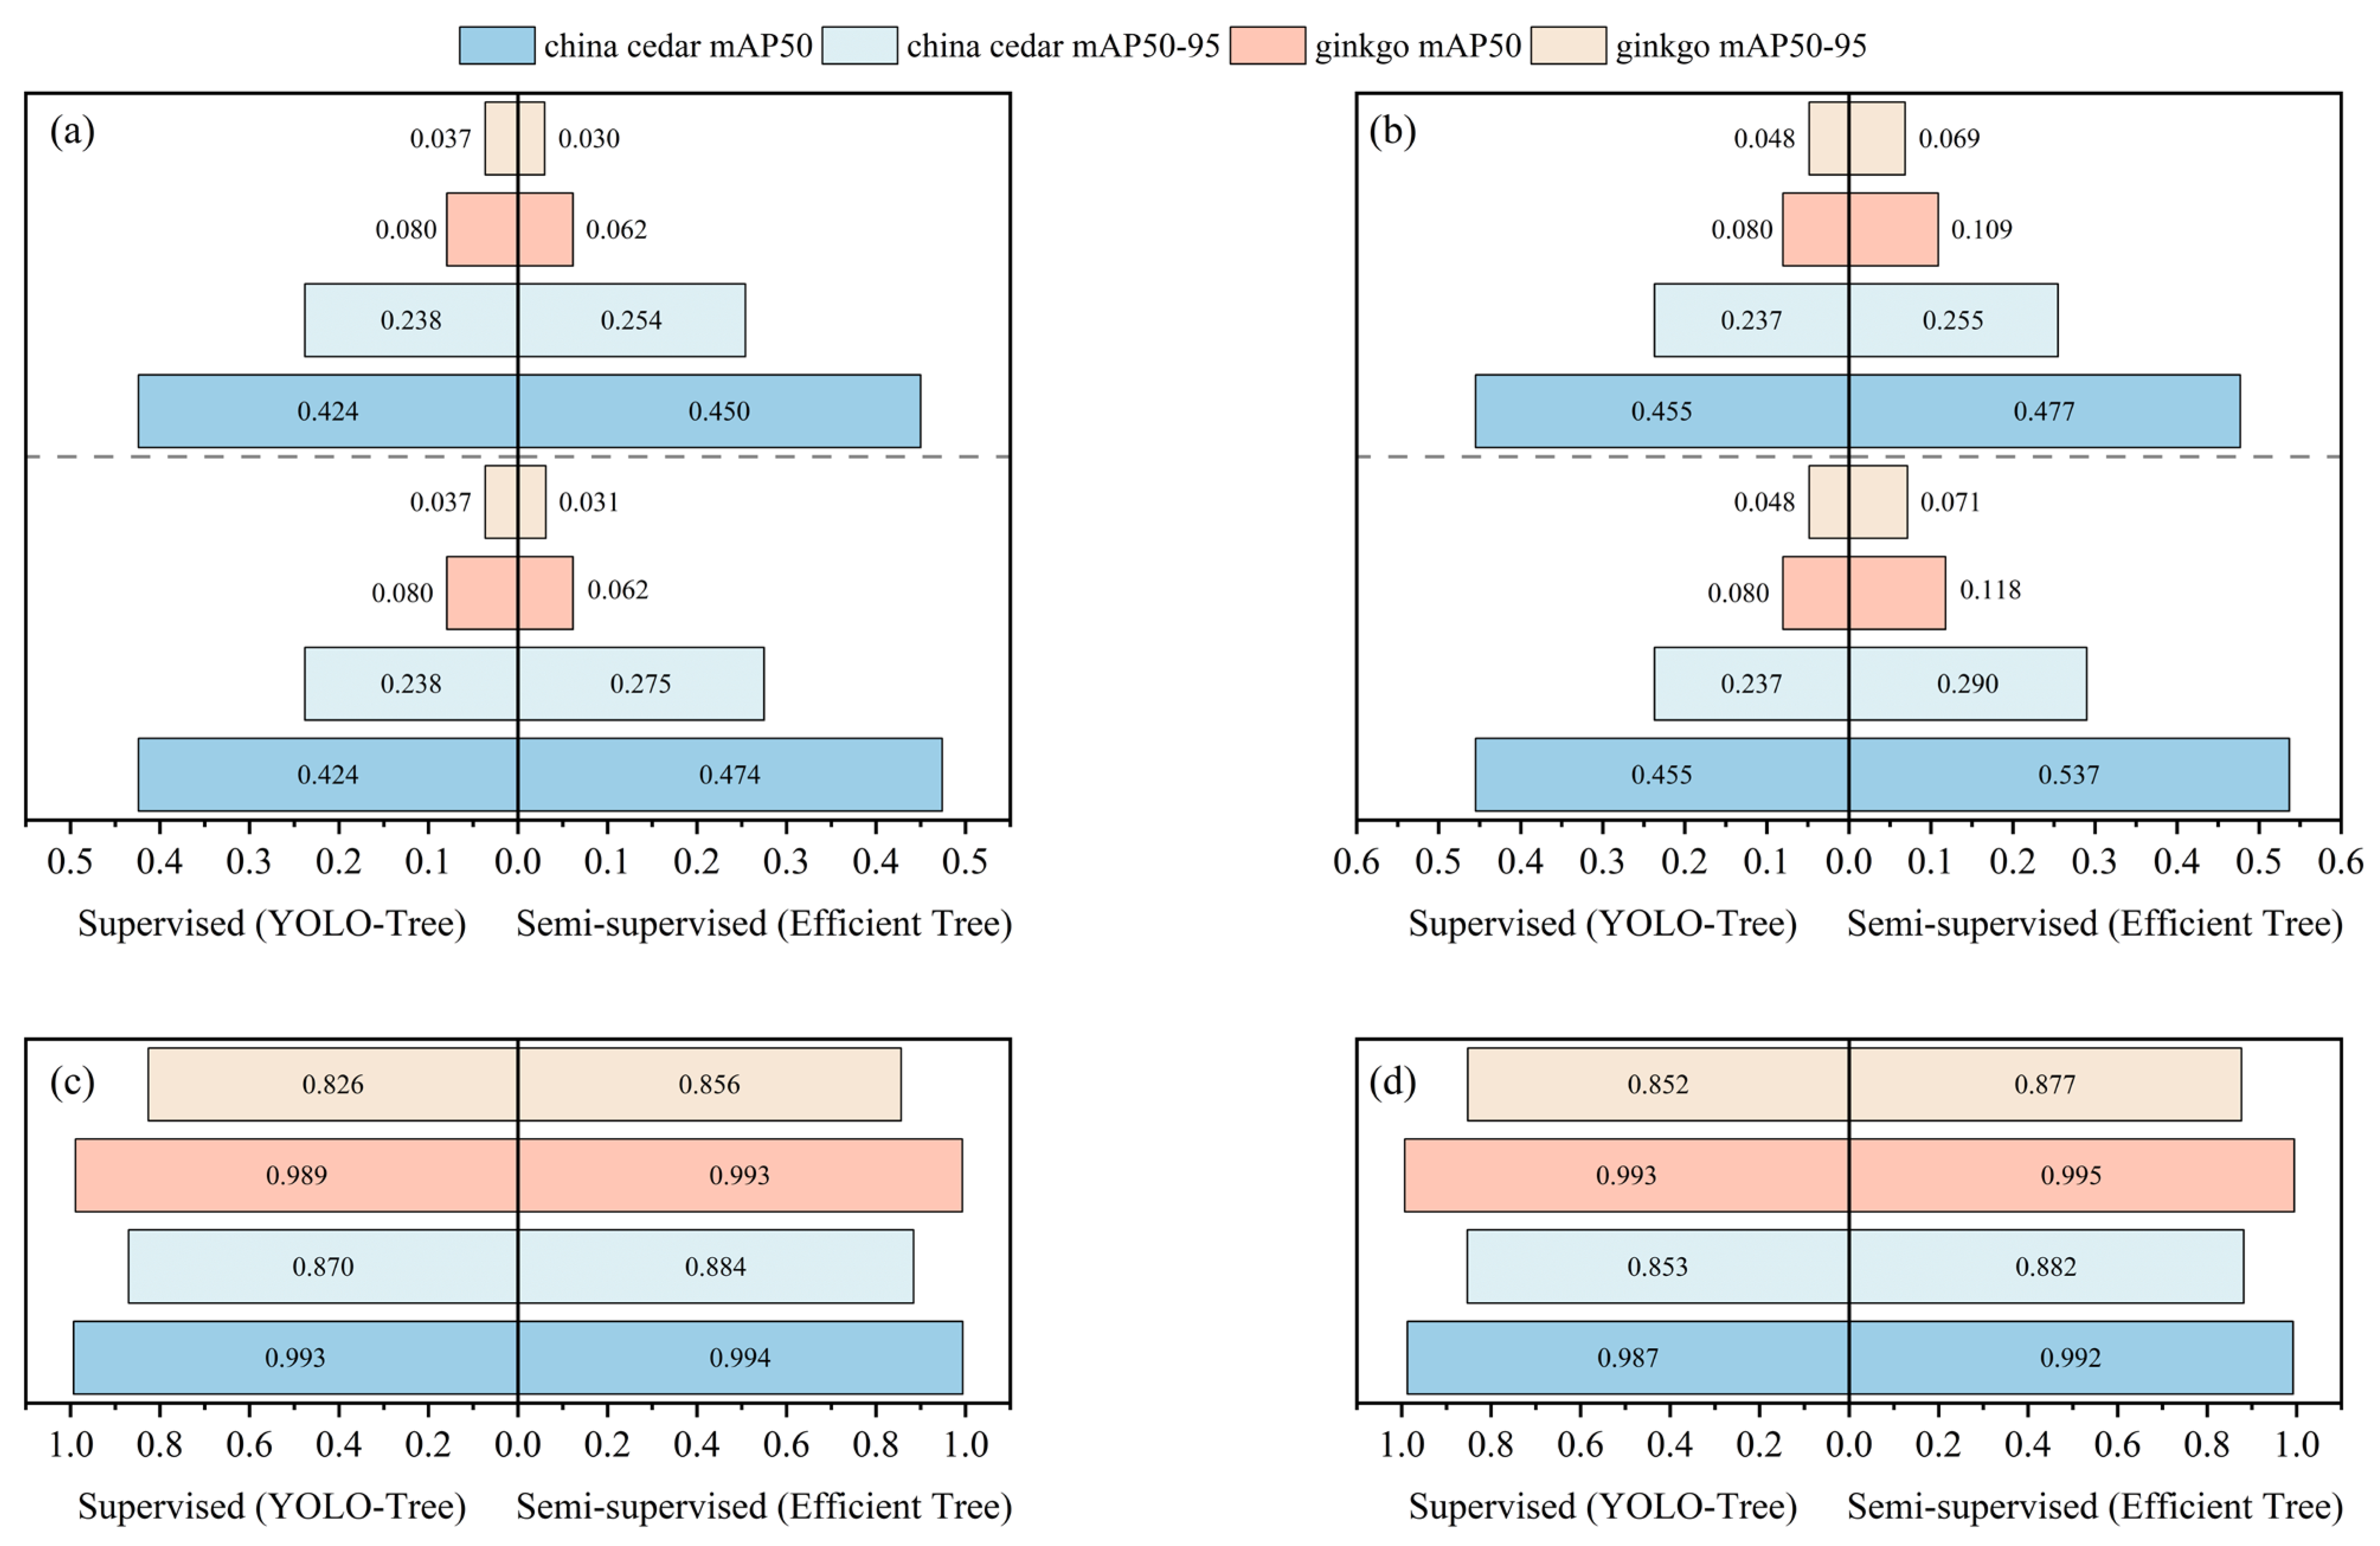
3.3. Performance Comparison Between ET and YOLO-Tree on Datasets with Varying Annotation Proportions

In this study, varying proportions of labeled data from the original Ancient Hall or Chan-yuan Temple datasets were randomly sampled, while the remaining data were considered unlabeled to generate datasets with different annotation ratios. The effectiveness of SSL was assessed by comparing the performance of supervised and semi-supervised methods under varying proportions of annotations. In addition to the artificially partitioned small-scale datasets, ET and YOLO-Tree were also evaluated on the complete labeled datasets (Figure 8). Specifically, YOLO-Tree was trained solely on data from a single site (either Ancient Hall or Chan-yuan Temple). Efficient tree utilized the same single-site dataset in the burn-in phase. Additionally, it introduced data from other sites as unlabeled data for joint training in the SSL phase. The results showed that the F1, mAP50, and mAP50-95 metrics for both YOLO-Tree and ET progressively rose with the increasing amount of labeled data. Efficient tree exhibited the most notable gains in mAP50-95 compared to the other two metrics. With only 10% of the labeled data available, ET achieved maximum mAP50-95 improvements of 6.9% and 9.4%, respectively (Figure 8a,c).
Surprisingly, the within-site detection accuracy and cross-site transferability of single-site models were also enhanced by introducing unlabeled data from external sites. Due to the comparable data scale across the different sites (approximately 1:1:1), the within-site accuracy gains were limited. It was noteworthy that SSL significantly improved the model’s generalization ability for China cedar (Figure 9a,b), particularly with the inclusion of the San-li Pavilion data, leading to average increases of 6.6% in mAP50 and 4.5% in mAP50-95. In contrast, the detection performance of ginkgo was not similarly boosted. It was surmised that ginkgo trees were scarce in the San-li Pavilion region, which made it difficult for the model to learn comprehensive features for this species. Additionally, SSL was found to effectively improve the cross-site transferability of universal models trained on data from all sites (Figure 9c,d). The consistent results were obtained when compared to YOLO-World with zero-shot learning capabilities (Table S4).

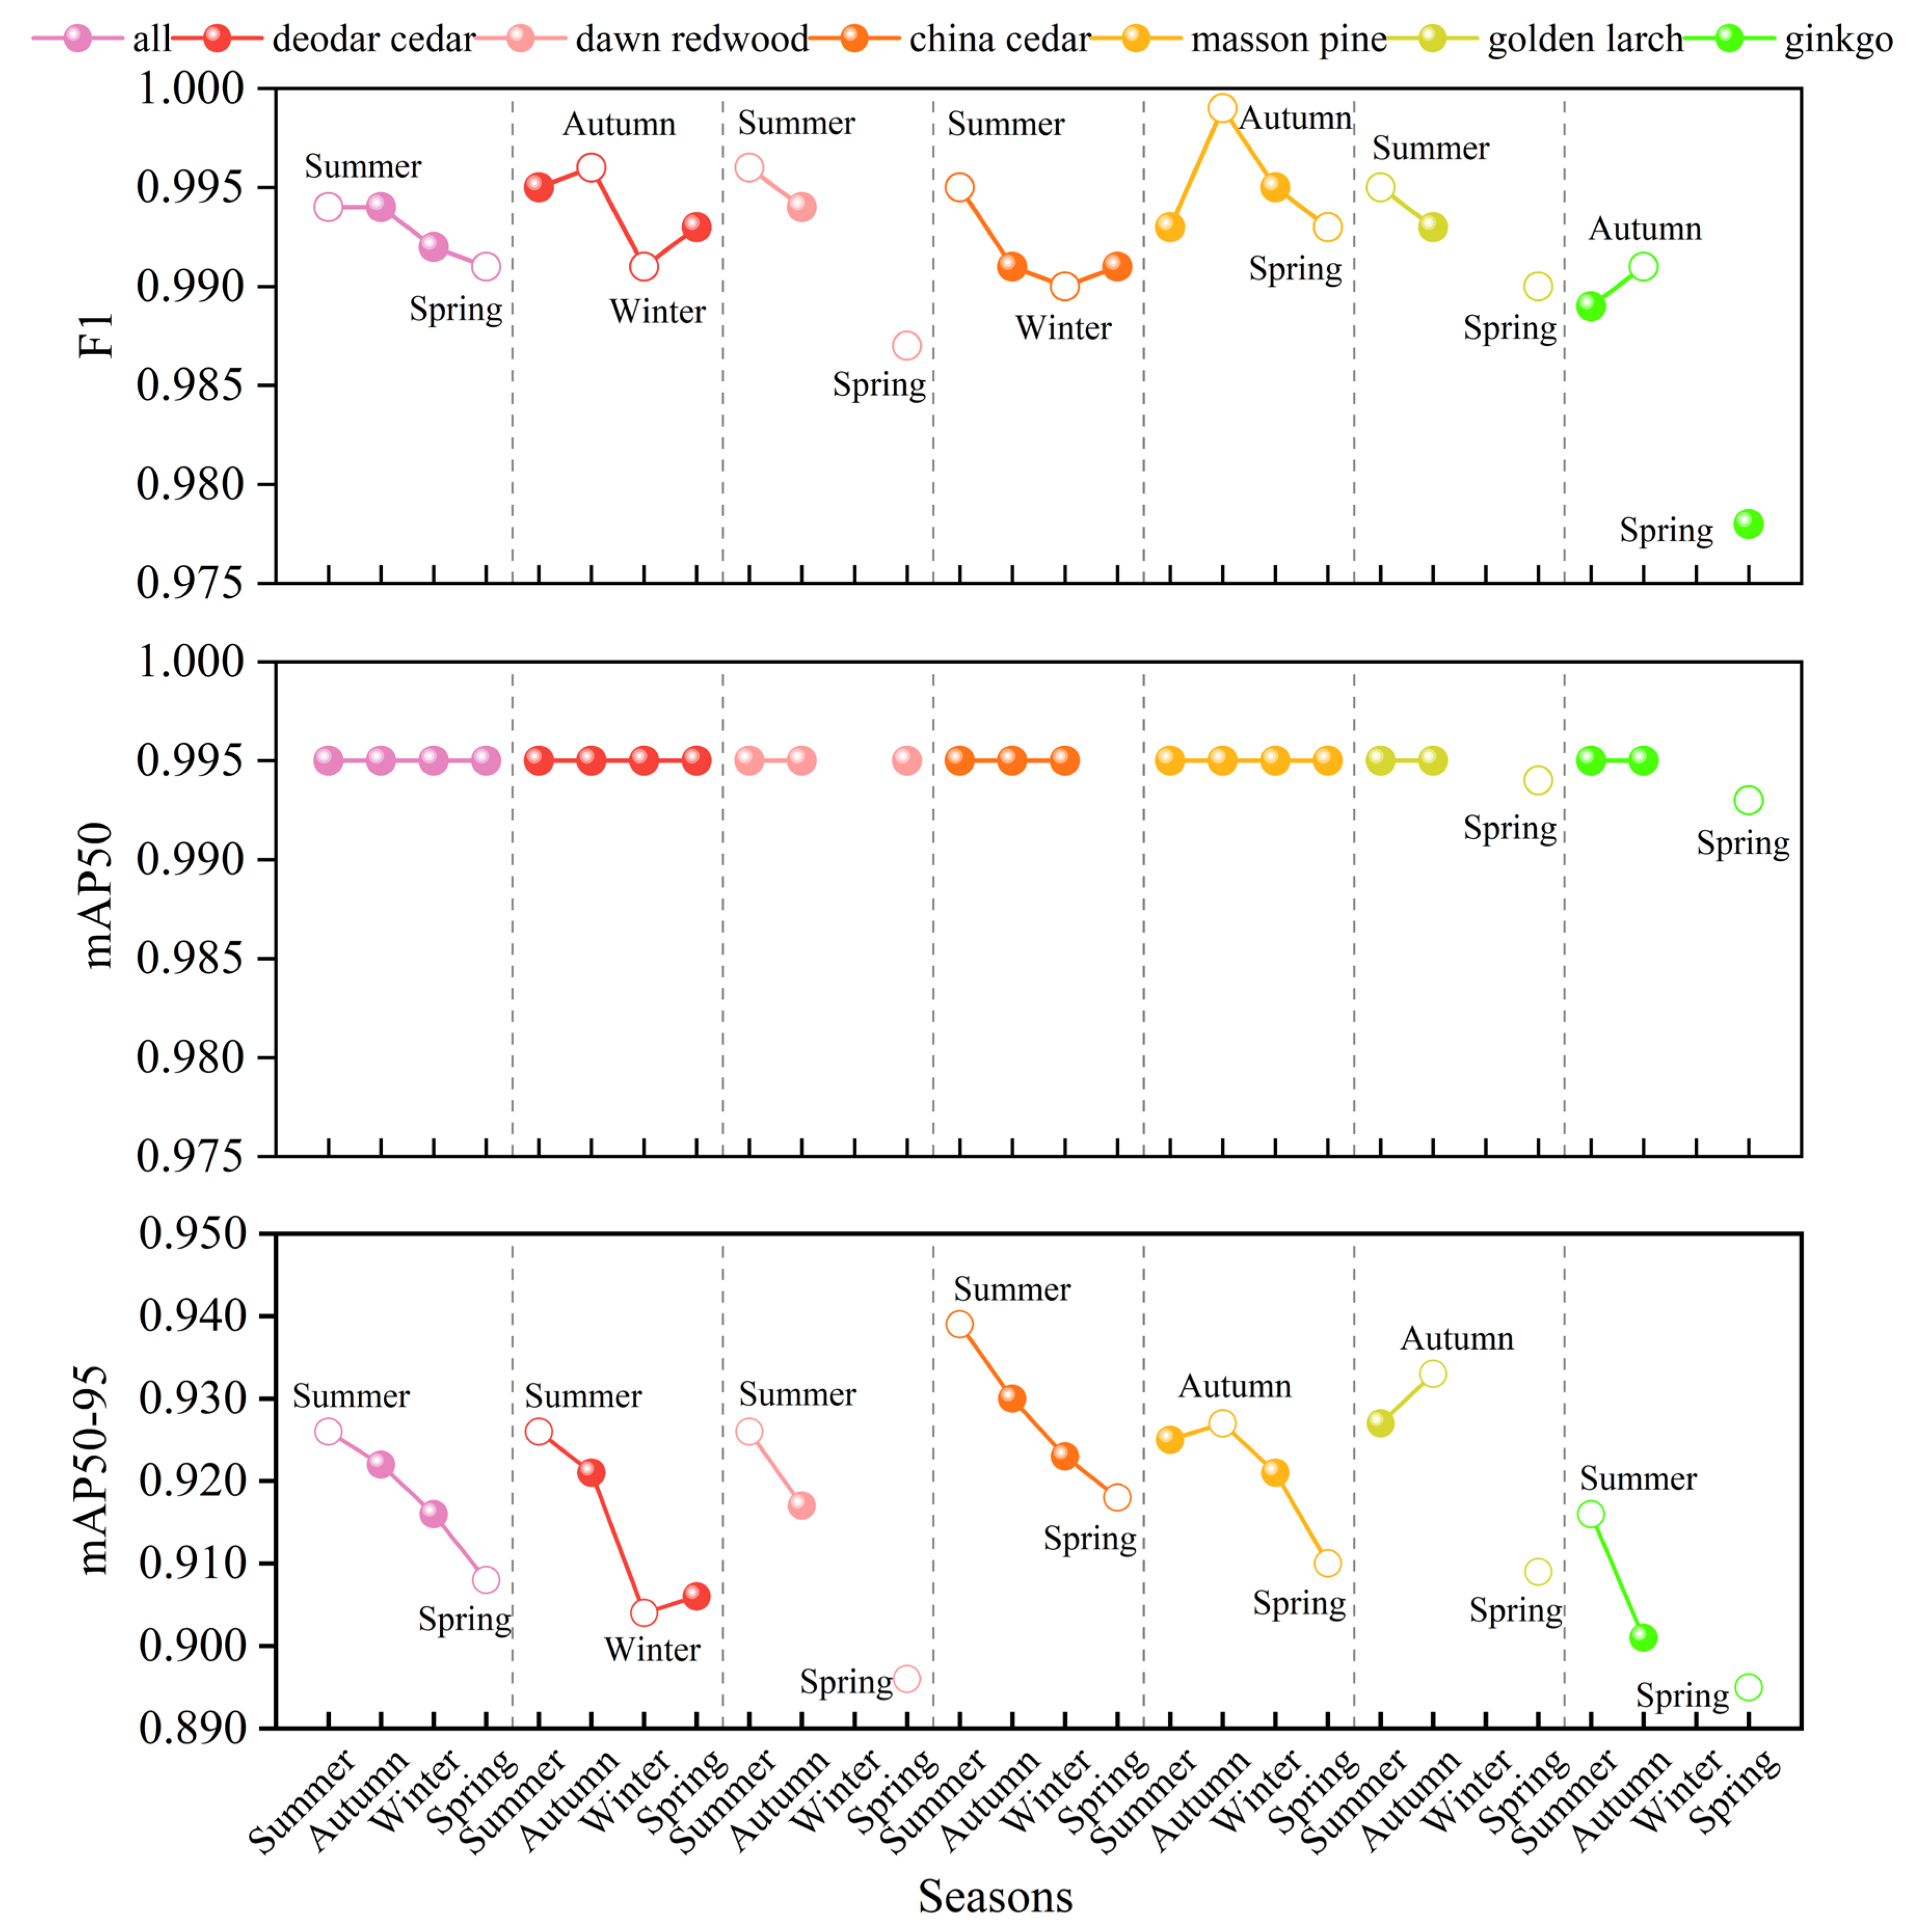
3.4. Influence of Phenology on Tree Species Identification

The detection performance of the best-performing semi-supervised model (trained on all-site data) was evaluated on imagery from different months to investigate the optimal season for tree species identification. The cross-seasonal identification performance of ET on six tree species is illustrated in Figure 10. The mAP50 metric consistently maintained a value above 0.99 across all months. In contrast, other metrics exhibited minor seasonal fluctuations. The mAP50-95 metric was most sensitive to seasonal variation, suggesting that the model’s ability to locate tree crowns precisely was significantly affected by the season. Combined with Figure S1, it can be seen that the model achieved higher localization accuracy during summer (June, July, and August) and autumn (November), when the tree crown morphologies were stable and the boundaries were clear. During spring and winter, leaf phenological processes, such as budding, growth, and shedding, markedly alter the external morphology and color characteristics of trees. Also, the canopy boundaries became indistinct. These changes posed significant challenges for model identification and localization.

4. Discussion

4.1. Impact of Spatial Resolution and Overlap Ratio on the Detection Accuracy of YOLO-Tree

The findings of this study indicate that adjusting the flight altitude to yield a coarser spatial resolution can lead to better performance when utilizing high-resolution UAV-based RGB imagery (with a spatial resolution finer than 5 cm) for tree species detection. The improvement was due to the broader geographical coverage provided by coarser imagery, which facilitates the capture of more-intact and less-fragmented tree crowns. The results are consistent with those reported by Zhong et al. [32] and Ullah et al. [33], which indicate that images with a 5 cm resolution are sufficient to characterize tree canopy structure. The resolution of 5 cm strikes a balance between accuracy and operational efficiency, making it suitable for tree mapping over extensive areas. The optimal flight height or spatial resolution appears to be influenced by the canopy size of the target tree species, with finer resolution benefiting smaller-crowned species and coarser resolution preferring larger-crowned species [34]. Separately, increasing the overlap ratio helped enlarge the dataset sizes, which in turn, led to significant improvements in model accuracy, suggesting that the overlapping cropping strategy is an effective method for augmenting UAV imagery data.

4.2. Impact of Site Conditions on the Generalization Capability of YOLO-Tree

The t-SNE visualizations of deep semantic features extracted from China cedar and ginkgo crowns (Figure S2) revealed that the heterogeneity of elevations and habitats resulted in intra-class variation for the same species. Under non-overlapping cropping, a wider distribution of China cedar was observed in the Ancient Hall region, whereas ginkgo from the Chan-yuan Temple area displayed greater intraspecific variation. These findings were consistent with the field observations. In the Ancient Hall region, China cedars exhibited apparent visual discrepancies in the color and size of their crowns, while the Chan-yuan Temple region included more cultivated ginkgo seedlings that were distinct from the taller, wild individuals. Consequently, it was surmised that the detection accuracy and cross-site transferability of single-site models were affected by the intrinsic data heterogeneity caused by the sites. Specifically, single-site models trained on more heterogeneous data generally achieved superior cross-site generalization but often resulted in lower within-site detection accuracy. However, the site-induced performance gap could be reduced by increasing the overlap ratio, as the data distribution differences (especially for dominant tree species) gradually diminished with an increasing overlap ratio. Even so, single-site models showed unacceptable declines in cross-site detection accuracy, with non-dominant species being nearly undetectable. It was clear that the universal model, built on data from all sites, attained high detection accuracy for each site (Figure 7c,d). Therefore, it is essential to train universal models using heterogeneous data that encompasses diverse forest structures and site conditions [35]. The universal models are capable of capturing more generalized features independent of geographic or ecological factors, thus showing robust in-distribution and out-of-distribution generalization.

4.3. The Effectiveness of Semi-Supervised Learning (SSL)

The performance of SSL was found to decline relative to fully supervised learning when the proportion of labeled data exceeded 50% (Figure S3). This result corroborates those of Yang et al. [36]. In particular, the mAP50-95 metric showed the most significant decrease, dropping by 7.4% at a labeled proportion of 80%. Consequently, a crucial point to highlight is that SSL requires abundant unlabeled data to enhance the model’s feature-learning capability. A small amount of unlabeled data may not accurately reflect the true data distribution, leading the model to generate low-quality pseudo-labels during the initial semi-supervised phase and thereby adversely affecting subsequent training.
Furthermore, ET tended to yield weak initial accuracy in the supervised phase when training with small datasets. The insufficient initial performance compromised the reliability of the pseudo-labels generated during the semi-supervised stage and consequently affected the model’s stable convergence and overall performance. For instance, ET exhibited relatively poorer F1 and mAP50 metrics when trained with 30% or 40% non-overlapping labeled data from the Ancient Hall site. This issue was effectively alleviated by increasing the amount of annotated data through the application of the overlapping cropping strategy. As illustrated in Figure 8b,d, ET exhibited substantial improvements across all evaluation metrics when the overlap ratio was 50%. Yet, the performance gains provided by SSL generally declined with further increases in the proportion of labeled data. For example, on the Chan-yuan Temple dataset, increasing the labeled data proportion from 10% to 50% resulted in a decrease in improvements in F1, mAP50, and mAP50-95 from 4.7%, 5.3%, and 8.3% to 0.5%, 0.6%, and 3.5%, respectively. Hence, proper configurations of the proportion and quantity of labeled data are crucial for maximizing the benefits of SSL, requiring a balance between ensuring sufficient initial accuracy for the supervised-learning phase and enhancing the performance gains from the semi-supervised phase.

4.4. The Optimal Seasons for Tree Species Identification

In this study, the overall performance tended to be optimal in late summer (July and August) and minimal in early spring (March and April). The most suitable periods for tree species identification were observed during the vigorous growth phase (summer) and the senescence phase (autumn). The results differed slightly from those of Liang et al. [37]. They found that phenological changes in early autumn and late spring facilitated tree species identification in temperate forests, while the identification accuracy during the peak autumn coloration was lowest. This discrepancy could be attributed to differences in species composition. In their study, the study area was characterized by the presence of seven deciduous broadleaf species and six conifer species. Although the autumn color transition helped distinguish deciduous from evergreen trees, a high degree of interspecific similarity was observed among deciduous broadleaf species during the autumn peak. In contrast, the spring leaf phenology exhibited more uniform color responses than autumn. Conifer species dominate our study area. Species such as China cedar, deodar cedar, dawn redwood, and masson pine maintained relatively constant morphology and color in summer, and these homogeneous characteristics made them easily recognized by the model. For golden larch and ginkgo, the unique color changes in autumn helped improve the identification effectiveness. These results suggested that the identification performances of different tree species may be influenced by their specific phenological response patterns, with stable or unique traits being crucial for improving model accuracy [38,39]. The detection results for the two areas in April, August, and November are presented in Figure S4 to intuitively visualize the dynamic differences in the effectiveness of tree species identification with phenological changes.

5. Conclusions

Given the challenges of diverse data and limited annotations in forest monitoring, innovative SSL-based methods for identifying tree species across different forest ecosystems have been explored. The effectiveness of SSL was validated through performance comparisons between ET and YOLO-Tree across datasets with varying annotation proportions. Notably, significant performance gains were observed under low-annotation conditions (below 50%), underscoring the utility of SSL in scenarios with sparse labeled data. With only 10% of the labeled data available, maximum mAP50-95 improvements of 6.9% and 9.4% were achieved. Moreover, incorporating unlabeled data from cross-site domains enhanced generalization performance, with the best-case scores reaching F1: 0.979, mAP50: 0.992, and mAP50-95: 0.871. The application of an overlapping cropping strategy helped in increasing the scale of the labeled data, facilitating stable semi-supervised training under conditions of small sample sizes. These findings reinforced the need to leverage abundant unlabeled data to enhance model robustness. Altogether, the identification of tree species across different months indicated that summer and autumn are typically optimal seasons for recognition. However, performance varied among species due to their unique phenological response patterns. Specifically, the summer season facilitated the identification of tree species that exhibited stable coloration and morphology, whereas the autumn season was suitable for discriminating among species with distinct color changes. This study highlights the significant potential of SSL for forest dynamic monitoring, with generated spatial distribution maps of tree species contributing to a comprehensive understanding of the forest structure and phenological changes.

Supplementary Materials

The following supporting information can be downloaded at https://www.mdpi.com/article/10.3390/rs17152541/s1, Table S1: The GSD of the aerial imagery collected in each flight mission; Table S2: The annotations count for each tree species; Table S3: The performance of YOLO-Tree across datasets encompassing diverse sites, overlap ratios, and flight altitudes (China Cedar and Ginkgo only); Table S4: Performance comparison of Efficient Tree with YOLO-World on three datasets; Figure S1: The canopy images of dominant tree species in the study area during different phenological periods (at a altitude of 100 m): (a) Chan-yuan Temple; (b) Ancient Hall; Figure S2: Comparison of t-SNE visualizations for two tree species at various overlap ratios (left column for China Cedar, right column for Ginkgo); Figure S3: Performance comparison of Efficient Tree and YOLO-Tree under varying annotation proportions (exemplified by the Ancient Hall dataset); Figure S4: The detection results of six tree species at different phenological periods: (a) Chan-yuan Temple; (b) Ancient Hall.

Author Contributions

B.H.: Investigation, Methodology, Visualization, Writing—original draft. C.L.: Investigation, Writing—review and editing. M.C.: Data curation, Investigation, Validation. Y.Z.: Project administration, Writing—review and editing. M.M.G.: Project administration, Validation, Writing—review and editing. Y.C.: Supervision. F.L.: Project administration, Writing—review and editing. X.F.: Funding acquisition, Project administration, Writing—review and editing. All authors have read and agreed to the published version of the manuscript.

Funding

This research was supported by the Key Technology Research and Development Program of Zhejiang Province (No. 2023C03138).

Data Availability Statement

The raw data supporting the conclusions of this article will be made available by the authors on request.

Conflicts of Interest

Author Yuefeng Chen was employed by the company Zhejiang Branch of Chinese Academy of Agricultural Mechanization Sciences Group Co., Ltd. The remaining authors declare that the research was conducted in the absence of any commercial or financial relationships that could be construed as a potential conflict of interest.

References

  1. Yan, G.; Bongers, F.J.; Trogisch, S.; Li, Y.; Chen, G.; Yan, H.; Deng, X.; Ma, K.; Liu, X. Climate and mycorrhizae mediate the relationship of tree species diversity and carbon stocks in subtropical forests. J. Ecol. 2022, 110, 2462–2474. [Google Scholar] [CrossRef]
  2. Ouaknine, A.; Kattenborn, T.; Laliberté, E.; Rolnick, D. OpenForest: A data catalog for machine learning in forest monitoring. Environ. Data Sci. 2025, 4, e15. [Google Scholar] [CrossRef]
  3. Sun, Z.; Wang, X.; Wang, Z.; Yang, L.; Xie, Y.; Huang, Y. UAVs as remote sensing platforms in plant ecology: Review of applications and challenges. J. Plant Ecol. 2021, 14, 1003–1023. [Google Scholar] [CrossRef]
  4. Chen, J.; Liang, X.; Liu, Z.; Gong, W.; Chen, Y.; Hyyppä, J.; Kukko, A.; Wang, Y. Tree species recognition from close-range sensing: A review. Remote Sens. Environ. 2024, 313, 114337. [Google Scholar] [CrossRef]
  5. Onishi, M.; Ise, T. Explainable identification and mapping of trees using UAV RGB image and deep learning. Sci. Rep. 2021, 11, 903. [Google Scholar] [CrossRef] [PubMed]
  6. Xu, L.; Lu, C.; Zhou, T.; Wu, J.; Feng, H. A 3D-2DCNN-CA approach for enhanced classification of hickory tree species using UAV-based hyperspectral imaging. Microchem. J. 2024, 199, 109981. [Google Scholar] [CrossRef]
  7. Xie, Y.; Wang, Y.; Sun, Z.; Liang, R.; Ding, Z.; Wang, B.; Huang, S.; Sun, Y. Instance segmentation and stand-scale forest mapping based on UAV images derived RGB and CHM. Comput. Electron. Agric. 2024, 220, 108878. [Google Scholar] [CrossRef]
  8. Shi, W.; Liao, X.; Wang, S.; Ye, H.; Wang, D.; Yue, H.; Liu, J. Evaluation of a CNN model to map vegetation classification in a subalpine coniferous forest using UAV imagery. Ecol. Inform. 2025, 87, 103111. [Google Scholar] [CrossRef]
  9. Schiefer, F.; Kattenborn, T.; Frick, A.; Frey, J.; Schall, P.; Koch, B.; Schmidtlein, S. Mapping forest tree species in high resolution UAV-based RGB-imagery by means of convolutional neural networks. ISPRS J. Photogramm. Remote Sens. 2020, 170, 205–215. [Google Scholar] [CrossRef]
  10. Kattenborn, T.; Eichel, J.; Wiser, S.; Burrows, L.; Fassnacht, F.E.; Schmidtlein, S. Convolutional Neural Networks accurately predict cover fractions of plant species and communities in Unmanned Aerial Vehicle imagery. Remote Sens. Ecol. Conserv. 2020, 6, 472–486. [Google Scholar] [CrossRef]
  11. Beloiu, M.; Heinzmann, L.; Rehush, N.; Gessler, A.; Griess, V.C. Individual Tree-Crown Detection and Species Identification in Heterogeneous Forests Using Aerial RGB Imagery and Deep Learning. Remote Sens. 2023, 15, 1463. [Google Scholar] [CrossRef]
  12. Yun, T.; Li, J.; Ma, L.; Zhou, J.; Wang, R.; Eichhorn, M.P.; Zhang, H. Status, advancements and prospects of deep learning methods applied in forest studies. Int. J. Appl. Earth Obs. Geoinf. 2024, 131, 103938. [Google Scholar] [CrossRef]
  13. Hamedianfar, A.; Mohamedou, C.; Kangas, A.; Vauhkonen, J. Deep learning for forest inventory and planning: A critical review on the remote sensing approaches so far and prospects for further applications. Forestry 2022, 95, 451–465. [Google Scholar] [CrossRef]
  14. Lu, Y.; Huang, Y.; Sun, S.; Zhang, T.; Zhang, X.; Fei, S.; Chen, V. M2fNet: Multi-Modal Forest Monitoring Network on Large-Scale Virtual Dataset. In Proceedings of the 2024 IEEE Conference on Virtual Reality and 3D User Interfaces Abstracts and Workshops (VRW), Orlando, FL, USA, 16–21 March 2024; pp. 539–543. [Google Scholar] [CrossRef]
  15. Xu, W.; Cheng, Y.; Luo, M.; Mai, X.; Wang, W.; Zhang, W.; Wang, Y. Progress and Limitations in Forest Carbon Stock Estimation Using Remote Sensing Technologies: A Comprehensive Review. Forests 2025, 16, 449. [Google Scholar] [CrossRef]
  16. Fromm, M.; Schubert, M.; Castilla, G.; Linke, J.; McDermid, G. Automated Detection of Conifer Seedlings in Drone Imagery Using Convolutional Neural Networks. Remote Sens. 2019, 11, 2585. [Google Scholar] [CrossRef]
  17. Soltani, S.; Feilhauer, H.; Duker, R.; Kattenborn, T. Transfer learning from citizen science photographs enables plant species identification in UAV imagery. ISPRS Open J. Photogramm. Remote Sens. 2022, 5, 100016. [Google Scholar] [CrossRef]
  18. Chadwick, A.J.; Coops, N.C.; Bater, C.W.; Martens, L.A.; White, B. Transferability of a Mask R–CNN model for the delineation and classification of two species of regenerating tree crowns to untrained sites. Sci. Remote Sens. 2024, 9, 100109. [Google Scholar] [CrossRef]
  19. Hosseiny, B.; Mahdianpari, M.; Hemati, M.; Radman, A.; Mohammadimanesh, F.; Chanussot, J. Beyond Supervised Learning in Remote Sensing: A Systematic Review of Deep Learning Approaches. IEEE J. Sel. Top. Appl. Earth Obs. Remote Sens. 2024, 17, 1035–1052. [Google Scholar] [CrossRef]
  20. Chen, J.; Chen, G.; Zhang, L.; Huang, M.; Luo, J.; Ding, M.; Ge, Y. Category-sensitive semi-supervised semantic segmentation framework for land-use/land-cover mapping with optical remote sensing images. Int. J. Appl. Earth Obs. Geoinf. 2024, 134, 104160. [Google Scholar] [CrossRef]
  21. Huang, W.; Shi, Y.; Xiong, Z.; Zhu, X.X. Decouple and weight semi-supervised semantic segmentation of remote sensing images. ISPRS J. Photogramm. Remote Sens. 2024, 212, 13–26. [Google Scholar] [CrossRef]
  22. Lv, L.; Zhang, L. Advancing Data-Efficient Exploitation for Semi-Supervised Remote Sensing Images Semantic Segmentation. IEEE Trans. Geosci. Remote Sens. 2024, 62, 1–13. [Google Scholar] [CrossRef]
  23. Liu, N.; Xu, X.; Gao, Y.; Zhao, Y.; Li, H.-C. Semi-supervised object detection with uncurated unlabeled data for remote sensing images. Int. J. Appl. Earth Obs. Geoinf. 2024, 129, 103814. [Google Scholar] [CrossRef]
  24. Fang, Z.; Ren, J.; Zheng, J.; Chen, R.; Zhao, H. Dual Teacher: Improving the Reliability of Pseudo Labels for Semi-Supervised Oriented Object Detection. IEEE Trans. Geosci. Remote Sens. 2025, 63, 1–15. [Google Scholar] [CrossRef]
  25. Luo, J.; Fan, J.; Huang, S.; Wu, S.; Zhang, F.; Li, X. Semi-supervised learning techniques for detection of dead pine trees with UAV imagery for pine wilt disease control. Int. J. Remote Sens. 2025, 46, 575–605. [Google Scholar] [CrossRef]
  26. Xu, B.; Chen, M.; Guan, W.; Hu, L. Efficient Teacher: Semi-Supervised Object Detection for YOLOv5. arXiv 2023. [Google Scholar] [CrossRef]
  27. Zhang, L.; Lin, H.; Wang, F. Individual Tree Detection Based on High-Resolution RGB Images for Urban Forestry Applications. IEEE Access 2022, 10, 46589–46598. [Google Scholar] [CrossRef]
  28. Amirkolaee, H.A.; Shi, M.; Mulligan, M. TreeFormer: A Semi-Supervised Transformer-Based Framework for Tree Counting From a Single High-Resolution Image. IEEE Trans. Geosci. Remote Sens. 2023, 61, 1–15. [Google Scholar] [CrossRef]
  29. Cao, F.; Yan, K.; Chen, H.; Wang, Z.; Du, Y.; Zheng, Z.; Li, K.; Qi, B.; Wang, M. SSCD-YOLO: Semi-Supervised Cross-Domain YOLOv8 for Pedestrian Detection in Low-Light Conditions. IEEE Access 2025, 13, 61225–61236. [Google Scholar] [CrossRef]
  30. Dai, Y.; Gieseke, F.; Oehmcke, S.; Wu, Y.; Barnard, K. Attentional Feature Fusion. In Proceedings of the 2021 IEEE Winter Conference on Applications of Computer Vision (WACV), Waikoloa, HI, USA, 3–8 January 2021; pp. 3559–3568. [Google Scholar] [CrossRef]
  31. Selvaraju, R.R.; Cogswell, M.; Das, A.; Vedantam, R.; Parikh, D.; Batra, D. Grad-CAM: Visual Explanations from Deep Networks via Gradient-Based Localization. In Proceedings of the 2017 IEEE International Conference on Computer Vision (ICCV), Venice, Italy, 22–29 October 2017; pp. 618–626. [Google Scholar] [CrossRef]
  32. Zhong, H.; Zhang, Z.; Liu, H.; Wu, J.; Lin, W. Individual Tree Species Identification for Complex Coniferous and Broad-Leaved Mixed Forests Based on Deep Learning Combined with UAV LiDAR Data and RGB Images. Forests 2024, 15, 293. [Google Scholar] [CrossRef]
  33. Ullah, S.; Ilniyaz, O.; Eziz, A.; Ullah, S.; Fidelis, G.D.; Kiran, M.; Azadi, H.; Ahmed, T.; Elfleet, M.S.; Kurban, A. Multi-Temporal and Multi-Resolution RGB UAV Surveys for Cost-Efficient Tree Species Mapping in an Afforestation Project. Remote Sens. 2025, 17, 949. [Google Scholar] [CrossRef]
  34. Miraki, M.; Sohrabi, H.; Fatehi, P.; Kneubuehler, M. Individual tree crown delineation from high-resolution UAV images in broadleaf forest. Ecol. Inform. 2021, 61, 101207. [Google Scholar] [CrossRef]
  35. Weinstein, B.G.; Marconi, S.; Bohlman, S.A.; Zare, A.; White, E.P. Cross-site learning in deep learning RGB tree crown detection. Ecol. Inform. 2020, 56, 101061. [Google Scholar] [CrossRef]
  36. Yang, R.; Chen, M.; Lu, X.; He, Y.; Li, Y.; Xu, M.; Li, M.; Huang, W.; Liu, F. Integrating UAV remote sensing and semi-supervised learning for early-stage maize seedling monitoring and geolocation. Plant Phenomics 2025, 7, 100011. [Google Scholar] [CrossRef]
  37. Liang, X.; Chen, J.; Gong, W.; Puttonen, E.; Wang, Y. Influence of data and methods on high-resolution imagery-based tree species recognition considering phenology: The case of temperate forests. Remote Sens. Environ. 2025, 323, 114654. [Google Scholar] [CrossRef]
  38. Liu, Y.; Zhang, R.; Lin, C.-F.; Zhang, Z.; Zhang, R.; Shang, K.; Zhao, M.; Huang, J.; Wang, X.; Li, Y.; et al. Remote sensing of subtropical tree diversity: The underappreciated roles of the practical definition of forest canopy and phenological variation. For. Ecosyst. 2023, 10, 100122. [Google Scholar] [CrossRef]
  39. Jiang, M.; Kong, J.; Zhang, Z.; Hu, J.; Qin, Y.; Shang, K.; Zhao, M.; Zhang, J. Seeing Trees from Drones: The Role of Leaf Phenology Transition in Mapping Species Distribution in Species-Rich Montane Forests. Forests 2023, 14, 908. [Google Scholar] [CrossRef]
Figure 1. The study area that was located in the Tian-mu Mountain Nature Reserve: (a) Chan-yuan Temple; (b) San-li Pavilion; (c) Ancient Hall.
Remotesensing 17 02541 g001
Figure 2. The overall workflow of data acquisition and processing.
Remotesensing 17 02541 g002
Figure 3. The overall framework of efficient tree (dashed lines for the supervised phase, solid lines for the semi-supervised phase).
Remotesensing 17 02541 g003
Figure 4. The architecture of the proposed YOLO-Tree.
Remotesensing 17 02541 g004
Figure 5. The detection results of YOLO-Tree and other mainstream YOLO models in complex forest scenarios (white dashed boxes indicate missed detections, while blue dashed boxes denote false detections): (a,b) irregular terrain; (c,d) dense and overlapped canopies; (e) cluttered canopies; (f,g) mixed vegetation.
Remotesensing 17 02541 g005
Figure 6. Comparison of model heatmaps before and after the inclusion of MSAM and CAM (both choose the last layer of the neck as the target layer): (a) original image; (b) without inclusion; (c) with inclusion.
Remotesensing 17 02541 g006
Figure 7. Cross-site detection performance of single-site and all-site models: (a) Ancient Hall site models for predicting Chan-yuan Temple site; (b) Chan-yuan Temple site models for predicting Ancient Hall site; (c) all-site models for predicting Chan-yuan Temple site; (d) all-site models for predicting Ancient Hall site.
Remotesensing 17 02541 g007
Figure 8. Performance comparison of ET and YOLO-Tree on datasets with varying annotation proportions (data points denoted by ‘#’ indicate the results of semi-supervised training using data from San-li Pavilion site): (a) Ancient Hall dataset (no overlap); (b) Ancient Hall dataset (50% overlap); (c) Chan-yuan Temple dataset (no overlap); (d) Chan-yuan Temple dataset (50% overlap).
Remotesensing 17 02541 g008
Figure 9. Cross-site detection performance of ET and YOLO-Tree (with an overlap ratio of 50%): (a) Ancient Hall site models for predicting Chan-yuan Temple site, unlabeled data from Chan-yuan Temple (top) and San-li Pavilion (bottom); (b) Chan-yuan Temple site models for predicting Ancient Hall site, unlabeled data from Ancient Hall (top) and San-li Pavilion (bottom); (c) all-site models for predicting Chan-yuan Temple site, unlabeled data from San-li Pavilion; (d) all-site models for predicting Ancient Hall site, unlabeled data from San-li Pavilion.
Remotesensing 17 02541 g009
Figure 10. The cross-seasonal identification performance of ET on six tree species (‘all’ means the average performance for all tree species).
Remotesensing 17 02541 g010
Table 1. Performance comparison of YOLO-Tree with four single-stage object detection models on three datasets.
DatasetsModelMetrics
PRF1mAP50mAP50-95Params (M)FPS
Ancient HallRetinaNet0.5660.7490.6450.7900.52437.7450.3
YOLOv50.8850.7970.8390.8830.6037.03256.4
YOLOv80.9250.7720.8420.8740.6469.84312.5
YOLOv110.9030.8290.8640.9030.6809.43238.1
Our0.9340.8520.8910.9300.68426.11172.4
Chan-yuan TempleRetinaNet0.6510.8390.7330.8680.57637.7450.3
YOLOv50.9210.8550.8870.9250.6247.03256.4
YOLOv80.9330.9040.9180.9520.6989.84312.5
YOLOv110.9020.9130.9070.9480.6979.43238.1
Our0.9370.8910.9130.9390.66526.11172.4
AllRetinaNet0.6010.8050.6880.8400.55137.7450.3
YOLOv50.8830.8550.8690.9120.6247.03256.4
YOLOv80.8870.8510.8690.9200.6749.84312.5
YOLOv110.8980.8690.8830.9280.6819.43238.1
Our0.9100.8750.8920.9270.65926.11172.4
Note: The best results were highlighted in bold. The implementations of YOLOv5, YOLOv8, and YOLOv11 in this work were based on their respective lightweight “s” (small) variants.
Table 2. The results of the ablation study for YOLO-Tree.
DatasetsModelMetrics
ResNet34 BackboneYOLOv8 neckMSAM+
CAM
PRF1mAP50mAP50-95
Ancient Hall×××0.8850.7970.8390.8830.603
××0.8910.8300.8590.8910.626
×0.9040.8740.8890.9310.668
0.9340.8520.8910.9300.684
Chan-yuan Temple×××0.9210.8550.8870.9250.624
××0.9260.8590.8910.9310.646
×0.9030.9010.9020.9300.654
0.9370.8910.9130.9390.665
Note: The best results were highlighted in bold.
Table 3. The performance of YOLO-Tree across datasets encompassing diverse flight altitudes, overlap ratios, and sites.
LocationsOverlap Ratio (%)Flight Height (m)Metrics
PRF1mAP50mAP50-95
Ancient Hall0600.8230.7200.7680.7790.530
1000.8760.7530.8100.7990.557
1500.9720.8160.8870.9140.618
25600.8830.9110.8970.9290.648
1000.9370.9130.9250.9390.704
1500.9700.8920.9290.9510.752
50600.9730.9570.9650.9750.851
1000.9890.9740.9810.9930.880
1500.9970.9870.9920.9940.895
Chan-yuan Temple0600.9140.8040.8550.9040.609
1000.9320.8800.9050.9170.638
1500.9440.9170.9300.9620.652
25600.9220.8820.9020.9480.727
1000.9370.9180.9270.9550.739
1500.9800.9340.9560.9730.788
50600.9730.9580.9650.9850.871
1000.9930.9740.9830.9890.895
1500.9980.9880.9930.9950.893
All0600.8350.8020.8180.8740.609
1000.8680.8210.8440.8730.620
1500.9240.8780.9000.9370.636
25600.9090.8960.9020.9410.704
1000.9490.9240.9360.9530.745
1500.9740.9130.9430.9590.757
50600.9810.9500.9650.9820.854
1000.9870.9710.9790.9890.884
1500.9860.9790.9820.9930.892
Note: The best results were highlighted in bold.
Disclaimer/Publisher’s Note: The statements, opinions and data contained in all publications are solely those of the individual author(s) and contributor(s) and not of MDPI and/or the editor(s). MDPI and/or the editor(s) disclaim responsibility for any injury to people or property resulting from any ideas, methods, instructions or products referred to in the content.

