Article

An Efficient Ship Target Integrated Imaging and Detection Framework (ST-IIDF) for Space-Borne SAR Echo Data

1
School of Electronic and Information Engineering, Beihang University, Bejing 100191, China
2
School of Electronics and Information Engineering, Anhui University, Hefei 230601, China
3
Institute of Information Fusion, Naval Aviation University, Yantai 264001, China
*
Author to whom correspondence should be addressed.
Remote Sens. 2025, 17(15), 2545; https://doi.org/10.3390/rs17152545
Submission received: 24 May 2025 / Revised: 11 July 2025 / Accepted: 18 July 2025 / Published: 22 July 2025
(This article belongs to the Special Issue Efficient Object Detection Based on Remote Sensing Images)

Abstract

Due to the sparse distribution of ship targets in wide-area offshore scenarios, the typical cascade mode of imaging and detection for space-borne Synthetic Aperture Radar (SAR) echo data would consume substantial computational time and resources, severely affecting the timeliness of ship target information acquisition tasks. Therefore, we propose a ship target integrated imaging and detection framework (ST-IIDF) for SAR oceanic region data. A two-step filtering structure is added in the SAR imaging process to extract the potential areas of ship targets, which can accelerate the whole process. First, an improved peak-valley detection method based on one-dimensional scattering characteristics is used to locate the range gate units for ship targets. Second, a dynamic quantization method is applied to the imaged range gate units to further determine the azimuth region. Finally, a lightweight YOLO neural network is used to eliminate false alarm areas and obtain accurate positions of the ship targets. Through experiments on Hisea-1 and Pujiang-2 data, within sparse target scenes, the framework maintains over 90% accuracy in ship target detection, with an average processing speed increase of 35.95 times. The framework can be applied to ship target detection tasks with high timeliness requirements and provides an effective solution for real-time onboard processing.

1. Introduction

Wide-area offshore ship target detection is one of the key technologies in maritime reconnaissance and surveillance. The efficient information acquisition of ship targets plays an important role in the surveillance of national maritime security and justice [1]. SAR satellites possess the capability to collect wide-area maritime information over long periods and in all weather conditions [2]; ship target position information can be extracted from high-resolution ocean SAR data interpretation at the same time. However, due to the strengthened ability of continuously acquiring SAR echo data, the amount to be processed in wide-area maritime scenes can reach hundreds of millions [2], making improvements in the high data volume processing efficiency [3] a pressing issue that needs addressing in the entire target detection task.
Generally, the traditional space-borne SAR marine ship target detection task follows an “imaging + detection” cascade processing mode [4], which separates the imaging and detection operations independently. The imaging operation focuses on converting SAR echo data from the signal domain to the image domain, while the detection operation simply considers extracting target detection results from existing SAR images. The clear division of the processing steps allows researchers to optimize the algorithms and hardware acceleration in these two directions separately, both of which have yielded excellent results in terms of precision and speed.
On the one hand, researchers consider improving the efficiency of algorithms. The typical space-borne SAR imaging algorithms include the Back Projection (BP) [5,6], the Range Doppler (RD) [5,7], Chirp Scaling (CS) [5,8], Omaga-K [5,9] algorithms, etc. Among them, the BP algorithm achieves accurate imaging through time-domain coherent accumulation, which causes high computational complexity, leading to the development of the Fast Back Projection (FBP) [10] and Fast Factorized Back Projection (FFBP) [11,12]. The CS algorithm solves the range migration problem through phase compensation. Its extended versions, Extended Chirp Scaling (ECS) [13] and Frequency Scaling (FS) [14], further optimize the imaging efficiency in scenarios with large squint angles and wide bandwidths. In the field of SAR target detection, traditional methodologies have evolved significantly across two paradigms. These approaches focus on statistical modeling and handcrafted features: the Constant False Alarm Rate (CFAR) detector [15,16] pioneered adaptive threshold segmentation by leveraging background clutter statistics, while the Scale-Invariant Feature Transform (SIFT) [17] and Support Vector Machines (SVMs) [18] addressed feature representation and classification challenges. Feature enhancement techniques such as the Wavelet Transform (WT) [19,20] and Principal Component Analysis (PCA) [21,22] further improved the robustness against complex backgrounds. However, these methods faced computational bottlenecks as the scale and quantity of SAR imagery expanded exponentially, particularly in real-time applications requiring iterative parameter tuning [23]. The advent of deep learning introduced transformative advancements [24,25,26]. The Faster Region-based Convolutional Neural Network (Faster R-CNN) [27,28] and You Only Look Once (YOLO) [29,30], as representative two-stage and one-stage detectors, respectively, achieved breakthroughs in both accuracy and inference speed through feature learning. Subsequent innovations like Deformable Convolutional Networks (DCNs) [31] enhanced geometric adaptability by modeling irregular target deformations inherent to SAR imagery. Notably, these architectures addressed the sensitivity to speckle noise and rigid template matching by integrating hierarchical feature extraction and multi-scale fusion mechanisms [32]. Recent studies also emphasize lightweight architectures and attention mechanisms [33] to optimize resource efficiency without compromising performance, marking a pivotal shift toward deployable SAR detection systems.
On the other hand, with the advancements in dedicated chips and computational hardware, researchers utilized multi-core CPU and GPU architectures to distribute imaging and detection tasks [34,35] and achieve algorithm parallelization and significant acceleration effects [36,37,38]. For onboard SAR processing systems, FPGAs were generally used as real-time processors because of their lighter weight, lower power consumption, abundant logic resources, and strong parallel processing capabilities [39,40]. Currently, a common hardware architecture is FPGA + RAM or FPGA + DSP [41,42], which can complete imaging and detection processing for large-scale targets within tens of seconds [43] under space-borne observation.
Although there have been plenty of studies on real-time imaging [44] and optimized detection networks [45,46,47,48,49,50,51] for wide-swath scenarios, researchers tend to do separate research on imaging and detection all the time, but ignore the fact that detection is based on images processed from the SAR echo. If SAR images serve the purpose of target detection, the imaging process could be simplified and adjusted for the best of detection efficiency [45,46,47,48,49,50,51]. In recent years, some research has been conducted on considering target detection in the SAR echo process, such as the raw echo [45], wave-number domain [46], and range-compressed domain [47,48,49,50,51,52]. Among them, range compression data stands out with detection networks because of its ability to effectively concentrate target energy [47]. Detection frameworks, like the CFAR-based method [47,48,49], Incept-TextCNN model [50], and YOLO network [51], decouple imaging from feature extraction, yet exhibit a sensitivity to coherent speckle noise and degraded resolution at swath edges. While these approaches alleviate specific computational burdens, the reliance of networks on scene-specific assumptions or restricted data subsets (narrow swaths and pre-filtered regions) compromises the robustness in wide-area heterogeneous scenarios [52]. Persistent challenges include balancing resolution preservation with computational tractability and ensuring generalizability across varying clutter distributions [50,51,52], which affect the further implementation of deployable wide-area SAR processing systems.
To conclude, in wide-area offshore scenes, the efficiency of recent methods cannot achieve quick processing after SAR data acquisition, and the timeliness of the final detection results is declined, leading to a low credibility of further processing results from the target information. Therefore, this paper proposes a ship target integrated imaging and detection framework (ST-IIDF), taking the sparse distribution of targets in vast ocean scenarios into consideration. As most of the collected space-borne SAR data consists of echoes from target-free areas, this framework can quickly and accurately filter out suspected target areas in both the signal domain and corresponding image domain through two-step filtering under large data volumes, accelerating the imaging and detection processes. Based on the SAR range-compressed signal, where target areas have relatively concentrated signal strengths in both the range and azimuth directions with slightly different distribution characteristics, the framework first uses an improved peak and valley detection method based on the Automatic Multi-scale-based Peak Detection algorithm (AMPD) [53] to determine the position of potential target area range gates. Then, based on the extracted one-dimensional azimuthal signal, we attempt to shorten the suspected potential range and image based on the screened potential target area signals. To narrow down the azimuth direction in the image domain, a dynamic quantization method [4] is applied to quickly locate potential target areas and reduce the target area range in the azimuth direction. The screened SAR slices are pre-segmented and quantized to 8 bits, which can be directly input into the deep learning model for target detection. Finally, taking the YOLOv7 network [30,54] as an example, through weight pruning and neuron pruning methods, the network architecture is light weighted, the parameters are adjusted, and the screened SAR images are used for ship target detection, obtaining the detection results [55]. At the same time, the network can also eliminate the false alarm areas in the previous two-step filtering to ensure the final detection accuracy of the ship targets.
In summary, to solve the problems of redundancy in the imaging and detection of wide-area data and the low timeliness of detection results faced by current space-borne SAR in offshore ship detection, this paper constructs an integrated imaging and detection framework for the ship target detection task of wide-area offshore SAR data. Through the characteristics of the target signal domain and image domain, it pre-screens target areas in the range and azimuth directions, filters out data ranges without targets in the region extraction stage, and enhances the processing speed from the signal to target detection results, achieving improved timeliness and efficiency of space-borne SAR ocean ship target imaging and detection. The innovations include three points: (1) constructing a general integrated imaging and detection framework, screening target areas twice in the signal domain and image domain, with no restrictions on imaging and detection algorithms; (2) in the SAR echo signal domain, using the one-dimensional features of range-compressed data, proposing a peak and valley detection method based on the AMPD algorithm, locating potential target areas in the range direction, and shortening the azimuth ranges, saving imaging computational costs in the target-free signal; and (3) in the SAR image domain, applying a dynamic quantization method to supplement the area screening in the azimuth direction, saving detection network segmentation and quantization image costs and reducing network preprocessing burdens. The rest of this paper consists of the following four parts: Section 2 mainly expounds the composition of the integrated imaging and detection framework and further explains the methods of the potential target area screening steps in the framework; Section 3 conducts experiments on the integrated imaging and detection process to confirm the efficiency and timeliness improvement of SAR data processing achieved by the proposed framework; Section 4 compares the performance of existing methods on the proposed methods to prove the progressiveness; and Section 5 summarizes the achievements of this paper and future research ideas.

2. Methods

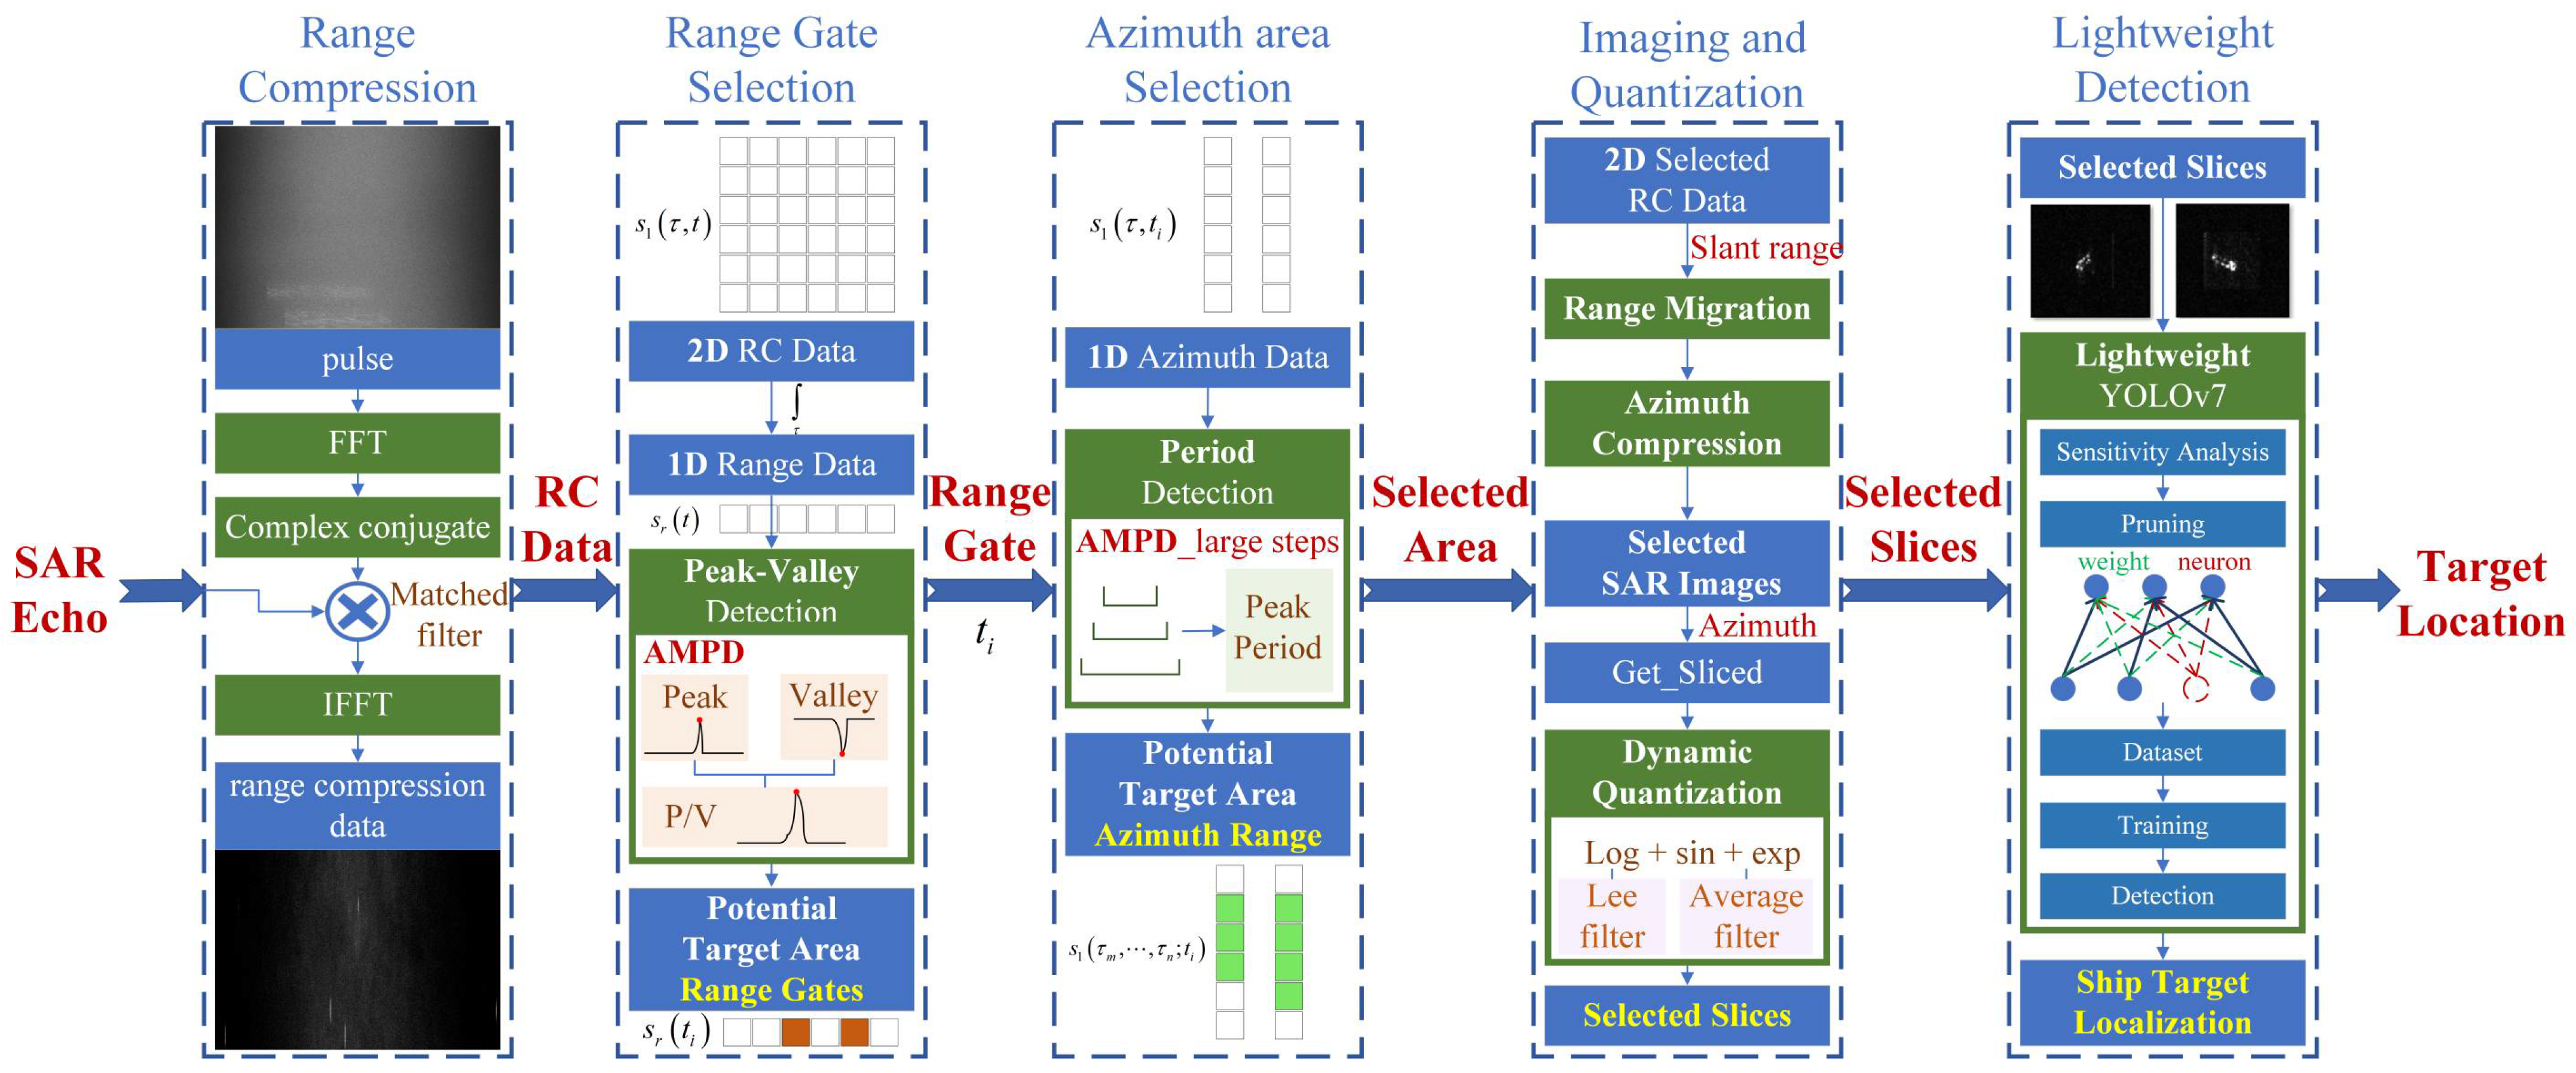
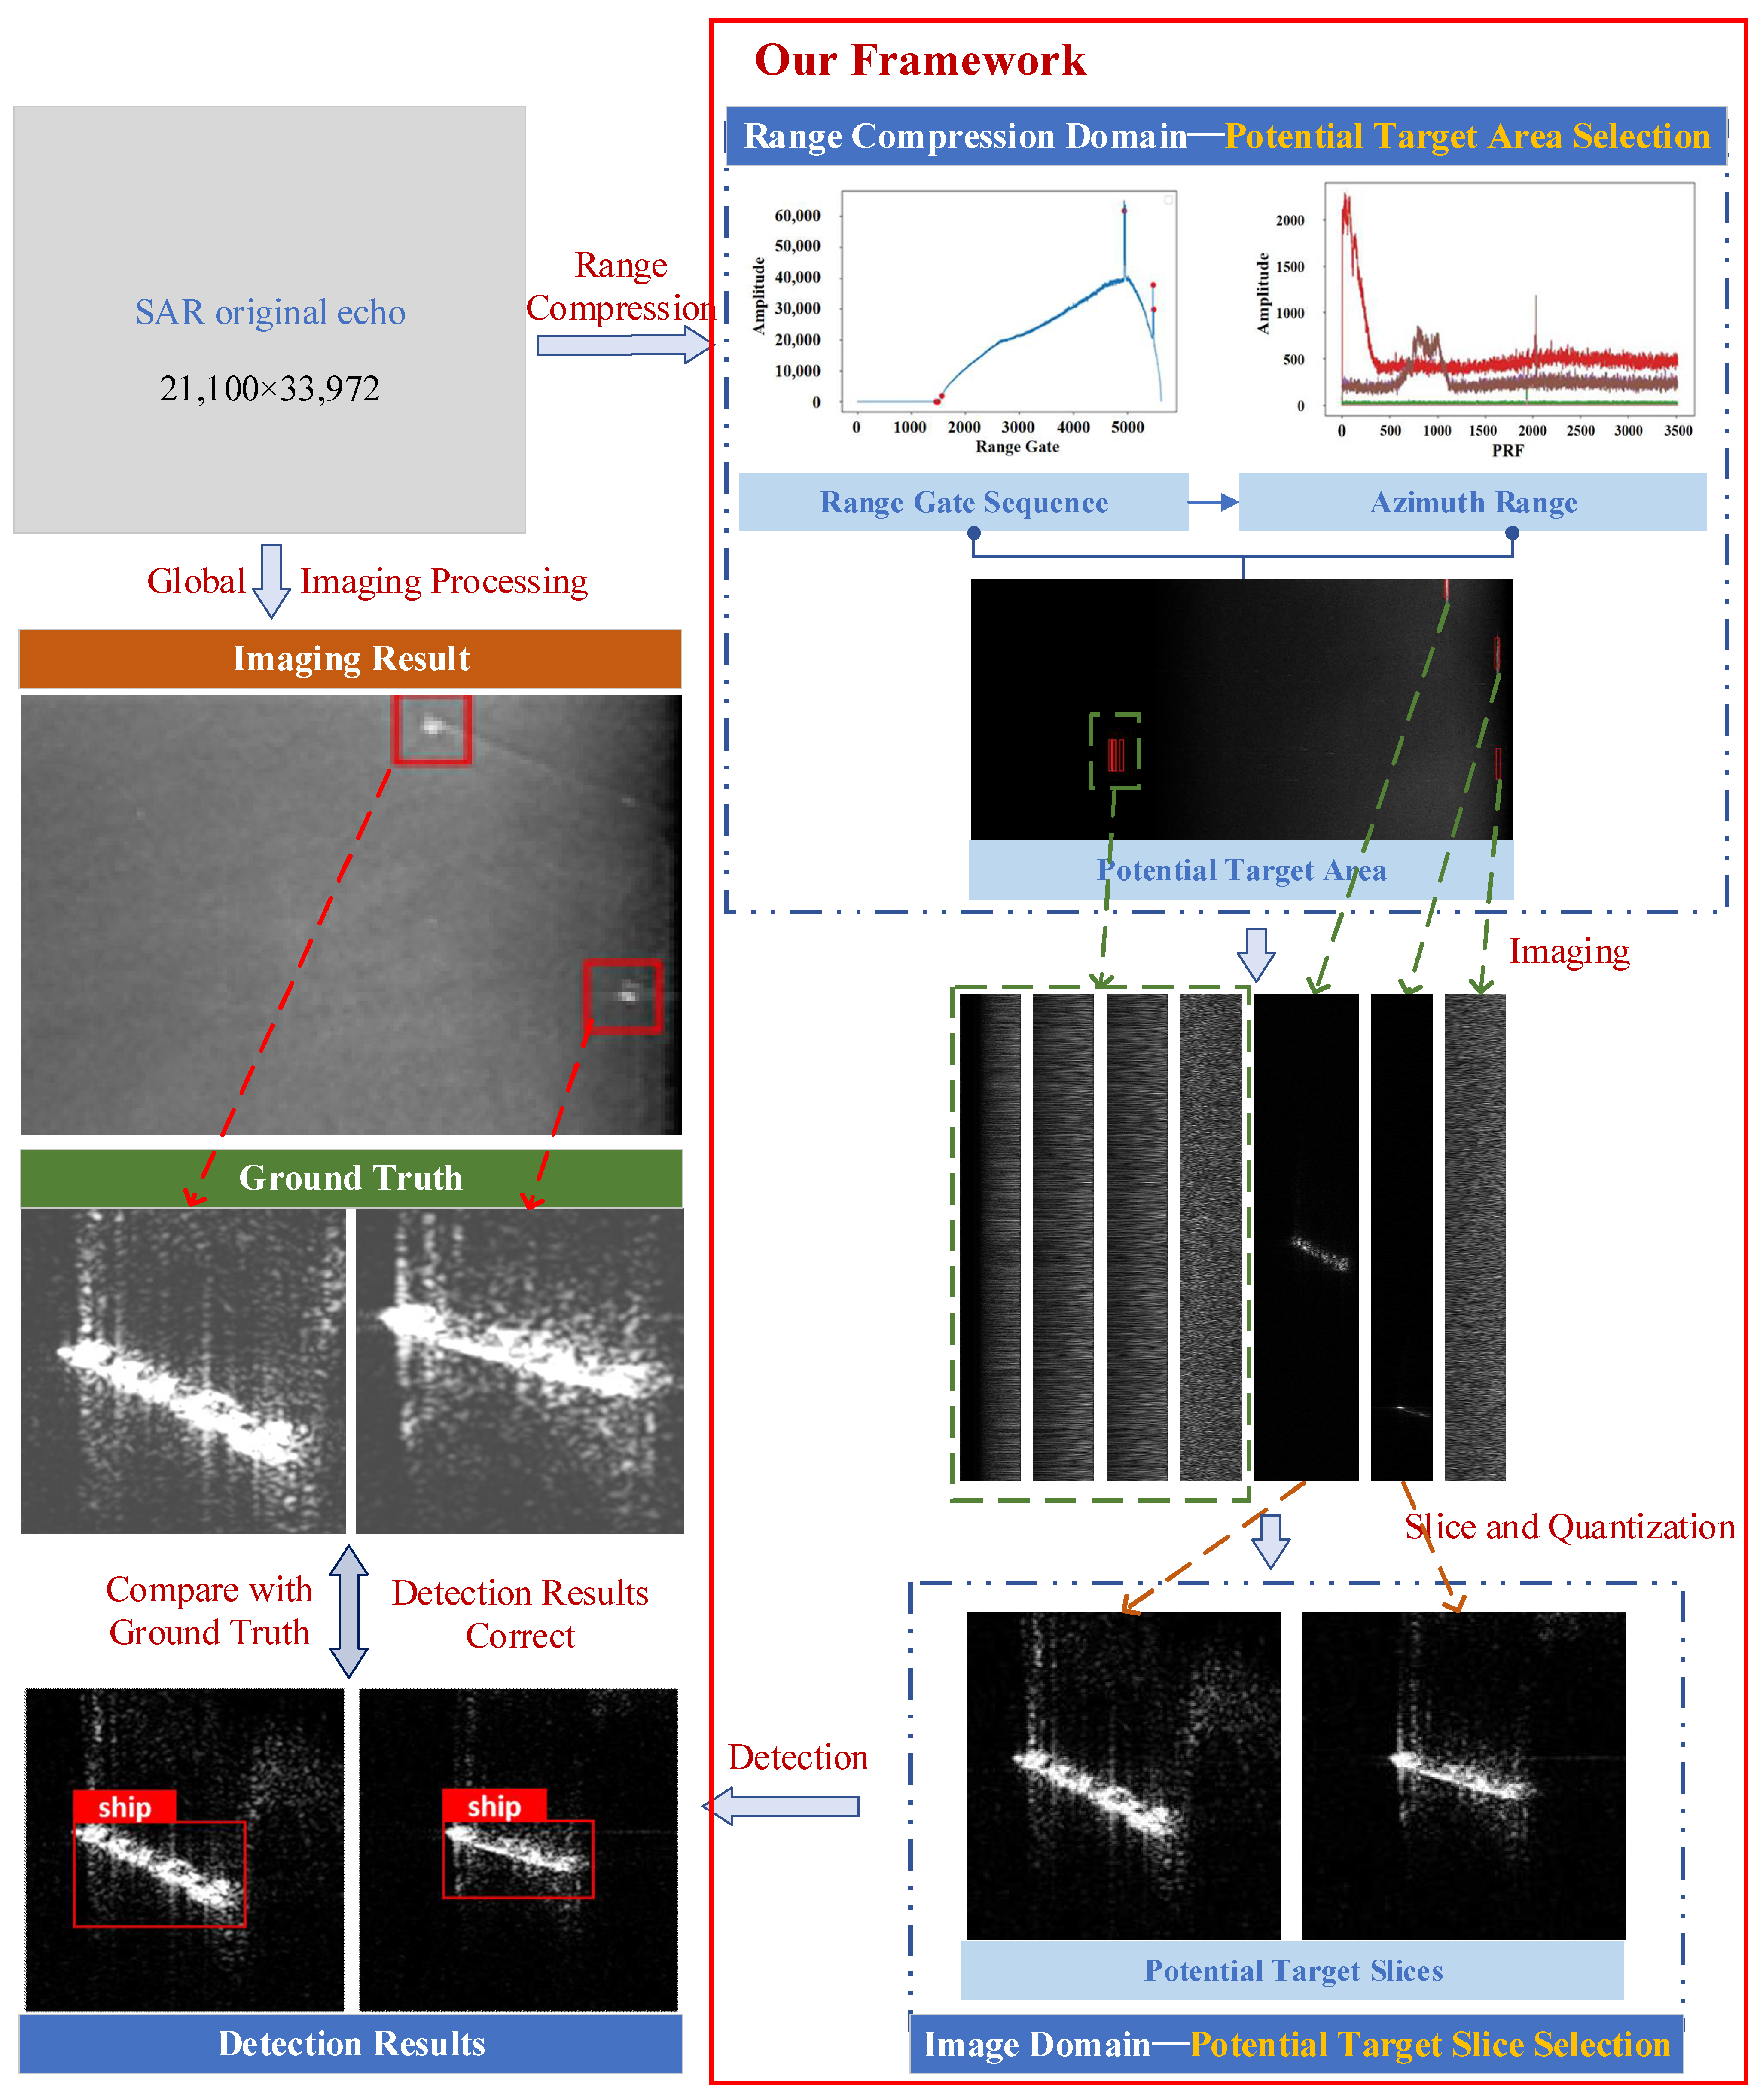
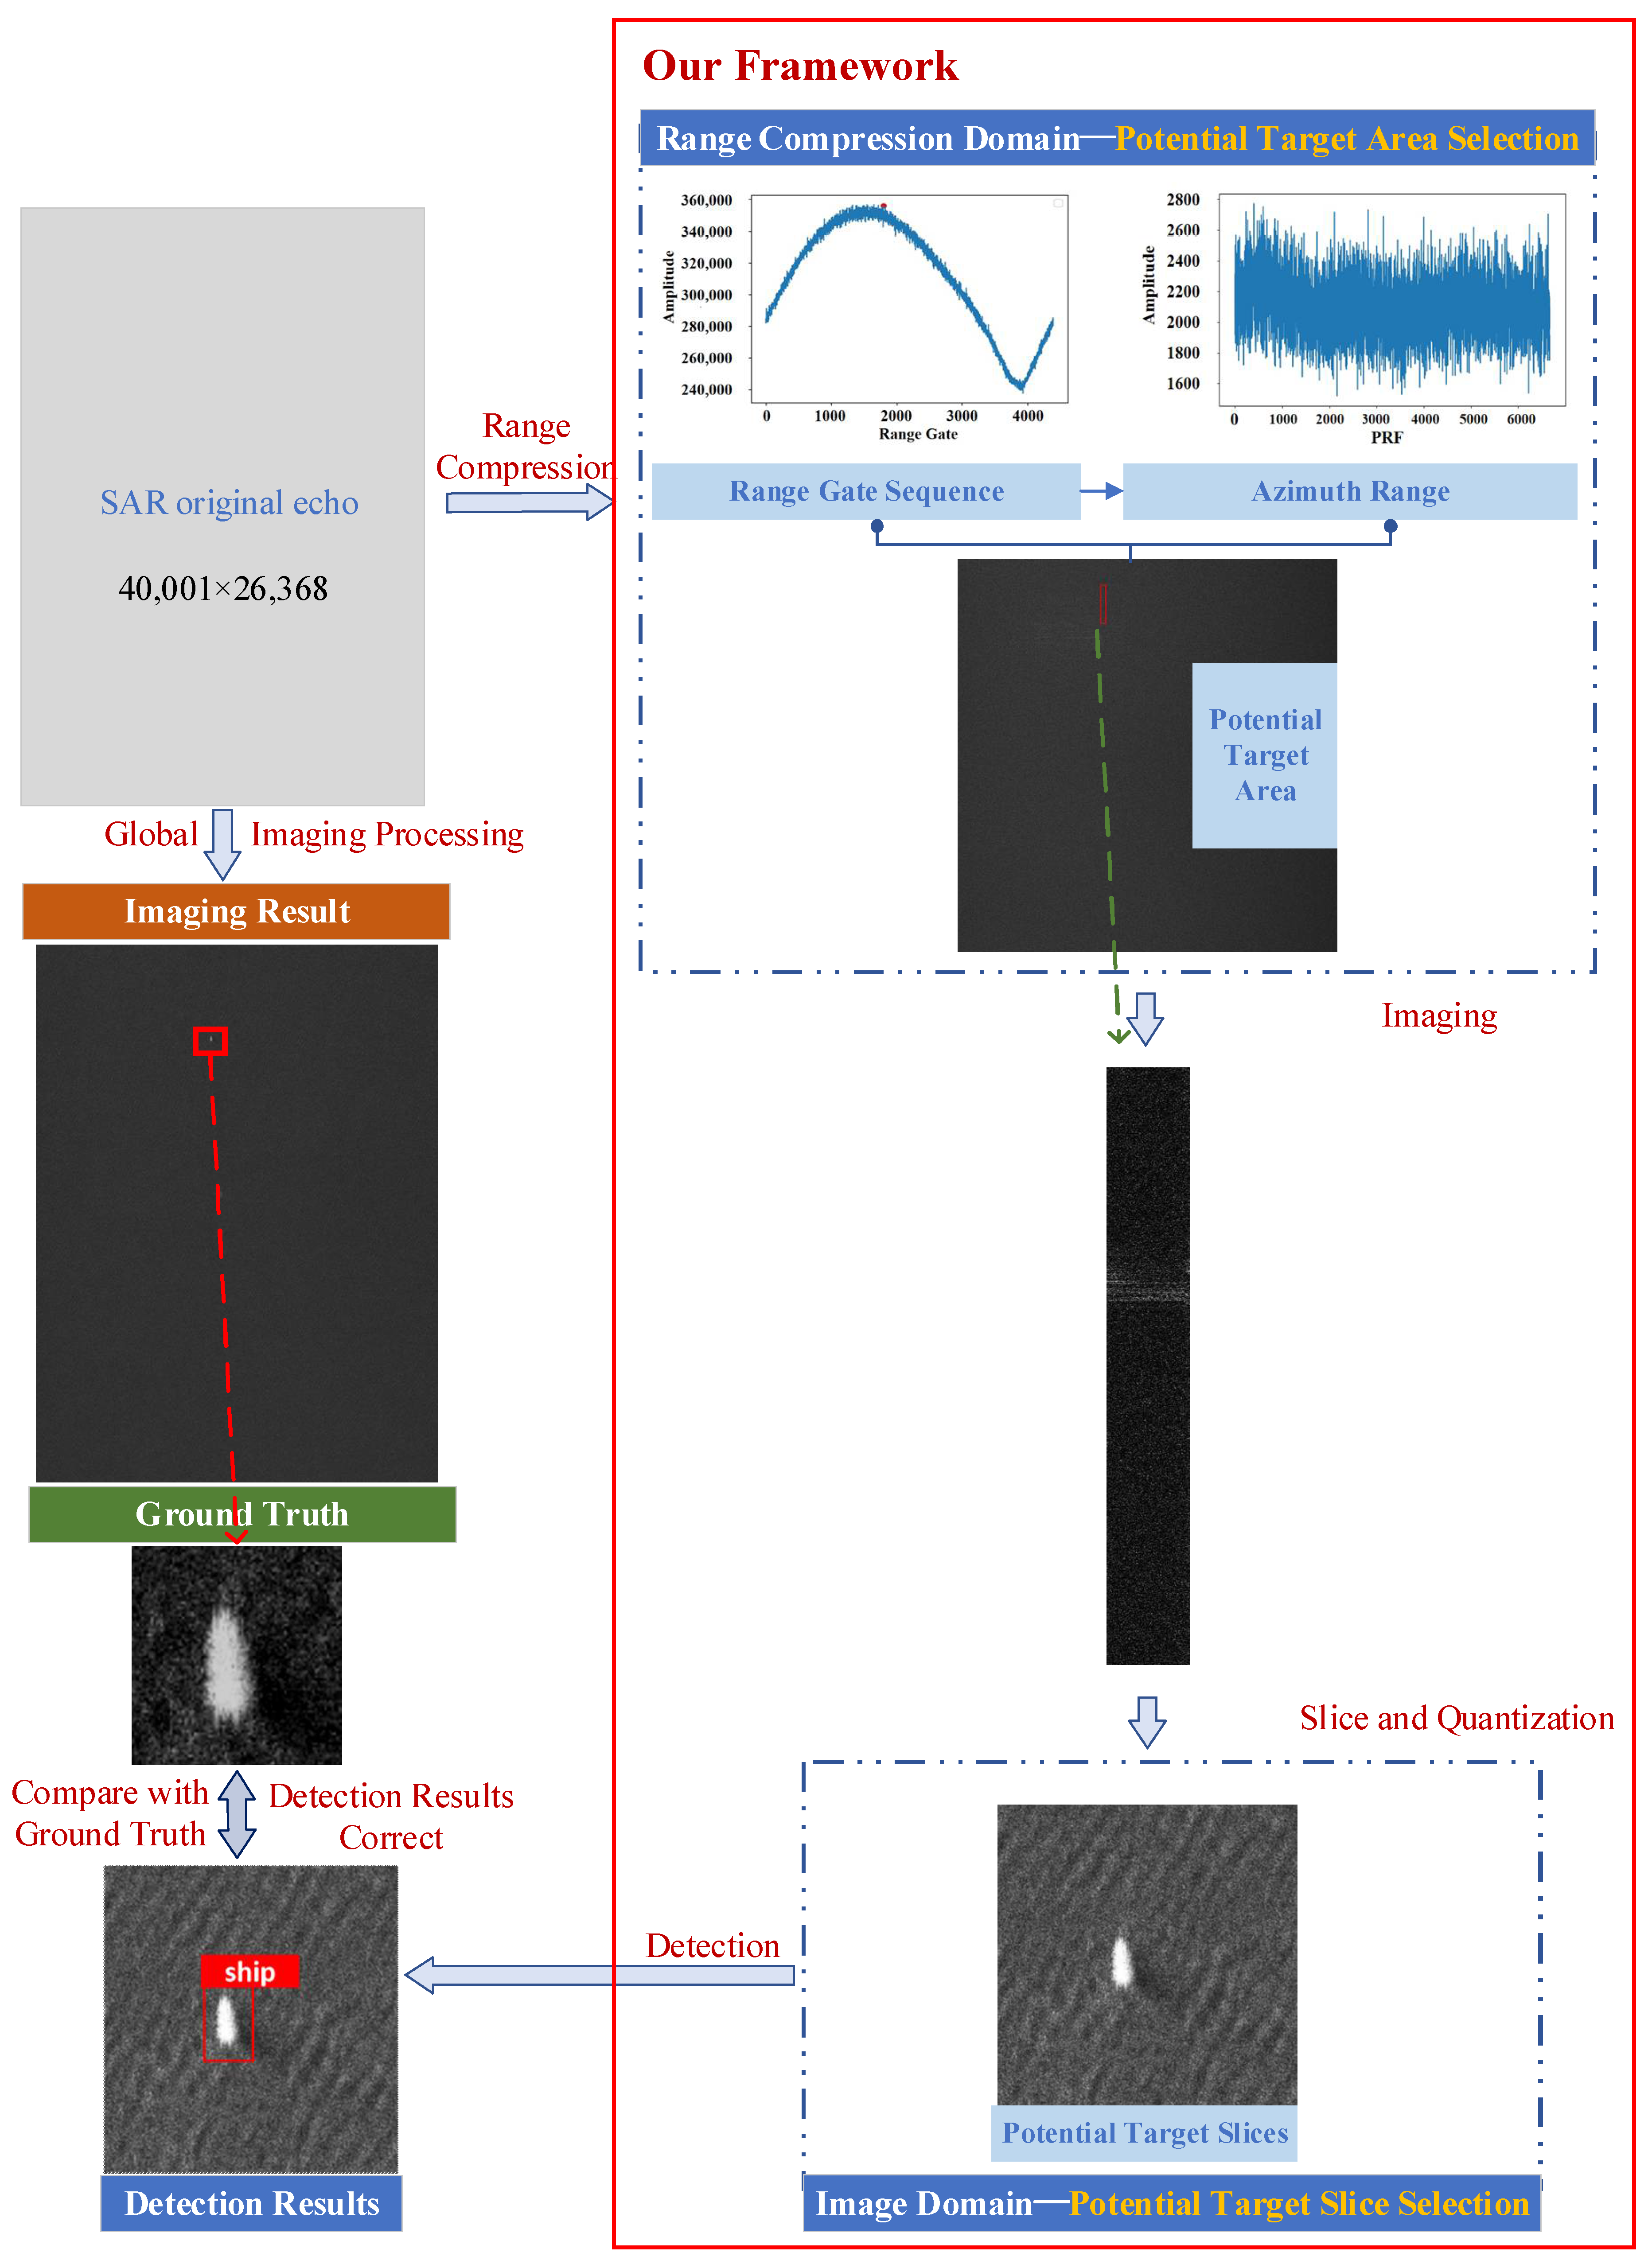
2.1. ST-IIDF for Wide-Area Offshore Scenarios

SAR satellites capture vast amounts of echo data in wide-area offshore scenarios. Practically, it is difficult for onboard processors to image and detect ship targets from the mass of data with limited hardware condition. Thus, after certain prepossessing, semi-finished data would be transferred to ground processors to further complete the process [43]. Even with high-performance hardware, the data amount causes a great occupation in traversing through the total signal and images. The unavoidable loss is because the inherent imaging and detection operate in a cascaded manner, which means they are currently divided into two independent sections [46,47,48,49,50,51]. As ship targets are randomly distributed in an extremely sparse way, when it comes to practical objectiveness, the imaging process serves the purpose of ship target detection, so the operations performed on the SAR data in regions where no targets are present gives rise to computational and temporal redundancies in the overall workflow. Consequently, the timeliness of the acquired target location information is compromised, and the referential value of such information in subsequent data mining tasks, such as real-time target monitoring and position tracking during deployment, is undermined.
Considering the detection of offshore wide-area scene images, only partial areas with potential target presence have operational value due to the sparse essence. Hence, we attempt to select these conforming areas before detection and avoid extra computational operations in the meantime. It is known that quantization is necessary in deep learning networks to adjust the quantization bit, suppress noise and clutter in the image, and improve training efficiency. Most of the existing quantization methods are based on mathematical models, are easily affected by parameters, and can only be applied to specific scenarios. So, we experimented with a dynamic quantization method to distinguish slices with and without targets in the image domain.
However, slice selection is far from enough, because it takes considerable computational and time cost for multi-thousand by multi-thousand pixels of SAR images to be formed and sliced. Similarly, we attempted to select echo data scattered from potential targets before imaging. The original echo signal records the scattering characteristics of seawater and ships with dispersed target energy information, so it is not conducive to subsequent screening. Range compression is one of the necessary steps for imaging, effectively concentrating the target scattering energy and suppressing background noise [47,48]. Though the signal-to-noise ratio (SNR) of the target area is significantly improved, the distinction between the target and background in two-dimensional data is relatively low [47,48]. Methods such as threshold segmentation and network detection tend to result in a higher number of false alarms and missed detections. Therefore, we accumulated the two-dimensional data into one dimension in order to concentrate the energy of the target signal more effectively. A peak and valley detection algorithm based on AMPD is purposed to extract potential target areas from the range and azimuth direction in the range-compressed domain.
Consequently, this section explores a framework to enhance the efficiency of the imaging detection process, aiming to quickly acquire information on the target location. According to the characteristics of the SAR satellite echo data and the fact that ship targets tend to form dihedral structures with the sea surface, ships could exhibit strong scattering energy in both the SAR signal domain and image domain. Thus, we leveraged the general pattern and pre-selected potential target areas before imaging, performing detailed imaging only on the potential area signals. The resulting SAR images were then divided into blocks, and slices containing potential targets were quantified and filtered. These filtered slices were input into a target detection neural network, obtaining the final positional results. The overall structure of the framework is shown in Figure 1.

2.1.1. Range Compression

The framework input consists of raw signals acquired by the space-borne SAR that reflect the ocean surface and its overlying targets. A range-wise matched filtering is chosen to achieve range compression, concentrating the target scattering energy and making the target features in the signal easier to discern.

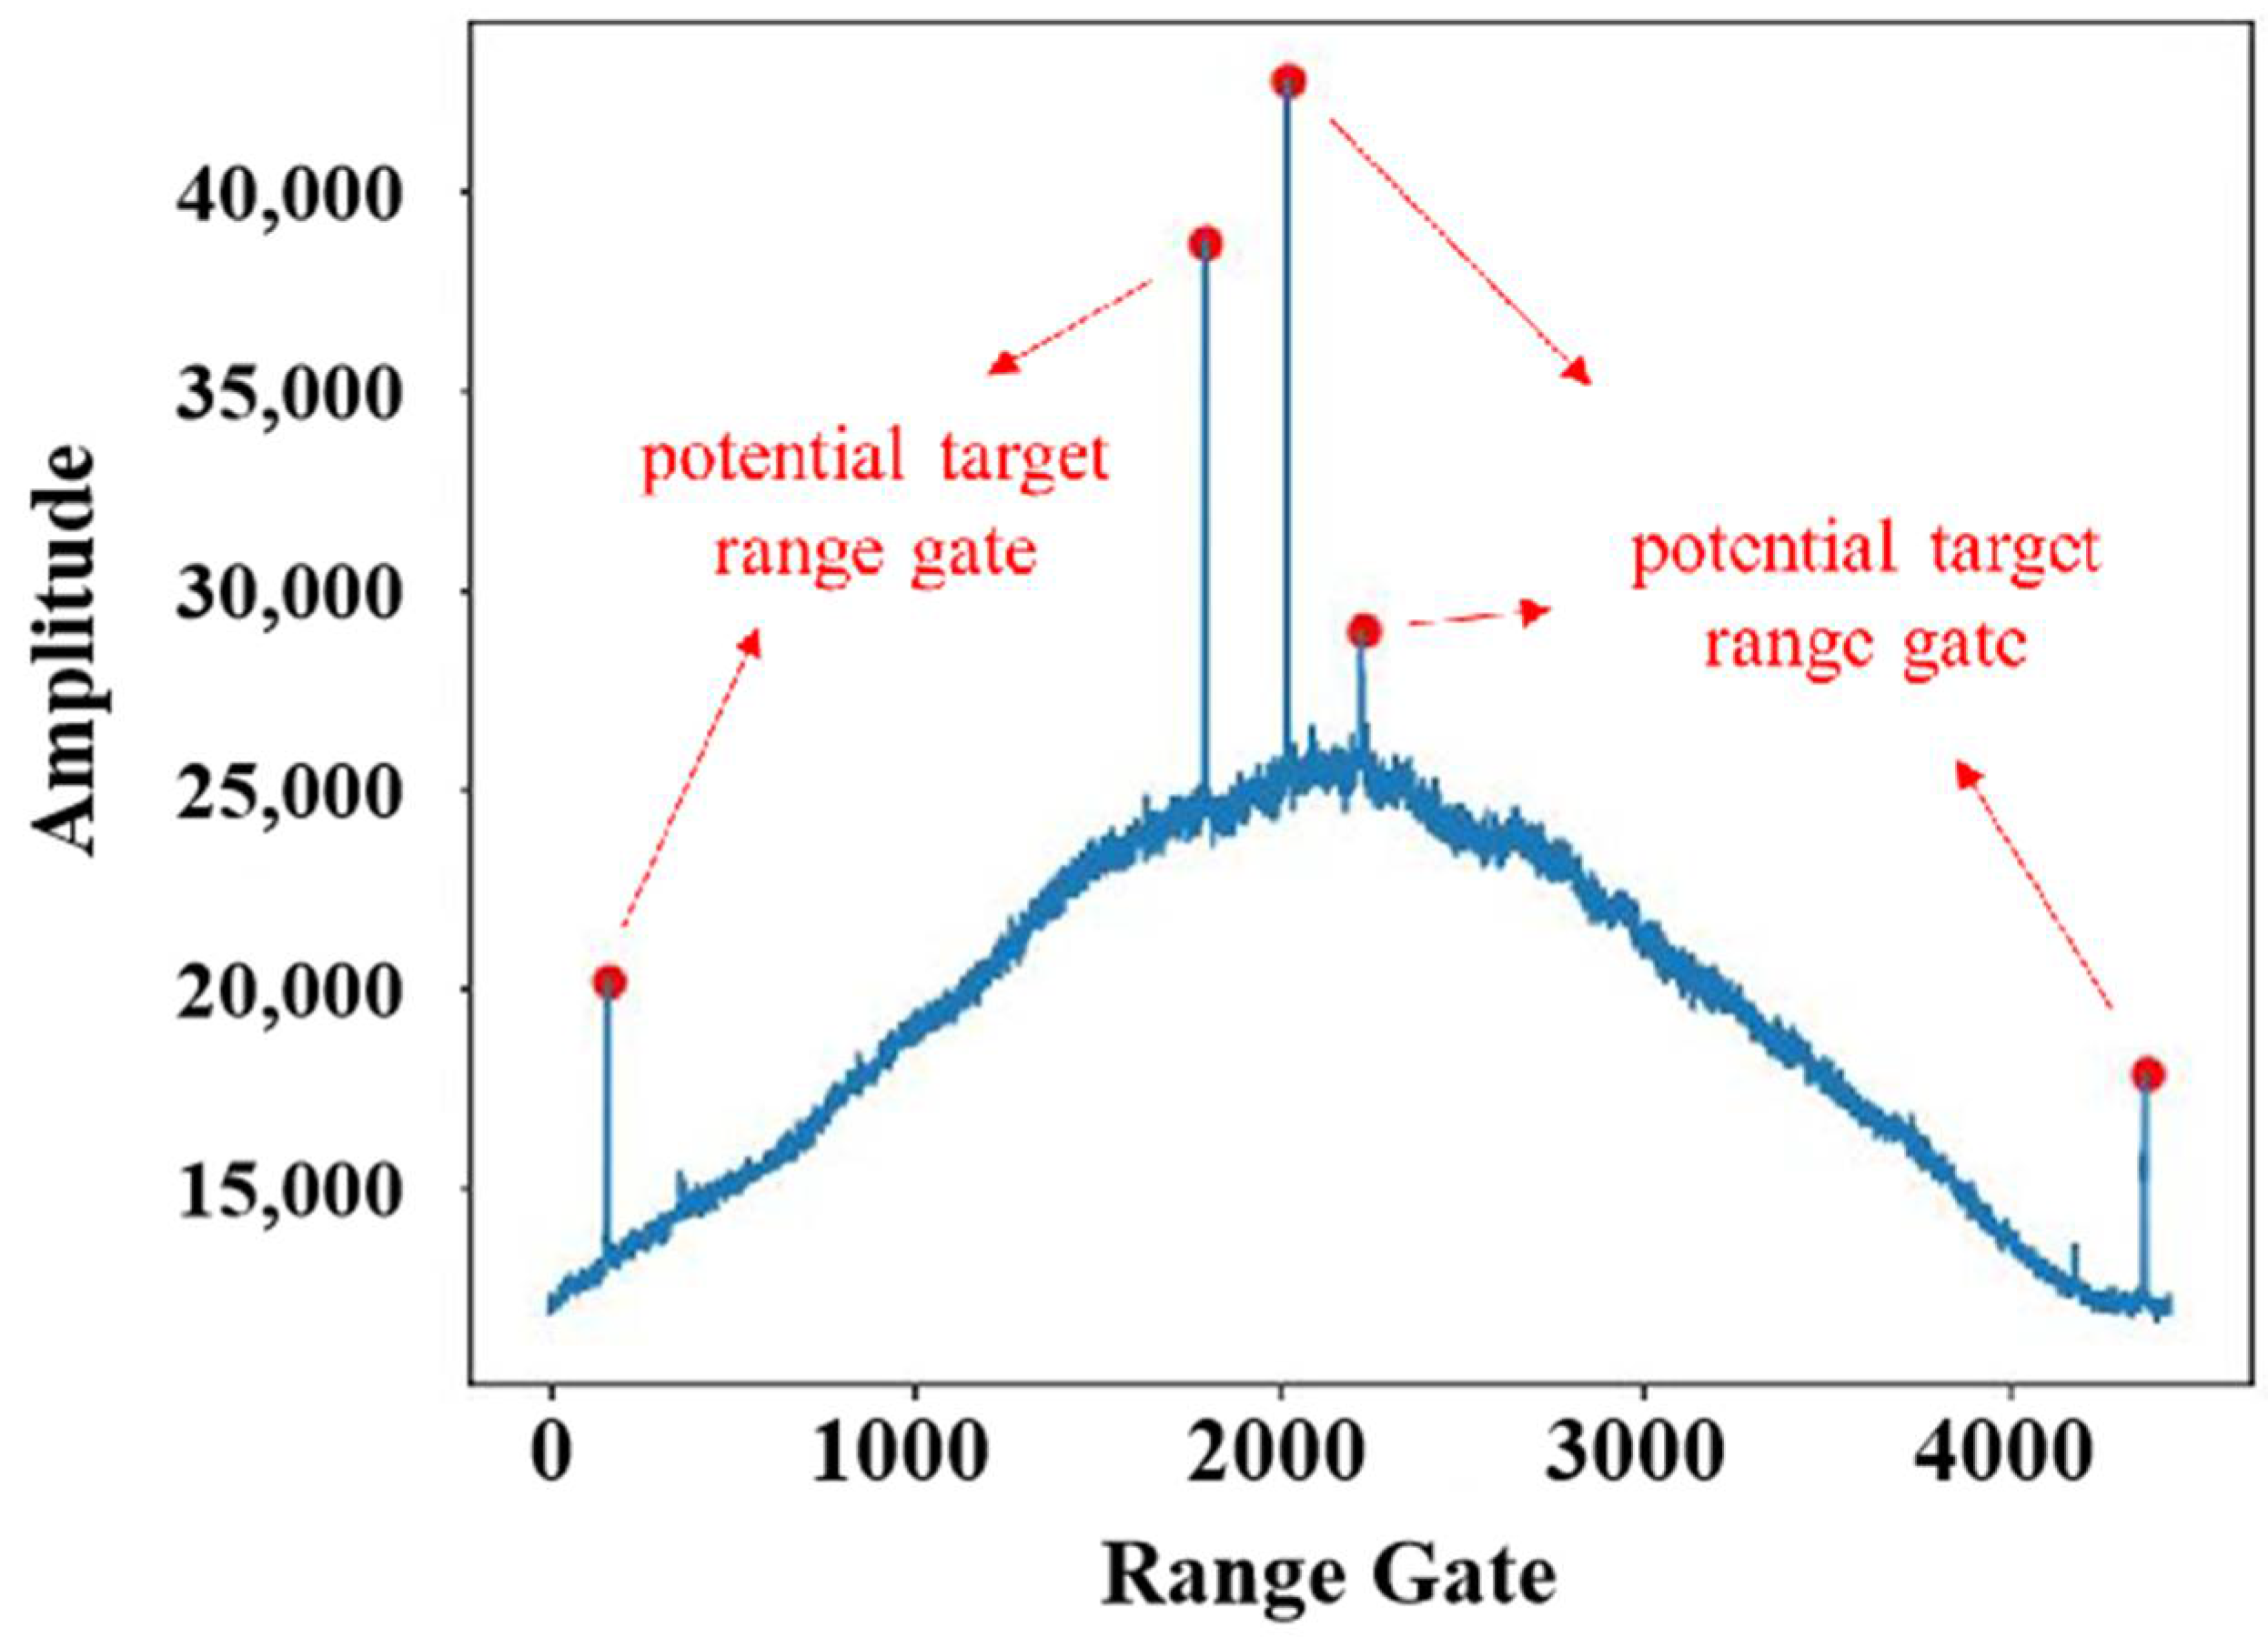
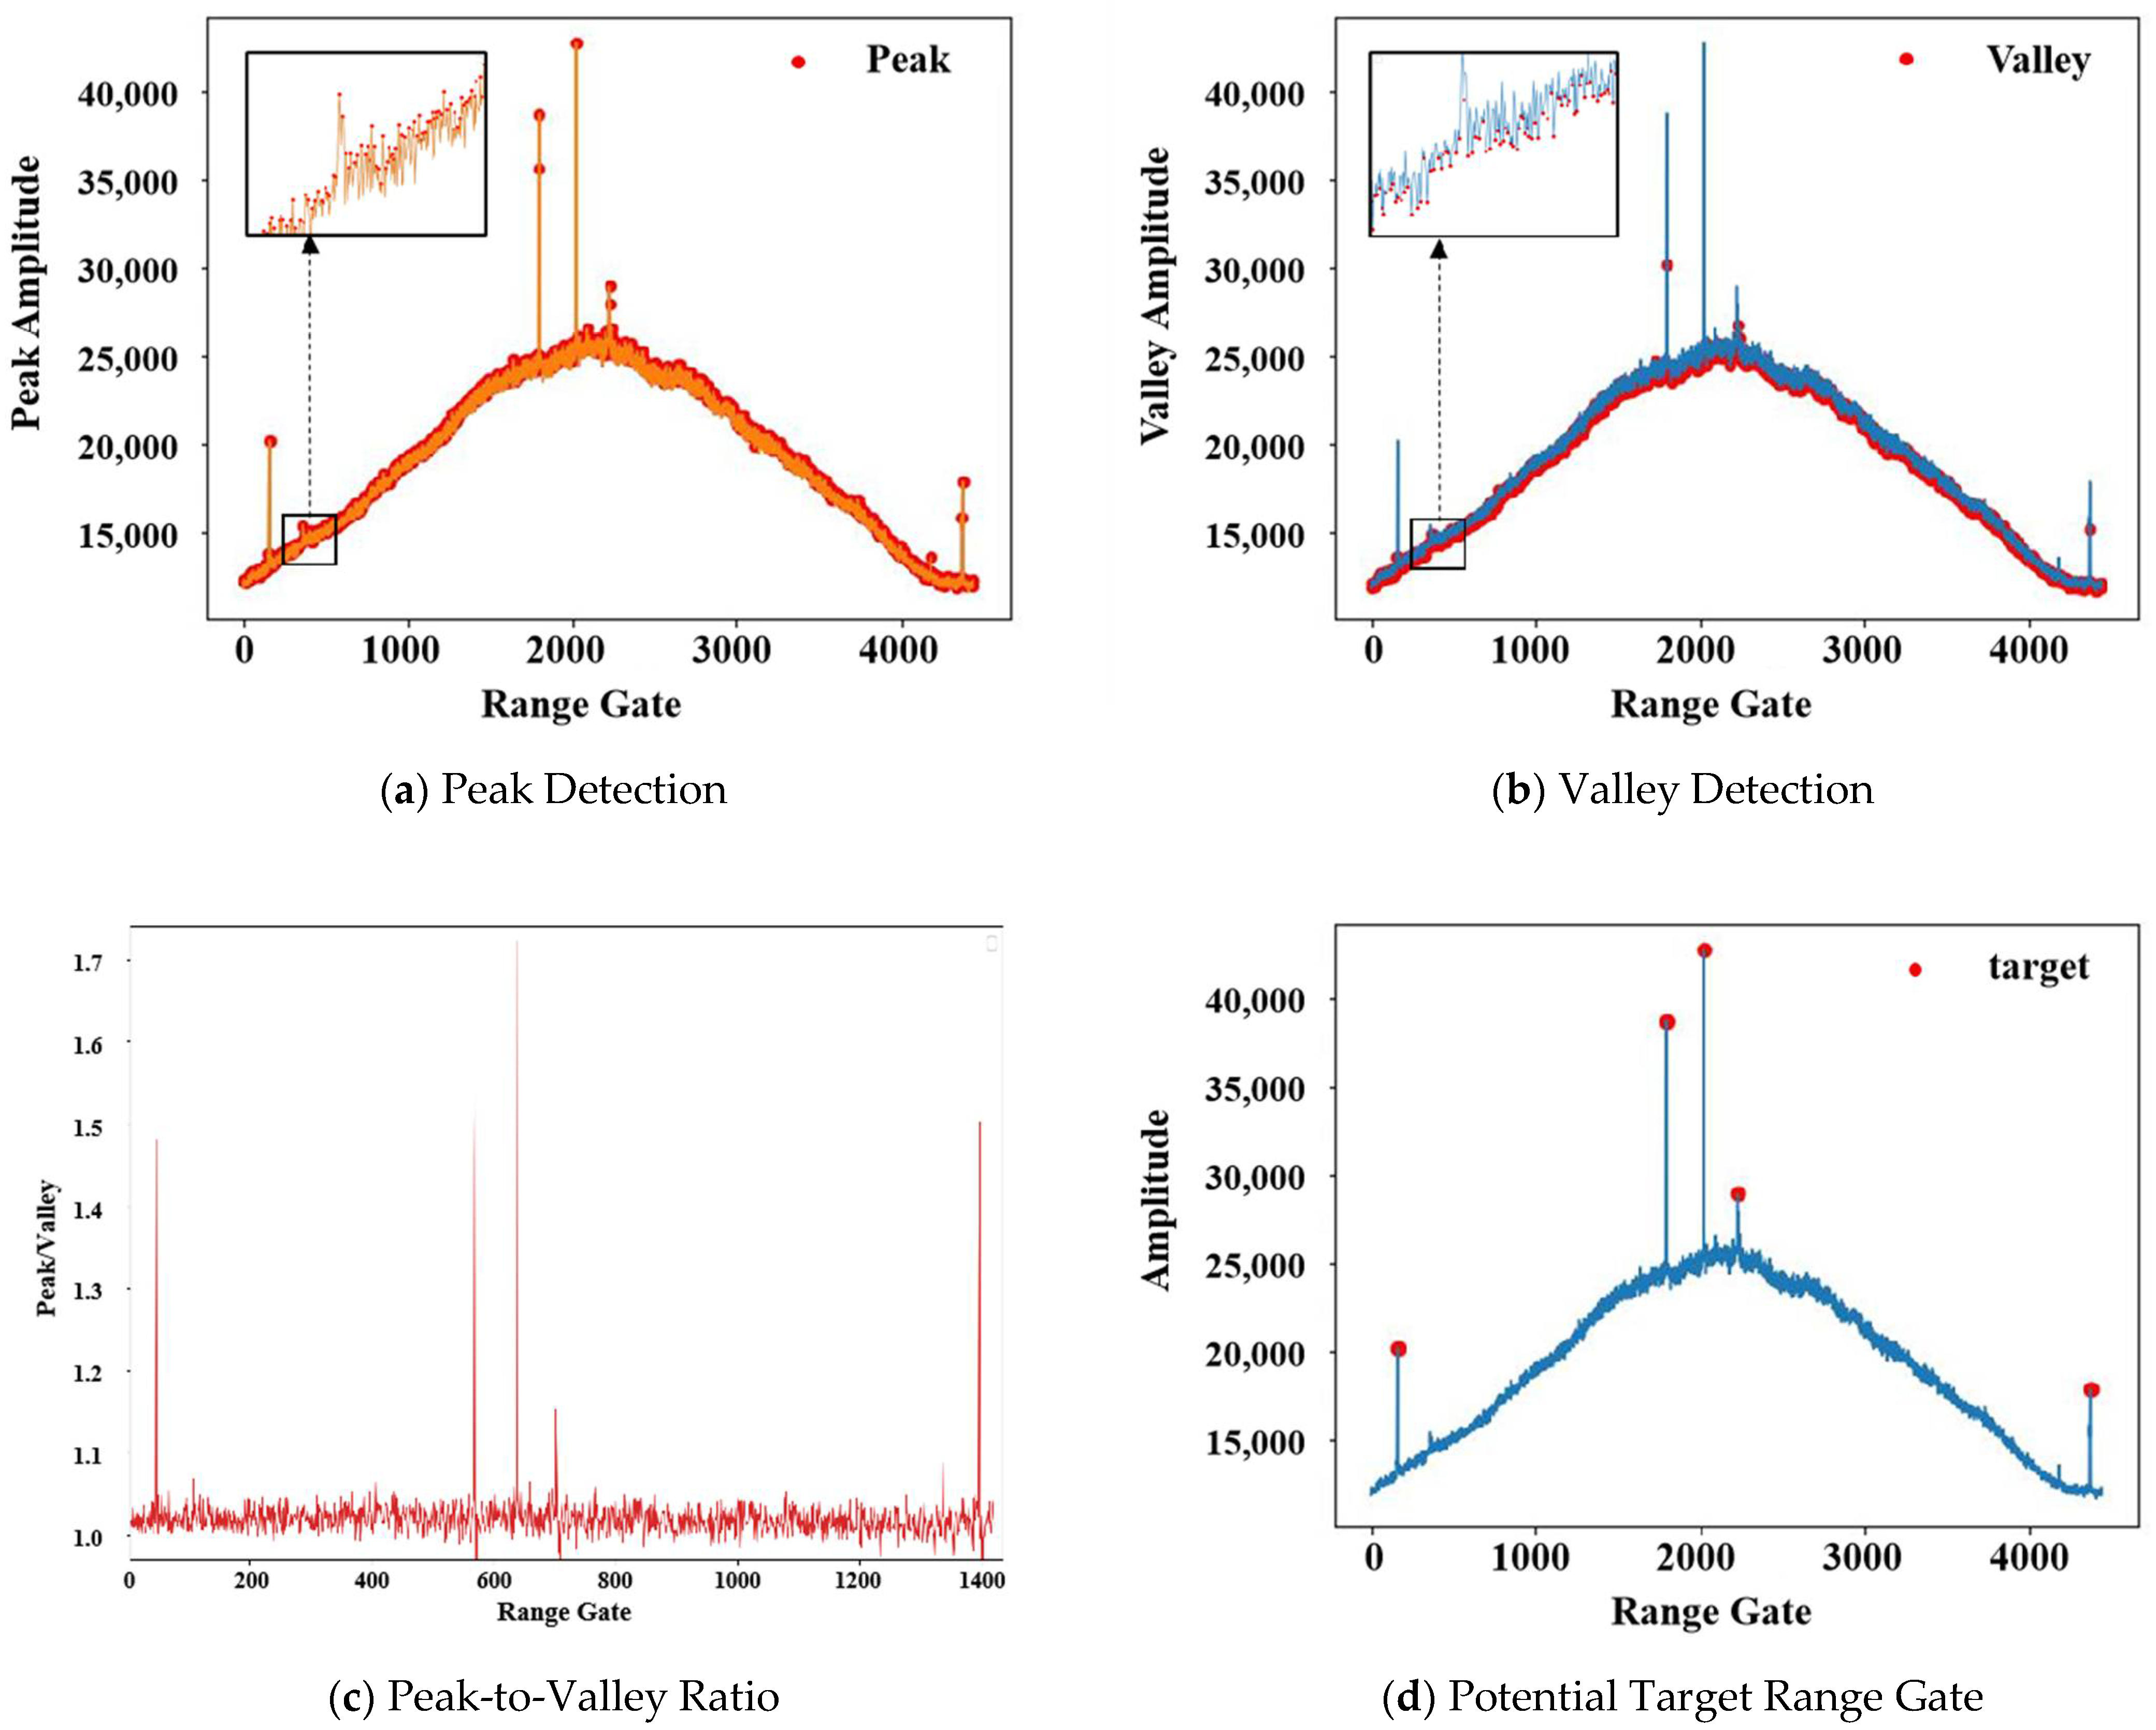
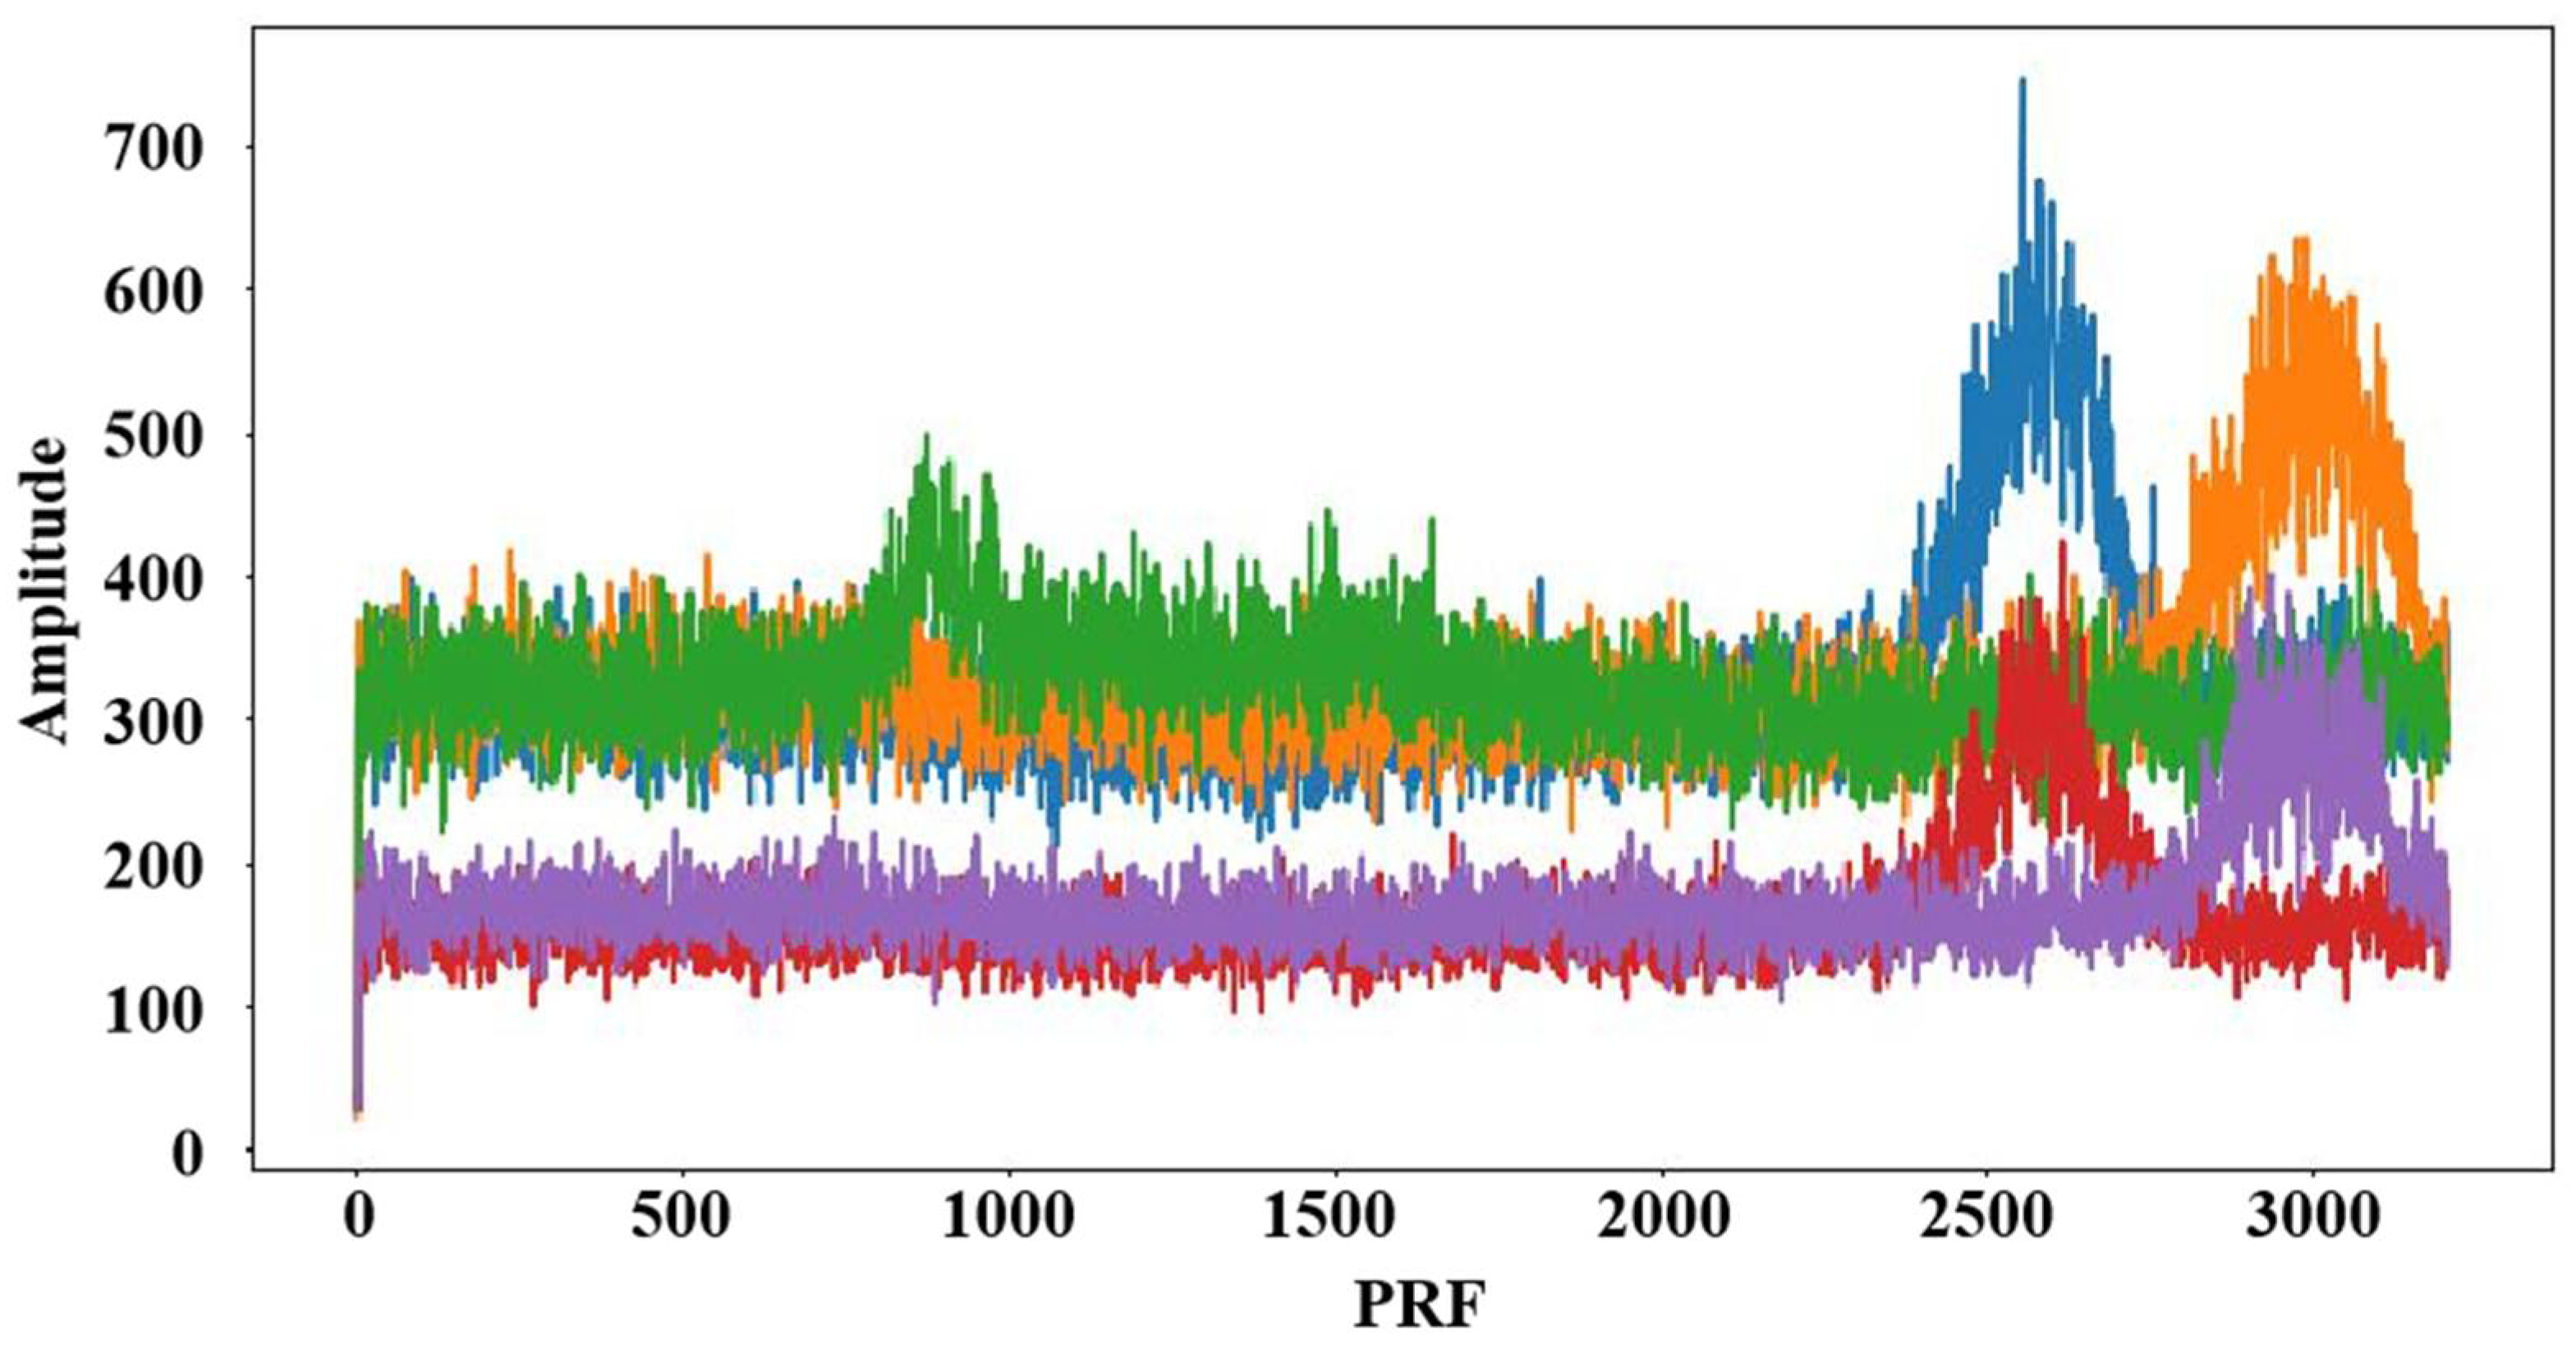
2.1.2. Range Gate Selection

The range compression data is first accumulated along the azimuth direction into one-dimensional range data. Then we design a peak and valley detection method based on the AMPD algorithm [53], which utilizes the variation characteristics of signals at different scales to determine the positions of peaks and valleys. By filtering the peak-to-valley ratio, we obtain the range gate sequence.

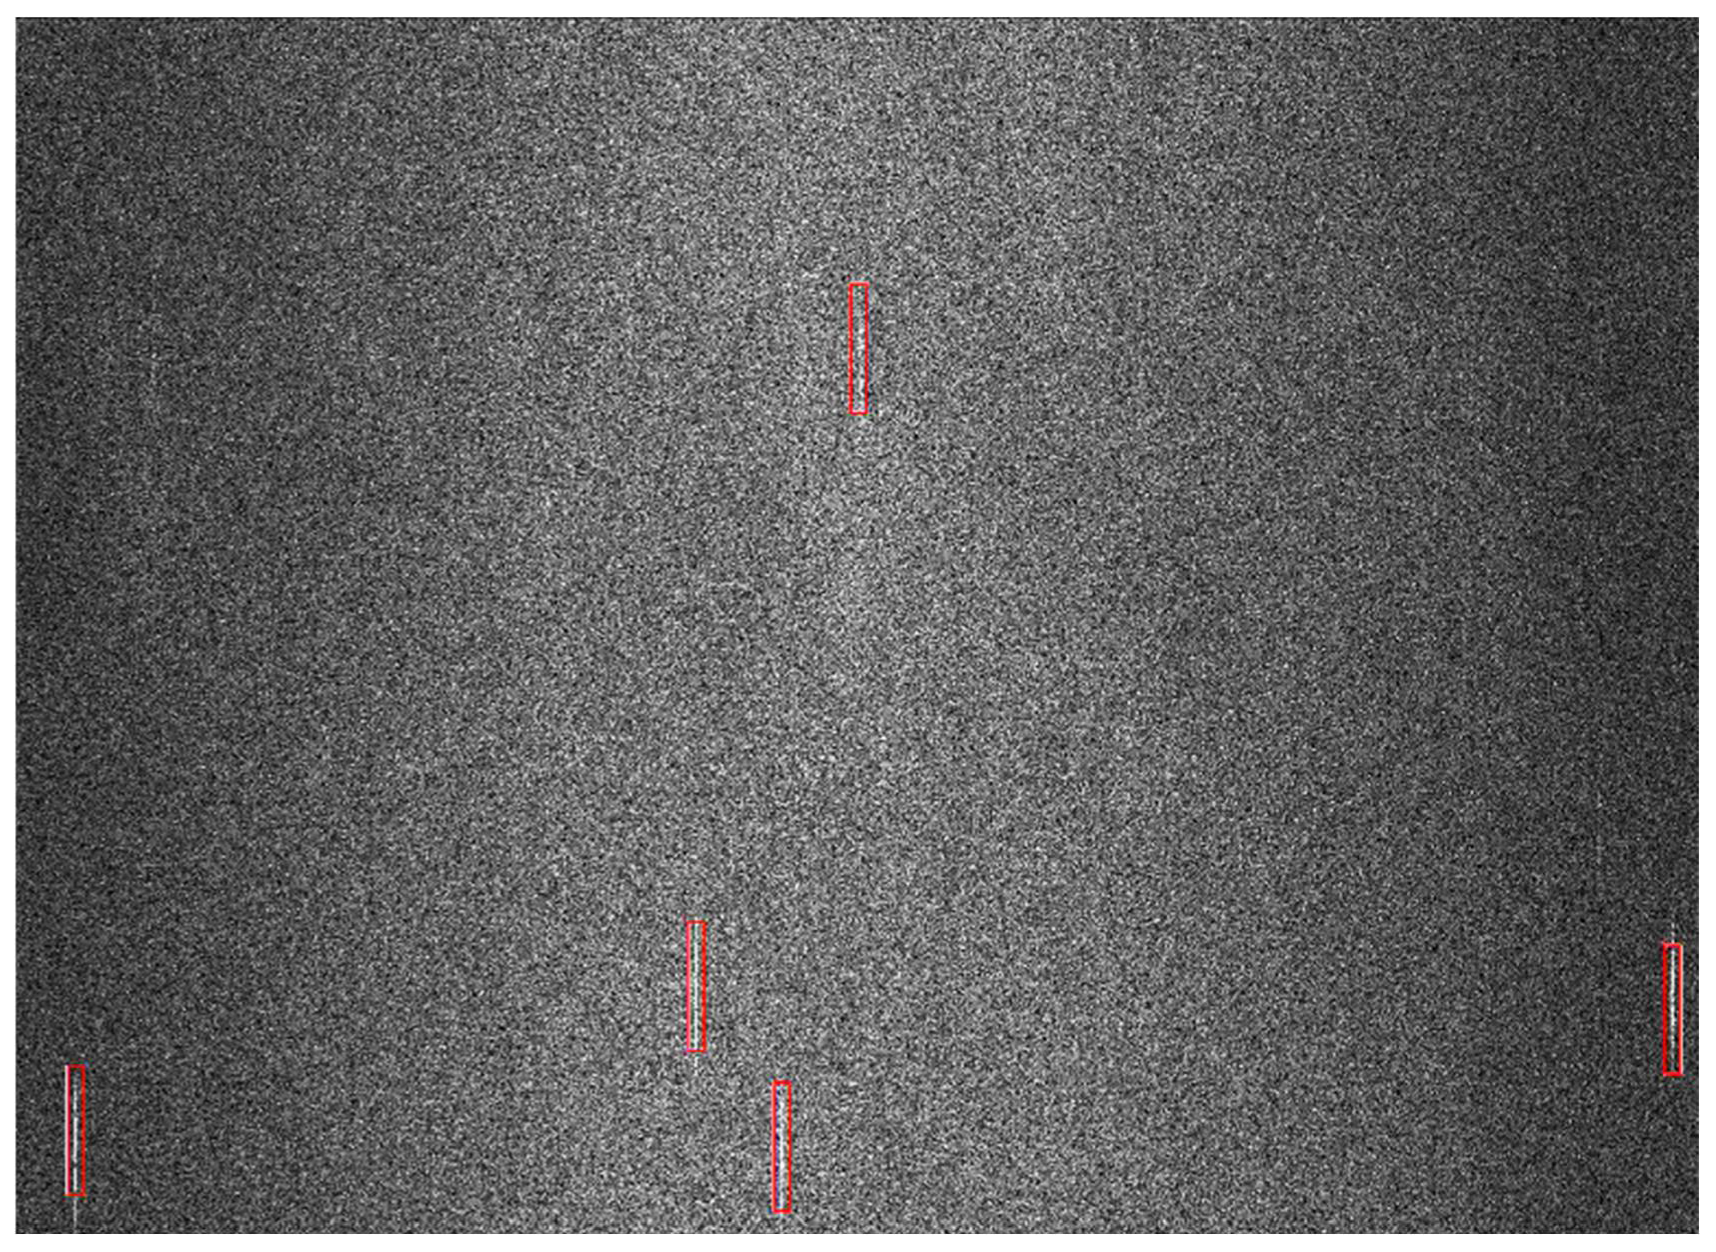
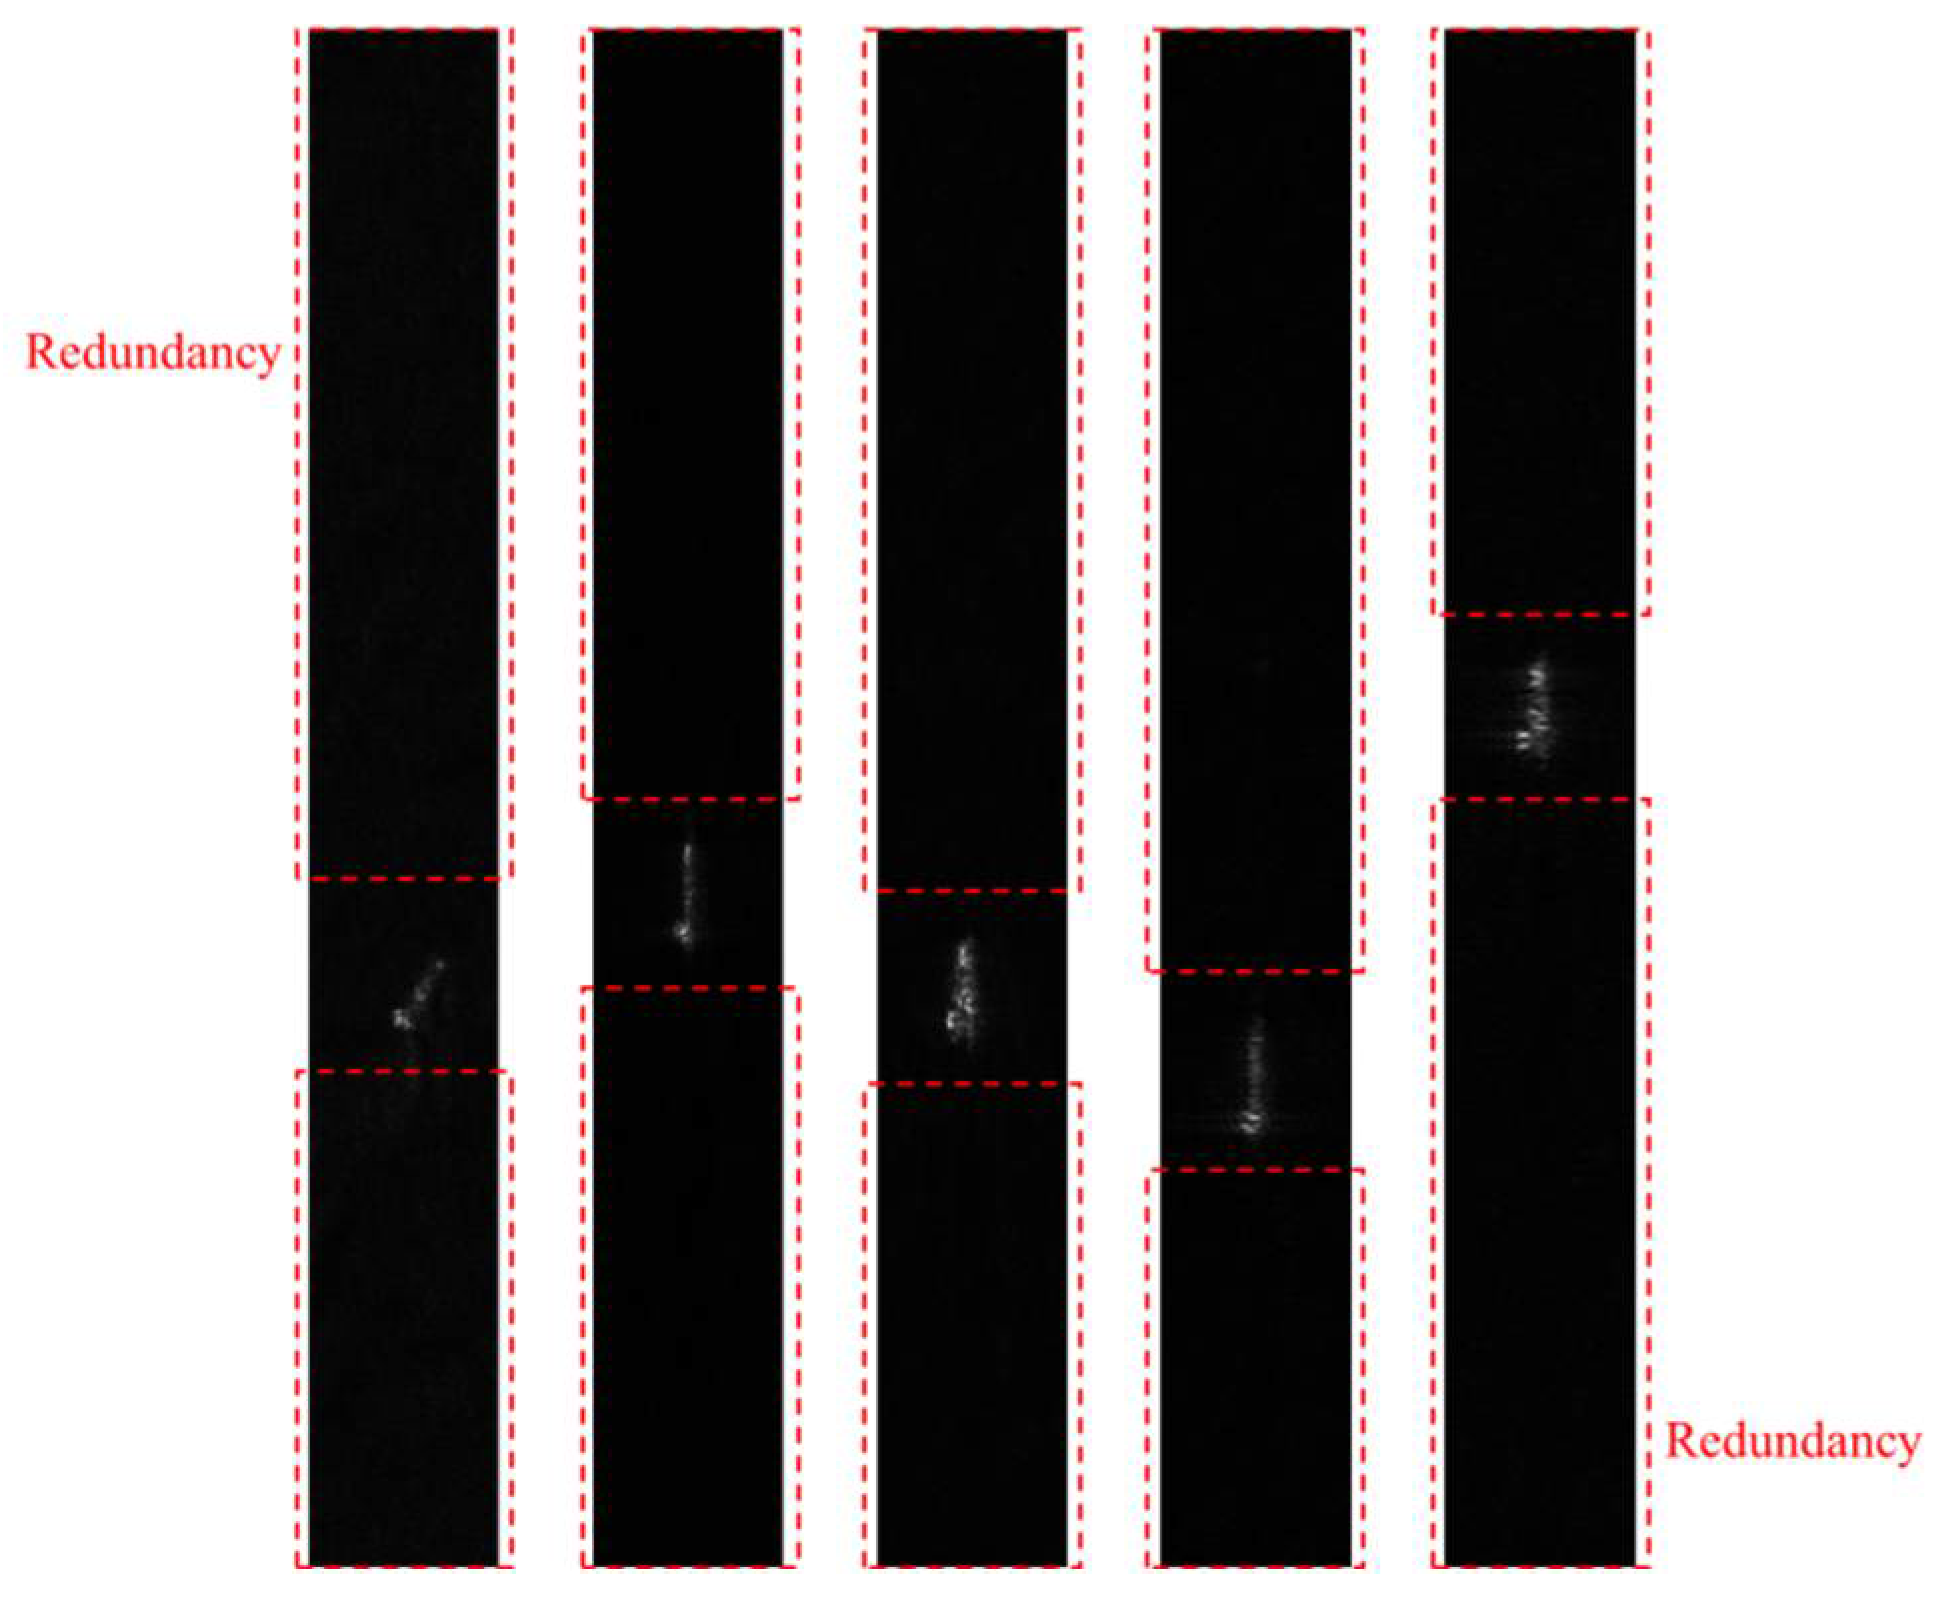
2.1.3. Azimuth Range Selection

According to the range gate sequence, the one-dimensional azimuth direction signals in the range-compressed domain are extracted. We performed segmented extraction, filtering, and merging by adjusting the scale and step size of the AMPD algorithm to narrow the azimuthal range in each one-dimensional signal. The selected data areas were combined with range gate sequence and fitting azimuth ranges.

2.1.4. Imaging and Quantization

Based on the selected data areas in the range-compressed domain, the corresponding signal blocks were extracted and further implemented to obtain the required SAR images. As the images still remain as an azimuthal redundancy, a “log + sin + exp” dynamic quantization method [4], which could increase the gray scale contrast, is utilized on the sliced images in place of the network’s original quantization algorithm. Then, we were able to exclude slices without targets through mean filtering.

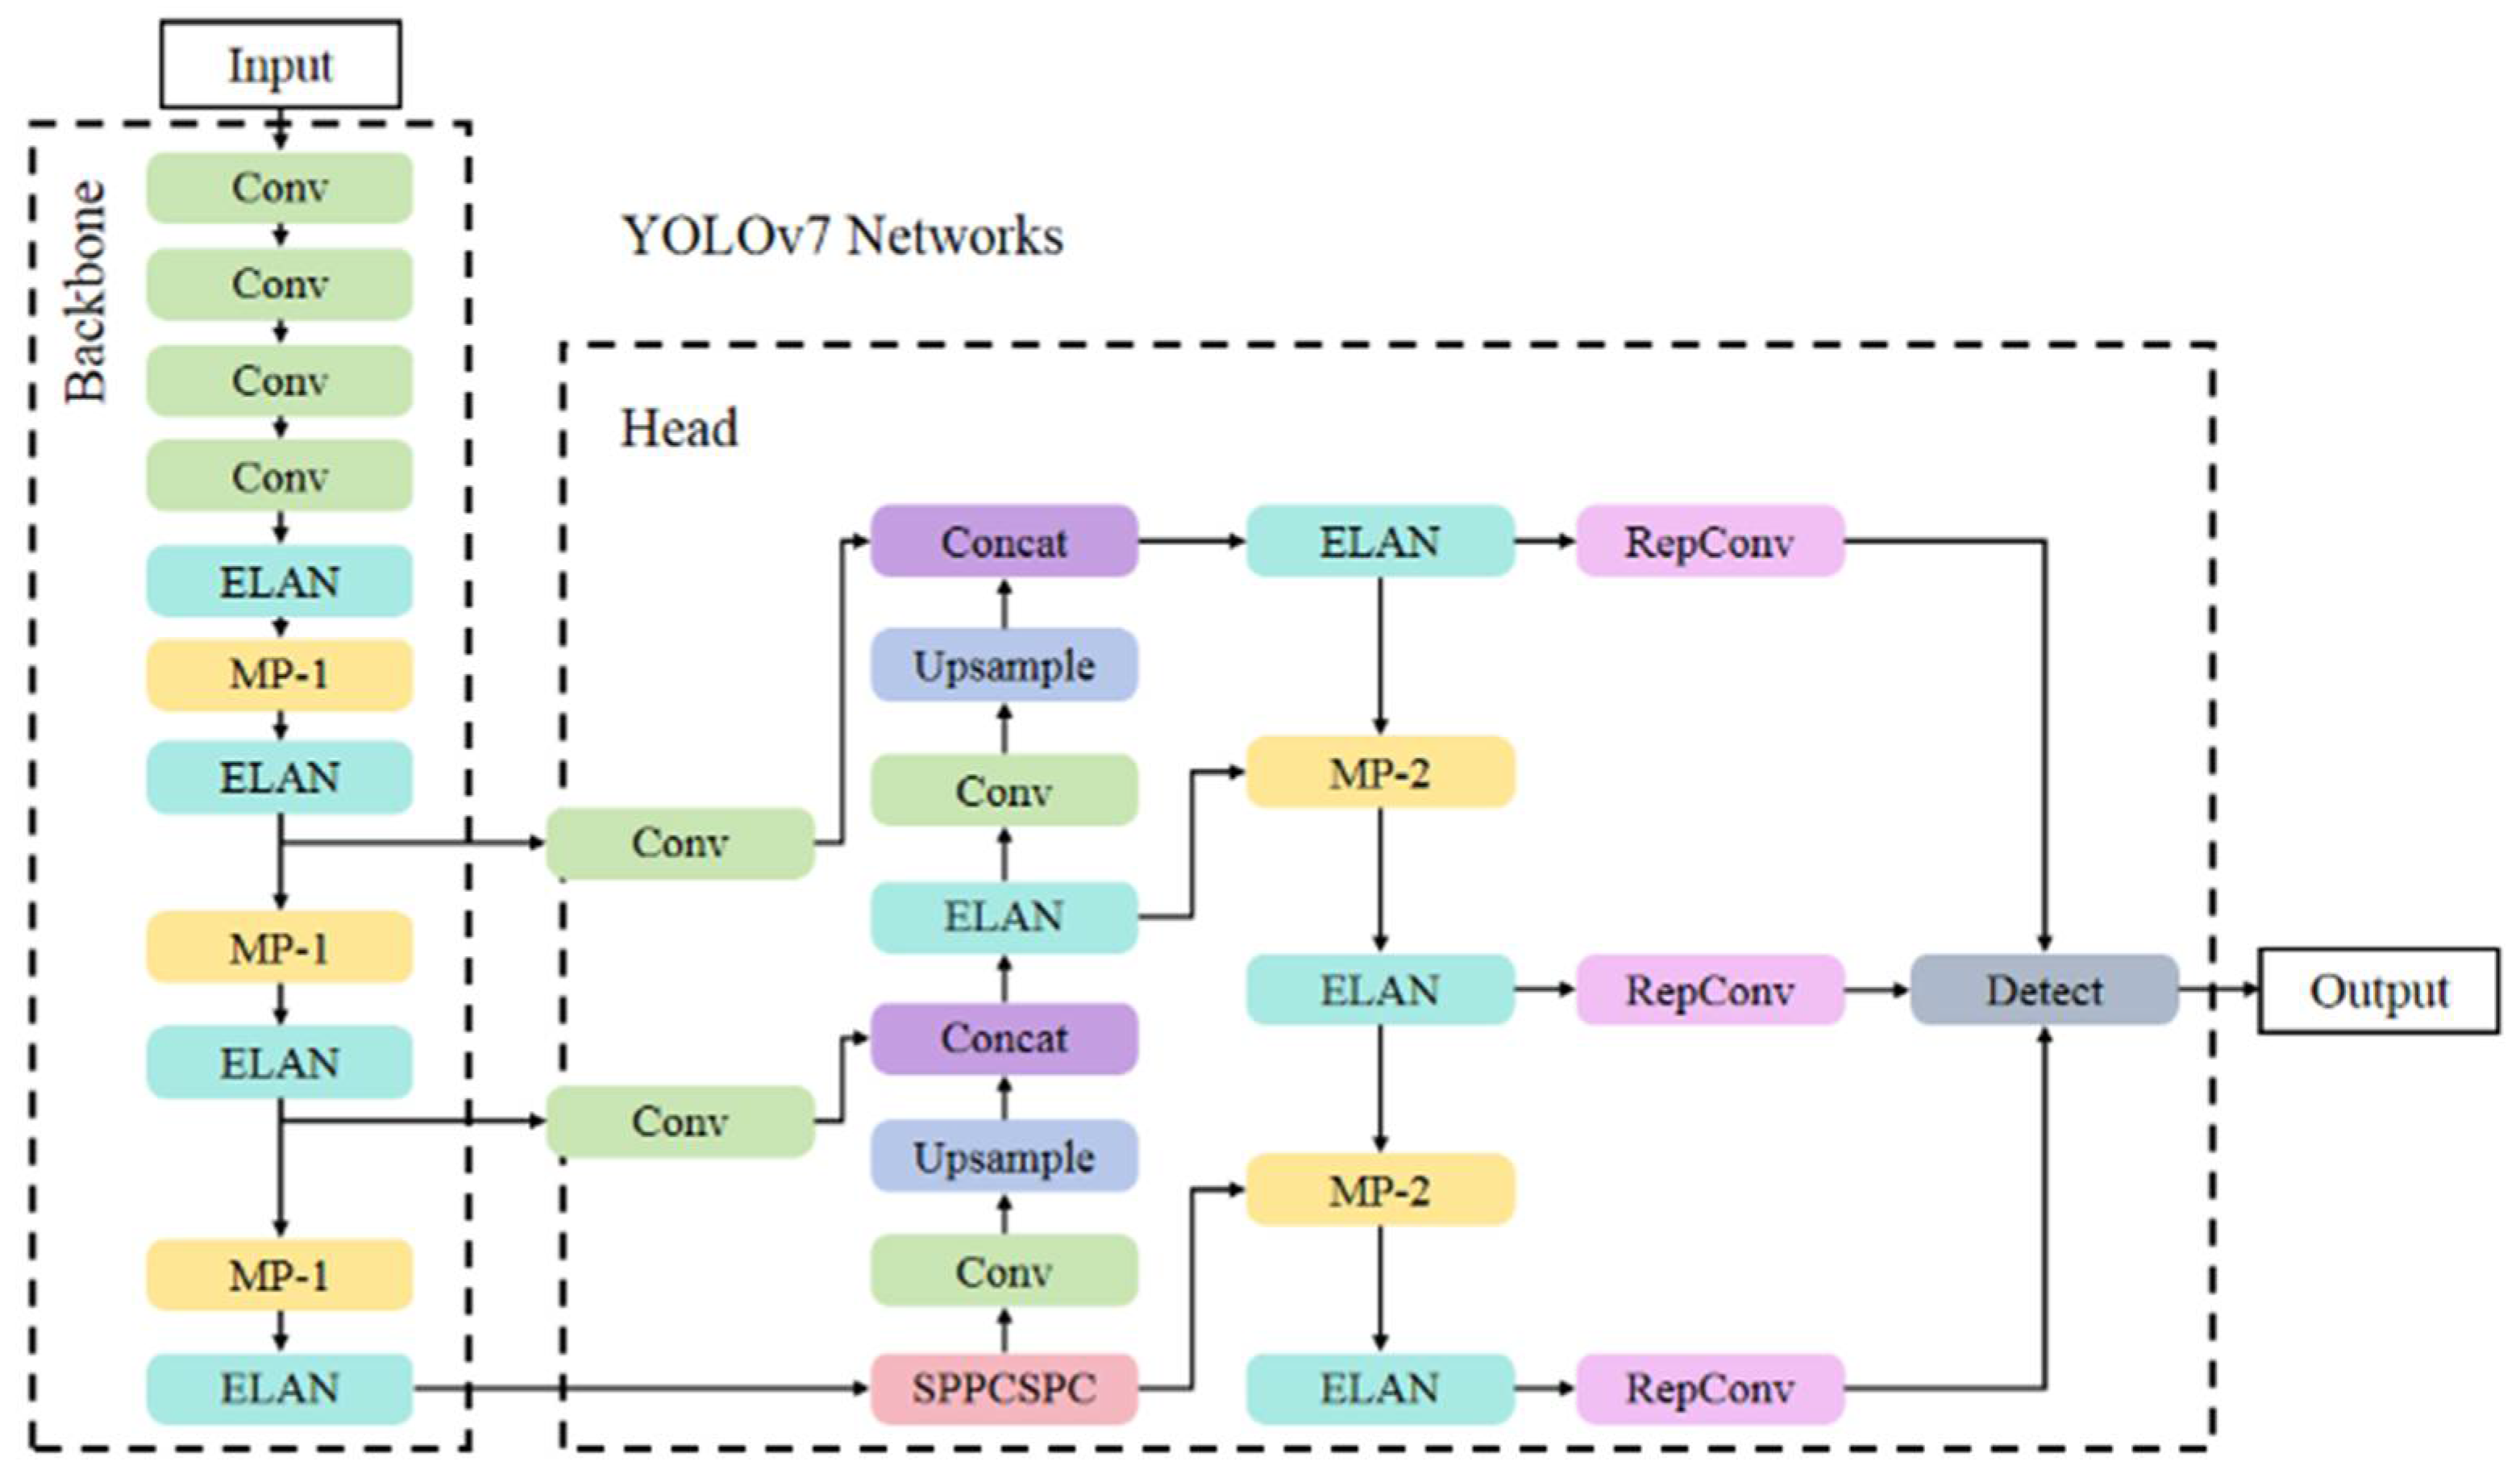
2.1.5. Lightweight Detection

The selected potential target slices can be directly input into the detection network. We chose the YOLOv7 deep learning network, as shown in Figure 2, which can effectively extract image features and capture detailed target information and context clues [30,54]. The model underwent weight pruning and neuron pruning, with fine-tuning of the parameters to ensure an acceptable accuracy loss for target detection.

2.2. Specific Implementation Method of ST-IIDF

Taking target detection as the final pursuit of data processing, we designed an integrated imaging and detection framework by adding data selection methods to accelerate the whole process. Based on the one-dimensional range compression data, we selected potential target data blocks in the range-compressed domain using a peak-to-valley detection method. After obtaining the images from the selected data, we filtered potential target slices in the image domain using a dynamic quantization method. Then the selected slices went straight into the trained lightweight YOLOv7 network, and the ship targets were successfully detected. By eliminating target-free data, the framework saved computational and time costs on only potential target areas to improve process efficiency. More details are stated as follows.

2.2.1. Range Compression

SAR raw echo s 0 ( τ , t ) is a linear frequency modulated pulse in the range direction t , and range compression can be achieved by the principle of matched filtering [5]. Firstly, the pulse is replicated, and zero-padding is performed to attain reference signal s r e f ( t ) . Subsequently, the discrete Fourier transform is applied as s r e f ( k ) = D F T ( s r e f ( t ) ) , and the frequency-domain matched filter kernel H ( k ) = s r e f * ( k ) · W ( k ) is generated by taking the complex conjugate and modulating it by the window function W ( k ) . Next, the raw echo is transformed into the range frequency domain through the discrete Fourier transform as D F T r a n g e ( s 0 ( τ , t ) ) and then multiplied by the previously generated frequency-domain matched filter. Finally, the matched filter is multiplied by the range frequency spectrum and then the inverse range Fourier transformation is performed, and the range-compressed time-domain signal s 1 ( τ , t ) = i D F T { D F T r a n g e ( s 0 ( τ , t ) ) · H ( k ) } is obtained [5].

2.2.2. Range Gate Selection

In order to enlarge the distinction between target-present and target-free areas, the two-dimensional SAR range-compressed domain data s 1 ( τ , t ) is accumulated along the azimuth direction, thereby obtaining the one-dimensional distribution of the signal in the range direction.
s r ( t ) = τ s 1 ( τ , t ) d τ
The statistical result of the acquired one-dimensional range-directed SAR data is illustrated in Figure 3.
Inverse-based on the longest size distribution of ship targets in the range direction, we assume that one ship target will only exist within three range gates. If a target spans continuous multiple range gates, the gate with highest energy is selected to represent the target. The one-dimensional range SAR amplitude distribution reveals that in wide-area offshore scenarios, the major oceanic areas are target-free sea surfaces with relatively small back-scattering coefficients. For the target-present areas, their signal amplitudes are evidently higher than those of the adjacent range gates. Owing to the significant impact of the range-directed antenna pattern, even if the targets possess identical scattering characteristics, their signal intensities will also exhibit notable differences at different range gate positions. Consequently, the scattering signal intensity of the ship target located at the edge of the range direction may even be lower than that of the sea clutter signal in central area, such as shown in Figure 3, which renders fixed threshold detection inapplicable.
Simultaneously, since the ship targets are randomly distributed, the one-dimensional signal lacks periodicity. So, the AMPD algorithm will detect all peaks in the signal, including numerous minute peaks caused by clutter interference. These minute peaks are strong distractors to screen out the range gates with potential ship targets.
Therefore, this paper proposes an improved peak and valley detection method based on the AMPD algorithm. Firstly, we use a normal AMPD algorithm to detect the peaks and valleys of the signal. The local maximum value is obtained through the utilization of the multi-scale sliding window, and ultimately the index sequence with the maximum number of maxima of the one-dimensional signal is acquired as:
{ p i } = m a x { i | s r ( i ) > s r ( i k ) s r ( i ) > s r ( i + k ) } , k = 1,2 , , [ N 2 1 ]
where N represents the number of sampling points of the one-dimensional signal. k stands for the multi-scale step size, and i is the local maximum range gate index within ( k , N k ) .
Considering extreme scenarios, to prevent exceeding the number of points in the range direction when calculating the sliding window area, the upper limit for selecting the multi-scale sliding window step size k is half of the number of sampling points in the azimuth direction, which can ensure detection under all parameter conditions. However, in practical applications, excessive step sizes are usually not used, and the specific value selection can be further narrowed down by combining the prior information of imaging resolution. This can further reduce the computational load and time consumption.
After peak detection, we obtain a peak sequence { p i } m with the length of the sequence being m . Analogously, by obtaining the local minimum value, the valley sequence { v j } n can also be obtained, with the length of sequence being n . The shorter sequence among the two sequences is padded with the last value to reach the length of u = m a x ( m , n ) , and then the ratio of the peak to the nearest valley is calculated as:
{ x l } u = s r ( p l ) s r ( v l ) u , l = 1, 2, , u
The peak-to-valley ratio of the range gates with potential targets should be significantly higher than that of the surrounding range gates. This indicates that the echo signal scattering intensity within this range gate is the extreme value of a single range gate after the antenna pattern is normalized. Therefore, the sequence of range gates with potential targets can be screened out as x μ u . According to the sequence index, the two-dimensional range-compressed domain data after range gate screening can be obtained as:
s 1 ( τ , t μ ) = s 1 ( τ , p μ | x μ > θ ) ,   x μ ϵ x l u
where θ > 1 is the threshold value of the peak-to-valley ratio, which can extract all the range gates containing ship targets and ensure the accuracy of the results. t μ u is the corresponding range gate sequence. The threshold determines the number of targets or clutter responses extracted, but in actual data, the threshold is affected by factors such as the satellite bands and antenna energy distribution. In the preliminary experimental analysis, we found that θ = 1.1 is a widely applicable setting for C and X band data. After the analysis and statistics on hundred level data, which covers general sea conditions among levels 1–4, this threshold can effectively extract target responses and suppress clutter to a large extent. Due to the fact that existing ocean observation data mainly consists of X and C bands, this threshold is generally suitable for the vast majority of target detection scenarios. Subsequent experiments have further demonstrated the effectiveness of this setting. Furthermore, with the accumulation of data, achieving the adaptive matching of threshold selection with bands and sea conditions will be the future optimization research for peak-valley detection.
The obtained t μ u is reasonable as the peak-to-valley ratio eliminates the influence of the antenna pattern and environmental noise. Figure 4 demonstrates the process from peak and valley detection to the derivation of the final range gate position.

2.2.3. Azimuth Range Selection

s 1 ( τ , t μ ) represents multiple one-dimensional azimuth data selected based on potential range gate sequence. First, filtering is performed to reduce the impact of noise, and then the amplitude distribution curve in the azimuth direction of the range-compressed domain signals in the potential target areas is obtained, as shown in Figure 5. The one-dimensional azimuthal signal has the characteristic of segmental amplitude distribution, so it is difficult to concentrate the range of potential target areas within a few Pulse Repetition Frequencies (PRFs).
Each one-dimensional signal is denoted as s μ ( τ ) . As observed in Figure 6, when a target is suspected to exist, the signal presents a continuous region in the azimuth direction that is significantly higher than the surrounding amplitudes. In terms of the focusing degree of signal intensity, it is not compact. This is because the azimuth direction has not undergone compression and focusing, so only a rough range can be obtained. However, it can still be distinguished from the ocean background. Firstly, the maximum point of the amplitude distribution curve is detected.
τ c = m a x [ s μ ( τ ) ]
Subsequently, combining with crucial prior information such as the actual size of the ship and the synthetic aperture time and following the principle of ensuring that all points of the target can be completely irradiated during the synthetic aperture time, a reasonable number of reference window points N a s t e p is set. Finally, with the detected maximum point τ c as the center, the reference window is used for interception to obtain the azimuth range as:
τ m i n , τ m a x = τ c N a s t e p 2 ,   τ c + N a s t e p 2
Through the above steps, by utilizing the peak detection in the range direction and azimuth direction as well as the signal extraction results, the potential ship target areas are initially determined, and the potential area data are screened out from the original range-compressed domain data as s 1 ( τ m i n , , τ m a x ; t μ ) . Figure 6 clearly displays the signal domain areas of potential ship targets, which greatly reduces the amount of data for subsequent imaging work.

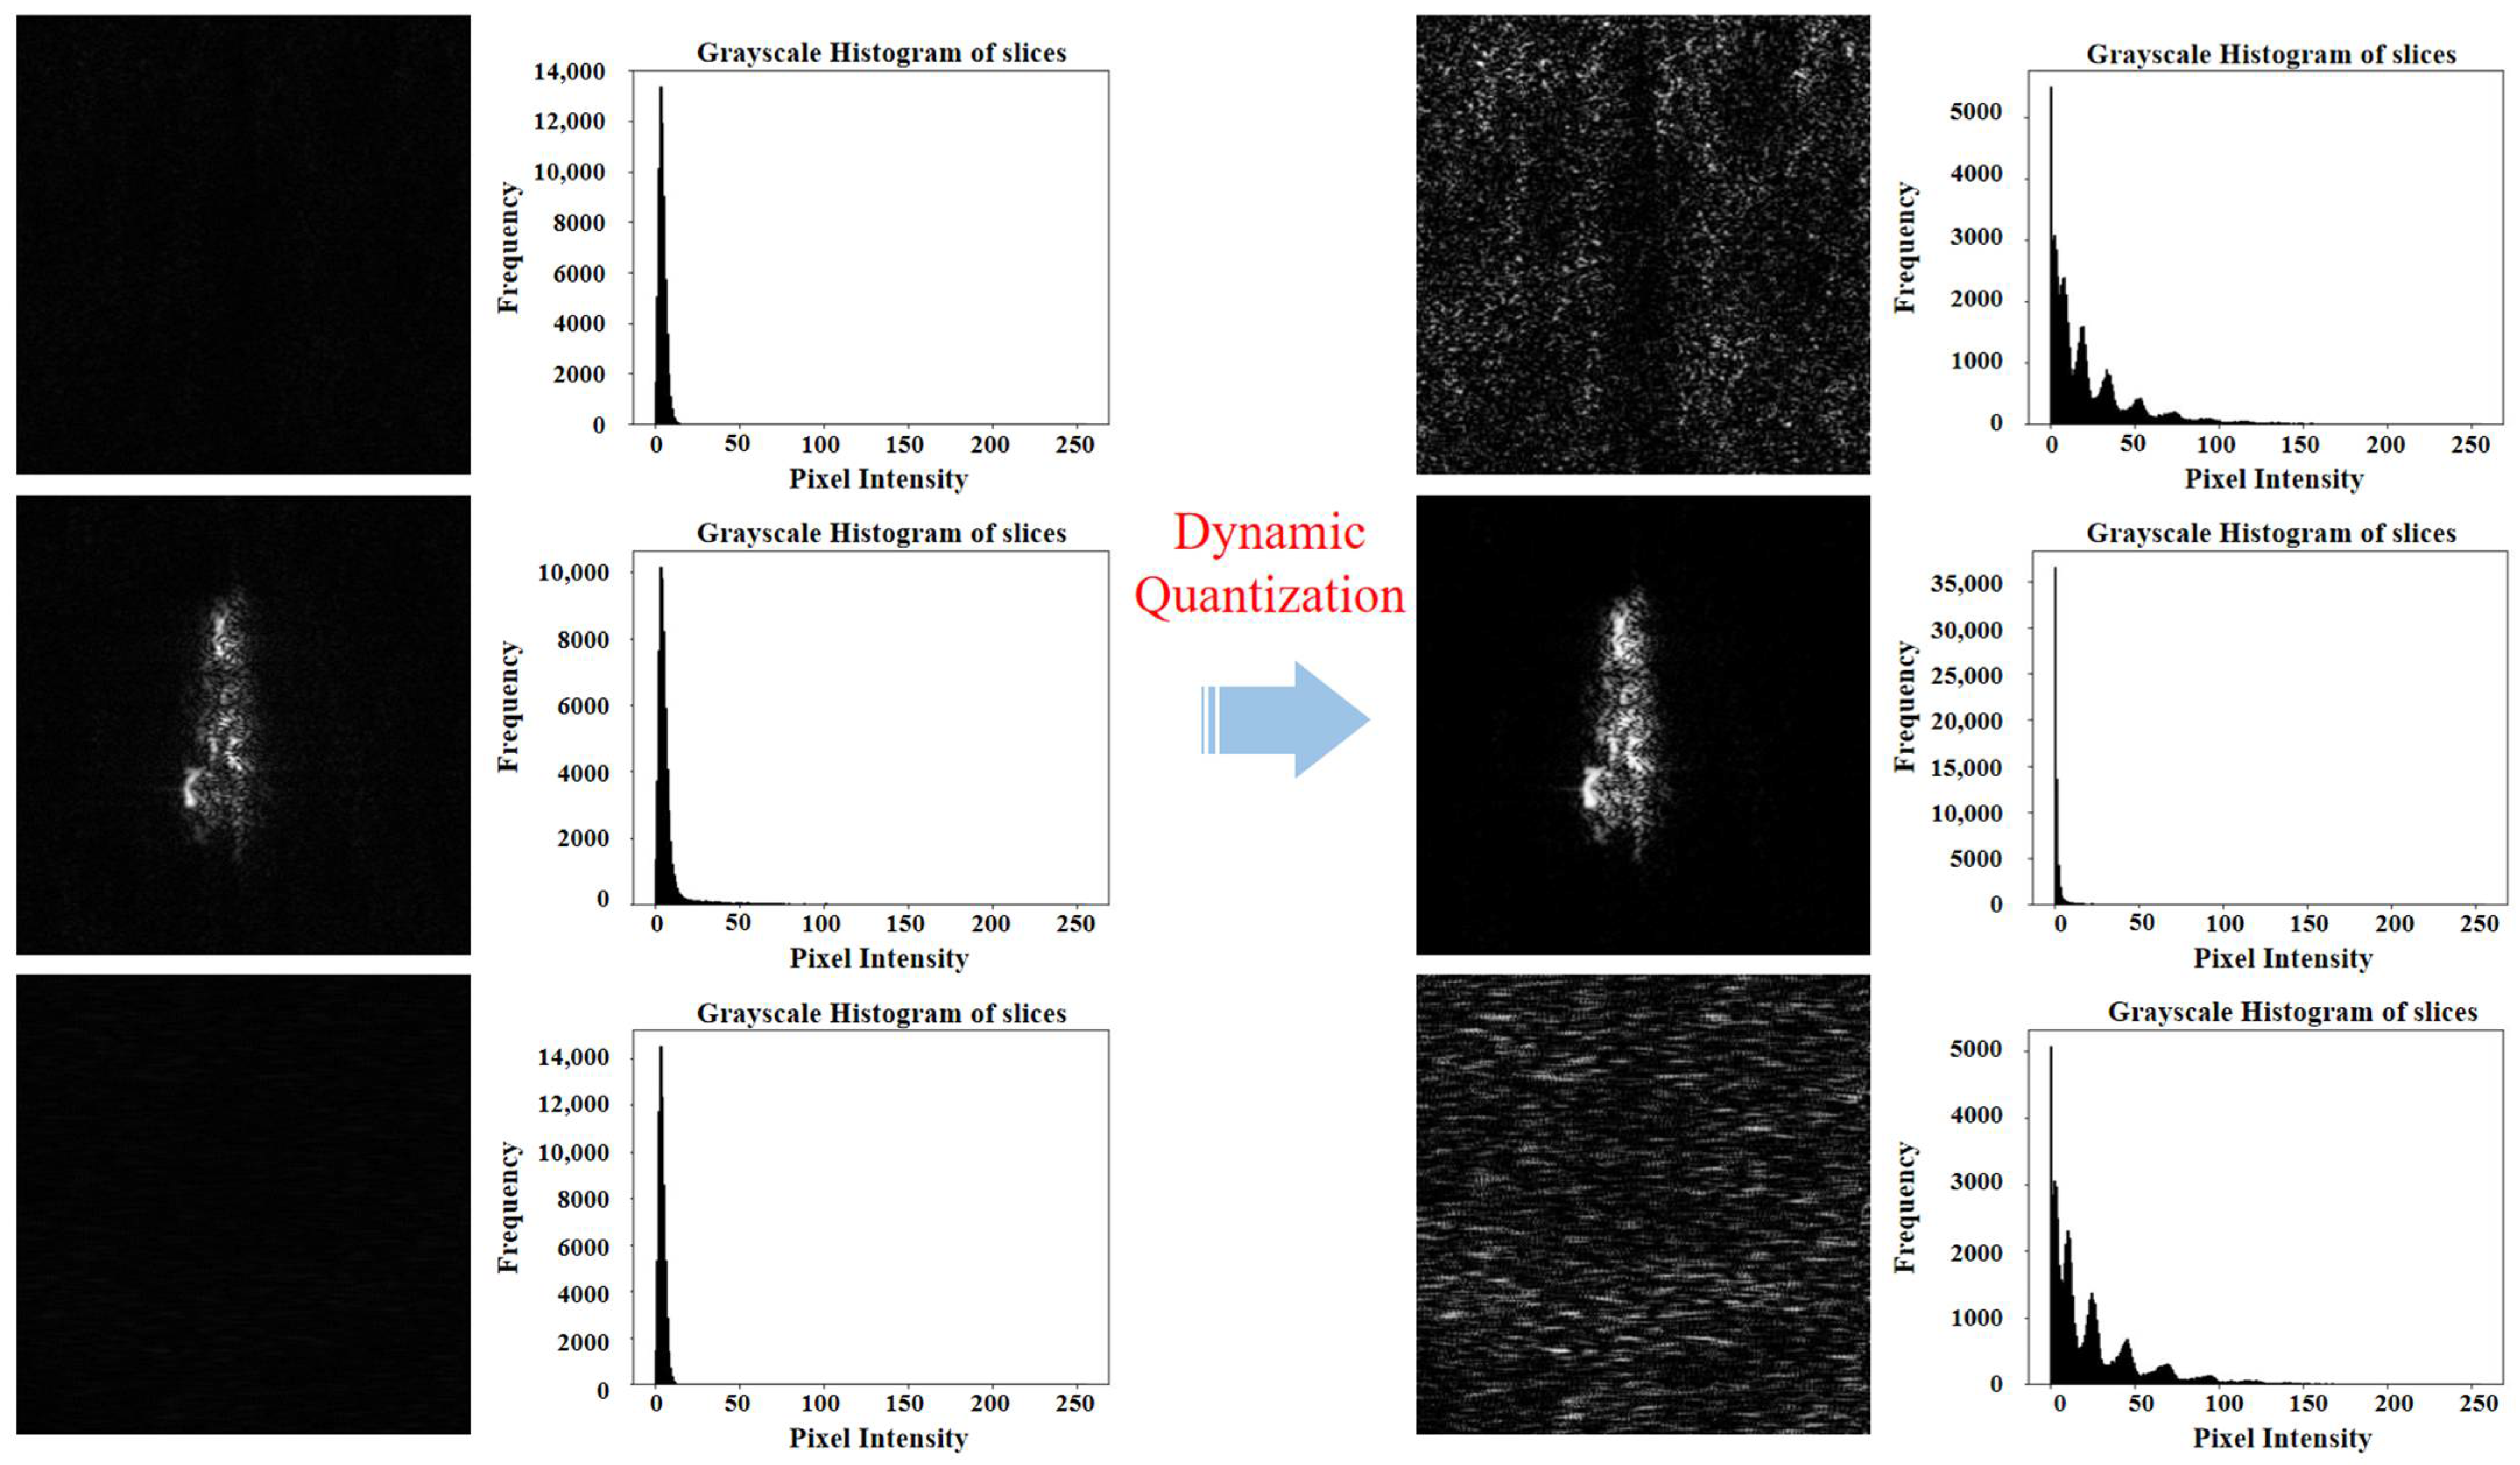
2.2.4. Imaging and Quantization

Given that the potential target area data s 1 ( τ m i n , , τ m a x ; t μ ) in the signal domain has already undergone range compression processing, the required two-dimensional focused image can be obtained by simply further implementing range migration correction and azimuth compression.
Since stripmap, TOPSAR, or scan modes are generally adopted when conducting large-scale observations in the open sea, this paper takes the stripmap mode as an example of imaging as the specific imaging algorithm is not the research focus. For the selected target area data, Doppler characteristic analysis is first carried out according to its position in the entire scene. In this working mode, the azimuth Doppler history of a point target is consistent with that of the entire scene, and the influence of the range position on Doppler parameters is mainly considered. Assuming that the size of the scene data is N a × N r , and the position center after coarse extraction is τ c , t μ , during imaging processing, the equivalent slant range model of the target as follows:
R ( t ; R ) = R 2 + ( v t ) 2 2 R v t c o s φ
where R is the slant range when t = 0 ; the beam center irradiating the target, v is the payload velocity; and φ represents the angle between the beam center and the velocity direction. For the extracted data block μ , the equivalent slant range model is as follows:
R ( t ; R μ ) = R μ 2 + v t t μ 2 2 R μ v ( t t μ ) c o s φ
where R μ is the slant range when the beam center irradiates the center of the data block μ . According to the definition of the Doppler parameters, the Doppler center frequency spectrum and the Doppler chirp rate of the sub-data block can be calculated. Then, the data is transformed to the range-Doppler domain through azimuth FFT, and range migration correction is completed through interpolation. Since the extracted data block is much smaller than the size of the original scene data, the amount of interpolation calculation will be greatly reduced compared with the complete processing of the entire scene image. Then, azimuth compression is achieved by using the updated Doppler parameters, and then the data is transformed to the two-dimensional time domain through the azimuth inverse Fourier transform. The imaging results I μ of each data block are shown in Figure 7 below.
The current size of the images is unsuitable for direct input into deep learning network as the azimuthal side would be resized to 640 pixels. So, we cut all images to slices of the same size. Because there is still redundancy in the azimuth direction of the original image, the slices could be divided into ones with and without ship targets. In order to select slices with potential targets before inputting into the target detection network, this paper proposes a dynamic quantization preprocessing method for slices in potential target areas in SAR images that combines sliding window detection, quantization, and quality improvement.
First, the SAR image is cut along the azimuth direction with overlap to ensure that the target will not be divided into two parts when generating the target area, and Gaussian filtering is used to suppress sharp noise. The obtained slices are denoted as I 0 . Then, each image slice I 0 is quantified according to a dynamic quantization method of “logarithm + sine + exponential”, as proposed in this paper. First, a log stretching operation is performed on the gray scale matrix of each slice as:
I 1 = l o g ( I 0 + 1 )
which can compress the original high gray scale value regions in each slice, expand the gray scale distribution range of the ocean background, and enlarge the gray scale change range of the ocean background.
Next, Lee filtering [4] is performed on the current slice to suppress the speckle noise in the image and reduce the image blurriness as follows:
I 2 = 1 s 2 k , l = 1 s I 1 ( k . l ) + σ N 2 s 2 k , l = 1 s d ( k k 0 , l l 0 ) d 1 2
where s represents the size of the filter, k and l are the horizontal and vertical coordinates of each pixel point in the filter, respectively, d ( k k 0 , l l 0 ) represents the distance between each pixel point in the filter’s gray scale matrix and the center point of the filter, k 0 and l 0 are the horizontal and vertical coordinates of the center point of the filter, respectively, d 1 2 represents the sum of the squares of the distance, σ N 2 represents the estimated noise variance, and I 2 represents the filtered gray scale matrix.
Finally, an operation combining sine and power functions is designed to map the scattering intensity range of the SAR image slice from 0 to MAX to the unified gray scale range from 0 to 255 as follows:
I 3 ( x , y ) = s i n ( I 2 ( x , y ) I 2   m i n I 2   m a x I 2   m i n 1 2 ) π n × 255
where I 2 ( x , y ) represents the gray scale value of the pixel point with the coordinates ( x , y ) in the filtered gray scale matrix, I 2   m i n and I 2   m a x are the minimum and maximum gray scale values of the pixel points in the filtered gray scale matrix, respectively, and I 3 ( x , y ) represents the gray scale value of the pixel point with the coordinates ( x , y ) in the final gray scale matrix I 3 .
Within the limited gray scale range, although the brightness of the slices with target areas is reduced, it can still ensure that there is a large contrast between the target and the background because during the dynamic quantization process, due to the high gray scale of the target, the background will not be stretched to an overly large gray scale region, and the energy is still concentrated on the target. For the sea surface background, through the treatment of the dynamic quantization matrix, it will be evenly distributed throughout the gray scale range. Figure 8 shows the changes in a group of slices before and after gray scale dynamic quantization. Reflected in the gray scale values, we find that the slices without targets have a higher average gray scale value, while the slices with targets have a concentrated energy and a lower average gray scale value. Therefore, threshold filtering can be carried out according to the average gray scale value of the image to obtain the target area image I t a r , and these slices can be directly input into the deep learning model.

2.2.5. Lightweight Detection

After filtering in both the signal and image domains, ship target interference is minimal, leaving feature quantities with low influence during network inference. Thus, sparse and pruning operations on the model enable high-precision and high-speed detection, accurately differentiating ship targets from interferences and efficiently completing integrated imaging and detection. To further cut parameters and boost efficiency, the YOLOv7 model undergoes weight and neuron pruning. Sensitivity analysis gives importance scores for each feature weight parameter. Specific pruning ratios are applied to set the least important weights and neurons to zero, shrinking the model. Also, training parameters are fine-tuned, and the iteration number is increased to maintain target detection accuracy.
Based on the high-resolution SAR ship target images from thePujiang-2 satellite and Hisea-1 satellite (from the Tianyi Research Institute, Changsha, China), a target detection dataset was constructed. This dataset covers both the C-band and X-band and includes ship images of different types, angles, and scales. We quantized the images containing the target regions and extracted the target areas. Through operations such as cropping, resizing, and normalization, the differences between the images were eliminated, enhancing the generalization ability of the model. Finally, 501 slices with a size of 128 × 128 were obtained, which include various types of ship targets such as small boats, bulk carriers, container ships, and pleasure boats. For sea clutter and other interferences, the SAR ocean data under different sea conditions were selected, and the interference category dataset was acquired in the form of sliding window slices. This dataset contains a total of 523 slices with a size of 128 × 128. Some slices in the dataset are shown in Figure 9.
The classification dataset contains a total of 1024 SAR image slices. Divided according to the ratio of 4:1, the training set includes 820 real SAR image slices, while the testing set contains 204 real SAR image slices. The lightweight YOLOv7 network was compared with other network models and the original non-lightweight model, with the results shown in the following Table 1.
As shown in Table 1, the lightweight YOLOv7 detection network model has been compressed by more than 2 times in terms of model size, while the detection performance has not been significantly degraded compared to the original model. It also outperforms the SSD and Faster R-CNN models under the same conditions. Therefore, this network can be used as the experimental detection algorithm for the integrated framework of space-borne SAR long-range large-scene imaging and detection.

3. Experimental Results

3.1. Implementation Details

All the experiments in Section 3.1 and 3.2 were carried out under the hardware configuration displayed in Table 2. The proposed integrated imaging and detection framework was tested using several wide-area offshore SAR echo scenes from the Pujiang-2 and Hisea-1 SAR satellites, each with pixel dimensions exceeding 15,000 × 25,000. Comparative evaluations against the traditional cascaded imaging-detection approach under identical algorithmic configurations demonstrated the framework’s efficacy in both target detection accuracy and computational time reduction. The hardware environment for conducting the experiment is shown in Table 2.

3.2. Experimental Data

Due to the proposed framework is based on large-scale SAR echo data for rapid detection of ship targets. However, most of the existing public SAR ship datasets are target slices in the image domain which cannot achieve the non-image domain signal detection proposed in the framework, it is also difficult to intuitively test the timeliness improvement under large-scale computation on such datasets. Therefore, to verify the effectiveness of the proposed integrated framework for wide-area imaging detection in the open sea and the two potential target region extraction algorithms, we selected the original echo data from the Pujiang-2 and Hisea-1 SAR satellites for testing. The satellites work in the stripmap mode, with a resolution of 1 m and 3 m and a swath width of 20–40 km. It contains multiple sets of open ocean observation data at different times and geographical locations, covering ship targets of different sizes, shapes, and backgrounds to verify the reliability of the model. The main related parameters of the experimental satellite data are shown in Table 3.

3.3. Real Scenario Results

In the experiments based on Pujiang-2 and Hisea-1, we verified the effectiveness of the proposed ship target imaging detection and framework for target detection tasks through real scene data and fully proved the progressiveness timeliness of the proposed framework compared with traditional processing flow by counting the running time under the same hardware environment.
Taking three complete wide-area offshore SAR raw echo data as examples, the SAR echo information is listed as Table 4, and the entire processing flow is shown through the imaging detection integrated framework as Figure 10, Figure 11 and Figure 12.

4. Discussion

4.1. Fundamental Analysis

After the original data is processed by the integrated imaging and detection framework, the ship targets are effectively detected. In the target area selection stage, to avoid missing ship targets during the screening process in the range-compressed domain, when we use the same preset threshold, it is possible to include some clutter with strong scattering. Meanwhile, since it is difficult to ensure that the target energy is confined to a single range gate, there may also be situations where adjacent range gates all contain potential targets, resulting in overlapping anchor boxes. That is why the framework completely extracts all potential target areas in range-compressed domain, including some false alarm areas. After the selected potential target areas are processed by subsequent imaging, sliced and screened through image domain quantification, and input into the target detection network, the framework can successfully eliminate interference clutter and achieve the rapid detection and localization of ship targets.
It is worth mentioning that the improved peak-valley detection algorithm can filter out adjacent range gate units, and the final detection result of ship targets is obtained from the image domain. Ship targets with close distributions in the range and azimuth directions will be effectively distinguished by imaging operations and then detected separately in the image to avoid missed detections of adjacent targets. At the same time, false alarms generated by islands or small land during the potential area screening stage may also be effectively filtered by YOLO network due to their image domain features not matching the ship target.
In addition, the ship targets extracted based on imaging and detection frameworks were compared with the true values obtained from direct imaging processing. Preliminary analysis shows that the proposed framework is applicable to large ships with a length exceeding 100 m. These ship targets can generate sufficient signal response at the range gate unit and can be effectively extracted in the “peak valley detection” stage of the efficient detection process and further detected by deep learning networks in the image domain. At the same time, as the main component of ocean-going vessels, this type of target accounts for the vast majority in wide area sea scenarios. The framework proposed in this paper has high performance for such targets and fully demonstrates its application capability.

4.2. Comparison Analysis

We also examined the advantages of the overall imaging detection process in timeliness. Therefore, we conducted detailed statistics on the targets in all scenes, specifically including the total number of manually labeled ships, the number of areas extracted in the range-compressed domain, slices selected in image domain, correctly detected targets, falsely detected targets, missed targets, as well as the time used in the integrated framework and the time used in the traditional process under the same data and the same imaging detection algorithm. The time spent in each scenario is averaged by three measurements. By dividing the two total times, we obtained the acceleration multiple of the integration framework proposed in this paper compared with the traditional method. The results are shown in Table 5.
By analyzing various indicators, it can be seen that the proposed imaging detection integrated system has a good effect on target detection. All ten of the wide-area offshore scenes contain 33 ship targets. The first eight experiment data are from the X-band Pujiang-2 satellite and the last two experiment data are from the C-band Hisea-1 satellite. The integrated framework extracted 57 range compression domain signal blocks, selected 37 potential target slices, and correctly detected 33 targets. The signals of the ship targets are redundantly selected in the range compression domain. The extra potential target areas are cluttered with high scattering intensity, which is successfully eliminated by dynamic quantization after imaging. The final ship target detection results were consistent with the real image annotation results, which verified the effectiveness of the proposed framework.
When using the same imaging and detection algorithms, the processing framework proposed in this paper is 35.95 times average faster than the traditional cascaded approach and remains the detection accuracy. Both the imaging and detection algorithms are calculated using a single core, and acceleration methods such as GPU parallel computing are not adopted. It can be seen that the fewer the number of ship targets, the higher the acceleration multiple of the integrated imaging and detection process can be, which can even exceed 50 times when there exists only one target in the areas of size 21,789 × 23,552 and 40,001 × 26,368. These results demonstrate that the framework proposed in this paper has a significant advantage in timeliness for ship target detection tasks in wide-area offshore scenarios.

5. Conclusions

In this paper, to improve the processing efficiency of wide-area offshore SAR data in practical engineering, a SAR integrated imaging and detection framework is proposed. The steps of selecting potential ship target areas in both the range compression and image domain are added to reduce the amount of data that needs to be processed in the following imaging and detection processes, thereby significantly improving the processing speed from SAR echo data to ship target position information, and making the obtained information retain a higher timeliness value. Based on the actual wide-area offshore SAR echo data, the framework, especially the effectiveness of the potential target area selection method, is verified. The overall accuracy can be guaranteed to reach 90%, and the data processing efficiency is improved by 35.95 times on average, compared with the traditional imaging and detection process using the same algorithms. Since the method screens the target areas with data in the range compression area and images in quantization, two steps are both necessary for the imaging and detection algorithms, which indicate that the framework has a strong versatility as the algorithms are replaceable. For the ship target detection task in wide-area offshore scenarios, this framework has extraordinary application advantages and prospects.
In practical applications, more advanced object detection networks can be replaced to achieve higher accuracy, or lightweight models can be used to further reduce computational parameters to adapt to more hardware platforms. This indicates that the proposed framework has a strong generalization performance. It is worth mentioning that the efficient imaging detection framework for ship targets proposed in this article is a universal computing framework, which can be transplanted and deployed on customized hardware platforms such as FPGA and embedded in systems by optimizing specific algorithms in each stage of the process. This provides an effective solution for on-board real-time applicability of SAR ship target imaging detection.
But the framework is not perfect. On the one hand, the method is strictly limited to the wide-area offshore scenes, which means the sparsity of ship targets and no land interference. The experiment shows that the more the number of targets, the lower the acceleration ratio. Land, as a strong scattering and wide-area interference term, will lead to the inability to screen out a large number of range gate sequences in the range-compressed domain, which will affect the overall acceleration effect. On the other hand, the range selection method leads to unavoidable false alarm conditions to assure no potential missing target. Also, the potential azimuthal range is redundant as for the necessity of imaging, so there exist improvements in efficiency. Future research would pursuit how to further accelerate the process from SAR echo to target detection and use the data and results to reasonably explore more potential information such as the target identification and background condition. While optimizing the processing algorithms, the generalization advantage of the proposed framework also needs to be fully utilized, and porting the imaging and detection processing flow onto hardware platforms such as FPGA will also be another future research focus.

Author Contributions

Conceptualization, W.Y. and C.L.; methodology, C.S. and W.Y.; software, Y.P. and C.S.; validation, H.Z., Y.W. and J.C. (Jie Chen 2); formal analysis, W.Y.; investigation, Y.W.; resources, J.C. (Jie Chen 1) and Z.H.; data curation, W.X.; writing—original draft preparation, C.S. and Y.P.; writing—review and editing, H.Z.; supervision, W.Y.; project administration, J.C. (Jie Chen 2). All authors have read and agreed to the published version of the manuscript.

Funding

This research was funded by National Natural Science Foundation of China grant number No. U23B2007 and National Key Research and Development Program of China grant number No. 2023YFC3305901. And The APC was funded by National Natural Science Foundation of China grant number No. U23B2007.

Data Availability Statement

We are appreciate to Tianyi Research Institute (Changsha, China) and other relevant units for providing dataset in our research. The raw data supporting the conclusions of this article will be made available by the authors on request. Please contact the corresponding author in email.

Conflicts of Interest

The authors declare no conflict of interest.

References

  1. Ren, Y.; Zheng, M.; Zhang, L.; Fan, H.; Xie, Y. An adaptive false target suppression and radial velocity estimation method of moving targets based on image-domain for high-resolution and wide-swath SAR. IEEE Trans. Geosci. Remote Sens. 2024, 62, 5211718. [Google Scholar] [CrossRef]
  2. Li, C.S.; Wang, W.J.; Wang, P.B.; Chen, J.; Xu, H.P.; Yang, W.; Yu, Z.; Sun, B.; Li, J.W. Current situation and development trend of space-borne SAR technology. J. Electron. Inf. Technol. 2016, 38, 229–240. (In Chinese) [Google Scholar] [CrossRef]
  3. Lv, J.; Zhu, D.; Geng, Z.; Chen, H.; Huang, J.; Niu, S.; Ye, Z.; Zhou, T.; Zhou, P. Efficient target detection of monostatic/bistatic SAR vehicle small targets in ultracomplex scenes via lightweight model. IEEE Trans. Geosci. Remote Sens. 2024, 62, 5225120. [Google Scholar] [CrossRef]
  4. Su, C.; Pan, Y.; Yang, W.; Wang, Y.; Zeng, H.; Li, C. An integrated method for fast imaging and detection of lightweight intelligent ship targets. In Proceedings of the IGARSS 2024—2024 IEEE International Geoscience and Remote Sensing Symposium, Athens, Greece, 7–12 July 2024; pp. 9268–9272. [Google Scholar] [CrossRef]
  5. Cumming, I.G.; Wong, F.H. Digital Processing of Synthetic Aperture Radar Data: Algorithms and Implementation; Artech House: Norwood, MA, USA, 2005. [Google Scholar]
  6. Li, B.; Liu, S.; Gu, P.; Huang, Y.; Wu, Y. High-resolution imaging algorithm based on back projection for bistatic SAR. Inf. Technol. 2019, 02, 39–48. (In Chinese) [Google Scholar] [CrossRef]
  7. Walker, J.L. Range-Doppler imaging of rotating objects. IEEE Trans. Aerosp. Electron. Syst. 1980, AES-16, 23–52. [Google Scholar] [CrossRef]
  8. Raney, R.K.; Runge, H.; Bamler, R.; Cumming, I.G.; Wong, F.H. Precision SAR processing using chirp scaling. IEEE Trans. Geosci. Remote Sens. 1994, 32, 786–799. [Google Scholar] [CrossRef]
  9. Giroux, V.; Cantalloube, H.; Daout, F. An omega-K algorithm for SAR bistatic systems. In Proceedings of the 2005 IEEE International Geoscience and Remote Sensing Symposium (IGARSS), Seoul, Republic of Korea, 29 July 2005; pp. 1060–1063. [Google Scholar] [CrossRef]
  10. Zuo, S.; Sun, G.; Xing, M.; Chang, W. A modified fast factorized back projection algorithm for the spotlight SAR imaging. In Proceedings of the 2015 IEEE 5th Asia-Pacific Conference on Synthetic Aperture Radar (APSAR), Singapore, 1–4 September 2015; pp. 756–759. [Google Scholar] [CrossRef]
  11. Wu, Y.; Li, B.; Zhao, B.; Liu, X. A fast factorized back-projection algorithm based on range block division for stripmap SAR. Electronics 2024, 13, 1584. [Google Scholar] [CrossRef]
  12. Ulander, L.M.; Hellsten, H.; Stenstrom, G. Synthetic-aperture radar processing using fast factorized back-projection. IEEE Trans. Aerosp. Electron. Syst. 2003, 39, 760–776. [Google Scholar] [CrossRef]
  13. Moreira, A.; Mittermayer, J.; Scheiber, R. Extended chirp scaling algorithm for air- and spaceborne SAR data processing in stripmap and scanSAR imaging modes. IEEE Trans. Geosci. Remote Sens. 1996, 34, 1123–1136. [Google Scholar] [CrossRef]
  14. Zhang, H.; Zuo, W.; Liu, B.; Li, C.; Li, D.; Duan, C. An extended frequency scaling algorithm for bistatic SAR with high squint angle. IEEE Access 2023, 11, 20063–20078. [Google Scholar] [CrossRef]
  15. Finn, H.M. A CFAR design for a window spanning two clutter fields. IEEE Trans. Aerosp. Electron. Syst. 1986, AES-22, 155–169. [Google Scholar] [CrossRef]
  16. Færch, L.; Dierking, W.; Hughes, N.; Doulgeris, A.P. A comparison of constant false alarm rate object detection algorithms for iceberg identification in L- and C-band SAR imagery of the Labrador Sea. Cryosphere 2023, 17, 5335–5355. [Google Scholar] [CrossRef]
  17. Lowe, D.G. Distinctive image features from scale-invariant keypoints. Int. J. Comput. Vis. 2004, 60, 91–110. [Google Scholar] [CrossRef]
  18. Gao, F.; Huang, T.; Wang, J.; Sun, J.; Yang, E.; Hussain, A. Combining deep convolutional neural network and SVM for SAR image target recognition. In Proceedings of the 2017 IEEE International Conference on Internet of Things (iThings) and IEEE Green Computing and Communications (GreenCom) and IEEE Cyber, Physical and Social Computing (CPSCom) and IEEE Smart Data (SmartData), Exeter, UK, 21–23 June 2017; pp. 1082–1085. [Google Scholar] [CrossRef]
  19. Mallat, S.G. A theory for multiresolution signal decomposition: The wavelet representation. IEEE Trans. Pattern Anal. Mach. Intell. 1989, 11, 674–693. [Google Scholar] [CrossRef]
  20. Latif, I.H.; Abdulredha, S.H.; Hassan, S.K.A. Discrete wavelet transform-based image processing: A review. Al-Nahrain J. Sci. 2024, 27, 109–125. [Google Scholar] [CrossRef]
  21. Jolliffe, I.T. Principal Component Analysis, 2nd ed.; Springer: New York, NY, USA, 2002. [Google Scholar]
  22. Xiao, S.Y.; Xu, H.P.; Sun, B.; Liu, W. Modified Morphological Component Analysis Method for SAR Image Clutter Suppression. Remote Sens. 2025, 17, 1727. [Google Scholar] [CrossRef]
  23. Moreira, A.; Prats-Iraola, P.; Younis, M. A tutorial on synthetic aperture radar. IEEE Geosci. Remote Sens. Mag. 2013, 1, 6–43. [Google Scholar] [CrossRef]
  24. Ai, J.; Tian, R.; Luo, Q. Multi-scale rotation-invariant Haar-like feature integrated CNN-based ship detection algorithm of multiple-target environment in SAR imagery. IEEE Trans. Geosci. Remote Sens. 2019, 57, 10070–10087. [Google Scholar] [CrossRef]
  25. Ren, X.Z.; Zhou, P.Y.; Fan, X.Q.; Feng, C.G.; Li, P. LPFFNet: Lightweight Prior Feature Fusion Network for SAR Ship Detection. Remote Sens. 2025, 17, 1698. [Google Scholar] [CrossRef]
  26. Tao, L.; Zhou, Y.; Jiang, X.; Liu, X.; Zhou, Z. Convolutional neural network-based dictionary learning for SAR target recognition. IEEE Geosci. Remote Sens. Lett. 2021, 18, 1776–1780. [Google Scholar] [CrossRef]
  27. Ren, S.; He, K.; Girshick, R.; Sun, J. Faster R-CNN: Towards real-time object detection with region proposal networks. IEEE Trans. Pattern Anal. Mach. Intell. 2017, 39, 1137–1149. [Google Scholar] [CrossRef] [PubMed]
  28. Wang, R.; Xu, F.; Pei, J. An improved Faster R-CNN based on MSER decision criterion for SAR image ship detection in harbor. In Proceedings of the IGARSS 2019—2019 IEEE International Geoscience and Remote Sensing Symposium (IGARSS), Yokohama, Japan, 28 July–2 August 2019; pp. 1322–1325. [Google Scholar] [CrossRef]
  29. Redmon, J.; Divvala, S.; Girshick, R.; Farhadi, A. You only look once: Unified, real-time object detection. In Proceedings of the 2016 IEEE Conference on Computer Vision and Pattern Recognition (CVPR), Las Vegas, NV, USA, 27–30 June 2016; pp. 779–788. [Google Scholar] [CrossRef]
  30. Wan, Z.Y.; Lan, Y.L.; Xu, Z.D.; Shang, K.; Zhang, F.Z. DAU-YOLO: A Lightweight and Effective Method for Small Object Detection in UAV Images. Remote Sens. 2025, 17, 1768. [Google Scholar] [CrossRef]
  31. Cao, Y.; Guo, S.; Jiang, S.; Zhou, X.; Wang, X.; Luo, Y.; Yu, Z.; Zhang, Z.; Deng, Y. Parallel optimisation and implementation of a real-time back projection (BP) algorithm for SAR based on FPGA. Sensors 2022, 22, 2292. [Google Scholar] [CrossRef] [PubMed]
  32. Cheng, Y.; Li, C.Y.; Zhu, Y.F. Denoising and Feature Enhancement Network for Target Detection Based on SAR Images. Remote Sens. 2025, 17, 1739. [Google Scholar] [CrossRef]
  33. Chen, Y.S.; Chen, J.; Sun, L.; Wu, B.C.; Xu, H. AJANet: SAR Ship Detection Network Based on Adaptive Channel Attention and Large Separable Kernel Adaptation. Remote Sens. 2025, 17, 1745. [Google Scholar] [CrossRef]
  34. Guo, H.; Bai, H.; Yuan, Y.; Qin, W. Fully deformable convolutional network for ship detection in remote sensing imagery. Remote Sens. 2022, 14, 1850. [Google Scholar] [CrossRef]
  35. Venter, C.J.; Grobler, H.; AlMalki, K.A. Implementation of the CA-CFAR algorithm for pulsed-Doppler radar on a GPU architecture. In Proceedings of the 2011 IEEE Jordan Conference on Applied Electrical Engineering and Computing Technologies, Amman, Jordan, 6–8 December 2011; IEEE: Piscataway, NJ, USA, 2012. [Google Scholar] [CrossRef]
  36. Zhang, F.; Yao, X.; Tang, H. Multiple mode SAR raw data simulation and parallel acceleration for Gaofen-3 mission. IEEE J. Sel. Top. Appl. Earth Obs. Remote Sens. 2018, 11, 2115–2126. [Google Scholar] [CrossRef]
  37. Zhang, Y.; Shang, M.; Lv, Y.; Qiu, X. A Near-Real-Time Imaging Algorithm for Focusing Spaceborne SAR Data in Multiple Modes Based on an Embedded GPU. Remote Sens. 2025, 17, 1495. [Google Scholar] [CrossRef]
  38. Zhang, L.J.; Zhang, J.; Zhang, X.; Lang, H.T. Parallel algorithm of dual-parameter CFAR ship detection with balanced task allocation. J. Remote Sens. 2016, 20, 344–351. (In Chinese) [Google Scholar] [CrossRef]
  39. Bales, M.R.; Benson, T.; Dickerson, R.; Campbell, D.; Hersey, R.; Culpepper, E. Real-time implementations of ordered-statistic CFAR. In Proceedings of the 2012 IEEE Radar Conference, Atlanta, GA, USA, 7–11 May 2012. [Google Scholar] [CrossRef]
  40. Bian, M.M.; Li, S.L.; Yue, R.G. Research of On-board Real-time Imaging Processing Algorithm of Space-borne Synthetic Aperture Radar. Spacecr. Eng. 2013, 22, 97–103. (In Chinese) [Google Scholar] [CrossRef]
  41. Zhao, J.; Lin, X.; Yuan, Z.D.; Du, N.G.; Cai, X.L.; Yang, C.; Zhao, J.; Xu, Y.S.; Zhao, L.W. GNSS Precipitable Water Vapor Prediction for Hong Kong Based on ICEEMDAN-SE-LSTM-ARIMA Hybrid Model. Remote Sens. 2025, 17, 1675. [Google Scholar] [CrossRef]
  42. Xie, Y.; Zhong, Z.; Li, B.; Xie, Y.; Chen, L.; Chen, H. An ARM-FPGA Hybrid Acceleration and Fault Tolerant Technique for Phase Factor Calculation in Spaceborne Synthetic Aperture Radar Imaging. IEEE J. Sel. Top. Appl. Earth Obs. Remote Sens. 2024, 17, 5059–5072. [Google Scholar] [CrossRef]
  43. Xiao, M.; Ling, W.C.; Liu, Y.B.; Liu, L.; Wang, X.B.; Liu, X. Real-time Ship Detection Algorithm Based on Gaofen-3 Satellite. Sci. Technol. Eng. 2021, 21, 8057–8064. (In Chinese) [Google Scholar] [CrossRef]
  44. Ran, L.; Liu, Z.; Li, T.; Xie, R.; Zhang, L. An adaptive fast factorized back-projection algorithm with integrated target detection technique for high-resolution and high-squint spotlight SAR imagery. IEEE J. Sel. Top. Appl. Earth Obs. Remote Sens. 2017, 11, 171–183. [Google Scholar] [CrossRef]
  45. De Sousa, K.; Pilikos, G.; Azcueta, M.; Floury, N. Ship detection from raw SAR echoes using convolutional neural networks. IEEE J. Sel. Top. Appl. Earth Observ. Remote Sens. 2024, 17, 9936–9944. [Google Scholar] [CrossRef]
  46. Casalini, E.; Frioud, M.; Small, D.; Henke, D. Refocusing FMCW SAR Moving Target Data in the Wavenumber Domain. IEEE Trans. Geosci. Remote Sens. 2019, 57, 3436–3449. [Google Scholar] [CrossRef]
  47. Joshi, S.K.; Baumgartner, S.V.; da Silva, A.B.C.; Kriege, G. Range-Doppler based CFAR ship detection with automatic training data selection. Remote Sens. 2019, 11, 1270. [Google Scholar] [CrossRef]
  48. Schneider, F.; Muller, M. Real-Time SAR Ship Detection via CFAR-Based Range-Compressed Data Filtering. In Proceedings of the 2021 IEEE International Geoscience and Remote Sensing Symposium (IGARSS), Brussels, Belgium, 11–16 July 2021; pp. 5128–5131. [Google Scholar] [CrossRef]
  49. Wang, C.; Guo, B.; Song, J.; He, F.; Li, C. A novel CFAR-based ship detection method using range-compressed data for spaceborne SAR system. IEEE Trans. Geosci. Remote Sens. 2024, 62, 5215515. [Google Scholar] [CrossRef]
  50. Zeng, H.; Song, Y.; Yang, W.; Miao, T.; Liu, W.; Wang, W.; Chen, J. An Incept-TextCNN model for ship target detection in SAR range-compressed domain. IEEE Geosci. Remote Sens. Lett. 2024, 21, 3501305. [Google Scholar] [CrossRef]
  51. Tan, X.D.; Leng, X.G.; Luo, R.; Sun, Z.Z.; Ji, K.F.; Kuang, G.Y. YOLO-RC: SAR ship detection guided by characteristics of range-compressed domain. IEEE J. Sel. Top. Appl. Earth Observ. Remote Sens. 2024, 17, 18834–18851. [Google Scholar] [CrossRef]
  52. Tan, X.D.; Leng, X.G.; Ji, K.F.; Kuang, G.Y. RCShip: A dataset dedicated to ship detection in range-compressed SAR data. IEEE Geosci. Remote Sens. Lett. 2024, 21, 4004805. [Google Scholar] [CrossRef]
  53. Scholkmann, F.; Wolf, M.; Boss, J. An Efficient Algorithm for Automatic Peak Detection in Noisy Periodic and Quasi-Periodic Signals. Algorithms 2012, 5, 588–603. [Google Scholar] [CrossRef]
  54. de M. Santos, R.C.C.; Silva, M.C.; Oliveira, R.A.R. Real-time Object Detection Performance Analysis Using YOLOv7 on Edge Devices. IEEE Lat. Am. Trans. 2024, 22, 799–805. [Google Scholar] [CrossRef]
  55. Miao, T.; Zeng, H.; Yang, W.; Chu, B.; Zou, F.; Ren, W. An Improved Lightweight RetinaNet for Ship Detection in SAR Images. IEEE J. Sel. Top. Appl. Earth Obs. Remote Sens. 2022, 15, 4667–4679. [Google Scholar] [CrossRef]
Figure 1. Ship Targets Integrated Imaging and Detection Framework (ST-IIDF) Diagram in Wide-Area Offshore Scenarios.
Remotesensing 17 02545 g001
Figure 2. YOLOv7 Network Structure.
Remotesensing 17 02545 g002
Figure 3. Amplitude Distribution Diagram of One-Dimensional Range Signal: The horizontal axis represents the number of scene range gate units, and the vertical axis represents the amplitude of the one-dimensional compressed range gate response. The area with strong amplitude response is the range gate unit where the target is suspected to be located.
Remotesensing 17 02545 g003
Figure 4. Target Potential Range Gate Extraction: This figure illustrates the process of extracting the range gate of the target based on peak-valley detection. The orange sequence in (a) represents the peak detection signal, while the blue sequence in (b) represents the valley detection signal. Red points in (a,b) show the peak and valley sequences, respectively, which can preliminarily locate the sequence where the target is located. Red sequence in (c) is the calculation of peak-to-valley ratio, which is used to further calculate the normalized response. Red points in (d) represent the target areas filtered based on the threshold and mapped back to the distance gate unit.
Remotesensing 17 02545 g004
Figure 5. Azimuth Amplitude Distribution Map of the Target Extraction Area: Each color represents a potential range gate for selected targets, and the sequence of each color represents the amplitude distribution of the signal along the azimuth direction in each range gate.
Remotesensing 17 02545 g005
Figure 6. Selected Potential Target Areas in Range-compressed Domain: The red boxes represent the data ranges for screening in the range-compressed domain.
Remotesensing 17 02545 g006
Figure 7. Imaging Results of Data Blocks in Potential Target Areas: The red dotted boxes represent the redundant images.
Remotesensing 17 02545 g007
Figure 8. Effect of Gray Scale Dynamic Quantization: The illustration on the left shows the slices and corresponding grayscale distribution diagrams before dynamic quantization. It can be seen that, since the grayscale proportion occupied by target is only a small part, there is not much difference in the grayscale distribution whether there exists a target or not. The illustration on the right shows the slices and corresponding grayscale distribution diagram after dynamic quantization. It can be observed that for the slices without a target, the low grayscale range is stretched, and the average grayscale value increases. For the slices with a potential target, the grayscale contrast increases, the target is brighter, the background details are not obvious, and the average grayscale value is low.
Remotesensing 17 02545 g008
Figure 9. Slices of Ship Targets, Sea Clutter, and Interference Targets: The first row displays ship target slices and the second row shows sea clutter (4 pictures on the right) and interference targets (2 pictures on the left).
Remotesensing 17 02545 g009
Figure 10. Imaging detection integrated processing result of Scene One. The green title displays the true value of the target, and the red anchor box displays the ship target detection results from our framework. The correctness of the detection results is verified by comparing with the true value.
Remotesensing 17 02545 g010
Figure 11. Imaging detection integrated processing result of Scene Two. The green title displays the true value of the target, and the red anchor box displays the ship target detection results from our framework. The correctness of the detection results is verified by comparing with the true value.
Remotesensing 17 02545 g011
Figure 12. Imaging detection integrated processing result of Scene Three. The green title displays the true value of the target, and the red anchor box displays the ship target detection results from our framework. The correctness of the detection results is verified by comparing with the true value.
Remotesensing 17 02545 g012
Table 1. Comparison of network model accuracy and computational complexity.
EvaluationAP-SSDDAP0.5-SSDDAP0.75-SSDDAP-GF3ParamsGFLOPS@640
SSD52.489.454.984.4————
Faster-RCNN54.090.059.984.6————
YOLOv7-origin58.793.768.191.811.2 M34.7
YOLOv7-pruned (Ours)57.393.266.491.56.0 M12.9
Table 2. Hardware configuration for experiments.
HardwareConfiguration
GPUNVIDIA Quadro RTX 6000/8000
Video Memory24 GB
CPUIntel Xeon Gold 6226R
CPU frequency2.9 GHz
Memory503 GB
Table 3. Main related parameters of experimental satellite data.
SourceBandImaging ModeResolutionObservation Range
Pujiang-2Xstripmap mode1 m20 km
Hisea-1Cstripmap mode1–3 m20–40 km
Table 4. Echo information of the examples for entire process experiment.
SceneSourceBandSizeCenter LongitudeCenter Latitude
1Pujiang-2X21,100 × 33,972−76.427181743136.9728933691
2Pujiang-2X21,789 × 23,55211.746622152437.2469736600
3Hisea-1C40,001 × 26,368113.820107664318.0575724603
Table 5. Comparison experiment results of framework timeliness improvement statistics.
SceneSizeNo. of ShipsNo. of Range Compressing Domain AreasNo. of Selected SlicesCorrect DetectionFalse DetectionMissing DetectionTotal Time
(Ours)
Traditional Process TimeTime
Accelerated
121,100 × 33,792272200296.8 s10,078.3 s33.9
221,789 × 23,552121100116.1 s6302.4 s54.3
317,455 × 33,792353300227.6 s7095.0 s31.2
419,248 × 26,624555500224.9 s6213.1 s27.6
517,546 × 34,8161222121200762.7 s8061.1 s10.6
617,798 × 26,624233200145.3 s3017.6 s20.8
717,670 × 35,840455400189.6 s4696.1 s24.8
821,599 × 31,74411110065.7 s3641.3 s55.4
940,001 × 26,368111100203.2 s15,385.9 s75.7
1040,001 × 19,712264200455.8 s11,523.8 s25.3
Disclaimer/Publisher’s Note: The statements, opinions and data contained in all publications are solely those of the individual author(s) and contributor(s) and not of MDPI and/or the editor(s). MDPI and/or the editor(s) disclaim responsibility for any injury to people or property resulting from any ideas, methods, instructions or products referred to in the content.

