Abstract
Mangroves form the dominant coastal plant community of low-energy tropical intertidal habitats and provide critical ecosystem services to humans and the environment. However, more frequent and increasingly powerful hurricanes and storm surges are creating additional pressure on the natural resilience of these threatened coastal ecosystems. Advances in remote sensing techniques and approaches are critical to providing robust quantitative monitoring of post-storm mangrove forest recovery to better prioritize the often-limited resources available for the restoration of these storm-damaged habitats. Here, we build on previously utilized spatial and temporal ranges of European Space Agency (ESA) Sentinel satellite imagery to monitor and map the recovery of the mangrove forests of the British Virgin Islands (BVI) since the occurrence of back-to-back category 5 hurricanes, Irma and Maria, on September 6 and 19 of 2017, respectively. Pre- to post-storm changes in coastal mangrove forest health were assessed annually using the normalized difference vegetation index (NDVI) and moisture stress index (MSI) from 2016 to 2023 using Google Earth Engine. Results reveal a steady trajectory towards forest health recovery on many of the Territory’s islands since the storms’ impacts in 2017. However, some mangrove patches are slower to recover, such as those on the islands of Virgin Gorda and Jost Van Dyke, and, in some cases, have shown a continued decline (e.g., Prickly Pear Island). Our work also uses a linear ANCOVA model to assess a variety of geospatial, environmental, and anthropogenic drivers for mangrove recovery as a function of NDVI pre-storm and post-storm conditions. The model suggests that roughly 58% of the variability in the 7-year difference (2016 to 2023) in NDVI may be related by a positive linear relationship with the variable of population within 0.5 km and a negative linear relationship with the variables of northwest aspect vs. southwest aspect, island size, temperature, and slope.
1. Introduction
1.1. Background
Mangroves form the dominant coastal plant community of low-energy tropical intertidal habitats. Within the neotropical habitat of the British Overseas Territory of the Virgin Islands, hereafter referred to as the BVI, only three species of true mangroves occur, including red (Rhizophora mangle), black (Avicennia germinans), and white mangroves (Laguncularia racemosa), each exhibiting characteristic features of vivipary, salt and flood tolerance, and a tendency towards forming monocultures [1]. Other mangrove associates also occur, most commonly buttonwood (Conocarpus erectus) [2,3].
Facing a pattern of global decline [4], mangroves provide many ecosystem services to humans. Mangroves protect coastlines from storm surges and erosion [5,6,7,8,9], accrete sediments for the creation of new coastal land areas [10,11], promote the succession of secondary vegetation species [12], and act as forging, refugia, and nurseries for many fish and aquatic species [13,14,15]. Mangrove forests also provide locations for recreation and ecotourism [16] and provide direct and indirect economic benefits to local economies [9,13,15]. Additionally, since mangroves are some of the most productive ecosystems in the world, they provide a carbon sink to the greater global carbon cycle [17,18].
Despite their well-documented global importance, these ecosystems are at risk due to habitat loss, resource extraction, land development, and associated anthropogenic disturbance [1,19]. Increasingly, catastrophic weather events are adding to these direct human-induced pressures through a stark increase in the frequency and strength of hurricanes and associated storm surges [20,21,22]. These threats have led researchers, land managers, and policymakers to work towards adaptation [23], mitigation [21,24], and restoration [25] efforts to help protect these important ecosystems and the ecosystem services they provide. In order to meaningfully assess coastal mangrove resources and inform adaptive management, it is critical to quantify both the areal extent and the relative health of the mangrove forests. This can be completed through the monitoring of mangrove forest areas via on-site land surveys [26,27], but it is well known these types of surveys can be potentially time-consuming, costly [28], and limited to easily accessible areas [29]. Alternatively, remote sensing surveys can often cover larger areas [30], are cost-effective [31], are passive to the ecosystem [32], and can be used to map protected areas that humans cannot easily access [33].
Remote sensing surveys are well known to be useful for monitoring the distribution and coverage of other types of forest ecosystems [34,35] and coastal environments such as salt marshes [36,37] and submerged eelgrasses [38]. However, previous research literature also shows the use of remote sensing for the mapping of coastal mangrove forest ecosystems [39,40,41,42]. For instance, Kotikot et al. [42] utilized 10 m spatial resolution European Space Agency (ESA) Sentinel-2 imagery to map the extent of mangrove forests in parts of the Caribbean to show that the BVI had a 3.68% increase in its overall coverage from the years of 2020 to 2023. Also, Baloloy et al. [41] created and utilized a mangrove vegetation index (MVI) to specifically classify and map the extent of mangrove forest areas in the Philippines and Japan using Sentinel-2 imagery dating from 2015 to 2019. Additionally, Everitt et al. [39] tested the use of color infrared (CIR) aerial photography to map black mangroves at two sites along the Texas Gulf Coast from the mid-1970s to the early 2000s for the purposes of assessing long-term change within the species coverage areas. Further, in 2015, Ballaria et al. [40] utilized unoccupied aerial vehicles (UAVs) to collect multispectral camera imagery for the purposes of classifying and monitoring mangroves and other vegetation in the 97% protected Galapagos Islands.
The use of emerging cloud computing Google Earth Engine (GEE) methods, machine learning algorithms, and thresholds have also been utilized in more recent years to map the distribution of mangroves in various regions of the world [43,44,45]. For instance, Liu et al. [45] utilized GEE, Sentinel-2 satellite imagery, and a threshold segmentation algorithm to map the extent of mangroves globally in 2022 with an overall regional accuracy of 90%. Additionally, Hu et al. [43] utilized GEE and a combination of Sentinel 1 SAR (Synthetic Aperture Radar), Sentinel-2 time-series imagery, and a random forest machine learning algorithm to show the importance of 10 m imagery for mapping the extent of mangroves in China. Further, Vu et al. [44] utilized GEE and Landsat (TM/ETM+/OLI/OLI-2) imagery time-series between 1990 and 2022 to monitor mangrove extent changes in Northern Vietnam with an overall classification accuracy in 2022 of 91.88%.
In addition to mapping the distribution of forests, previous and recent remote sensing studies have also looked to map the resilience and health of mangroves [46,47,48]. For instance, Fan et al. [46] utilized a time series of Landsat 8 satellite data in Google Earth Engine (GEE) to map the resilience of mangroves from 2000 to 2020 in southern China with the use of a resilience indicator constructed from growth trends and stability of mangrove patches. Alternatively, Taillie et al. [47] utilized Normalized Difference Vegetation Index (NDVI) values to map forest health in the Caribbean and the Gulf of Mexico to assess mangrove damage during the particularly active mega-hurricane year of 2017 and eight years prior. Results of this NDVI study showed 30 times greater mangrove damage due to the 2017 hurricane season relative to a baseline from the previous eight years. Further, Soanes et al. [49] utilized NDVI values to assess mangrove health recovery as a function of canopy closure at a selected set of three locations on the islands of Jost Van Dyke and Tortola in the BVI previous to and following hurricanes Irma and Maria from 2016 until 2019. The Jost Van Dyke and Tortola study was completed to help inform modeling efforts to benefit mangrove restoration projects. In fact, the NDVI has been shown to be an important health indicator of vegetation because of its relationship to vegetation biomass, canopy structure, and leaf area in other studies [50,51,52]. Besides NDVI, the Moisture Stress Index (MSI) has also been shown to be an important indicator of vegetation health because of its relationship to vegetation moisture [53,54] and the effects of drought conditions on vegetation [55]. For instance, Dotzler et al. [48] utilized the MSI and other spectral indexes to map the health of deciduous forest species in the Donnersberg region of Germany during the year 2014 for the purposes of mapping tree site-specific climate sensitivities. Further, in 1985, Rock et al. [53] used MSI to help measure vegetation health stress caused by the effects of acid precipitation at Camel’s Hump Mountain in the Green Mountains of Vermont with the use of multispectral imagery.
Rates of previous hurricane damage to mangroves have been linked to high maximum wind speeds, storm rainfall, previous storm damage, sediment deposition, defoliation, and mangrove canopy height [56,57,58,59,60,61,62]. However, post-hurricane mangrove forest health recovery appears to function through a different set of drivers [49,61,63]. Radabaugh et al. [61] and Sherman et al. [63] have documented that variations in the existence of pre-storm seedlings and gap light between post-storm trees may play a role in the speed of mangrove forest recoveries; thus, extreme storm surges that uproot seedlings or flush away propagules can significantly hinder natural recovery. Climate variations in temperatures or rainfall have also been shown to affect the speed, robustness, or spatial distributions of forest health recovery after being affected by storm damage [62,64,65]. Additionally, variations in vegetation patch areas and fragmentation patterns have been shown to affect the succession of other types of forest and coastal species after human population encroachment or sustaining storm damage [66,67]. Further, variations in distance and directions from hurricanes have been shown to vary the effects and severity of coastal mangrove damage in the first place [22,63], thus potentially setting the stage for spatial and temporal patterns of recovery. These studies imply that mangrove forest recovery may be influenced by a variety of geospatial, environmental, and human-induced drivers.
On September 6 and 19, respectively, hurricanes Irma and Maria struck the BVI, causing devastating effects on the local economy, infrastructure, and human life [68]. In addition to this destruction, these islands also suffered severe damage to their coastal mangrove forests [49], leaving adjacent communities vulnerable to future hurricanes, storm surges, and flooding events. Due to this known destruction of the BVI mangrove forests, we build on previous research to measure the recovery of the BVI mangrove forest ecosystems with the use of remotely sensed forest health indicators. Previous research studies have utilized greenness and moisture indexes to measure the health of mangroves in tropical locations. Within the current research, we look at the forest health measure of greenness via the NDVI and the complementary health measure of moisture via the MSI within the BVI. These measures are important because the effects of other devastating forest disasters combined with the effects of drought have been shown to have strong impacts on forest health recovery [69,70,71]. Also, though other studies have utilized Sentinel-2 surface reflectance (SR) data from Google Earth Engine to complete their work, this limited the early range of Sentinel data within the region of the BVI to start around the year 2020. Within the current study, we manually atmospherically corrected top-of-atmosphere (TOA) imagery to expand the use of Sentinel-2 imagery backwards for the calculation of health indexes prior to the 2017 hurricanes. It is with these expansions of previous research and data that we provide new measures and results of mangrove recovery in the BVI. While drivers of mangrove forest vulnerability and health recovery rates have been examined by comparing the NDVI forest health index versus mangrove forest characteristics over time [49,61,62,63], we examined other potential mangrove forest health recovery drivers within the BVI through 2023.
1.2. Objectives
Based on the need to better monitor and understand mangrove forest recovery, this research has the following objectives:
- Determine if remotely sensed Sentinel-2 imagery-derived NDVI and MSIs can be calculated to measure mangrove forest health in the BVI.
- Determine if a time series of remotely sensed Sentinel-2 imagery-derived NDVI and MSIs can be used to measure mangrove forest health recovery in the BVI following the 2017 hurricanes Irma and Maria through 2023.
- Determine if mangrove forest health recovery varies by island and by mangrove forest patch throughout the BVI.
- Assess if mangrove forest health recovery may be a function of a variety of mangrove geospatial, environmental, and human-induced drivers.
2. Materials and Methods
2.1. Study Area
The BVI is an archipelago of over fifty islands stretching across an area of 500 square kilometers of ocean lying west of the Islands of Puerto Rico and the United States Virgin Islands at about −64.54° West Longitude and 18.445° North Latitude (Figure 1). Of these fifty-plus islands, eight had ecologically significantly sized patches of coastal mangroves documented to occur prior to the September 2017 devastating effects of hurricanes Maria and Irma. These islands include Tortola, Anegada, Virgin Gorda, Jost Van Dyke, Beef Island, Frenchman’s Cay, Great Camanoe, and Prickly Pear Island, all of which vary significantly in total area, human population density, and microclimate (i.e., varying minimum and maximum temperatures and mean annual rainfall) [72]. However, the climate of the island region is mostly tropical savanna. Within the capital of Road Town, high temperatures range from 25 °C in winter to 28 °C in summer, with rainfall of about 947 mm annually [73]. Most of the islands are of volcanic origin and have steep, hilly terrain; however, Anagada is created from carbonate reef deposits. The highest point is on the Island of Tortola at 521 m above sea level, while Anagada’s highest point is only 8.5 m above sea level [74]. The pre-hurricane mangrove forest patches on each of these above-mentioned islands form the study area for this research. These island patches of mangrove forests have varying areas, perimeters, area/perimeter ratios, aspects, species richness and percent cover, canopy height, tidal influence, and other characteristics.
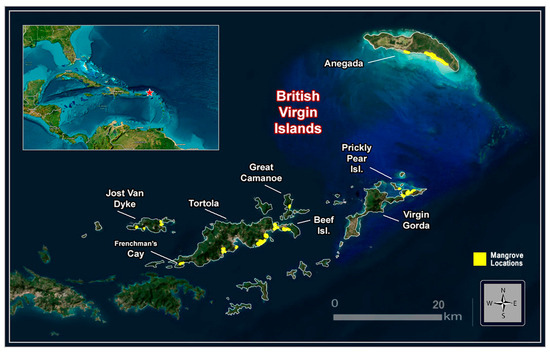
Figure 1.
Map of the British Virgin Islands, with study area islands labeled for reference and the locations of mangrove forest polygons displayed in yellow.
2.2. Data Collection and Processing
Damage and recovery of the BVI coastal and inland mangrove forests caused by and following Hurricanes Irma and Maria in September of 2017 were assessed with the use of 10 m resolution European Space Agency (ESA) Sentinel-2 satellite imagery [75] and the Google Earth Engine (GEE) cloud-based image processing platform [76].
Sentinel-2 Top of Atmosphere (TOA) reflectance imagery was acquired from the GEE imagery archive for the annual time window of September 20 to November 20 for the years 2016, 2017, 2019, 2021, and 2023. These dates were utilized because, per year, they corresponded with the two months that succeeded the anniversary date of Hurricane Maria, the second of the two hurricanes to affect the BVI in 2017. These imageries were then composited together per time period, prioritizing cloud-free pixels over cloudy pixels to form as cloud-free of a composite as possible with the use of the Sentinel-2 Cloud Probability product.
Though atmospherically corrected Sentinel-2 surface reflectance (SR) imagery would have been preferred for our analysis, no SR imagery was available in our study area prior to 2020. Thus, Sentinel-2 non-atmospherically corrected Top TOA reflectance imagery were used within this analysis instead because TOA imagery was available for the full length of our study period from 2016 to 2023. However, using TOA imagery instead of SR imagery required us to atmospherically correct the TOA imagery ourselves prior to using it for analysis. Thus, we completed atmospheric corrections of the imagery with the use of the Sensor Invariant Atmospheric Correction (SIAC) functions [77] and modified JavaScript code in GEE.
The SIAC function was used for our project because of its ability to atmospherically correct multiple satellite sensor data types, including Sentinel-2 imagery, such as those used for our research. The SIAC function uses daily 500 m resolution MODIS satellite MCD43 BRDF (Bidirectional Reflectance Distribution Function) products built into the GEE data library to estimate the reflectance of the Earth’s surface and a linear spectral mapping to scale these estimates between sensors [78]. A Bayesian framework is employed to estimate atmospheric parameters that are particularly useful for improving the spectral accuracy of imagery that contains thin clouds, gases, and aerosols [78]. The validation of atmospherically corrected imagery using the SIAC function has been shown to have a high correlation of r = 0.92 (RMSE = ~0.02) relative to NASA’s globally distributed network of AERONET ground-based stations that measure sun, sky, and infrared light during daylight hours [78]. The code for implementing the SIAC function in GEE is available on the online Github archive [79].
Expert manual delineation of coastal high-tide mangrove patch polygons over the eight islands of interest within this study area was completed in Google Earth prior to and following the 2017 hurricanes Maria and Irma. Mangrove patch polygons were delineated by creating KML files in the Google Earth online imagery browsing platform and then converting them to ESRI Shapefiles with the use of ArcGIS Pro GIS software, version 3.2 [80]. The shapefiles were then imported into GEE for further analysis.
Calculations of the Normalized Difference Vegetation Index (NDVI) and Moisture Stress Index (MSI) indexes were made in GEE for each delineated mangrove forest patch and in aggregate per island using our cloud-free atmospherically corrected composites. The Normalized Difference Vegetation Index (NDVI) indexes were calculated using Near-Infrared (NIR − band 8) and Red (R − band 4) wavelength bands from the Sentinel-2 composites to assess the level of greenness of the vegetation. NDVI values should range between 0.0 and 1.0, where higher values indicate a higher level of vegetation greenness within a given pixel. Mangrove forest patches with relatively healthy, dense canopies have been shown to have NDVI values of ~0.7 [81], thus also allowing for the use of NDVI greenness values to act as a proxy of canopy closure.
The Moisture Stress Index (MSI) indexes were calculated using Short Wave Infrared (SWIR − band 11) and (NIR − band 8) wavelength bands from the Sentinel-2 composites to quantitatively assess the level of dryness (a higher value) or wetness (a lower value) of vegetation per pixel.
Next, all NDVI and MSI per pixel values were averaged over each island and patch of mangrove forest areas for the study’s time periods using a series of GEE “reducer” Java Script functions. The collection of individual pixel values per assessed area was also collated in GEE for use in the project’s statistical analysis.
2.3. Data Assessment of Forest Health Indexes
Data assessment was first completed via the comparison of mean island mangrove NDVI and MSI values to compare 2016 health index values with post-storm 2017, 2019, 2021, and 2023 index values. Data were examined to determine the extent of mangrove damage and loss, as well as to document the trajectory of recovery across the time span of our study. Data were first graphed to visualize the changes in health indexes, and the percent changes in health indexes were calculated to determine the extent of recovery as of 2023.
2.4. Forest Health Index Validation
Validation of remotely sensed imagery is most often completed by comparing remotely sensed spectral values or classifications of those values with a series of validation points as collected on the ground or facilitated with the use of interpreted imagery of higher resolution [82,83]. However, by way of the nature of our methodology to build and utilize a cloud-free composite from multiple images over two-month periods per assessed years of our study, the collection and use of normal validation points were not feasible over such a large span of space and time. Alternative methods of ground validation within other studies have compared collected imagery or classified values visually within the imagery itself or within spatially coincident imagery of a different type or higher resolution [37,42]. Interpretation of independent ground photography and high-resolution aerial imagery from the online Earth observation application Google Earth has also been shown to be effective validation methods for independently calculating NDVI values [84,85]. Thus, we utilized visual aerial observations of the overall greenness, structure, and coverage of mangrove areas from high-resolution imagery made available through the online Google Earth application as a simple validation method for changes in our Sentinel-2 derived forest health index values between 2016 and 2023. Additional direct field observations and photographic evidence across all of the islands of the BVI during the project time period were also used to corroborate the findings of the Google Earth imagery [86].
Further, as NDVI values are partially dependent on part of the visual spectrum (Red band) but MSI values are not, and other remote sensing studies have shown an inverse relationship between NDVI values and leaf water stress in other vegetated landscapes [87,88], a correlation coefficient was calculated with our data as an additional validation check of the indexes.
2.5. Quantitative Analysis
Calculation of a linear ACNOVA model was completed to measure mangrove hurricane-damage NDVI recovery from 2016 to 2023 as a function of potential geospatial, environmental, and human-induced drivers. The model passed assessments of normality, constant variance, and independence of residuals. The pool of drivers under consideration included a variety of continuous variables, as well as a 4-level categorical variable indicating the patch aspect (primary coastal facing direction) () (Table 1). To fit a linear ANCOVA model, the categorical variable was recoded using a hierarchical scheme of contrasts. The four categories were first partitioned into two groups that maximize the between-group variation and recoded (. The two groups were then further partitioned and recoded () and ().

Table 1.
Assessed geospatial, environmental, and human-induced model drivers.
An All Possible Models procedure was used for variable selection. The All Possible Models framework examines all models that can be constructed from a collection of features. The models were then ranked based on AIC (Akaike Information Criterion), which penalizes the negative log-likelihood of the fit based on the number of features included in the model. The use of an information criterion such as AIC provides a trade-off between variance and bias that aims to provide a high-quality, parsimonious fits that reduce the risk of both overfitting and underfitting. In the absence of a comparable data set for validation, we held out 20% of the data set and examined the root mean squared prediction error (RMSE) for the training set and the validation set in the feature selection stage. After selecting the model features, the model was then re-fit using all the available data with non-missing columns.
3. Results
3.1. Results of Calculated Vegetation Health Indexes by Island
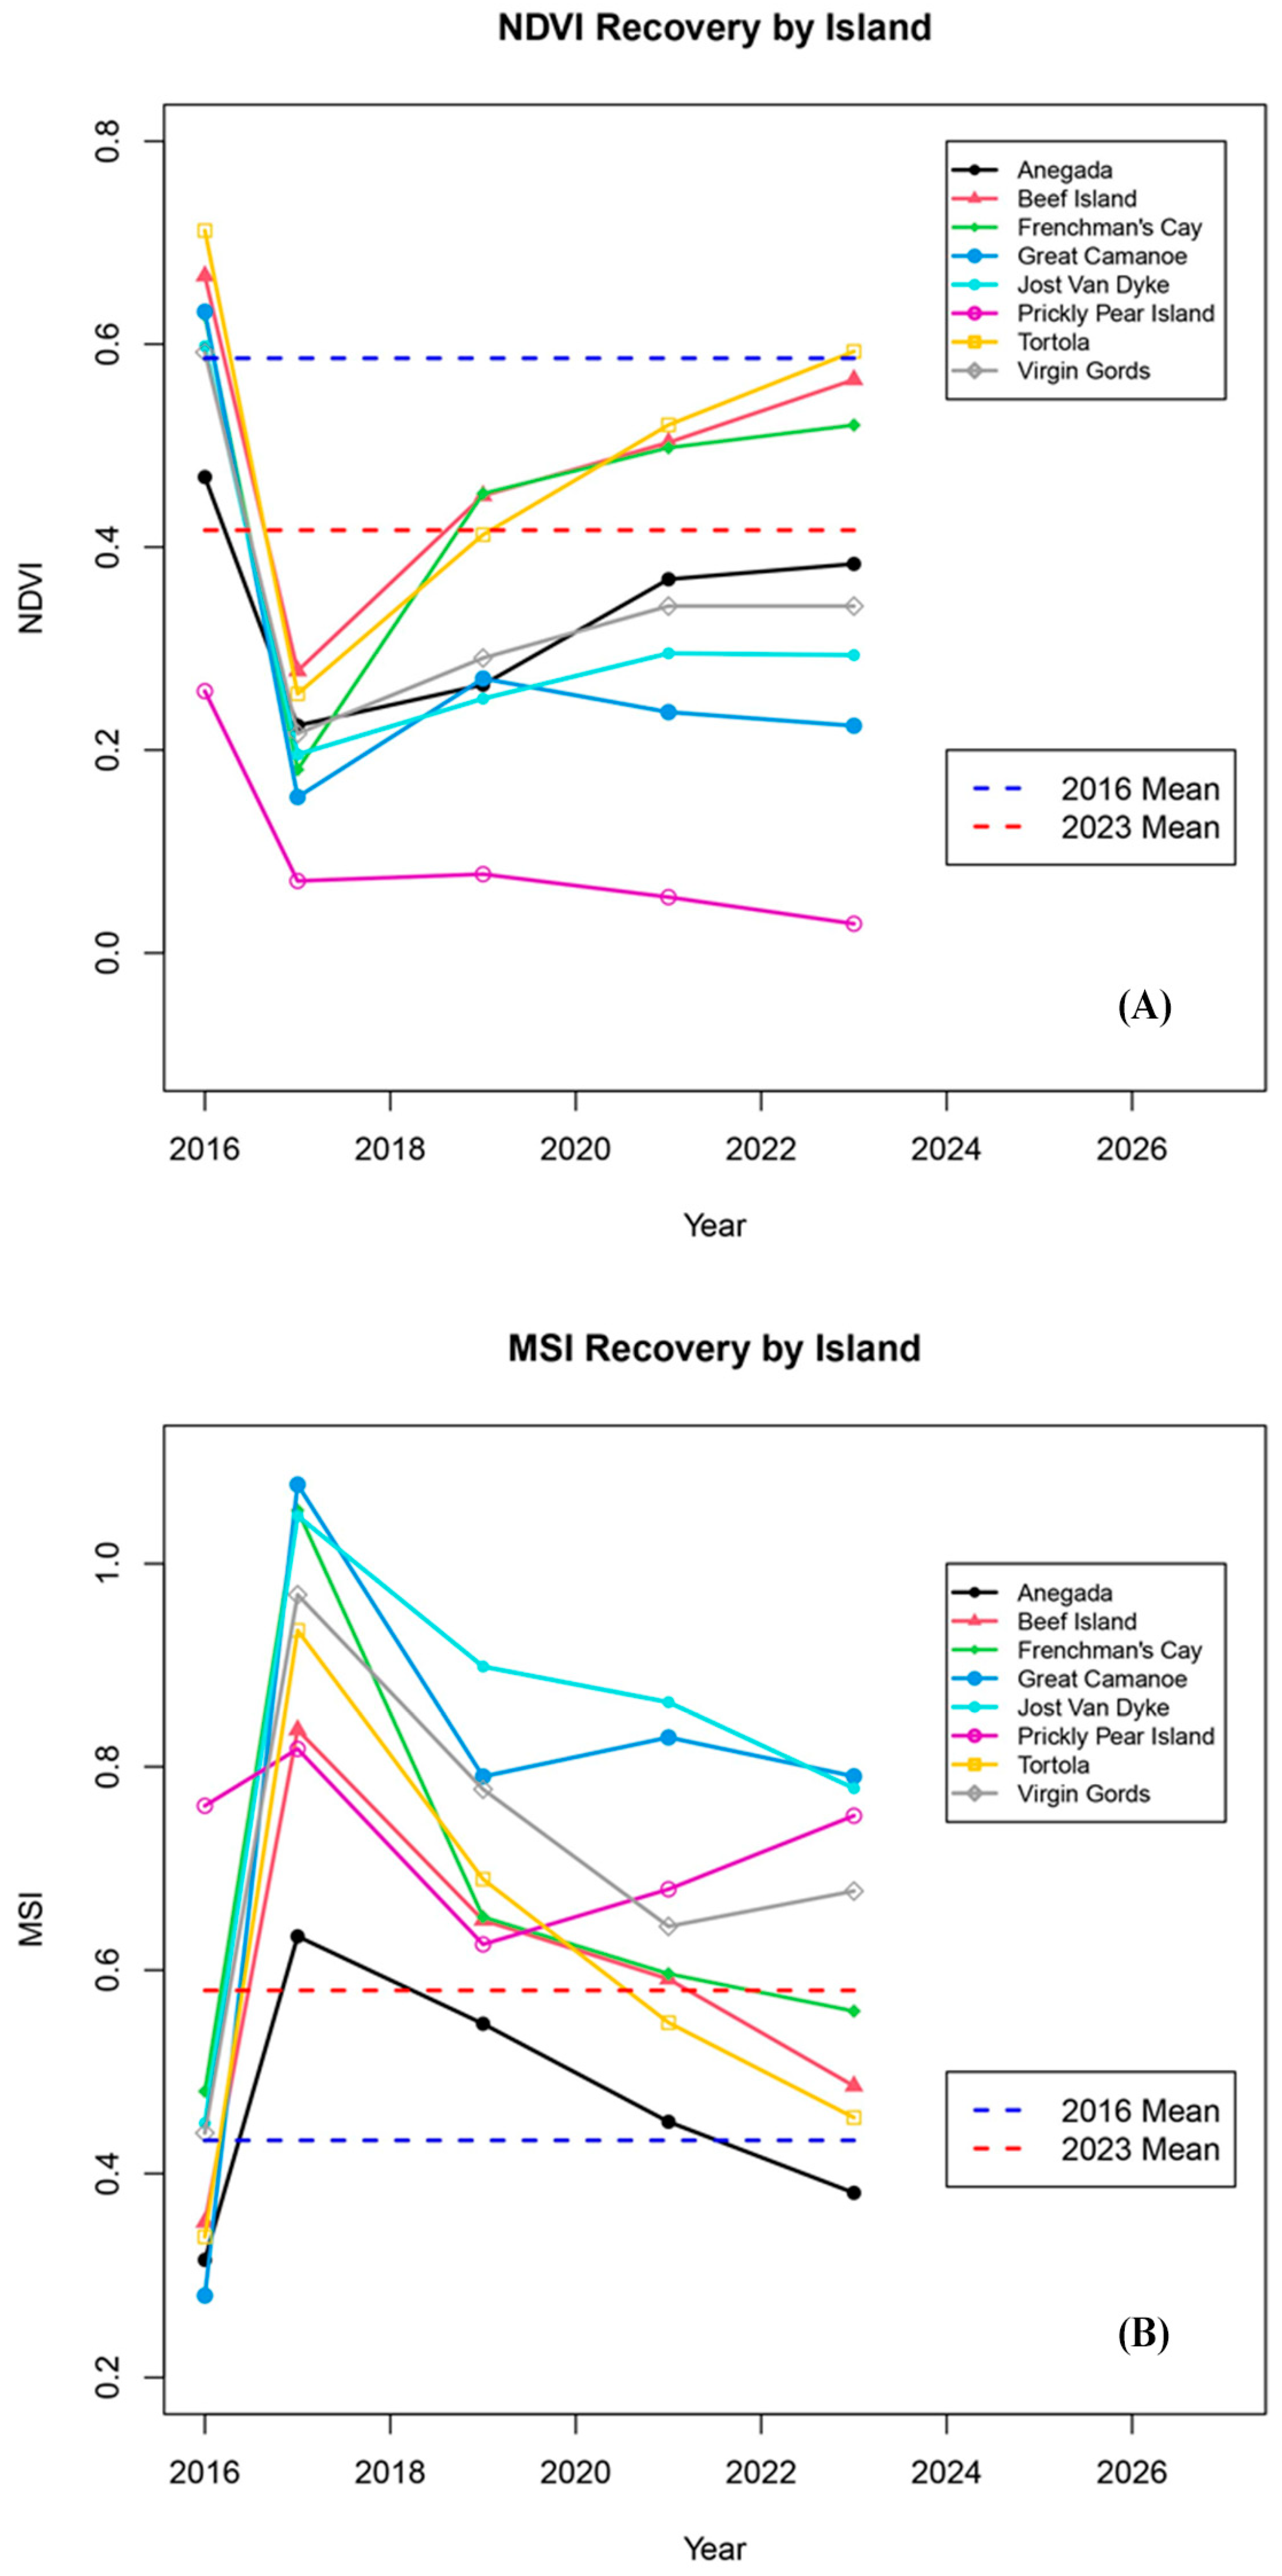
The results of our research show distinct patterns of decreased levels of greenness within each island’s set of mangrove forest polygons defined by their NDVI values after the occurrence of hurricanes Irma and Maria in September 2017 (Figure 2A). However, most of the islands have shown an increasing trend of NDVI greenness since then, implying a trajectory of recovery for the forests and forest patches (Figure 2A). The one exception to these trends is the relatively small, salt pond-dominated Prickly Pear Island, which has shown a continued decreasing trend in NDVI greenness since 2017 (Figure 2A). Distinct patterns of decreased levels of leaf moisture (increased MSI) for all mapped mangrove polygons were shown to occur immediately after the occurrence of the hurricanes (Figure 2B). Since then, most of the islands’ mangrove polygons have shown an increasing trend of leaf moisture (decreased MSI), implying a pattern of recovery in forest health (Figure 2B). As with NDVI, one exception to these trends with MSI is found on Prickly Pear, which in 2019 showed an upward trend in leaf moisture (lower MSI) but then followed a downward trend in leaf moister (Higher MSI) since then (Figure 2B). The mangroves of this unique system started out with a higher MSI than any of the other islands previous to the storms.
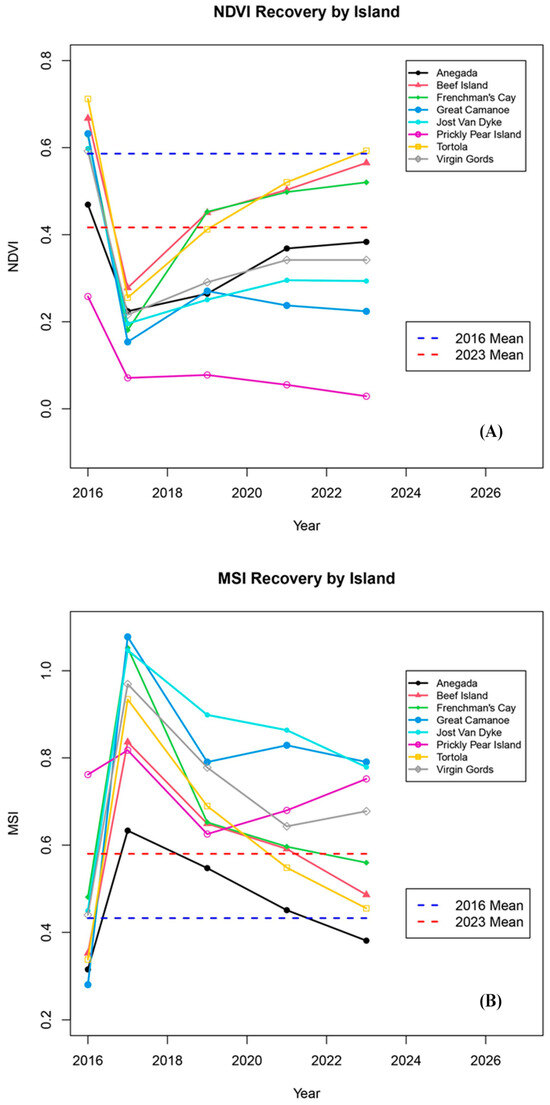
Figure 2.
Forest Health Indexes, Normalized Difference Vegetation Index (NDVI) graph of study area mangroves by island from 2016 to post-storm 2017, 2019, 2021, 2023 (A), Moisture Stress Index (MSI) graph of study area mangroves by island from 2016 to post-storm 2017, 2019, 2021, 2023 (B). Changes in both NDVI and MSI values for the 7-year span from 2016 to 2023 passed pair t-tests for statistical significance (α = 0.05).
3.2. Results of Vegetation Health Recovery by Island and Forest Patch
Differences in mangrove forest health indexes from pre-storm 2016 values to post-storm 2023 values showed an overall 66% NDVI recovery and a 76% MSI recovery for all of BVI (Table 2), implying that, on average, the mangrove forest areas were not yet as green (healthy, with closed canopies) or retaining comparable moisture in 2023 as they were in 2016 as is exemplified by the visualization of their mean values in Figure 2A,B. On a per-island basis, mangrove NDVI values appear to have been recovering everywhere, except for Prickly Pear Island, which saw a decrease in mangrove NDVI recovery of −23%. These results imply that these mangroves are less green (less healthy with less canopy cover) than they used to be prior to storm impacts. Of the other islands, Great Camano, Jost Van Dyke, and Virgin Gorda showed a mangrove NDVI recovery of 33% or less, while Anegada, Beef Island, and Frenchmen’s Cay showed a mangrove NDVI recovery of 65% or more. Overall, mangrove MSI values showed increases in recovery despite some variability between islands. Great Camano, Jost Van Dyke, and Virgin Gorda showed mangrove MSI recoveries of 55% or less, while Anegada, Beef Island, Frenchmen’s Cay, and Tortola showed mangrove MSI recoveries of 72 to 80%. In contrast, Prickly Pear Island reached an MSI value of 118%. However, the MSI values from 2016 to 2023 of 0.76 to 0.75 reflect only a minor change and should be interpreted with caution (Table 2, Figure 2B).
Table 2.
Results of hurricane mangrove NDVI and MSI forest health index recoveries by island.
To further understand the spatial distribution of mangrove forest health recovery, individual NDVI and MSI forest health recovery percentages were mapped across all mangrove patches in the study area (Figure 3A,B).
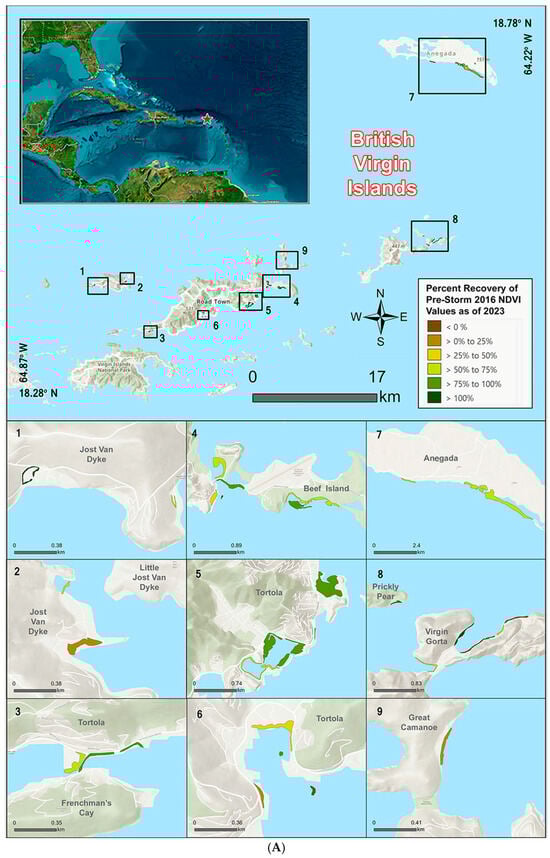
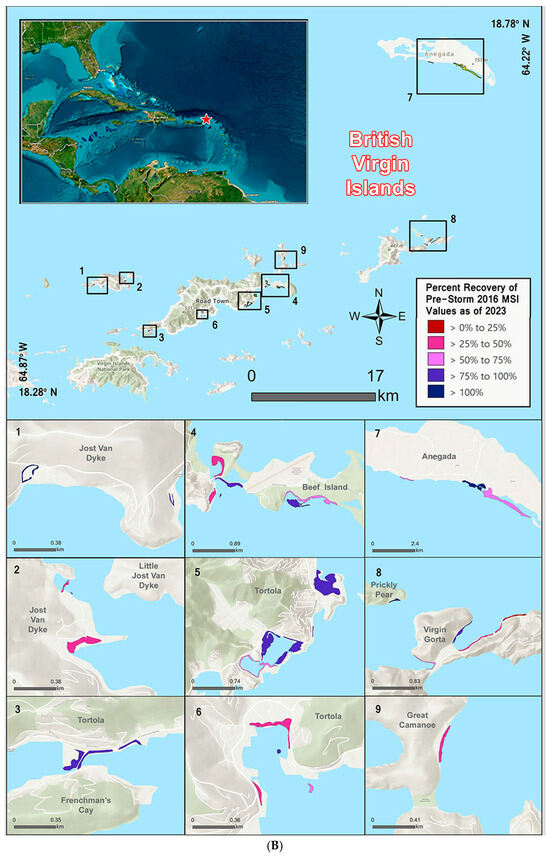
Figure 3.
(A) Map of the British Virgin Islands and inset mangrove forest patch maps showing the percent recovery of pre-storm 2016 NDVI values as of 2023. (B) Map of the British Virgin Islands and inset mangrove forest patch maps showing the percent recovery of pre-storm 2016 MSI values as of 2023.
3.3. Results of Forest Health Index Change Validation
We evaluated forest proxies of health changes between 2016 and 2023 via their NDVI and MSI recovery percentages (Table 2) vs. field-based observations. Overall, the general trends of NDVI and MSI recovery were corroborated by our visual observations and photographic evidence of forest regrowth, leaf moisture, and greenness (Figure 4).
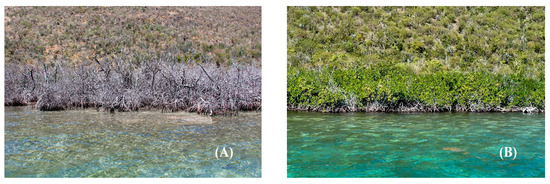
Figure 4.
Example photos of April 2018 post-storm damage to mangrove forests (A) and January 2023 increased forest regrowth, leaf moisture, and greenness (B) off of Deep Bay, Virgin Gorda, BVI.
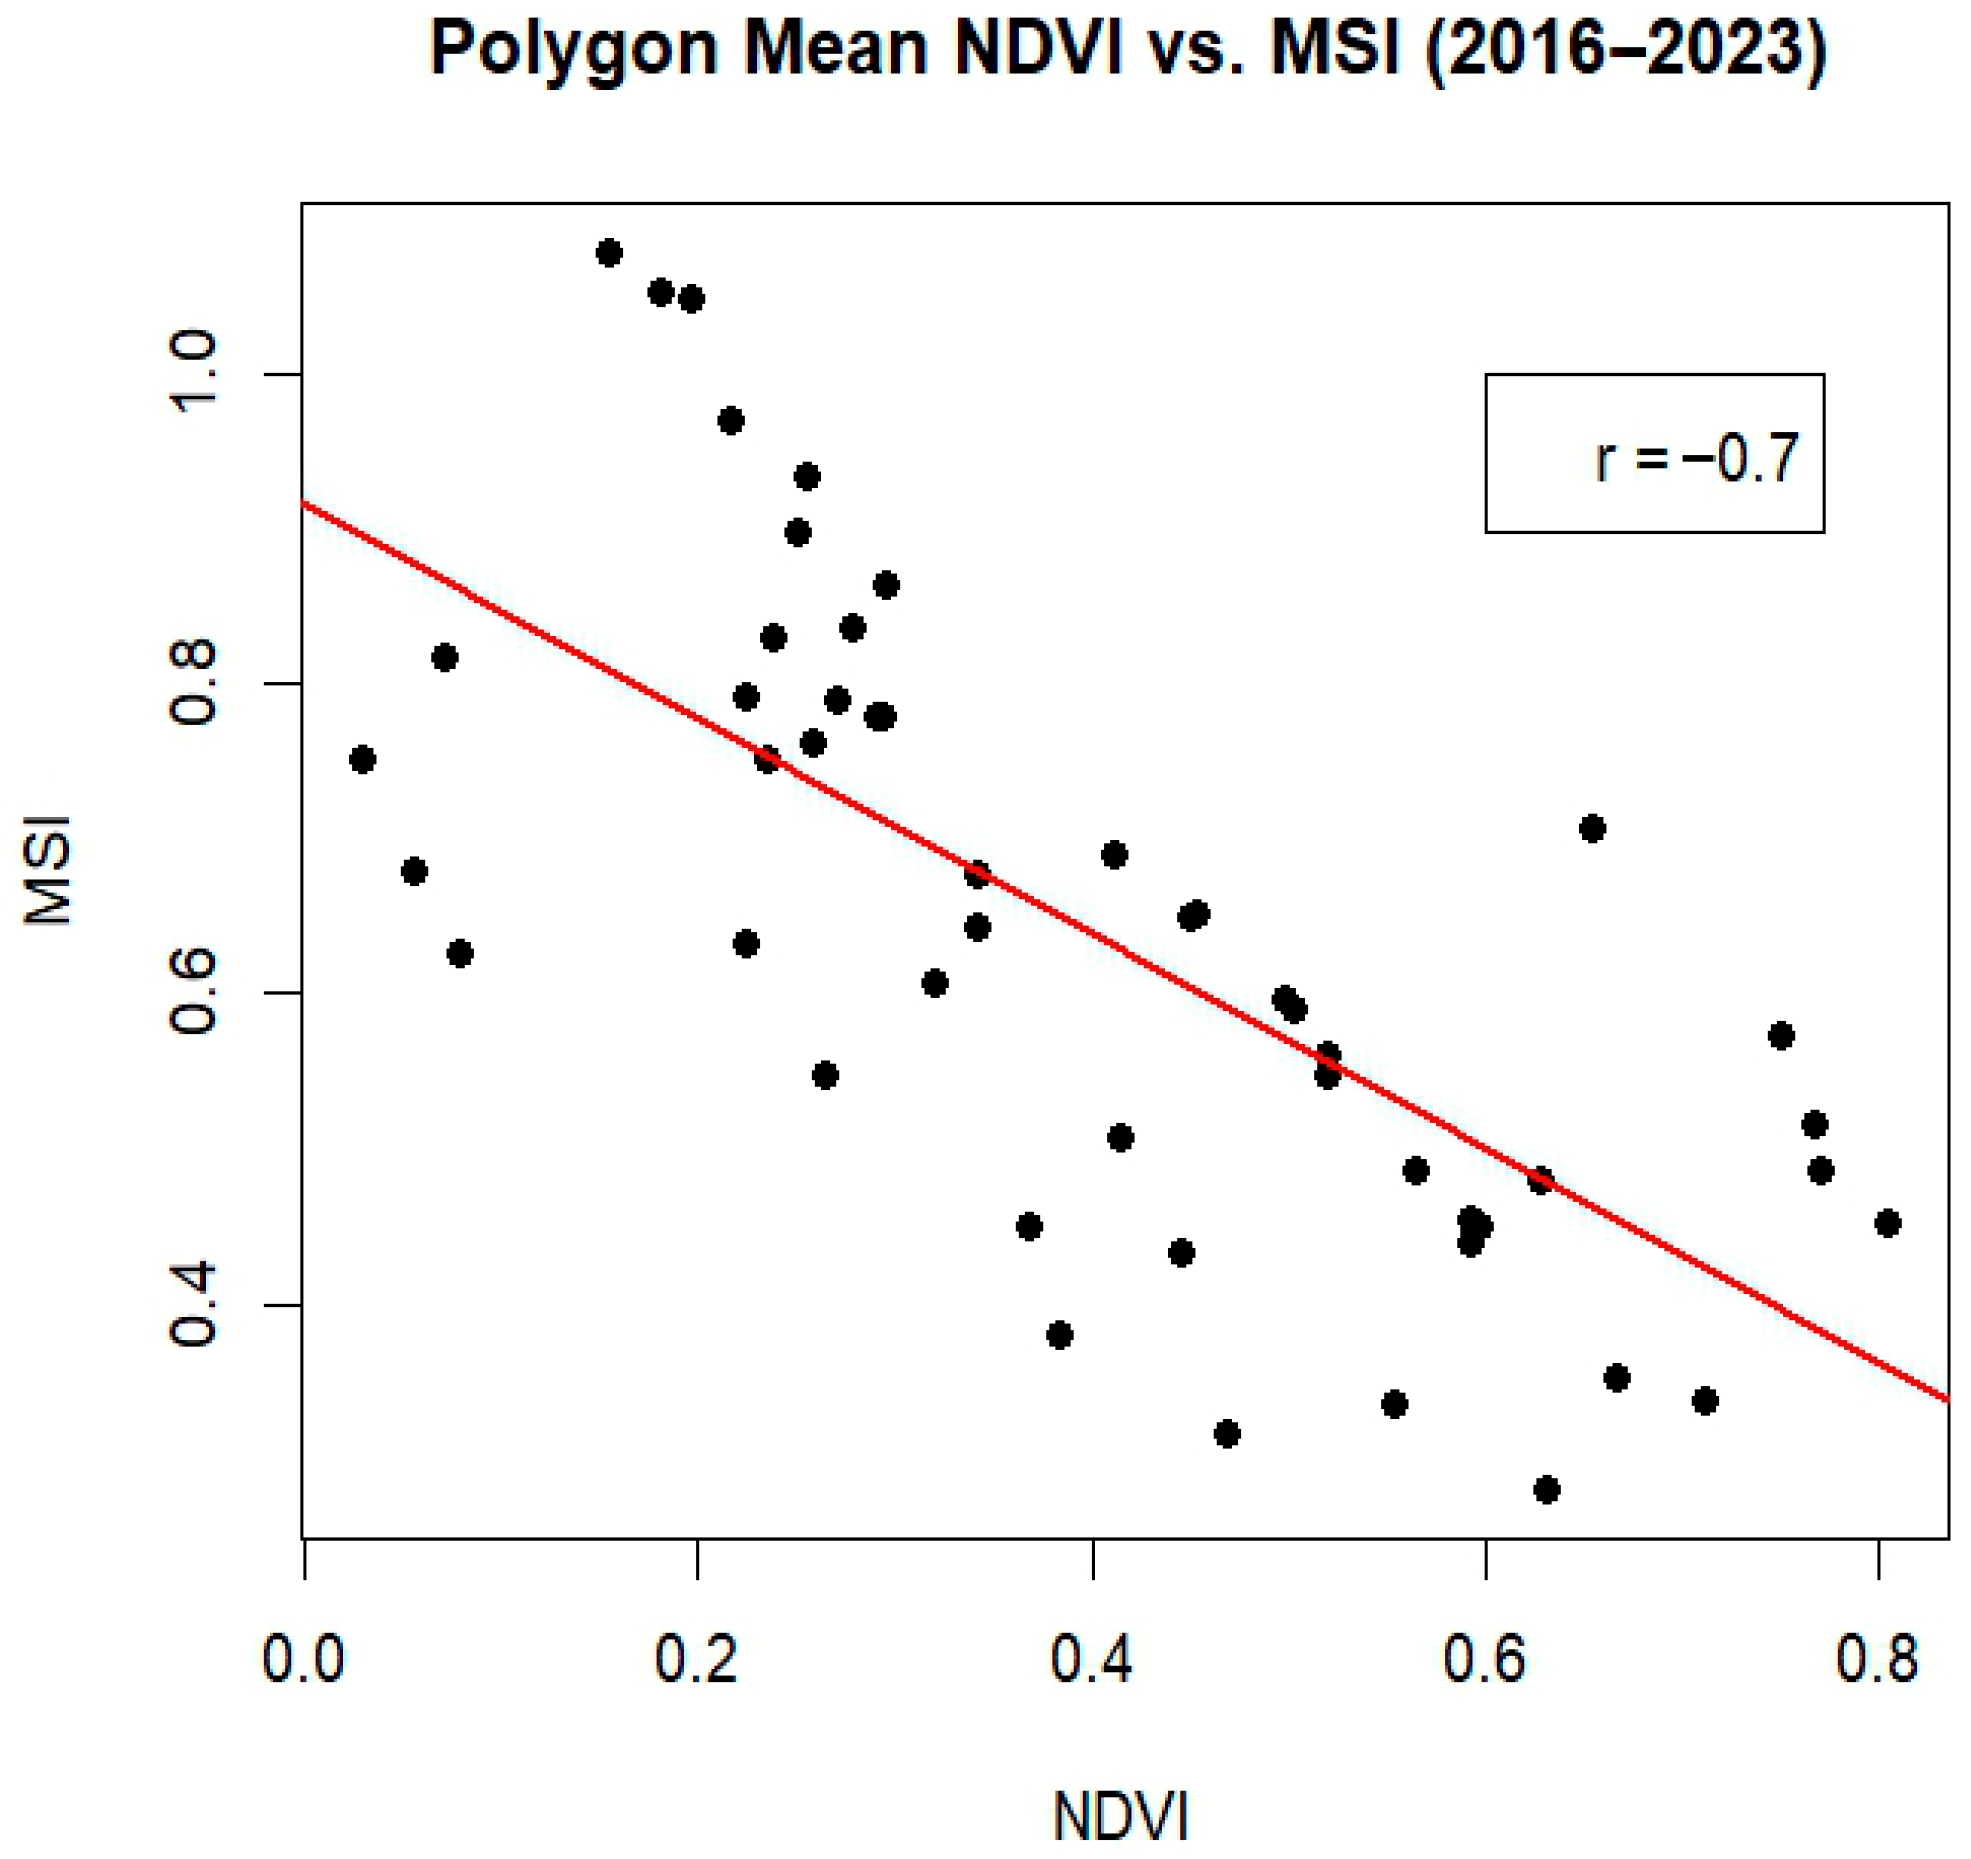
Further, as MSI values are not dependent on any part of the visual part of the electromagnetic spectrum, but NDVI values are, calculations of mangrove polygon patch mean NDVI vs. MSI values were compared to each other as an additional validation check of our in-person visual inspection results. A correlation coefficient of r = −0.7 showed a moderate to strong inverse linear relationship between the two indexes (Figure 5), which was expected because NDVI values increase with greater chlorophyll content (or as a surrogate of leaf area) and MSI values decrease with greater vegetation moisture.
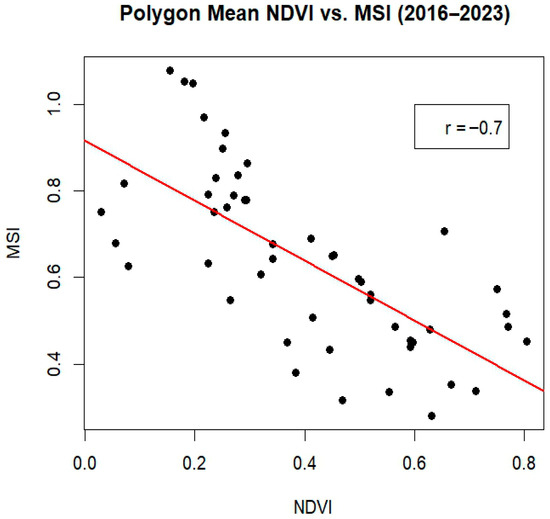
Figure 5.
Chart of 2016 to 2023 mangrove polygon patch NDVI vs. MSI mean values showing a negative linear relationship with a correlation coefficient of r = −0.7. Trend line shown in red.
3.4. Results of Quantitative Analysis
Our quantitative analysis models mangrove forest patch NDVI recovery as a function of a variety of geospatial, environmental, and anthropogenic drivers from 2017 (post storms) to 2023 (Table 3). The purpose of this model was to explore contributing factors to change in mangrove forest health and recovery since the occurrence of Hurricanes Maria and Irma in 2017. We measured the change in vegetation health by looking at the change in mean NDVI for each polygon from post-storm 2017 to the same time of the year in 2023. The final model selected ranked best in terms of AIC when compared to all possible models that could be fit from the collection of drivers under consideration. All possible models were fit using our training cases, and the top 3 models according to AIC are shown in Table 3 where a lower AIC is a better fit.
Table 3.
Top Three Models According to AIC.
Population, mean annual monthly temperature, island size, the NW vs. SE coastal facing direction (aspect), and slope were selected to remain in the model, and the model was re-fit using all available data. Due to a lack of weather station data from Prickly Pear or Great Camano Islands, they were excluded from the model assessment. All drivers retained in the model show evidence of statistical significance, with all associated p-values falling below 0.05 (Table 4). The model chosen for our assessment suggests that roughly 58% of the variability in the 6-year difference may be explained by the relationship with the included variables. The model results suggest a negative association with monthly average yearly rainfall, aspect (primarily along the northwest direction), island size, and primary average slope. It also suggests a positive association with proximity to human populations within 0.5 km (Table 4). In contrast, the parameters of mangrove patch area, perimeter, area-to-perimeter ratio, elevation, mean annual monthly precipitation, and proximity to roads and paths were either confounding or determined to be not significant for our model.
Table 4.
Model Scaled Estimate Rankings.
4. Discussion
4.1. Remotely Sensed Health Indexes for Mapping Mangrove Forest Health
Across the range of time and data examined we harnessed the value of Google Earth Engine and Sentinel-2 Satellite Imagery to calculate NDVI and MSIs for mangrove forests (Figure 2). Using proxies of vegetation indexes to measure mangrove forest health recovery differs from other studies that use satellite imagery to delineate mangrove forest extents [41] or changes in forest extents over time as a measure of recovery [42]. The use of a specific Mangrove Vegetation Index (MVI) to delineate mangroves amidst other vegetation and land cover types is laid out in Baloloy et al. [41]; further, Kotikot et al. [42] used a Random Forest machine learning technique to classify the extent of mangroves from 2020 to 2023. Within our study we defined mangroves via expert knowledge and manual vector delineation from pre-storm high-resolution satellite images instead. To further innovate our forest health index recovery approach, we expanded our analysis to as far back as 2016 with the use of Top of Atmosphere (TOA), manually atmospherically corrected Sentinel-2 imagery. The use of these data provided us with access to pre-storm (hurricanes Irma and Maria) imagery to measure rates of recovery from pre-storm benchmarks. Pre-storm 2016 mangrove forest NDVI values, as measured on all of the islands in our study, had values approximately between 0.6 and 0.7, except for Anagada and Prickly Pear (Figure 2A). These 0.6 to 0.7 values are similar to the 0.7 NDVI values reported by Satyanarayana et al., 2011 [81] for healthy and closed canopy mangrove forests. The pre-storm MSI values for these same mangrove forests show values of 0.3 to 0.5 (Figure 2B), implying the range of MSI values for healthy closed canopy mangrove forests within the BVI.
4.2. Remotely Sensed Health Indexes for Measuring Mangrove Forest Health Recovery
Through the approaches employed, we were able to see substantial immediate post-hurricane decreases in NDVI and increases in MSI values relative to pre-hurricane conditions in all study area mangrove forest polygons (Figure 2). These changes within NDVI and MSI are consistent with the physical effects of the well-known defoliation and damage of Mangroves that was caused by Hurricanes Irma and Maria across the BVI. We were also able to demonstrate increases in NDVI and decreases in MSI values in most study area mangrove polygons in 2019, 2021, and 2023 time periods, except for the outlier of Prickly Pear Island (Figure 2). Excluding Prickly Pear Island, these 2019, 2021, and 2023 changes in NDVI and MSI assessed are consistent with the physical effects of varying levels of mangrove forest health recovery inclusive of regrowth and re-foliation. Other studies show that vegetation health indexes can be helpful measures to compare the health of forest patches [49,53] or even individual tree crowns [35]. Soanes et al. [49] investigated post-hurricane forest health recovery with an NDVI on three mangrove patches on the BVI of Tortola and Jost Van Dyke through 2019. The immediate drop in NDVI post-storm and then varying levels of recovery from year to year that they reported were similar to our findings for those areas and time periods. However, our work extended the spatial and temporal ranges to all known mangrove patches in the Territory through 2023. The breadth of our evaluation was made possible in part due to our construction and use of composite images that contained the best cloud-free and atmospherically corrected pixels over post-annual storm anniversary date two-month periods from 2016 to 2023.
4.3. Remotely Sensed Health Indexes and Variation in Mangrove Forest Health Recovery by Island and Polygon Patch
We have shown varying rates of mangrove forest recovery on different islands via percent recovery calculations of pre- and post-hurricane NDVI and MSI values. However, NDVI recovery appears to lag behind MSI recovery for all islands except for Beef Island (Table 2). This could imply that MSI recovery occurs faster or prior to NDVI recovery within mangroves for our or other mangrove study areas; however, our review of research literature does not provide evidence to support or refute the validity of this finding. The islands of Anegada, Beef Island, Frenchmen’s Cay, and Tortola showed the highest percent recovery rates in both forest health indexes, while the islands of Great Camano, Jost Van Dyke, and Virgin Gorda showed the lowest percent recovery rates, respectively (Figure 2, Table 2). Of all the islands within the study, Prickly Pear singularly exhibited a continued decrease in the NDVI forest health index since the occurrence of hurricanes Maria and Irma (Figure 2, Table 2).
Prickly Pear Island is particularly unique and ecologically distinct from other mangrove patches mapped in this study. The majority of mangroves were associated with a salt pond in the interior of the island that received occasional tidal overwash, while a narrow band of fringing R. mangle occurred on the coastal shore adjacent to the pond. The interior pond mangroves existed in a tidally restricted and seasonally hypersaline environment, dominated by A. germinans prior to the hurricanes, but the pond was breached in those storm events, and its shoreline has been actively eroding through the present. Not only is mangrove recovery poor on Prickly Pear but there are fewer remaining mangroves to contribute to the restoration trajectory. We estimate that less than 30% of the pre-storm original mangroves remain. This factor, more than anything else, explains the continued decline in recovery (Figure 3A,B) at this site and its associated anomalous NDVI and MSI values that represent less chlorophyll greenness (as a function of canopy cover) and dryer conditions relative to the other island mangrove patches of the Territory (Figure 2A,B).
Unlike on Prickly Pear Island, distinctions of the mangroves around the salt ponds on Jost Van Dyke (Figure 3A,B, Inset Maps #1) exhibit strong recovery in both NDVI and MSI values likely due to their intact status and protected inland locations. However, large patches of mangroves on the eastern sides of Jost Van Dyke (Inset Maps 2) and Great Camanoe (Inset Maps 9) both show relatively lower recovery in NDVI and MSI values, likely due to their naturally drier climates.
4.4. Mangrove Forest Health Recovery as a Function of Geospatial, Environmental, and Human-Induced Drivers
To compare the relative practical significance of the effects of our model, we looked at the magnitude of the scaled effect estimates to account for the differences in the strength of the predictors. The population within 0.5 km of the predictor had a positive relationship with mangrove forest recovery from 2017 to 2023. Proximity of human population densities might have an effect of pre-storm fragmentation, reduction, or degradation of mangroves [1,19]. Mangroves close to human populations are also known to provide many ecosystem services to their communities, such as protection from storm surge events [5,6]. Thus, population centers and associated communities close to mangroves may have a particular interest in protecting these resources via post-storm management to repair damage to these forests [92], such as within the Post-Disaster Restoration of Mangroves (PROM) project in the British Virgin Islands [93].
Conversely, with respect to model drivers, a northwest aspect (vs. southeast) coastal facing direction, island size, average annual monthly temperature, and slope had a negative relationship with mangrove forest recovery from 2017 to 2023 (Table 3). This implies that mangrove patches with an aspect in the southeast direction, on smaller islands, with lower temperatures, and shallower slopes favored higher rates of recovery within our model. We suspect this is due to wind and wave patterns, mangrove species distributions specific to each mangrove patch, and their differing tolerance of prevailing tidal regimes (e.g., flooding and salinity tolerance). In general, coastal and terrestrial processes can deliver fine sediment deposition that can be helpful to mangrove growing conditions [94], such as on the southeastern windward coasts of the BVI. Wave and current patterns have also been found to be responsible for the distribution of mangrove propagules [95,96,97] that enhance the potential for mangrove recovery after hurricanes. The windward coasts of the BVI also provides more naturally protected bays, such as Paraquita, Fat Hogs, and Sea Cow bays, which may provide areas of regrowth of mangroves with reduced new storm disturbances. Further, each mangrove species has varying susceptibility to severe damage from broken limbs or uprooting [98], thus potentially promoting faster recovery of leaf regeneration in some species than others. Additionally, higher temperatures can promote greater evaporation, which can lead to elevated salinity (or hypersalinity, particularly in basin mangrove systems). Since R. mangle can be impacted by higher salinity [99], increased salinity could create less ideal conditions for recovery for this dominant mangrove species. Further, shallower slopes have been shown to better support the habitation of mangroves over steeper slopes [100] due to their ability to promote intertidal wave dissipation and sediment deposition.
Other drivers, such as mangrove patch area, perimeter, perimeter-to-area ratio, proximity to roads, and mean monthly precipitation, were confounding or found to be not significant to our model output. Thus, the results of our model are nuanced. Since our results suggest that only 58% of the variability of our model may be influenced by its relationship with the included variables, this indicates that there may be relevant drivers that are not currently being considered in the assessment. As other research has indicated, these drivers may include the presence of a viable understory of seedlings following storm impacts and canopy openness between post-storm trees [61,63], other climate variations [62,64,65,66], and other measures of patch fragmentation [66,67].
4.5. Management Implications of Research Results
The results of our research imply some considerations with regard to future management efforts for local mangrove forests. First, the visualization of mangrove patch NDVI and MSI recovery rates around the Territory (Figure 3A,B) may help inform local decision-makers to focus future management efforts where they best see fit, (i.e., within areas of slow recovery or within areas where natural recovery may be aided by additional management efforts). Second, the results of our model may be helpful to further guide management efforts. For instance, our model suggests that mangrove patches on smaller islands, with relatively lower mean annual monthly temperatures, a southeast aspect, and shallower slopes, favored higher post-storm recovery rates. Thus these parameters might be considered on a patch-by-patch basis when assessing future management efforts. Also, somewhat unexpectedly, our results found that mangrove patches closer to human population centers recovered faster than more remote patches. While we cannot specifically determine why this pattern occurred, it may suggest that any restoration efforts might be more effective at sites that tend to recover faster. Certainly, restoration sites that are more public-facing help promote stewardship, engagement, and education on the importance of mangroves, in addition to being more accessible. Other studies suggest the importance of engaging local populations for this purpose. Del Cid-Alvarado et al. [101] utilized a proportional stratified sampling survey of 300 interviewees around Chame Bay in Panama to show that though 24.6% of the population utilized mangroves in charcoal production, 60% were willing to participate in restoration efforts. Other efforts to engage the public about the importance of mangroves are illustrated by Moussa et al. [102], who explored how others were incorporating the ecological, cultural, and economic awareness that mangroves provide in local and regional tourism plans to promote a willingness for mangrove protection.
In addition to those drivers reported here, other considerations can be taken when promoting the conservation and restoration of mangroves, including, but not limited to mangrove (1) proximity to other coastal habitats (e.g., seagrass and coral), (2) impacts by other acute or chronic disturbances, and (3) relative location to protected lands or conservation easements, particularly if these areas allow for landward migration in the face of sea level rise (e.g., absence of infrastructure or natural topographic features that prevent migration). Evidence of satellite remote sensing in other locations, such as Northern Vietnam, has shown that mangrove programs promoted by the national and local governments were effective positive drivers for the restoration of mangrove forests [44]. Further, In China, mangroves within reserves were shown to have the highest resilience to degradation which prompted recommendations for the expansion of conservation boundaries rather than just creating new restoration areas outside of conservation zones alone [46].
4.6. Future Research Directions and Improvements
Recognizing that restoration and/or natural recovery of coastal habitats can take years to decades to achieve full ecological function [103], we continue to monitor mangrove forest health indexes along their trajectory to pre-hurricane levels. Future approaches can include the use of other forest health metrics and indexes, such as an Enhanced Vegetation Index (EVI) [104] or a Red Edge Normalized Difference Vegetation Index (RENDVI) [105], to monitor mangrove recovery. All remote sensing approaches are improved by the collection of direct field measures, such as the use of ground verification point measurements from real-time kinematics (RTK) Global Positioning System (GPS) units and high-resolution unoccupied aerial vehicle (UAV) acquired imagery to complete stronger quantitative high-resolution ground validation of future assessments. Further investigating the types and quantities of geospatial, environmental, and human-induced drivers will also assist in developing a stronger and more comprehensive mangrove forest health recovery model.
5. Conclusions
Given the mounting threats of catastrophic storm events and the prolonged periods of storm surge that follow, it is imperative to use the most efficient and reproducible approaches to document the very coastal resources that may protect shorelines and coastal infrastructure humans depend upon. Within this study, we utilized the remote sensing vegetation health indexes of NDVI (Normalized Difference Vegetation Index) and MSI (Moisture Stress Index) to document the trajectory of mangrove forest recovery within the BVI following the arrival of hurricanes Irma and Maria in 2017. We have also looked to explore additional geospatial, environmental, and human-induced drivers of post-hurricane mangrove health recovery within the BVI. It is our hope that our approach and the results it has yielded will help inform regional resource protection and strengthen adaptation management in the Territory.
Author Contributions
Conceptualization: G.E.M., M.R.R., B.N.R., S.Z.; methodology: M.R.R., S.G., M.D., B.N.R.; software: M.R.R., S.G., M.D.; validation: M.R.R., M.D.; formal analysis: G.E.M., M.R.R., M.D.; investigation: M.R.R., G.E.M., B.N.R., M.D., S.G.; resources: M.R.R., M.D., S.G.; data curation: M.R.R., S.G.; writing—original draft preparation: M.R.R., M.D.; writing—review and editing G.E.M., B.N.R., M.R.R., M.D., S.Z.: visualization: M.R.R., M.D., G.E.M.; project administration: M.R.R., G.E.M.; funding acquisition: S.Z., G.E.M. All authors have read and agreed to the published version of the manuscript.
Funding
Support for this research was provided in part by the Darwin Initiative, International Union for the Conservation of Nature (IUCN), the J.A. Woollam Foundation, and the Jost Van Dykes Preservation Society.
Data Availability Statement
All satellite imagery data used within this study are available via the Sentinel Satellite archive within Google Earth Engine. All source model data is documented in Table 1.
Conflicts of Interest
The authors declare no conflicts of interest.
Abbreviations
The following abbreviations are used in this manuscript:
| AIC | Akaike Information Criterion |
| ANCOVA | Analysis of Covariance |
| BVI | British Virgin Islands |
| CIR | Color Infrared |
| ESA | European Space Agency |
| GEE | Google Earth Engine |
| MSI | Moisture Stress Index |
| NDVI | Normalized Difference Vegetation Index |
| SR | Surface Reflectance |
| TOA | Top of Atmosphere |
References
- Gore, S.; Wynne, S.P.; Myers, A. UK Overseas Territories in the Northeast Caribbean: Anguilla, British Virgin Islands, Montserrat. In World Seas: An Environmental Evaluation; Academic Press: Cambridge, MA, USA, 2019; pp. 549–565. [Google Scholar] [CrossRef]
- Polidoro, B.A.; Carpenter, K.E.; Collins, L.; Duke, N.C.; Ellison, A.M.; Ellison, J.C.; Farnsworth, E.J. The loss of species: Mangrove extinction risk and geographic areas of global concern. PLoS ONE 2010, 5, e10095. [Google Scholar] [CrossRef] [PubMed]
- Primack, R.B.; Tomlinson, P.B. Variation in tropical forest breeding systems. Biotropica 1980, 12, 229–231. [Google Scholar] [CrossRef]
- Government of the Virgin Islands. Mangrove Brochure: Mangroves of the Virgin Islands (British); Conservation & Fisheries Department: Road Town, Tortola, 1 January 2015. Available online: https://bvi.gov.vg/content/mangroves-virgin-islands-british (accessed on 13 September 2024).
- Zhang, K.; Liu, H.; Li, Y.; Xu, H.; Shen, J.; Rhome, J.; Smith, T.J., III. The role of mangroves in attenuating storm surges. Estuar. Coast. Shelf Sci. 2012, 102, 11–23. [Google Scholar] [CrossRef]
- Blankespoor, B.; Dasgupta, S.; Lange, G.M. Mangroves as Protection from Storm Surges in a Changing Climate; WPS7596; World Bank: Washington, DC, USA, 2016. [Google Scholar] [CrossRef]
- del Valle, A.; Eriksson, M.; Ishizawa, O.A.; Miranda, J.J. Mangroves protect coastal economic activity from hurricanes. Proc. Natl. Acad. Sci. USA 2020, 117, 265–270. [Google Scholar] [CrossRef] [PubMed]
- Asari, N.; Suratman, M.N.; Mohd Ayob, N.A.; Abdul Hamid, N.H. Mangrove as a Natural Barrier to Environmental Risks and Coastal Protection. In Mangroves: Ecology, Biodiversity and Management; Springer: Singapore, 2021; pp. 305–322. [Google Scholar] [CrossRef]
- Miranda, J.J.; Butron, L.; Pantoja, C.; Gunasekera, R. Mangroves as Coastal Protection for Local Economic Activities from Hurricanes in the Caribbean; World Bank Group: Washington, DC, USA, 2021; Available online: https://documents1.worldbank.org/curated/en/174441638210732041/pdf/Mangroves-as-Coastal-Protection-for-Local-Economic-Activities-from-Hurricanes-in-the-Caribbean.pdf (accessed on 13 September 2024).
- Ellison, J.C. Mangrove retreat with rising sea-level, Bermuda. Estuar. Coast. Shelf Sci. 2023, 37, 75–87. [Google Scholar] [CrossRef]
- Saintilan, N.; Khan, N.S.; Ashe, E.; Kelleway, J.J.; Rogers, K.; Woodroffe, C.D.; Horton, B.P. Thresholds of mangrove survival under rapid sea level rise. Science 2020, 368, 1118–1121. [Google Scholar] [CrossRef] [PubMed]
- Chen, Q.; Zhao, Q.; Li, J.; Jian, S.; Ren, H. Mangrove succession enriches the sediment microbial community in South China. Sci. Rep. 2016, 6, 27468. [Google Scholar] [CrossRef] [PubMed]
- Laegdsgaard, P.; Johnson, C.R. Mangrove habitats as nurseries: Unique assemblages of juvenile fish in subtropical mangroves in eastern Australia. Mar. Ecol. Prog. Ser. 1995, 126, 67–81. [Google Scholar] [CrossRef]
- Martin, T.S.H.; Olds, A.D.; Pitt, K.A.; Johnston, A.B.; Butler, I.R.; Maxwell, P.S.; Connolly, R.M. Effective protection of fish on inshore coral reefs depends on the scale of mangrove–reef connectivity. Mar. Ecol. Prog. Ser. 2015, 527, 157–165. [Google Scholar] [CrossRef]
- Lefcheck, J.S.; Hughes, B.B.; Johnson, A.J.; Pfirrmann, B.W.; Rasher, D.B.; Smyth, A.R.; Williams, B.L.; Beck, M.W.; Orth, R.J. Are coastal habitats important nurseries? A meta-analysis. Conserv. Lett. 2019, 12, e12645. [Google Scholar] [CrossRef]
- Spalding, M.; Parrett, C.L. Global patterns in mangrove recreation and tourism. Mar. Policy 2019, 110, 103540. [Google Scholar] [CrossRef]
- Donato, D.C.; Kauffman, J.B.; Murdiyarso, D.; Kurnianto, S.; Stidham, M.; Kanninen, M. Mangroves are among the most carbon-rich forests in the tropics. Nat. Geosci. 2011, 4, 293–297. [Google Scholar] [CrossRef]
- Richards, D.R.; Thompson, B.S.; Wijedasa, L. Quantifying net loss of global mangrove carbon stocks from 20 years of land cover change. Nat. Commun. 2020, 11, 4260. [Google Scholar] [CrossRef] [PubMed]
- Ellison, A.M.; Farnsworth, E.J. Anthropogenic disturbance of Caribbean mangrove ecosystems: Past impacts, present trends, and future predictions. Biotropica 1996, 1, 549–565. [Google Scholar] [CrossRef]
- Bender, M.A.; Knutson, T.R.; Tuleya, R.E.; Sirutis, J.J.; Vecchi, G.A.; Garner, S.T.; Held, I.M. Modeled Impact of Anthropogenic Warming on the Frequency of Intense Atlantic Hurricanes. Science 2010, 327, 454–458. [Google Scholar] [CrossRef] [PubMed]
- Zhang, C.; Durgan, S.D.; Lagomasino, D. Modeling risk of mangroves to tropical cyclones: A case study of Hurricane Irma. Estuar. Coast. Shelf Sci. 2019, 224, 108–116. [Google Scholar] [CrossRef]
- Mo, Y.; Simard, M.; Hall, J.W. Tropical cyclone risk to global mangrove ecosystems: Potential future regional shifts. Front. Ecol. Environ. 2023, 21, 269–274. [Google Scholar] [CrossRef]
- Gilman, E.; Ellison, J.; Duke, N.C.; Field, C. Threats to mangroves from climate change and adaptation options: A review. Aquat. Bot. 2008, 89, 237–250. [Google Scholar] [CrossRef]
- Sidik, F.; Supriyanto, B.; Krisnawati, H.; Muttaqin, M.Z. Mangrove conservation for climate change mitigation in Indonesia. Wiley Interdisciplinary Reviews. Clim. Change 2018, 9, e529. [Google Scholar] [CrossRef]
- Moore, G.M. Community-Based Mangrove Restoration & Management, Woburn Bay Marine Protected Area, Grenada, West Indies, Mangrove Seed Preparation Guidelines. 2014. Available online: https://www.conservationgateway.org/ConservationByGeography/NorthAmerica/Caribbean/science/management/Documents/Mangrove%20Seed%20Preparation%20Guidelines%202009.pdf (accessed on 13 September 2024).
- Figueiredo, A.G.; Abuchacra, R.C.; Falheiro, P.F.; da Silva, F.T.; Vianna, P.J.; Pacheco, C.E. News Techniques for acquiring mangrove topography and tidal flooding information. In Proceedings of the SPE International Conference and Exhibition on Health, Safety, Environment, and Sustainability, Rio de Janeiro, Brazil, 12–14 April 2010; p. SPE-127165-MS. [Google Scholar] [CrossRef]
- Swales, A.; Denys, P.; Pickett, V.I.; Lovelock, C.E. Evaluating deep subsidence in a rapidly-accreting mangrove forest using GPS monitoring of surface-elevation benchmarks and sedimentary records. Mar. Geol. 2016, 380, 205–218. [Google Scholar] [CrossRef]
- Myint, S.W.; Giri, C.P.; Wang, L.; Zhu, Z.; Gillette, S.C. Identifying Mangrove Species and Their Surrounding Land Use and Land Cover Classes Using an Object-Oriented Approach with a Lacunarity Spatial Measure. GISci. Remote Sens. 2008, 45, 188–208. [Google Scholar] [CrossRef]
- Cárdenas, Y.N.; Joyce, K.E.; Maier, S.W. Monitoring mangrove forests: Are we taking full advantage of technology? Int. J. Appl. Earth Obs. Geoinf. 2017, 63, 1–14. [Google Scholar] [CrossRef]
- Shuman, C.S.; Ambrose, R.F. A comparison of remote sensing and ground-based methods for monitoring wetland restoration success. Restor. Ecol. 2003, 11, 325–333. [Google Scholar] [CrossRef]
- Mumby, P.J.; Green, E.P.; Edwards, A.J.; Clark, C.D. Cost-effectiveness of remote sensing for tropical coastal resources assessment and management. J. Environ. Manag. 1999, 55, 157–166. [Google Scholar] [CrossRef]
- Botkin, D.B.; Estes, J.E.; MacDonald, R.M.; Wilson, M.V. Studying the earth’s vegetation from space. Bioscience 1984, 34, 508–514. [Google Scholar] [CrossRef]
- Wang, Y.; Lu, Z.; Sheng, Y.; Zhou, Y. Remote Sensing Applications in Monitoring of Protected Areas. Remote Sens. 2020, 12, 1370. [Google Scholar] [CrossRef]
- Skole, D.; Tucker, C. Tropical deforestation and habitat fragmentation in the Amazon: Satellite data from 1978 to 1988. Science 1993, 260, 1905–1910. [Google Scholar] [CrossRef] [PubMed]
- Kanaskie, C.R.; Routhier, M.R.; Fraser, B.T.; Congalton, R.G.; Ayres, M.P.; Garnas, J.R. Early Detection of Southern Pine Beetle Attack by UAV-Collected Multispectral Imagery. Remote Sens. 2024, 16, 2608. [Google Scholar] [CrossRef]
- Moore, G.E.; Burdick, D.M.; Routhier, M.R.; Novak, A.B.; Payne, A.R. Effects of a large-scale, natural sediment deposition event on plant cover in a Massachusetts salt marsh. PLoS ONE 2021, 16, e0245564. [Google Scholar] [CrossRef] [PubMed]
- Routhier, M.; Moore, G.; Rock, B. Assessing Spectral Band, Elevation, and Collection Date Combinations for Classifying Salt Marsh Vegetation with Unoccupied Aerial Vehicle (UAV)-Acquired Imagery. Remote Sens. 2023, 15, 5076. [Google Scholar] [CrossRef]
- Routhier, M.; Grizzle, R.; Goddard, T.; Ward, K. Eelgrass Distribution in the Great Bay Estuary and Piscataqua River for 2022: Final Project Report Submitted to the Piscataqua Region Estuaries Partnership (2024). 2023. Available online: https://scholars.unh.edu/cgi/viewcontent.cgi?article=1466&context=prep (accessed on 13 September 2024).
- Everitt, J.H.; Yang, C.; Judd, F.W.; Summy, K.R. Use of Archive Aerial Photography for Monitoring Black Mangrove Populations. J. Coast. Res. 2010, 26, 649–653. [Google Scholar] [CrossRef]
- Ballaria, D.; Orellana, D.; Acostaa, E.; Espinoza, A.; Morocho, V. UAV Monitoring for Environmental Management in Galapagos Islands. In Proceedings of the International Archives of the Photogrammetry, Remote Sensing and Spatial Information Sciences, Prague, Czech Republic, 12–19 July 2016; Volume XLI-B1, pp. 1105–1111. [Google Scholar] [CrossRef]
- Baloloy, A.B.; Blanco, A.C.; Ana, R.R.C.S.; Nadaoka, K. Development and application of a new mangrove vegetation index (MVI) for rapid and accurate mangrove mapping. ISPRS J. Photogramm. Remote Sens. 2020, 166, 95–117. [Google Scholar] [CrossRef]
- Kotikot, S.M.; Spencer, O.; Cissell, J.R.; Connette, G.; Smithwick, E.A.; Durdall, A.; Grimes, K.W.; Stewart, H.A.; Tzadik, O.; Canty, S.W. Building a Mangrove Ecosystem Monitoring Tool for Managers Using Sentinel-2 Imagery in Google Earth Engine. Ocean. Coast. Manag. 2024, 256, 107307. [Google Scholar] [CrossRef]
- Hu, L.; Xu, N.; Liang, J.; Li, Z.; Chen, L.; Zhao, F. Advancing the Mapping of Mangrove Forests at National-Scale Using Sentinel-1 and Sentinel-2 Time-Series Data with Google Earth Engine: A Case Study in China. Remote Sens. 2020, 12, 3120. [Google Scholar] [CrossRef]
- Vu, T.T.P.; Pham, T.D.; Saintilan, N.; Skidmore, A.; Luu, H.V.; Vu, Q.H.; Le, N.N.; Nguyen, H.Q.; Matsushita, B. Mapping Multi-Decadal Mangrove Extent in the Northern Coast of Vietnam Using Landsat Time-Series Data on Google Earth Engine Platform. Remote Sens. 2022, 14, 4664. [Google Scholar] [CrossRef]
- Liu, X.; Liao, J.; Shen, G.; Zhang, L.; Chen, B. Extraction of 10 m Resolution Global Mangrove in 2022. Remote Sens. 2024, 16, 2723. [Google Scholar] [CrossRef]
- Fan, C.; Hou, X.; Zhang, Y.; Li, D. Satellite Data Reveal Concerns Regarding Mangrove Restoration Efforts in Southern China. Remote Sens. 2023, 15, 4151. [Google Scholar] [CrossRef]
- Taillie, P.J.; Roman-Cuesta, R.; Lagomasino, D.; Cifuentes-Jara, M.; Fatoyinbo, T.; Ott, L.E.; Poulter, B. Widespread mangrove damage resulting from the 2017 Atlantic mega hurricane season. Environ. Res. Lett. 2020, 15, 64010. [Google Scholar] [CrossRef]
- Dotzler, S.; Hill, J.; Buddenbaum, H.; Stoffels, J. The Potential of EnMAP and Sentinel-2 Data for Detecting Drought Stress Phenomena in Deciduous Forest Communities. Remote Sens. 2015, 7, 14227–14258. [Google Scholar] [CrossRef]
- Soanes, L.M.; Pike, S.; Armstrong, S.; Creque, K.; Norris-Gumbs, R.; Zaluski, S.; Medcalf, K. Reducing the vulnerability of coastal communities in the Caribbean through sustainable mangrove management. Ocean Coast. Manag. 2021, 210, 105702. [Google Scholar] [CrossRef]
- Tucker, C.J. Red and photographic infrared linear combinations for monitoring vegetation. Remote Sens. Environ. 1979, 8, 127–150. [Google Scholar] [CrossRef]
- Gitelson, A.A.; Kaufman, Y.J.; Merzlyak, M.N. Use of a green channel in remote sensing of global vegetation from EOS-MODIS. Remote Sens. Environ. 1996, 58, 289–298. [Google Scholar] [CrossRef]
- Sweet, S.K.; Asmus, A.; Rich, M.E.; Wingfield, J.; Gough, L.; Boelman, N.T. NDVI as a predictor of canopy arthropod biomass in the Alaskan arctic tundra. Ecol. Appl. 2015, 25, 779–790. [Google Scholar] [CrossRef] [PubMed]
- Rock, B.N.; Vogelmann, J.E.; Williams, D.L.; Vogelmann, A.F.; Hoshizaki, T. Remote Detection of Forest Damage. BioScience 1986, 36, 439–445. [Google Scholar] [CrossRef]
- Hunt, E.R.; Rock, B.N. Detection of changes in leaf water content using Near- and Middle-Infrared reflectances. Remote Sens. Environ. 1989, 30, 43–54. [Google Scholar] [CrossRef]
- Avetisyan, D.; Borisova, D.; Velizarova, E. Integrated Evaluation of Vegetation Drought Stress through Satellite Remote Sensing. Forests 2021, 12, 974. [Google Scholar] [CrossRef]
- Roth, L.C.; Clark, U. Hurricanes and mangrove regeneration: Effects of hurricane Joan, October 1988, on the vegetation of Isla del Venado, Bluefields, Nicaragua. Biotropica 1992, 24, 375–384. [Google Scholar] [CrossRef]
- Asbridge, E.; Lucas, R.; Rogers, K.; Accad, A. The extent of mangrove change and potential for recovery following severe Tropical Cyclone Yasi, Hinchinbrook Island, Queensland, Australia. Ecol. Evol. 2018, 8, 10416–10434. [Google Scholar] [CrossRef] [PubMed]
- Eppinga, M.B.; Pucko, C.A. The impact of hurricanes Irma and Maria on the forest ecosystems of Saba and St. Eustatius, northern Caribbean. Biotropica 2018, 50, 723–728. [Google Scholar] [CrossRef]
- Lambert, D. Hurricane disturbance and forest dynamics in east Caribbean mangroves. Ecosphere 2018, 9, e02231. [Google Scholar] [CrossRef]
- Simard, M.; Fatoyinbo, L.; Smetanka, C.; Rivera-Monroy, V.H.; Castaneda-Moya, E.; Thomas, N.; Van der Stocken, T. Mangrove Canopy Height Globally Related to Precipitation, Temperature and Cyclone Frequency. Nat. Geosci. 2019, 12, 40–45. [Google Scholar] [CrossRef]
- Radabaugh, K.R.; Moyer, R.P.; Chappel, A.R.; Dontis, E.E.; Russo, C.E.; Joyse, K.M.; Bownik, M.W.; Goeckner, A.H.; Khan, N.S. Mangrove Damage, Delayed Mortality, and Early Recovery Following Hurricane Irma at Two Landfall Sites in Southwest Florida, USA. Estuaries Coasts 2020, 43, 1104–1118. [Google Scholar] [CrossRef]
- Amaral, C.; Poulter, B.; Lagomasino, D.; Fatoyinbo, T.; Taillie, P.; Lizcano, G.; Canty, S.; Silveira, J.A.H.; Teutli-Hernández, C.; Cifuentes-Jara, M.; et al. Drivers of mangrove vulnerability and resilience to tropical cyclones in the North Atlantic Basin. Sci. Total Environ. 2023, 898, 165413. [Google Scholar] [CrossRef] [PubMed]
- Sherman, R.E.; Fahey, T.J.; Martinez, P. Hurricane impacts on a mangrove forest in the Dominican Republic: Damage patterns and early recovery. Biotropica 2001, 33, 393–408. [Google Scholar] [CrossRef]
- Gillis, L.G.; Hortua, D.A.S.; Zimmer, M.; Jennerjahn, T.C.; Herbeck, L.S. Interactive effects of temperature and nutrients on mangrove seedling growth and implications for establishment. Mar. Environ. Res. 2019, 151, 104750. [Google Scholar] [CrossRef] [PubMed]
- Descroix, L.; Sané, Y.; Thior, M.; Manga, S.-P.; Ba, B.D.; Mingou, J.; Mendy, V.; Coly, S.; Dièye, A.; Badiane, A.; et al. Inverse Estuaries in West Africa: Evidence of the Rainfall Recovery? Water 2020, 12, 647. [Google Scholar] [CrossRef]
- Angelini, C.; Silliman, B.R. Patch size-dependent community recovery after massive disturbance. Ecology 2012, 93, 101–110. [Google Scholar] [CrossRef] [PubMed]
- Bryan-Brown, D.N.; Connolly, R.M.; Richards, D.R.; Adame, F.; Friess, D.A.; Brown, C.J. Global trends in mangrove forest fragmentation. Sci. Rep. 2020, 10, 7117. [Google Scholar] [CrossRef] [PubMed]
- Blake, E.S. The 2017 Atlantic Hurricane Season: Catastrophic Losses and Costs. Weatherwise 2018, 71, 28–37. [Google Scholar] [CrossRef]
- Brando, P.M.; Balch, J.K.; Nepstad, D.C.; Morton, D.C.; Putz, F.E.; Coe, M.T.; Silvério, D.; Macedo, M.N.; Davidson, E.A.; Nóbrega, C.C.; et al. Abrupt increases in Amazonian tree mortality due to drought–fire interactions. Proc. Natl. Acad. Sci. USA 2014, 111, 6347–6352. [Google Scholar] [CrossRef] [PubMed]
- Allen, K.J.; Verdon-Kidd, D.C.; Sippo, J.Z.; Baker, P.J. Compound climate extremes driving recent sub-continental tree mortality in northern Australia have no precedent in recent centuries. Sci. Rep. 2021, 11, 18337. [Google Scholar] [CrossRef] [PubMed]
- Berenguer, E.; Lennox, G.D.; Ferreira, J.; Malhi, Y.; Aragão, L.E.O.C.; Barreto, J.R.; Del Bon Espírito-Santo, F.; Figueiredo, A.E.S.; França, F.; Gardner, T.A.; et al. Tracking the impacts of El Niño drought and fire in human-modified Amazonian forests. Proc. Natl. Acad. Sci. USA 2021, 118, e2019377118. [Google Scholar] [CrossRef] [PubMed]
- Weather and Climate, British Virgin Islands Climate, Nearby Locations. 2024. Available online: https://weatherandclimate.com/british-virgin-islands/british-virgin-islands (accessed on 8 September 2024).
- Climate Data Website. 2021. Available online: https://en.climate-data.org/north-america/british-virgin-islands/road-town/road-town-28879/ (accessed on 19 June 2025).
- CIA. The World Factbook, Central Intelligence Agency. 2025. Available online: https://www.cia.gov/the-world-factbook/countries/british-virgin-islands/ (accessed on 21 June 2025).
- European Space Agency (ESA). Sentinel-2. 2023. Available online: https://www.esa.int/Applications/Observing_the_Earth/Copernicus/Sentinel-2 (accessed on 10 October 2023).
- Gorelick, N.; Hancher, M.; Dixon, M.; Ilyushchenko, S.; Thau, D.; Moore, R. Google Earth Engine: Planetary-scale geospatial analysis for everyone. Remote Sens. Environ. 2017, 202, 18–27. [Google Scholar] [CrossRef]
- Yin, F.; Lewis, P.E.; Gómez-Dans, J.L. Bayesian atmospheric correction over land: Sentinel-2/MSI and Landsat 8/OLI. Geosci. Model Dev. 2022, 15, 7933–7976. [Google Scholar] [CrossRef]
- Yin, F.; Gomez-Dans, J.; Lewis, P. A Sensor Invariant Atmospheric Correction Method for Satellite Images. In Proceedings of the IGARSS 2018—2018 IEEE International Geoscience and Remote Sensing Symposium, Valencia, Spain, 22–27 July 2018; pp. 1804–1807. [Google Scholar] [CrossRef]
- Yin, F.; Lewis, P.E.; Gómez-Dans, J.L. Available on Github. 2018. Available online: https://github.com/MarcYin/SIAC_GEE (accessed on 21 December 2023).
- ESRI. ArcGIS Pro, Version 3.2; ESRI: Redland, CA, USA, 2024. Available online: https://www.esri.com/en-us/arcgis/products/arcgis-pro/ (accessed on 8 September 2024).
- Satyanarayana, B.; Mohamad, K.A.; Idris, I.F.; Husain, M.L.; Dahdouh-Guebas, F. Assessment of mangrove vegetation based on remote sensing and ground-truth measurements at Tumpat, Kelantan Delta, East Coast of Peninsular Malaysia. Int. J. Remote Sens. 2011, 32, 1635–1650. [Google Scholar] [CrossRef]
- Collin, A.; Lambert, N.; Etienne, S. Satellite-based salt marsh elevation, vegetation height, and species composition mapping using the superspectral WorldView-3 imagery. Int. J. Remote Sens. 2018, 39, 5619–5637. [Google Scholar] [CrossRef]
- Suir, G.M.; Saltus, C.L.; Reif, M.K.; Sasser, C.E.; Harris, J.M.; Diaz, R.; Giffin, G. Evaluating Drone Truthing as an Alternative to Ground Truthing: An Example with Wetland Plant Identification. 2021. Available online: https://erdc-library.erdc.dren.mil/server/api/core/bitstreams/aef5f5f3-f104-4aab-9c9a-128ddee5517e/content (accessed on 14 September 2024).
- Rhew, I.C.; Vander Stoep, A.; Kearney, A.; Smith, N.L.; Dunbar, M.D. Validation of the normalized difference vegetation index as a measure of neighborhood greenness. Ann. Epidemiol. 2011, 21, 946. [Google Scholar] [CrossRef] [PubMed]
- Eskandari, S.; Reza Jaafari, M.; Oliva, P.; Ghorbanzadeh, O.; Blaschke, T. Mapping Land Cover and Tree Canopy Cover in Zagros Forests of Iran: Application of Sentinel-2, Google Earth, and Field Data. Remote Sens. 2020, 12, 1912. [Google Scholar] [CrossRef]
- Moore, G.E. Field Observations and On-Site Photos of Mangrove Forests within the British Virgin Islands—2016 to 2023; Unpublished data; University of New Hampshire: Durham, NH, USA, 2023. [Google Scholar]
- Cohen, W.B. Response of vegetation indices to changes in three measures of leaf water stress. Photogramm. Eng. Remote Sens. 1991, 57, 195–202. Available online: https://www.asprs.org/wp-content/uploads/pers/1991journal/feb/1991_feb_195-202.pdf (accessed on 21 December 2024).
- Wang, S.; Zheng, X.; Du, Y.; Zhang, G.; Wang, Q.; Han, D.; Zhang, J. Estimation of Short-Term Vegetation Recovery in Post-Fire Siberian Dwarf Pine (Pinus pumila) Shrublands Based on Sentinel-2 Data. Fire 2025, 8, 47. [Google Scholar] [CrossRef]
- ESA. ESA DEM GLO-30: Global 30 m Digital Elevation Model. 2015. Available online: https://dataspace.copernicus.eu/explore-data/data-collections/copernicus-contributing-missions/collections-description/COP-DEM (accessed on 8 August 2024).
- Office for the Coordination of Humanitarian Affairs (OCHA). United Nations. 2020. Available online: https://www.unocha.org/ (accessed on 1 August 2024).
- OpenStreetMap. OpentstreetMap. Downloading Data. 2024. Available online: https://wiki.openstreetmap.org/wiki/Downloading_data (accessed on 8 July 2024).
- Silveira, J.; Hernandez, C.; Secaira Fajardo, F.; Braun, R.; Bowman, J.; Geselbracht, L.; Musgrove, M.; Rogers, M.; Schmidt, J.; Toral, P.; et al. Hurricane Damages to Mangrove Forests and Post-Storm Restoration Techniques and Costs; The Nature Conservancy: Arlington, VA, USA, 2022. [Google Scholar] [CrossRef]
- Goodwin, E.; Garciea, V.R.; Palaka, K.; Zaluski, S.; Moore, G.; Zagner, I. Darwin Plus: Overseas Territories Environment and Climate Fund Annual Report. International Union for Conservation of Nature, British Virgin Islands. March 2022. Available online: https://www.darwininitiative.org.uk/documents/DPLUS085/26058/DPLUS085%20AR2%20-%20rev%20-%20edited.pdf (accessed on 22 December 2024).
- Furukawa, K.; Wolanski, E. Sedimentation in Mangrove Forests. Mangroves Salt Marshes 1996, 1, 3–10. [Google Scholar] [CrossRef]
- Jönsson, B.F.; Watson, J.R. The timescales of global surface-ocean connectivity. Nat. Commun. 2016, 7, 11239. [Google Scholar] [CrossRef] [PubMed]
- Van der Stocken, T.; Wee, A.K.S.; De Ryck, D.J.R.; Vanschoenwinkel, B.; Friess, D.A.; Dahdouh-Guebas, F.; Simard, M.; Koedam, N.; Webb, E.L. A general framework for propagule dispersal in mangroves. Biol. Rev. Camb. Philos. Soc. 2019, 94, 1547–1575. [Google Scholar] [CrossRef] [PubMed]
- Wang, W.; Li, X.; Wang, M. Propagule Dispersal Determines Mangrove Zonation at Intertidal and Estuarine Scales. Forests 2019, 10, 245. [Google Scholar] [CrossRef]
- Kossin, J.P.; Knapp, K.R.; Olandor, T.L.; and Velden, C.S. Global increase in major tropical cyclone exceedance probability over the past four decades. Proc. Natl. Acad. Sci. USA 2020, 17, 11975–11980. [Google Scholar] [CrossRef] [PubMed]
- Sánchez, A.R.; Pineda, J.E.M.; Casas, X.M.; Calderón, J.H.M. Influence of Edaphic Salinity on Leaf Morphoanatomical Functional Traits on Juvenile and Adult Trees of Red Mangrove (Rhizophora mangle): Implications with Relation to Climate Change. Forests 2021, 12, 1586. [Google Scholar] [CrossRef]
- Cannon, D.; Kibler, K.; Donnelly, M.; McClenachan, G.; Walters, L.; Roddenberry, A.; Phagan, J. Hydrodynamic habitat thresholds for mangrove vegetation on the shorelines of a microtidal estuarine lagoon. Ecol. Eng. 2020, 158, 106070. [Google Scholar] [CrossRef]
- Del Cid-Alvarado, R.J.; Lopez, O.R.; Rodríguez-González, P.M.; Feás-Vázquez, J. Social Perception and Engagement in Mangrove Restoration: A Case Study in Central America. Land 2024, 13, 1783. [Google Scholar] [CrossRef]
- Moussa, L.G.; Mohan, M.; Burmeister, N.; King, S.A.L.; Burt, J.A.; Rog, S.M.; Watt, M.S.; Udagedara, S.; Sujud, L.; Montenegro, J.F.; et al. Mangrove Ecotourism along the Coasts of the Gulf Cooperation Council Countries: A Systematic Review. Land 2024, 13, 1351. [Google Scholar] [CrossRef]
- Chmura, G.; Burdick, D.M.; Moore, G.E. Recovering salt marsh ecosystem services through tidal restoration. In Restoring Tidal Flow to Salt Marshes: A Synthesis of Science and Management; Roman, C.T., Burdick, D.M., Eds.; Island Press: Washington, DC, USA, 2012. [Google Scholar]
- Huete, A.R.; Liu, H.; van Leeuwen, W.J. The use of vegetation indices in forested regions: Issues of linearity and saturation. In Proceedings of the IGARSS’97—1997 IEEE International Geoscience and Remote Sensing Symposium Proceedings. Remote Sensing-a Scientific Vision for Sustainable Development, Singapore, 3–8 August 1997; Volume 4, pp. 1966–1968. Available online: https://ieeexplore.ieee.org/document/609169 (accessed on 21 December 2024).
- Sims, D.A.; Gamon, J.A. Relationships between leaf pigment content and spectral reflectance across a wide range of species, leaf structures and developmental stages. Remote Sens. Environ. 2002, 81, 337–354. [Google Scholar] [CrossRef]


Disclaimer/Publisher’s Note: The statements, opinions and data contained in all publications are solely those of the individual author(s) and contributor(s) and not of MDPI and/or the editor(s). MDPI and/or the editor(s) disclaim responsibility for any injury to people or property resulting from any ideas, methods, instructions or products referred to in the content. |
© 2025 by the authors. Licensee MDPI, Basel, Switzerland. This article is an open access article distributed under the terms and conditions of the Creative Commons Attribution (CC BY) license (https://creativecommons.org/licenses/by/4.0/).