Review

Accelerated Adoption of Google Earth Engine for Mangrove Monitoring: A Global Review

by
K. M. Ashraful Islam
1,2,*,
Paulo Murillo-Sandoval
3,
Eric Bullock
4 and
Robert Kennedy
1
1
College of Earth, Ocean, and Atmospheric Sciences, Oregon State University, Corvallis, OR 97331, USA
2
Department of Urban and Regional Planning, Chittagong University of Engineering and Technology, Raozan, Chattogram 4349, Bangladesh
3
Departamento de Infraestructura y Geomática, Facultad de Ciencias del Hábitat, Diseño e Infraestructura, Universidad del Tolima, Ibagué 730001, Colombia
4
US Forest Service, Rocky Mountain Research Station, Riverdale, UT 84401, USA
*
Author to whom correspondence should be addressed.
Remote Sens. 2025, 17(13), 2290; https://doi.org/10.3390/rs17132290
Submission received: 29 April 2025 / Revised: 16 June 2025 / Accepted: 1 July 2025 / Published: 3 July 2025
(This article belongs to the Special Issue Remote Sensing in Mangroves III)

Abstract

Mangrove forests support coastal resilience, biodiversity, and significant carbon sequestration, yet they face escalating threats from climate change, urban expansion, and land-use change. Traditional remote sensing workflows often struggle with large data volumes, complex preprocessing, and limited computational resources. Google Earth Engine (GEE) addresses these challenges through scalable, cloud-based computation, extensive, preprocessed imagery catalogs, built-in algorithms for rapid feature engineering, and collaborative script sharing that improves reproducibility. To evaluate how the potential of GEE has been harnessed for mangrove research, we systematically reviewed peer-reviewed articles published between 2017 and 2022. We examined the spectrum of GEE-based tasks, the extent to which studies incorporated mangrove-specific preprocessing, and the challenges encountered. Our analysis reveals a noteworthy yearly increase in GEE-driven mangrove studies but also identifies geographic imbalances, with several high-mangrove-density countries remaining underrepresented. Although most studies leveraged streamlined preprocessing and basic classification workflows, relatively few employed advanced automated methods. Persistent barriers include limited coding expertise, platform quotas, and sparse high-resolution data in certain regions. We outline a generalized workflow that includes automated tidal filtering, dynamic image composite generation, and advanced classification pipelines to address these gaps. By synthesizing achievements and ongoing limitations, this review offers guidance for future GEE-based mangrove studies and conservation efforts and aims to improve methodological rigor and maximize the potential of GEE.

Graphical Abstract

1. Introduction

The world would not be the same without mangroves. They are vital to protecting coastlines from natural disasters [1] and their loss would significantly impact coastal resilience, biodiversity, and ecological balance [1]. Although only about 3% of the tropical forests in the world are mangroves, they house unique and diverse animal species [2], contribute to maintaining coastal ecosystems and food chains [3], help combat natural disasters such as tropical cyclones and coastal erosion [4], and provide timber [5]. The evaluation of ecosystem services of mangroves has been estimated to be $194,000 per hectare per year [6]. However, mangrove degradation is a global concern [7], as around 4.3% of the world’s mangroves disappeared between 1996 and 2016 [8]. The increase in population, climate change, aquaculture, and the growth of industrialization and urbanization threaten the global existence of mangroves [3]. The extirpation of substantial mangrove areas can result in the release of toxic substances into the environment, potentially damaging both upstream and downstream regions [9]. In addition, their loss removes breeding and feeding sites for a variety of marine life, including oysters, shrimp, and crabs [9]. Because mangroves play an important role in the sequestration of carbon, nitrogen, and heavy metals, their decline could contribute to increased global warming if not addressed [4]. Hence, it is crucial to closely monitor their condition and depletion rate.
Due to their significance, mangroves have been the subject of substantial research. Scientific studies on managing, restoring, conserving, mapping, and monitoring mangroves have been carried out by organizations such as the United Nations Educational, Scientific and Cultural Organization (UNESCO), United Nations Development Programme (UNDP), United Nations Environment Programme (UNEP), International Society for Mangrove Ecosystems (ISME), International Union for Conservation of Nature (IUCN), World Wildlife Fund (WWF), and Food and Agriculture Organization (FAO) [10,11,12,13,14]. Recently, scholarly attention has turned to mangroves for their role in the carbon cycle [15,16,17,18,19,20,21]. Due to their high carbon sequestration capacities, the loss of mangroves can have a substantial impact on global carbon budgets [3,22]. To participate in United Nations Framework Convention on Climate Change (UNFCCC) mitigation initiatives (e.g., Reduced Emissions from Deforestation and Degradation (REDD+), Clean Development Mechanism (CDM)), it is imperative to quantify the baseline carbon stock of ecosystems such as mangroves, which are known to store significant proportions of carbon per unit area [4,23,24,25,26].
Remote sensing (RS) can play a key role in mangrove science. RS techniques can reduce data acquisition-related difficulties and financial limitations associated with traditional field research [27,28,29,30]. RS can help detect early signs of mangrove deterioration and also plays a key role in mangrove management [31]. The use of RS has facilitated a shift in emphasis from project-scale to regional- and global-scale mangrove investigations [32]. Moreover, the environmental and economic advantages associated with the carbon sequestration and storage capabilities of mangroves are widely acknowledged by carbon markets [21], leading to a greater focus on the use of RS technologies to quantify carbon stocks in mangroves [33].
Compared with other forest ecosystems, mangrove RS poses more challenges. The presence of cloud cover is especially problematic in coastal zones, where mangroves are the most common [28,34]. As mangroves are found mainly in fragmented patches along coastal belts, high-resolution multitemporal images are needed to effectively monitor them [35]. The detection of submerged mangroves is another significant challenge of this task [36]. To do this, a thorough collection of available satellite images is required, as well as an evaluation of the image metadata to establish the specific timing of high and low tides [37,38].
In recent years, mangrove management and conservation initiatives have evolved from localized field surveys to programs that require long-term monitoring and rapid response to emerging threats [39,40]. Coastal agencies require multidecadal datasets to assess gradual processes in a mangrove ecosystem, as well as near-real-time analyses to respond quickly to extreme events (e.g., cyclone-driven defoliation, unplanned land use conversions) [39,40,41]. Generating and maintaining massive multisensor time series along an extensive mangrove coastline spanning thousands of kilometers requires images in the petabyte range. Thus, processing big data archives on local workstations causes delays and inconsistencies, preventing timely decision-making [42]. Modern mangrove conservation requires a solution that automates data ingestion, preprocessing, and analysis to ensure broad spatial and temporal coverage and quick turnaround for management [27,38].
However, mangrove studies have historically been limited by data availability, the shortage of computational resources, and the lack of automation in image processing [27]. In traditional remote-sensing approaches, researchers often needed to download large volumes of raw satellite data locally, manually apply cloud masks, stitch multiscene mosaics, and perform classification on desktop machines. These steps were time-consuming, error-prone, and difficult to scale beyond regional projects [27]. There was an increasing demand for more frequent and accurate monitoring of mangroves and the use of high-resolution multitemporal images to improve the accuracy of change detection and reduce the manual workload associated with data download and processing [43]. Furthermore, global mangrove studies required improved and fast computational platforms [28]. Despite advances in local computing power, the workflows for global studies could not efficiently handle petabyte-scale archives [27] (readers are referred to Section 3 for additional information).
The debut of Google Earth Engine (GEE) changed the way forest research is conducted using remote sensing by shifting all heavy data management and computation to a cloud-based platform [44]. Instead of manually downloading and preprocessing imagery, users can access a vast preprocessed catalog of Landsat, Sentinel, MODIS, and other sensors [44]. It also opened up advanced analytical options [45,46]. GEE provides an extensive array of tools for forest research, including image overlay, change vector analysis, indices computation, classification, transformation, and principal component analysis [46]. Furthermore, GEE allows users to obtain statistics of forest losses and gains over time using all available images [46]. In essence, GEE is invaluable for identifying spatial and temporal changes in forest characteristics and cover [46]. Therefore, it is no surprise that through its wide range of preprocessed satellite images, robust cloud computing capabilities, and interactive result dissemination flexibilities, GEE has become an invaluable tool for supporting and strengthening large-scale research initiatives in mangrove forest ecosystems [47]. The use of GEE has the potential to influence mangrove conservation and management practices in countries such as China [35], Vietnam [48], Bangladesh [49], Indonesia [50], and Myanmar [38], where data is often scarce and resources are limited to conduct field investigations.
However, there is still a knowledge gap in the current trends in mangrove research using GEE, specific use cases of GEE, and an understanding of how the many tools accessible on GEE can be leveraged collectively efficiently for mangrove monitoring. Furthermore, there are limited documents that highlight the constraints and considerations when using GEE in mangrove research, as well as studies that highlight specific case studies in which GEE has made major contributions to the area. Although several papers [29,30,33] have reviewed articles that focused on mangrove RS, reviews of how GEE was used for mangrove studies are scarce. Jahromi et al. [46] while reviewing the use of GEE for forest sciences, listed five articles that used GEE for mangrove mapping/classification. Gilani et al. [51] reviewed seven scientific articles that explicitly used GEE for mangrove mapping and reported on the study sites, modeling techniques, and the accuracy of the classification routines. However, since its inception in 2017, there has been a notable increase in the use of GEE for the study of mangroves. As described in the second section, numerous studies have employed GEE for applications related to mangrove mapping and analysis. Critical reviews of existing research can contribute significantly to the advancement of scientific knowledge in a given field [52]. Given the growing body of work on GEE applications in mangrove research, a dedicated review has become both timely and necessary. Furthermore, current knowledge regarding opportunities, limitations, and prospects of utilizing GEE for mangrove studies is still at a rudimentary level.
GEE supports a broad array of mangrove research tasks, and organizing these applications into clear categories is essential for grasping their underlying principles. By surveying existing efforts, we can distill the prevailing practices in GEE-driven mangrove analysis. An in-depth, worldwide review will enrich our insight into the principal challenges, methodologies, and considerations associated with using GEE for remote-sensing–based mangrove research. Finally, identifying emerging themes in recent GEE-based mangrove studies will help anticipate future directions in the field.
The purpose of this present article is to offer an extensive review of scientific efforts carried out by mangrove researchers utilizing GEE from 2017 to 2022. This article has four objectives: (1) to document how GEE has improved the remote sensing of mangroves and to investigate the many applications of GEE; (2) to find out research domains that leveraged GEE for mangrove studies; (3) to document the challenges encountered and identify the common practices for mangrove analysis using GEE; and (4) to provide insight into future research directions in this area.

2. Methods

For our literature review, we relied on the Web of Science. The keywords used on the platform were Google Earth Engine (or GEE) and Mangrove. On the Web of Science Core Collection, we used this query: (((TS = (Google Earth Engine)) OR TS = (GEE))) AND TS = (Mangrove). Our inclusion criteria were as follows:
  • Peer-reviewed journal articles published in English between January 2017 and December 2022.
  • Explicit use of GEE for any stage of data collection or analysis.
  • Focus on mangrove ecosystems (e.g., extent mapping, species classification, change detection, carbon accounting).
We did not apply any filter based on journal impact factor. Instead, we relied on Web of Science’s own editorial and impact-based selection process. It is important to acknowledge that there exist several more databases, such as Google Scholar and Scopus, which serve as platforms for hosting academic literature [53]. However, for the purpose of our current analysis, we limited our selection of journals to those included in the Web of Science database. This is because the Web of Science team employs rigorous evaluation criteria to ensure that quality works are hosted in its repository [54]. They have, for example, 24 quality criteria aimed to choose for editorial integrity, as well as 4 impact criteria that seek out the most prominent journals in their respective disciplines [55]. However, future systematic reviews could incorporate complementary databases such as Scopus or Google Scholar to capture any additional studies that may not appear within Web of Science’s indexing portfolio.
Based on these search terms (searched on 28 March 2023), we found 75 articles that were published from 2017 to 2022. We carefully read all 75 papers and selected only those that used GEE, at least for data collection, and specifically studied mangroves. A total of 54 scientific journal articles were selected for final evaluation. If we had any questions about a specific method, analysis result, or use of GEE in an article, we contacted the paper’s corresponding authors for clarification. We organized the papers according to theme (mangrove RS subfield), motivation (driving factors) and specific applications of GEE in mangrove studies.

3. Pre-GEE Era: Problems Encountered

During the pre-GEE era, researchers investigating mangroves faced numerous obstacles. According to Giri et al. [28], the issue of cloud cover in satellite imagery posed a significant obstacle for researchers. Moreover, in a separate study, Giri et al. [43] used Landsat images and had to select only cloud-free images. The raw images further required them to convert digital numbers into top-atmospheric reflectance. They also employed the maximum likelihood classification algorithm but observed poor change detection accuracy. As a future direction, they pointed to the need for frequent and credible monitoring of mangroves by utilizing high multitemporal images to improve accuracy and change detection capabilities. Ibharim et al. [56] conducted their investigation on mangroves using only three multispectral satellite data sources. Consequently, this restriction hindered the ability to capture temporal variations and limited the scope to conduct a broad analysis of mangrove spatiotemporal change dynamics. Another study conducted by Jean-Baptiste and Jensen [57] focused on the utilization of a single (clearest non-cloudy) scene. Younes Cárdenas et al. [27] emphasized this limitation, observing that the use of a single image yielded limited results and did not demonstrate the persistence of relationships between spectral indices of mangroves and biophysical variables. Consequently, they expressed concern regarding the limited use of all available satellite images. According to them, most studies analyzed fewer than ten images, which increased uncertainty, ignored the impact of extreme weather events on mangrove loss, and may have obscured sections of mangrove forests due to tidal height or water. Therefore, adequate observations are required to detect subtle or precipitous changes in mangroves, as this could make a substantial difference in preventing catastrophic diebacks and allowing for prompt responses [27].
The influence of water under the mangrove canopy, specifically the height of the tide, posed an additional significant challenge [27,58]. Younes Cárdenas et al. [27] highlighted the importance of examining how tidal height affects the spectral signature of mangroves. However, they observed that few mangrove studies incorporated tidal influences, which likely have affected the results, especially in regions with significant tidal fluctuations such as mangrove forests in Malaysia, Southern China, and Vietnam. To accurately map submerged mangroves, it is important to collect enough data, possibly leveraging all available satellite data, including images taken during high and low tides.
In addition, automation was limited during the pre-GEE era of mangrove research. Younes Cárdenas et al. [27] observed that a limited number of articles reported automation of tasks, such as calculating spectral indices for large image volumes. This limitation emphasized the need for tools and/or techniques that could facilitate and automate data analysis processes to manage the immense volume of data that is currently available. Furthermore, the need for remote sensing expertise and specialized software for image processing presented obstacles for researchers working with optical and SAR imagery [29,30]. Commercial software packages (e.g., ERDAS Imagine, ENVI, ArcGIS) often carry hefty license fees, which limited accessibility.
In addition to data limitations, the pre-GEE era was beset by computational inadequacies and a lack of local machines with sufficient image-processing capacity [27]. Considering this, Younes Cárdenas et al. [27], Giri [59], and Granell et al. [60] highlighted the significance of incorporating open-source cloud computing resources in future mangrove research. This concept originated not only from the need for adequate data storage and processing capabilities but also from the search for cost-effective solutions for large-scale, long-term mangrove research.
In light of these obstacles, Wang et al. [61] suggested that researchers should leverage powerful cloud computing platforms such as GEE. GEE maintains a vast quantity of preprocessed imagery from multiple sources (including a full archive of Landsat, Sentinel, and MODIS) [44], which can facilitate the development of large-scale mangrove studies. The availability of petabytes of data, as well as a variety of processing tools and algorithms, can enable researchers to surmount previous limitations and conduct in-depth analyses of mangrove ecosystems.

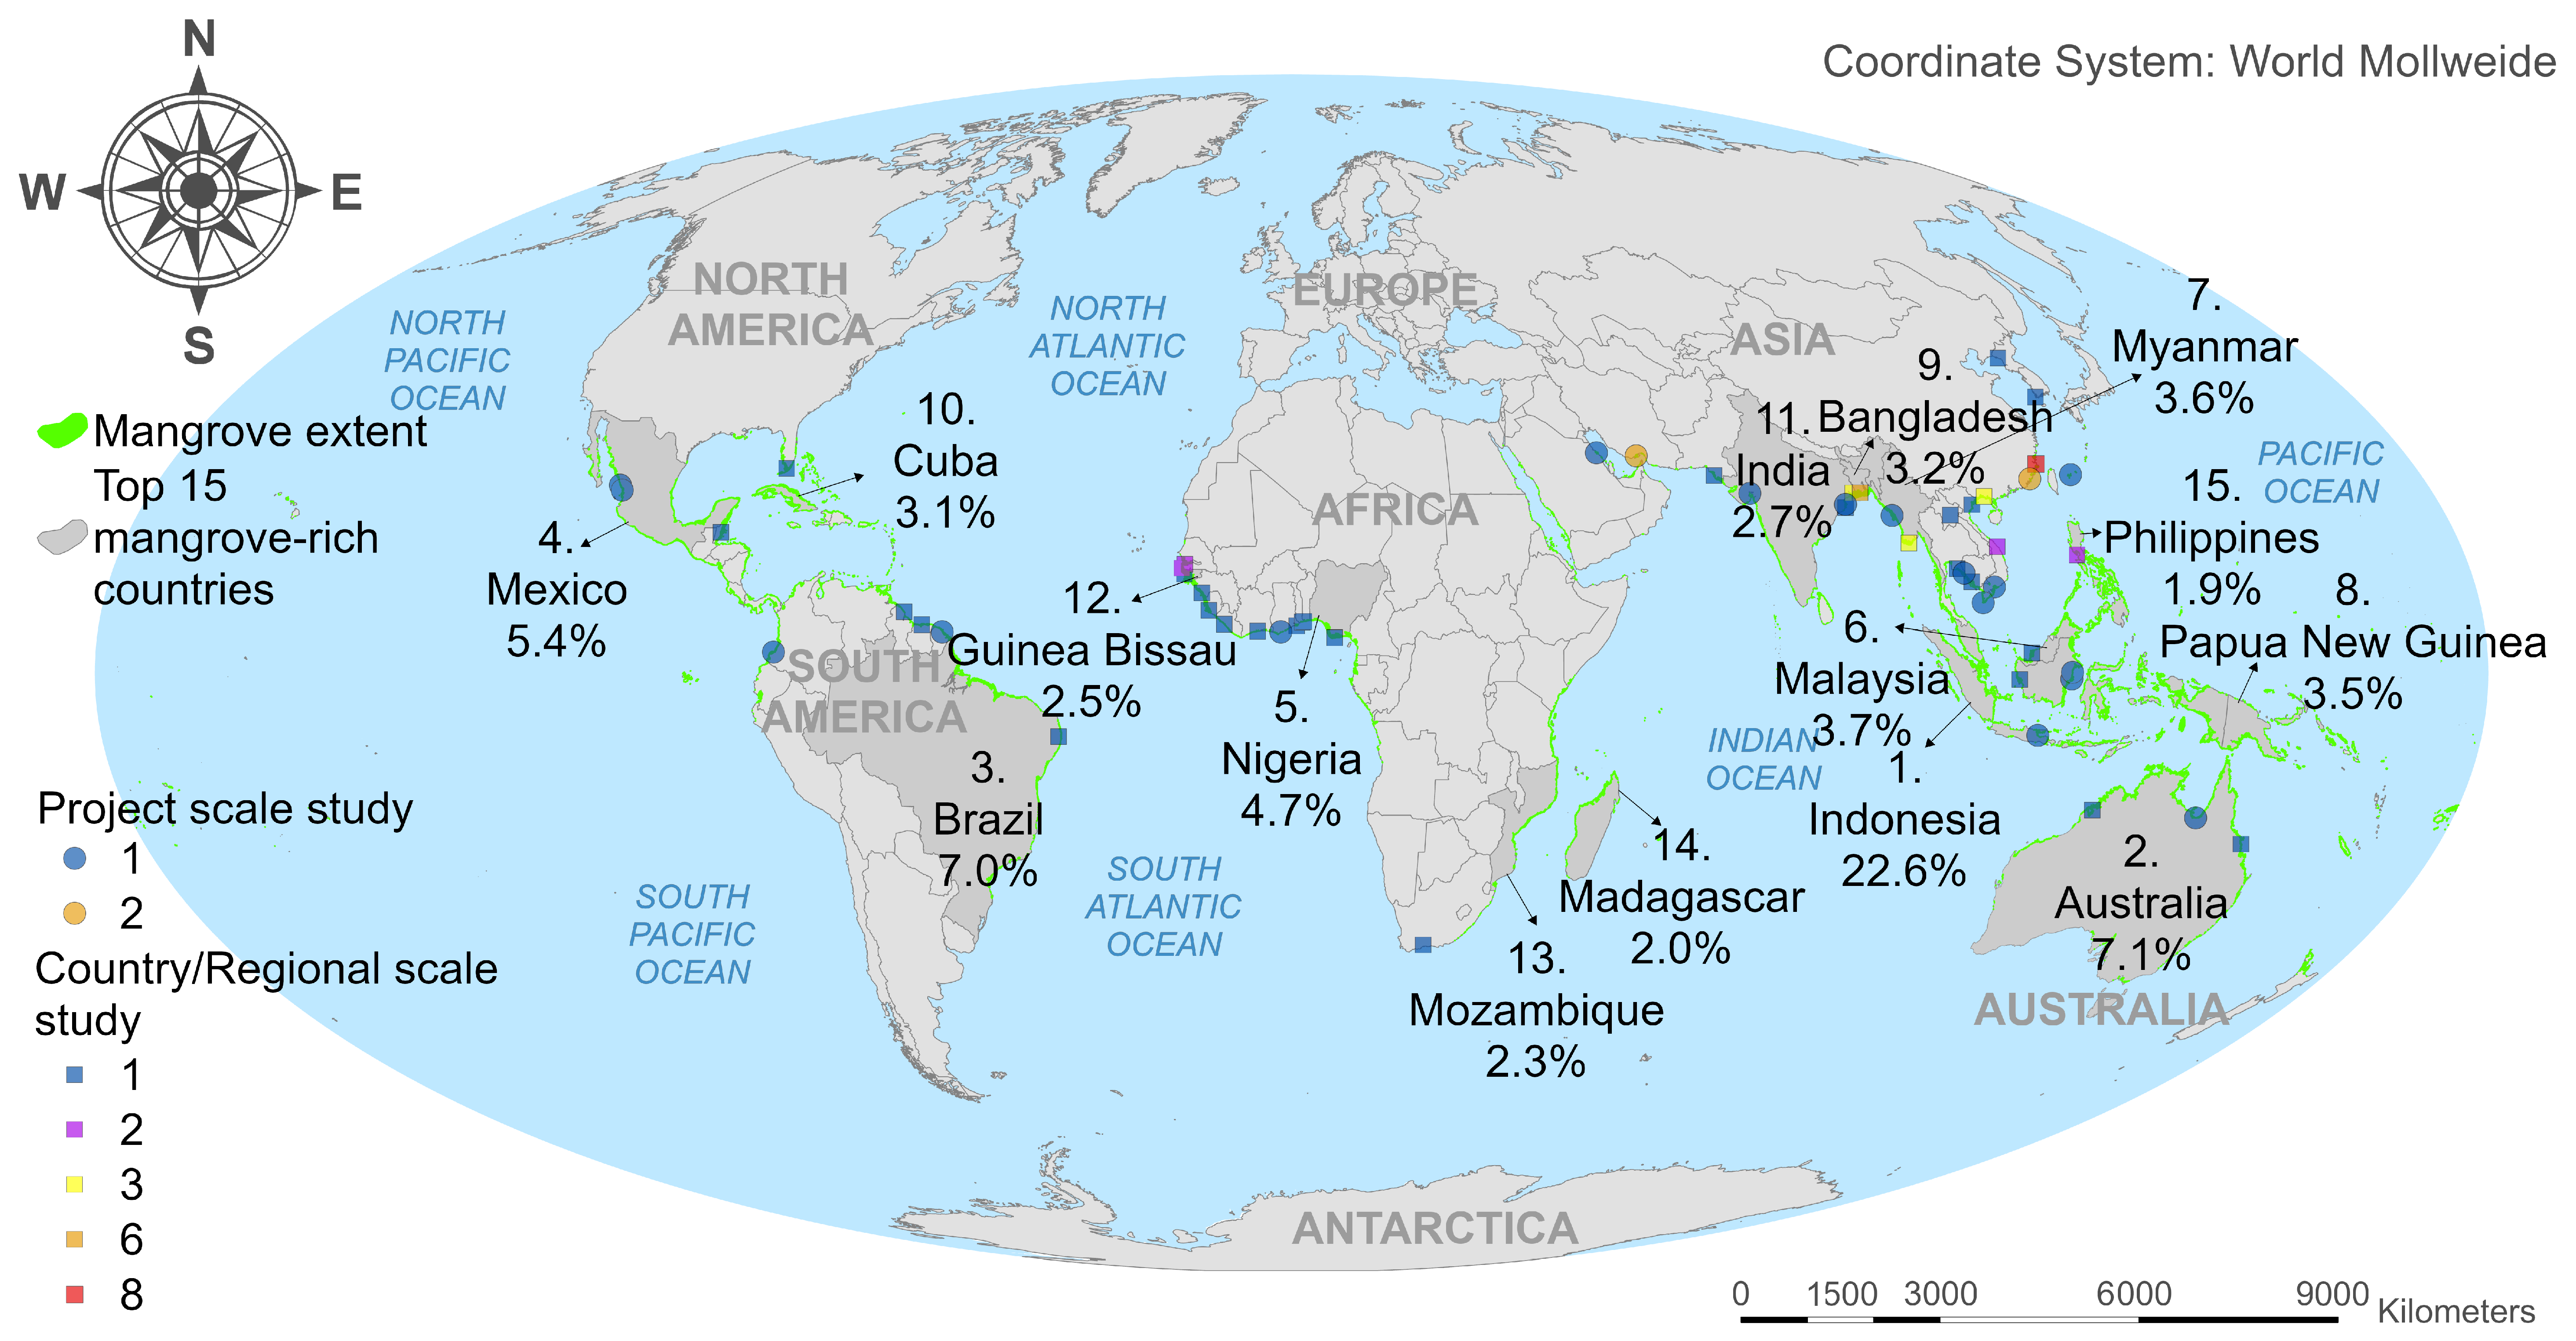
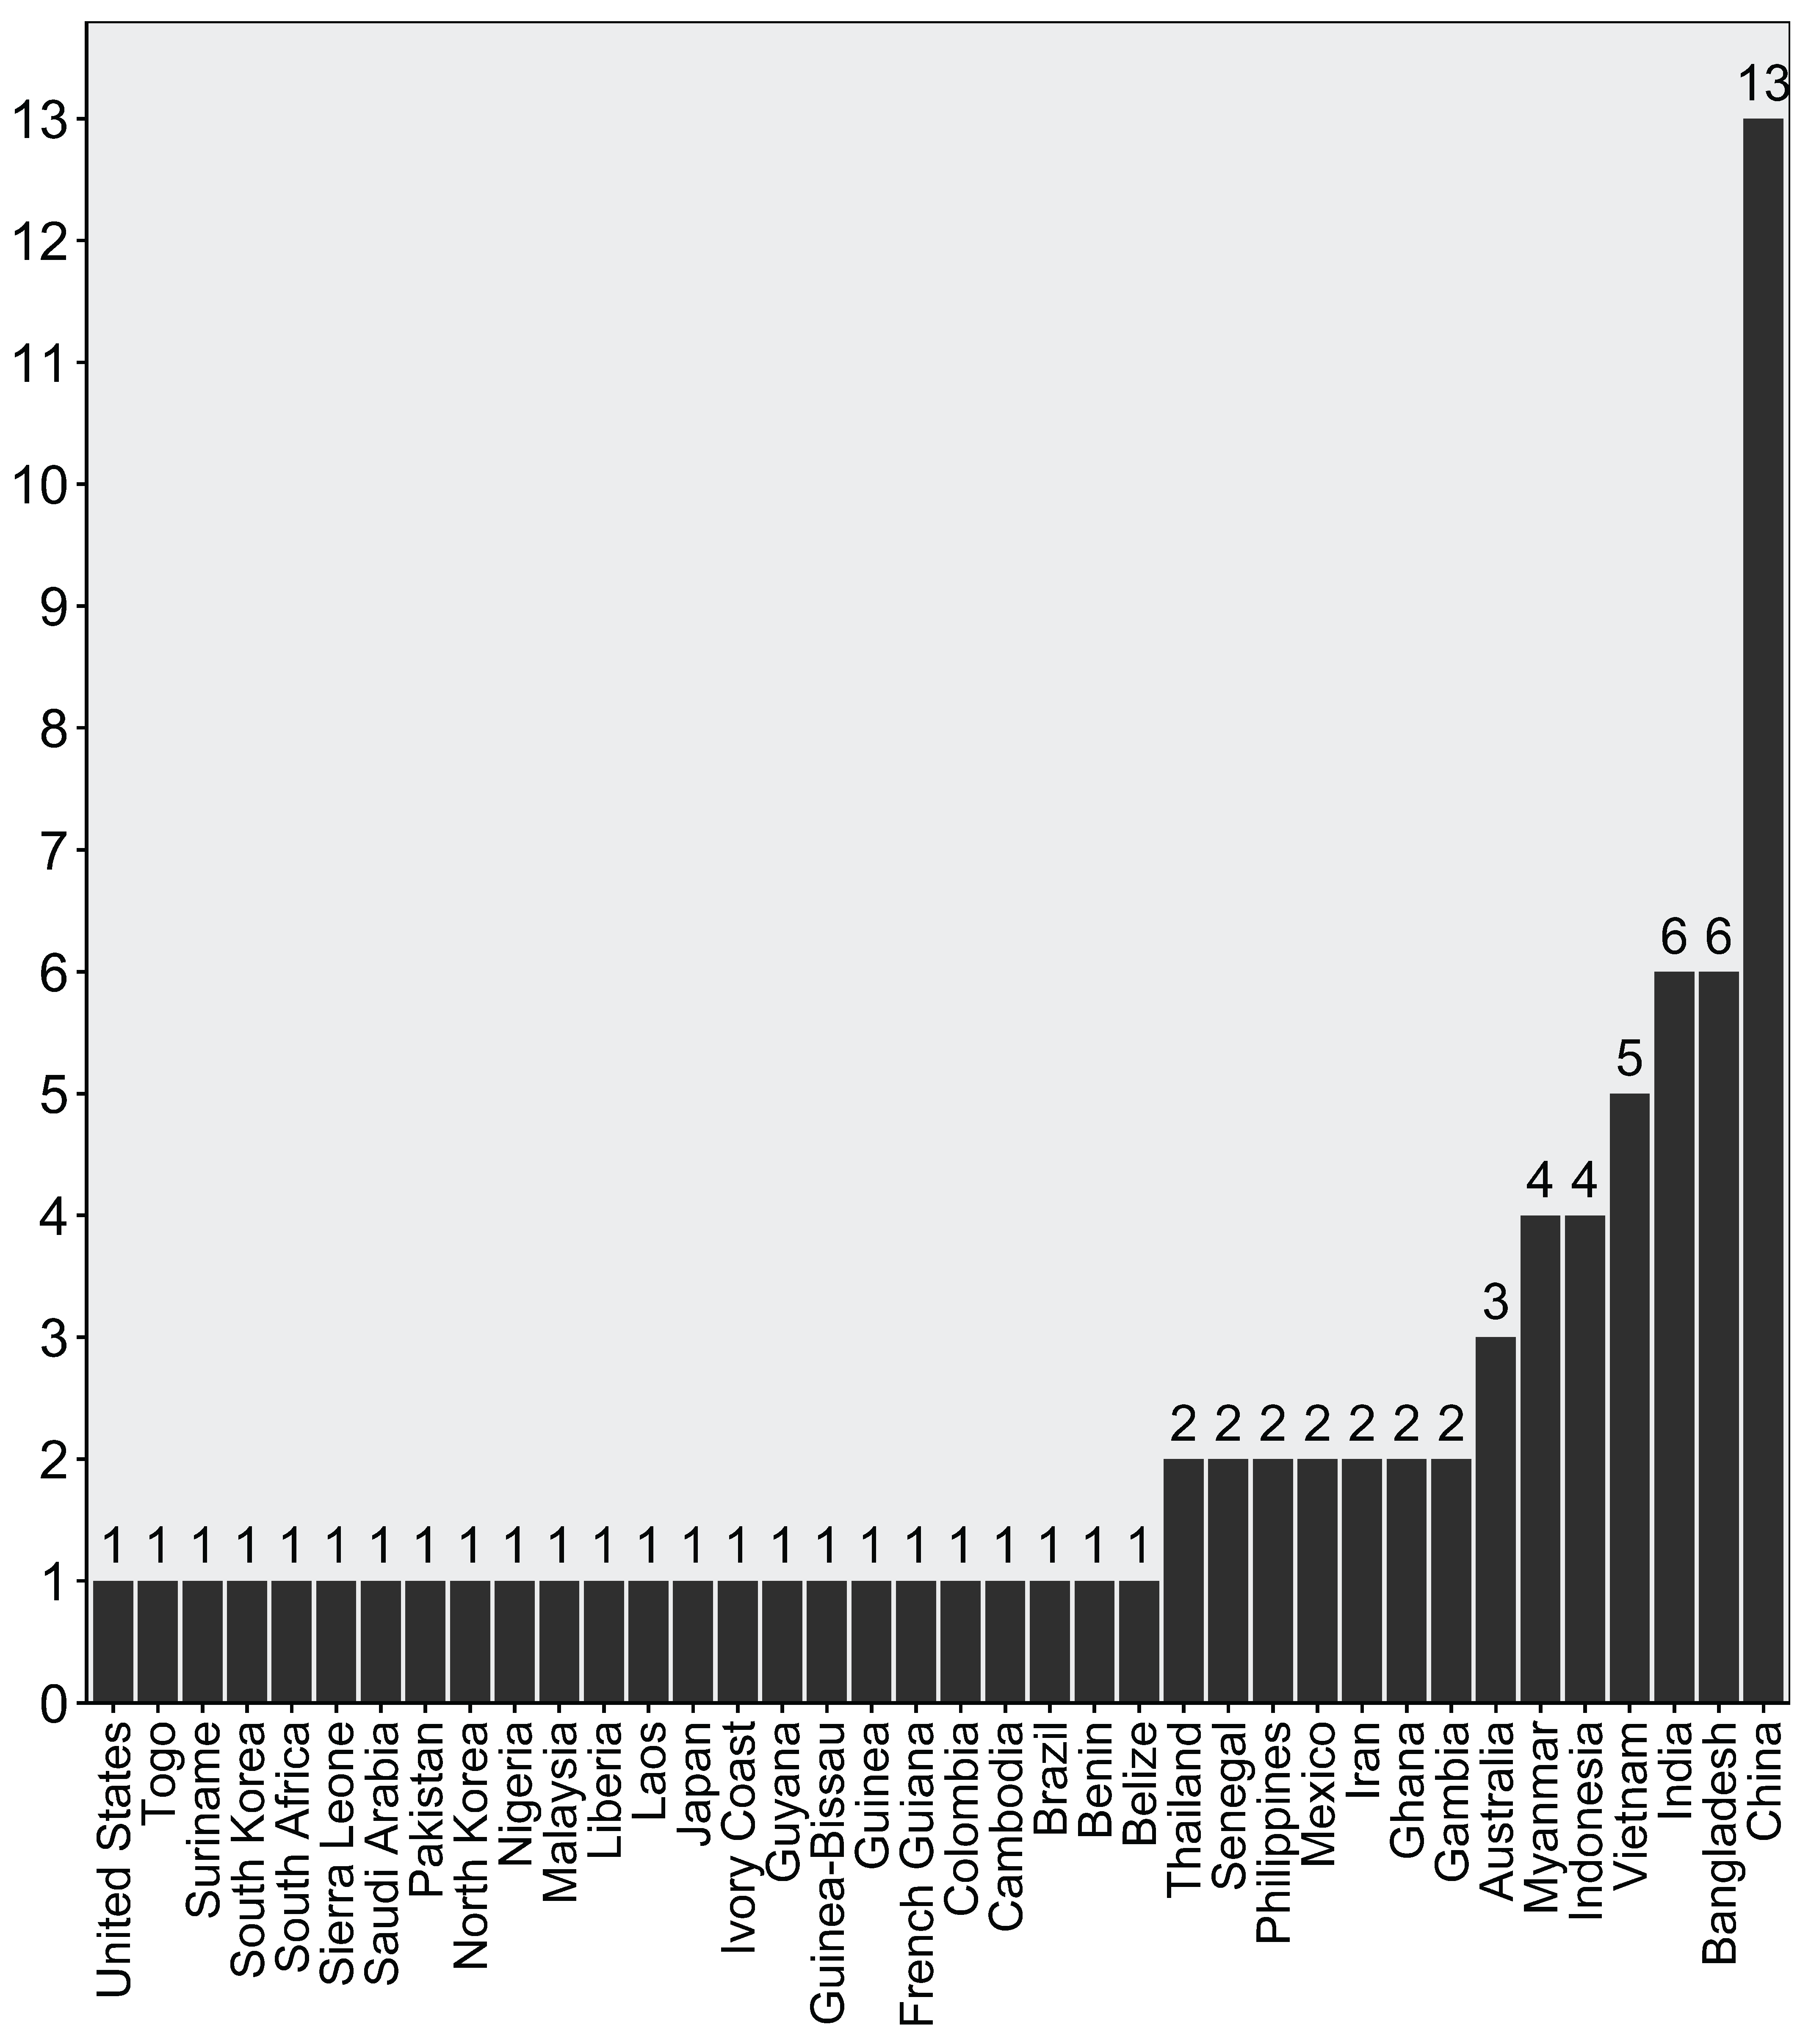
4. GEE Testbeds: Study Sites and Scales

Mangroves are most abundant in Asia, followed by West Africa, Australia, and Central and South America (Figure 1). Approximately 75% of mangrove area exists in the top 15 mangrove–rich countries [28]. GEE-based studies mostly focused on the top mangrove-rich countries (Figure 1). However, there were a few countries with no GEE-based mangrove studies, including Papua New Guinea (8th mangrove-rich country, 3.5% of global total), Cuba (10th, 3.1%), Mozambique (13th, 2.3%), and Madagascar (14th, 2.0%). The distribution of study areas based on the affiliated country of the author is given in Appendix A, Table A1. We observed that the studies cover mangrove ecosystems on almost every inhabited continent, with a strong focus on China. Apart from China, first-author affiliations included countries from South and Southeast Asia, Iran, and various European and African nations. It should be noted that 30 studies (out of 54) solely examined the country of affiliation of the first author.
Some papers stated whether their research focused on mangrove regions at the regional or project level. However, where it was unclear, the corresponding authors were contacted. In the context of our present study, a project-scale study is defined as one that examines a smaller portion of a larger mangrove forest present on a national or regional scale. Out of 54 studies, about 65% (35 studies) focused on country- or regional-scale, while around 33% (18 studies) were local- or project-based. There was only one article that focused on both regional and project-scale study areas. Again, although not in the top 15 mangrove-rich countries list, the majority of studies that used GEE were concentrated in China (Figure 2). There were eight country-wide, three regional-scale, and two project-scale studies that considered the Chinese territory. Six studies considered the Bangladesh part of the Sundarbans mangrove forest, and three studies considered the Indian part. Three regional and two project-scale studies were conducted in Vietnam. It is to be noted that despite being the most mangrove-rich country, Indonesia had only one regional-scale and three local-scale studies. Myanmar was examined in three regional and one project-scale studies. Australia was the subject of two regional and one project-scale studies. In other parts of the world, two or fewer studies were conducted. Most articles were published in Remote Sensing, an open-access journal by MDPI (Multidisciplinary Digital Publishing Institute; Figure 3).

5. Use of GEE: Broad Categories

Mangrove studies have utilized GEE for: (1) data extraction, filtering and/or preprocessing; (2) training models or running algorithms; (3) assessing the accuracy of the models or estimations; (4) generating interactive web tools; or (5) adopting a combination of these usages (Figure 4). The driving factors that propelled these studies can also be divided into four types. Researchers have tried to either accurately map the extent of mangroves, understand the change dynamics, to assess the damage caused by calamities, or constrain leaf biochemical properties.
These 54 studies can be further grouped based on the subfield of mangrove RS and the type of study conducted. Wang et al. [61] divided the mangrove RS subfield into three major groups: (1) distribution mapping; (2) extracting biophysical properties; and (3) modeling ecosystem processes. Distribution mapping can further be separated into two interconnected components: (a) mapping the entire area, and (b) mapping individual species. Works that studied biophysical properties estimated either the height and biomass of mangroves, or the leaf area index (LAI) [61]. Furthermore, ecosystem process modeling can take two routes: understanding the carbon flux and “process modeling” of evapotranspiration [61]. Wang et al. [61] also identified two more mangrove RS topics: health condition analysis and effect of climatic condition on mangroves.
GEE-based mangrove studies have primarily focused on data extraction, preprocessing, modeling, and accuracy evaluation (Table 1). These areas have garnered the most attention and recognition within the field, as evidenced by the number of publications and citations. However, despite its capabilities, the utilization of GEE for interactive mapping of mangrove data remains limited. As previously mentioned, GEE was utilized for more than one purpose in several mangrove research studies. The most used combinations were data extraction/preprocessing and modeling/algorithms, as well as data extraction/preprocessing and accuracy assessment (Figure 4). While accurate mapping dominates the literature, there is also notable interest in change dynamics analysis, and fewer studies on damage assessment. It is noteworthy that while certain subfields have received little attention, they nonetheless provide essential insights on how GEE has been used all over the world for studying mangroves. In particular, GEE has proven highly effective for detecting subtle phenological shifts, quantifying biomass changes, and informing locally tailored conservation strategies across diverse mangrove regions [63]. Also, it is worth mentioning that even though functions to perform a particular task (like accuracy assessment) are available on GEE, some researchers utilized third-party GIS software or open-source applications instead. Figure 4 presents specific tasks that researchers carried out using GEE tools and functions.

5.1. GEE Used for Data Extraction and Preprocessing

Because mangroves grow near the low-lying coastal belt, cloud filtering and topographic masking are often essential steps in any workflow. Computing and aggregating data on a per-pixel level is also important for deriving mangrove phenology. GEE is being used for these purposes. It is also becoming more popular for large-scale mapping and processing due to its speed and ease of use.
Almost all 54 papers have at least leveraged the basic utility of GEE, that is, data extraction and preprocessing. A wide range of GEE-based preprocessing techniques were used to improve the usability of satellite imagery (Figure 5). Clearly, the most popular was generating image composites (47 out of 54 articles). As indicated by their occurrence in 42 and 40 papers, respectively, calculating indices and cloud and shadow masking were the next most used preprocessing steps. The significance of topographic masking in mangrove research was addressed in 19 articles. Speckle filtering, a method intended to mitigate noise in radar images, has been adopted in four papers. Other preprocessing approaches include extracting texture information via Grey Level Co-occurrence Matrix (GLCM), scan-line gap filling, additional atmospheric correction, and subtracting dark objects.
Often, a single article has applied multiple preprocessing techniques, indicating GEE’s applicability in various steps. For example, Chen et al. [47] pioneered the application of GEE for mangrove remote sensing by precisely measuring mangrove extent along China’s coastline region in 2015. They used cloud and shadow masking techniques and calculated indices like NDVI, EVI, LSWI, and mNDWI to estimate greenness, canopy coverage, and tidal inundation. In a separate study, Diniz et al. [34] used cloud and shadow masking techniques, composite images, and the Modular Mangrove Recognition Index (MMRI) to describe mangrove habitats. Please see Section 6 for a more detailed review of various preprocessing approaches used by different scholars within the GEE framework.
The number of publications and citations of various mangrove RS studies employing GEE for data extraction and preprocessing has increased over time (Figure 6). Accurate mapping, change dynamics, and damage assessment are all receiving a growing amount of scholarly interest. GEE is becoming more and more popular in mangrove studies because it can quickly run preprocessing steps for data from multiple years in a matter of seconds. This level of efficiency is reached at the pixel level, which makes it easy for researchers to work with large temporal records. The easy-to-use interface of GEE makes implementation simple, and the visualization tools make it easy to examine the results.

5.2. Leveraging GEE-Based Algorithms

A key area where the cloud-based processing framework of GEE has been leveraged is through the application of sophisticated image processing algorithms (Figure 6). Learning-based algorithms for mangrove modeling (or classification) include Classification and Regression Trees [64], Gradient Tree Boosting [65], K-means clustering [66], Random Forests [67], Support Vector Machine [68], and Support Vector Data Description [69]. Other algorithms have been structured in GEE by authors from scratch (Harmonic Analysis of Time Series Algorithm [70]; Otsu Thresholding Algorithm [71]) or have built-in GEE (LandTrendr [72]; Linear Regression [73]). Some authors also used user-defined threshold/decision trees [74].
Random Forest (RF) [67] has proven effective in classifying mangroves and hence is the most widely used algorithm (Figure 7). Murray et al. [75], for example, used RF in GEE to incorporate predictor variables such as topography, climate, spectral bands, and spectral indices into mangrove classification in the Gulf of Carpentaria, Australia. In a study on temporal mangrove change in Brazil, Diniz et al. [34] used both RF and K-means clustering techniques. The work of Bhargava and Friess [76], as well as Li et al. [77], demonstrates an efficient use of GEE in training classifiers for estimating mangrove loss. The initiative undertaken by Nedd et al. [78] to extract biomass from the mangroves of Guyana by using RD shows the effectiveness of GEE through the seamless integration of Landsat, ALOS PALSAR, and Sentinel-1 SAR imagery, which was effective in distinguishing between mangroves and non-mangroves.
GEE makes it easier for researchers to optimize and visualize results by fine-tuning algorithm hyperparameters [75]. In addition, the GEE-based stratified random sampling method makes it easier to sample training data prior to classification [50]. After classification, different GEE-based post-processing techniques can be applied, such as temporal, spatial, and frequency filters and gap filling [34]. Based on the rising volume of publications and references to such pieces, it is evident that the scientific community is becoming more interested in classifications and algorithms available on GEE (Figure 8).

5.3. GEE Used for Accuracy Assessment

Accurately reporting results is critical for researchers and policymakers to confidently rely on the data when making decisions about the mangrove ecosystem. This, in turn, depends on reference data to evaluate the maps. GEE facilitates the acquisition of accuracy reports based on the reference data for author-generated mangrove maps. Accuracy assessments performed on GEE tend to center on extent mapping, specifically on accurately mapping mangrove for a single year, or on analyzing the trend in change over time. For instance, to assess accuracy, Chen et al. [47] compared their 2015 mangrove map with data from field surveys, in situ data from the China Mangrove Conservation Network, very high spatial resolution images from Google Earth captured during 2015, and a different set of in situ data from previous studies. The authors used a sampling grid to assess map accuracy. The random function in GEE was used to produce a total of 4100 random points, each with a buffer zone with a radius of 15 m. Similarly, Diniz et al. [34] used GEE to randomly assign sample points to test the resulting mangrove maps, generating a confusion matrix and reporting different accuracy parameters. Multiple reference data sources were utilized by Shrestha et al. [79] as training data to calculate the accuracy of mangrove mapping in their study. They also used GEE-based stratified random sample points for assessing the accuracy. Thus, GEE can be leveraged to create confusion matrices and readily obtain a report of overall accuracy, producer accuracy, user accuracy, and kappa coefficient [47,80].
GEE has been widely used by researchers for accuracy assessment (in different subfields) (Figure 9). Except for 2021, the number of publications using GEE for accuracy reporting has increased every year. In addition, citations of papers reporting accuracy are on the rise.

5.4. GEE Used for Interactive Mapping/Web Tool

Rapid processing and result displaying are key for any interactive tool targeted at people with less experience with coding or geospatial data [81]. Through GEE’s interfaces, users may quickly and inexpensively extract map- and GIS-based products from satellite and/or other gridded data hosted within GEE [82]. However, works that introduced an interactive web-based mangrove mapping method are rather limited (Figure 10). Baloloy et al. [83] developed a GEE-based graphical user interface and an interactive mapping system that does not require coding expertise to generate mangrove maps. Users do not need to download large volumes of satellite images to use this web interface. Users are only required to define their region of interest, the start and end dates of images they are interested in, and the minimum and maximum MVI (mangrove vegetation index) thresholds. The workflow is completely automated and produces RGB and false color composites, as well as MVI vegetation and mangrove rasters. Following the application run, users can view all available images within the specified date range. Users can easily utilize the interactivity, zoom in and out, and select the MVI map with the least amount of cloud, cloud shadow, and smog coverage. This GEE-based web application has the potential to empower stakeholders to promptly and globally map mangroves. Yancho et al. [38] developed a GEE mangrove mapping methodology that allows stakeholders to perform temporal analysis and generate their own change maps by tailoring parameters and/or options to their specific needs. Users can define the region of interest, set input variables, calculate workflow thresholds, generate imagery composites, and compute chosen indices. Several masking features can be utilized to refine the classification scope and create maps of high- and low-tide events. Modern and historical image composites can be generated by users. Users can specify classification variables and hyperparameters, investigate correlation and spectral separability, and perform classification to generate classified maps and perform accuracy assessments. In cases where initial map classes were utilized to capture variability but where confidence in class borders may be inadequate, users are given the option to combine map classes after classification. The spectral separability of land cover classes may be investigated by users in reference to many possible spectral indices. Finally, the tool permits users to calculate dynamics and perform optional quality assurance using selected classification schemes. However, users must change/modify a few lines of code to tune the tool, and Yancho et al. [38] are developing a graphical user interface to make it more user-friendly for stakeholders and rid themselves of the need for coding knowledge. An increasing trend of studies using GEE for interactive mapping in RS-based mangrove research is evident (Figure 10). Although GEE-based interactive mapping has grown in popularity over the years, it has been the focus of fewer papers and consequently fewer citations than other use cases of GEE.
In short, GEE has become a cornerstone in mangrove remote sensing, primarily for data extraction, preprocessing, modeling, and accuracy assessment. Its strengths include efficient data handling, algorithm implementation, and validation at multiple spatial and temporal scales. Interactive mapping remains underexplored, despite its increasing relevance, as the majority of studies concentrate on mapping extent, tracking change, and assessing damage. This gap suggests future research on stakeholder engagement and decision support using accessible, user-driven mapping tools on GEE.

6. Approaches for Studying Mangroves Using GEE

In this section, we describe a broad framework for mangrove study using GEE based on the synthesis of the papers we reviewed. First, we discuss how GEE functions can be used to filter, preprocess, and classify data, and we then describe the mangrove-specific GEE tools researchers have utilized.
Image processing for mangroves begins with the same basic steps as image processing for any other application domain. Firstly, GEE functions can filter images based on factors such as area of interest, time periods, cloud cover, cirrus, image bands, or other metadata properties [36,51,74,75,84,85,86,87,88,89,90,91,92]. There are GEE-based gap-filling algorithms that can fix data gaps in Landsat 7 scenes [93] and reduce noise in radar imagery like in Sentinel-1 and ALOS PALSAR [94]. Numerous classic and new indices and band ratios can be easily calculated with arithmetic operations [34,50,74,75,80,83,95,96,97,98,99]. By utilizing all available cloud-free images within a particular time-frame (e.g., for a specific year), temporally consistent mean/median image composites can be created [37,50,75,84,88,89,92,95,97,100,101,102].
GEE is used by researchers worldwide to classify mangroves and other important land cover types [100,103]. It has tools to make use of training and testing sample points for classification algorithms and offers drawing tools to collect random points from a base map [47,103]. GEE can also be used to combine radar and optical imagery to improve classification [76,86,88,92,104]. Post-processing of classified images can be performed in GEE [36,91]. Furthermore, accuracy assessment can be performed using a confusion matrix [75,80]. Finally, GEE allows for easy sharing of results and map products, allowing stakeholders, end users, and policymakers to analyze them [38,49,83].
That being stated, there are certain specific applications of GEE that are focused on mangroves, and are explained in more detail below:

6.1. Analyzing Indices and Spectral Signature

Using GEE, species diversity and structural components of mangroves can be understood from differences in spectral signature or indices values in different points in time, as demonstrated by several past works [74,83]. Furthermore, these differences can also be used to obtain an optimal time window for distinguishing mangroves and other invasive plants like S. alterniflora [96,99].

6.2. Generating Mangrove-Specific Image Composites

A mangrove-specific yearly highest-index-value composite can be created using GEE functions. For example, NDVI can be used to create a year-long greenest mangrove pixel composite [80,105]. Furthermore, standard deviation and percentile composites can be created to detect anomalies in mangroves [106]. Additionally, monthly composites (e.g., 3-, 4-, 6-month composites) can be created to understand seasonal patterns and variation of mangroves [50,51,86]. These composites can be further used to analyze mangrove disturbances or damages over time [76].

6.3. Developing and Testing Decision-Making Thresholds

Many mangrove studies have demonstrated that it is easy to implement user-defined rule-based logics in GEE [36,90]. As an example, Solanki et al. [98] categorized mangrove health based on NDVI thresholds. An NDVI value of more than 0.4 was considered to be healthy vegetation in their study. Similarly, user-defined rule-based decisions can be used to detect non-mangrove plants, mudflats, and permanent water [38,84]. Mangroves are generally found in low-elevation coastal zones, and different digital elevation data hosted on GEE can be utilized to create a topographic mask [38,78,102,107]. This can be performed using GEE by defining an elevation threshold beyond which mangroves are rarely found [84,107].

6.4. Creating Buffer Zones for Separating Mangroves from Water

GEE has functions for generating buffers by a user-defined distance from a geometry (i.e., polygon, polyline, or point), which is useful for separating coastal mangroves from other plants [38,90,95]. To create a distinction between mangrove and sea, buffer zones can also be created and tested to obtain the optimum intersecting line [47]. Moreover, it has been reported that ponds and other inland water bodies used for shrimp and fish farming can be found in close proximity to mangroves [48]. As Zhang et al. [91] demonstrated, GEE-based algorithms make it possible to successfully remove these inland water pixels and distinguish them from the sea water. This is achieved by examining tide-level and phenological patterns. This method uses RF classifiers to identify unvegetated wetlands, mangroves, and salt marshes, which effectively distinguishes between inland and seawater pixels.

6.5. Considering Tide and Submerged Mangroves

Coastal mangroves get inundated periodically and at varying frequencies [47,90]. User-defined rule-based logic in GEE can help to produce inundation frequency maps. For example, Chen et al. [47] and Dong et al. [96] created frequency maps by applying user-defined thresholds to image indices to understand inundation rates. Furthermore, GEE can be utilized to generate high tide and low tide composites for detecting submerged mangroves by employing a per-pixel ordering function and/or specifying a threshold pixel value for aggregation [38,91,99]. By leveraging GEE, quantile composites can also be generated to detect submerged mangroves to discern tidal inundation states [99,108]. More details on the application of this approach are described in the work of Xia et al. [99]. They estimated the tidal datum from a pixel of time series images by assigning values to the tenth and ninetieth quantiles, respectively, to detect low and high tide scenes. Also, intertidal zones can be identified with this approach [108]. Additionally, Otsu’s binary thresholding method can be used to differentiate submerged mangroves from regular ones [97,99].

6.6. Time Series Analysis

For a particular mangrove patch, the entire area of interest or a single-pixel-based time series can be generated and analyzed using GEE [36,86,99,108,109]. This helps to understand seasonal variation in mangrove canopy greenness [80,83]. Phenological features can be readily extracted from the time series [47,74,80,108,110]. Harmonic analysis of time series can be applied by leveraging time series produced in GEE to better understand the dynamics of phenological changes and seasonality of mangroves [37,96]. Moreover, temporal segmentation algorithms like LandTrendr, which effectively uses time series data, are useful for investigating patterns in mangrove degradation, growth, and settlement [85].

6.7. Spectral Unmixing

Spectral unmixing separates mixed pixels and, for example, can aid in determining the portion of water pixels within mangrove patches near shore [90]. GEE has a spectral unmixing function that can be used for this purpose (https://developers.google.com/earth-engine/apidocs/ee-image-unmix (accessed on 2 January 2023)).

6.8. Mangrove Classification

GEE can be used to improve mangrove species mapping with few reference points, which is especially helpful for inaccessible forests. GEE-provided classification algorithms can be used to generate a preliminary species distribution map, which can then be used to improve the decision-making surface of the algorithm by iteratively refining the initial map through the inclusion of negative samples [92].

6.9. Comparing Maps and Results

GEE helps to readily map and monitor mangrove changes over time for various geographical locations. Comparing regions of interest helps to understand prevailing unique processes for different mangrove settings [49,83]. Moreover, different mangrove map products (raster/vector) can be imported directly to GEE and the new mangrove maps can be compared with other products to understand the spatial differences at pixel level [34,38,50,78,108]. This comparison can be both qualitative and quantitative as GEE helps to visualize data products as layers and perform arithmetic calculation to detect differences [34,49,83,90].

6.10. Assessing Drivers of Change

GEE has been used to understand the influence of various land cover changes on mangroves over a long period of time [37,95,109]. For example, Tinh et al. [48] showed how expansion of aquaculture ponds and croplands is negatively impacting mangrove forests. GEE also hosts meteorological datasets. The differences in phenological features of mangroves and/or other plants within the mangrove ecosystem and their relationship with climatic variables such as precipitation and temperature can be analyzed with the help of GEE [37,79,83,87].
In summary, GEE provides an exhaustive array of tools for mangrove remote sensing, including image filtering, preprocessing, classification, time series analysis, and change detection. Researchers can employ GEE to amalgamate optical and radar imagery, evaluate spectral indices, establish decision thresholds, and differentiate mangroves from adjacent terrestrial and aquatic features, including submerged or tidal zones. It additionally facilitates effective map sharing and stakeholder involvement. GEE enables qualitative and quantitative analyses across various regions and across the globe, allowing mangrove monitoring in data-scarce or inaccessible areas. This section aims to assist new users—be they researchers or enthusiasts—by outlining the key functions and practical procedures for utilizing GEE in mangrove studies.

7. Current Shortcomings of GEE for Mangrove Studies

In this section, we explore existing shortcomings when using GEE for mangrove studies. These shortcomings fall into three categories: user-related shortcomings, which stem from gaps in expertise or familiarity that prevent users from fully taking advantage of GEE functionalities; platform-specific constraints, referring to missing or underdeveloped tools and processing capabilities needed for mangrove-focused analyses; and data limitation, arising from insufficient high-resolution or regionally relevant datasets within the GEE catalog.

7.1. User-Related Shortcomings

GEE has been used in numerous studies for mangrove mapping, but many have used selective years of satellite imagery [49,86,88] even though GEE hosts petabytes of a complete collection of datasets. Furthermore, despite GEE hosting 10 m resolution Sentinel images [111], 26 studies have relied on coarse- or mid-resolution imagery, such as Landsat, which may limit success in accurately delineating mangrove patches [85,89,94,104]. Moreover, many studies lack sufficient ground validation, introducing uncertainties and limiting the reliability of the results [34,36,51,85,104,112,113]. Tidal effects in open mangrove canopies can also introduce uncertainties in mangrove classification. Although Yancho et al. [38] demonstrated that GEE can be leveraged to understand the tidal influence while delineating mangrove extent, most GEE-based studies have not adequately considered this influence [74,84,88,92,94,100]. GEE can be used to reduce the salt–pepper effect detected in SAR images [114]. The salt–pepper effect can introduce noise and reduce the precision of mangrove classification outcomes [99]. However, studies have not adequately addressed this issue [96,105,108]. Additionally, GEE offers interactive mapping and graphical interfaces, but as discussed before, only three studies have used it to empower stakeholders.

7.2. Platform-Specific Constraints

Working with large regions of interest in GEE can pose a challenge in mapping mangroves. Processing very large areas can lead to memory errors in GEE during global studies [38,75]. As a result, very few studies have attempted to conduct a global analysis [115]. This limitation stems from various constraints within the GEE cloud computing environment, including limitations on requests, processing time, memory space, and data storage [116]. This limitation hinders the ability to compare global patterns of mangrove erosion and progradation [49,94]. Furthermore, distinguishing water from non-water pixels is an important step for detecting submerged mangroves, and it can exceed GEE’s processing limits at global scales, risking memory errors during training [97,117]. While some studies use manual, visual delineation [91], this is labor intensive and not scalable. Implementing automated GEE algorithms requires additional tiling or composite strategies to stay within platform quotas, and this highlights a platform-specific constraint.
GEE has limited supervised and unsupervised classification algorithms to offer for classifying land cover, including mangroves [118]. The training set size is limited to 100 MB, which can only accommodate datasets with a limited number of bands. Inference phase predictions require fewer than 400 bands of imagery, and the model must be less than 100 MB in size [118]. Additionally, the JavaScript API platform does not support advanced models—such as artificial neural networks and deep learning—thereby limiting researchers to traditional classification methods in mangrove studies.

7.3. Data Limitations

The GEE platform utilized for mangrove species mapping studies, but in limited numbers (Table 1). The absence of quality and multitemporal hyperspectral and Lidar data on GEE is likely the reason. It is worth noting that the hyperspectral dataset from Earth Observing-1 (EO-1) is accessible on GEE [119], but it does not have global coverage. Additionally, Bessinger et al. [100] and Cissell et al. [84] note the importance of elevation and height data while mapping mangroves, especially the need to consider relief and shadows. However, there are few high-resolution elevation datasets on GEE that have a global and multitemporal footprint.
Some studies have overlooked socio-economic factors, such as anthropogenic disturbances, that can influence mangrove mapping [79,80]. This indicates the need to include socio-economic gridded products on GEE to infer anthropogenic influences.

8. Lessons Learned

In this section, we identify and discuss the main findings on how GEE is improving mangrove mapping. We discuss how GEE has transformed mangrove mapping by facilitating regional and global monitoring and by reducing atmospheric outliers and cloud interference. We also discuss how GEE simplifies classification in varied geographic regions, overcomes tidal fluctuation issues, and empowers non-experts with user-friendly interfaces.
GEE has completely changed the way mangrove mapping is performed by offering methodical solutions to problems, including atmospheric outliers, cloud and shadow interference, and changing weather-related issues. Researchers have attempted to develop mangrove maps since the 1980s, albeit in an unsystematic manner, whereas systematized mangrove mapping methodologies were developed with the introduction of GEE [34,83,86]. Before the application of GEE, unfiltered clouds and shadow residues were classified as non-mangrove, resulting in incorrect results, which GEE-based cloud and shadow filtering addressed [34]. Using GEE, it is easy to generate median composites that mitigate the impact of atmospheric outliers on long-term monitoring of mangrove status [92]. In addition, GEE makes it easy and fast to perform band ratio operations, which can further eradicate the noise caused by varying illumination, topography, and atmospheric conditions [92].
With the high degree of automation provided by GEE, mangroves can be mapped often and precisely at different scales [94]. Furthermore, mangroves can now be monitored at both regional and global scales thanks to ongoing updates by GEE with the latest images and new satellite data [120]. Moreover, cross-boundary comparison is easy with GEE. For instance, Baloloy et al. [83] leveraged GEE to compute a new mangrove index and compared the results for different mangrove ecosystems in the Philippines, Japan, Thailand, Vietnam, Indonesia, Cambodia, South America, Africa, and Australia. Rather than classifying the entire study region, GEE can help segment it into tiles and then run multiple classification models, ensuring that GEE’s calculation time and memory are not exhausted [91,121].
GEE helps researchers overcome the problem of tidal fluctuation by allowing them to utilize all available observations [90]. Low and high tide images are important for distinguishing submerged mangroves and can be performed using GEE [38,91]. The spectral characteristics of high-tide conditions allow for the differentiation between tidal flats and submerged mangroves [120]. In addition, images taken at low tide can help determine the extent of the mudflat. Leveraging GEE, the mean of the calculated indices can help to infer the tide level for every available satellite image to obtain the highest and lowest tide scenes [91]. Moreover, GEE aids in detecting scenes with similar tide conditions, which is essential to accurately detect mangrove disturbances within the intertidal zones [120].
GEE-enabled GUIs and tools can empower nonexpert users and encourage policy makers to provide constructive feedback using local knowledge related to mangroves to improve maps that suit their own specific requirements [38]. Tools and GUIs developed using GEE can be made publicly available online, which may improve the reliability of procedures while opening up new possibilities for personalization and modification [38].
Beyond our original study period, we sought to determine whether our work remained current by extending our literature search through December 2023. This resulted in 25 additional GEE-based mangrove studies. To ensure scientific rigor and focus on the most impactful work, we used inclusion criteria. Each candidate paper needed at least six total citations and a citation rate of at least two per year, and hence, selected sixteen new studies for review (summarized in Appendix A, Table A2). The key findings from these 2023 papers reveal a few distinct trends. GEE is increasingly using multisource, time series remote sensing, combining optical and SAR inputs to improve classification accuracy. Researchers are integrating temporal segmentation algorithms and phenological composites into GEE to detect long-term changes in mangrove extent and species composition with minimal manual tuning. GEE’s built-in tools for cloud filtering, spectral index computation, and machine learning model training enable rapid and reproducible mapping pipelines without the need for local high-performance hardware. Several studies suggest using GEE to increase access to large-scale time series analyses for mangrove monitoring. The lessons learned from 2023 thus both reinforce our insights from 2022 and chart new avenues for future methodological development and application.

9. Future Directions

Some possible next steps might pave the path for more effective use of GEE in mangrove monitoring in the future. In this section, we highlight areas deserving special attention in potential future work on mangroves using GEE.

9.1. Fusing Data

Several authors demonstrated that GEE can be used for merging multisource remote sensing data to obtain better accuracy [86,88,94,96,102]. However, more research is needed in this area. Time series of imagery stored in GEE (e.g., Sentinel) allows detection of differences in mangrove phenological patterns, particularly in areas where they are irregular and patchy [80,91]. Tracking phenological patterns highlights changes in amplitude and phase of mangroves, leveraging the detection of leaf density and synchronizing timing shifts of mangrove canopy with environmental cues like temperature, rainfall, or tidal patterns.

9.2. Incorporating Spectral and Ecological Properties

Future research should concentrate on improving approaches and adding advanced modeling/algorithms/tools that account for spectral signatures and ecological properties of various mangrove typologies [113].

9.3. Mapping with Spatial Awareness

To improve the precision of mangrove classification, object-based techniques such as Simple Non-Iterative Clustering (SNIC) has the potential to improve classification accuracy and decrease problems in mangrove spatial separability [99,100]. Additionally, there is an urgency to include state-of-the-art deep learning classifiers like U-Net and Stacked AutoEncoder into GEE [91,92].

9.4. Incorporating More Environmental Data

Many authors have proposed utilizing climatic and atmospheric data, including pollution, sea temperature, soil moisture, nighttime lights, drought severity, sea surface temperature, and pests/diseases, to enhance our knowledge of mangrove dynamics [79,80]. Therefore, future research should leverage many of the environmental gridded data products already available on GEE [119].

9.5. Using Diverse Spectral Indicators

There is an apparent need for looking into more combinations of indices to improve the detection of mangroves [37,74]. There are already GEE-based algorithms and utilities developed by researchers that can automatically generate numerous spectral indices from various satellite data products, like Landsat, Sentinel-1, and -2 [122]. However, single-index approaches, like the NDVI, have been criticized for being too sensitive to climatic variables [85]. Prior works have highlighted the importance of exploring mangrove-specific indices [39]. However, for varying geographical settings, systematic evaluation of these emerging indices within the GEE environment is recommended. Furthermore, future studies could evaluate the effectiveness of the Tasselled Cap approach for identifying mangroves on tidal flats and monitoring cover changes [85].
Looking forward, researchers should conduct comparative studies across diverse biogeographic regions—tropical, subtropical, and temperate—to assess index robustness under varying tidal regimes, canopy densities, and seasonal conditions. Such work will refine best practices for index selection and open avenues for automated, scalable mangrove monitoring pipelines that adapt to local spectral characteristics.

9.6. Improving Reference Data Collection

As GEE offers interactive mapping facilities, there is potential to develop GEE-based automatic methods to collect and expand training samples for improved classification accuracy [91]. Also, there is a need for the development of refined and automated techniques using GEE to improve visual assessments [108]. While tools such as collect earth online (https://www.collect.earth/ (accessed on 1 March 2023)), earthmap (https://earthmap.org/ (accessed on 1 March 2023)), sepal (https://sepal.io/ (accessed on 9 January 2024)), and Sentinel Hub (https://apps.sentinel-hub.com/eo-browser/ (accessed on 1 March 2023)) offer non-coding approaches, advanced processing require additional payment. Novel ideas for visualization are needed for practical visualization outcomes.

9.7. Incorporating a Temporal Segmentation Algorithm

The use of temporal segmentation techniques in GEE was recently highlighted by Pasquarella et al. [123] as a way to assist the worldwide mapping, monitoring, and analysis of landscapes, with an emphasis on understanding the trends and patterns in their features. LandTrendr, CCDC, EWMACD, VCT, and VeRDET are just a few of the algorithms that use band and spectral-index-based time series to detect and monitor changes. They can provide useful insights for tracking the rate and pattern of erosion and colonization in mangrove habitats [85]. Despite the advantages, there are few studies that used a temporal segmentation method to analyze a mangrove forest [85,124]. To more correctly portray the dynamic processes and changing timeline of mangrove forests, future studies should emphasize investigating and applying the many temporal segmentation techniques accessible on GEE.

9.8. Detecting Degradation

Detecting mangrove degradation is key to anticipating new mangrove deforestation regimes or preventing the complete loss of mangroves. While degradation can be defined, conceptualized, and represented in different ways [125], few articles focus on tracking mangrove degradation using dense remote sensing time series. New approaches to disentangle mangrove loss from degraded mangrove are necessary. Some key examples are algorithms such as Continuous Degradation Detection (CODED) [126], which delineate ephemeral changes linked to degradation over tropical forests but poorly tested on mangrove ecosystems. Although global degradation datasets like Tropical Moist Forests [127] provide and understanding of land-cover transitions, field validation is still necessary to confirm mangrove degradation.

9.9. Expanding Potential Drivers

Some drivers of mangrove change are unusual but important. For instance, the effect of oil spills in the Nigerian delta over mangroves can be mapped through satellite imagery [128]. This is useful to inform authorities about inefficient oil extraction practices that gradually degrade mangrove and the role of locals for the establishment of community vanguards to develop a sustainable platform for mangrove conservation [129]. Another understudied driver is Nipa palm expansion that has documented the loss of 28,000 ha of mangroves [130]. Natural drivers such as hurricanes cause damage to mangrove forests depending on the storm level. However, understanding mangrove resurgence after hurricane impact remains uncertain. While some local studies suggest >5 years for canopy recovery, constant monitoring and mangrove resilience should be quantified, especially during repetitive hurricane events and the long-term effects of climate change. Salinity is a gradual driver of mangrove change. Salinity is rising due to climate change, and it significantly impedes forest growth and ecosystem functions for mangroves. Understanding how salinity influences mangrove structure is relevant at regional scales. Satellite imagery, mostly hyperspectral [131] can assist in identifying wide mangrove areas affected by salinity. The proliferation of invasive species is another driver of mangrove change that is poorly evaluated using satellite imagery. Monitoring and eradicating these invasive species are vital to preserving the ecosystem. Sentinel 2 and hyperspectral imagery show promising results in identifying the spatial variability of invasive species [132]. Data collection from high-resolution imagery available in GEE and empowering citizen science through GEE-free apps will increase the amount of training data to improve the classification of potential drivers of mangrove change.

9.10. Focusing on Carbon

GEE is used to derive diverse biophysical variables related to mangrove at a global scale. Height, biomass and total carbon estimates are now passively calculated using the GEDI’s LIDAR system combined with optical/SAR imagery [133,134]. However, more regional and local biophysical variable estimates are needed to reduce uncertainty and improve accuracy. More reliable estimates can support blue carbon credits that may help tropical coastal countries for climate change goals [135].

10. Conclusions

A thorough review of 54 relevant studies published within the 2017–2022 period showed that GEE has been widely and increasingly used for mapping mangroves in many locations around the world. We categorized the studies based on the breadth of GEE integration, the primary motivations for doing so, and the subfields of mangrove remote sensing to better understand how GEE may be used in mangrove studies. We documented growing interest in GEE among mangrove remote sensing experts. GEE is particularly useful for data extraction, preprocessing, modeling, computational tasks, accuracy evaluations, and the development of interactive mapping interfaces, all of which are critical to mangrove research. However, some constraints prevent GEE from reaching its full potential in mangrove research. By identifying these limitations, we outlined clear directions and priorities for future studies.
An essential function of this present work, like any other review paper, is to outline challenges and propose potential avenues for future research [52]. The present work is an indispensable asset for researchers seeking to expand upon prior investigations. The current effort would bring together existing knowledge, techniques, methodology, and findings, offering a coherent and thorough summary of current trends in leveraging GEE for mangrove studies. As the first of its kind, this current study provides an important starting point for the emerging field of mangrove research using GEE, as well as a guidepost for new research endeavors looking to capitalize on the potential of this cloud-computing platform.

Author Contributions

K.M.A.I., conceptualization, investigation, data preparation, data curation, methodology, software, formal analysis, visualization, writing—original draft, and writing—review and editing; P.M.-S., formal analysis, writing—original draft, and writing—review and editing; E.B., writing—review and editing; R.K., supervision, writing—original draft, and writing—review and editing. All authors have read and agreed to the published version of the manuscript.

Funding

This work was partially supported by the NASA SERVIR program under grant 80NSSC23K0245.

Data Availability Statement

Data available on request.

Acknowledgments

The authors would like to extend their appreciation to the Graduate Writing Center of Oregon State University, USA, for their assistance in refining the manuscript. Additionally, the authors would like to express their gratitude to all the corresponding authors of the reviewed articles for their cordial assistance in resolving any questions that arose during the analysis period.

Conflicts of Interest

The authors declare no conflicts of interest.

Abbreviations

The following abbreviations are used in this manuscript:
CODEDContinuous Degradation Detection
EO-1Earth Observing-1
EVIEnhanced Vegetation Index
GEEGoogle Earth Engine
LAILeaf Area Index
LANDSATLand Satellite
LSWILand Surface Water Index
MDPIMultidisciplinary Digital Publishing Institute
MMRIModular Mangrove Recognition Index
mNDWIModified Normalized Difference Water Index
MVIMangrove Vegetation Index
NDVINormalized Difference Vegetation Index
RFRandom Forest
RSRemote Sensing
SNICNon-Iterative Clustering

Appendix A

Table A1. Study areas and the country affiliation of researchers.
Article TitleAffiliated Country of First AuthorContext/Study Area
10-m-resolution mangrove maps of China derived from multisource and multitemporal satellite observationsChinaChina
A cloud computing-based approach to mapping mangrove erosion and progradation: Case studies from the Sundarbans and French GuianaSingaporeIndia, Bangladesh, French Guiana
A detailed mangrove map of China for 2019 derived from Sentinel-1 and-2 images and Google Earth imagesChinaChina
A history of the rehabilitation of mangroves and an assessment of their diversity and structure using Landsat annual composites (1987–2019) and transect plot inventoriesThailandThailand
A mangrove forest map of China in 2015: Analysis of time series Landsat 7/8 and Sentinel-1A imagery in Google Earth Engine cloud computing platformChinaChina
Advancing the Mapping of Mangrove Forests at National-Scale Using Sentinel-1 and Sentinel-2 Time Series Data with Google Earth Engine: A Case Study in ChinaChinaChina
An Improved Submerged Mangrove Recognition Index-Based Method for Mapping Mangrove Forests by Removing the Disturbance of Tidal Dynamics and S. alternifloraChinaChina
Application of Artificial Neural Networks for Mangrove Mapping Using Multitemporal and Multisource Remote Sensing ImageryIranIran
Assessing cyclone disturbances (1988–2016) in the Sundarbans mangrove forests using Landsat and Google Earth EngineJapanIndia, Bangladesh
Brazilian Mangrove Status: Three Decades of Satellite Data AnalysisBrazilBrazil
Characterizing Spatiotemporal Patterns of Mangrove Forests in Can Gio Biosphere Reserve Using Sentinel-2 ImageryVietnamVietnam
Cloud-Based Monitoring and Evaluation of the Spatial-Temporal Distribution of Southeast Asia’s Mangroves Using Deep LearningUKCambodia, Laos, Malaysia, Myanmar, Philippines, Indonesia, Thailand, Vietnam
Combing Sentinel-1 and Sentinel-2 image time series for invasive Spartina alterniflora mapping on Google Earth Engine: a case study in Zhangjiang EstuaryChinaChina
Development and application of a new mangrove vegetation index (MVI) for rapid and accurate mangrove mappingPhilippinesPhilippines, Japan
Distribution and drivers of Vietnam mangrove deforestation from 1995 to 2019VietnamVietnam
Eleven Years of Mangrove-Mudflat Dynamics on the Mud Volcano-Induced Prograding Delta in East Java, Indonesia: Integrating UAV and Satellite ImageryNetherlandsIndonesia
Elucidating the phenology of the Sundarbans mangrove forest using 18-year time series of MODIS vegetation indicesJapanBangladesh
Evaluating Combinations of Sentinel-2 Data and Machine-Learning Algorithms for Mangrove Mapping in West AfricaUSASenegal, Gambia
Evaluating mangrove conservation and sustainability through spatiotemporal (1990–2020) mangrove cover change analysis in PakistanPakistanPakistan
Evaluation of Spatiotemporal Dynamics of Guyana’s Mangroves Using SAR and GEEGuyanaGuyana
Extrapolating canopy phenology information using Sentinel-2 data and the Google Earth Engine platform to identify the optimal dates for remotely sensed image acquisition of semiarid mangrovesMexicoMexico
Gap-Free Monitoring of Annual Mangrove Forest Dynamics in Ca Mau Province, Vietnamese Mekong Delta, Using the Landsat-7–8 Archives and Post-Classification Temporal OptimizationNetherlandsVietnam
How to automate timely large-scale mangrove mapping with remote sensingUSAUSA, China
Identifying and forecasting potential biophysical risk areas within a tropical mangrove ecosystem using multisensor dataUSAIndia
Identifying large-area mangrove distribution based on remote sensing: A binary classification approach considering subclasses of non-mangrovesChinaChina
Improved estimates of mangrove cover and change reveal catastrophic deforestation in MyanmarSingaporeMyanmar
Incorporating the Plant Phenological Trajectory into Mangrove Species Mapping with Dense Time Series Sentinel-2 Imagery and the Google Earth Engine PlatformChinaChina
Large-Scale High-Resolution Coastal Mangrove Forests Mapping Across West Africa With Machine Learning Ensemble and Satellite Big DataUSASenegal, Gambia, Guinea Bissau, Guinea, Sierra Leone, Liberia, Ivory Coast, Ghana, Togo, Benin, Nigeria
Mangrove Ecosystem Mapping Using Sentinel-1 and Sentinel-2 Satellite Images and Random Forest Algorithm in Google Earth EngineIranIran
Mangrove Forest Cover and Phenology with Landsat Dense Time Series in Central Queensland, AustraliaAustraliaAustralia
Mapping and dynamic analysis of mangrove forest during 2009–2019 using landsat-5 and sentinel-2 satellite data along Odisha CoastIndiaIndia
Mapping mangrove dynamics and colonization patterns at the Suriname coast using historic satellite data and the LandTrendr algorithmNetherlandsSuriname
Mapping National Mangrove Cover for Belize Using Google Earth Engine and Sentinel-2 ImageryUSABelize
Previous Shoreline Dynamics Determine Future Susceptibility to Cyclone Impact in the Sundarban Mangrove ForestSingaporeIndia, Bangladesh
Radar and optical remote sensing for near real-time assessments of cyclone impacts on coastal ecosystemsUSAIndia, Bangladesh
Remote Sensing-Based Mapping of Senescent Leaf C:N Ratio in the Sundarbans Reserved Forest Using Machine Learning TechniquesChinaBangladesh
Sub-continental-scale mapping of tidal wetland composition for East Asia: A novel algorithm integrating satellite tide-level and phenological featuresChinaChina, North and South Korea
The Google Earth Engine Mangrove Mapping Methodology (GEEMMM)UKMyanmar
The Key Reason of False Positive Misclassification for Accurate Large-Area Mangrove ClassificationsChinaChina
Turning the Tide on Mapping Marginal Mangroves with Multidimensional Space-Time Remote SensingAustraliaAustralia
Using multi-indices approach to quantify mangrove changes over the Western Arabian Gulf along Saudi Arabia coastUSASaudi Arabia
Annual Change Analysis of Mangrove Forests in China during 1986–2021 Based on Google Earth EngineChinaChina
Assessment of mangrove cover dynamics and its health status in the Gulf of Khambhat, Western India, using high-resolution multitemporal satellite data and Google Earth EngineIndiaIndia
Decision surface optimization in mapping exotic mangrove species (Sonneratia apetala) across latitudinal coastal areas of ChinaChinaChina
Identification of Mangrove Changes in The Mahakam Delta in 2007–2017 using Alos/Palsar and LandsatIndonesiaIndonesia
Landsat-8-based coastal ecosystem mapping in South Africa using Random Forest classification in Google Earth EngineSouth AfricaSouth Africa
Mapping Multidecadal Mangrove Extent in the Northern Coast of Vietnam Using Landsat Time Series Data on Google Earth Engine PlatformVietnamVietnam
Monitoring detailed mangrove hurricane damage and early recovery using multisource remote sensing dataMexicoMexico
Quantifying Mangrove Extent Using a Combination of Optical and Radar Images in a Wetland Complex, Western Region, GhanaGhanaGhana
Remap: An online remote sensing application for land cover classification and monitoringAustraliaAustralia
The environmental burdens of special economic zones on the coastal and marine environment: A remote sensing assessment in MyanmarUSAMyanmar
The national nature reserves in China: Are they effective in conserving mangroves?ChinaChina
Tracking changes in extent and distribution of tropical coastal covers using simple semi-supervised classificationUSAColombia
Tracking Deforestation, Drought, and Fire Occurrence in Kutai National Park, IndonesiaCanadaIndonesia
Table A2. Summary of selected 2023 remote sensing studies using Google Earth Engine (GEE) for mangrove monitoring.
TitlePublication DateTotal CitationsAverage/YearSummary of GEE Implementation: Methods, Advantages, and Future Directions
GWL-FCS30: a global 30 m wetland map with a fine classification system using multisourced and time series remote sensing imagery in 2020 [136]JAN 20237826Leveraged multisource, time series imagery in GEE; generated phenological composites, stratified random samples, and a Random Forest classifier; all preprocessing, classification, and accuracy assessment ran within GEE. Future work should integrate additional data sources to further refine map detail.
Identifying mangroves through knowledge extracted from trained Random Forest models: An interpretable mangrove mapping approach (IMMA) [137]JUL 20233612Employed GEE to extract spectral-band thresholds from pretrained Random Forest models; GEE aided automation; interpretable delineation of mangrove extents without manual parameter tuning was possible.
Remote sensing for cost-effective blue carbon accounting [63]MAR 2023289.33Demonstrated that cloud-computing platforms like GEE, combined with multisensor fusion, big-data integration, and AI algorithms, allow sophisticated blue-carbon estimation and have the potential to attain higher accuracy and precision without the need to download large volumes of observational data.
Long-Term Wetland Monitoring Using the Landsat Archive: A Review [138]FEB 2023175.67Reviewed GEE-based workflows using intra-annual Landsat TM/ETM+/OLI-TIRS time series and efficient index calculations for regional to continental-scale change detection. Highlighted potential of GEE to reduce technology gaps between the Global North and South by democratizing access to large-scale time series analyses.
Collaborative multiple change detection methods for monitoring the spatiotemporal dynamics of mangroves in Beibu Gulf, China [139]DEC 2023134.33Showcased GEE implementation of temporal-segmentation algorithms (e.g., CCDC) to deliver robust, automated mapping of mangrove extent and dynamics over time.
Mangrove species mapping through phenological analysis using Random Forest algorithm on Google Earth Engine [140]APR 2023134.33Used GEE to access multisource, multitemporal imagery; applied cloud filtering, tidal-effect thresholding, and computed 21 spectral indices; generated max/mean/median composites; and ran Random Forest classification. Noted that rapidly mapping mangrove species was possible without requiring local training samples.
Monitoring of 35-Year Mangrove Wetland Change Dynamics and Agents in the Sundarbans Using Temporal Consistency Checking [141]FEB 2023134.33Accessed the complete Landsat archive in GEE; applied cloud filtering, median composites, spectral-Tasseled-Cap indices, pixel unmixing, gap filling, and temporal segmentation algorithm; ran GEE-based Random Forest and preclassification workflows; compared age-structure map products; and computed accuracy while accounting for tidal effects.
Annual Mangrove Vegetation Cover Changes (2014–2020) in Indian Sundarbans National Park Using Landsat 8 and Google Earth Engine [142]MAR 2023124Retrieved and preprocessed Landsat 8 in GEE; performed cloud/shadow masking, spectral-index computation, and median compositing; then conducted time series change detection. Authors demonstrated that the speed and efficiency of GEE were superior for large-scale mangrove monitoring.
An enhanced approach to mangrove forest analysis in the Colombian Pacific coast using optical and SAR data in Google Earth Engine [143]APR 2023103.33Fused Landsat and SAR inputs in GEE with cloud/speckle (Refined Lee) filtering; computed spectral indices and GLCM texture metrics; generated image composites; and tuned Random Forest hyperparameters, which achieved improved classification accuracy.
Spatiotemporal monitoring of Qeshm mangrove forests through machine learning classification of SAR and optical images on Google Earth Engine [144]OCT 202393Employed GEE’s free access to Landsat 8, Sentinel-1/2; fused optical and radar data; applied spectral indices; and trained SVM and Random Forest models, computing overall accuracy entirely within GEE’s cloud environment. Noted that GEE gives researchers instant access to vast multisensor and multitemporal imagery, plus built-in tools for preprocessing, analysis, and machine learning. It enables fast, reproducible mapping without local hardware constraints.
Satellite Data Reveal Concerns Regarding Mangrove Restoration Efforts in Southern China [145]SEP 202372.33Used GEE to access the Landsat archive; calculate spectral indices; apply user-defined thresholding; analyze time series. Tidal influence was considered. Authors used temporal segmentation algorithm for disturbance detection. Accuracy was assessed using F1-score metrics using GEE.
Comparison of the Applicability of J-M Distance Feature Selection Methods for Coastal Wetland Classification [146]JUN 202372.33Accessed Sentinel and DEM data in GEE; performed cloud masking, SAR noise removal, and terrain correction; fused datasets; computed spectral indices and GLCM metrics; and trained a Random Forest classifier; evaluated performance via confusion-matrix.
Time series (2001/2002–2021) analysis of Earth observation data using Google Earth Engine (GEE) for detecting changes in land use land cover (LULC) with specific reference to forest cover in East Godavari Region, Andhra Pradesh, India [147]MAY 202372.33This paper is not explicitly mangrove-focused. Authors harnessed GEE’s cloud infrastructure to automate a 20-year LULC change-detection. The study accessed and preprocessed Landsat archives; applied cloud masking and normalization. GEE-based Hansen global forest change data was used. Classification and Regression Tree algorithm was utilized, and accuracy was assessed using GEE.
Comparison of vegetation indices and image classification methods for mangrove mapping at semi-detailed scale in southwest of Rio de Janeiro, Brazil [148]APR 202372.33Retrieved Landsat in GEE; applied topographic masking, median composites, and computed spectral indices. Ran supervised classifiers (CART, RF, Minimum Distance) and unsupervised methods (K-means, X-means, Cascade Simple K-means, LVQ, Cobweb), noting GEE’s capacity to handle unprecedented data volumes. Authors highlighted the MVI-Cobweb method for accurately identifying various mangrove ecotypes and recommended testing newer algorithms in future studies.
Understanding the natural expansion of white mangrove (Laguncularia racemosa) in an ephemeral inlet based on geomorphological analysis and remote sensing data [149]JUL 202372.33Analyzed Sentinel-2 NDVI time series via the GEE plugin in QGIS. Authors successfully detected spatial expansion patterns of L. racemosa linked to geomorphological changes.
Understanding the states and dynamics of mangrove forests in land cover transitions of The Gambia using a Fourier transformation of Landsat and MODIS time series in Google Earth Engine [150]FEB 23 202362Accessed Landsat/MODIS in GEE; applied cloud masking, generated gap-free median mosaics, computed spectral indices, and performed harmonics-based phenological analysis with K-means clustering for sample design. Ran Random Forest classification, assessed accuracy, and recommended longer data records and CCDC temporal segmentation for future work.

References

  1. Barbier, E.B. Natural barriers to natural disasters: Replanting mangroves after the tsunami. Front. Ecol. Environ. 2006, 4, 124–131. [Google Scholar] [CrossRef]
  2. Spalding, M. World Mangrove Atlas; International Society for Mangrove Ecosystems: Okinawa, Japan, 1997. [Google Scholar]
  3. Alongi, D.M. Present state and future of the world’s mangrove forests. Environ. Conserv. 2002, 29, 331–349. [Google Scholar] [CrossRef]
  4. Mitra, A. Mangrove Forests in India: Exploring Ecosystem Services; Springer International Publishing: Cham, Switzerland, 2020. [Google Scholar]
  5. Craft, C. Mangroves. In Creating and Restoring Wetlands; Elsevier: Amsterdam, The Netherlands, 2016; pp. 233–263. [Google Scholar]
  6. Costanza, R.; de Groot, R.; Sutton, P.; van der Ploeg, S.; Anderson, S.J.; Kubiszewski, I.; Farber, S.; Turner, R.K. Changes in the global value of ecosystem services. Glob. Environ. Change 2014, 26, 152–158. [Google Scholar] [CrossRef]
  7. Held, A.; Ticehurst, C.; Lymburner, L.; Williams, N. High resolution mapping of tropical mangrove ecosystems using hyperspectral and radar remote sensing. Int. J. Remote Sens. 2003, 24, 2739–2759. [Google Scholar] [CrossRef]
  8. Worthington, T.A.; Andradi-Brown, D.A.; Bhargava, R.; Buelow, C.; Bunting, P.; Duncan, C.; Fatoyinbo, L.; Friess, D.A.; Goldberg, L.; Hilarides, L.; et al. Harnessing Big Data to Support the Conservation and Rehabilitation of Mangrove Forests Globally. One Earth 2020, 2, 429–443. [Google Scholar] [CrossRef]
  9. Davie, J.D.S.; Hegerl, E.J.; Saenger, P. Global Status of Mangrove Ecosystems; IUCN: Gland, Switzerland, 1983. [Google Scholar]
  10. Clüsener-Godt, M.; Cárdenas Tomažič, M.R. 8—The Importance of Mangrove Ecosystems for Nature Protection and Food Productivity: Actions of UNESCO’s Man and the Biosphere Programme. In Halophytes for Food Security in Dry Lands; Khan, M.A., Ozturk, M., Gul, B., Ahmed, M.Z., Eds.; Academic Press: San Diego, CA, USA, 2016; pp. 125–140. [Google Scholar]
  11. Fao. The World’s Mangroves 2000–2020; FAO: Rome, Italy, 2023. [Google Scholar]
  12. Kusmana, C. Distribution and Current Status of Mangrove Forests in Indonesia. In Mangrove Ecosystems of Asia: Status, Challenges and Management Strategies; Faridah-Hanum, I., Latiff, A., Hakeem, K.R., Ozturk, M., Eds.; Springer: New York, NY, USA, 2014; pp. 37–60. [Google Scholar]
  13. Tangah, J.; Bajau, F.E.; Jilimin, W.; Baba, S.; Chan, H.T.; Kezuka, M. Rehabilitation of Mangroves in Sabah—The SFD-ISME Collaboration (2011–2014); Technical Report; Sabah Forestry Department, International Society for Mangrove Ecosystems and Tokio Marine & Nichido Fire Insurance Co., Ltd.: Tokyo, Japan, 2015. [Google Scholar]
  14. United Nations Development Programme; World Conservation Union. Mangroves for the Future: A Strategy for Promoting Investment in Coastal Ecosystem Conservation; Technical Report; United Nations Development Programme: New York, NY, USA; World Conservation Union: Gland, Switzerland, 2015. [Google Scholar]
  15. Adame, M.F.; Kauffman, J.B.; Medina, I.; Gamboa, J.N.; Torres, O.; Caamal, J.P.; Reza, M.; Herrera-Silveira, J.A. Carbon Stocks of Tropical Coastal Wetlands within the Karstic Landscape of the Mexican Caribbean. PLoS ONE 2013, 8, e56569. [Google Scholar] [CrossRef]
  16. Atwood, T.B.; Connolly, R.M.; Almahasheer, H.; Carnell, P.E.; Duarte, C.M.; Ewers Lewis, C.J.; Irigoien, X.; Kelleway, J.J.; Lavery, P.S.; Macreadie, P.I.; et al. Global patterns in mangrove soil carbon stocks and losses. Nat. Clim. Change 2017, 7, 523–528. [Google Scholar] [CrossRef]
  17. Bouillon, S.; Borges, A.V.; Castañeda Moya, E.; Diele, K.; Dittmar, T.; Duke, N.C.; Kristensen, E.; Lee, S.Y.; Marchand, C.; Middelburg, J.J.; et al. Mangrove production and carbon sinks: A revision of global budget estimates. Glob. Biogeochem. Cycles 2008, 22, 3052. [Google Scholar] [CrossRef]
  18. Kristensen, E.; Bouillon, S.; Dittmar, T.; Marchand, C. Organic carbon dynamics in mangrove ecosystems: A review. Aquat. Bot. 2008, 89, 201–219. [Google Scholar] [CrossRef]
  19. Moraes, O. Blue carbon in area-based coastal and marine management schemes—A review. J. Indian Ocean Reg. 2019, 15, 193–212. [Google Scholar] [CrossRef]
  20. Sanderman, J.; Hengl, T.; Fiske, G.; Solvik, K.; Adame, M.F.; Benson, L.; Bukoski, J.J.; Carnell, P.; Cifuentes-Jara, M.; Donato, D.; et al. A global map of mangrove forest soil carbon at 30 m spatial resolution. Environ. Res. Lett. 2018, 13, 055002. [Google Scholar] [CrossRef]
  21. Vanderklift, M.A.; Marcos-Martinez, R.; Butler, J.R.A.; Coleman, M.; Lawrence, A.; Prislan, H.; Steven, A.D.L.; Thomas, S. Constraints and opportunities for market-based finance for the restoration and protection of blue carbon ecosystems. Mar. Policy 2019, 107, 103429. [Google Scholar] [CrossRef]
  22. Dittmar, T.; Hertkorn, N.; Kattner, G.; Lara, R.J. Mangroves, a major source of dissolved organic carbon to the oceans. Glob. Biogeochem. Cycles 2006, 20, 2570. [Google Scholar] [CrossRef]
  23. Diop, S.; Barusseau, J.P.; Descamps, C. (Eds.) The Land/Ocean Interactions in the Coastal Zone of West and Central Africa; Estuaries of the World; Springer International Publishing: Cham, Switzerland, 2014. [Google Scholar]
  24. Donato, D.C.; Kauffman, J.B.; Murdiyarso, D.; Kurnianto, S.; Stidham, M.; Kanninen, M. Mangroves among the most carbon-rich forests in the tropics. Nat. Geosci. 2011, 4, 293–297. [Google Scholar] [CrossRef]
  25. Mizanur Rahman, M.; Nabiul Islam Khan, M.; Fazlul Hoque, A.K.; Ahmed, I. Carbon stock in the Sundarbans mangrove forest: Spatial variations in vegetation types and salinity zones. Wetl. Ecol. Manag. 2015, 23, 269–283. [Google Scholar] [CrossRef]
  26. Thomas, S.; Dargusch, P.; Harrison, S.; Herbohn, J. Why are there so few afforestation and reforestation Clean Development Mechanism projects? Land Use Policy 2010, 27, 880–887. [Google Scholar] [CrossRef]
  27. Younes Cárdenas, N.; Joyce, K.E.; Maier, S.W. Monitoring mangrove forests: Are we taking full advantage of technology? Int. J. Appl. Earth Obs. Geoinf. 2017, 63, 1–14. [Google Scholar] [CrossRef]
  28. Giri, C.; Ochieng, E.; Tieszen, L.L.; Zhu, Z.; Singh, A.; Loveland, T.; Masek, J.; Duke, N. Status and distribution of mangrove forests of the world using earth observation satellite data: Status and distributions of global mangroves. Glob. Ecol. Biogeogr. 2011, 20, 154–159. [Google Scholar] [CrossRef]
  29. Kuenzer, C.; Bluemel, A.; Gebhardt, S.; Quoc, T.V.; Dech, S. Remote Sensing of Mangrove Ecosystems: A Review. Remote Sens. 2011, 3, 878–928. [Google Scholar] [CrossRef]
  30. Purnamasayangsukasih, P.R.; Norizah, K.; Ismail, A.A.M.; Shamsudin, I. A review of uses of satellite imagery in monitoring mangrove forests. IOP Conf. Ser. Earth Environ. Sci. 2016, 37, 012034. [Google Scholar] [CrossRef]
  31. Lewis, R.R.; Milbrandt, E.C.; Brown, B.; Krauss, K.W.; Rovai, A.S.; Beever, J.W.; Flynn, L.L. Stress in mangrove forests: Early detection and preemptive rehabilitation are essential for future successful worldwide mangrove forest management. Mar. Pollut. Bull. 2016, 109, 764–771. [Google Scholar] [CrossRef] [PubMed]
  32. Lee, S.Y.; Primavera, J.H.; Dahdouh-Guebas, F.; McKee, K.; Bosire, J.O.; Cannicci, S.; Diele, K.; Fromard, F.; Koedam, N.; Marchand, C.; et al. Ecological role and services of tropical mangrove ecosystems: A reassessment. Glob. Ecol. Biogeogr. 2014, 23, 726–743. [Google Scholar] [CrossRef]
  33. Farzanmanesh, R.; Khoshelham, K.; Thomas, S. Technological opportunities for measuring and monitoring blue carbon initiatives in mangrove ecosystems. Remote Sens. Appl. Soc. Environ. 2021, 24, 100612. [Google Scholar] [CrossRef]
  34. Diniz, C.; Cortinhas, L.; Nerino, G.; Rodrigues, J.; Sadeck, L.; Adami, M.; Souza, P. Brazilian Mangrove Status: Three Decades of Satellite Data Analysis. Remote Sens. 2019, 11, 808. [Google Scholar] [CrossRef]
  35. Zhao, C.; Qin, C.Z. A detailed mangrove map of China for 2019 derived from Sentinel-1 and-2 images and Google Earth images. Geosci. Data J. 2022, 9, 74–88. [Google Scholar] [CrossRef]
  36. Hickey, S.; Radford, B. Turning the Tide on Mapping Marginal Mangroves with Multi-Dimensional Space-Time Remote Sensing. Remote Sens. 2022, 14, 3365. [Google Scholar] [CrossRef]
  37. Chamberlain, D.; Phinn, S.; Possingham, H. Mangrove Forest Cover and Phenology with Landsat Dense Time Series in Central Queensland, Australia. Remote Sens. 2021, 13, 3032. [Google Scholar] [CrossRef]
  38. Yancho, J.; Jones, T.; Gandhi, S.; Ferster, C.; Lin, A.; Glass, L. The Google Earth Engine Mangrove Mapping Methodology (GEEMMM). Remote Sens. 2020, 12, 3758. [Google Scholar] [CrossRef]
  39. Tran, T.V.; Reef, R.; Zhu, X. A Review of Spectral Indices for Mangrove Remote Sensing. Remote Sens. 2022, 14, 4868. [Google Scholar] [CrossRef]
  40. Pham, T.D.; Xia, J.; Ha, N.T.; Bui, D.T.; Le, N.N.; Tekeuchi, W. A Review of Remote Sensing Approaches for Monitoring Blue Carbon Ecosystems: Mangroves, Seagrassesand Salt Marshes during 2010–2018. Sensors 2019, 19, 1933. [Google Scholar] [CrossRef]
  41. Schill, S.R.; McNulty, V.P.; Perez, D.; Shono, K.; Friedman, K. Remote Sensing Techniques for Mapping and Monitoring Mangroves at Fine Scales; FAO: Rome, Italy, 2024. [Google Scholar]
  42. Ma, Y.; Wu, H.; Wang, L.; Huang, B.; Ranjan, R.; Zomaya, A.; Jie, W. Remote sensing big data computing: Challenges and opportunities. Future Gener. Comput. Syst. 2015, 51, 47–60. [Google Scholar] [CrossRef]
  43. Giri, C.; Pengra, B.; Zhu, Z.; Singh, A.; Tieszen, L.L. Monitoring mangrove forest dynamics of the Sundarbans in Bangladesh and India using multi-temporal satellite data from 1973 to 2000. Estuar. Coast. Shelf Sci. 2007, 73, 91–100. [Google Scholar] [CrossRef]
  44. Gorelick, N.; Hancher, M.; Dixon, M.; Ilyushchenko, S.; Thau, D.; Moore, R. Google Earth Engine: Planetary-scale geospatial analysis for everyone. Remote Sens. Environ. 2017, 202, 18–27. [Google Scholar] [CrossRef]
  45. Alonso, A.; Muñoz Carpena, R.; Kennedy, R.E.; Murcia, C. Wetland Landscape Spatio-Temporal Degradation Dynamics Using the New Google Earth Engine Cloud-Based Platform: Opportunities for Non-Specialists in Remote Sensing. Trans. ASABE 2016, 59, 1331–1342. [Google Scholar]
  46. Jahromi, M.N.; Jahromi, M.N.; Zolghadr-Asli, B.; Pourghasemi, H.R.; Alavipanah, S.K. Google Earth Engine and Its Application in Forest Sciences. In Spatial Modeling in Forest Resources Management; Shit, P.K., Pourghasemi, H.R., Das, P., Bhunia, G.S., Eds.; Springer International Publishing: Cham, Switzerland, 2021; pp. 629–649. [Google Scholar]
  47. Chen, B.; Xiao, X.; Li, X.; Pan, L.; Doughty, R.; Ma, J.; Dong, J.; Qin, Y.; Zhao, B.; Wu, Z.; et al. A mangrove forest map of China in 2015: Analysis of time series Landsat 7/8 and Sentinel-1A imagery in Google Earth Engine cloud computing platform. ISPRS J. Photogramm. Remote Sens. 2017, 131, 104–120. [Google Scholar] [CrossRef]
  48. Tinh, P.; MacKenzie, R.; Hung, T.; Hanh, N.; Hanh, N.; Manh, D.; Ha, H.; Tuan, M. Distribution and drivers of Vietnam mangrove deforestation from 1995 to 2019. Mitig. Adapt. Strateg. Glob. Change 2022, 27, 29. [Google Scholar] [CrossRef]
  49. Bhargava, R.; Sarkar, D.; Friess, D. A cloud computing-based approach to mapping mangrove erosion and progradation: Case studies from the Sundarbans and French Guiana. Estuar. Coast. Shelf Sci. 2021, 248, 106798. [Google Scholar] [CrossRef]
  50. Beselly, S.; van der Wegen, M.; Grueters, U.; Reyns, J.; Dijkstra, J.; Roelvink, D. Eleven Years of Mangrove-Mudflat Dynamics on the Mud Volcano-Induced Prograding Delta in East Java, Indonesia: Integrating UAV and Satellite Imagery. Remote Sens. 2021, 13, 1084. [Google Scholar] [CrossRef]
  51. Gilani, H.; Naz, H.; Arshad, M.; Nazim, K.; Akram, U.; Abrar, A.; Asif, M. Evaluating mangrove conservation and sustainability through spatiotemporal (1990–2020) mangrove cover change analysis in Pakistan. Estuar. Coast. Shelf Sci. 2021, 249, 107128. [Google Scholar] [CrossRef]
  52. Palmatier, R.W.; Houston, M.B.; Hulland, J. Review articles: Purpose, process, and structure. J. Acad. Mark. Sci. 2018, 46, 1–5. [Google Scholar] [CrossRef]
  53. Martín-Martín, A.; Orduna-Malea, E.; Thelwall, M.; Delgado López-Cózar, E. Google Scholar, Web of Science, and Scopus: A systematic comparison of citations in 252 subject categories. J. Inf. 2018, 12, 1160–1177. [Google Scholar] [CrossRef]
  54. Pranckutė, R. Web of Science (WoS) and Scopus: The Titans of Bibliographic Information in Today’s Academic World. Publications 2021, 9, 12. [Google Scholar] [CrossRef]
  55. Clarivate. Web of Science Editorial Selection Process. 2023. Available online: https://clarivate.com/academia-government/scientific-and-academic-research/research-discovery-and-referencing/web-of-science/web-of-science-core-collection/editorial-selection-process/ (accessed on 31 March 2023).
  56. Ibharim, N.; Mustapha, M.; Lihan, T.; Mazlan, A. Mapping mangrove changes in the Matang Mangrove Forest using multi temporal satellite imageries. Ocean Coast. Manag. 2015, 114, 64–76. [Google Scholar] [CrossRef]
  57. Jean-Baptiste, N.; Jensen, J.R. Measurement of Mangrove Biophysical Characteristics in the Bocozelle Ecosystem in Haiti Using ASTER Multispectral Data. Geocarto Int. 2006, 21, 3–8. [Google Scholar] [CrossRef]
  58. Quader, M.A.; Agrawal, S.; Kervyn, M. Multi-decadal land cover evolution in the Sundarban, the largest mangrove forest in the world. Ocean Coast. Manag. 2017, 139, 113–124. [Google Scholar] [CrossRef]
  59. Giri, C. Observation and Monitoring of Mangrove Forests Using Remote Sensing: Opportunities and Challenges. Remote Sens. 2016, 8, 783. [Google Scholar] [CrossRef]
  60. Granell, C.; Havlik, D.; Schade, S.; Sabeur, Z.; Delaney, C.; Pielorz, J.; Usländer, T.; Mazzetti, P.; Schleidt, K.; Kobernus, M.; et al. Future Internet technologies for environmental applications. Environ. Model. Softw. 2016, 78, 1–15. [Google Scholar] [CrossRef]
  61. Wang, L.; Jia, M.; Yin, D.; Tian, J. A review of remote sensing for mangrove forests: 1956–2018. Remote Sens. Environ. 2019, 231, 111223. [Google Scholar] [CrossRef]
  62. Bunting, P.; Rosenqvist, A.; Hilarides, L.; Lucas, R.M.; Thomas, N.; Tadono, T.; Worthington, T.A.; Spalding, M.; Murray, N.J.; Rebelo, L.M. Global Mangrove Extent Change 1996–2020: Global Mangrove Watch Version 3.0. Remote Sens. 2022, 14, 3657. [Google Scholar] [CrossRef]
  63. Malerba, M.E.; Costa, M.D.d.P.; Friess, D.A.; Schuster, L.; Young, M.A.; Lagomasino, D.; Serrano, O.; Hickey, S.M.; York, P.H.; Rasheed, M.; et al. Remote sensing for cost-effective blue carbon accounting. Earth-Sci. Rev. 2023, 238, 104337. [Google Scholar] [CrossRef]
  64. Breiman, L.; Friedman, J.H.; Olshen, R.A.; Stone, C.J. Classification and Regression Trees; Routledge: New York, NY, USA, 2017. [Google Scholar]
  65. Friedman, J.H. Greedy Function Approximation: A Gradient Boosting Machine. Ann. Stat. 2001, 29, 1189–1232. [Google Scholar] [CrossRef]
  66. Jin, X.; Han, J. K-Means Clustering. In Encyclopedia of Machine Learning; Sammut, C., Webb, G.I., Eds.; Springer: Boston, MA, USA, 2010; pp. 563–564. [Google Scholar]
  67. Breiman, L. Random Forests. Mach. Learn. 2001, 45, 5–32. [Google Scholar] [CrossRef]
  68. Shmilovici, A. Support Vector Machines. In Data Mining and Knowledge Discovery Handbook; Maimon, O., Rokach, L., Eds.; Springer: Boston, MA, USA, 2005; pp. 257–276. [Google Scholar]
  69. Tax, D.M.; Duin, R.P. Support Vector Data Description. Mach. Learn. 2004, 54, 45–66. [Google Scholar] [CrossRef]
  70. Bloomfield, P. Fourier Analysis of Time Series: An Introduction; John Wiley & Sons: Hoboken, NJ, USA, 2004. [Google Scholar]
  71. Otsu, N. A Threshold Selection Method from Gray-Level Histograms. IEEE Trans. Syst. Man Cybern. 1979, 9, 62–66. [Google Scholar] [CrossRef]
  72. Kennedy, R.E.; Yang, Z.; Cohen, W.B. Detecting trends in forest disturbance and recovery using yearly Landsat time series: 1. LandTrendr—Temporal segmentation algorithms. Remote Sens. Environ. 2010, 114, 2897–2910. [Google Scholar] [CrossRef]
  73. Forthofer, R.N.; Lee, E.S.; Hernandez, M. 13 - Linear Regression. In Biostatistics, 2nd ed.; Forthofer, R.N., Lee, E.S., Hernandez, M., Eds.; Academic Press: San Diego, CA, USA, 2007; pp. 349–386. [Google Scholar]
  74. Pimple, U.; Simonetti, D.; Hinks, I.; Oszwald, J.; Berger, U.; Pungkul, S.; Leadprathom, K.; Pravinvongvuthi, T.; Maprasoap, P.; Gond, V. A history of the rehabilitation of mangroves and an assessment of their diversity and structure using Landsat annual composites (1987-2019) and transect plot inventories. For. Ecol. Manag. 2020, 462, 118007. [Google Scholar] [CrossRef]
  75. Murray, N.J.; Keith, D.A.; Simpson, D.; Wilshire, J.H.; Lucas, R.M. Remap: An online remote sensing application for land cover classification and monitoring. Methods Ecol. Evol. 2018, 9, 2019–2027. [Google Scholar] [CrossRef]
  76. Bhargava, R.; Friess, D. Previous Shoreline Dynamics Determine Future Susceptibility to Cyclone Impact in the Sundarban Mangrove Forest. Front. Mar. Sci. 2022, 9, 814577. [Google Scholar] [CrossRef]
  77. Li, H.; Jia, M.; Zhang, R.; Ren, Y.; Wen, X. Incorporating the Plant Phenological Trajectory into Mangrove Species Mapping with Dense Time Series Sentinel-2 Imagery and the Google Earth Engine Platform. Remote Sens. 2019, 11, 2479. [Google Scholar] [CrossRef]
  78. Nedd, G.; Oyedotun, T.; Simard, M. Evaluation of Spatio-Temporal Dynamics of Guyana’s Mangroves Using SAR and GEE. Earth Syst. Environ. 2021, 7, 509–524. [Google Scholar] [CrossRef]
  79. Shrestha, S.; Miranda, I.; Kumar, A.; Pardo, M.; Dahal, S.; Rashid, T.; Remillard, C.; Mishra, D. Identifying and forecasting potential biophysical risk areas within a tropical mangrove ecosystem using multi-sensor data. Int. J. Appl. Earth Obs. Geoinf. 2019, 74, 281–294. [Google Scholar] [CrossRef]
  80. Mandal, M.; Kamruzzaman, M.; Hosaka, T. Elucidating the phenology of the Sundarbans mangrove forest using 18-year time series of MODIS vegetation indices. Tropics 2020, 29, 41–55. [Google Scholar] [CrossRef]
  81. Valenti, V.L.; Carcelen, E.C.; Lange, K.; Russo, N.J.; Chapman, B. Leveraging Google Earth Engine User Interface for Semiautomated Wetland Classification in the Great Lakes Basin at 10 m With Optical and Radar Geospatial Datasets. IEEE J. Sel. Top. Appl. Earth Obs. Remote Sens. 2020, 13, 6008–6018. [Google Scholar] [CrossRef]
  82. Scheip, C.M.; Wegmann, K.W. HazMapper: A global open-source natural hazard mapping application in Google Earth Engine. Nat. Hazards Earth Syst. Sci. 2021, 21, 1495–1511. [Google Scholar] [CrossRef]
  83. Baloloy, A.; Blanco, A.; Ana, R.; Nadaoka, K. Development and application of a new mangrove vegetation index (MVI) for rapid and accurate mangrove mapping. Isprs J. Photogramm. Remote Sens. 2020, 166, 95–117. [Google Scholar] [CrossRef]
  84. Cissell, J.; Canty, S.; Steinberg, M.; Simpson, L. Mapping National Mangrove Cover for Belize Using Google Earth Engine and Sentinel-2 Imagery. Appl. Sci. 2021, 11, 4258. [Google Scholar] [CrossRef]
  85. de Jong, S.; Shen, Y.; de Vries, J.; Bijnaar, G.; van Maanen, B.; Augustinus, P.; Verweij, P. Mapping mangrove dynamics and colonization patterns at the Suriname coast using historic satellite data and the LandTrendr algorithm. Int. J. Appl. Earth Obs. Geoinf. 2021, 97, 102293. [Google Scholar] [CrossRef]
  86. Ghorbanian, A.; Zaghian, S.; Asiyabi, R.M.; Amani, M.; Mohammadzadeh, A.; Jamali, S. Mangrove Ecosystem Mapping Using Sentinel-1 and Sentinel-2 Satellite Images and Random Forest Algorithm in Google Earth Engine. Remote Sens. 2021, 13, 2565. [Google Scholar] [CrossRef]
  87. Guild, R.; Wang, X.; Russon, A.E. Tracking Deforestation, Drought, and Fire Occurrence in Kutai National Park, Indonesia. Remote Sens. 2022, 14, 5630. [Google Scholar] [CrossRef]
  88. Parida, B.; Kumar, P. Mapping and dynamic analysis of mangrove forest during 2009–2019 using landsat-5 and sentinel-2 satellite data along Odisha Coast. Trop. Ecol. 2020, 61, 538–549. [Google Scholar] [CrossRef]
  89. Rahman, M.; Zhang, X.; Ahmed, I.; Iqbal, Z.; Zeraatpisheh, M.; Kanzaki, M.; Xu, M. Remote Sensing-Based Mapping of Senescent Leaf C:N Ratio in the Sundarbans Reserved Forest Using Machine Learning Techniques. Remote Sens. 2020, 12, 1375. [Google Scholar] [CrossRef]
  90. Vu, T.T.P.; Pham, T.D.; Saintilan, N.; Skidmore, A.; Luu, H.V.; Vu, Q.H.; Le, N.N.; Nguyen, H.Q.; Matsushita, B. Mapping Multi-Decadal Mangrove Extent in the Northern Coast of Vietnam Using Landsat Time-Series Data on Google Earth Engine Platform. Remote Sens. 2022, 14, 4664. [Google Scholar] [CrossRef]
  91. Zhang, R.; Jia, M.; Wang, Z.; Zhou, Y.; Mao, D.; Ren, C.; Zhao, C.; Liu, X. Tracking annual dynamics of mangrove forests in mangrove National Nature Reserves of China based on time series Sentinel-2 imagery during 2016–2020. Int. J. Appl. Earth Obs. Geoinf. 2022, 112, 102918. [Google Scholar] [CrossRef]
  92. Zhao, C.; Qin, C.Z. Identifying large-area mangrove distribution based on remote sensing: A binary classification approach considering subclasses of non-mangroves. Int. J. Appl. Earth Obs. Geoinf. 2022, 108, 102750. [Google Scholar] [CrossRef]
  93. Johnston-González, R.; Coca, O.; Duque, D.; Ricaurte-Villota, C. Tracking changes in extent and distribution of tropical coastal covers using simple semi-supervised classification. Remote Sens. Appl. Soc. Environ. 2022, 27, 100822. [Google Scholar] [CrossRef]
  94. Aja, D.; Miyittah, M.K.; Angnuureng, D.B. Quantifying Mangrove Extent Using a Combination of Optical and Radar Images in a Wetland Complex, Western Region, Ghana. Sustainability 2022, 14, 16687. [Google Scholar] [CrossRef]
  95. De Alban, J.; Jamaludin, J.; de Wen, D.; Than, M.; Webb, E. Improved estimates of mangrove cover and change reveal catastrophic deforestation in Myanmar. Environ. Res. Lett. 2020, 15, 034034. [Google Scholar] [CrossRef]
  96. Dong, D.; Wang, C.; Yan, J.; He, Q.; Zeng, J.; Wei, Z. Combing Sentinel-1 and Sentinel-2 image time series for invasive Spartina alterniflora mapping on Google Earth Engine: A case study in Zhangjiang Estuary. J. Appl. Remote Sens. 2020, 14, 044504. [Google Scholar]
  97. Mondal, P.; Dutta, T.; Qadir, A.; Sharma, S. Radar and optical remote sensing for near real-time assessments of cyclone impacts on coastal ecosystems. Remote Sens. Ecol. Conserv. 2022, 8, 506–520. [Google Scholar] [CrossRef]
  98. Solanki, J.B.; Lele, N.; Das, A.K.; Maurya, P.; Kumari, R. Assessment of mangrove cover dynamics and its health status in the Gulf of Khambhat, Western India, using high-resolution multi-temporal satellite data and Google Earth Engine. Environ. Monit. Assess. 2022, 194, 896. [Google Scholar] [CrossRef]
  99. Xia, Q.; He, T.; Qin, C.; Xing, X.; Xiao, W. An Improved Submerged Mangrove Recognition Index-Based Method for Mapping Mangrove Forests by Removing the Disturbance of Tidal Dynamics and S. alterniflora. Remote Sens. 2022, 14, 3112. [Google Scholar] [CrossRef]
  100. Bessinger, M.; Lück-Vogel, M.; Skowno, A.; Conrad, F. Landsat-8 based coastal ecosystem mapping in South Africa using random forest classification in Google Earth Engine. S. Afr. J. Bot. 2022, 150, 928–939. [Google Scholar] [CrossRef]
  101. Hauser, L.; Binh, N.; Hoa, P.; Quan, N.; Timmermans, J. Gap-Free Monitoring of Annual Mangrove Forest Dynamics in Ca Mau Province, Vietnamese Mekong Delta, Using the Landsat-7-8 Archives and Post-Classification Temporal Optimization. Remote Sens. 2020, 12, 3729. [Google Scholar] [CrossRef]
  102. Zhao, C.; Qin, C.Z. The Key Reason of False Positive Misclassification for Accurate Large-Area Mangrove Classifications. Remote Sens. 2021, 13, 2909. [Google Scholar] [CrossRef]
  103. Aung, T.S.; Overland, I.; Vakulchuk, R.; Xie, Y. The environmental burdens of special economic zones on the coastal and marine environment: A remote sensing assessment in Myanmar. Remote Sens. Appl. Soc. Environ. 2022, 28, 100809. [Google Scholar] [CrossRef]
  104. Hu, L.; Xu, N.; Liang, J.; Li, Z.; Chen, L.; Zhao, F. Advancing the Mapping of Mangrove Forests at National-Scale Using Sentinel-1 and Sentinel-2 Time-Series Data with Google Earth Engine: A Case Study in China. Remote Sens. 2020, 12, 3120. [Google Scholar] [CrossRef]
  105. Liu, X.; Fatoyinbo, T.; Thomas, N.; Guan, W.; Zhan, Y.; Mondal, P.; Lagomasino, D.; Simard, M.; Trettin, C.; Deo, R.; et al. Large-Scale High-Resolution Coastal Mangrove Forests Mapping Across West Africa With Machine Learning Ensemble and Satellite Big Data. Front. Earth Sci. 2021, 8, 560933. [Google Scholar] [CrossRef]
  106. Lu, Y.; Wang, L. How to automate timely large-scale mangrove mapping with remote sensing. Remote Sens. Environ. 2021, 264, 112585. [Google Scholar] [CrossRef]
  107. Mondal, P.; Liu, X.; Fatoyinbo, T.; Lagomasino, D. Evaluating Combinations of Sentinel-2 Data and Machine-Learning Algorithms for Mangrove Mapping in West Africa. Remote Sens. 2019, 11, 2928. [Google Scholar] [CrossRef]
  108. Zhao, C.; Qin, C.Z. 10-m-resolution mangrove maps of China derived from multi-source and multi-temporal satellite observations. Isprs J. Photogramm. Remote Sens. 2020, 169, 389–405. [Google Scholar] [CrossRef]
  109. Le, H.; Tran, T.; Gyeltshen, S.; Nguyen, C.; Tran, D.; Luu, T.; Duong, M. Characterizing Spatiotemporal Patterns of Mangrove Forests in Can Gio Biosphere Reserve Using Sentinel-2 Imagery. Appl. Sci. 2020, 10, 4058. [Google Scholar] [CrossRef]
  110. Valderrama-Landeros, L.; Flores-Verdugo, F.; Rodriguez-Sobreyra, R.; Kovacs, J.; Flores-de Santiago, F. Extrapolating canopy phenology information using Sentinel-2 data and the Google Earth Engine platform to identify the optimal dates for remotely sensed image acquisition of semiarid mangroves. J. Environ. Manag. 2021, 279, 111617. [Google Scholar] [CrossRef] [PubMed]
  111. Google. Sentinel Collections in Earth Engine: Earth Engine Data Catalog; Google: Mountain View, CA, USA, 2023. [Google Scholar]
  112. Ghorbanian, A.; Ahmadi, S.; Amani, M.; Mohammadzadeh, A.; Jamali, S. Application of Artificial Neural Networks for Mangrove Mapping Using Multi-Temporal and Multi-Source Remote Sensing Imagery. Water 2022, 14, 244. [Google Scholar] [CrossRef]
  113. Lomeo, D.; Singh, M. Cloud-Based Monitoring and Evaluation of the Spatial-Temporal Distribution of Southeast Asia’s Mangroves Using Deep Learning. Remote Sens. 2022, 14, 2291. [Google Scholar] [CrossRef]
  114. Mullissa, A.; Vollrath, A.; Odongo-Braun, C.; Slagter, B.; Balling, J.; Gou, Y.; Gorelick, N.; Reiche, J. Sentinel-1 SAR Backscatter Analysis Ready Data Preparation in Google Earth Engine. Remote Sens. 2021, 13, 1954. [Google Scholar] [CrossRef]
  115. Mentaschi, L.; Vousdoukas, M.I.; Pekel, J.F.; Voukouvalas, E.; Feyen, L. Global long-term observations of coastal erosion and accretion. Sci. Rep. 2018, 8, 12876. [Google Scholar] [CrossRef]
  116. Google. Earth Engine Quotas: Google Earth Engine; Google: Mountain View, CA, USA, 2023. [Google Scholar]
  117. Priyono, K.D.; Saifuddin, A.; Nugroho, F.S.; Jumadi, J. Identification of Mangrove Changes in The Mahakam Delta in 2007–2017 using Alos/Palsar and Landsat. Int. J. GEOMATE 2022, 23, 77–84. [Google Scholar] [CrossRef]
  118. Google. Machine Learning in Earth Engine: Google Earth Engine: Google for Developers; Google: Mountain View, CA, USA, 2023. [Google Scholar]
  119. Google. Earth Engine Data Catalog: Google for Developers; Google: Mountain View, CA, USA, 2023. [Google Scholar]
  120. Li, W.; El-Askary, H.; Qurban, M.; Li, J.; ManiKandan, K.; Piechota, T. Using multi-indices approach to quantify mangrove changes over the Western Arabian Gulf along Saudi Arabia coast. Ecol. Indic. 2019, 102, 734–745. [Google Scholar] [CrossRef]
  121. Hooper, S.; Kennedy, R.E. A spatial ensemble approach for broad-area mapping of land surface properties. Remote Sens. Environ. 2018, 210, 473–489. [Google Scholar] [CrossRef]
  122. Montero, D.; Aybar, C.; Mahecha, M.D.; Wieneke, S. Spectral: Awesome Spectral Indices deployed via the Google Earth Engine JavaScript API. Int. Arch. Photogramm. Remote Sens. Spat. Inf. Sci. 2022, 48, 301–306. [Google Scholar] [CrossRef]
  123. Pasquarella, V.J.; Arévalo, P.; Bratley, K.H.; Bullock, E.L.; Gorelick, N.; Yang, Z.; Kennedy, R.E. Demystifying LandTrendr and CCDC temporal segmentation. Int. J. Appl. Earth Obs. Geoinf. 2022, 110, 102806. [Google Scholar] [CrossRef]
  124. Murillo-Sandoval, P.J.; Fatoyinbo, L.; Simard, M. Mangroves Cover Change Trajectories 1984–2020: The Gradual Decrease of Mangroves in Colombia. Front. Mar. Sci. 2022, 9, 892946. [Google Scholar] [CrossRef]
  125. Lee, C.K.F.; Duncan, C.; Nicholson, E.; Fatoyinbo, T.E.; Lagomasino, D.; Thomas, N.; Worthington, T.A.; Murray, N.J. Mapping the Extent of Mangrove Ecosystem Degradation by Integrating an Ecological Conceptual Model with Satellite Data. Remote Sens. 2021, 13, 2047. [Google Scholar] [CrossRef]
  126. Bullock, E.L.; Woodcock, C.E.; Olofsson, P. Monitoring tropical forest degradation using spectral unmixing and Landsat time series analysis. Remote Sens. Environ. 2020, 238, 110968. [Google Scholar] [CrossRef]
  127. Vancutsem, C.; Achard, F.; Pekel, J.F.; Vieilledent, G.; Carboni, S.; Simonetti, D.; Gallego, J.; Aragão, L.E.O.C.; Nasi, R. Long-term (1990–2019) monitoring of forest cover changes in the humid tropics. Sci. Adv. 2021, 7, eabe1603. [Google Scholar] [CrossRef]
  128. Obida, C.B.; Blackburn, G.A.; Whyatt, J.D.; Semple, K.T. Counting the cost of the Niger Delta’s largest oil spills: Satellite remote sensing reveals extensive environmental damage with >1million people in the impact zone. Sci. Total Environ. 2021, 775, 145854. [Google Scholar] [CrossRef]
  129. Onyena, A.P.; Sam, K. A review of the threat of oil exploitation to mangrove ecosystem: Insights from Niger Delta, Nigeria. Glob. Ecol. Conserv. 2020, 22, e00961. [Google Scholar] [CrossRef]
  130. Barenblitt, A.; Fatoyinbo, L.; Thomas, N.; Stovall, A.; de Sousa, C.; Nwobi, C.; Duncanson, L. Invasion in the Niger Delta: Remote sensing of mangrove conversion to invasive Nypa fruticans from 2015 to 2020. Remote Sens. Ecol. Conserv. 2023, 10, 5–23. [Google Scholar] [CrossRef]
  131. Lassalle, G.; Ferreira, M.P.; Cué La Rosa, L.E.; Del’Papa Moreira Scafutto, R.; de Souza Filho, C.R. Advances in multi- and hyperspectral remote sensing of mangrove species: A synthesis and study case on airborne and multisource spaceborne imagery. ISPRS J. Photogramm. Remote Sens. 2023, 195, 298–312. [Google Scholar] [CrossRef]
  132. Arasumani, M.; Kumaresan, M.; Esakki, B. Mapping native and non-native vegetation communities in a coastal wetland complex using multi-seasonal Sentinel-2 time series. Biol. Invasions 2024, 26, 1105–1124. [Google Scholar] [CrossRef]
  133. Lang, N.; Jetz, W.; Schindler, K.; Wegner, J.D. A high-resolution canopy height model of the Earth. Nature Ecology & Evolution 2023, 7, 1778–1789. [Google Scholar]
  134. Simard, M.; Fatoyinbo, L.; Smetanka, C.; Rivera-Monroy, V.H.; Castañeda Moya, E.; Thomas, N.; Van der Stocken, T. Mangrove canopy height globally related to precipitation, temperature and cyclone frequency. Nat. Geosci. 2019, 12, 40–45. [Google Scholar] [CrossRef]
  135. Zeng, Y.; Friess, D.A.; Sarira, T.V.; Siman, K.; Koh, L.P. Global potential and limits of mangrove blue carbon for climate change mitigation. Curr. Biol. 2021, 31, 1737–1743.e3. [Google Scholar] [CrossRef] [PubMed]
  136. Zhang, X.; Liu, L.; Zhao, T.; Chen, X.; Lin, S.; Wang, J.; Mi, J.; Liu, W. GWLFCS30: A global 30 m wetland map with a fine classificationsystem using multi-sourced and time-series remote sensing imagery in 2020. Earth Syst. Sci. Data 2023, 15, 265–293. [Google Scholar] [CrossRef]
  137. Zhao, C.; Jia, M.; Wang, Z.; Mao, D.; Wang, Y. Identifying mangroves through knowledge extracted from trained random forest models: An interpretable mangrove mapping approach (IMMA). ISPRS J. Photogramm. Remote Sens. 2023, 201, 209–225. [Google Scholar] [CrossRef]
  138. Demarquet, Q.; Rapinel, S.; Dufour, S.; Hubert-Moy, L. Long-Term Wetland Monitoring Using the Landsat Archive: A Review. Remote Sens. 2023, 15, 820. [Google Scholar] [CrossRef]
  139. Fu, B.; Yao, H.; Lan, F.; Li, S.; Liang, Y.; He, H.; Jia, M.; Wang, Y.; Fan, D. Collaborative multiple change detection methods for monitoring the spatio-temporal dynamics of mangroves in Beibu Gulf, China. Giscience Remote Sens. 2023, 60, 2202506. [Google Scholar] [CrossRef]
  140. Aji, M.A.P.; Kamal, M.; Farda, N.M. Mangrove species mapping through phenological analysis using random forest algorithm on Google Earth Engine. Remote Sens.-Appl.-Soc. Environ. 2023, 30, 100978. [Google Scholar] [CrossRef]
  141. Zhang, Z.; Ahmed, M.R.; Zhang, Q.; Li, Y.; Li, Y. Monitoring of 35-Year Mangrove Wetland Change Dynamics and Agents in the Sundarbans Using Temporal Consistency Checking. Remote Sens. 2023, 15, 625. [Google Scholar] [CrossRef]
  142. Karsch, G.; Mukul, S.A.; Srivastava, S.K. Annual Mangrove Vegetation Cover Changes (2014-2020) in Indian Sundarbans National Park Using Landsat 8 and Google Earth Engine. Sustainability 2023, 15, 5592. [Google Scholar] [CrossRef]
  143. Selvaraj, J.J.; Perez, B.E.G. An enhanced approach to mangrove forest analysis in the Colombian Pacific coast using optical and SAR data in Google Earth Engine. Remote Sens.-Appl.-Soc. Environ. 2023, 30, 100938. [Google Scholar] [CrossRef]
  144. Mahdavifard, M.; Ahangar, S.K.; Feizizadeh, B.; Kamran, K.V.; Karimzadeh, S. Spatio-Temporal monitoring of Qeshm mangrove forests through machine learning classification of SAR and optical images on Google Earth Engine. Int. J. Eng. Geosci. 2023, 8, 239–250. [Google Scholar] [CrossRef]
  145. Fan, C.; Hou, X.; Zhang, Y.; Li, D. Satellite Data Reveal Concerns Regarding Mangrove Restoration Efforts in Southern China. Remote Sens. 2023, 15, 4151. [Google Scholar] [CrossRef]
  146. Zhang, X.; Lin, X.; Fu, D.; Wang, Y.; Sun, S.; Wang, F.; Wang, C.; Xiao, Z.; Shi, Y. Comparison of the Applicability of J-M Distance Feature Selection Methods for Coastal Wetland Classification. Water 2023, 15, 2212. [Google Scholar] [CrossRef]
  147. Kaur, H.; Tyagi, S.; Mehta, M.; Singh, D. Time series (2001/2002–2021) analysis of Earth observation data using Google Earth Engine (GEE) for detecting changes in land use land cover (LULC) with specific reference to forest cover in East Godavari Region, Andhra Pradesh, India. J. Earth Syst. Sci. 2023, 132, 86. [Google Scholar] [CrossRef]
  148. Rodrigues, F.H.; Cerri, R.I.; Kolya, A.d.A.; Veiga, V.M.; Reis, F.A.G.V. Comparison of vegetation indices and image classification methods for mangrove mapping at semi-detailed scale in southwest of Rio de Janeiro, Brazil. Remote Sens.-Appl.-Soc. Environ. 2023, 30, 100965. [Google Scholar] [CrossRef]
  149. Flores-de Santiago, F.; Rodríguez-Sobreyra, R.; Álvarez Sánchez, L.F.; Valderrama-Landeros, L.; Amezcua, F.; Flores-Verdugo, F. Understanding the natural expansion of white mangrove (Laguncularia racemosa) in an ephemeral inlet based on geomorphological analysis and remote sensing data. J. Environ. Manag. 2023, 338, 117820. [Google Scholar] [CrossRef]
  150. Harou, I.L.; Inyele, J.; Minang, P.; Duguma, L. Understanding the states and dynamics of mangrove forests in land cover transitions of The Gambia using a Fourier transformation of Landsat and MODIS time series in Google Earth Engine. Front. For. Glob. Change 2023, 5, 934019. [Google Scholar]
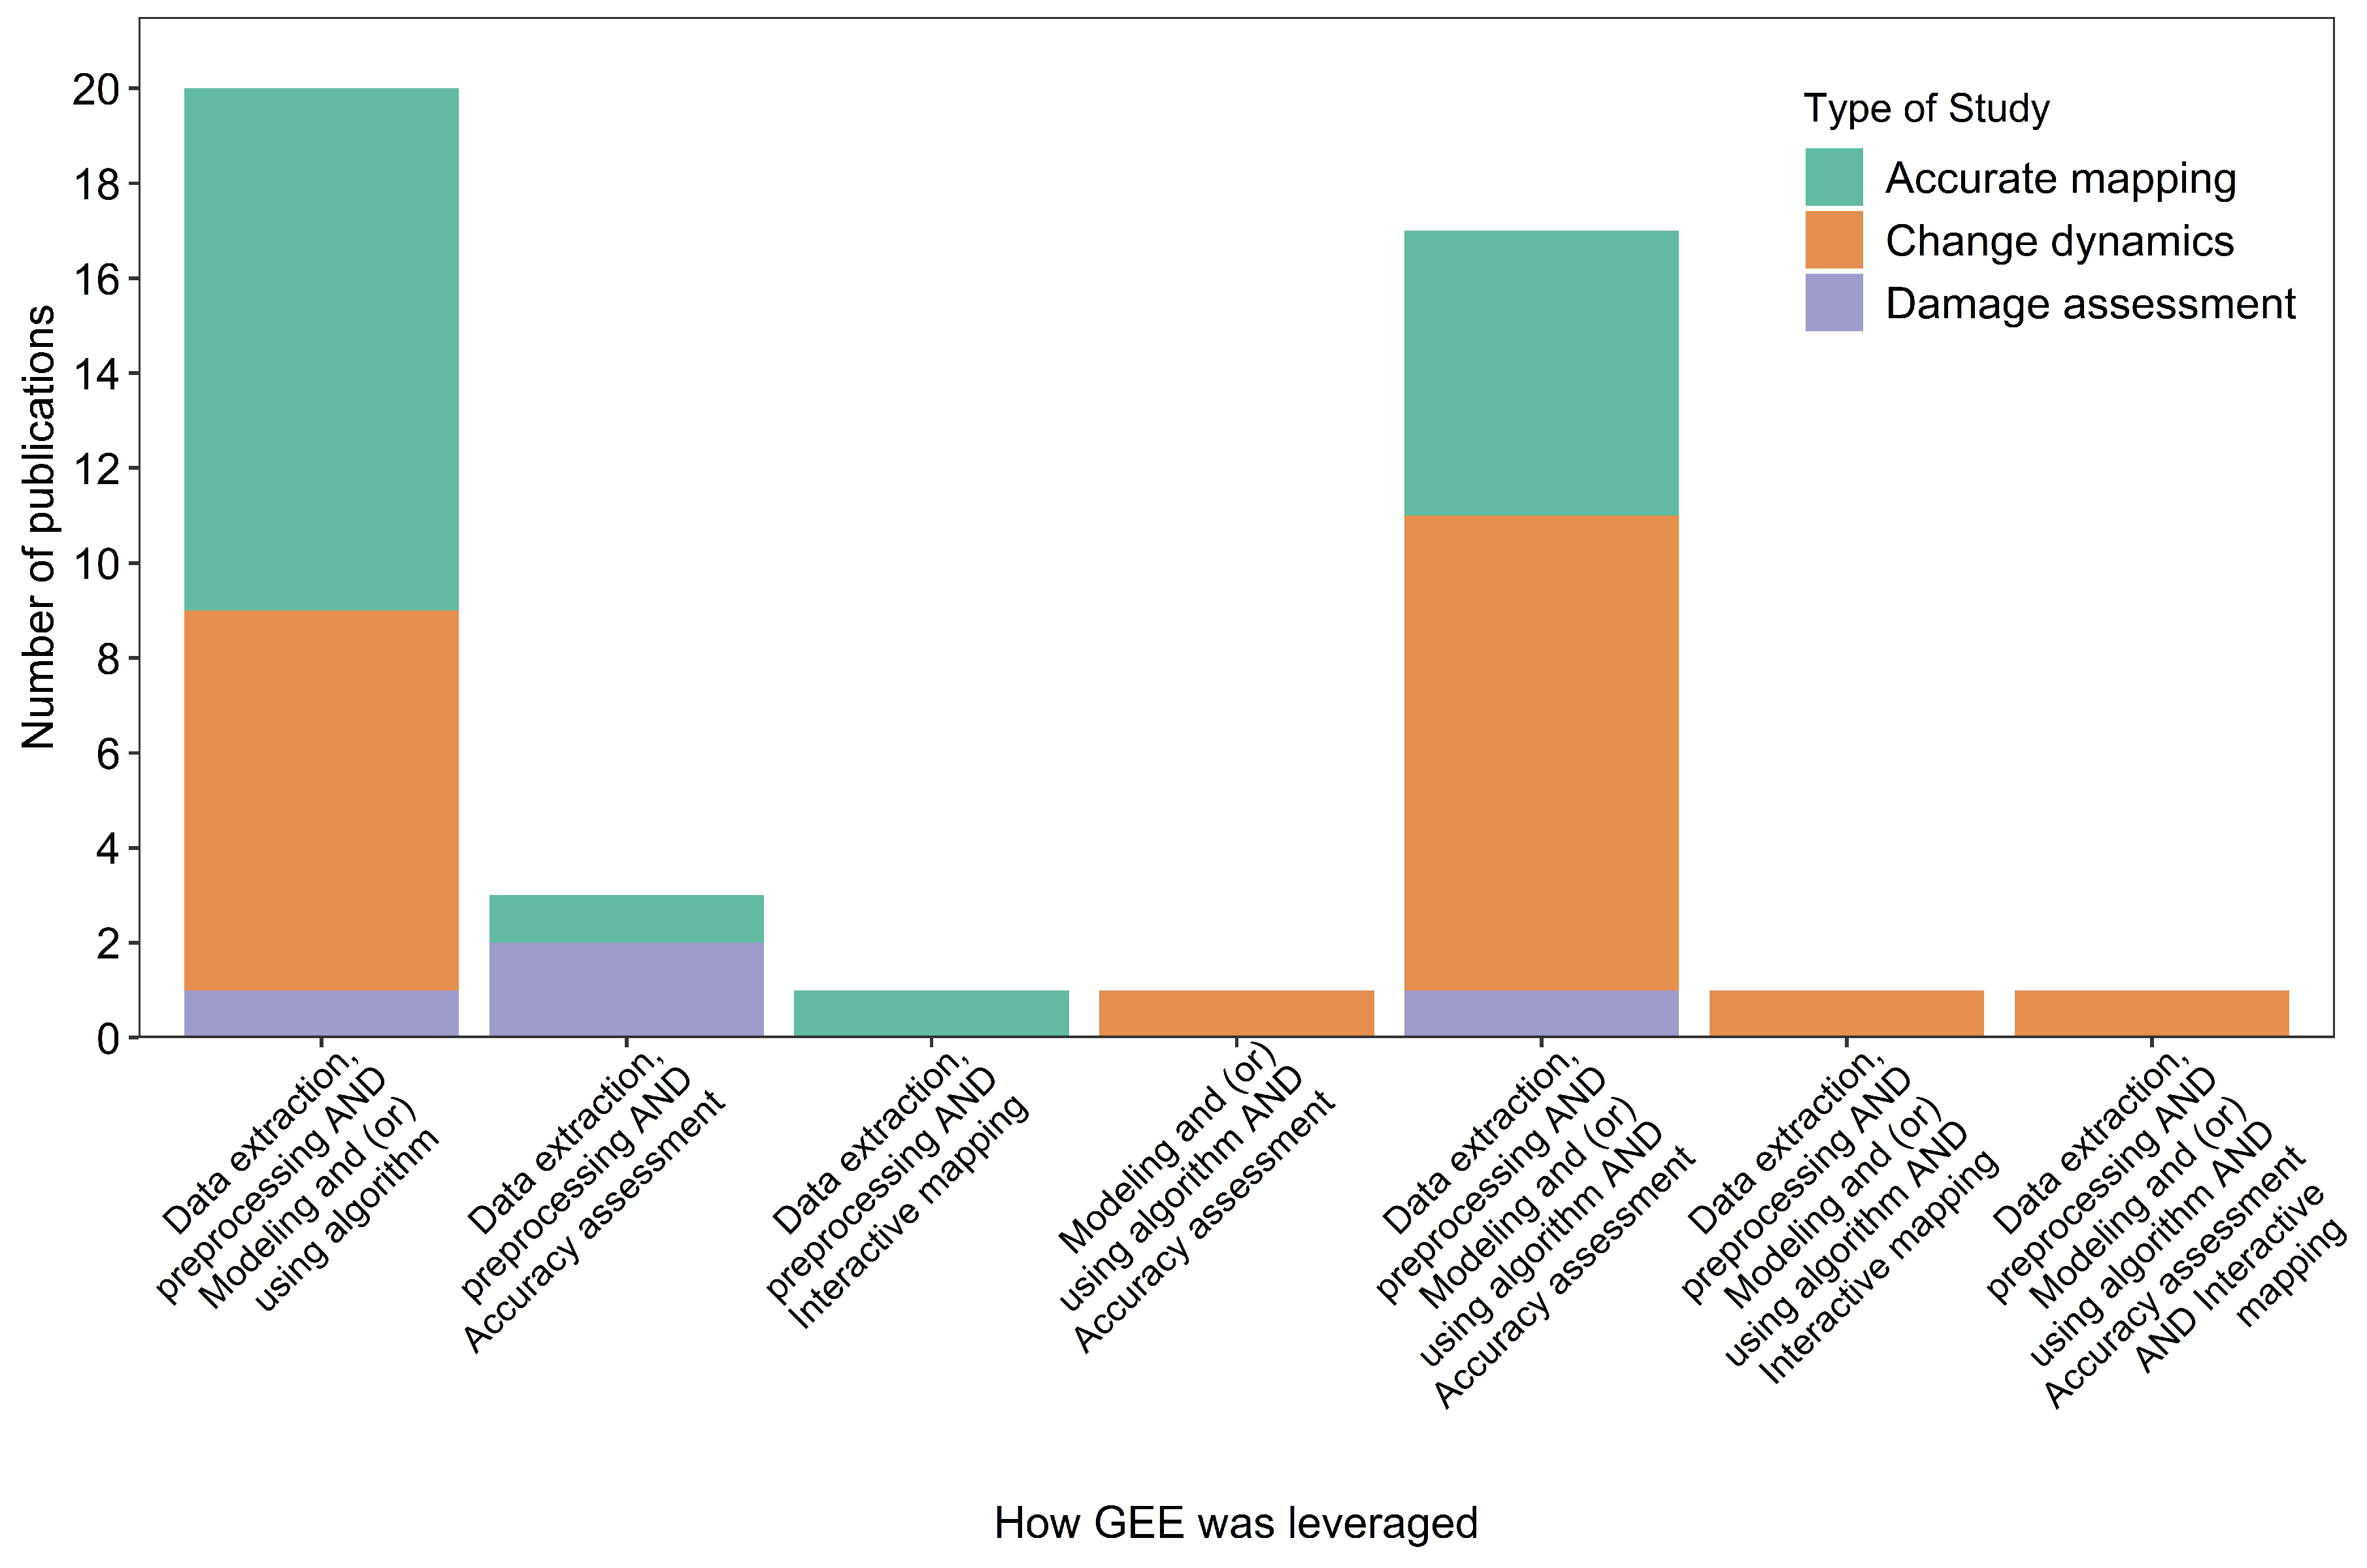
Figure 1. Study areas where GEE was used for mangrove RS. The 2020 Global Mangrove Watch (GMW) Version 3.0 data was used to show mangrove extent [62].
Remotesensing 17 02290 g001
Figure 2. The number of articles that examined mangroves in various countries. Note that some papers considered more than one study site.
Remotesensing 17 02290 g002
Figure 3. The names of the journals that published the 54 articles.
Remotesensing 17 02290 g003
Figure 4. RS-based mangrove studies that had more than one use of GEE.
Remotesensing 17 02290 g004
Figure 5. Techniques for preprocessing within GEE framework.
Remotesensing 17 02290 g005
Figure 6. RS-based mangrove studies that utilized GEE for data extraction and preprocessing; (a) number of publications per year from 2017 to 2022, and (b) number of citations per year from 2017 to 2022.
Remotesensing 17 02290 g006
Figure 7. Number of studies that utilized various GEE-based algorithms for mangrove RS. Note that some studies have utilized more than one algorithm or modeling technique.
Remotesensing 17 02290 g007
Figure 8. RS-based mangrove studies that utilized GEE-based modeling and (or) algorithm: (a) number of publications per year from 2017 to 2022 and (b) number of citations per year from 2017 to 2022.
Remotesensing 17 02290 g008
Figure 9. RS-based mangrove studies that utilized GEE for accuracy assessment: (a) number of publications per year from 2017 to 2022 and (b) number of citations per year from 2017 to 2022.
Remotesensing 17 02290 g009
Figure 10. RS-based mangrove studies that utilized GEE for interactive mapping: (a) number of publications per year from 2017 to 2022 and (b) number of citations per year from 2017 to 2022.
Remotesensing 17 02290 g010
Table 1. Classification of mangrove RS articles by subfield and application of GEE. The number in parentheses represents the number of citations.
Mangrove RS SubfieldHow GEE Was UtilizedAccurate MappingChange DynamicsDamage AssessmentLeaf Biochemical Property Inversion
Extent mappingData extraction, preprocessing3 (35)2 (7)0 (0)0 (0)
Data extraction, preprocessing AND Modeling and (or) using algorithm10 (107)6 (24)1 (1)0 (0)
Data extraction, preprocessing AND Accuracy assessment1 (206)0 (0)2 (24)0 (0)
Data extraction, preprocessing AND Interactive mapping1 (48)0 (0)0 (0)0 (0)
Modeling and (or) using algorithm AND Accuracy assessment0 (0)1 (0)0 (0)0 (0)
Data extraction, preprocessing AND Modeling and (or) using algorithm AND Accuracy assessment5 (69)8 (160)1 (1)0 (0)
Data extraction, preprocessing AND Modeling and (or) using algorithm AND Interactive mapping0 (0)1 (15)0 (0)0 (0)
Data extraction, preprocessing AND Modeling and (or) using algorithm AND Accuracy assessment AND Interactive mapping0 (0)1 (16)0 (0)0 (0)
Extent mapping and height estimationData extraction, preprocessing0 (0)0 (0)1 (0)0 (0)
Data extraction, preprocessing AND Modeling and (or) using algorithm0 (0)1 (7)0 (0)0 (0)
Species mappingData extraction, preprocessing1 (21)1 (9)0 (0)0 (0)
Data extraction, preprocessing AND Modeling and (or) using algorithm1 (0)0 (0)0 (0)0 (0)
Data extraction, preprocessing AND Modeling and (or) using algorithm AND Accuracy assessment1 (34)0 (0)0 (0)0 (0)
Species mapping and height estimationData extraction, preprocessing AND Modeling and (or) using algorithm0 (0)1 (6)0 (0)0 (0)
Biomass estimationData extraction, preprocessing AND Modeling and (or) using algorithm AND Accuracy assessment0 (0)1 (0)0 (0)0 (0)
Health conditionData extraction, preprocessing0 (0)1 (0)0 (0)0 (0)
Effect of climateData extraction, preprocessing AND Modeling and (or) using algorithm AND Accuracy assessment0 (0)1 (18)0 (0)0 (0)
Ecosystem processData extraction, preprocessing0 (0)0 (0)0 (0)1 (5)
Total 23 (520)25 (262)5 (26)1 (5)
Disclaimer/Publisher’s Note: The statements, opinions and data contained in all publications are solely those of the individual author(s) and contributor(s) and not of MDPI and/or the editor(s). MDPI and/or the editor(s) disclaim responsibility for any injury to people or property resulting from any ideas, methods, instructions or products referred to in the content.

