Abstract
Wetlands are critical components of the global carbon cycle, yet their carbon sink dynamics under hydrological fluctuations remain insufficiently understood. This study employed the Carnegie-Ames-Stanford Approach (CASA) model to estimate the net ecosystem productivity (NEP) of the Dongting Lake wetland and explored the spatiotemporal dynamics and driving mechanisms of carbon sinks from 2000 to 2022, utilizing the Theil-Sen median trend, Mann-Kendall test, and attribution based on the differentiating equation (ADE). Results showed that (1) the annual mean spatial NEP was 50.24 g C/m2/a, which first increased and then decreased, with an overall trend of −1.5 g C/m2/a. The carbon sink was strongest in spring, declined in summer, and shifted to a carbon source in autumn and winter. (2) Climate variability and human activities contributed +2.17 and −3.73 g C/m2/a to NEP, respectively. Human activities were the primary driver of carbon sink degradation (74.30%), whereas climate change mainly promoted carbon sequestration (25.70%). However, from 2000–2011 to 2011–2022, climate change shifted from enhancing to limiting carbon sequestration, mainly due to the transition from water storage and lake reclamation to ecological restoration policies and intensified climate anomalies. (3) NEP was negatively correlated with precipitation and water level. Land use adjustments, such as forest expansion and conversion of cropland and reed to sedge, alongside maintaining growing season water levels between 24.06~26.44 m, are recommended to sustain and enhance wetland carbon sinks. Despite inherent uncertainties in model parameterization and the lack of sufficient in situ flux validation, these findings could provide valuable scientific insights for wetland carbon management and policy-making.
1. Introduction
With the intensification of global climate change and anthropogenic activities, atmospheric CO2 concentrations have continued to rise. IPCC [1] reported that the increase in global CO2 levels in 2021 exceeded the decadal average and reached 149% of the pre-industrial levels, with this upward trend still persistent. The surge in carbon emissions has prompted countries worldwide to adopt more proactive response strategies, and China has proposed its dual goals of a carbon peak before 2030 and carbon neutrality by 2060. Wetlands play a crucial role in the global carbon cycle. They accumulate carbon at remarkable rates [2] and serve as major carbon sinks within terrestrial ecosystems [3]. Although wetlands cover only 6–9% of the Earth’s land area, they are estimated to store approximately 35% of the global terrestrial carbon [4,5,6], making an indispensable part for maintaining carbon balance. Nonetheless, the increasing degradation of wetlands is posing significant challenges to their carbon sink capacity, exacerbating global warming, intensifying the greenhouse effect, and triggering socio-ecological challenges [7,8]. Consequently, wetland carbon sequestration and storage have become critical research areas, highlighting the need to assess and understand their carbon sink functions and mechanisms.
Net ecosystem productivity (NEP), a key metric for assessing ecosystem carbon budgets, reflects the difference between the carbon fixed through vegetation photosynthesis and released by soil respiration [9,10]. It can effectively provide insights into ecosystem structure, function, and productivity. Traditional NEP estimation methods are primarily based on the existing biomass inventories or CO2 flux measurements [11], which are often accurate but limited by high costs and time requirements. In recent years, advancements in remote sensing technologies and the development of net primary productivity (NPP) simulation models [12,13] have significantly improved the ability to monitor carbon fluxes at multiple scales. The Carnegie-Ames-Stanford Approach (CASA), a light-use efficiency model, stands out for its simplicity, low reliance on ground truth data, and ease of implementation, making it one of the most widely applied tools for estimating NPP at regional and global scales [14,15,16]. Furthermore, the integration of meteorological and soil parameters to develop soil respiration models has provided new pathways for NEP studies [17,18]. NEP research is evolving toward large-scale and long-term applications, laying a robust foundation for exploring the driving mechanisms of wetland ecosystem carbon sinks.
Numerous studies have applied the CASA model to analyze the temporal and spatial dynamics of wetland vegetation NPP and NEP, providing valuable insights into carbon sink patterns and their underlying drivers. Lyu et al. [19] assessed NPP, NEP, and carbon sink dynamics in the Weihe River Basin, revealing the impacts of climate and land use changes. Zhang et al. [20] examined NPP trends in marsh wetlands across China, highlighting spatial heterogeneity linked to hydrological variation and human interventions. Yang et al. [21] investigated LUCC effects on NPP in the Yangtze River Basin, emphasizing human-driven carbon changes. Zheng et al. [22] employed multi-source remote sensing data to downscale NEP estimation at the county level, demonstrating the feasibility of fine-scale carbon flux monitoring in complex landscapes. However, research focusing on lake wetlands has often overlooked the influence of dynamic water bodies on vegetation carbon sink estimations. In particular, fluctuating water areas lead to continuous changes in the effective measurement range of wetland NEP, which can introduce uncertainties in assessing carbon fluxes. Such simplifications could lead to inaccuracies in spatial heterogeneity expression and obscure the role of hydrological regimes in regulating vegetation carbon uptake, especially in wetlands subject to strong human interventions such as reservoir regulation or artificial vegetation planting. With increasing landscape fragmentation and diverse vegetation structures, it is essential to assess carbon sink variations under fluctuating hydrological conditions in a more adaptive manner.
Furthermore, understanding the respective roles of natural and anthropogenic factors in driving carbon sink dynamics remains a hot topic in current research. Existing studies have been conducted at the watershed scale and primarily addressed drivers such as climate variability, land use change, and urbanization [23,24,25]. There is a lack of quantitative evaluation regarding the relative contributions of these factors, particularly within natural wetlands outside urban areas. Some studies adopted an attribution method based on the Differentiating Equation (ADE) to separate the effects of climate and human activities on ecological and hydrological processes. Lyu et al. [19] applied a modified ADE method to distinguish the relative contributions of climate change and human activities, primarily land use change, on NPP variations in the Weihe River Basin. Zhang et al. [26] used traditional ADE quantitative methods based on partial derivatives to assess the relative impacts of climatic and anthropogenic factors on NPP changes in the Dongting Lake wetlands. These applications typically relied on least squares regression to estimate trends, which are vulnerable to outliers and less effective in highly variable ecosystems. Unlike least squares regression, the Theil–Sen median trend analysis is a non-parametric approach that offers greater robustness and performs well with non-linear or non-normally distributed time series [27]. Integrating ADE with Theil–Sen analysis can help build a more stable and accurate attribution framework for evaluating NEP trends in complex wetland environments. Nonetheless, important questions remain unanswered: Have extreme climate events in recent years weakened the carbon sink capacity of wetlands? How do changes in vegetation types influence carbon sequestration potential? To what extent do fluctuations in water area and water level affect the carbon dynamics of lake wetlands? Addressing these issues is vital to provide valuable guidance for the formulation and implementation of targeted and effective policy strategies.
As a pivotal lake wetland in the middle reaches of the Yangtze River in China, the Dongting Lake wetland presents an ideal case for addressing these questions due to its dense hydrographic network, ecological richness, and significant carbon sink potential [28]. Recognized as one of the Ramsar Wetlands of International Importance [29], the Dongting Lake wetland faces complex interactions between climate variability, land use, and hydrological changes, making it essential to conduct a comprehensive assessment of its carbon sink dynamics.
Therefore, this study aims to: (1) Quantify vegetation NEP from 2000 to 2022 using multi-source remote sensing data and the CASA model, particularly in response to hydrological fluctuations, and reveal the spatiotemporal distribution of carbon sinks with the Theil-Sen median trend and Modified Mann-Kendall test. (2) Assess the relative contributions of natural factors and anthropogenic activities to carbon sink variations through partial correlation analysis and attribution methods based on differential equations, thereby clarifying their respective impacts. (3) Investigate the impacts of water body dynamics on vegetation carbon sequestration, and assess the evolving balance between climatic and anthropogenic influences, in order to propose practical recommendations for land use optimization and water management strategies to enhance wetland carbon sink functions. This research seeks to provide scientific guidance for the ecological security and sustainable development of lake wetland vegetation, offering empirical insights for achieving peak carbon, carbon neutrality, and global wetland ecological protection goals.
2. Materials and Methods
2.1. Study Area
Dongting Lake, located in the northern part of Hunan Province, along the south bank of the Jingjiang section of the Yangtze River (110°40′–113°10′E, 28°30′–29°31′N), is the second-largest freshwater lake in China [30]. It is a typical through-flow lake, comprising three main sub-lakes: East Dongting Lake (EDTL), West Dongting Lake (WDTL), and South Dongting Lake (SDTL) [31]. Its water system receives inflow from four tributaries (Xiangjiang, Zishui, Yuanjiang, and Lishui) and discharges through three outlets (Ouchi, Songzi, and Taiping) into the Yangtze River, ultimately flowing back via the Chenglingji hydrological station. The study area was within the planning boundary of Dongting Lake Wetland Protection Zone, covering an area of approximately 2858.97 km2 (Figure 1).
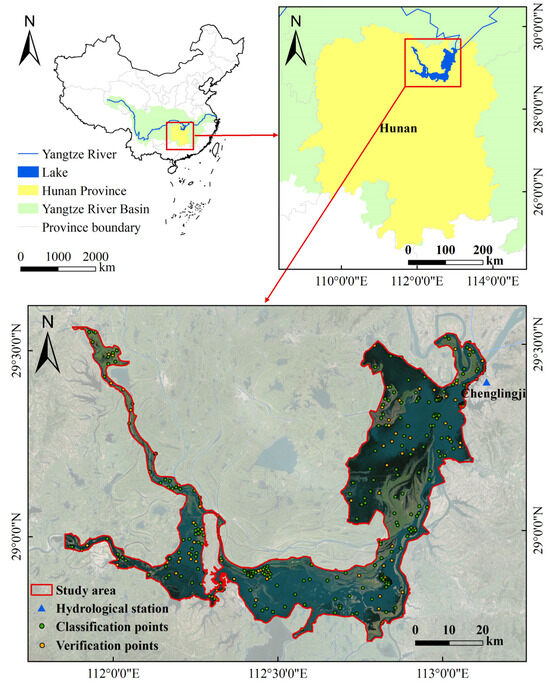
Figure 1.
Location of the Dongting Lake wetland in China with Google Earth background (May 2019).
The Dongting Lake wetland experiences a subtropical monsoon climate, characterized by a mild temperature, abundant precipitation, and four distinct seasons. The annual average temperature is 17 °C, and the average annual precipitation is around 1400 mm. The wetland contains numerous vegetation types, including mudflat, sedge, reed (Phragmites australis), forest, etc., of which reed and sedge are the dominant species and play critical roles in the ecosystem [32]. Notably, the vegetation presents a belt-like distribution pattern, primarily driven by variations in water availability.
2.2. Data and Preprocessing
2.2.1. Remote Sensing Data
The remote sensing data included the MCD13Q1 and MOD17A3HGF datasets, both sourced from GEE (https://developers.google.com/earth-engine/datasets, accessed on 15 September 2024). The MOD13Q1 NDVI product, characterized by a spatial resolution of 250 m and a temporal resolution of 16 days, was primarily for NPP estimation. Preprocessing steps for MOD13Q1 NDVI images involved cloud masking based on the quality assurance (QA) layer, value scaling (to a range of −1 to 1), projection transformation, and the maximum synthesis method to derive monthly NDVI data. The MOD17A3HGF NPP dataset, with a spatial resolution of 500 m and an annual temporal resolution, was mainly for the validation of the simulation performance of the CASA model, with necessary adjustments made to their values, resolution, and projection.
2.2.2. Wetland Classification Data
The hydrological conditions exhibit pronounced seasonal variations. To accurately reflect wetland vegetation distribution, remote sensing images from the flat-water period in May were selected for wetland classification. To address the limitations of MODIS and Landsat images in summer, the improved Flexible Spatiotemporal Data Fusion Method (cuFSDAF 2.0) proposed by Guo et al. [33] was applied, which generated high-resolution (30 m) images for May from 2001 to 2020. Compared with methods like STARFM or ESTARFM, cuFSDAF 2.0 offers higher reconstruction accuracy by incorporating vegetation phenology constraints and improving spatial consistency, making it particularly suitable for complex wetland environments with frequent cloud contamination. For 2000, 2021, and 2022, six scenes of Landsat images with cloud cover <20% were directly acquired from USGS (https://earthexplorer.usgs.gov/, accessed on 25 September 2024). A series of preprocessing steps were performed, including radiometric calibration, FLAASH atmospheric correction, geometric correction, Landsat_gapfill, spectral enhancement, optimal band selection, mosaicking, and cropping.
2.2.3. Hydrology and Meteorological Data
Hydrological data were obtained from monthly water level observations at the Chenglingji Hydrological Station, sourced from the Hydrological Data of the Yangtze River Basin (http://www.cjw.gov.cn/zwzc/zjgb/, accessed on 10 December 2024). Temperature (Tem) and precipitation (Pre) data were derived from the daily terrestrial climate dataset, provided by the China National Meteorological Science Data Center (https://data.cma.cn/, accessed on 5 October 2024). Meteorological data from the surrounding 31 stations with missing or incomplete records were first excluded. With latitude and longitude as independent variables and elevation as a covariate, the ANUSPLIN 4.37 software, a professional meteorological data interpolation tool developed by Hutchinson et al. [34], was applied to generate monthly meteorological raster datasets. Monthly solar radiation (Solar) data were retrieved from the TerraClimate dataset (https://www.climatologylab.org/terraclimate.html, accessed on 25 October 2024), with a spatial resolution of approximately 4 km, and accessed from GEE. Preprocessing steps involved unit conversion (from W/m2 to MJ/m2) and clipping.
2.2.4. Field Measurement Data
Field investigations were primarily for vegetation classification. In May 2023, a field survey was carried out to assess vegetation distribution and structure during the flat-water period in the Dongting Lake wetland. Detailed geographic coordinates and vegetation types for nearly 380 wetland sampling sites were recorded using GPS (Figure 1). These sample points covered various vegetation types, including sedge, reed, woodland, and cropland. Specifically, the stratified random sampling method was used based on different vegetation types within the study area to ensure spatial representativeness. A subset of 285 points was then randomly selected and combined with historical imagery as regions of interest (ROI) for image classification and feature extraction, while the remaining 95 points were allocated for validating classification accuracy. Additional survey data gathered from December 2022 to January 2023 [32], corresponding to the dry season, were employed as supplementary references for classification.
To validate the simulated NEP, this study utilized the Carbon dioxide flux observation dataset of the Miscanthus sacchariflorus ecosystem at Dongting Lake National Station from 2014 to 2016, sourced from the National Ecosystem Science Data Center (http://www.nesdc.org.cn/, accessed on 5 July 2025). This dataset included detailed measurements of ecosystem net carbon exchange (NEE), ecosystem respiration (RE), total ecosystem carbon flux, latent and sensible heat fluxes, and other variables, recorded at time scales ranging from half-hourly to annual. Although spatial coverage was limited and continuous soil respiration observations were unavailable from 2000 to 2022, this dataset provides essential observational benchmarks for assessing carbon flux dynamics and serves as a valuable reference for model validation.
2.2.5. Soil Organic Carbon Density Data
Soil Organic Carbon Density (SOCD) data were obtained from the Basic soil property dataset of high-resolution China Soil Information Grids (2010–2018), provided by the National Tibetan Plateau/Third Pole Environment Data Center (http://data.tpdc.ac.cn, accessed on 10 November 2024). The dataset offers SOCD measurements for the 0–30 cm soil layer, with a spatial resolution of 1 km and an annual temporal resolution. For the purpose of this study, the data were processed to derive the mean SOCD values for the 0–20 cm soil depth.
2.2.6. Auxiliary Data
Auxiliary datasets included GF-1 high-resolution images, the CLCD dataset [35], and MCD12Q1 Land Cover Type data, mainly used to assist in the selection and validation of wetland classification samples. SRTM DEM (30 m) data from the Geospatial Data Cloud Platform (https://www.gscloud.cn, accessed on 6 October 2024) were used to obtain topographic elevation information. DEM processing steps included image mosaicking, clipping, and resampling. Socio-economic data, including population density and GDP, were extracted from the kilometer grid datasets of China’s population spatial distribution and a GDP spatial distribution published by the Chinese Academy of Sciences (http://www.resdc.cn/, accessed on 5 July 2025). These datasets were used to analyze the relationships between socio-economic factors and vegetation NEP.
Given the variations in data sources, all spatial datasets were reprojected to the WGS 1984, UTM 49N, and resampled to a spatial resolution of 250 m to ensure consistency.
2.3. Methodology
2.3.1. Vegetation Classification Using Support Vector Machine Method
Accurate vegetation distribution maps are essential for NPP estimation. In this study, the Support Vector Machine (SVM) method was effectively applied for wetland classification to represent vegetation distribution patterns. The Dongting Lake wetland was categorized into seven distinct land cover types: water, sedge, reed, cropland, woodland, built-up areas, and mudflat/barren land. Given the temporal variability of wetland types, field survey data were used as references, and ROIs were dynamically adjusted based on spatial features derived from GF-1 high-resolution images, the CLCD dataset, and MCD12Q1 land cover data, which can ensure that the classification reflects actual wetland conditions over time. The wetland vegetation maps achieved an overall classification accuracy of 84.34%, with Kappa coefficients exceeding 0.70 (Figure 2). Confusion matrices and class-specific accuracy metrics for three representative years (2000, 2011, and 2022) were also presented in Table A1.
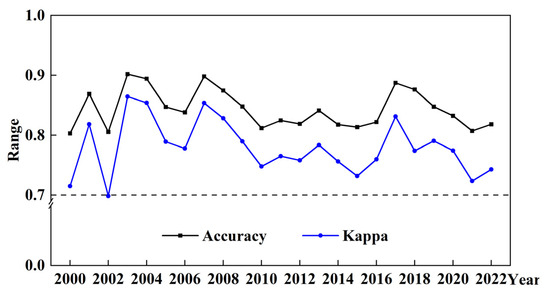
Figure 2.
Annual classification accuracy verification results of the SVM method from 2000 to 2022.
2.3.2. Improved CASA Model for NPP and NEP Estimation
The improved CASA model, developed by Zhu et al. [36], was utilized to estimate NPP. The main equation for NPP simulation is as follows:
where, NPP(x,t) represents the NPP of pixel x in month t (g C/m2/month), APAR(x,t) is the photosynthetically active radiation absorbed by vegetation at pixel x in month t (MJ/m2), and ε(x,t) is the actual light use utilization efficiency (g C/MJ).
The maximum light use efficiency (εmax) varies across vegetation types. We referred to εmax values reported by Zhu et al. [12], who provided estimates for various vegetation types across China, and adopted the values proposed by Zhang [37], whose research specifically focused on the dominant wetland vegetation types in the Dongting Lake region, including reed, sedge, and woodland. The εmax values for seven land cover types in the Dongting Lake wetland were: cropland (0.542), woodland (0.692), sedge (0.542), reed (0.429), built-up areas (0.542), water (0.542), and mudflat/barren land (0.542), which are considered regionally appropriate. NPP estimates from 2000 to 2022 were then computed using ENVI 5.6 software by integrating mean monthly Tem, total monthly Pre and Solar, and NDVI for each vegetation type.
NEP measures the ability of plant communities to sequester carbon and is calculated as:
where, a positive NEP indicates a carbon sink, while a negative value denotes a carbon source.
Soil heterotrophic respiration (Rh) refers to CO2 emissions due to microbial decomposition of organic matter [38]. It was estimated by a regression model based on soil respiration (Rs), incorporating key factors such as Pre, Tem, and SOCD. This method has been widely applied for soil respiration studies in China [39,40]. The Rh–Rs regression model is expressed as:
The monthly Rs is calculated as:
where, Rsmonth represents the monthly soil respiration rate (g C/m2), SOCD is soil organic carbon density in the 0–20 cm layer (kg/m2), Pre and Tem are the monthly total Pre (mm) and mean Tem (°C), respectively. The annual heterotrophic respiration (Rhannual) is obtained by summing the monthly Rh values:
2.3.3. Theil-Sen Median Trend Analysis and Modified Mann-Kendall Test
The characteristics and significance levels of vegetation NEP changes in the Dongting Lake wetland were assessed using the Theil-Sen median trend analysis combined with the Mann-Kendall (MK) trend test. Both methods are widely acknowledged for their high accuracy and reliability, particularly in meteorological and hydrological fields. Further methodological details can be found in Lyu et al. [19].
To ensure a meaningful interpretation of NEP trends, a threshold of ±0.0005 for the Theil-Sen slope (β) was adopted, following practices established in similar vegetation index analyses [41]. Prior to the MK analysis, the lag-1 autocorrelation coefficient (ACF) of the NEP time series was calculated and found to be −0.314, indicating the presence of negative autocorrelation. To avoid the risk of underestimating trend significance, we employed the Modified Mann–Kendall test proposed by Hamed and Rao [42], which adjusts the variance of the MK statistic to account for serial correlation. The statistical significance of the NEP trend was then evaluated at a significance level of α = 0.05. Z-statistic values with |Z| > 1.96 were considered significant, and those with |Z| ≤ 1.96 were considered non-significant. Based on the combined criteria of β and Z, vegetation NEP change patterns were categorized into five distinct types, as shown in Table 1.

Table 1.
Change patterns of vegetation NEP.
2.3.4. Partial Correlation Analysis and Attribution of Climatic and Anthropogenic Impacts on NEP Changes
Partial correlation (PCC) analysis was applied to quantify the relationship between NEP and individual climatic variables (e.g., Pre, Tem, and Solar), while controlling for the influence of other factors. The statistical significance of the correlations was evaluated using a T-test. To ensure reliability, multicollinearity among climatic variables was evaluated using the Variance Inflation Factor (VIF) before the PCC analysis. The VIF values for Pre, Tem, and Solar were 2.42, 1.11, and 2.56, all below the threshold of 5, indicating no significant multicollinearity. Thus, three climatic variables were all suitable for inclusion in the PCC analysis.
To further assess the relative contributions of climate change and human activities to wetland vegetation NEP dynamics, an attribution method based on the Differentiating Equation (ADE) was employed. It assumes that NEP variations are mainly influenced by climatic changes (Pre, Tem, and Solar) and human activities, and the equation can be described as:
where, SNEP is the interannual variation in NEP, n is the total number of years of research (in this article the value is 23); and i and NEPi represent the i-th year of the study and the NEP value in the i-th year, respectively. Ccon, Hcon, CTem, CPre, and CSolar represent the contributions of climatic changes, human activities (calculated as the residual between total NEP change SNEP and climate-driven change Ccon), temperature, precipitation, and solar radiation, respectively. ∂NEP/∂Tem is equal to the partial correlation coefficient between NEP and temperature when removing the influence of precipitation and solar radiation; dTem/dt is the interannual variation in temperature, and CTem is then calculated as the product of ∂NEP/∂Tem and dTem/dt. A similar method is also suitable for calculating CPre and CSolar. Although there are many driving factors in addition to climate change that affect NEP changes, human activities, including land use changes and socio-economic development (like GDP, population density, and reservoir operation), still account for the majority of these factors. For more detailed descriptions, please refer to the study of Lyu et al. [19] and Zhang et al. [26].
Traditionally, ADE analyses estimated these trends using least squares regression (SNEP). In this study, the ADE method was integrated with the Theil-Sen trend analysis (βNEP) to form the ADE + Sen quantitative attribution framework, which is more robust and provides more accurate trend estimates. To address the issue of positive and negative contributions offsetting each other, we introduced the metric of absolute mean contribution values. Seven scenarios were then established to evaluate the relative impacts of climatic and anthropogenic drivers under different NEP trend conditions (Table 2).
Table 2.
Assessment scenarios of the relative contributions of climate change and human activities to NEP dynamics.
3. Results
3.1. Applicability of Vegetation NPP/NEP Based on CASA Model
Grounded in the principles of the CASA model and incorporating insights from previous studies, this study derived annual vegetation distributions and determined εmax for various wetland vegetation types to estimate NPP of the Dongting Lake wetland. A comparison with the MOD17A3 NPP product showed that the estimated NPP values were slightly lower, with a multi-year mean relative error (MRE) of 22.92% (Figure 3). Although this deviation appeared relatively high, it fell within the acceptable range (10–30%) for wetland or complex ecosystems [43,44]. The discrepancies mainly resulted from the coarse resolution of MOD17A3 data and the sensitivity of the CASA model to certain parameters like εmax and FPAR, especially in variable hydrological conditions. Additionally, the model did not explicitly account for seasonal inundation, which can affect vegetation productivity. Nevertheless, the results were highly consistent with those from other CASA-based simulations (Table 3), supporting the reliability of the NPP estimates.
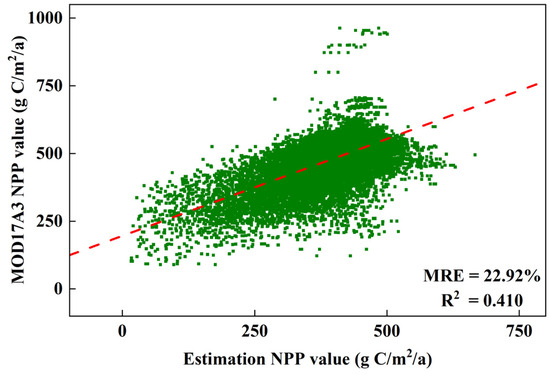
Figure 3.
Comparison between estimated NPP and MODIS NPP.
Table 3.
Comparison of NPP estimates from different CASA-based models and MODIS NPP.
To further evaluate the applicability of the CASA framework model combined with the soil respiration module for NEP simulation, we conducted both annual and monthly comparisons using field-measured flux data. Simulated annual NEP values for 2014, 2015, and 2016 were 98.89, 135.29, and 119.88 g C/m2/a, respectively, which generally followed the same interannual trend as the observed flux data from the Miscanthus sacchariflorus ecosystem at Dongting Lake National Station (163.21, 521.41, and 516.16 g C/m2/a). While the simulation values tended to be lower, it successfully reproduced the interannual variation trend. A monthly comparison (from June 2014 to December 2016) showed a moderately strong and statistically significant correlation (r = 0.68, p < 0.001), suggesting that the model can effectively capture intra-annual carbon flux dynamics. The differences in NEP estimates were attributable to spatial mismatches between regional-scale simulations and the localized flux tower footprint, heterogeneity in vegetation types and structure, the cumulative uncertainty from NPP estimation, and model simplifications such as the lack of explicit soil respiration partitioning or dynamic inundation effects. Despite these limitations, these findings could offer a reference for analyzing both annual and monthly NEP variations, facilitating detailed assessments of the spatiotemporal dynamics of carbon sources/sinks in the Dongting Lake wetland. They also provide a robust foundation for studying wetland carbon fluxes across multiple temporal scales.
3.2. Spatiotemporal Dynamics of NEP and Vegetation Carbon Sink Capacity
3.2.1. Spatial Distribution of NEP and Carbon Sink Patterns
The average NEP in the Dongting Lake wetland ranged from −342.70 to 529.08 g C/m2/a, with a spatial mean of 50.24 g C/m2/a (Figure 4a). A clear spatial heterogeneity was observed across the region. High carbon sink areas (NEP > 150 g C/m2/a) were mainly scattered in the western parts of EDTL and SDTL, and in the central and northern areas of WDTL, while lakeside zones generally exhibited lower NEP values. The proportions of the wetland area showing significant enhancement, slight enhancement, stability, slight degradation, and significant degradation of carbon sink capacity were 4.21%, 39.95%, 0.02%, 44.07%, and 11.76%, respectively, with corresponding mean change rates of 4.04, 1.82, 0, −2.09, and −6.04 g C/m2/a (Figure 4b). Most degradation occurred in central EDTL and southern WDTL.
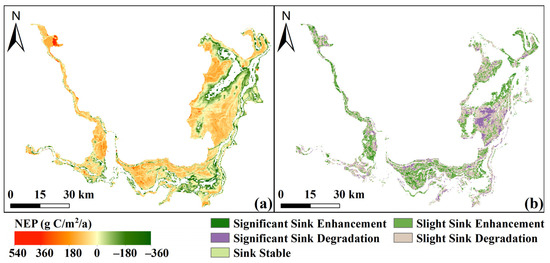
Figure 4.
Spatial distribution of annual average NEP (a) and change patterns (b).
Monthly average NEP ranged from −31.45 to 85.76 g C/m2/month, showing spatial patterns similar to the annual distribution (Figure 5). NEP variations followed seasonal changes in temperature and precipitation. From March to October, carbon sinks were dominant, except for some lakeside areas in central EDTL and eastern SDTL (Figure 5c–j). In winter (from November to February), lower water levels exposed lakeside vegetation, resulting in positive NEP values (Figure 5k,l). Subsequently, as temperature, precipitation, and solar radiation declined, vegetation entered the withering period, and NEP generally dropped below zero, making the largest proportion of carbon source areas (Figure 5a,b).
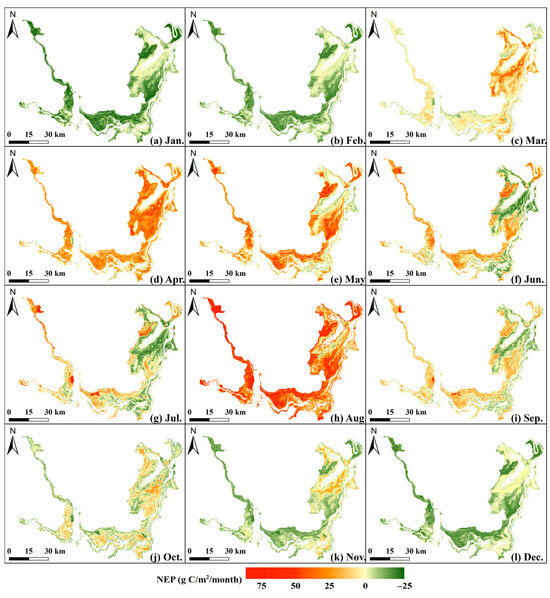
Figure 5.
Spatial distribution of the monthly average NEP.
3.2.2. Temporal Variations in NEP and Carbon Sink Capacity
From 2000 to 2022, the annual mean NEP exhibited a downward trend at −1.5 g C/m2/a (Figure 6a). Two distinct fluctuating stages were identified: an increase from 77.96 g C/m2 in 2000 to 134.88 g C/m2 in 2011 (+0.97 g C/m2/a), followed by a sharp decline to 28.86 g C/m2 by 2022 (−6.69 g C/m2/a). NEP turned negative in 2003, 2012, and 2020, indicating temporary carbon source conditions.
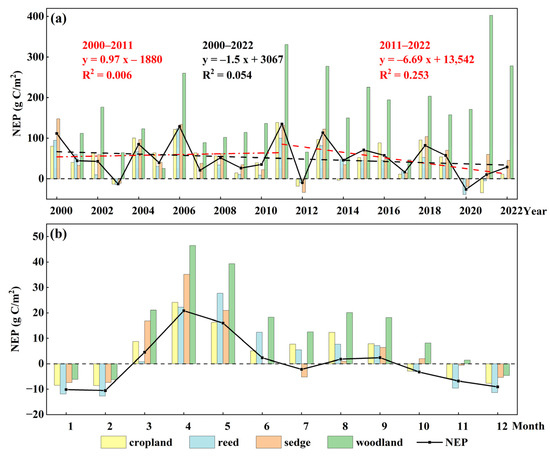
Figure 6.
Interannual (a) and monthly (b) variations in vegetation NEP.
Monthly NEP also showed a seasonal pattern, peaking at 20.40 g C/m2 in April and reaching its lowest value of −6.81 g C/m2 in January (Figure 6b). The average NEP in spring (from March to May) was 14.28 g C/m2/month, significantly higher than the 2.88 g C/m2/month observed in summer (from June to August). Spatial pattern analysis revealed that this variation was closely linked to reduced NPP caused by vegetation submergence due to rising water levels (Figure 5).
Furthermore, the negative annual NEP in 2003 and 2020 was mainly attributed to reduced summer carbon sinks, with the wetland even acting as a weak source. In contrast, the negative NEP in 2012 resulted from a widespread reduction in carbon sink capacity during both spring and summer, with a mean NEP of only 1.40 g C/m2/month.
3.3. Driving Force of Vegetation NEP Dynamics
3.3.1. Interrelationships Between Climatic Factors and Vegetation NEP
The partial correlations between NEP and climate factors exhibited clear spatial and temporal patterns. At the annual scale, NEP showed overall negative correlations with precipitation (Pre, mean PCC = −0.09) and temperature (Tem, mean PCC = −0.064) (Figure 7a,c). Specifically, negative correlations between NEP and Pre were widespread, covering 66.05% of the area. Tem exhibited strong spatial heterogeneity, with positive correlations mainly near lakesides and negative ones in permanent vegetation zones (58.78%; Figure 7c). In contrast, NEP and solar radiation (Solar) had a positive correlation (mean PCC = 0.11), covering 65.65% of the area and showing an opposite spatial pattern to Tem (Figure 7e).
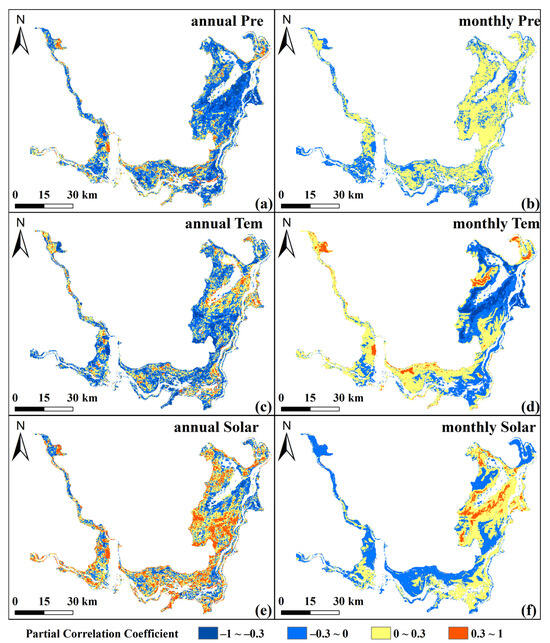
Figure 7.
Spatial distributions of annual and monthly PCCs between NEP and Pre (a,b), Tem (c,d), and Solar (e,f).
On the monthly scale, the correlations between NEP and Solar remained generally positive (mean PCC = 0.04), and Tem still showed a weak negative relationship (mean PCC = −0.003), with positive and negative correlations dominating 53.7% and 51.33% of the area, respectively (Figure 7f,d). While the correlations between NEP and Pre changed to generally positive (mean PCC = 0.015), and positive correlations covering 62.83% (Figure 7b). Notably, monthly correlations between NEP and Tem were negative in lakeside areas but positive in the permanent vegetation zone. Overall, NEP showed stronger correlations with Solar and Pre than with Tem, reflecting the influence of photosynthesis, moisture availability, and temperature sensitivity across vegetation types. Excess annual precipitation may cause waterlogging or light limitation, thereby inhibiting carbon sequestration and highlighting the scale-dependent impacts of climate on wetland carbon dynamics.
3.3.2. Interrelationships Between Land Use and Vegetation NEP
The main land use types in the Dongting Lake wetland, water, sedge, reed, cropland, and woodland, accounted for over 97.5% of the total area (Figure 8), each showing distinct carbon sequestration capacities. Woodland had the highest NEP (168.37 g C/m2/a), while reed exhibited the lowest (34.82 g C/m2/a). Sedge and cropland had comparable NEP values of 56.51 and 48.83 g C/m2/a, respectively (Figure 6a).
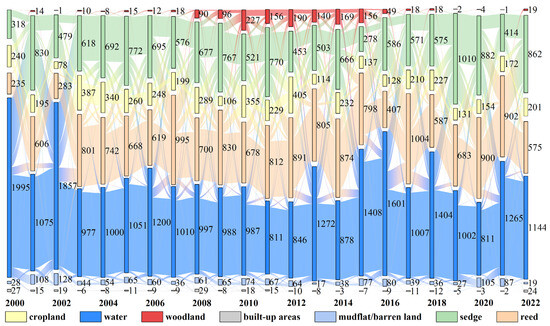
Figure 8.
Land use transition characteristics in the Dongting Lake wetland (m2).
Land use transitions were dominated by water-vegetation conversions, influenced by hydrological regulation and vegetation management (Figure 8). From 2000 to 2011, water areas decreased significantly, with a sharp decline of 47.39% in 2002–2003, followed by a fluctuating recovery with the resubmergence of vegetation. Woodland areas increased by 156.32 km2 (2000–2015) due to afforestation, then declined by 20.99 km2 annually with poplar removal, mainly converting to water, sedge, reed, and cropland. Frequent transitions also occurred between sedge and reed, with approximately 27.58% of sedge converting to reed and 20.49% of reed to sedge annually. Cropland areas remained relatively stable (220.56 km2), while mudflat/barren land and built-up areas showed minimal change and were excluded from NEP analysis due to a lack of vegetation.
Overlaying land use transitions with corresponding NEP spatial distributions revealed that conversions from reed to woodland, sedge, or cropland enhanced carbon sink capacity, especially reed-to-woodland, with an average NEP increase of 260.58 g C/m2/a (Table 4). In contrast, conversions from woodland, sedge, and cropland to reed reduced NEP. In the lakeside water-vegetation transition zones, only the conversion of water to woodland resulted in a positive NEP change (54.93 g C/m2/a), indicating that exposed woodland retains carbon sink capacity. Conversely, conversions to sedge, cropland, or reed reduced NEP by −39.28, −50.17, and −68.95 g C/m2/a, respectively, suggesting that these vegetation types tend to act as carbon sources when exposed.
Table 4.
Mean NEP change in different land use transition processes (g C/m2/a).
3.3.3. Interrelationships Between Socio-Economic Factors and Vegetation NEP
Population density and GDP are key indicators of regional socio-economic development and may also influence vegetation NEP. Population density in the study area increased steadily, reaching a peak of 381.71 persons/km2 in 2015, followed by a slight decline in 2020. Meanwhile, GDP showed continuous and rapid growth (Figure 9). Correlation analysis revealed a moderate negative association between population density and NEP (r = −0.52), as well as between GDP and NEP (r = −0.49), implying that socio-economic development may place stress on ecosystem carbon sink functions.
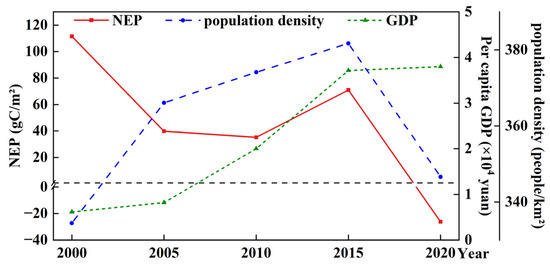
Figure 9.
Trends of NEP, population density, and GDP in the Dongting Lake wetland from 2000 to 2020.
While in terms of temporal dynamics, NEP generally declined from 2000 to 2010 despite the continued increase in population and GDP, indicating that economic expansion may have suppressed ecosystem carbon sink capacity. However, after 2010, NEP trends began to more closely reflect the dynamics of GDP and population density, indicating that enhanced ecological protection measures and shifts toward sustainable development might have fostered improved coordination between economic advancement and ecosystem health. Although data limitations reduced the statistical significance of these correlations, the results provided valuable preliminary insights that warrant further detailed investigation.
3.3.4. Interrelationships Between Water Level and Vegetation NEP
The water level dynamics of the Dongting Lake wetland are shaped by both the water storage of the Three Gorges Reservoir and natural environmental factors [47]. From 2000 to 2022, the mean annual water level was 25.08 m, ranging from 23.54 m in 2022 to 26.44 m in 2020, showing a fluctuating trend (Figure 10a). Annual NEP variation was negatively correlated with water level (r = −0.557; Figure 10b). On the monthly scale, water level peaked at 30.27 m in July and dropped to 21.30 m in January (Figure 10c). NEP was higher in spring than in summer, as mentioned in Section 3.2.2, likely due to vegetation submergence reducing photosynthetic activity under high summer water levels. A similar negative correlation (r = −0.467) was observed between NEP and water level during the growing season (Figure 10d).
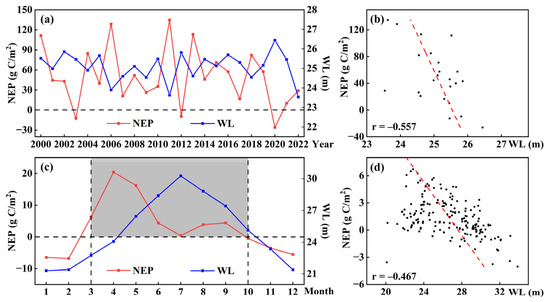
Figure 10.
Variations and correlations of interannual and monthly vegetation NEP and water level: (a) interannual variations; (b) interannual correlations; (c) monthly variations; (d) monthly correlations.
Water levels impact plant photosynthesis, soil respiration, and the organic carbon cycle in wetlands. While moderate water levels benefit NEP, excessively high summer levels would suppress wetland carbon sequestration. To support the wetland carbon sink function, maintaining water levels within 24.06~26.44 m during the growing season is recommended.
3.3.5. Quantifying Climate Change and Anthropogenic Contributions to NEP Variations
The contribution of climate change to vegetation NEP ranged from −48.11 to 71.33 g C/m2/a2, with a mean of 2.17 g C/m2/a2 and a coefficient of variation (CV) of 2.10, indicating an overall positive effect (Figure 11a). Positive contributions (67.85%) were mainly concentrated in permanently vegetated areas, while negative ones (32.15%) were scattered along the lakesides of EDTL. In contrast, human activities contributed −47.34~18.40 g C/m2/a2, with an average of −3.73 g C/m2/a2 and a CV of −1.8 (Figure 11b). Positive impacts were limited (30.26%) and spatially opposite to those of climate change, whereas negative impacts dominated (69.74%). It is noteworthy that the impact of climate change on vegetation NEP exhibited higher variability and uncertainty, while anthropogenic effects were more evenly distributed.
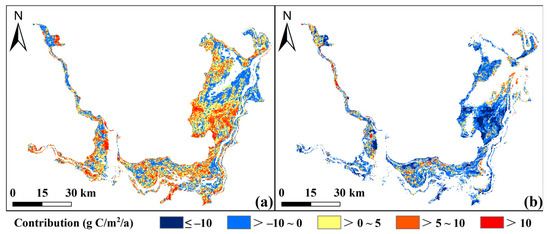
Figure 11.
Contributions of climate change (a) and human activities (b) to annual NEP dynamics.
To identify the dominant drivers of vegetation NEP dynamics, the relative impacts of climate change and anthropogenic activities were further assessed. Human activities played a leading role, influencing 68.77% of carbon sink dynamics, compared to 21.07% dominated by climate change, and 10.16% of the area was jointly affected by both (Figure 12). Climate change contributed mainly to carbon sink enhancement (24.98%), with minor degradation (6.20%) and stability (0.05%) (Figure 12a), while human activities were predominantly associated with carbon sink degradation (52.24%), followed by enhancement (26.64%) and stability (0.05%) (Figure 12b). Overall, human activities were the primary driver of vegetation carbon sink decline, whereas climate change tended to promote carbon sink enhancement.
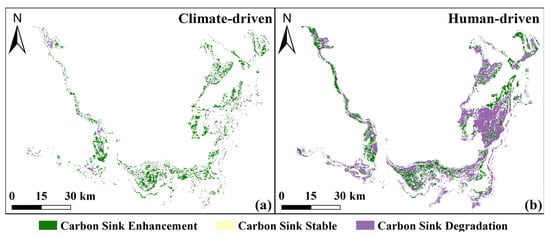
Figure 12.
Carbon sink enhancement or degradation dominated by climate change (a) and human activities (b) from 2000 to 2022.
4. Discussion
4.1. Comparison of NEP Trends and Variations in the Dongting Lake Wetland (2002–2022)
From 2002 to 2022, the overall NEP in China showed a steady annual increase, with an average rate of 0.02 g C/m2/a [48]. In contrast, the annual NEP of the Dongting Lake wetland declined consistently (Figure 6), indicating ongoing wetland ecosystem degradation. Wang et al. [49] reported that from 2001 to 2020, the vegetation ecosystem in the Dongting Lake Basin acted as a carbon sink, with weak sink areas (NEP < 300 g C/m2/a) mainly located in the lake region, consistent with our findings. They also found an overall increasing NEP trend across the basin. Similarly, Pang et al. [50] observed a growing NEP trend in the middle Yangtze River, while Wang et al. [51] noted a slight decline (−1.49%) in carbon sequestration in the Basin from 2000 to 2015. The NEP increase from 2001 to 2019 identified in our study was consistent with previous research, including the abrupt change in 2011–2012. These consistencies indirectly supported the applicability of the CASA–Rh–Rs model framework used in this study, despite the lack of localized Rh flux measurements. The use of regionally representative driving variables, such as monthly temperature, precipitation, and SOCD, would likely enhance the reliability of the NEP simulation in subtropical wetland conditions.
However, after extending the period to 2022, we found a decline in NEP during 2019–2020, followed by a slight rebound, whereas other studies reported an increase in 2020. This discrepancy may be attributed to two main factors. First, differences in spatial scale and land cover likely played a role. Our study focused specifically on the lake wetland, which is more vulnerable to hydrological fluctuations, sedimentation, and ecological degradation. In contrast, other studies covered the broader basin, where denser vegetation likely drove higher NEP values. Second, extreme drought events in recent years may have contributed to the NEP reduction. In particular, the Yangtze River Basin experienced unprecedented heat and low precipitation in 2022, marking the most severe summer drought, which severely affected wetland vegetation productivity [52]. These results highlighted the influence of spatial heterogeneity and climate extremes on wetland carbon dynamics.
Furthermore, Du et al. [53] also emphasized that different land uses exhibit distinct biodiversity, water cycles, and ecosystem functions, causing significant NEP variations among vegetation types. Wang et al. [49] identified forest as having the highest carbon absorption, followed by grasslands, with cultivated land lowest. Our Section 3.3.2 results were consistent with these findings. Differences in specific values likely arise from variations in study boundaries and model parameters.
In comparison to other major lake wetlands in China, Dongting Lake exhibited unique carbon sink characteristics. For example, Poyang Lake showed a sustained increase in NPP, largely driven by climate warming and relatively stable hydrological conditions [54]. While the NEP values in Taihu Lake declined notably due to intensified urbanization, land use change, and eutrophication [55]. Recent droughts, sedimentation changes, and anthropogenic activities such as water regulation and reclamation have exacerbated the Dongting Lake wetland ecosystem degradation, limiting its carbon sequestration capacity. Overall, these comparisons support the reliability of our results and deepen understanding of carbon sink dynamics in the unique ecological and hydrological conditions of large lake wetlands.
4.2. Climate, Land Use, and Hydrology as Drivers of NEP Change in Lake Wetlands
Assessing the impacts of multiple factors on wetland vegetation productivity is complex. In Section 3.3.1, we found that solar radiation exerted the most significant influence on NEP, while temperature had the least effect, consistent with Zhang et al. [26]. Although their study believed that NPP was positively correlated with temperature, precipitation, and Solar, Pang et al. [50] and our findings both indicated that higher temperature negatively affected NEP. Additionally, we observed a negative correlation between NEP and precipitation, which may be due to increased soil respiration and carbon emissions under warm and moist conditions, as also noted by Zhao et al. [56].
Numerous studies have demonstrated that human activities, particularly land use changes, can alter ecosystem structure and function in the short term, impacting regional carbon sink capacities [57,58]. Land conversion to woodland significantly enhanced carbon sinks, consistent with the conclusions of Zhang et al. [59]. We also found that converting cropland and reed to sedge increased NEP, driven by government policies promoting forest and grassland restoration. Conversely, inadequate management in reed and cropland areas reduced sequestration capacity and, in some cases, shifted from carbon sinks into sources (Figure 6a). Wang et al. [60] also reached similar conclusions. Nonetheless, such land use interventions may involve ecological trade-offs, for instance, the potential for reduced biodiversity or altered hydrological processes if not properly managed. Thus, conservation efforts should prioritize vegetation types with high carbon sink potential, appropriately increase vegetation coverage, and implement effective post-restoration management to prevent degradation.
Hydrological processes play a vital role in the wetland carbon cycle. As shown in Section 3.3.3, prolonged high water levels can submerge vegetation and reduce productivity. Li et al. [61] also emphasized that water table depth (WTD) exerted greater control than climate or ecosystem variables, with increased WTD linked to stronger carbon sinks. Conversely, Yu et al. [62] highlighted that in arid and semi-arid regions, increased precipitation indirectly promoted vegetation growth. As noted in Section 3.2.2, NEP turned negative in 2003, 2012, and 2020, indicating the wetland shifted to a carbon source. Further analysis showed that increased precipitation, rising water levels, and reduced solar radiation in 2012 and 2020 contributed to this switch (Figure 10a and Figure 13a). In 2003, despite relatively stable natural conditions, the impoundment of the Three Gorges Reservoir caused significant reductions in lake surface area, altered groundwater dynamics, and increased soil respiration from a large amount of vegetation. Collectively, these findings underscore the urgent need to maintain wetland hydrological balance amid global environmental change.
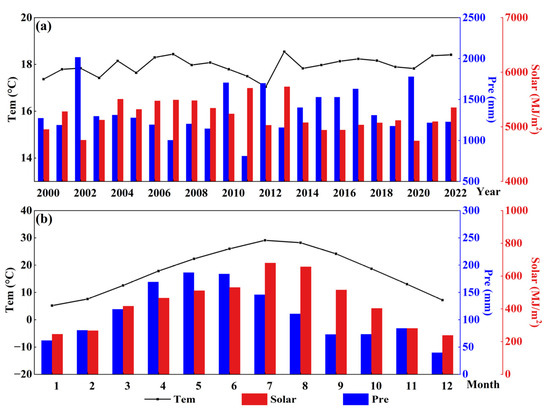
Figure 13.
Variation of annual (a) and monthly (b) Tem, Pre, and Solar.
4.3. Insights into the Balance of Climatic and Human Influences on Sustainable Wetland Carbon Sequestration
As shown in Section 3.3.4, climate change contributed positively to NEP, while human activities had a negative impact from 2000 to 2022. Degradation driven by human activities was identified as the main driver, consistent with Zhang et al. [26] and Pang et al. [50]. However, wetland NEP trends and their key drivers varied over time, warranting a more detailed analysis.
From 2000 to 2011, human activities, such as lake reclamation and reservoir impoundment, were the primary cause of NEP degradation (−9.95 g C/m2/a), while climate change played a dominant positive role (11.25 g C/m2/a). During this period, carbon sink areas expanded to 69.7% (Figure 14a). Degraded zones were mainly located in the transition areas between sedge and reed, particularly in northern WDTL, western SDTL, and central EDTL. Vegetation carbon sink areas were primarily driven by climate (67.01%), followed by human activities (22.69%), and their combined effects (10.29%) (Figure 15a,b). Climate change contributed mainly to carbon sink enhancement (65.50%), with minor degradation (11.80%) and stability (0.01%), while human activities were predominantly associated with carbon sink degradation (23.50%), followed by enhancement (9.48%) and stability (0.01%) (Figure 15a,b).
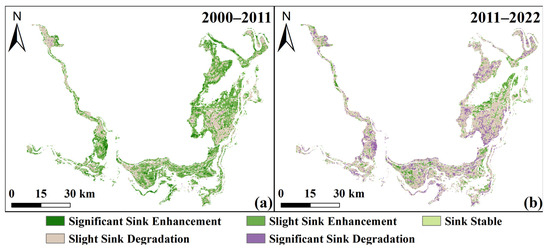
Figure 14.
Spatial distribution of NEP change patterns in 2000–2011 (a) and 2011–2022 (b).
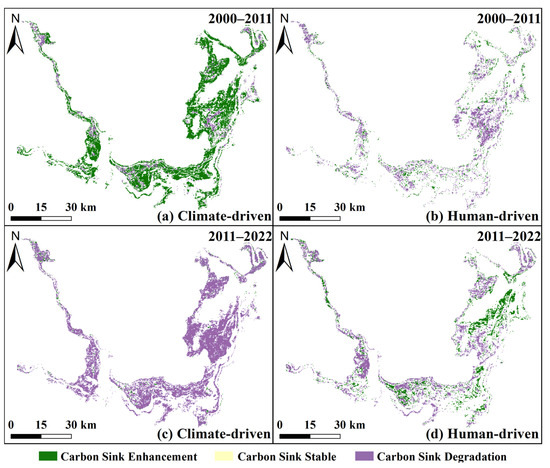
Figure 15.
Carbon sink enhancement or degradation dominated by climate change (a,c) and human activities (b,d) in 2000–2011 and 2011–2022.
In contrast, from 2011 to 2022, human activities shifted toward a restorative role, contributing positively to NEP (6.63 g C/m2/a), largely due to ecological policies such as the Return Farmland to Lake initiative launched in 2014 and continued wetland restoration efforts. However, this improvement was outweighed by intensified climate extremes, including droughts and reduced precipitation, resulting in a negative climatic contribution (−11.77 g C/m2/a). Consequently, carbon sink areas declined sharply to 19.61%, with degradation seen in most areas except for localized enhancements along the lakesides of EDTL and SDTL (Figure 14b). Carbon sink areas were now dominated by climate (51.46%), human activities (26.47%), and both combined (22.07%) (Figure 15c,d). Notably, climate-driven areas saw degradation dominate (71.40%), whereas human-driven regions showed increasing carbon sink enhancement. The temporal dynamics of NEP relative to population density and GDP also reflected this relationship in Section 3.3.3.
These results also suggest a shifting dynamic: climate change has increasingly constrained carbon sequestration, while human activities have begun to play a more positive role in wetland protection, highlighting the importance of considering temporal policy contexts when interpreting attribution results. Similar findings have been reported by Li et al. [52]. This emphasizes the need to rethink human roles beyond ecological stressors, recognizing their potential as regulatory agents in ecosystem management. Meanwhile, further research is needed to address the lasting impacts of climate change on wetland carbon sink stability.
4.4. Limitations and Future Research Directions
In this study, we used MODIS products for data investigation, which have been widely applied in previous research. However, advances in multi-source data fusion techniques and land classification algorithms offer potential to improve the datasets [26,33]. Although the spatial resolution of MODIS data limited its widespread use, our findings highlighted the importance of considering water area and water level dynamics when estimating lake wetland carbon sinks. This provides new insights for more accurate estimation of wetland NEP. Additionally, NEP estimates relied on a national-scale empirical model for Rh due to the lack of in situ flux data. Incorporating field measurements such as eddy covariance-derived CO2 and Rh fluxes would improve parameterization and enhance model applicability in subtropical wetland conditions. Future research should focus on the integration of higher-resolution satellite imagery, multi-source data fusion, eddy covariance measurements, and NEP modelling in different future climate scenarios to deepen the understanding of wetland carbon dynamics and support conservation efforts.
5. Conclusions
This study integrated long-term remote sensing data with the CASA model, Theil-Sen median trend, Modified Mann-Kendall test, and Attribution methods based on Differential Equations and Sen to assess the spatiotemporal dynamics and driving mechanisms of vegetation NEP in the Dongting Lake wetland from 2000 to 2022 during fluctuating water conditions. Main findings are as follows:
- (1)
- The estimated NPP was slightly lower than the MOD17A3 product, with a multi-year mean relative error of 22.92%, which fell within the acceptable range (10–30%) for wetland carbon modeling, demonstrating good consistency with previous studies and supporting the reliability of the NEP estimates.
- (2)
- Annual NEP ranged from −342.70 to 529.08 g C/m2/a, showing an initial rise followed by a decline, with an overall decreasing trend of −1.5 g C/m2/a. Monthly NEP varied from −31.45 to 85.76 g C/m2/month, spring exhibited stronger carbon sink effects than summer, while winter acted as a carbon source.
- (3)
- Climate change contributions to NEP ranged from −48.11 to 71.33 g C/m2/a, averaging 2.17 g C/m2/a. Positive effects were concentrated in permanently vegetated areas, with solar radiation showing the strongest positive correlation. Precipitation had a negative annual correlation with NEP but weakly positive monthly correlations.
- (4)
- Human activities contributed between −47.34 and 18.40 g C/m2/a, averaging −3.73 g C/m2/a, with positive and negative impacts inversely distributed compared to climate change. Human activities dominated carbon sink degradation (74.30%), while climate change drove enhancement (25.70%).
- (5)
- Climate change has increasingly constrained wetland carbon sequestration, with its contribution to NEP shifting from +11.25 g C/m2/a (2000–2011) to −11.77 g C/m2/a (2011–2022). To enhance carbon sink resilience, further research and adaptive strategies are needed to mitigate the long-term climatic impacts on wetland ecosystems.
- (6)
- Positive human interventions, such as forest expansion and the conversion of cropland and reed to sedge, significantly enhanced carbon sequestration and should be promoted. Additionally, maintaining water levels within the optimal range of 24.06–26.44 m during the growing season is recommended to sustain wetland carbon sink capacity.
Author Contributions
Conceptualization, M.G. and N.Z.; methodology, M.G. and X.Z.; validation, Y.C., S.L. and K.L.; formal analysis, X.Z.; investigation, S.L., K.L. and W.Z.; resources, K.L.; data curation, Y.C. and X.Z.; writing—original draft preparation, M.G.; writing—review and editing, X.W. and N.Z.; visualization, M.G.; supervision, Y.C.; project administration, Y.C.; funding acquisition, N.Z. and W.Z. All authors have read and agreed to the published version of the manuscript.
Funding
This research was funded by the National Natural Science Foundation of China (Grant Nos. 42272291 and 42077176), and the Strategic Research Program of the National Natural Science Foundation of China (Grant No. 42242202).
Data Availability Statement
The original contributions presented in the study are included in the article; further inquiries can be directed to the corresponding author.
Acknowledgments
We would like to express our gratitude to the National Tibetan Plateau/Third Pole Environment Data Center for providing the Soil Organic Carbon Density (SOCD) dataset. Additionally, we thank Guo et al. [33] for sharing the Wetland Classification Data, which can be accessed at https://github.com/Andy-cumt/Dongting-Lake-Data-2001-2020 (accessed on 20 September 2024). The authors have reviewed and edited the output and take full responsibility for the content of this publication.
Conflicts of Interest
The authors declare no conflicts of interest.
Appendix A
Table A1.
Confusion matrices and accuracy metrics for wetland classification using the SVM Method in 2000, 2011, and 2022.
Table A1.
Confusion matrices and accuracy metrics for wetland classification using the SVM Method in 2000, 2011, and 2022.
| Year | Classified/Reference | Build-Up | Cropland | Mudflat | Reed | Sedge | Water | Woodland | User’s Accuracy (%) |
|---|---|---|---|---|---|---|---|---|---|
| 2000 | build-up | 297 | 101 | 0 | 39 | 0 | 0 | 23 | 64.56 |
| cropland | 212 | 1916 | 43 | 99 | 347 | 28 | 108 | 69.59 | |
| mudflat | 0 | 1 | 65 | 0 | 63 | 59 | 0 | 34.57 | |
| reed | 59 | 54 | 0 | 4078 | 93 | 5 | 224 | 90.36 | |
| sedge | 3 | 340 | 18 | 584 | 2029 | 9 | 22 | 67.52 | |
| water | 7 | 232 | 303 | 214 | 756 | 9810 | 34 | 86.38 | |
| woodland | 0 | 0 | 0 | 0 | 0 | 0 | 0 | 0 | |
| Producer’s Accuracy (%) | 51.38 | 72.46 | 15.15 | 81.33 | 61.70 | 98.98 | 0 | ||
| Overall Accuracy | 81.68 | Kappa Coefficient | 0.735 | ||||||
| 2011 | build-up | 63 | 7 | 0 | 0 | 0 | 5 | 84.00 | |
| cropland | 97 | 1445 | 47 | 55 | 140 | 62 | 128 | 73.20 | |
| mudflat | 0 | 12 | 249 | 0 | 40 | 189 | 0 | 50.81 | |
| reed | 9 | 89 | 1 | 4651 | 544 | 33 | 60 | 86.33 | |
| sedge | 100 | 294 | 151 | 441 | 3827 | 357 | 67 | 73.07 | |
| water | 21 | 130 | 79 | 0 | 81 | 7316 | 12 | 95.77 | |
| woodland | 5 | 177 | 38 | 65 | 21 | 10 | 513 | 61.88 | |
| Producer’s Accuracy (%) | 21.35 | 67.08 | 44.07 | 89.23 | 82.24 | 91.77 | 65.76 | ||
| Overall Accuracy | 83.50 | Kappa Coefficient | 0.779 | ||||||
| 2022 | build-up | 260 | 51 | 58 | 76 | 16 | 0 | 10 | 55.20 |
| cropland | 44 | 1780 | 49 | 37 | 381 | 205 | 62 | 69.58 | |
| mudflat | 49 | 19 | 52 | 0 | 0 | 2 | 0 | 42.62 | |
| reed | 7 | 33 | 35 | 4449 | 753 | 18 | 149 | 81.72 | |
| sedge | 213 | 276 | 87 | 1405 | 5244 | 5 | 124 | 71.30 | |
| water | 3 | 606 | 162 | 12 | 149 | 11,418 | 42 | 1.20 | |
| woodland | 2 | 12 | 0 | 15 | 5 | 0 | 94 | 73.43 | |
| Producer’s Accuracy (%) | 44.98 | 64.09 | 11.73 | 74.22 | 80.08 | 98.02 | 19.54 | ||
| Overall Accuracy | 81.83 | Kappa Coefficient | 0.745 | ||||||
References
- IPCC. Synthesis Report of the IPCC Sixth Assessment Report (AR6), Longer Report; Lee, H., Calvin, K., Dasgupta, D., Krinmer, G., Mukherji, A., Thorne, P., Trisos, C., Romero, J., Aldunce, P., Barret, K., Eds.; IPCC: Geneva, Switzerland, 2023. [Google Scholar]
- Xiao, D.; Deng, L.; Kim, D.G.; Huang, C.; Tian, K. Carbon budgets of wetland ecosystems in China. Glob. Change Biol. 2019, 25, 2061–2076. [Google Scholar] [CrossRef]
- Davidson, N.C.; Finlayson, C.M. Extent, regional distribution and changes in area of different classes of wetland. Mar. Freshw. Res. 2018, 69, 1525–1533. [Google Scholar] [CrossRef]
- Ye, X.; Meng, Y.; Xu, L.; Xu, C. Net primary productivity dynamics and associated hydrological driving factors in the floodplain wetland of China’s largest freshwater lake. Sci. Total Environ. 2019, 659, 302–313. [Google Scholar] [CrossRef] [PubMed]
- Rosentreter, J.A.; Borges, A.V.; Deemer, B.R.; Holgerson, M.A.; Liu, S.; Song, C.; Melack, J.; Raymond, P.A.; Duarte, C.M.; Allen, G.H. Half of global methane emissions come from highly variable aquatic ecosystem sources. Nat. Geosci. 2021, 14, 225–230. [Google Scholar] [CrossRef]
- Mitsch, W.J.; Bernal, B.; Nahlik, A.M.; Mander, Ü.; Zhang, L.; Anderson, C.J.; Jørgensen, S.E.; Brix, H. Wetlands, carbon, and climate change. Landsc. Ecol. 2013, 28, 583–597. [Google Scholar] [CrossRef]
- Yang, L.; Wang, L.; Yu, D.; Yao, R.; He, Q.; Wang, S.; Wang, L. Four decades of wetland changes in Dongting Lake using Landsat observations during 1978–2018. J. Hydrol. 2020, 587, 124954. [Google Scholar] [CrossRef]
- Nag, S.K.; Ghosh, B.D.; Das, B.K.; Sarkar, U.K. Wetlands function as carbon sink: Evaluation of few floodplains of middle Assam, northeast India in the perspective of climate change. J. Environ. Manag. 2025, 373, 123841. [Google Scholar] [CrossRef]
- Jin, Y.; Li, J.; Liu, C.; Liu, Y.; Zhang, Y.; Song, Q.; Sha, L.; Chen, A.; Yang, D.; Li, P. Response of net primary productivity to precipitation exclusion in a savanna ecosystem. For. Ecol. Manag. 2018, 429, 69–76. [Google Scholar] [CrossRef]
- Cloern, J.E.; Safran, S.M.; Vaughn, L.S.; Robinson, A.; Whipple, A.A.; Boyer, K.E.; Drexler, J.Z.; Naiman, R.J.; Pinckney, J.L.; Howe, E.R. On the human appropriation of wetland primary production. Sci. Total Environ. 2021, 785, 147097. [Google Scholar] [CrossRef]
- Waldo, S.; Chi, J.; Pressley, S.N.; O’Keeffe, P.; Pan, W.L.; Brooks, E.S.; Huggins, D.R.; Stöckle, C.O.; Lamb, B.K. Assessing carbon dynamics at high and low rainfall agricultural sites in the inland Pacific Northwest US using the eddy covariance method. Agric. For. Meteorol. 2016, 218, 25–36. [Google Scholar] [CrossRef]
- Zhu, W.; Pan, Y.; He, H.; Yu, D.; Hu, H. Simulation of maximum light use efficiency for some typical vegetation types in China. Chin. Sci. Bull. 2006, 51, 457–463. [Google Scholar] [CrossRef]
- Crabtree, R.; Potter, C.; Mullen, R.; Sheldon, J.; Huang, S.; Harmsen, J.; Rodman, A.; Jean, C. A modeling and spatio-temporal analysis framework for monitoring environmental change using NPP as an ecosystem indicator. Remote Sens. Environ. 2009, 113, 1486–1496. [Google Scholar] [CrossRef]
- Field, C.B.; Randerson, J.T.; Malmström, C.M. Global net primary production: Combining ecology and remote sensing. Remote Sens. Environ. 1995, 51, 74–88. [Google Scholar] [CrossRef]
- Chen, S.; Jiang, H.; Chen, Y.; Cai, Z. Spatial-temporal patterns of net primary production in Anji (China) between 1984 and 2014. Ecol. Indic. 2020, 110, 105954. [Google Scholar] [CrossRef]
- Seixas, J.; Carvalhais, N.; Nunes, C.; Benali, A. Comparative analysis of MODIS-FAPAR and MERIS–MGVI datasets: Potential impacts on ecosystem modeling. Remote Sens. Environ. 2009, 113, 2547–2559. [Google Scholar] [CrossRef]
- Chuai, X.; Qi, X.; Zhang, X.; Li, J.; Yuan, Y.; Guo, X.; Huang, X.; Park, S.; Zhao, R.; Xie, X. Land degradation monitoring using terrestrial ecosystem carbon sinks/sources and their response to climate change in China. Land Degrad. Dev. 2018, 29, 3489–3502. [Google Scholar] [CrossRef]
- Yu, G.; Zheng, Z.; Wang, Q.; Fu, Y.; Zhuang, J.; Sun, X.; Wang, Y. Spatiotemporal pattern of soil respiration of terrestrial ecosystems in China: The development of a geostatistical model and its simulation. Environ. Sci. Technol. 2010, 44, 6074–6080. [Google Scholar] [CrossRef]
- Lyu, J.; Fu, X.; Lu, C.; Zhang, Y.; Luo, P.; Guo, P.; Huo, A.; Zhou, M. Quantitative assessment of spatiotemporal dynamics in vegetation NPP, NEP and carbon sink capacity in the Weihe River Basin from 2001 to 2020. J. Clean. Prod. 2023, 428, 139384. [Google Scholar] [CrossRef]
- Zhang, C.; Zhen, H.; Zhang, S.; Tang, C. Dynamic changes in net primary productivity of marsh wetland vegetation in China from 2005 to 2015. Ecol. Indic. 2023, 155, 110970. [Google Scholar] [CrossRef]
- Yang, H.; Zhong, X.; Deng, S.; Xu, H. Assessment of the impact of LUCC on NPP and its influencing factors in the Yangtze River basin, China. CATENA 2021, 206, 105542. [Google Scholar] [CrossRef]
- Zheng, B.; Wu, S.; Liu, Z.; Wu, H.; Li, Z.; Ye, R.; Zhu, J.; Wan, W. Downscaling estimation of NEP in the ecologically-oriented county based on multi-source remote sensing data. Ecol. Indic. 2024, 160, 111818. [Google Scholar] [CrossRef]
- Qiao, W.; Hu, B.; Kattel, G.R.; Liu, J. Impact of urbanization on net carbon sink efficiency in economically developed area: A case study of the Yangtze River Delta urban agglomeration, China. Ecol. Indic. 2023, 157, 111211. [Google Scholar] [CrossRef]
- Maziarz, J.; Vourlitis, G.L.; Kristan, W. Carbon and nitrogen storage of constructed and natural freshwater wetlands in southern California. Ecol. Eng. 2019, 142, 100008. [Google Scholar] [CrossRef]
- Nath, A.J.; Sileshi, G.W.; Bania, J.K.; Nath, A. Threats to inland wetlands and uncertainty around global soil carbon stocks and sequestration rates. Sci. Total Environ. 2024, 955, 177190. [Google Scholar] [CrossRef]
- Zhang, M.; Yuan, N.; Lin, H.; Liu, Y.; Zhang, H. Quantitative estimation of the factors impacting spatiotemporal variation in NPP in the Dongting Lake wetlands using Landsat time series data for the last two decades. Ecol. Indic. 2022, 135, 108544. [Google Scholar] [CrossRef]
- Tian, F.; Liu, L.; Yang, J.; Wu, J. Vegetation greening in more than 94% of the Yellow River Basin (YRB) region in China during the 21st century caused jointly by warming and anthropogenic activities. Ecol. Indic. 2021, 125, 107479. [Google Scholar] [CrossRef]
- Li, Q.; Zheng, B.; Tu, B.; Yang, Y.; Wang, Z.; Jiang, W.; Yao, K.; Yang, J. Refining urban built-up area via multi-source data fusion for the analysis of dongting lake eco-economic zone spatiotemporal expansion. Remote Sens. 2020, 12, 1797. [Google Scholar] [CrossRef]
- An, X.; Jin, W.; Long, X.; Chen, S.; Qi, S.; Zhang, M. Spatial and temporal evolution of carbon stocks in Dongting Lake wetlands based on remote sensing data. Geocarto Int. 2022, 37, 14983–15009. [Google Scholar] [CrossRef]
- Long, X.; Li, X.; Lin, H.; Zhang, M. Mapping the vegetation distribution and dynamics of a wetland using adaptive-stacking and Google Earth Engine based on multi-source remote sensing data. Int. J. Appl. Earth Obs. Geoinf. 2021, 102, 102453. [Google Scholar] [CrossRef]
- Lai, X.; Jiang, J.; Huang, Q. Effects of the normal operation of the Three Gorges Reservoir on wetland inundation in Dongting Lake, China: A modelling study. Hydrol. Sci. J. 2013, 58, 1467–1477. [Google Scholar] [CrossRef]
- Guo, M.; Zhou, N.; Cai, Y.; Zhao, W.; Lu, S.; Liu, K. Monitoring the Landscape Pattern Dynamics and Driving Forces in Dongting Lake Wetland in China Based on Landsat Images. Water 2024, 16, 1273. [Google Scholar] [CrossRef]
- Guo, D.; Shi, W.; Qian, F.; Wang, S.; Cai, C. Monitoring the spatiotemporal change of Dongting Lake wetland by integrating Landsat and MODIS images, from 2001 to 2020. Ecol. Inform. 2022, 72, 101848. [Google Scholar] [CrossRef]
- Hutchinson, M.F.; Xu, T. ANUSPLIN Version 4.4 User Guide; Centre for Resource and Environmental Studies, The Australian National University: Canberra, Australia, 2013; p. 54. [Google Scholar]
- Yang, J.; Huang, X. The 30 m annual land cover datasets and its dynamics in China from 1985 to 2023. Earth Syst. Sci. Data 2024, 13, 3907–3925. [Google Scholar] [CrossRef]
- Zhu, W.; Pan, Y.; Zhang, J. Estimation of net primary productivity of Chinese terrestrial vegetation based on remote sensing. Chin. J. Plant Ecol. 2007, 31, 413–424. (In Chinese) [Google Scholar]
- Zhang, M. Modeling net primary productivity of wetland with a satellite-based light use efficiency model. Geocarto Int. 2022, 37, 4028–4052. [Google Scholar] [CrossRef]
- Schimel, D.S.; House, J.I.; Hibbard, K.A.; Bousquet, P.; Ciais, P.; Peylin, P.; Braswell, B.H.; Apps, M.J.; Baker, D.; Bondeau, A. Recent patterns and mechanisms of carbon exchange by terrestrial ecosystems. Nature 2001, 414, 169–172. [Google Scholar] [CrossRef]
- Shi, Z. Spatial-Temporal Simulation of Vegetation Carbon Sink and Its Influential Factors Based on CASA and GSMSR Model in Shaanxi Province. Master’s Thesis, Northwest A&F University, Xianyang, China, 2015. (In Chinese). [Google Scholar]
- Du, H.; Yang, S.; Li, Z.; Guo, Z.; Fan, Q. Spatio-temporal Characteristics and Influencing Factors of Carbon Sources/Sinks in the Yangtze River Delta Under Carbon Neutrality Target. Environ. Sci. 2024, 45, 6848–6857. (In Chinese) [Google Scholar] [CrossRef]
- Wang, K.; Xu, M.; Wang, S.; Wang, L.; Tian, H.; Boonprong, S.; Gao, X.; Yang, X.; Guo, H.; Li, J.; et al. Spatiotemporal patterns and driving factors of NDVI changes in the central and Western Asia economic corridor over the past decade. Front. Environ. Sci. 2025, 13, 1546190. [Google Scholar] [CrossRef]
- Hamed, K.H.; Rao, R.A. A modified Mann-Kendall trend test for autocorrelated data. J. Hydrol. 1998, 204, 182–196. [Google Scholar] [CrossRef]
- Lv, G.; Li, X.; Fang, L.; Peng, Y.; Zhang, C.; Yao, J.; Ren, S.; Chen, J.; Men, J.; Zhang, Q.; et al. Disentangling the Influential Factors Driving NPP Decrease in Shandong Province: An Analysis from Time Series Evaluation Using MODIS and CASA Model. Remote Sens. 2024, 16, 1966. [Google Scholar] [CrossRef]
- Wu, C.; Chen, K.; Chongyi, E.; You, X.; He, D.; Hu, L.; Liu, B.; Wang, R.; Shi, Y.; Li, C.; et al. Improved CASA model based on satellite remote sensing data: Simulating net primary productivity of Qinghai Lake basin alpine grassland. Geosci. Model Dev. 2022, 15, 6919–6933. [Google Scholar] [CrossRef]
- Qi, S.; Chen, S.; Long, X.; An, X.; Zhang, M. Quantitative contribution of climate change and anthropological activities to vegetation carbon storage in the Dongting Lake basin in the last two decades. Adv. Space Res. 2023, 71, 845–868. [Google Scholar] [CrossRef]
- Tian, X.; Huang, Y.; Hu, W.; Li, G.; Li, C.; Yang, R.; Fu, C.; Lei, W. Evaluation of the impact of ecological poplar retreat on the net primary productivity of Lake Wetland. Ecol. Eng. 2025, 212, 107528. [Google Scholar] [CrossRef]
- Xie, Y.; Tang, Y.; Chen, X.; Li, F.; Deng, Z. The impact of Three Gorges Dam on the downstream eco-hydrological environment and vegetation distribution of East Dongting Lake. Ecohydrology 2015, 8, 738–746. [Google Scholar] [CrossRef]
- Lin, X.; Huang, N.; Wang, L.; Liu, J.; Chang, J.; Shi, Y. A dataset of 8-day carbon flux components observations for global terrestrial ecosystems during 1991–2023. Sci. Data Bank 2025, 10, 1–9. [Google Scholar] [CrossRef]
- Wang, S.; Feng, H.; Zou, B.; Yang, Z.; Wang, S. Vegetation Greening Enhanced the Regional Terrestrial Carbon Uptake in the Dongting Lake Basin of China. Forests 2023, 14, 768. [Google Scholar] [CrossRef]
- Pang, B.; Liu, Y.; An, R.; Xie, Y.; Tong, Z.; Liu, Y. Spatial and temporal divergence and driving mechanisms of carbon sinks in terrestrial ecosystems in the middle reaches of the Yangtze River urban agglomerations during 2008–2020. Ecol. Indic. 2024, 165, 112205. [Google Scholar] [CrossRef]
- Wang, L.; Li, Z.; Wang, D.; Chen, J.; Liu, Y.; Nie, X.; Zhang, Y.; Ning, K.; Hu, X. Unbalanced social-ecological development within the Dongting Lake basin: Inspiration from evaluation of ecological restoration projects. J. Clean. Prod. 2021, 315, 128161. [Google Scholar] [CrossRef]
- Li, L.; Zhou, T.; Zhang, W.; Gui, K. Quantifying the extremity of 2022 Chinese Yangtze River Valley daily hot extreme: Fixed or moving baseline matters. Environ. Res. Lett. 2024, 19, 064074. [Google Scholar] [CrossRef]
- Du, X.; Jian, J.; Du, C.; Stewart, R.D. Conservation management decreases surface runoff and soil erosion. Int. Soil Water Conserv. Res. 2022, 10, 188–196. [Google Scholar] [CrossRef]
- Yang, Y.; Wu, C.; An, T.; Yue, T. Characteristics of Climate Change in Poyang Lake Basin and Its Impact on Net Primary Productivity. Sustainability 2024, 16, 9420. [Google Scholar] [CrossRef]
- Xu, X.; Yang, G.; Tan, Y.; Tang, X.; Jiang, H.; Sun, X.; Zhuang, Q.; Li, H. Impacts of land use changes on net ecosystem production in the Taihu Lake Basin of China from 1985 to 2010. J. Geophys. Res. Biogeosci. 2017, 122, 690–707. [Google Scholar] [CrossRef]
- Zhao, Q.; Zhang, T.; Yang, S.; He, Y.; Zhai, T. Moisture-dependent response of soil carbon mineralization to temperature increases in a karst wetland on the Yunnan-Guizhou Plateau. Environ. Sci. Pollut. Res. 2023, 30, 47769–47779. [Google Scholar] [CrossRef] [PubMed]
- Gomes, E.; Inácio, M.; Bogdzevič, K.; Kalinauskas, M.; Karnauskaitė, D.; Pereira, P. Future land-use changes and its impacts on terrestrial ecosystem services: A review. Sci. Total Environ. 2021, 781, 146716. [Google Scholar] [CrossRef]
- Li, C.; Fu, B.; Wang, S.; Stringer, L.C.; Wang, Y.; Li, Z.; Liu, Y.; Zhou, W. Drivers and impacts of changes in China’s drylands. Nat. Rev. Earth Environ. 2021, 2, 858–873. [Google Scholar] [CrossRef]
- Zhang, J.; Liu, M.; Zhang, M.; Yang, J.; Cao, R.; Malhi, S.S. Changes of vegetation carbon sequestration in the tableland of Loess Plateau and its influencing factors. Environ. Sci. Pollut. Res. 2019, 26, 22160–22172. [Google Scholar] [CrossRef]
- Wang, M.; Hu, Z.; Wang, X.; Li, X.; Wang, Y.; Liu, H.; Han, C.; Cai, J.; Zhao, W. Spatio-temporal variation of carbon sources and sinks in the loess plateau under different climatic conditions and land use types. Forests 2023, 14, 1640. [Google Scholar] [CrossRef]
- Li, J.; Jiang, M.; Pei, J.; Fang, C.; Li, B.; Nie, M. Convergence of carbon sink magnitude and water table depth in global wetlands. Ecol. Lett. 2023, 26, 797–804. [Google Scholar] [CrossRef]
- Yu, Z.; Miao, L.; Liu, Q.; Kattel, G.R.; Bao, G.; Chuai, X.; Zhang, Y.; Zhang, H. Uncovering the impact of multiple determinants on vegetation NPP in Inner Mongolia. Glob. Ecol. Conserv. 2024, 56, e03341. [Google Scholar] [CrossRef]
Disclaimer/Publisher’s Note: The statements, opinions and data contained in all publications are solely those of the individual author(s) and contributor(s) and not of MDPI and/or the editor(s). MDPI and/or the editor(s) disclaim responsibility for any injury to people or property resulting from any ideas, methods, instructions or products referred to in the content. |
© 2025 by the authors. Licensee MDPI, Basel, Switzerland. This article is an open access article distributed under the terms and conditions of the Creative Commons Attribution (CC BY) license (https://creativecommons.org/licenses/by/4.0/).