Abstract
Desertification presents a significant ecological challenge in arid and semi-arid regions, posing a severe threat to regional ecological security and sustainable development. This study introduces an integrated framework for desertification vulnerability assessment, combining the MEDALUS model with the XGBoost algorithm, to evaluate desertification dynamics across the Mongolian Plateau from 2000 to 2020 and project future trends under four Shared Socioeconomic Pathways (SSPs) for 2030. The findings are as follows: (1) Between 2000 and 2020, desertification vulnerability was most pronounced in the southern and western regions of the plateau, with lower vulnerability observed in the northern and eastern areas. High-vulnerability zones expanded over time, highlighting the need for targeted and prioritized management efforts. (2) Climate factors—particularly temperature, wind speed, and precipitation—emerged as the dominant drivers of desertification, followed by soil characteristics and vegetation (NDVI). The influence of human activities on desertification became increasingly significant, stressing the need for improved land management and sustainable practices. (3) Future risks show that desertification vulnerability in the Mongolian Plateau will intensify under high-emission scenarios (SSP3-7.0, SSP5-8.5), with significant expansion of high vulnerability areas. Lower-emission scenarios (SSP1-2.6, SSP2-4.5) may reduce some impacts, but high vulnerability will persist, highlighting the need for urgent climate mitigation and adaptation efforts.
1. Introduction
Desertification is one of the most critical manifestations of global ecosystem degradation, representing a significant threat to regional ecological security and sustainable development [1,2,3]. The Mongolian Plateau, home to the largest contiguous temperate grassland ecosystem in Eurasia [4,5], serves as a vital ecological transition zone that connects the East Asian monsoon domain with the arid regions of Central Asia [6,7]. In recent decades, this region has experienced a marked decline in ecological stability, driven by the compounded effects of climate change and anthropogenic pressures [8,9,10]. Currently, over 72% of the land on the Mongolian Plateau is affected by desertification to varying degrees [11,12], making the region a critical hotspot for investigating desertification dynamics in dryland systems globally.
Traditional desertification assessment approaches often rely on a single driving mechanism, limiting their ability to capture the complex, coupled nature of human-environment systems. For instance, models such as the China Land Desertification Assessment System (CLDAS) focus primarily on meteorological influences [13,14,15], while remote sensing-based models like the Revised Universal Soil Loss Equation (RUSLE) emphasize soil erosion [15,16]. These models, though valuable, often overlook the spatiotemporal heterogeneity, multiple data sources, and integrated analysis of driving factors that are essential for a comprehensive desertification assessment [17,18]. For example, Chen et al. utilized Google Earth Engine and machine learning techniques to identify desertification drivers in Qilian Mountain National Park [19], and Vieira et al. highlighted the importance of social factors in analyzing vulnerability patterns in Brazil’s Northeast [20], while Vieira et al. emphasized the role of social factors by analyzing vulnerability patterns in Brazil’s Northeast [19]. The Mediterranean Desertification and Land Use (MEDALUS) model, developed by the European Commission in the early 1990s, is widely used to identify Environmentally Sensitive Areas (ESAs) to desertification by integrating climate, soil, vegetation, and land management indices [21]. These indices are combined using a geometric mean to assess sensitivity levels. While this model has been applied in various regions, including the Souss River Basin and Niger River Basin, its utility is limited by the lack of consideration for dynamic interactions and weight adjustments among the driving factors [22,23]. The integration of Geographic Information Systems (GIS) enhances spatial analysis, supporting land management and policy-making efforts to combat desertification [24,25].
Recent advancements in machine learning, particularly the Extreme Gradient Boosting (XGBoost) algorithm, offer significant potential for ecological modeling [26,27,28]. XGBoost is recognized for its ability to handle high-dimensional feature selection, adapt to nonlinear relationships, and provide high predictive accuracy [29]. When combined with SHapley Additive exPlanations (SHAP), XGBoost can also offer enhanced interpretability, quantifying the relative contributions of individual predictors and improving the transparency and scientific credibility of model results [30,31]. This combination not only improves prediction accuracy but also facilitates a better understanding of complex ecological processes [32,33].
This study proposes an integrated desertification vulnerability assessment framework by coupling the MEDALUS model with XGBoost. This framework addresses the traditional limitations of desertification models, particularly in terms of factor interaction and dynamic weighting. By focusing on the Mongolian Plateau from 2000 to 2020, the study analyzes spatiotemporal desertification patterns using multi-source remote sensing and meteorological data. The XGBoost-SHAP model further reveals nonlinear driving mechanisms and forecasts desertification vulnerability under different Shared Socioeconomic Pathways (SSPs) for 2030, offering valuable insights for China–Mongolia ecological cooperation and advancing the methodology for arid land degradation assessment.
2. Materials and Methods
2.1. Study Area
Located in central Eurasia (37°22′–53°20′N, 87°43′–126°04′E), the Mongolian Plateau spans approximately 2.6 million km2, encompassing Mongolia and extensive regions of western and central Inner Mongolia, China [34]. This topographically enclosed highland, averaging ~1580 m in elevation with a west-high, east-low configuration, is bounded by the Altai, Greater Khingan, Sayan–Khangai, and Helan–Yinshan mountain ranges [35]. The region experiences a strongly continental temperate climate characterized by extreme seasonal temperature variations and pronounced precipitation seasonality. Over 70% of annual precipitation occurs between June and August, exhibiting a steep east-west gradient that decreases from 200–400 mm (predominantly rainfall) in the east to arid conditions (predominantly snowfall) in the west [36,37]. This climatic pattern drives distinct vegetation zonation, transitioning from meadow steppe through dry steppe to desert. Driven by climate variability and anthropogenic pressures, the plateau faces widespread and intensifying land degradation. Desertification affects approximately 72% of Mongolia’s territory, while Inner Mongolia contains sandy lands accounting for approximately one-fifth of China’s national total. These changes significantly impair regional ecological stability and functioning, altering carbon cycling, hydrological regimes, and land–atmosphere energy exchanges [38]. Given its position as a climate-sensitive ecotone between the East Asian monsoon and Central Asian arid systems, the Mongolian Plateau serves as a critical region for diagnosing ecological vulnerability and elucidating desertification mechanisms under global change using remote sensing techniques. An overview of the study area is presented in Figure 1.
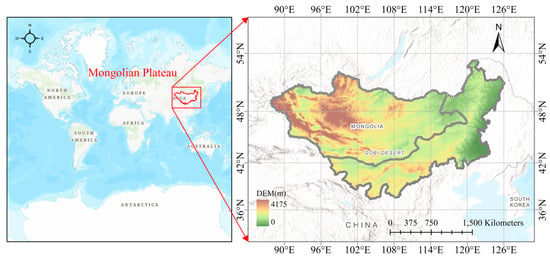
Figure 1.
Geographical context of the study area.
2.2. Data Sources
Table 1 provides an overview of the various data sources used in this study, including data types, sources, descriptions, spatial resolutions, and access information, which are crucial for the spatial and environmental analysis conducted in this research.

Table 1.
Data sources.
2.3. Vulnerability Assessment of Desertification Based on the MEDALUS Model
Based on the framework and evaluation criteria of the MEDALUS (Mediterranean Desertification and Land Use) model, this study establishes a Desertification Sensitivity Index (DSI) by selecting 12 representative indicators across four dimensions: Soil Quality (SQI), Vegetation Quality (VQI), Climate Quality (CQI), and Management Quality (MQI) [39,40]. Each parameter is graded on a sensitivity scale from 1 to 4. The corresponding quality indices are computed, and a comprehensive Desertification Vulnerability Index (DVI) is synthesized by integrating the Management Quality Index (MQI), Vegetation Quality Index (VQI), Soil Quality Index (SQI), and Climate Quality Index (CQI) through an entropy-weighted geometric mean, where weights are derived via the Entropy Weight Method. Finally, the DVI values are categorized using the Natural Breaks (Jenks) classification approach.
2.3.1. Soil Quality Index (SQI)
The SQI evaluates topographical impacts and edaphic processes in desertification development [41]. In this study, SQI is evaluated using three indicators: slope, sand content, and soil organic matter content. The Normalized Difference Soil Index (NDSI) is a remote sensing-derived index that effectively reflects soil characteristics, particularly moisture content and surface coverage, by utilizing the spectral differences between the red and shortwave infrared bands. All indicators are classified using the Natural Breaks method, with the classification criteria shown in Table 2. The SQI is calculated as follows:
where is terrain slope; is soil sand content; is soil organic matter content; and is normalized soil condition index.

Table 2.
Classification of Soil Quality Index and its corresponding weights.
2.3.2. Vegetation Quality Index (VQI)
Phytogenic stabilization has a key impact on the progression of land degradation [42]. This study evaluates the Vegetation Quality Index (VQI) from three aspects: erosion protection capability, drought resistance, and vegetation cover as indicated by the Normalized Difference Vegetation Index (NDVI). NDVI, a widely used remote sensing indicator, measures vegetation health by comparing the difference between near-infrared and red reflectance. NDVI values are classified using the Natural Breaks method, with the classification criteria detailed in Table 3. The VQI is computed as follows:
where is drought resistance; is invasion protection; and is vegetation health.

Table 3.
Classification of Vegetation Quality Index and its corresponding weights.
2.3.3. Climate Quality Index (CQI)
Desertification patterns are evaluated through climate impact measurements in the CQI [43]. This study analyzes CQI through three indicators: annual mean temperature, precipitation, and wind speed. Classification is performed using the Natural Breaks method, with criteria provided in Table 4. The CQI is calculated as follows:
where is annual average temperature; is annual precipitation; and is annual average wind speed.

Table 4.
Classification of Climate Quality Index and its corresponding weights.
2.3.4. Management Quality Index (MQI)
As an evaluative framework, the MQI correlates with anthropogenic drivers of ecological deterioration in semi-arid regions [41]. In this study, MQI is evaluated using two factors: population density and land use intensity, with classification criteria presented in Table 5. The is calculated as follows:
where is the population density and is the land use type.

Table 5.
Classification of Management Quality Index and its corresponding weights.
2.3.5. Desertification Vulnerability Index (DVI)
The synthesis of the Desertification Vulnerability Index (DVI) employs multi-index aggregation techniques, integrating the Management Quality Index (MQI), Vegetation Quality Index (VQI), Soil Quality Index (SQI), and Climate Quality Index (CQI) through the Entropy Weight Method (EWM), thereby mitigating fluctuations [44]. The is calculated as follows:
In the formula, , , and are the weights determined using the Entropy Weight Method. MQI is the Management Quality Index; is the Vegetation Quality Index; is the Soil Quality Index; and VQI is the Vegetation Quality Index.
2.4. Coefficient of Variation
The coefficient of variation (CV), or relative standard deviation, serves as a statistical indicator to evaluate the extent of dispersion in a dataset [45]. It effectively reflects the temporal stability of spatial data over a time series. The Coefficient of Variation (CV) is particularly useful for evaluating the temporal fluctuations in desertification sub-indices, as it provides a measure of the relative variability over time. By calculating the CV, we can assess the degree of change in the sub-indices, helping to identify regions where desertification is more dynamic or undergoing significant shifts. This approach is crucial for understanding the temporal evolution of desertification vulnerability and provides insights into the stability or instability of ecological conditions across different time periods. The calculation formula is as follows:
The formula for calculating the standard deviation is:
In the formula, represents the coefficient of variation; represents the standard deviation; represents the mean; represents the true value of the observed data; represents the mean of the observed data; represents the number of observations; represents the time sequence number; and the size of reflects the degree of data fluctuation. The larger the value, the greater the dispersion of the data, indicating poorer stability; conversely, it indicates smaller dispersion and better stability.
2.5. Pearson Correlation Analysis
To explore the linear relationships between the driving factors of desertification, this study adopts the Pearson Correlation Coefficient for quantitative analysis. Pearson’s r assesses how strongly two continuous variables are linearly related, with values between −1 and 1, where 1 and −1 represent perfect correlations and 0 implies no linear link [46]. The formula is:
In this formulation, and denote the measured values of two distinct variables for the -th observational unit, where and represent the arithmetic means of their respective variables, and indicates the total sample size. The numerator in the expression corresponds to the covariance between the variables, while the denominator constitutes the product of their standard deviations. Through the construction of a correlation coefficient heatmap, the interrelationships among driving factors across variables can be intuitively visualized, thereby elucidating underlying correlation patterns in multivariate datasets. To explore the relationships between the variables used in the DVI index, the Pearson Correlation Coefficient was applied to parameters such as vegetation cover (NDVI), climate variables (temperature and precipitation), soil conditions, and human activity factors. This analysis identified significant correlations among these variables, helping to reveal their combined impact on desertification. A correlation heatmap was also created to visually represent the strength and direction of these relationships, facilitating the identification of key interactions driving desertification.
2.6. Driven Interpretation and Prediction Based on XGBoost and SHAP Models
To investigate the driving mechanisms of desertification vulnerability in the study area, This study employs a hybrid modeling framework that integrates Extreme Gradient Boosting (XGBoost) with Shapley Additive Explanations (SHAP) [47]. This combined approach not only provides robust predictive performance but also enhances interpretability by quantifying the contribution of each influencing factor, thereby identifying their relative importance in driving desertification vulnerability.
2.6.1. Construction of the XGBoost Model
XGBoost is a powerful and accurate algorithm that is especially good at modeling complex relationships between different variables. In this study, we used the XGBoost model to identify the main factors driving desertification vulnerability, focusing on four key groups of environmental factors: climate (e.g., temperature, precipitation), vegetation (e.g., NDVI), soil (e.g., sand content), and topography (e.g., elevation, slope). The XGBoost model works by minimizing the difference between the predicted values and the actual values, while also adding a regularization step to keep the model from becoming too complicated and overfitting the data, improving its ability to make accurate predictions on new data [48]. The objective function is formulated as follows:
where denotes the loss function measuring the discrepancy between the observed and predicted values, and represents the complexity penalty of the tree.
2.6.2. SHAP for Feature Importance Analysis
To enhance the interpretability of the model outputs, the SHAP method was introduced to quantify the marginal contributions of individual driving factors. Rooted in cooperative game theory, SHAP leverages Shapley values to fairly attribute each feature’s impact on the model’s predictions. This method offers not only a prioritized ranking of feature importance but also indicates whether each feature contributes positively or negatively to the prediction outcome [49].
For each feature , the Shapley value is calculated as:
where is the set of all features, is a subset that does not include feature , and represents the model prediction given a specific set of features [50]. Through SHAP analysis, this study not only identifies the relative importance of each driving factor but also improves the robustness and transparency of the results, making it suitable for causal analysis in complex environmental systems.
2.6.3. Projection of Desertification Vulnerability in 2030
To further explore the spatiotemporal evolution of desertification risk, this study applies the XGBoost model to predict desertification vulnerability in the year 2030 based on historical data from 2000, 2005, 2010, 2015, and 2020, including temperature, precipitation, and soil sand content. By constructing a time series model that integrates climate and soil variables with corresponding vulnerability data, the XGBoost framework effectively captures the influence of environmental drivers on the evolution of desertification. This enables reliable prediction of the spatial patterns of desertification vulnerability in 2030. The prediction model serves as a useful tool to guide future strategies in land resource management and ecological restoration.
3. Results
3.1. Spatiotemporal Evaluation of Desertification Vulnerability Sub-Indices
As depicted in Figure 2, the desertification vulnerability sub-indices across the Mongolian Plateau demonstrated overall stability from 2000 to 2020, though certain localized areas exhibited either increasing or decreasing trends, reflecting spatial heterogeneity. High-value zones for Vegetation, Climate, and Soil Quality Indices (VQI, CQI, SQI) gradually expanded toward the southwest, signaling an area of increasing desertification vulnerability. Conversely, low-value areas in the northeast exhibited minimal change, remaining spatially stable throughout the period. This pattern suggests that the northern regions may be less susceptible to desertification pressures, possibly due to more favorable climatic conditions and land management practices. In contrast, the Management Quality Index (MQI) exhibited notable spatial variability, with intensified management pressure observed in southeastern regions. This variation can be attributed to higher anthropogenic activities such as agriculture, grazing, and urbanization in those areas, which exert additional stress on the ecosystem.
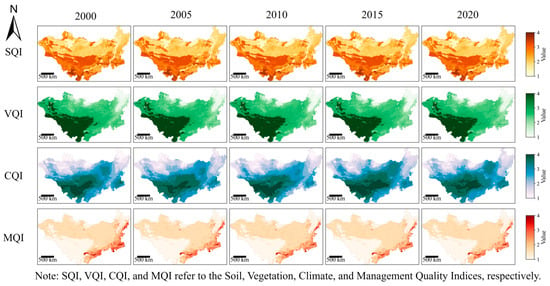
Figure 2.
Spatial analysis of the four desertification sub-indices in the Mongolian Plateau from 2000 to 2020.
The coefficient of variation (CV) analysis, as shown in Figure 3, further emphasizes the considerable spatial heterogeneity in desertification vulnerability across the plateau. The CV for VQI, CQI, and SQI showed higher values in the central and northeastern regions, indicating heightened sensitivity to interannual fluctuations in both climate conditions and land use. This increased variability underscores the dynamic nature of the ecosystem, where changes in vegetation, climate, and soil quality are more pronounced and responsive to environmental shifts. In these regions, the landscape appears to be more susceptible to fluctuations in weather patterns, such as droughts or changes in precipitation, which can exacerbate desertification. Meanwhile, the MQI exhibited the most significant fluctuations in the southeast, reflecting the region’s vulnerability to anthropogenic disturbances, including land degradation and unsustainable land management practices, which exacerbate desertification processes. This finding highlights the critical role of human activities in influencing desertification patterns in certain areas of the plateau.
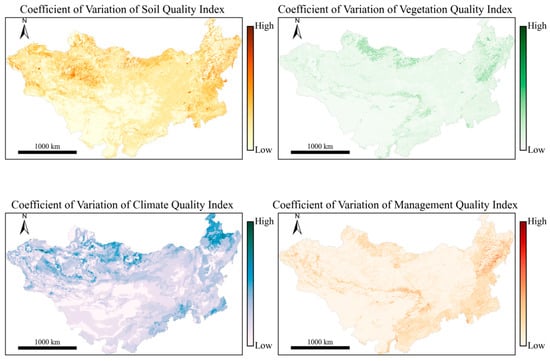
Figure 3.
Coefficient of variation in the four desertification vulnerability sub-indices in the Mongolian Plateau from 2000 to 2020.
3.2. Spatiotemporal Evolution Analysis of Desertification Vulnerability in the Mongolian Plateau
3.2.1. Spatiotemporal Distribution Characteristics of Desertification Vulnerability
From Figure 4, it is evident that between 2000 and 2020, desertification vulnerability in the Mongolian Plateau exhibited significant spatiotemporal variations. Despite the expansion of low vulnerability areas in certain regions, areas categorized as high and extremely high vulnerability still occupied the majority of the land, indicating the widespread ecological fragility of the region.As shown in Figure 5, in Inner Mongolia, the area of low vulnerability increased from 128.3 × 10³ km2 in 2000 to 152.1 × 10³ km2 in 2015, before slightly declining to 144.8 × 10³ km2 in 2020. The area of moderate vulnerability exhibited a continuous upward trend, suggesting a transition of some high vulnerability regions to a lower vulnerability category, which may be related to ecological restoration and improvements in land management. The area of high vulnerability fluctuated significantly, peaking at 368.8 × 10³ km2 in 2010, while the area of extremely high vulnerability consistently remained high, exceeding 550 × 103 km2 throughout the study period. In contrast, most of Mongolia remained predominantly in the high vulnerability category. Although low and moderate vulnerability areas slightly increased after 2010, the high and extremely high vulnerability areas continued to dominate, with their combined area exceeding 950 × 103 km2 annually. The area of extremely high vulnerability reached 427.8 × 10³ km2 in 2020, the highest value during the study period for Mongolia, indicating an intensification of land degradation processes, likely linked to climate aridification and human disturbances such as overgrazing. A direct comparison reveals that Inner Mongolia showed a more noticeable improvement in low vulnerability areas, while Mongolia continued to face greater desertification pressure, with limited reductions in high-risk areas. This comparison may reflect differences in the implementation of ecological policies, land use management, and investments in restoration projects. At the scale of the entire Mongolian Plateau, the area of low vulnerability increased by approximately 37 × 103 km2 over the 20-year period. However, extremely high vulnerability areas remained dominant, reaching 973.7 × 10³ km2 in 2020. These results highlight the long-term susceptibility of the region to desertification and reveal a spatial mismatch between localized ecological improvements and the overall vulnerability pattern.
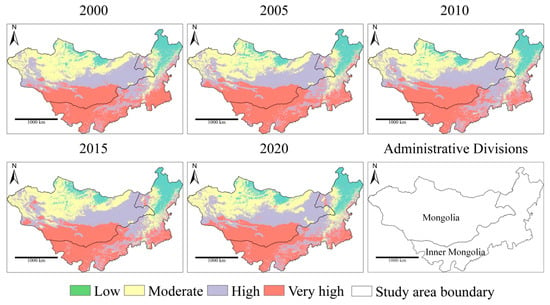
Figure 4.
Spatial distribution of desertification vulnerability.
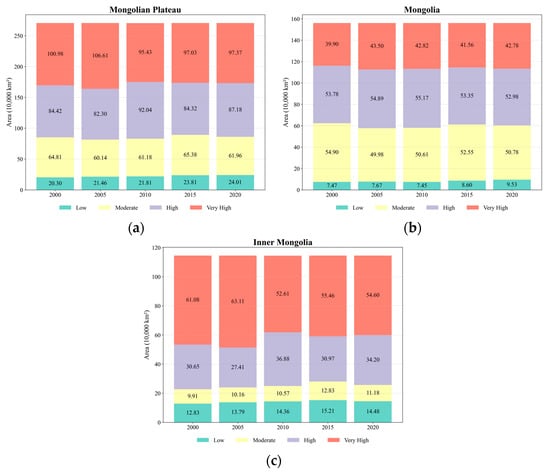
Figure 5.
Area distribution of desertification vulnerability in (a) Mongolian Plateau, (b) Mongolia, (c) Inner Mongolia.
3.2.2. Transition Patterns of Desertification Vulnerability
From 2000 to 2020, desertification vulnerability in the Mongolian Plateau exhibited significant spatiotemporal variations (Figure 6). Overall, desertification pressure intensified during most periods, particularly between 2000 and 2005 and 2010 and 2020, with notable expansions in high vulnerability (High) and very high vulnerability (Very High) areas, particularly with the transition from high vulnerability to very high vulnerability regions. This change was driven primarily by climate change, frequent droughts, and human activities, which led to ecosystem degradation and the acceleration of desertification. During the 2000–2005 period, desertification issues began to emerge, particularly with significant transitions from low vulnerability (Low) to moderate vulnerability (Moderate) and high vulnerability areas. During this period, the high vulnerability and very high vulnerability areas increased by approximately 1.22 × 10⁵ km2 and 6.51 × 10⁴ km2, respectively, indicating the initial stages of desertification and its intensification. In the 2005–2010 period, although the area of high vulnerability and very high vulnerability continued to expand, there were also signs of partial recovery, especially in the very high vulnerability regions, where area reduction was observed, reflecting the positive effects of ecological restoration and improved management. However, from 2010 to 2015, desertification once again intensified, with notable transitions from moderate vulnerability to high vulnerability and very high vulnerability regions. The area of very high vulnerability continued to expand, increasing by approximately 1.00 × 10⁵ km2 during this period. Between 2015 and 2020, desertification pressure peaked, particularly in the transition from moderate vulnerability to high vulnerability and very high vulnerability regions, which reached a historical maximum of 1.12 × 10⁵ km2. Although the net increase in very high vulnerability areas slowed in some regions, indicating some recovery, the overall trend of desertification expansion remained significant. Specifically, the low vulnerability areas showed almost no transition to very high vulnerability areas, suggesting that although recovery efforts have yielded some positive results, the overall desertification issue remains largely unaddressed.
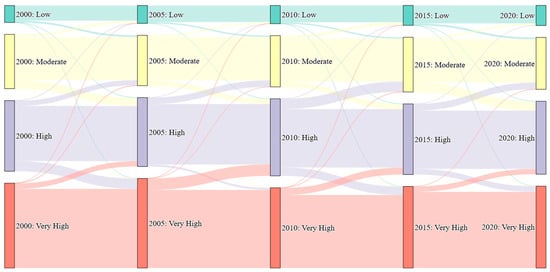
Figure 6.
Desertification vulnerability transition analysis of the Mongolian Plateau.
In summary, the spatial transition patterns of desertification vulnerability in the Mongolian Plateau reveal a long-term trend of increasing desertification, particularly with the continuous expansion of high vulnerability and very high vulnerability areas. This highlights the profound impact of climate change and human activities on the ecosystem. However, the partial recovery and management improvements in certain regions demonstrate that appropriate ecological restoration measures can stabilize or recover some areas. Given the increasingly severe desertification situation, future efforts should focus on strengthening ecological protection and restoration, especially in high vulnerability and very high vulnerability areas, with effective governance strategies essential to halting the expansion of desertification in the context of climate change.
3.3. Analysis of Driving Factors of Desertification Vulnerability
3.3.1. Correlation Among Driving Factors
As shown in Figure 7, in the desertification vulnerability analysis of the Mongolian Plateau, correlation analysis of driving factors highlights the strong relationships between ecological changes and factors such as climate, soil conditions, land use, and population density. The correlation heatmap reveals significant interaction between climate factors (temperature and precipitation) and ecological changes, with a positive correlation between temperature and precipitation observed in 2000 and 2020 (correlation coefficient of 0.66). This indicates that climate change, particularly rising temperatures and fluctuating precipitation, is a major driver of ecological changes. Increased temperatures lead to higher evaporation rates, causing soil dryness, while reduced precipitation impacts vegetation water supply, destabilizing plant growth and ecosystems. Climate change acts as a catalyst for desertification, reducing vegetation cover and intensifying soil erosion. Soil factors, such as organic matter (OM) and sand content, show a significant positive correlation with NDVI, especially in 2005 and 2015, suggesting that soil quality significantly influences ecosystem health. Higher organic matter improves moisture retention and promotes vegetation growth, while increased sand content can degrade soil structure and accelerate desertification. These changes in soil conditions, in conjunction with climate change, contribute to a vicious cycle of desertification. Land use change and population density exhibit weaker correlations, though land use showed stronger correlations with NDVI and sand content in 2015. Expanding farmland and urbanization alter the ecological structure and hydrological conditions, intensifying soil erosion and reducing vegetation cover. Higher population density increases resource demand, leading to further land overuse and hindering ecosystem recovery. Topographic factors, such as DEM and slope, show weak correlations, indicating limited direct effects on desertification vulnerability. However, topography can influence vegetation indirectly by affecting water flow and soil erosion. Steep slopes promote water runoff, leading to soil degradation, while low-lying areas may encourage plant growth, though excessive water can cause soil salinization.
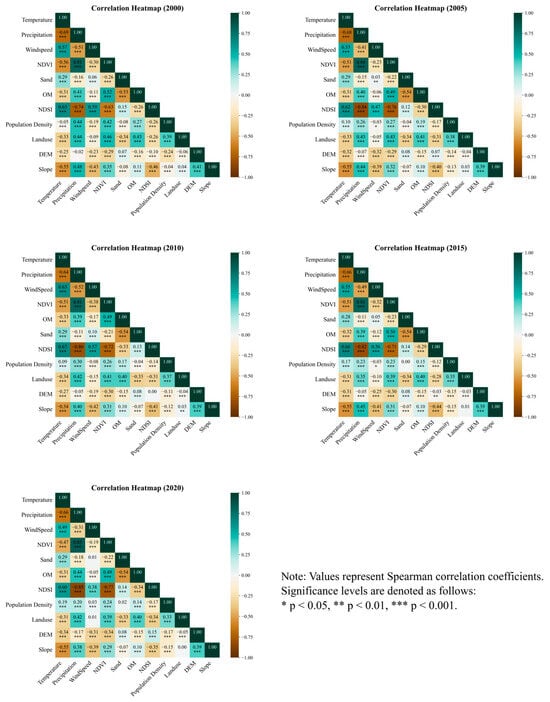
Figure 7.
Driver factor correlation heatmap.
Overall, ecological changes on the Mongolian Plateau are driven by multiple factors, with climate change being the primary driver. Soil conditions and land use changes also contribute to desertification, while topographic factors have localized, indirect effects. To address desertification, integrated management focusing on climate regulation, soil conservation, and sustainable land use is essential for regional sustainability.
3.3.2. Identification of Key Drivers and SHAP-Based Interpretation
Figure 8 illustrates the temporal evolution of key drivers influencing desertification vulnerability across the Mongolian Plateau from 2000 to 2020. Climate-related variables, particularly temperature, wind speed, and precipitation, exerted the strongest influence. Temperature consistently ranked as one of the most critical drivers, with its impact peaking in 2005 (0.2668) and remaining significant in 2020 (0.2154). This variation is primarily attributed to temperature’s role in exacerbating evaporation, soil moisture depletion, and vegetation stress. Wind speed maintained its significant effect, particularly in 2000 (0.1853) and 2020 (0.1936), due to its close association with wind erosion processes. Precipitation had a substantial impact on desertification vulnerability in the early period (0.1809 in 2000), but its influence diminished post-2005, with a value of 0.1355 in 2020, indicating a reduced effect on soil moisture retention and vegetation growth. Temperature and wind speed, as primary climatic factors, played a dominant role in desertification dynamics. The rise in temperature not only intensified soil moisture loss but also exacerbated vegetation stress, particularly under drought and high-temperature conditions, thus significantly driving the progression of desertification. Wind speed, through facilitating wind erosion, made soil particles more susceptible to being displaced, leading to soil degradation and increased ecosystem vulnerability. The reduction in precipitation, especially after 2005, directly affected soil water supply, making it difficult for vegetation to thrive under arid conditions, thereby accelerating land degradation. Soil characteristics also played a significant role in shaping desertification vulnerability. Sand content reached its peak in 2015 (0.1885), while organic matter (OM) exhibited an increasing influence over time, with a value of 0.1242 in 2020. Areas with higher sand content exhibit poorer moisture retention and are more vulnerable to wind and water erosion, further exacerbating desertification. Vegetation indices, such as NDVI (e.g., 0.1185 in 2010) and NDSI (around 0.1287 in 2020), primarily reflect the ecosystem’s response to climatic and soil conditions, with their contribution gradually increasing over time. Topographic factors, such as slope, had a relatively minor influence, with values of 0.0229 in 2000 and 0.0304 in 2015. Similarly, land use and population density exhibited moderate effects, with land use contribution rising from 0.0326 in 2005 to 0.0620 in 2020, and population density decreasing from 0.0796 in 2000 to 0.0639 in 2020. These results underscore the dominant role of temperature, wind speed, and precipitation in desertification dynamics, while the significance of soil characteristics and vegetation indices also increased over time. To mitigate desertification risks, urgent implementation of climate-resilient strategies is necessary, including temperature regulation, the establishment of windbreaks, soil stabilization through sand fixation and organic matter enhancement, as well as vegetation restoration in highly vulnerable areas.
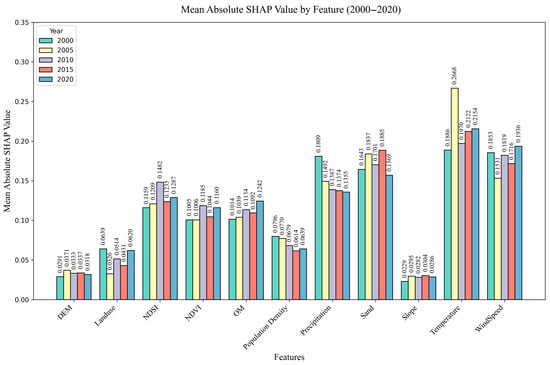
Figure 8.
Feature importance of driving factors.
As illustrated in Figure 9, the SHAP analysis offers deeper insights into the complex relationships driving desertification vulnerability. Temperature emerges as a key factor, with elevated temperature values consistently aligning with high SHAP values, underscoring its significant positive contribution to vulnerability. Wind speed also plays a crucial role, exhibiting a strong correlation with increased SHAP values, particularly evident in the years 2005 and 2020, suggesting its exacerbating effect on land degradation during these periods. Precipitation, conversely, shows a negative relationship with SHAP values: areas experiencing low rainfall are associated with higher SHAP values, indicating that drought conditions exacerbate vulnerability. On the other hand, increased rainfall appears to mitigate the impact of desertification by reducing SHAP values. Sand content is another influential factor, with high levels correlating strongly with elevated SHAP values, further emphasizing its role in soil degradation and desertification processes. Organic matter (OM) shows an inverse relationship with SHAP values, with higher OM content contributing to lower SHAP values, reaffirming its role in promoting soil resilience and enhancing land productivity. The Normalized Difference Soil Index (NDSI) reveals a positive correlation with SHAP values, highlighting areas with exposed soil as degradation hotspots, where the absence of vegetation and protective ground cover leads to increased vulnerability. Interestingly, the Normalized Difference Vegetation Index (NDVI) demonstrates a negative relationship, where higher vegetation coverage correlates with lower SHAP values, indicating that healthy vegetation plays a protective role against desertification. Population density, particularly from 2015 onward, shows an increasing influence on desertification vulnerability. High-density areas are linked with higher SHAP values, suggesting the growing impact of anthropogenic pressures, such as overgrazing, land-use changes, and urban expansion, which contribute to land degradation. Topographic factors, including slope and Digital Elevation Model (DEM) values, show limited influence on desertification vulnerability, with SHAP distributions remaining relatively small and clustered. This suggests that while topography may influence local variations in land degradation, its effect is less pronounced compared to climate factors and human-induced pressures.
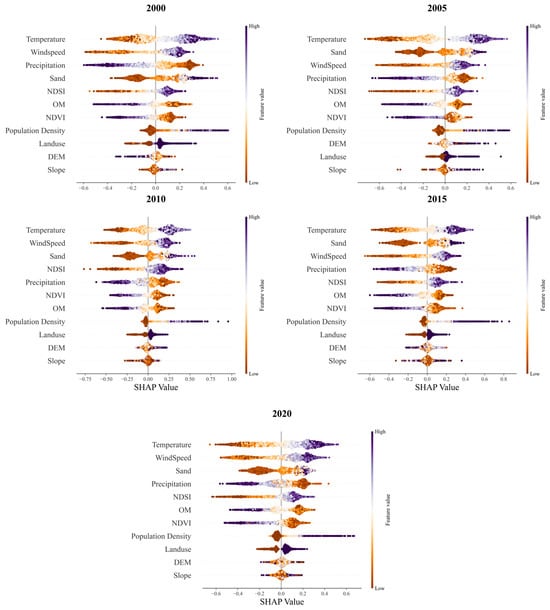
Figure 9.
SHAP values of driver factors.
Overall, the analysis emphasizes that desertification vulnerability is driven by a complex interplay of climatic, ecological, and anthropogenic factors. Climate variables, particularly temperature and wind speed, are dominant contributors, while soil and vegetation act as vital buffers. However, human activities are emerging as significant threats to land stability, highlighting the need for targeted management strategies to mitigate the accelerating impacts of desertification.
3.4. Projection of Desertification Vulnerability Based on Climate and Soil Interactions
Based on analysis, temperature, precipitation, and soil sand content were identified as key drivers of desertification vulnerability. Using data from 2000 to 2020, this study projected vulnerability for 2030 under four SSP scenarios: SSP126, SSP245, SSP370, and SSP585 (Figure 10 and Table 6). The SSP scenarios assess the potential impacts of different socioeconomic development paths on climate change and the environment. SSP126 represents a path with significant progress in reducing greenhouse gas emissions, focusing on green energy and environmental protection, limiting global temperature rise to below 2 °C. SSP245 follows a more moderate approach to climate change mitigation, where emissions are reduced moderately, and global temperature rise may exceed 2 °C but is managed through adaptation measures. SSP370 depicts a fragmented world with limited global cooperation and rapid increases in emissions, leading to global temperatures rising by more than 3 °C. Finally, SSP585 represents a high-emission path driven by fossil fuels, where emissions remain high, causing significant climate change impacts and global temperatures rising by more than 4 °C. The model demonstrated good predictive performance (R2 = 0.8947, RMSE = 0.1411). The results revealed increasing vulnerability and shifting spatial patterns from SSP126 to SSP585. Under SSP126, northern and northeastern regions maintain low to moderate vulnerability, while high-emission scenarios (SSP370, SSP585) show widespread high vulnerability, particularly in southern and transitional zones, with a noticeable south-to-north resilience gradient. Table 6 compares the structural distribution of vulnerability in 2030 to 2020. All scenarios show an expansion of vulnerable areas, with the Very High category increasing sharply—reaching 1.24 million km2 under SSP585—indicating severe ecological degradation. Meanwhile, the Low and Moderate categories decline, indicating a loss of ecologically secure zones. These findings underscore the urgency of adopting low-carbon development pathways, enhancing land-use sustainability, and strengthening ecological restoration efforts.
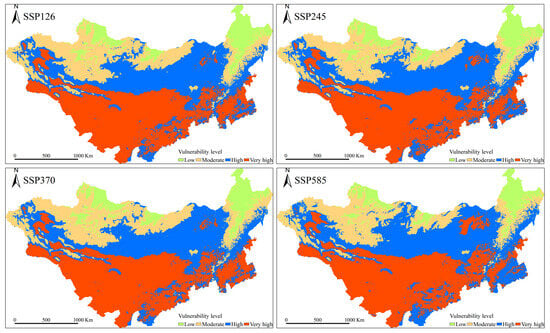
Figure 10.
Multi-scenario projections of desertification vulnerability in 2030.

Table 6.
Desertification vulnerability areas (km2) across severity levels for 2020 and projected values under SSP scenarios for 2030.
As of 2020, the plateau exhibits significant vulnerability, with the very high vulnerability areas (10,098.02 km2) representing the largest portion of the affected land. Additionally, high vulnerability regions cover 844,236.86 km2, underscoring the severe desertification challenges currently faced. Under the SSP1-2.6 scenario, which represents a low-carbon, green development pathway, there is a slight improvement, with low vulnerability areas increasing to 182,363.69 km2. However, high vulnerability areas still expand to 1,202,990.63 km2, reflecting the long-term impacts of climate change and environmental degradation, even under mitigation efforts. Similarly, the SSP2-4.5 scenario, which suggests moderate mitigation policies, results in a similar trend, with a slight improvement in low vulnerability regions (189,153.36 km2), but high vulnerability areas remain at 1,211,657.27 km2. In contrast, the SSP3-7.0 scenario, characterized by rapid emission increases and limited global cooperation, exacerbates desertification, with high vulnerability areas reaching 1,190,627.28 km2. Finally, the SSP5-8.5 scenario, which represents a high-emission and fossil-fuel-driven pathway, results in the most severe projections, with high vulnerability areas expanding further to 1,241,440.74 km2, highlighting the significant threat of climate change and anthropogenic activities. These findings indicate that while low-carbon development scenarios can mitigate some desertification effects, high-emission pathways will exacerbate land degradation, especially in the southern and western regions, emphasizing the urgent need for targeted environmental policies and climate adaptation strategies.
4. Discussion
4.1. Ecological Interpretation of Driving Mechanisms
This study applied the XGBoost model combined with SHAP analysis to identify the key drivers of desertification vulnerability on the Mongolian Plateau. Temperature and wind speed were found to be the primary climatic factors, with average SHAP values ranging from 0.215 to 0.265 and 0.185 to 0.194, respectively, which is consistent with the findings of previous studies [51]. These results indicate an intensifying aridification trend closely linked to the strengthening Siberian high-pressure system. Elevated temperatures have increased evapotranspiration, reducing soil moisture availability and inhibiting vegetation growth [52]. Concurrently, intensified wind speeds have aggravated wind erosion, leading to an approximately 15% annual increase in sand transport, which degrades soil structure and vegetation cover [53]. This interaction creates a negative feedback loop: vegetation degradation accelerates soil deterioration, which further hampers vegetation recovery and exacerbates desertification. Soil properties, particularly sand content and organic matter, also significantly influence ecological vulnerability. Higher sand content correlates positively with increased degradation risk, whereas elevated organic matter improves soil stability and resilience. Vegetation health, represented by NDVI, negatively correlates with desertification risk, emphasizing its critical role as an ecological buffer.
4.2. Future Vulnerability Trends and Policy Implications
Forecasts under four Shared Socioeconomic Pathways (SSPs) scenarios for 2030 demonstrate that high-emission scenarios (SSP370 and SSP585) will substantially increase desertification vulnerability in central and southwestern regions, heightening ecological risks [54,55]. In contrast, the low-emission sustainable development pathway (SSP126) predicts relatively stable ecological conditions, illustrating the benefits of low-carbon and environmentally friendly development strategies [56]. The high predictive accuracy of the model (R2 = 0.8837, RMSE = 0.1401) validates the effectiveness of integrating machine learning with remote sensing data to capture the complex drivers and spatiotemporal evolution of desertification. These findings underscore the urgency to implement climate-adaptive policies, improve land management, and promote ecological restoration [57]. Recommended actions include establishing shelterbelts to reduce wind erosion, adopting water-saving irrigation and vegetation restoration techniques to enhance water-use efficiency, regulating grazing practices scientifically to prevent overexploitation, and strengthening cross-border cooperation between Mongolia and Inner Mongolia for coordinated governance [58]. Pursuing sustainable, low-carbon development pathways is critical to mitigating climate impacts and preserving regional ecological security.
4.3. Limitations and Future Directions
Despite significant advances, this study has several limitations. Socioeconomic variables such as land-use change dynamics, policy enforcement intensity, and economic development levels were not fully integrated, which may limit the comprehensiveness of vulnerability assessments [59]. Additionally, future projections were primarily based on historical trends of climate and soil sand content, excluding possible effects of extreme events or abrupt policy changes. The spatial resolution and temporal coverage of the datasets constrained the capacity to detect fine-scale variations and micro-regional changes. Future research should focus on integrating multi-scale, multi-source data fusion leveraging GIS technologies to enable dynamic monitoring and precise early warning of desertification [60]. Incorporating social-ecological system dynamics into integrated modeling frameworks will further improve the understanding and prediction of complex desertification processes. Moreover, long-term monitoring of policy effectiveness and ecological restoration outcomes is essential to guide sustainable ecosystem management and land use planning in arid and semi-arid regions [34].
5. Conclusions
This study developed a comprehensive framework for assessing desertification vulnerability in the Mongolian Plateau, utilizing the MEDALUS model alongside multi-source remote sensing and geospatial data. The assessment incorporated four key dimensions: management, vegetation, soil, and climate quality. By applying the XGBoost algorithm and SHAP interpretability, the study identified the primary drivers of desertification and their interconnected feedback mechanisms. A regression model was subsequently built, using precipitation, temperature, and soil sand content to forecast future vulnerability under four SSP scenarios for 2030. Key findings include:
- (1)
- Spatiotemporal Variation in Vulnerability: From 2000 to 2020, desertification was more pronounced in the southern and western regions, with lower vulnerability in the north and east. While extreme vulnerability areas showed a slight reduction, high vulnerability zones expanded, underscoring the need for targeted control efforts. Positive trends were observed in Inner Mongolia, while Mongolia continued to face significant vulnerability.
- (2)
- Dominant Drivers: Climate factors—particularly temperature, wind speed, and precipitation—emerged as the most significant drivers, followed by soil characteristics and vegetation (NDVI). Human activities also increasingly influence vulnerability, emphasizing the importance of enhanced climate adaptation, soil management, and sustainable land-use practices.
- (3)
- Projected Risks: Future projections indicate that desertification vulnerability in the Mongolian Plateau will increase significantly under high-emission scenarios, such as SSP3-7.0 and SSP5-8.5, with high vulnerability areas expanding notably. In contrast, lower-emission pathways like SSP1-2.6 and SSP2-4.5 can mitigate some desertification impacts, though high vulnerability regions will persist. The results emphasize the critical need for effective climate mitigation and adaptation strategies to address the escalating desertification risks, particularly in the southern and western regions, where the threat of land degradation remains highest.
In conclusion, this study shows that integrating machine learning with remote sensing enhances the accuracy of desertification vulnerability assessments and provides valuable insights for planning and mitigation. By identifying key drivers such as climate, soil degradation, and human activities, the findings can guide targeted interventions and inform sustainable land-use practices. Incorporating socioeconomic data further improves future projections, supporting more effective desertification management and adaptation strategies.
Author Contributions
M.L. conducted data processing and wrote research papers; B.A., G.B., Y.L., Y.W., X.Y. and Y.Z. contributed to the discussion of the results; Q.Y. contributed some ideas and revised the paper; and all authors edited the paper. All authors have read and agreed to the published version of the manuscript.
Funding
This work was supported by the National Natural Science Foundation of China [42261144747], and the 5⋅5 Engineering Research & Innovation Team Project of Beijing Forestry University [BLRC2023B06] and Chinese College Students’ Innovative Entrepreneurial Training Plan Program “Analysis and Comparative Study on the Evolution of Desert Ecosystems in China and Mongolia”.
Data Availability Statement
All datasets used in this study are publicly available from open-access sources. The Digital Elevation Model (DEM) for the Mongolian Plateau was obtained from the SRTM dataset via the USGS EarthExplorer platform (https://earthexplorer.usgs.gov/, accessed on 5 April 2025), and slope data were generated using ArcGIS 10.8. Historical meteorological variables, including temperature, precipitation, and wind speed, were retrieved from the ERA5-Land dataset provided by ECMWF (https://www.ecmwf.int/en/era5-land, accessed on 8 April 2025). Future climate projections were accessed through the WorldClim platform (https://worldclim.org/, accessed on 10 April 2025). Vegetation and soil indices, namely the Normalized Difference Vegetation Index (NDVI) and the Normalized Difference Soil Index (NDSI), were calculated using the MOD09A1 product on the Google Earth Engine platform (https://earthengine.google.com/ and https://lpdaac.usgs.gov/, accessed on 12 April 2025). Land cover data were sourced from the MCD12Q1 v061 dataset (accessed on 15 April 2025), and soil properties were obtained from the Harmonized World Soil Database v1.2 (HWSD) by the FAO (accessed on 17 April 2025). Demographic information was collected from the WorldPop project (https://www.worldpop.org/, accessed on 20 April 2025). The spatial boundary of the study area was delineated using data from the Ministry of Natural Resources of China (http://bzdt.ch.mnr.gov.cn/, accessed on 22 April 2025).
Acknowledgments
The authors gratefully acknowledge the Google Earth Engine (GEE) platform for providing access to remote sensing datasets and computational resources essential to this research. We also thank the anonymous reviewers for their constructive comments and valuable suggestions, which have significantly improved the quality of this manuscript.
Conflicts of Interest
The authors declare no conflicts of interest.
References
- Reynolds, J.F.; Smith, D.M.S.; Lambin, E.F.; Turner, B.; Mortimore, M.; Batterbury, S.P.; Downing, T.E.; Dowlatabadi, H.; Fernández, R.J.; Herrick, J.E. Global desertification: Building a science for dryland development. Science 2007, 316, 847–851. [Google Scholar] [CrossRef]
- Burrell, A.L.; Evans, J.P.; De Kauwe, M.G. Anthropogenic climate change has driven over 5 million km2 of drylands towards desertification. Nat. Commun. 2020, 11, 3853. [Google Scholar] [CrossRef]
- Ahmed, Z.; Gui, D.; Abd-Elmabod, S.K.; Murtaza, G.; Ali, S. An overview of global desertification control efforts: Key challenges and overarching solutions. Soil. Use Manag. 2024, 40, e13154. [Google Scholar] [CrossRef]
- Nandintsetseg, B.; Boldgiv, B.; Chang, J.; Ciais, P.; Davaanyam, E.; Batbold, A.; Bat-Oyun, T.; Stenseth, N.C. Risk and vulnerability of Mongolian grasslands under climate change. Environ. Res. Lett. 2021, 16, 034035. [Google Scholar] [CrossRef]
- Chen, J.; John, R.; Zhang, Y.; Shao, C.; Brown, D.G.; Batkhishig, O.; Amarjargal, A.; Ouyang, Z.; Dong, G.; Wang, D. Divergences of two coupled human and natural systems on the Mongolian Plateau. Bioscience 2015, 65, 559–570. [Google Scholar] [CrossRef]
- Zhang, Q.; Zeng, J.; Yue, P.; Zhang, L.; Wang, S.; Wang, R. On the land-atmosphere interaction in the summer monsoon transition zone in East Asia. Theor. Appl. Climatol. 2020, 141, 1165–1180. [Google Scholar] [CrossRef]
- Wang, L.; Chen, W.; Huang, G.; Zeng, G. Changes of the transitional climate zone in East Asia: Past and future. Clim. Dyn. 2017, 49, 1463–1477. [Google Scholar] [CrossRef]
- Guo, J.; Shen, B.; Li, H.; Wang, Y.; Tuvshintogtokh, I.; Niu, J.; Potter, M.A.; Li, F.Y. Past dynamics and future prediction of the impacts of land use cover change and climate change on landscape ecological risk across the Mongolian plateau. J. Environ. Manag. 2024, 355, 120365. [Google Scholar] [CrossRef]
- Zhao, X.; Shen, H.; Geng, X.; Fang, J. Three-decadal destabilization of vegetation activity on the Mongolian Plateau. Environ. Res. Lett. 2021, 16, 034049. [Google Scholar] [CrossRef]
- Guo, E.; Wang, Y.; Wang, C.; Sun, Z.; Bao, Y.; Mandula, N.; Jirigala, B.; Bao, Y.; Li, H. NDVI indicates long-term dynamics of vegetation and its driving forces from climatic and anthropogenic factors in Mongolian Plateau. Remote Sens. 2021, 13, 688. [Google Scholar] [CrossRef]
- Wang, Y.; Guo, E.; Kang, Y.; Ma, H. Assessment of land desertification and its drivers on the Mongolian plateau using intensity analysis and the geographical detector technique. Remote Sens. 2022, 14, 6365. [Google Scholar] [CrossRef]
- Zhang, X.; Zhang, S. China-Mongolia-Russia economic corridor and environmental protection cooperation. R-Economy 2017, 3, 161–166. [Google Scholar] [CrossRef][Green Version]
- Guluzade, R.; Pan, X.; Muhammad, F.; Yang, Y. Comprehensive Error Analysis of CLDAS Soil Moisture Over Arid and Semiarid Regions. IEEE J. Sel. Top. Appl. Earth Obs. Remote Sens. 2023, 16, 4414–4422. [Google Scholar] [CrossRef]
- Yajie, X.; Runping, S.; Anqi, H.; Yujing, L.; Yunyu, W.; Zhaoying, X.; Chunxiang, S.; Shuai, S. Integrated drought monitoring model based on MODIS and CLDAS. Nanjing Xinxi Gongcheng Daxue Xuebao 2024, 16, 394–404. [Google Scholar]
- Yan, J.; Ling, X.; Qun, Z.; Wei-kun, L.; Shuai, S. Agricultural Drought Monitoring in Yunnan Based on CLDAS Soil Relative Moisture. Chin. J. Agrometeorol. 2024, 45, 79. [Google Scholar]
- Baskan, O. Analysis of spatial and temporal changes of RUSLE-K soil erodibility factor in semi-arid areas in two different periods by conditional simulation. Arch. Agron. Soil. Sci. 2022, 68, 1698–1710. [Google Scholar] [CrossRef]
- Tian, L.; Qiu, S.; Peng, J.; Hu, Y.; Jia, J.; Mao, Q. Desertification sensitivity evaluation in Inner Mongolia Autonomous Region based on PSR framework. Prog. Geogr. 2018, 37, 1682–1692. [Google Scholar]
- Chen, Y.; Ma, L.; Wang, X.; Liu, T.; Qiao, Z. Spatiotemporal patterns of desertification sensitivity and influencing factors across the Western Inner Mongolia Plateau, China. Ecol. Inform. 2025, 89, 103190. [Google Scholar] [CrossRef]
- Vieira, R.M.d.S.P.; Sestini, M.F.; Tomasella, J.; Marchezini, V.; Pereira, G.R.; Barbosa, A.A.; Santos, F.C.; Rodriguez, D.A.; do Nascimento, F.R.; Santana, M.O. Characterizing spatio-temporal patterns of social vulnerability to droughts, degradation and desertification in the Brazilian northeast. Environ. Sustain. Indic. 2020, 5, 100016. [Google Scholar] [CrossRef]
- Chen, X.; Wang, N.; Peng, S.; Meng, N.; Lv, H. Analysis of spatiotemporal dynamics of land desertification in Qilian Mountain National Park based on google earth engine. ISPRS Int. J. Geo-Inf. 2024, 13, 117. [Google Scholar] [CrossRef]
- Kosmas, C.; Kirkby, M.; Geeson, N. ‘The Medalus Project—Mediterranean Desertification and Land Use′. Manual on Key Indicators of Desertification and Mapping Environmentally Sensitive Areas to Desertification; European Commission—Office for Official Publications of the European Communities: Luxembourg, 1999; Volume 18882.
- Bouabid, R.; Rouchdi, M.; Badraoui, M.; Diab, A.; Louafi, S. Assessment of land desertification based on the MEDALUS approach and elaboration of an action plan: The case study of the Souss River Basin, Morocco. In Land Degradation and Desertification: Assessment, Mitigation and Remediation; Springer: Dordrecht, The Netherlands, 2010; pp. 131–145. [Google Scholar]
- Ogbue, C.; Igboeli, E.; Ajaero, C.; Ochege, F.U.; Yahaya, I.I.; Yeneayehu, F.; You, Y.; Wang, Y. Remote sensing analysis of desert sensitive areas using MEDALUS model and GIS in the Niger River Basin. Ecol. Indic. 2024, 158, 111404. [Google Scholar] [CrossRef]
- Engelen, G. Desertification and Land Degradation in Mediterranean Areas: From Science to Integrated Policy Making; Nota di Lavoro: 2001. Available online: https://www.econstor.eu/handle/10419/155178 (accessed on 9 July 2025).
- Temerdek-Ivan, K.; Benedek, J.; Török, I.; Holobâcă, I.H.; Alexe, M. Determination of Land Degradation in Romania at a Local Scale Using Advanced Analytical Techniques. Land. Degrad. Dev. 2025, 36, 1614–1627. [Google Scholar] [CrossRef]
- Sun, D.; Wu, X.; Wen, H.; Ma, X.; Zhang, F.; Ji, Q.; Zhang, J. Ecological security pattern based on XGBoost-MCR model: A case study of the three gorges reservoir region. J. Clean. Prod. 2024, 470, 143252. [Google Scholar] [CrossRef]
- Lao, Y.; He, X.; Chen, J.; Liang, Y. Revealing spatio-temporal characteristics of ecological resistance surfaces: A regional study case based on coupled algorithms AutoEncoder-XGBoost. Ecol. Front. 2025, 45, 422–432. [Google Scholar] [CrossRef]
- Jia, Z.; Zhang, Z.; Cheng, Y.; Borjigin, S.; Quan, Z. Grassland biomass spatiotemporal patterns and response to climate change in eastern Inner Mongolia based on XGBoost model estimates. Ecol. Indic. 2024, 158, 111554. [Google Scholar] [CrossRef]
- Chen, T.; Guestrin, C. Xgboost: A scalable tree boosting system. In Proceedings of the 22nd Acm Sigkdd International Conference on Knowledge Discovery and Data Mining, San Francisco, CA, USA, 13–17 August 2016; pp. 785–794. [Google Scholar]
- Wang, M.; Li, Y.; Yuan, H.; Zhou, S.; Wang, Y.; Ikram, R.M.A.; Li, J. An XGBoost-SHAP approach to quantifying morphological impact on urban flooding susceptibility. Ecol. Indic. 2023, 156, 111137. [Google Scholar] [CrossRef]
- Liu, Y.; Wang, H.; Guan, X.; Meng, Y.; Xu, H. Urban flood depth prediction and visualization based on the XGBoost-SHAP model. Water Resour. Manag. 2025, 39, 1353–1375. [Google Scholar] [CrossRef]
- Frifra, A.; Maanan, M.; Maanan, M.; Rhinane, H. Harnessing LSTM and XGBoost algorithms for storm prediction. Sci. Rep. 2024, 14, 11381. [Google Scholar] [CrossRef] [PubMed]
- Sun, M.; Yang, J.; Yang, C.; Wang, W.; Wang, X.; Li, H. Research on prediction of PPV in open-pit mine used RUN-XGBoost model. Heliyon 2024, 10, e28246. [Google Scholar] [CrossRef]
- Rao, Y.; Zhou, M.; Ou, G.; Dai, D.; Zhang, L.; Zhang, Z.; Nie, X.; Yang, C. Integrating ecosystem services value for sustainable land-use management in semi-arid region. J. Clean. Prod. 2018, 186, 662–672. [Google Scholar] [CrossRef]
- John, R.; Chen, J.; Ou-Yang, Z.-T.; Xiao, J.; Becker, R.; Samanta, A.; Ganguly, S.; Yuan, W.; Batkhishig, O. Vegetation response to extreme climate events on the Mongolian Plateau from 2000 to 2010. Environ. Res. Lett. 2013, 8, 035033. [Google Scholar] [CrossRef]
- Xie, Q.; Jia, X.; Chen, X.; Qian, Q. Combined effects of ocean-land processes on spring precipitation variability in Mongolian Plateau. Atmos. Res. 2025, 313, 107765. [Google Scholar] [CrossRef]
- Gao, S.; Huang, S.; Singh, V.P.; Deng, X.; Duan, L.; Leng, G.; Guo, W.; Li, Y.; Zhang, L.; Han, Z. Dynamic response of vegetation to meteorological drought and driving mechanisms in Mongolian Plateau. J. Hydrol. 2025, 650, 132541. [Google Scholar] [CrossRef]
- Dorj, O.; Enkhbold, M.; Lkhamyanjin, S.; Mijiddorj, K.; Nosmoo, A.; Puntsagnamil, M.; Sainjargal, U. Mongolia: Country features, the main causes of desertification and remediation efforts. In Combating Desertification in Asia, Africa and the Middle East; Springer: Dordrecht, The Netherlands, 2013; pp. 217–229. [Google Scholar]
- D’Ettorre, U.S.; Liso, I.S.; Parisi, V.; Parise, M. Desertification Assessment Using the Modified Mediterranean Desertification and Land Use Model in a Karst Plateau. Geosciences 2024, 14, 320. [Google Scholar] [CrossRef]
- Gad, A.; Mansour, R. Index integrating soil, vegetation, climate and management qualities to evaluate desertification in the Northwestern coast, Egypt. Int. J. Environ. Eng. Dev. 2023, 1, 250–265. [Google Scholar] [CrossRef]
- Xu, D.; You, X.; Xia, C. Assessing the spatial-temporal pattern and evolution of areas sensitive to land desertification in North China. Ecol. Indic. 2019, 97, 150–158. [Google Scholar] [CrossRef]
- Salih, A.; Hassaballa, A.A. Quantitative assessment of land sensitivity to desertification in Central Sudan: An application of remote sensing-based MEDALUS model. In Applications of Space Techniques on the Natural Hazards in the MENA Region; Springer: Berlin/Heidelberg, Germany, 2022; pp. 419–446. [Google Scholar]
- Maity, S.S.; Shaw, R.P.; Maity, R. Climate change may cause oasification or desertification both: An analysis based on the spatio-temporal change in aridity across India. Theor. Appl. Climatol. 2024, 155, 1167–1184. [Google Scholar] [CrossRef]
- Salvati, L.; Sabbi, A.; Smiraglia, D.; Zitti, M. Does forest expansion mitigate the risk of desertification? Exploring soil degradation and land-use changes in a Mediterranean country. Int. For. Rev. 2014, 16, 485–496. [Google Scholar] [CrossRef]
- Jalilibal, Z.; Amiri, A.; Castagliola, P.; Khoo, M.B. Monitoring the coefficient of variation: A literature review. Comput. Ind. Eng. 2021, 161, 107600. [Google Scholar] [CrossRef]
- Zhang, X.; Fan, H.; Sun, L.; Liu, W.; Wang, C.; Wu, Z.; Lv, T. Identifying regional eco-environment quality and its influencing factors: A case study of an ecological civilization pilot zone in China. J. Clean. Prod. 2024, 435, 140308. [Google Scholar] [CrossRef]
- Li, H.; Dong, L.; Su, W.; Liu, Y.; Tang, Z.; Liao, X.; Long, J.; Zhang, X.; Sun, X.; Zhang, H. Multiple patterns of EEG parameters and their role in the prediction of patients with prolonged disorders of consciousness. Front. Neurosci. 2025, 19, 1492225. [Google Scholar] [CrossRef] [PubMed]
- Bhoopathi, S.; Kumar, N.; Pal, M. Evaluating the performances of SVR and XGBoost for short-range forecasting of heatwaves across different temperature zones of India. Appl. Comput. Geosci. 2024, 24, 100204. [Google Scholar] [CrossRef]
- Wang, H.; Liang, Q.; Hancock, J.T.; Khoshgoftaar, T.M. Feature selection strategies: A comparative analysis of SHAP-value and importance-based methods. J. Big Data 2024, 11, 44. [Google Scholar] [CrossRef]
- Yamaguchi, K. Feature importance analysis in global manufacturing industry. Int. J. Trade Econ. Financ. 2022, 13, 28–35. [Google Scholar]
- Guo, X.; Chen, R.; Thomas, D.S.; Li, Q.; Xia, Z.; Pan, Z. Divergent processes and trends of desertification in Inner Mongolia and Mongolia. Land. Degrad. Dev. 2021, 32, 3684–3697. [Google Scholar] [CrossRef]
- Perşoiu, A.; Ionita, M.; Weiss, H. Atmospheric blocking induced by the strengthened Siberian High led to drying in west Asia during the 4.2 ka BP event–a hypothesis. Clim. Past. 2019, 15, 781–793. [Google Scholar] [CrossRef]
- Alzahrani, A.J.; Alghamdi, A.G.; Ibrahim, H.M. Assessment of Soil Loss Due to Wind Erosion and Dust Deposition: Implications for Sustainable Management in Arid Regions. Appl. Sci. 2024, 14, 10822. [Google Scholar] [CrossRef]
- Li, H.; Li, Z.; Chen, Y.; Xiang, Y.; Liu, Y.; Kayumba, P.M.; Li, X. Drylands face potential threat of robust drought in the CMIP6 SSPs scenarios. Environ. Res. Lett. 2021, 16, 114004. [Google Scholar] [CrossRef]
- Sun, C.; Feng, X.; Fu, B.; Ma, S. Desertification vulnerability under accelerated dryland expansion. Land. Degrad. Dev. 2023, 34, 1991–2004. [Google Scholar] [CrossRef]
- Riahi, K.; Van Vuuren, D.P.; Kriegler, E.; Edmonds, J.; O’neill, B.C.; Fujimori, S.; Bauer, N.; Calvin, K.; Dellink, R.; Fricko, O. The Shared Socioeconomic Pathways and their energy, land use, and greenhouse gas emissions implications: An overview. Glob. Environ. Change 2017, 42, 153–168. [Google Scholar] [CrossRef]
- Mao, D.; Wang, Z.; Wu, B.; Zeng, Y.; Luo, L.; Zhang, B. Land degradation and restoration in the arid and semiarid zones of China: Quantified evidence and implications from satellites. Land. Degrad. Dev. 2018, 29, 3841–3851. [Google Scholar] [CrossRef]
- Li, T. Sustainable Development and Management of Ecosystem in Arid and Semi-Arid Areas: A Focus on the Qinghai-Tibet Plateau and Inner Mongolian Grasslands. Ph.D. Thesis, Griffith University, Brisbane, Australia, 2024. [Google Scholar]
- Amissah-Arthur, A.; Mougenot, B.; Loireau, M. Assessing farmland dynamics and land degradation on Sahelian landscapes using remotely sensed and socioeconomic data. Int. J. Geogr. Inf. Sci. 2000, 14, 583–599. [Google Scholar] [CrossRef]
- Jiang, Z.; Ni, X.; Xing, M. A study on spatial and temporal dynamic changes of desertification in northern China from 2000 to 2020. Remote Sens. 2023, 15, 1368. [Google Scholar] [CrossRef]
Disclaimer/Publisher’s Note: The statements, opinions and data contained in all publications are solely those of the individual author(s) and contributor(s) and not of MDPI and/or the editor(s). MDPI and/or the editor(s) disclaim responsibility for any injury to people or property resulting from any ideas, methods, instructions or products referred to in the content. |
© 2025 by the authors. Licensee MDPI, Basel, Switzerland. This article is an open access article distributed under the terms and conditions of the Creative Commons Attribution (CC BY) license (https://creativecommons.org/licenses/by/4.0/).