Article

InSAR Inversion of the Source Mechanism of the 23 January 2024 Xinjiang Wushi Mw7.0 Earthquake

National Institute of Natural Hazards, Ministry of Emergency Management of China, Beijing 100086, China
*
Author to whom correspondence should be addressed.
Remote Sens. 2025, 17(14), 2435; https://doi.org/10.3390/rs17142435
Submission received: 18 June 2025 / Revised: 10 July 2025 / Accepted: 10 July 2025 / Published: 14 July 2025

Abstract

The Mw7.0 earthquake that occurred on 23 January 2024, in Wushi County, Xinjiang, China, was centered on the Maidan fault, located at the rear edge of the Kalpin reverse-thrust system in the southwestern Tianshan Mountains, at a depth of 13 km. This event caused significant surface deformation and triggered a series of secondary geologic hazards. In this study, data from two satellites, Sentinel-1A and LuTan-1, were combined to obtain the coseismic deformation field of the earthquake. The two-step inversion method was applied to determine the geometrical parameters and slip characteristics of the mainshock fault. The results indicate that the seismicity is primarily driven by reverse faulting, with a contribution from sinistral strike–slip faulting, and the maximum dip–slip displacement is 4.2 m. Additionally, an aftershock of magnitude 5.7 occurring on January 30 was identified in the LT-1 data. This aftershock was controlled by a reverse fault dipping opposite to the mainshock fault, and its maximum slip is 0.65 m. Analysis of the Coulomb stress triggering effect suggests that the Wushi earthquake may have induced the aftershock.

1. Introduction

On 23 January 2024, a magnitude-7.0 earthquake struck Wushi County in the Aksu Region of Xinjiang (41.26°N, 78.63°E). The tremor also impacted Kalpin and Akqi counties, resulting in varying degrees of structural damage and casualties. Notably, this earthquake marked the largest seismic event recorded in the Tianshan seismic belt since the 1992 Suusamyr earthquake (magnitude 7.3) in Kyrgyzstan. According to the United States Geological Survey (USGS), within one month of the initial quake, 55 aftershocks with magnitudes of 4.5 or greater occurred, including 12 aftershocks with magnitudes of 5.0 or higher. The most significant of these was a magnitude-5.8 aftershock. Subsequently, the aftershock zone extended approximately 62 km, primarily in a north-easterly direction, and was located within the basin–mountains interface. This region experienced secondary geological hazards, including slope destabilization, rockfalls, and rock rolls, which were concentrated along the tectonic trend. Most of these seismic events occurred within 30 km on either side of the epicenter [1,2]. As shown in Table 1 [3,4,5,6,7], various research organizations and studies, including this study, have derived solutions for the seismic source mechanisms, revealing that the faults resulting from this earthquake primarily strike from ENE to WSW, with reverse and sinistral strike–slip characteristics. The depths range from 6 to 15 km, indicating that this event was a shallow-focus earthquake. The estimated fault dip (45° to 67°), strike (229° to 236°), and rake (42° to 60°) also vary among different studies, which may be attributed to differences in the data, methodologies, and modeling approaches employed. Through a comprehensive analysis of the Wushi earthquake and its aftershocks, we can enhance our understanding of the tectonic characteristics of the Tianshan seismic belt. As a result, such deeper understanding will provide a scientific basis for assessing the potential for future seismic events.
In this study, the data are derived from the Sentinel-1 satellite and LuTan-1 (LT-1) satellite. The interferometric synthetic aperture radar (InSAR) surface deformation field of the 2024 Wushi Mw 7.0 earthquake is effectively obtained by utilizing both ascending and descending orbit images from the Sentinel-1 and LT-1 satellites. The feasibility of the LT-1 data in the seismic industry has been demonstrated in most earthquakes [8,9]. The long wavelength of the L-band renders it more stable for monitoring surface deformation in comparison to Sentinel-1 data, and its high accuracy and coherence can more accurately capture the details of surface deformation, which is crucial for providing reliable deformation data. The joint utilization of Sentinel-1 and LT-1 data for inversion allows for the combination of the advantages inherent in both data types with regard to temporal and spatial resolution. This approach leverages the strengths of both data sources, enriching the observation set and providing more comprehensive information for seismic deformation analysis. The combination of these advantages enriches the observation data and provides more comprehensive information for the seismic deformation analysis. Subsequently, using the dislocation model in a uniform elastic half-space, the geometric parameters of the faults and the coseismic slip distribution characteristics of the earthquake are inverted. Additionally, an inversion analysis can be conducted for the aftershocks observed in the LT-1 data. Finally, based on the fault slip distribution model obtained in this study, the Coulomb stress changes caused by the mainshock on the observed aftershocks are calculated and the influence of the mainshock on the stress state of the faults associated with the aftershocks is analyzed.

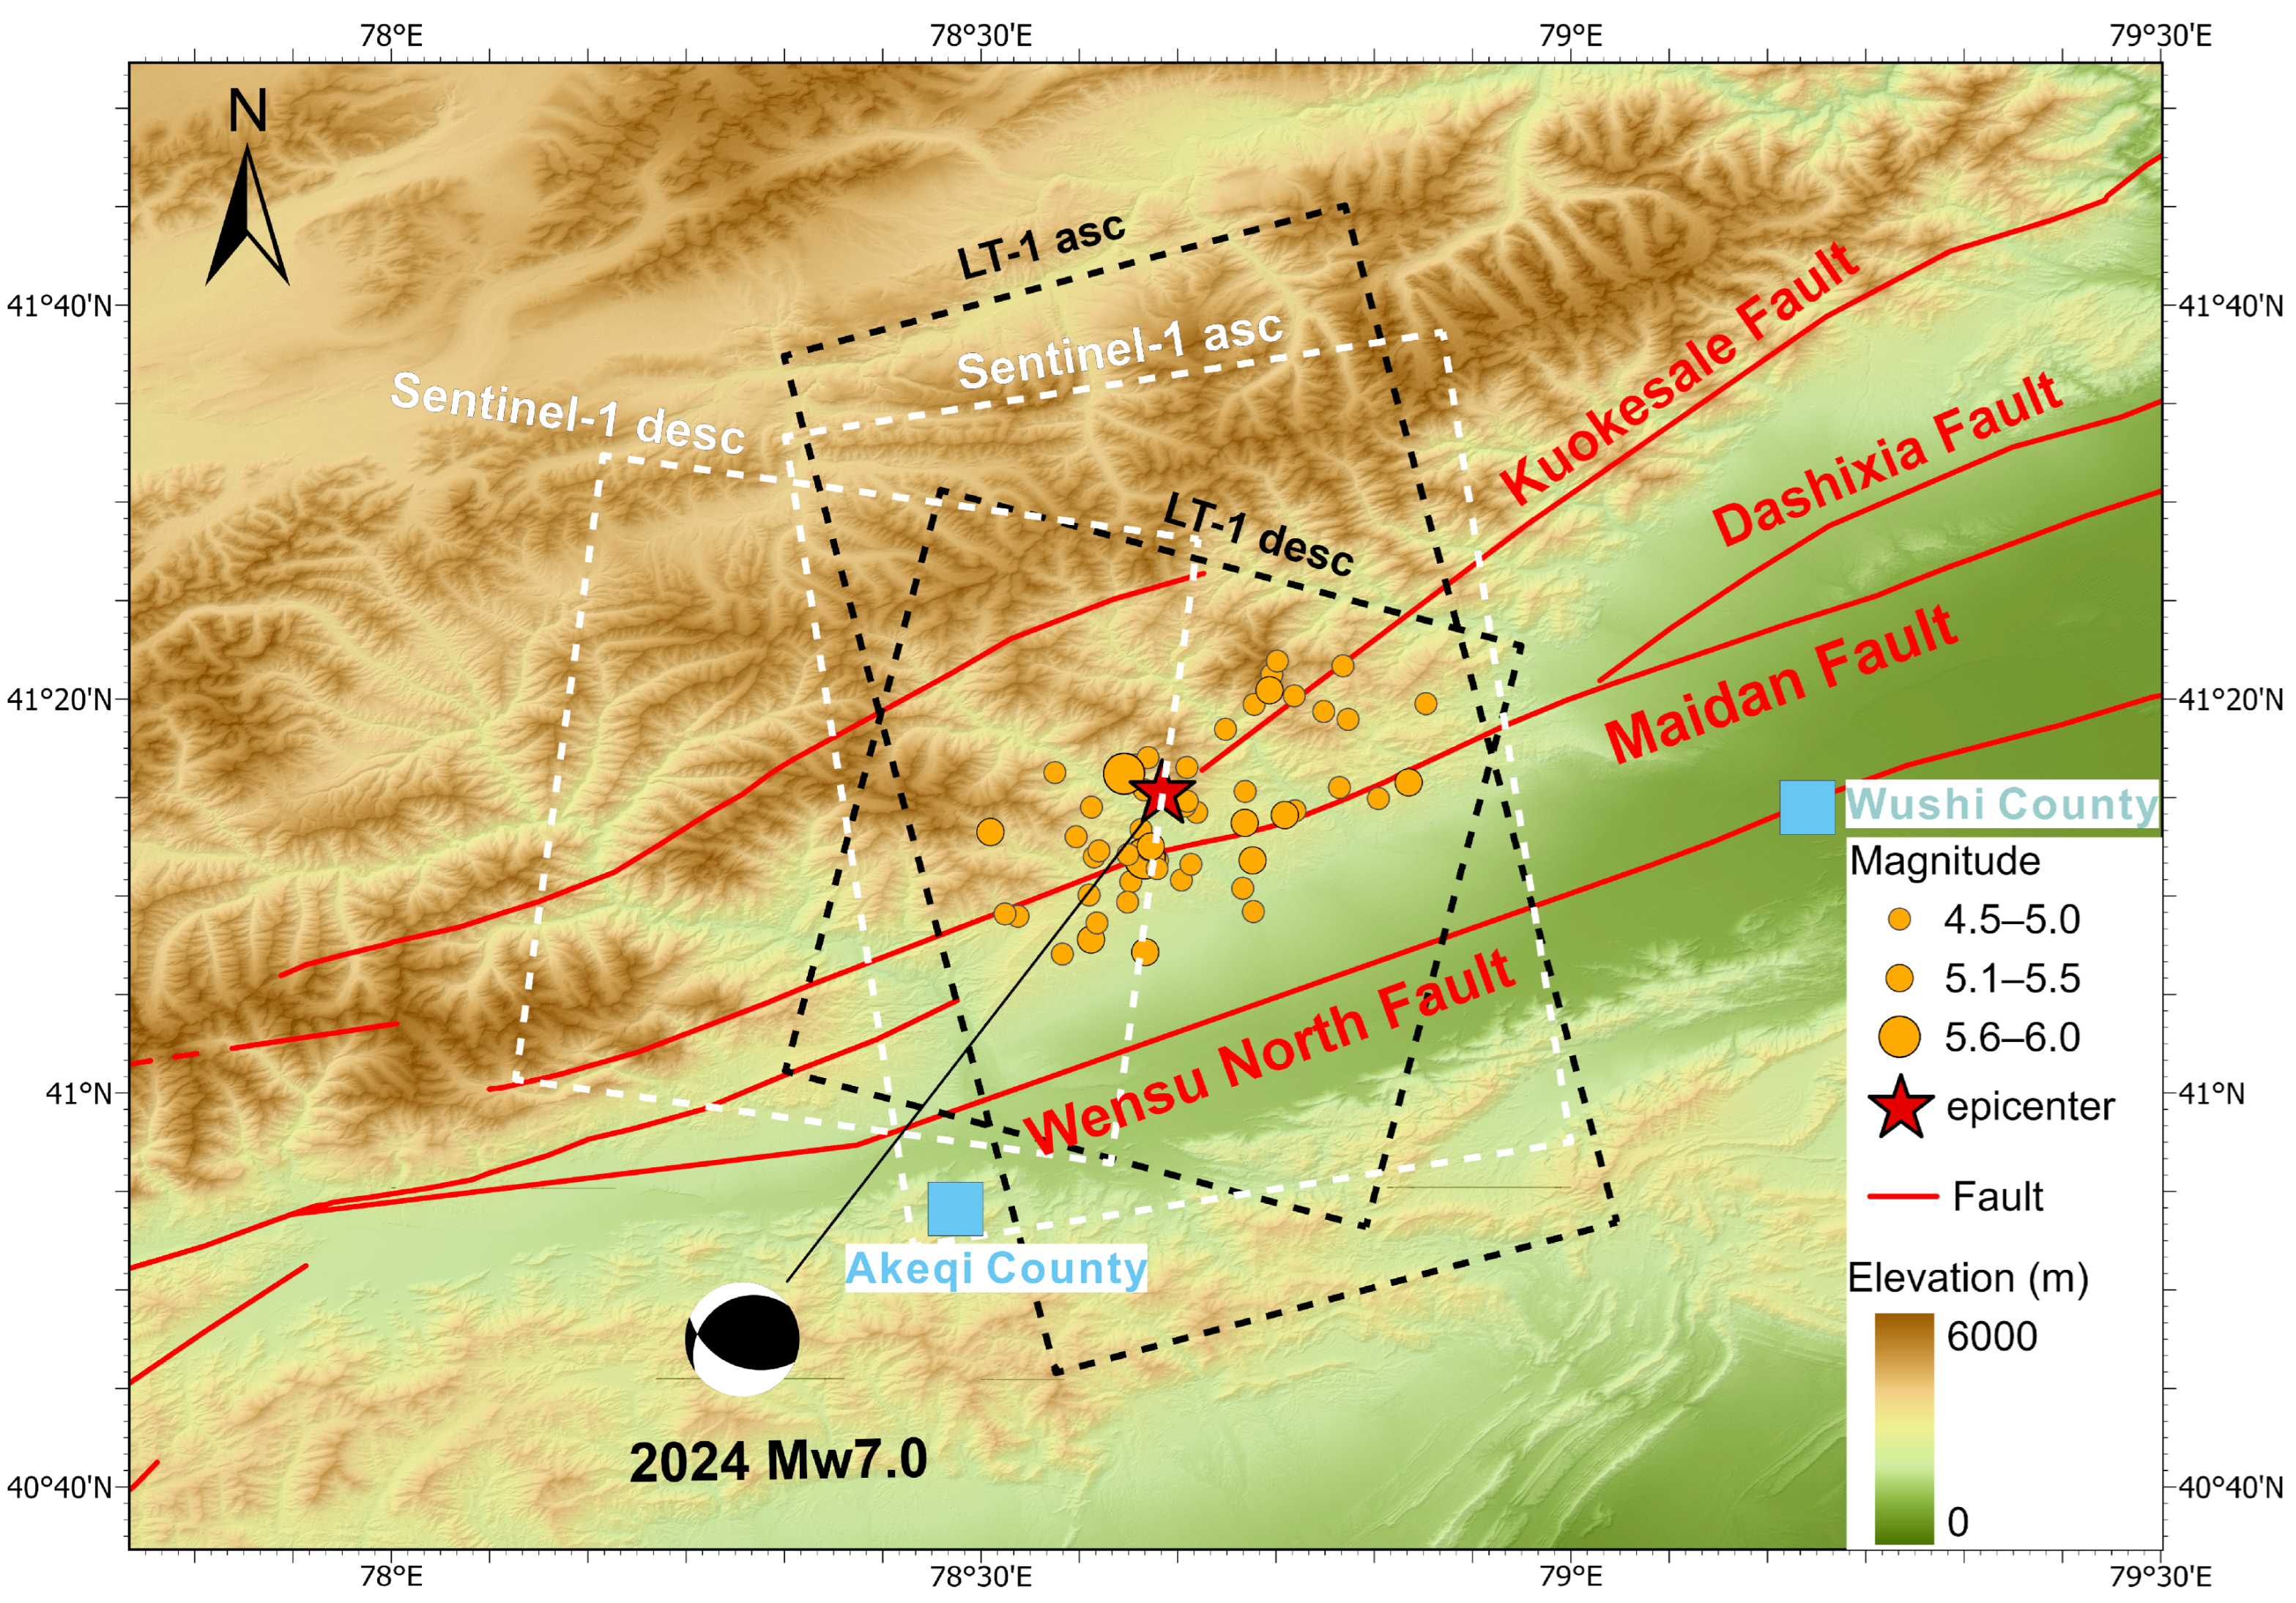
2. Tectonic Background

The Wushi Mw 7.0 earthquake occurred along the root fault of the Kalpin reverse-thrust system in the southwest Tianshan orogeny, with the Maidan fault, a significant reverse fault located in the Wushi region of Xinjiang, being the closest to the epicenter (Figure 1).
The Tianshan orogeny is considered the youngest intra-terrestrial orogenic belt. Since the Cenozoic era, the Tianshan orogeny has experienced significant tectonic deformation, with pronounced deformation in the west and relatively less intense deformation in the east. The entire southwest Tianshan region is characterized by three primary NEE-oriented faults and numerous secondary tectonic structures. All three primary faults are reverse and sinistral strike–slip [10].
The Kalpin reverse-thrust system is located at the leading edge of the southwest Tianshan orogenic belt, which is the region’s strongest thrust–fold deformation zone. Since the Cenozoic, the collision between the Indian and Eurasian plates has generated stress transfer, mantle convection, and crustal deformation. Significant uplift and deformation have occurred in the Tianshan orogenic belt due to crustal shortening. The deformation is primarily concentrated in five to six Mesozoic-to-Cenozoic fold belts, with some recurrent folds identified along the mountain front [11,12,13]. The tectonic deformation in the region is primarily driven by horizontal extrusion in the NW to SE direction, with some horizontal extension in the NE to SW direction. This results in regional tectonics being dominated by reverse faulting. Additionally, the accumulation of crustal stress has caused the southwest Tianshan to exhibit characteristics of sinistral strike–slip. The slip movement is mainly concentrated along the Maidan fault, which forms the boundary between the Tianshan and the Tarim Basin. The slip rate along the Maidan fault is estimated to be 2.3 ± 1.1 mm/a in the western section and 1.8 ± 1.7 mm/a in the eastern part of the Akqi Valley [10,14]. At this site, a confluence of NE-striking and NW-striking faults is observed, highlighting the complex nature of tectonic activity in the region. The front of the Kalpin thrust system experiences frequent and concentrated seismic activity, predominantly characterized by moderate earthquakes with magnitudes ranging from 5.5 to 7.0. In contrast, seismic activity along the root faults is less documented, with relatively few moderate-intensity earthquakes observed. This contrasts with the seismicity observed along the Tianshan and thrust system front, where earthquake magnitudes are generally smaller compared to other regions [15,16].
The Maidan fault is the root fault within the Kalpin reverse-thrust system, located adjacent to the Atushi thrust body to the west and the Kalpin thrust body to the east. It originates from the Talas–Fergana fault zone in the west and extends eastward through the Maidan, Akqi, and Wushi sections. The Maidan fault strikes NE, with the eastern section adopting a nearly NEE strike, and it has a total length of approximately 400 km. The fault is composed of multiple secondary faults, with a maximum width of 15–17 km. The fault surface exhibits a northwestward orientation, with dips ranging from 30° to 80° [17,18]. The high-angle reverse Maidan fault plays a crucial role in the redistribution of strain within the southwest Tianshan front, effectively absorbing the left-lateral shear stress generated by the oblique subduction of the Tarim plate. The interseismic deformation of the Kalpin thrust system is primarily tectonically occluded at the root, with the Maidan fault being locked at a significant depth of approximately 13.4 km [10,19].

3. InSAR Coseismic Deformation

3.1. InSAR Data and Methodology

The satellite data utilized in this study are derived from the European Space Agency’s (ESA) Sentinel-1 and China’s LT-1. Sentinel-1 carries C-band Synthetic Aperture Radar (SAR), which has wide-range imaging capabilities and effectively captures surface deformation over large areas. In contrast, the LT-1 satellite, launched in 2022, is equipped with L-band multi-polarized SAR and offers a spatial resolution ranging from 3 to 30 m. Its six imaging modes and a shorter revisit period of 8 days for single-star tracks and 4 days for dual-star configurations make it particularly effective for emergency monitoring of coseismic deformation during earthquakes [9].
To acquire the coseismic deformation field of the 2024 Wushi earthquake, both ascending and descending track data from Sentinel-1 (T56, T34) and LT-1 were utilized. The processing of these data involved using the ASTER GDEM V3 Global Digital Elevation Model [20] with a 30 m resolution to effectively reduce the impact of terrain-induced phase errors on interferometric measurements. In the interferometric processing, due to the inherent imaging characteristics of SAR systems, the azimuth resolution was substantially higher than the range resolution. To improve the signal-to-noise ratio (SNR) of the Sentinel-1 SAR imagery, a multi-look processing scheme with a ratio of 10:2 was employed, corresponding to averaging over 10 looks in the azimuth direction and 2 looks in the range direction. The phase unwrapping process utilized the minimum cost flow (MCF) method [21] to address phase jumps and noise interference, ensuring accurate and reliable results. To correct for atmospheric phase delays, the InSAR Generalized Atmospheric Correction Online Service (GACOS) [22,23] was employed, mitigating both tropospheric and terrain-related delays. After these steps were implemented, potential errors were minimized, resulting in the final high-precision coseismic deformation field. This dataset provided the essential information for the subsequent inversion of fault slip distribution and seismic mechanism analysis.

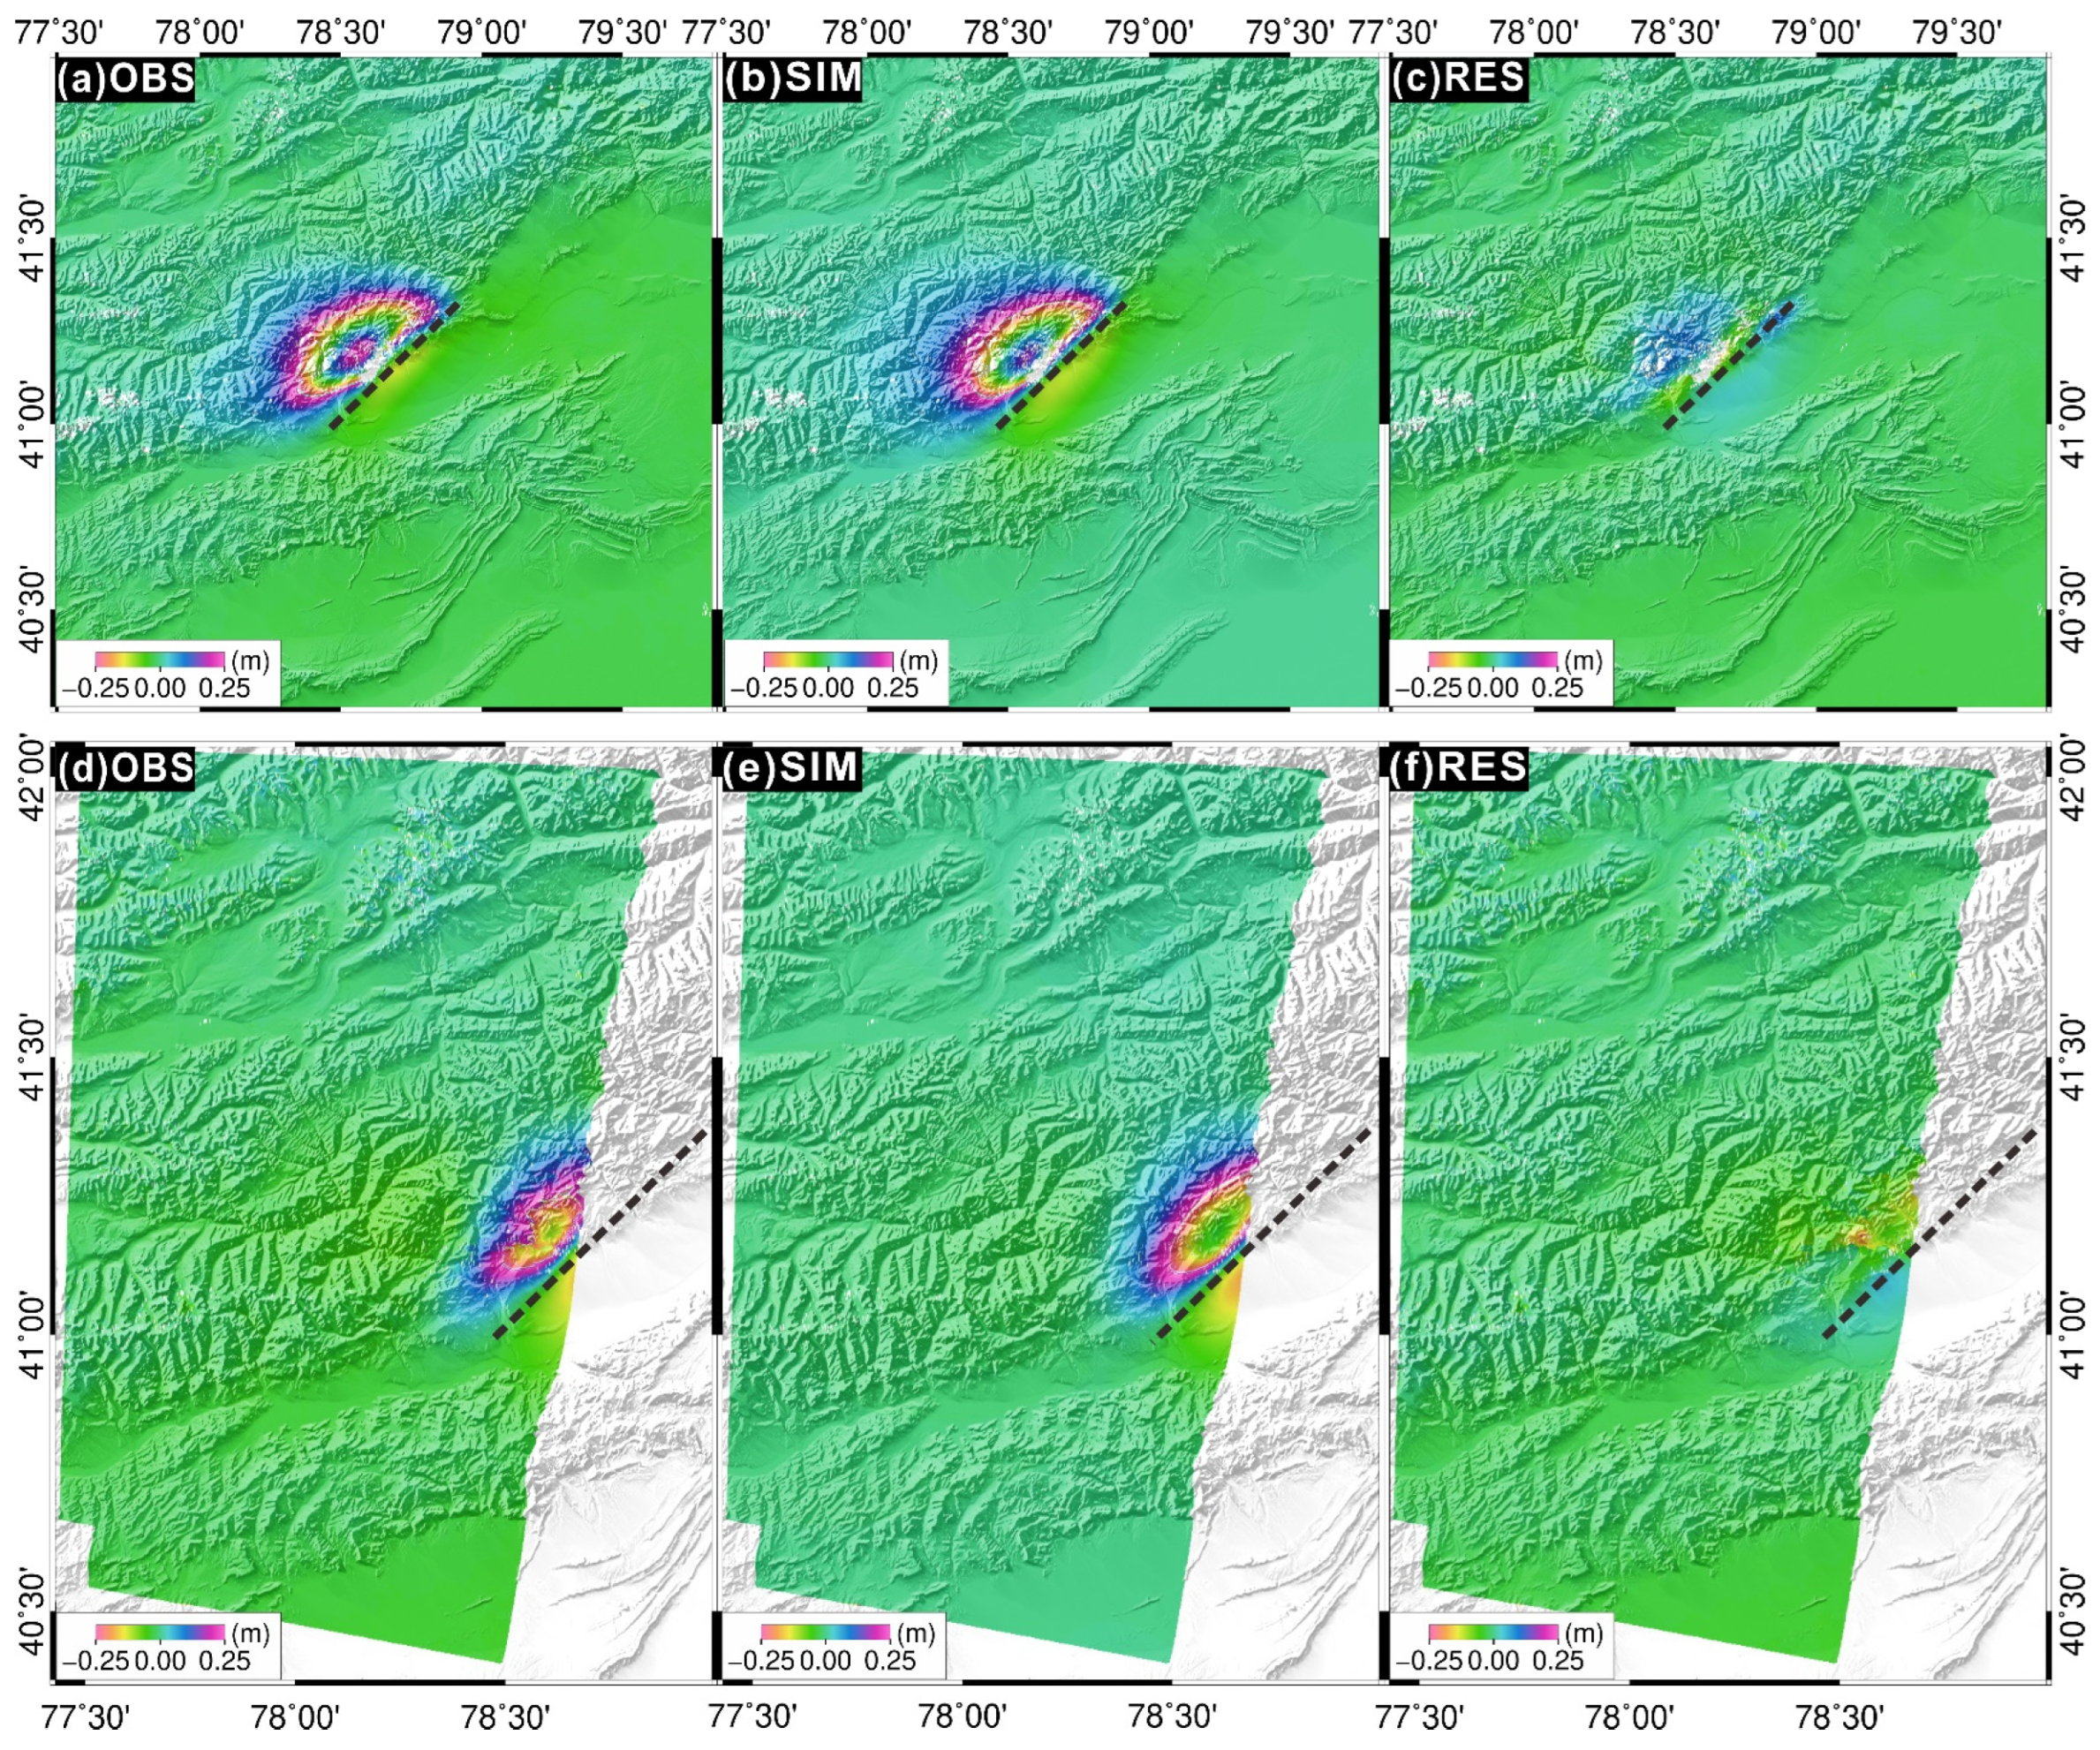
3.2. Characterization of the Coseismic Deformation

The Wushi region is characterized by an arid climate, with minimal precipitation, and is predominantly covered by deserts and Gobi landscapes. This topography leads to sparse vegetation, which contributes to the generation of interferograms with high coherence, thereby facilitating the identification of fault rupture zones on the surface. As a result, the distribution of fault rupture zones on the surface can be readily determined. A comparison of the spatial distribution of the coseismic deformation field derived from the two satellite platforms (Figure 2) reveals a high degree of similarity in the deformation patterns observed from both platforms. The primary coseismic deformation area is concentrated along the Maidan fault, forming a significant deformation zone that aligns with the rupture strike. A subelliptical surface uplift zone can be observed to the north of the fault, with the deformation gradient gradually weakening toward the periphery. Additionally, the descending data reveal a slight secondary elliptical subsidence deformation to the south of the rupture, which is asymmetrically distributed relative to the uplift zone. The spatial disparity between the northern region of the interferogram, characterized by dense striations, and the southern region, marked by sparse striations, reflects the distinct motion characteristics of the upper and lower sections of the rupture. This observation further supports the hypothesis that the earthquake is a composite rupture event, primarily driven by retrograde action and characterized by sinistral strike–slip motion. The maximum line-of-sight (LOS) displacement for Sentinel-1 ascending data is approximately 0.74 m, while for descending data, it is approximately 0.41 m. Similarly, for LT-1 ascending data, the maximum LOS displacement is approximately 1.1 m, and for descending data, it is approximately 0.84 m. A comparison of the Sentinel-1 and LT-1 data reveals that each of them has its own characteristics in coseismic deformation monitoring. Sentinel-1 provides a broader and more uniform spatial coverage, but with lower resolution. In contrast, the LT-1 has a narrower observational range than Sentinel-1, but the final results of the LT-1 data show a larger maximum apparent displacement, which clearly captures deformation details. Moreover, benefiting from its longer temporal coverage, a distinct aftershock-related deformation signal can be clearly identified in the displacement field. This particular aftershock will be further analyzed and discussed in the following sections.

4. Rupture Parameter Inversion and Coulomb Stress Calculation

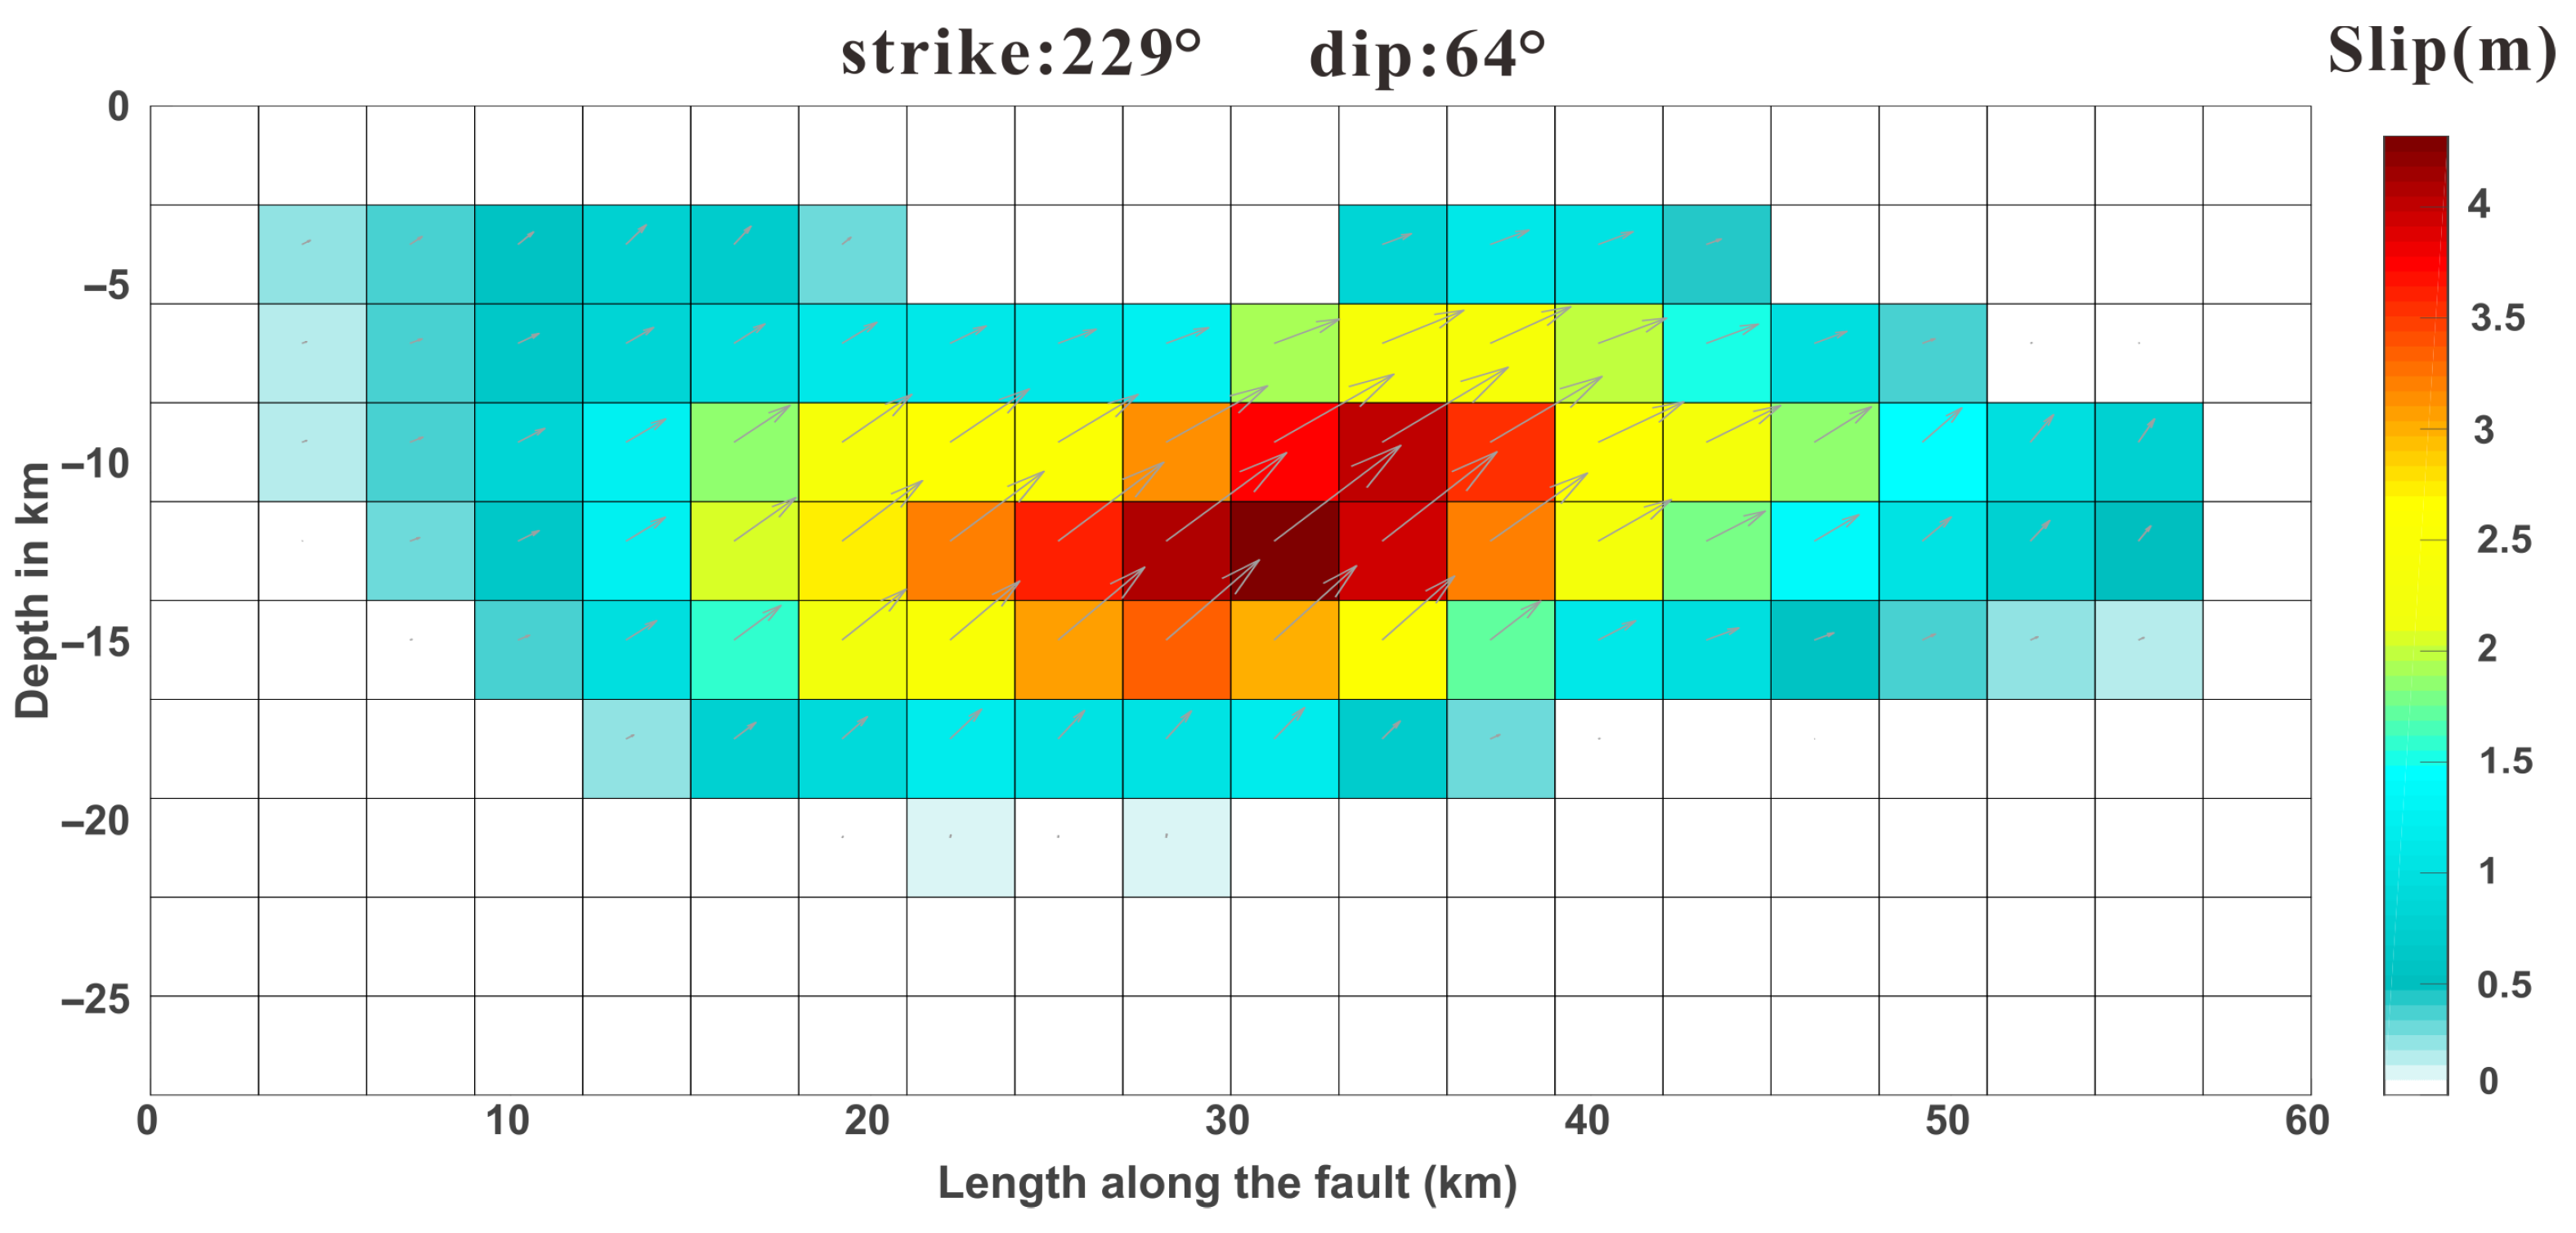
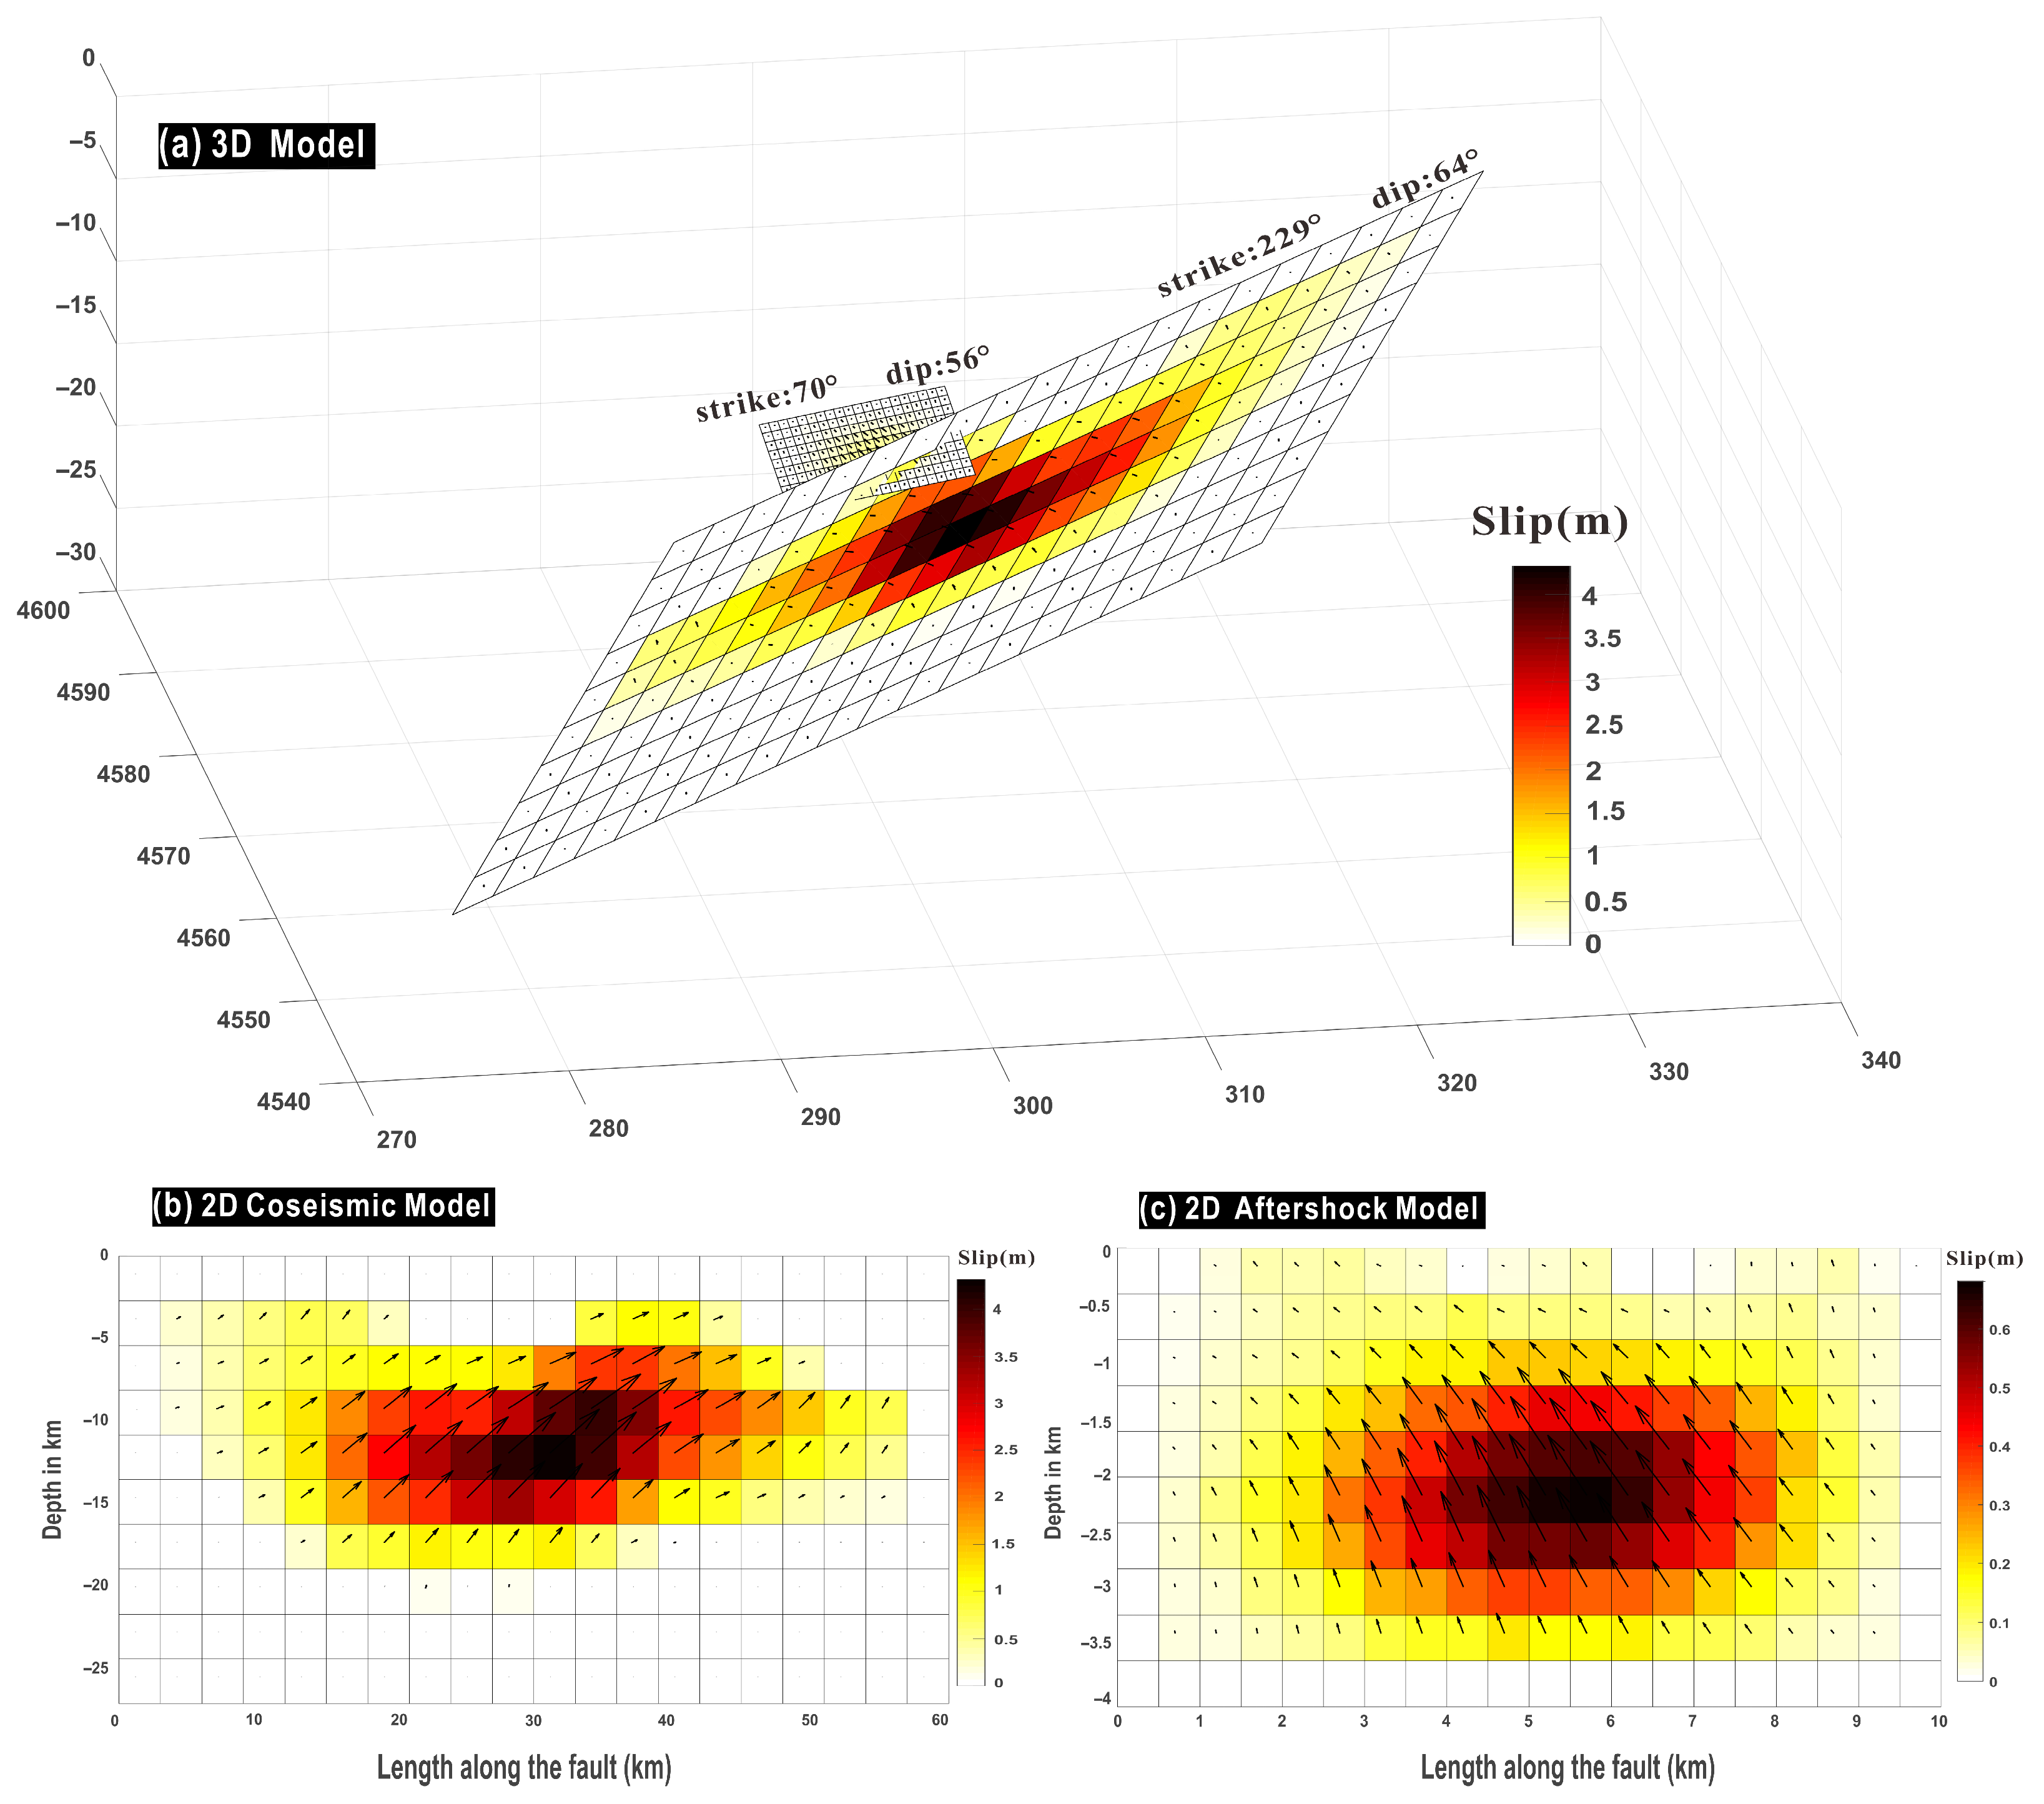
4.1. Coseismic Inversion

In this paper, the coseismic surface deformation interferograms of the Wushi earthquake, derived from Sentinel-1 and LT-1 satellite data, are utilized as constraints for inversion. The geometric parameters of the fault rupture are initially determined using the Sentinel-1 data, and the LT-1 data are then introduced to assist in delineating the spatial distribution of seismic slip. Initially, the InSAR deformation interferogram is processed and then downsampled using a quadtree method [24,25], constrained by the resolution of the data. In the downsampled interferogram, areas exhibiting significant surface deformation show pronounced changes in the deformation gradient, while regions at greater distances with less deformation display relatively smaller gradient variations. This approach ensures the accuracy of the inversion while effectively reducing the computational burden in subsequent steps.
The present study employs a two-step inversion method to estimate the geometric parameters of fault rupture and dip–slip distribution. In the first step, the spatial geometric parameters of the fault are derived using a uniform fault model, assuming that the earthquake is caused by dip–slip on a single fault plane. In the second step, a distributed fault model is applied, based on the uniform fault model, to estimate the amount of distributed slip along the fault plane. For the inversion process, PSOKINV4.5 software is used [26] to estimate the geometric parameters of the fault rupture and dip–slip distribution through an improved stochastic search particle method. The particle swarm optimization (PSO) algorithm, an iterative optimization technique, is based on a group of stochastic solutions that are initially set randomly to perform a global search within the model space. Through an iterative process, the PSO algorithm refines the candidate solutions to find the optimal one.
The primary objective of the inversion using the uniform fault model is to determine the location (latitude and longitude), depth, strike, dip, and other geometric parameters of the fault. By utilizing the Okada elastic dislocation model [27], the PSO nonlinear optimization algorithm automatically compares the simulation results and searches for the optimal parameters. Specifically, it identifies the solution that minimizes the fitness function within the entire parameter domain. The fitness function used in this study is defined as follows:
σ = W D G S 2 N
where the coefficient matrix G represents the surface motion response induced by 1 m of dip–slip on the homogeneous fault. S denotes the dip–slip vector, W represents the relative weight of each dataset, D refers to the observed surface deformation values, and N is the number of deformation observations. Using the Sentinel-1 ascending and descending track coseismic deformation fields as constraint data, the PSO method is employed to determine the optimal fitting fault parameters. These parameters are derived based on the homogeneous fault model located at (78.71°E, 41.20°N), with the fault’s length being 34.9 km, a width of 7.7 km, a strike of 229°, a dip of 64.63°, and a slip angle of 30°.
The spatial distribution of seismic slip is further determined using the uniform fault model, followed by the application of the distributed fault model. The uniform rectangular fault model from the previous step is extended to 60 km along the strike and 30 km in the width of the trend direction. During the inversion process, the size of the discrete subfaults is set to 3 km × 3 km, a configuration that is both computationally efficient and aligned with the requirements of observation. To reduce excessive jitter in the slip between subfault blocks, the quadratic difference Laplace operator is commonly employed to constrain the sliding roughness [28]. The fundamental relationship is expressed as follows:
G δ α 2 L S = D 0
where L denotes the second-order differential operator for evaluating sliding roughness, α2 represents the smoothing factor, Gδ denotes the theoretical displacement field with a dip angle of δ, calculated from the elastic dislocation theory, S represents the dip–slip vector of each subfault, and D indicates the deformation observation. In this study, the trends of model roughness and residuals are analyzed by fixing different values of dip and adjusting varying smoothing coefficients. The dip angle is tested within a range of 45° to 75°, and to improve the accuracy of the distributed-slip inversion, the dip angle is further optimized using ABIC (Akaike’s Bayesian Information Criterion) within a range of 45° to 75°, with 5° increments [29,30]. Following the determination of the approximate range, in 1° increments, the smoothing coefficient α2 ranges from 1.1 to 10.1. It was determined that the dip angle is 64°, as illustrated in Figure 3.

4.2. Coseismic Inversion Results

The inversion of the source mechanism of the 2024 Wushi Mw7.0 earthquake reveals that the Wushi earthquake was predominantly a thrust earthquake with a sinistral strike–slip component. The rupture zone is 30 km in length and 15 km in width, with slip occurring primarily within a depth range of 10 to 15 km. The maximum slip, approximately 4.2 m, is observed at a depth of 13 km beneath the surface. The InSAR coseismic deformation field indicates that the observed data may also incorporate postseismic deformation signals, as well as the influence of strong aftershocks (see Figure 4 and Figure 5). This introduces a slight deviation in the inversion results for dip–slip. However, as shown in Figure 4 and Figure 5, the root mean square (RMS) of the residuals for both ascending and descending orbits is consistently one order of magnitude smaller than that of the InSAR observations. This observation further substantiates the reliability of the inversion results. Due to the broader temporal coverage of LT-1 (from 7 January to 4 February), an additional discernible deformation signal is observed in panels c and f of Figure 5 (41.2°N, 78.6°E). This signal is speculated to be potentially associated with the significant 5.7-magnitude aftershock that occurred on 30 January, based on the combination of the imaging time difference, geographic location, and the earthquake’s magnitude.

4.3. Aftershock Deformation and Inversion

The source mechanism solution provided by the USGS indicates that the 5.7-magnitude aftershock on 30 January had a strike of 221° for Nodal Plane 1, a dip of 35°, and a rake of 66°. For Nodal Plane 2, the parameters were a strike of 69°, a dip of 59°, and a rake of 106°.
Given the broader temporal coverage and enhanced information content provided by the LT-1 data in capturing aftershock activity, which is essential for the detailed study of aftershock sequences, this study employs Sentinel-1 ascending track imagery to capture the aftershock deformation field of the 2024 Wushi earthquake (from 25 January to 7 February) and specifically analyzes the deformation associated with the magnitude-5.7 aftershock that occurred on 30 January. In this analysis, the same processing methodology described in Section 3.1 is applied to obtain the deformation field corresponding to the aftershocks. The subsequent analysis of the aftershock deformation field reveals the following key findings: the maximum line-of-sight (LOS) uplift recorded by the Sentinel-1 ascending track data is approximately 0.35 m, while the observed line-of-sight subsidence is approximately 0.17 m. Based on these observations, it is hypothesized that the fault segment responsible for the aftershock is a branch of the primary fault that triggered the mainshock, with the forward-extending fault formed under the continued thrusting motion of the Maidan fault [5].
In the aftershock inversion study, the two-step inversion methodology previously applied is adapted for the estimation of the aftershock fault slip distribution, using ascending orbit data from Sentinel-1 as the primary data source. For this aftershock, the fault length is defined as 10 km, and the dip-direction width is set to 5 km. The size of the discrete subfaults in the inversion process is selected as 0.5 km × 0.5 km to ensure a more refined and accurate characterization of the slip distribution across the fault plane.
The final results, shown in Figure 6 and Figure 7, reveal that the fault exhibits a strike of 70°, an optimal dip of 56°, a rake of 110°, and a rupture area measuring 5.5 km in length and 2 km in width. The slip is predominantly distributed between depths of 1.5 km and 3.5 km, with the maximum slip occurring at a depth of 2.25 km, reaching 0.65 m. In summary, the aftershock was predominantly characterized by an inverse rupture, exhibiting a tendency opposite to that of the mainshock-generating faults. Analysis of the Sentinel-1 inversion results reveals signs of partial surface exposure. This, when combined with the geographic location, suggests that the rupture likely occurred in the western part of the Chalmati Valley. This is consistent with the surface rupture data identified by Zhang et al. [2] during field investigations.

4.4. Coseismic Coulomb Stress Changes in the Wushi Earthquake

This paper further explores the seismic hazard and the possible relationship between mainshocks and aftershocks through the Coulomb stress change (∆CFS) based on the study of fault slip distribution. Coulomb stress, which integrates normal and shear stresses along with pore fluid pressure, is an essential tool for assessing the potential for rock rupture along a fault plane. This approach is particularly useful in understanding how the distribution of fault slip may influence aftershock activity following a mainshock. According to the Coulomb rupture hypothesis, the change in Coulomb stress that drives a rock towards rupture is expressed as follows [31]:
CFS   =   τ +   μ σ n
where Δτ is the change in shear stress on the fault plane, which is positive along the fault slip direction; Δσn is the change in normal stress on the fault plane, which is tensile positive; and μ′ is the effective friction coefficient.
The maximum slip of the aftershock occurs at a depth of 2.25 km, which is critical for assessing the stress transfer from the mainshock to the aftershock sequence. To analyze the Coulomb stress changes from coseismic to aftershock events at this depth, this paper utilizes the PSGRN08/PSCMP08 software package [32]. The seismic rupture model was based on the results of InSAR deformation observation inversion.
As demonstrated in Figure 8, when μ′ is initially set to 0.4 based on empirical values, the maximum recorded Coulomb stress change is 0.596 × 10⁶ Pa. When examining the distribution of aftershocks with magnitudes greater than 4.5, it is evident that most aftershocks are concentrated in areas where the Coulomb stress change is notably high. Further analysis investigates the potential correlation between the Mw7.0 Wushi earthquake and the subsequent magnitude-5.7 earthquake. As shown in Table 2, calculations reveal that for μ′ values ranging from 0.2 to 0.8, the occurrence of the Mw7.0 earthquake causes fluctuations in the stress levels at the epicenter of the magnitude-5.7 aftershock ranging from 0.3 × 10⁶ Pa to 0.6 × 10⁶ Pa. The maximum observed stress increase is 0.5969 × 10⁶ Pa, suggesting a significant contribution of the Mw7.0 Wushi earthquake to the triggering of the magnitude-5.7 aftershock.

5. Discussion

5.1. Stability Analysis of Coulomb Stress Changes

According to Equation (3), the Coulomb stress change is influenced by the normal stress change, shear stress change, and the effective friction coefficient. The impact of the effective friction coefficient on Coulomb stress change must be carefully considered. This study examines how Coulomb stress change varies following the mainshock, with the effective friction coefficient (μ′) ranging from 0.2 to 0.8, focusing specifically on the mainshock’s influence on the aftershocks. Generally, μ′ values are higher for normal and reverse faults, reaching up to 0.8, while strike–slip faults tend to have lower values [33]. To assess the effect of different effective friction coefficients on Coulomb stress calculations, four values of μ′ (0.2, 0.4, 0.6, and 0.8) were selected. Coulomb stress changes at the epicenter of the magnitude-5.7 earthquake were then computed for each value (Figure 9).
The results indicate that the patterns of Coulomb stress changes are similar across different values of μ′ in the case of the coseismic rupture (Figure 9). The regions with positive Coulomb stress changes exhibit cross-distribution characteristics from NE to SW and NW to SE along the seismogenic faults.
However, as the effective friction coefficient (μ′) increases from 0.2 to 0.8, a gradual transition from positive to negative Coulomb stress change is observed in the northern part of the rupture surface, indicating significant spatial variability in the stress distribution. To further elucidate the underlying mechanisms, the coseismic changes in normal and shear stress components are examined. As illustrated in Figure 10, the Wushi earthquake induces pronounced opening shear along the northern segment of the rupture plane, resulting in a substantial reduction in coseismic shear stress and a concurrent increase in normal stress in this region. According to Equation (3), an increase in μ’ amplifies the contribution of normal stress to the Coulomb stress. Consequently, higher coseismic Coulomb stress is observed in specific northern areas when the friction coefficient is large. Moreover, both the mainshock and the magnitude-5.7 aftershock are associated with positive Coulomb stress changes, regardless of the assumed value of the friction coefficient.

5.2. Relationship Between the Mainshock and the 30 January Aftershock

Following a significant seismic event, the stress state within the source region can undergo considerable changes, which may substantially influence subsequent seismic activity along active faults in neighboring areas. These changes can either promote or delay the occurrence of subsequent earthquakes. In the case of the magnitude-5.7 aftershock on 30 January, positive Coulomb stress, normal stress, and shear stress changes were observed, as shown in Figure 8 and Figure 10. Positive values of normal stress change indicate tension between the fault surfaces, thereby increasing the likelihood of fault slip. Similarly, positive shear stress changes enhance the sliding tendency along the fault surfaces.
Lv et al. [34] provided a comprehensive overview of the extant research on aftershock models, meticulously categorizing them into two distinct dip directions: a one-fault model and a two-fault model. Subsequent to this, a detailed analysis was conducted on four specific aftershock models. The ensuing conclusion drawn by the researchers was that all models indicated that the coseismic deformation was predominantly characterized by slip along a reverse fault.
In this study, InSAR data are employed for inversion, with the aftershock modeled as a single-fault structure. The aftershock is identified as occurring on a NE-dipping splay fault. As shown in Figure 11, a three-dimensional geometric model of the coseismic and aftershock faults is reconstructed using the inversion method described in the preceding section. The spatial configuration of the two fault systems clearly reveals their structural relationship. The aftershock fault appears to branch from and develop along the influence zone of the mainshock fault. This geometric relationship facilitates the release of accumulated stress and induces the redistribution and adjustment of stress in the vicinity of the mainshock rupture. When combined with the previously calculated Coulomb stress changes, it can be observed that the aftershock region experienced a significant increase in Coulomb stress following the mainshock. This suggests that the mainshock triggered the occurrence of the aftershock at that depth. The coherence between the inversion results and the stress change analysis provides robust support for this interpretation.

5.3. The Wushi Earthquake and Tianshan Tectonics

While the mainshock did not rupture the ground surface, the aftershock was accompanied by surface-breaking features. This aftershock occurred on a branch fault of the mainshock fault, suggesting that rupture propagation progressed from deeper to shallower structural levels during the earthquake sequence. The initial release of energy along the deep-seated fault was followed by upward stress transfer, which subsequently activated overlying shallow faults and triggered aftershocks. This observation aligns with a structural model characterized by a deep-rooted main fault and multiple upper-level branch faults, underscoring the segmented rupture process within the Tianshan fault system [14,35].
The results of the Coulomb stress change analysis provide further evidence supporting this structural relationship. The stress released by the initial seismic event resulted in significant positive stress loading at the depth of the aftershock. Moreover, Coulomb stress changes remain a fundamental tool for assessing future seismic hazards. In the aftermath of the 2024 Wushi earthquake in Xinjiang, regions such as the Kuokesale fault and the northeastern segment of the Tuoshigan fault have experienced positive Coulomb stress changes, indicating ongoing stress accumulation. In the case of certain shallow branch faults, the future seismic hazard in these areas is expected to increase significantly. Alternatively, there exists an elevated potential for the triggering of shallow earthquakes. These regions therefore warrant continued monitoring and focused attention.

6. Conclusions

The Mw7.0 earthquake that occurred in Wushi, Xinjiang, on 23 January 2024, was located at the rear edge of the Kalpin thrust system within the Tianshan seismic belt, with the Maidan fault being the nearest fault. This study uses Sentinel-1 and LT-1 ascending and descending orbit data to derive seismic deformation maps for the coseismic events of the earthquake.
A two-step inversion strategy was employed to invert the coseismic and aftershock mechanisms of the Wushi earthquake, using InSAR deformation data as constraints. The results show that the fault parameters derived from the inversion exhibit a strong correlation with the observed data. The main rupture has a length of 34.9 km, a width of 7.7 km, a strike of 229°, an optimal dip angle of 64°, and a maximum dip–slip of 4.2 m, located at a depth of 13 km. The 5.7-magnitude aftershock, which occurred on 30 January, was inverted using the aftershock deformation map obtained from Sentinel-1. The aftershock was identified as a fault with a strike of 70°, an optimal dip of 56°, a maximum slip of 0.65 m, and a branching reverse fault with the fault that originated from the mainshock. For the magnitude-5.7 aftershock that occurred on 30 January, the mainshock induced significant changes in the local stress field. The calculated increases in Coulomb stress, normal stress, and shear stress were all positive, suggesting that the aftershock was likely promoted or triggered by the mainshock.
By analyzing the Wushi earthquake and a subsequent strong aftershock, this study reveals the potential segmented rupture behavior of the Maidan fault within the tectonic framework of the Tianshan region. These findings provide insights into the mainshock–aftershock triggering mechanism and offer a basis for assessing future seismic hazards.

Author Contributions

Conceptualization, Y.L. (Yongsheng Li) and M.J.; methodology, Y.L. (Yongsheng Li) and M.J.; software, Y.L. (Yongsheng Li) and M.J.; validation, Y.L. (Yongsheng Li), Y.L. (Yujiang Li) and M.J.; formal analysis, Y.L. (Yujiang Li) and M.J.; investigation, M.J.; resources, M.J.; data curation, M.J.; writing—original draft preparation, M.J.; writing—review and editing, Y.L. (Yongsheng Li) and Y.L. (Yujiang Li); visualization, M.J.; supervision, Y.L. (Yongsheng Li); project administration, Y.L. (Yongsheng Li); funding acquisition, Y.L. (Yongsheng Li). All authors have read and agreed to the published version of the manuscript.

Funding

This research was funded by the National Science Foundation of China under Grant (grant number 42374039), Basic Research Projects of the National Institute of Natural Hazards, Ministry of Emergency Management of China (ZDJ2024-18).

Data Availability Statement

The Sentinel-1 data used in this study were downloads from the Alaska Satellite Facility https://search.asf.alaska.edu/#/ (accessed on 12 December 2024).

Acknowledgments

The authors would like to thank the European Space Agency and the Alaska Satellite Facility for providing the Sentinel-1 data. We also appreciate the constructive feedback offered by the anonymous reviewers.

Conflicts of Interest

The authors declare no conflicts of interest.

References

  1. Zhang, Z.; Fang, L.H.; Chen, K.; Liu, R.F.; Wang, Y.Z.; Guo, X.Y. Quick Output Parameters Related to the 23 January 2024 MS7.1 Wushi Earthquake in the Aksu Region of Xinjiang. Prog. Earthq. Sci. 2024, 54, 221–228. [Google Scholar]
  2. Zhang, B.X.; Qian, L.; Li, T.; Chen, J.; Xu, J.H.; Yao, Y.; Fang, L.H.; Xie, C.; Chen, J.B.; Liu, G.H.; et al. Geological Disasters and Surface Ruptures of January 23, 2024 MS7.1 Wushi Earthquake, Xinjiang, China. Seismol. Geol. 2024, 46, 220–234. [Google Scholar]
  3. Nai, Y.H.; Han, B.Q.; Liu, Z.J.; Li, Z.H.; Song, C.; Yu, C.; Li, S.J.; Peng, J.B. Coseismic Surface Displacements and Source Model of the 2024 Mw7.0 Wushi (Xinjiang, China) Earthquake Revealed by InSAR Observations. Geomat. Inf. Sci. Wuhan Univ. 2024, 50, 368–376. [Google Scholar]
  4. Zhao, L.; Chen, Z.D.; Xie, L.; Zhu, Z.; Xu, W. Coseismic deformation and slip model of the 2024 MW7.0 Wushi earthquake obtained from InSAR observation. Rev. Geophys. Planet. Phys. 2024, 55, 453–460. [Google Scholar]
  5. Yu, S.Y.; Li, Z.J.; Zhao, P.; Luo, J.J. Source Parameters and Seismogenic Fault Model of the 2024 Mw7.0 Wushi (Xinjiang, China) Earthquake Revealed by InSAR Observations. Pure Appl. Geophys. 2024, 182, 1149–1162. [Google Scholar] [CrossRef]
  6. Ding, Y.R.; Liu, X.; Dai, X.F.; Yin, G.Y.; Yang, Y.; Guo, J.Y. D-InSAR-Based Analysis of Slip Distribution and Coulomb Stress Implications from the 2024 Mw7.01 Wushi Earthquake. Remote Sens. 2024, 16, 4319. [Google Scholar] [CrossRef]
  7. Famiglietti, N.A.; Cheloni, D.; Caputo, R.; Vicari, A. Geodetic model of the 2024 January 22 Mw 7.0 Wushi (northwestern China) earthquake and Mw 5.7 aftershock from inversion of InSAR data. Geophys. J. Int. 2025, 241, 941–953. [Google Scholar] [CrossRef]
  8. Zhang, X.; Tang, X.M.; Li, T.; Zhao, H. Turkey-Syria Mw 7.8 Earthquake Deformation Monitoring Using Lutan-1 SAR Data. In Proceedings of the Photonics Electromagnetics Research Symposium (PIERS), Chengdu, China, 15 January 2024. [Google Scholar]
  9. Li, Y.S.; Li, Q.; Jiao, Q.S.; Jiang, W.L.; LI, B.Q.; Zhang, J.F.; Luo, Y. Application of Lutan-1 SAR Satellite Constellation to Earthquake Industry and Its Prospect. Geomat. Inf. Sci. Wuhan Univ. 2024, 49, 1741–1752. [Google Scholar]
  10. Wu, C.Y. Late Quaternary Activity of the East-Northeastern Trending Faults in the Southwestern Tianshan and Their Role in the Tectonic Deformation of the Tianshan Mountains. Ph.D. Thesis, Institute of Geology, China Earthquake Administration, Beijing, China, 2016. [Google Scholar]
  11. Hendrix, M.S.; Dumitru, T.A.; Graham, S.A. Late Oligocene-Early Miocene Unroofing in the Chinese Tian Shan: An Early Effect of the India-Asia Collision. Geology 1994, 22, 487–490. [Google Scholar] [CrossRef]
  12. Yin, A.; Nie, S.; Craig, P.; Harrison, T.M.; Ryerson, F.J.; Qian, X.L.; Yang, G. Late Cenozoic Tectonic Evolution of the Southern Chinese Tian Shan. Tectonics 1998, 17, 1–27. [Google Scholar] [CrossRef]
  13. Yang, X.P.; Ran, Y.K.; Cheng, J.W.; Chen, L.C.; Xu, X.W. Measurement of Terrace Deformation and Crustal Shortening of Some Renascent Fold Zones within Kalpin Nappe Structure. Sci. China Earth Sci. 2007, 50, 33–42. [Google Scholar] [CrossRef]
  14. Wang, Z.T.; Cheng, H.H.; Dong, P.Y.; Pang, Y.J.; Zhang, H.; Shi, Y.L. Numerical Analysis of Seismogenic Stress Field and Fault Activity Characteristics of Tianshan Orogen and Its Adjacent Areas. Chin. J. Geophys. 2020, 63, 4037–4049. [Google Scholar]
  15. Wei, B.; Chen, C.Y. Study on the Relationship Between GNSS Deformation Characteristics and Earthquakes in Xinjiang and Its Adjacent Regions. J. Seismol. Res. 2024, 47, 419–429. [Google Scholar]
  16. Lv, L.X.; Li, T.; Chen, Z.X.; Jobe, J.T.; Fang, L.H. Active Structural Geometries and Their Correlation with Moderate (M 5.5–7.0) Earthquakes in the Jiashi-Keping Region, Tian Shan Southwestern Front. Tectonics 2021, 40, 12. [Google Scholar]
  17. Wu, C.Y.; Alimujiang, D.X.; Dai, X.Y.; Wu, G.D.; Chen, J.B. Discovery of the Late Quaternary Activity Along the Eastern Segment of Maidan Fault in Southwest Tianshan and Its Tectonic Implication. Seismol. Geol. 2014, 36, 976–990. [Google Scholar]
  18. Jia, Q.C.; Wu, C.Y.; Shen, J.; Wu, G.D.; Ren, P. Evidence of Left-Lateral Strike-Slip Along the Akqi Segment of Maidan Fault in Southwest Tianshan Mountains, China and Its Latest Activity. China Earthq. Eng. J. 2015, 37, 222–227. [Google Scholar]
  19. Guo, Q.; Wen, Y.; Xu, C.; Zhao, X. Present-day tectonic activities of transverse faults in the Keping region, southwest Tianshan. Seismol. Res. Lett. 2024, 96, 1901–1910. [Google Scholar] [CrossRef]
  20. NASA/METI/AIST/Japan Space systems and U.S./Japan ASTER Science Team. ASTER Global Digital Elevation Model V003; NASA: Washington, DC, USA, 2019. [Google Scholar]
  21. Chen, C.W.; Zebker, H.A. Network Approaches to Two-Dimensional Phase Unwrapping: Intractability and Two New Algorithms. J. Opt. Soc. Am. A 2000, 17, 401–414. [Google Scholar] [CrossRef]
  22. Yu, C.; Penna, N.T.; Li, Z. Generation of Real-Time Mode High-Resolution Water Vapor Fields from GPS Observations. J. Geophys. Res. Atmos. 2017, 122, 2008–2025. [Google Scholar] [CrossRef]
  23. Yu, C.; Li, Z.; Penna, N.T. Interferometric Synthetic Aperture Radar Atmospheric Correction Using a GPS-Based Iterative Tropospheric Decomposition Model. Remote Sens. Environ. 2018, 204, 109–121. [Google Scholar] [CrossRef]
  24. Finkel, R.A.; Bentley, J.L. Quad trees a data structure for retrieval on composite keys. Acta Inform. 1974, 4, 1–9. [Google Scholar] [CrossRef]
  25. Jónsson, S. Fault Slip Distribution of the 1999 Mw 7.1 Hector Mine, California, Earthquake, Estimated from Satellite Radar and GPS Measurements. Bull. Seismol. Soc. Am. 2002, 92, 1377–1389. [Google Scholar] [CrossRef]
  26. Feng, W.P.; Li, Z.H. A Novel Hybrid PSO/Simplex Algorithm for Determining Earthquake Source Parameters Using InSAR Data. Prog. Geophys. 2010, 25, 1189–1196. [Google Scholar]
  27. Okada, Y. Surface Deformation Due to Shear and Tensile Faults in a Half-Space. Bull. Seismol. Soc. Am. 1985, 75, 1135–1154. [Google Scholar] [CrossRef]
  28. Harris, R.A.; Segall, P. Detection of a Locked Zone at Depth on the Parkfield, California, Segment of the San Andreas Fault. J. Geophys. Res. Solid Earth 1987, 92, 7945–7962. [Google Scholar] [CrossRef]
  29. Akaike, H. Likelihood and the Bayes Procedure. In Bayesian Statistics; Bernardo, J.M., DeGroot, M.H., Lindley, D.V., Smith, A.F.M., Eds.; University Press: Valencia, Spain, 1980; pp. 143–166. [Google Scholar]
  30. Fukahata, Y.; Wright, T.J. A non-linear geodetic data inversion using ABIC for slip distribution on a fault with an unknown dip angle. Geophys. J. Int. 2008, 173, 353–364. [Google Scholar] [CrossRef]
  31. King, G.C.P.; Stein, R.S.; Lin, J. Static Stress Changes and the Triggering of Earthquakes. Bull. Seismol. Soc. Am. 1994, 84, 935–953. [Google Scholar]
  32. Wang, R.; Lorenzo-Martín, F.; Roth, F. PSGRN/PSCMP—A New Code for Calculating Co- and Post-Seismic Deformation, Geoid and Gravity Changes Based on the Viscoelastic-Gravitational Dislocation Theory. Comput. Geosci. 2006, 32, 527–541. [Google Scholar] [CrossRef]
  33. Xiong, X.; Shan, B.; Zheng, Y.; Wang, R.J. Stress Transfer and Its Implication for Earthquake Hazard on the Kunlun Fault, Tibet. Tectonophysics 2010, 491, 216–225. [Google Scholar] [CrossRef]
  34. Lv, X.; Luo, G.; Zheng, L.; Zhang, B.; Zhang, C. Early Post-Seismic Deformation Revealed After the Wushi (China) Earthquake (Mw = 7.1) Occurred on 22 January 2024. Remote Sens. 2025, 17, 1340. [Google Scholar] [CrossRef]
  35. Qiu, J.; Sun, J.; Ji, L. The 2024 Mw 7.1 Wushi Earthquake: A Thrust and Strike-Slip Event Unveiling the Seismic Mechanisms of the South Tian Shan’s Thick-Skin Tectonics. Remote Sens. 2024, 16, 2937. [Google Scholar] [CrossRef]
Figure 1. Seismotectonic background of the Wushi region. Solid red lines represent the major active faults in the area. The white dotted box outlines the approximate coverage of Sentinel-1 data. The black dotted box indicates the coverage of LT-1 data. The red star marks the epicenter of the 2024 Wushi Mw 7.0 earthquake. The orange dot denotes the location of the epicenter of a magnitude-4.5 aftershock, as recorded by the USGS prior to 20 February 2024. The blue rectangles are used to denote county names.
Remotesensing 17 02435 g001
Figure 2. The seismic deformation field in the Wushi earthquake area. (a) Sentinel-1 ascending track, (b) Sentinel-1 descending track, (c) LT-1 ascending track, and (d) LT-1 descending track.
Remotesensing 17 02435 g002
Figure 3. Coseismic slipping distribution of the Wushi earthquake.
Remotesensing 17 02435 g003
Figure 4. Coseismic surface deformation field with InSAR constraints, simulated deformation field with optimal sliding model constraints, and residual map. (ac) is the Sentinel-1 ascending track; (df) is the Sentinel-1 descending track. The dashed lines in the image represent the inverted fault.
Remotesensing 17 02435 g004
Figure 5. Coseismic surface deformation field with InSAR constraints, simulated deformation field with optimal sliding model constraints, and residual map. (ac) is the LT-1 ascending track; (df) is the LT-1 descending track. The dashed lines in the image represent the inverted fault.
Remotesensing 17 02435 g005
Figure 6. Sliding distribution of magnitude-5.7 aftershocks (30 January 2024).
Remotesensing 17 02435 g006
Figure 7. Surface deformation field, simulated deformation field with optimal sliding model constraints, and residual maps for the 30 January 2024, magnitude-5.7 aftershocks of the Sentinel-1 ascending track under InSAR constraints. The dashed lines in the image represent the inverted fault.
Remotesensing 17 02435 g007
Figure 8. Variation of coseismic Coulomb stress in the Wushi earthquake with the friction coefficient taken as 0.4.
Remotesensing 17 02435 g008
Figure 9. Variation of Coulomb stress in the Wushi earthquake with different friction coefficients.
Remotesensing 17 02435 g009
Figure 10. Variation of normal and shear stress components in the Wushi earthquake.
Remotesensing 17 02435 g010
Figure 11. Fault modeling of the mainshock and the on 30 January aftershock.
Remotesensing 17 02435 g011
Table 1. Source parameters of the 2024 Wushi earthquake.
SourceLocationsDepth (km)Focal MechanismsFault DimensionsMagnitude (MW)
Lon (°)Lat (°)Strike (°)Dip (°)Rake (°)Length (km)Width (km)
USGS78.6541.271323545427.0
GCMT78.5741.191423648477.0
Nai [3]78.6441.236.6230.27554234.710.57.05
Zhao [4]78.6041.191322867603414.27.0
Yu [5]78.6541.221522962.849.83567.02
Ding [6]78.6641.2313228.3461.884234.815.87.02
Famiglietti [7]78.6741.217.4229.761.647.236.312.17.01
This study78.6941.227229.3864.644534.97.747.1
Table 2. Coulomb stress change for the Mw 5.7 earthquake with different friction coefficients.
Effective Friction Coefficient0.20.40.60.8
Coulomb Stress Change0.3391 × 106 Pa0.4251 × 106 Pa0.5110 × 106 Pa0.5969 × 106 Pa
Disclaimer/Publisher’s Note: The statements, opinions and data contained in all publications are solely those of the individual author(s) and contributor(s) and not of MDPI and/or the editor(s). MDPI and/or the editor(s) disclaim responsibility for any injury to people or property resulting from any ideas, methods, instructions or products referred to in the content.

