Abstract
This study conducted a comprehensive geological background investigation of the Zhurong rover’s landing area in Utopia Planitia using 3.5 m/pixel DEM and 0.7 m/pixel DOM data and completed the compilation of a 1:250,000-scale geological map. A total of 17 geological structures were systematically identified within the landing area. Additionally, focusing on scientific questions regarding the evolution of troughs, cone units, and mesas, we theoretically designed an exploration route considering slope constraints by taking the Zhurong rover route design as a case study. This route, a conceptual design, starts from the hibernation location of the Zhurong rover and has a total length of 126 km. It can provide a reference for advancing detection strategies for volatile components (e.g., water and ice) and contribute to the design of the Tianwen-3 exploration route. Ultimately, this study aims to establish a general guideline for integrating geological mapping with rover mobility planning in future extraterrestrial exploration missions.
1. Introduction
On 23 July 2020, China’s first Mars probe, “Tianwen-1”, was successfully launched from the Wenchang Satellite Launch Center. On 15 May 2021, the Tianwen-1 lander and the Zhurong Mars rover launched by China successfully landed at the preselected landing site (25.067°N, 109.926°E) south of Utopia Planitia. The scientific mission of “Tianwen-1” is to obtain Mars exploration scientific data through space–Earth cooperation and to study the Martian atmospheric ionosphere and surface climate and environment, surface morphology and geological structure, soil characteristics and water ice distribution, material composition, and physical scientific issues such as the physical fields and internal structures. Based on the multisource remote sensing payloads carried by the rover and orbiter, the specific scientific tasks that “Tianwen-1” will carry out on the surface and subsurface of Mars include the following: (1) detecting the topography of Mars and interpreting the characteristics of the geological structure of Mars; (2) analyzing the characteristics of the soil on the surface of Mars and exploring the distribution of water and ice; (3) analyzing the material composition of the Mars surface; (4) detecting the surface atmospheric ionosphere and surface climate and environmental characteristics; and (5) carrying out analysis and research on the physical field and internal structure of Mars [1].
To complete the Mars scientific exploration mission, the orbiter and the Zhurong rover carried 13 types of scientific exploration instruments. The orbiter consists of seven payloads [2], including the High-Resolution Imaging Camera (HiRIC), Moderate-Resolution Imaging Camera (MoRIC), Mars Mineralogical Spectrometer (MMS), Mars Orbiter Scientific Investigation Radar (MOSIR), Mars Ion and Neutral Particle Analyzer (MINPA), Mars Energetic Particles Analyzer (MEPA), and the Mars Orbiter Magnetometer (MOMAG). The Zhurong Mars rover consists of six payloads [3], namely, the Mars Surface Composition Detector (MarSCoDe), Multispectral Camera (MSCam), Navigation and Terrain Camera (NaTeCam), Mars Rover Penetrating Radar (RoPeR), Mars Rover Magnetometer (RoMAG), and the Mars Climate Station (MCS). As of 5 May 2022, the “Tianwen-1” orbiter has been in orbit for 651 days and is 240 million km away from Earth. The “Zhurong” rover has worked on Mars for 347 days, traveling 1921 m [4]. The orbiter and the Zhurong rover have accumulated approximately 940 GB of original scientific data.
Zhurong’s landing site is in the southern region of Utopia Planitia. Utopia Planitia has shown unusually diverse geological processes that occurred during the long geological evolution process [5]. It is considered the largest circular impact basin in Mars’ northern lowland region, filled by a series of mixtures of sediments, lavas, or volatiles transported via aeolian and other processes [6]. Wu et al. [7] summarized the evolution history of the Utopia Plain and divided it into eight stages: a. formation of Utopia Planitia that was caused by the large Noachian impact event; b. subsequently, the basin was reformed and filled with sedimentary and volcanic materials; c. during the Early Hesperian age, it was covered by volcanic materials; d. during the middle Hesperian, the plains were dominated by wrinkle ridge-related tectonics; e. during the Late Hesperian, the formation of outflow channels in the northern plains covered and changed the ridged plains; f. in a very short geological time, the sediment left by the outflow channel led to the creation of the Vastitas Borealis Formation (VBF); g. tectonic rebound from sublimation or volumetric compaction of water or ice formed giant polygons; h. finally, during the Amazonian, the lava flow and the Elysium Mons magma flow flowed into the southeastern part of the basin.
Based on topographical analysis, Head et al. [8] proposed that Mars’ northern lowlands are a ridged plain of volcanic origin. In addition, widespread VBF covers most of the northern plains, and VBF is generally considered the product of sedimentary activities related to the aquatic environment [9]. Scientists are eager to study the geological features of Utopia Planitia to gain a better understanding of the geological history of Mars. It is believed that some of the features on the surface of this region may provide clues to the evolution of the Martian climate and environment.
To further understand the geological background of the Zhurong landing area, this study focuses on its eastern part, analyzing surrounding topography and geomorphology to compile a 1:250,000-scale geological map detailing Utopia Planitia’s landforms (Figure 1). Based on systematic mapping of major landforms around the landing site, we theoretically designed an exploration route—taking the Zhurong rover’s route as a case study—with slope constraints considered, aiming to provide references for future detection strategies for volatile substances (e.g., water, ice), guide Tianwen-3 route design, and establish a general guideline integrating geological mapping with rover mobility planning in extraterrestrial missions.
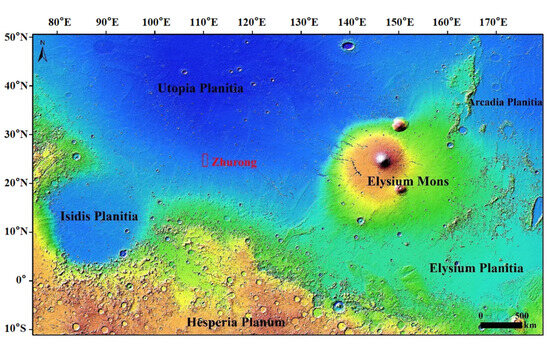
Figure 1.
The study area is outlined with a red rectangle. The background image is a color-shaded relief of the Mars Orbiter laser altimeter data [10].
2. Materials and Methods
2.1. Data Acquisition and Preprocessing
The Digital Elevation Model (DEM, 3.5 m/pixel) and Digital Orthophoto Map (DOM, 0.7 m/pixel) were acquired by the High-Resolution Imaging Camera (HiRIC) onboard Tianwen-1, downloaded from the Planet Exploration Program Scientific Data Release System, http://124.17.81.212:8081/marsdata/ (accessed on 9 July 2025) [11]. The research area is shown in Figure 2. HiRIC, a core payload of Tianwen-1, employs an Off-Axis Three-Mirror Astigmatic (TMA) optical system with a focal length of 4640 mm, F-number of 12, and Field of View (FOV) of 2° × 0.693°. Constructed with carbon-based materials for ultra-lightweight design (total mass 42 kg), it achieves a ground resolution of 0.5 m/pixel and a swath width of 9 km at 265 km orbital altitude [11].
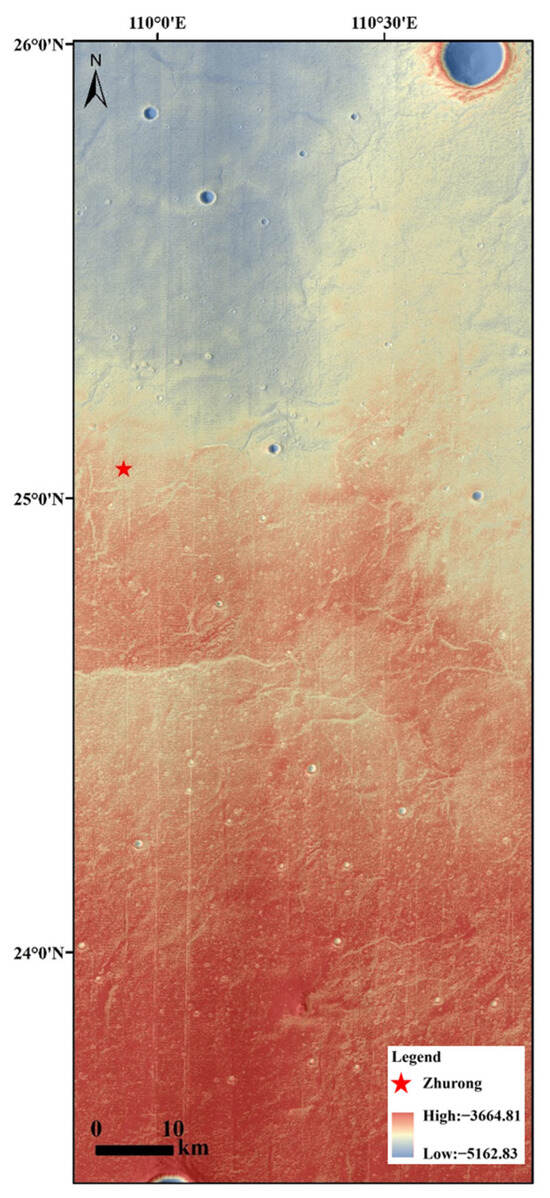
Figure 2.
The “Zhurong” rover (at the red five-pointed star) landing site and the research area. The map is composed of the DOM image of “Tianwen-1” superimposed on the DEM rendering.
Preprocessing includes the following: DOM and DEM mosaicking, cropping, and stitching using ArcGIS 10.8. All data are projected using the Plate Carrée projection, and the coordinate system employed is Simple Cylindrical Mars.
2.2. Geomorphological Interpretation and Mapping Methods
2.2.1. Impact Crater and Other Geological Structures: Visual Interpretation
Using the CraterTools (v2.1) plugin in ArcGIS [12], manual identification of impact craters employs a three-point positioning method for craters > 200 m in diameter. Specifically, three points were manually selected along the crater rim to fit a circle representing the crater boundary. Uniformly distributing these three points along the rim minimizes fitting errors [13]. The center of the fitted circle denotes the crater’s central coordinates, while the circle’s diameter quantifies the crater size.
Other geomorphic interpretation methods follow the image characteristics, using the polygon or line feature drawing tools in ArcGIS for delineation, and distinguishing them with different legend styles.
2.2.2. Geomorphological Classification System
This cartographic work follows the Planetary Geologic Mapping Protocol (PGMP) [14] and the FGDC Digital Cartographic Standard for Geologic Map Symbolization [15], with appropriate adjustments made based on actual conditions. In this study, based on the imagery and according to geomorphological characteristics, the geomorphology of the study area was classified into 11 categories, designated as concentric graben, ridge, crenulated ridge, lobate margin, trough, impact unit, mesa, cone unit, dune, bumpy terrain and plain. Each category encompasses one or more geological structures, with detailed information presented in Table 1.

Table 1.
Geological structure classification table.
2.3. Exploration Route Design Method
The degree of terrain undulation is one of the key factors to consider in route planning, which determines whether the rover can pass smoothly. In this study, the slope index was selected to evaluate the degree of terrain undulation, so as to design a passable exploration route.
Slope analysis was performed using ArcGIS Spatial Analyst based on the DEM, employing a 3 × 3 window finite difference algorithm:
where and are the elevation gradients in the X and Y directions, respectively. This formula is derived from classic terrain analysis theories [16]. Based on the constraint that the maximum climbing capacity of the Zhurong rover on soft terrain is 25° [17], the terrain traversed by the designed route should be as flat as possible. Ideally, the maximum slope should not exceed 25°; however, actual terrain is often complex and requires allowing for a margin. Therefore, this study stipulates that the slope along the route should not exceed 18°. The terrain is classified into five grades according to the generated slope map, <5° (very gentle), 5–10° (gentle), 10–18° (moderate), 18–25° (steep), and >25° (impassable), as shown in Table 2.
Table 2.
Topographic classification table based on slope.
3. Results
To understand the geological structure and distribution of the study area, this study focuses on an area located at 110.318°E, 24.748°N, and the geological mapping is concentrated in a region 150 km long and 54 km wide. The geological map of the landing area is drawn with a 1:250,000 scale (Figure 3). The geological map was produced using images, and the geological structure and distribution of the study area were analyzed in detail. In this study, geological structures are divided into 11 categories, and 17 types are discussed; each category contains one or more structures. The 11 geological structure categories include concentric graben, ridge, crenulated ridge, lobate margin, trough, impact unit (impact crater, exterior wall, interior wall and crater ejecta), mesa, cone unit (pitted cone, possible cone and cone field), dune, bumpy terrain, and plain. Further investigation of these structures could lead to new mineral resources. In addition, this study also provides significant information for the further exploration and development of water resources in the region.
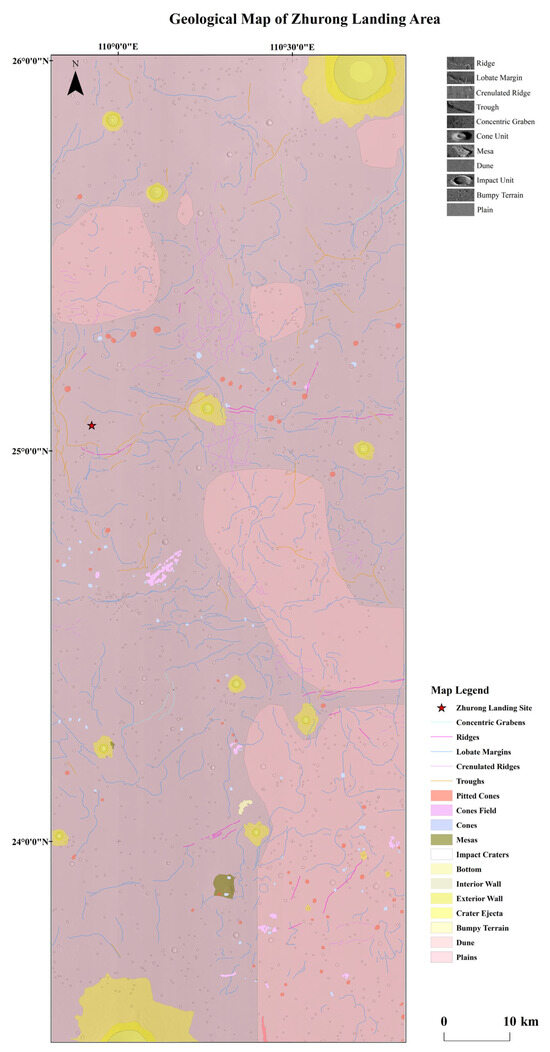
Figure 3.
Geological map of the “Zhurong” landing area, at a 1:250,000 scale.
The shape of a concentric graben is similar to a series of concentric ring-shaped pits or ravines (Figure 4a). The concentric graben is usually circular or oval, surrounding the flat area in the middle, and the graben’s concentric ring shape is particularly obvious, with the graben direction inside. The center is filled with bright matter and consists of a series of parallel, relatively flat regions and slopes (Figure 4c). The degradation degree of the two suspected same concentric grabens identified was relatively serious (Figure 4b). The relief state of a circular graben is directly related to its diameter [18]. The formation of concentric grabens is related to volume compaction and shrinkage of the covering material. This is done on the topography of the buried impact crater. The two horizontal tensions located inside and outside the crater edge correspond to the downward movement of the covering material near the crater. Therefore, the theory supports the phenomenon of wet deposition of covering materials; that is, there is an aqueous environment in the northern lowlands of Mars [19].
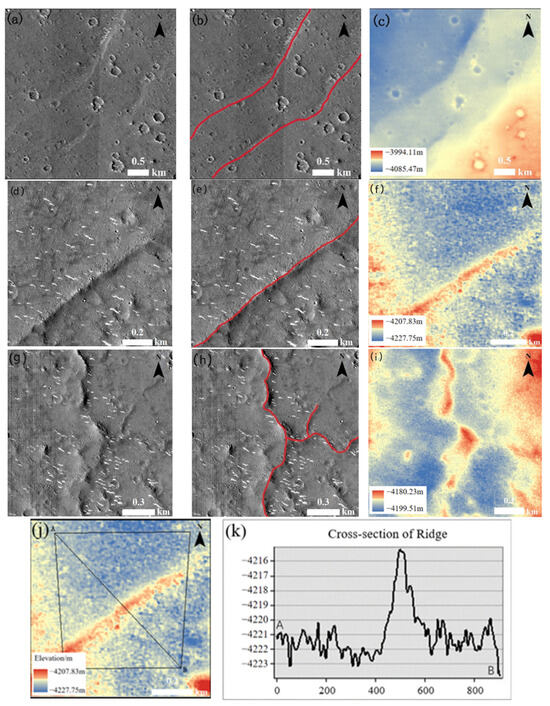
Figure 4.
Image features (left), interpretation map (middle) and elevation map (right). The area outlined in red is the corresponding landform. Concentric graben image features (a), interpretation map (b) and elevation map (c). Image features of ridge (d), interpretation map (e) and elevation map (f). Image features (g), interpretation map (h) and elevation map (i) of the crenulated ridge. Ridge profile line location map (j), cross-section of ridge map (k). In addition, the line segment AB in (j) is the profile line, and AB in (k) is the two endpoints of the profile line.
The ridge extends linearly as a whole with a narrow width, showing continuous elongation without obvious segmentation, fractures, or sharp inflections (Figure 4d,e). In the cross-section, it exhibits a morphology of a sharp crest and steep flanks on both sides (Figure 4j,k). There are 43 ridges, most of which are oriented east—west. Figure 4f shows the ridge height is approximately 20 m. Various hypotheses have been proposed for the formation mechanism of linear ridges on Mars. These hypotheses include inverted channels [20], linear dunes [21], volcanic lava tubes [22] and volcanic dikes [23]. Ridges are usually classified as short and straight or meandering and elongated. Short and straight ridges are usually interpreted as volcanic dikes [24]. The meandering and slender ridges may be similar to the ridged lava tubes found in the Tharsis quadrangle.
Compared with ridges, crenulated ridges typically exhibit continuous irregular inflections and non-linear extension (Figure 4g,h). The height is approximately 10–20 m (Figure 4i), and the length ranges from hundreds to thousands of meters. There are 205 crenulated ridges identified, most of which run north—south, and the crenulated ridges are distributed in a clustered network in the east and northeast of the landing site. There are also crenulated ridges in the west and southwest of the landing site. The ridges in the east and northeast are more concentrated and have a higher peak. The ridges in the west and southwest are more scattered and have a lower peak.
Lobate margins are raised slopes in the form of leaf margins, interpreted as lava or mud flow fronts, usually found on plains (Figure 5a,b). Due to their sharp slopes, the margins have distinct height differences on both sides (Figure 5c). The existence of sharp slopes may serve as direct evidence of past lava or mud flow boundaries [25]. Figure 3 shows the lobate margins are widely distributed and concentrated in the southeastern region. There are usually cone units near the lobate margins, which may be because cone units block the flow of liquid substances, or it may be that higher-temperature fluid substances cause underground volatiles to surge up to form cone units [25].
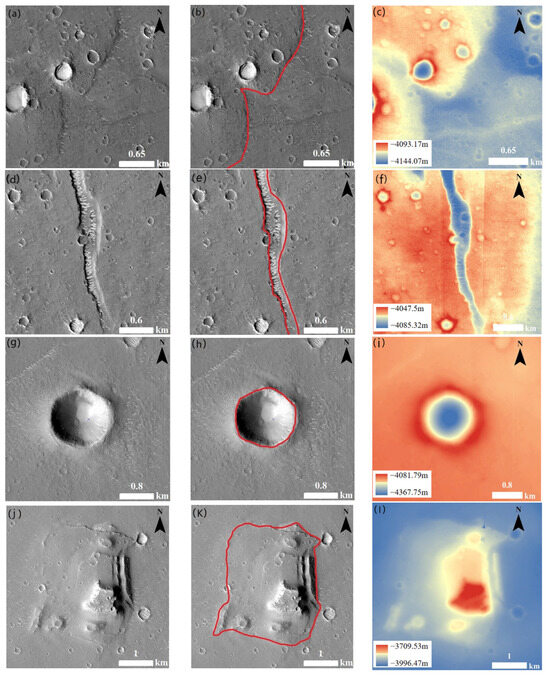
Figure 5.
Image features (left), interpretation map (middle) and elevation map (right). The area outlined in red is the corresponding landform. Image features (a), interpretation map (b) and elevation map (c) of the lobate margin. Image features (d), interpretation map (e) and elevation map (f) of the trough. Image features (g), interpretation map (h) and elevation map (i) of the impact crater. Image features (j), interpretation map (k) and elevation map (l) of the mesas.
A trough is a wide, elongated depression with steep sides and a low-lying middle (Figure 5d–f). Most troughs are distributed in the central and northern areas of the landing area. Most of the troughs to the west of the landing point run north—south, with a length of approximately 15 km and a width of approximately 200 m. The majority of the troughs to the east of the landing point are northeast—southwest trending, with a length of approximately 13 km and a width ranging from 100 m to 400 m. The center of the trough is filled with higher-reflectivity materials. The formation of higher-reflectivity materials is similar to ice margins formed by thermal contraction and rupture [26]. Fine-grained sediments preexist in the Utopia basement through the aquatic environment and experience long-term volume compaction to then form troughs [27].
Foreign celestial bodies will form impact craters and impact basins on Mars’ surface, and secondary landforms such as secondary impact craters and sputter blankets will also be formed [28]. Due to the different impact scales, the impact terrain can be divided into simple impact craters, complex impact craters, buried impact craters and impact basins. The impact units within the scope of the project include impact crater, exterior and interior walls and crater ejecta. Impact craters are approximately circular depressions with sloping raised edges (Figure 5g–i), usually related to the surrounding mound-like material, and are a typical feature of Martian terrain. This study describes a region through visual interpretation with a diameter more than 200 m, and, in total, there are 1360 impact craters. The impact craters are randomly distributed, and there are large impact craters and impact crater splashes in the southwest and northeast regions of the landing area. The impact has exposed minerals below the surface, and, to date, more than half of the hydrous minerals on Mars are formed by impact-induced excavation and hydrothermal action; they are all exposed inside the impact crater [29]. The study of impact landforms can help us understand the historical formation background as well as the reconstruction process of a specific area of Mars.
Mesas are high formations that are usually flat and smooth on top, sometimes featuring cones or impact craters. The sides are inclined and irregular (Figure 5j–l). Two mesas were found in the study area, including the one in the south-central area, which was larger and approximately 11 km2 in size. There are many explanations for the formation of mesas. For example, the formation of mesas is related to the heating of subsurface volatile-rich sediments or the eruption or extrusion of low-viscosity fluidized sediments from the structure [30]. The stratigraphic records of mesas may help us understand the geological evolution of Utopia Planitia. This is especially relevant to the material composition information at the bottom of the plain and the environmental evolution of the region.
Cone units include the pitted cone, possible cone and cone field. The pitted cone is conical, characterized by a ring-shaped peak pit, with a diameter ranging from 100 to 1000 m. The center is concave, with a smooth surface that has a delicate texture. Relatively light-colored substances appear at the edge of the peak pit, and relatively dark-colored substances appear on the sides (Figure 6a–c). The possible cone has similar structural features to the pitted cone, with a relatively irregular shape and a certain degree of adhesion to each other. The top of the cone has different degrees of erosion, and the degree of degradation is quite serious (Figure 6d–f). Cone fields refer to vertebral bodies in chains or groups (Figure 6g–i). The vertebral bodies are mostly distributed in the central and southern regions of the study area.
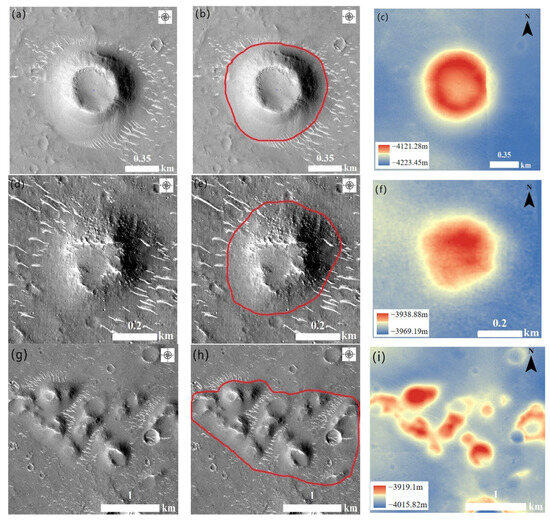
Figure 6.
Image features (left), interpretation map (middle) and elevation map (right) of cone unit; The area outlined in red is the corresponding landform. image features (a), interpretation map (b) and elevation map (c) of pitted cones; image features (d), interpretation map (e) and elevation map (f) of possible cones; image features (g), interpretation map (h) and elevation map (i) of cone field.
Dunes are ridges or mounds formed by the interaction and accumulation of discrete sediments under the action of wind, and different forms of dunes have different performance scales (Figure 7a–c). Although Earth and Mars have different environments, the morphological characteristics of the dunes on Earth and Mars are very similar. From the Hesperian period to the early Amazonian period, Mars’ surface water gradually accumulated at the middle and high latitudes through sublimation and atmospheric transport, forming shallow subsurface ice at the middle and high latitudes. Due to the freezing and thawing of the surface, the sublimation of the shallow subsurface ice promotes sediment separation, and occasional wind events cause sand particles to jump, which leads to further sediment separation, and dunes are formed after long-term geological changes [31].
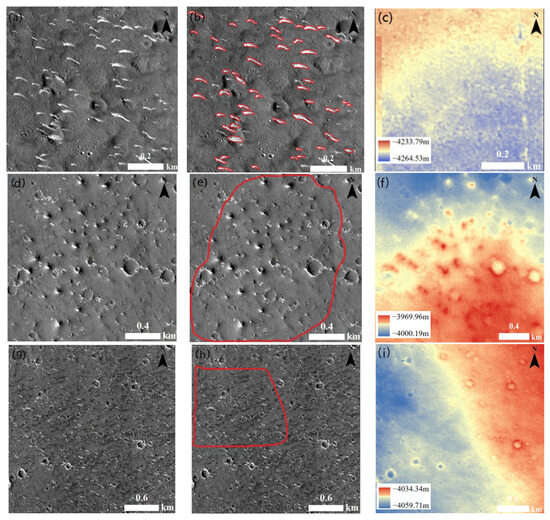
Figure 7.
Image features (left), interpretation map (middle) and elevation map (right). The area outlined in red is the corresponding landform. Image features (a), interpretation map (b) and elevation map (c) of the dune. Image features (d), interpretation map (e) and elevation map (f) of bumpy terrain. Image features (g), interpretation map (h) and elevation map (i) of the plain.
The bumpy terrain is a specific topographic unit characterized by numerous small, densely distributed circular mounds, forming an uneven surface. These mounds are generally low in height, exhibit rounded crests as convex features, and typically occur in clusters or contiguous distributions (Figure 7d–f). Bumpy terrain was found in the southern part of study area.
A plain refers to a large area with relatively flat terrain, and its surface is characterized by being vast and flat and generally does not have obvious topographical protrusions (Figure 7g–i). Plains occupy most of the study area, and the study area is overall relatively flat. This topographic feature may be formed by the interaction of factors such as sedimentation, erosion and crustal movement in the region.
All in all, the concentric graben may be related to the Martian climate environment and its evolution, the formation of lobate margins may be related to the Martian climate environment and its evolution, and the formation of mesas and cone units may be related to the atmosphere–surface water cycle process, which can provide reference value for the evolution of a habitable environment on Mars. Ridges, crenulated ridges and bumpy terrain are unique features of the Martian landscape that can help us explore the geological structure and evolution of Mars. Studying the formation mechanism of the troughs and the geological changes of dunes is an important way to understand the occurrence of water on Mars, which will help us search for traces of life on Mars. The formation of impact craters and the formation of plains are related to the formation of Mars and the source of materials, which can help us understand the internal structure and early processes of Mars.
4. Discussion
By 1 May 2022, the Zhurong rover had traversed 1921 m on Mars. Along its path, it gathered comprehensive spectral, topographic, and meteorological data and performed initial analyses of selected rocks and aeolian landforms. This study discusses the subsequent exploration path for the Zhurong rover under the scenario of continued operations, extending the existing route. This hypothetical route acts as a case study to guide route planning for future missions, especially Tianwen-3, and to establish a general framework integrating geological mapping with rover mobility planning in extraterrestrial exploration.
Combining the existing driving route of the Zhurong rover and based on factors such as slope, an idealized design for the rover’s future exploration route is conducted. According to the design and verification of lunar rovers by Pan Dong et al., the maximum climbing capability of a lunar rover is 25° [17]. However, due to the complex surface conditions of Mars, to maximize the service life of the Mars rover, this study designs the optimal climbing condition to be below 10°. In reality, it is difficult to avoid harsh climbing conditions, so the overall slope is limited to 18°. Additionally, considering that China’s “Tianwen-3” sampling return mission mainly explores elements of life existence, and that troughs [32], mud volcanoes [33], and mesas [34] are highly correlated with the influence of water activities, this study focuses on troughs, cone units, and mesas as the main research objects, paying special attention to the activities of water and heat sources, to design the exploration route. The performance of the Zhurong rover is similar to that of the Perseverance rover [35], which theoretically supports long-term operation and makes it possible to explore distant areas.
Ultimately, a driving route map with a total length of 126 km is designed, which includes 43 observation points of interest. Troughs, cone units, and mesas are the key research objects, starting from the landing site and reaching the mesas area, as shown in Figure 8 and Figure 9. This route is divided into five sections (Figure 9). The first section targets troughs, starting from the hibernation position of the Zhurong rover and ending at the cone unit, with a total length of approximately 34 km. The second section targets the cone unit, starting from the cone unit and ending at the trough, covering approximately 12 km. The third section also focuses on troughs, starting from the trough and extending approximately 13 km. The fourth section still targets the cone unit, starting from the end of the third section and continuing to observe the cone unit, with a length of approximately 35 km. The fifth section starts from the end of the fourth section and finally reaches the mesa, with a length of approximately 32 km. A total of 43 observation points are set along the entire exploration route. The selection of observation points of interest is based on two aspects: first, whether there is a complete 0.7 m/pixel orthophoto to effectively distinguish regional elements; second, the focus is on finding landform elements that can be reached via flat routes. In addition, based on the average speed of the Zhurong rover under ideal conditions mentioned in the study by Chen et al. [36], this study estimates the possible time consumption for each section of the route, and the results are shown in Table 3.
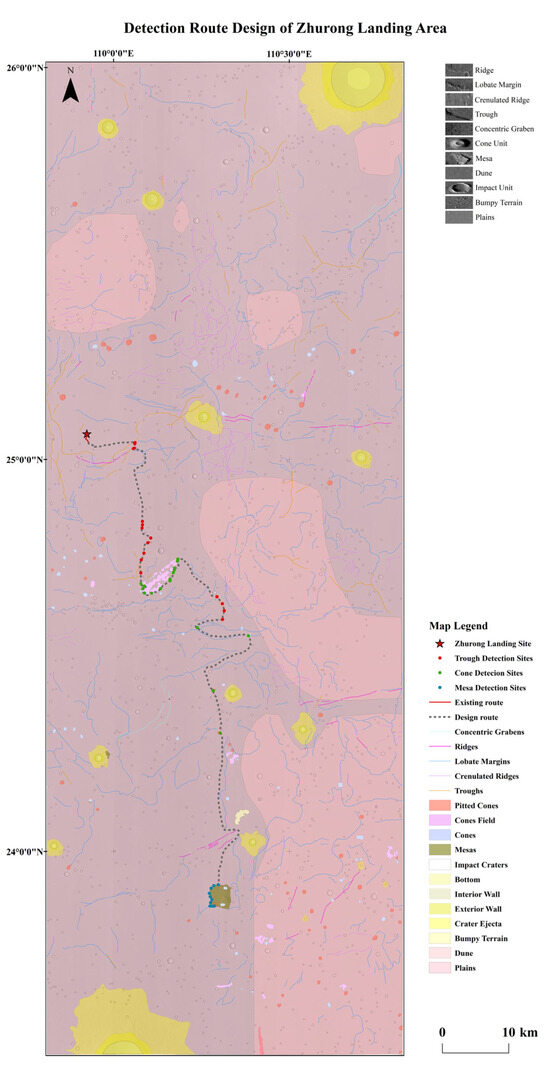
Figure 8.
The detection route of the “Zhurong” rover landing area set up with troughs, cone units and mesas as key research objects.
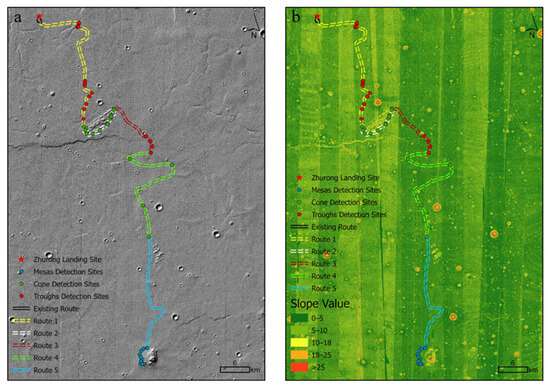
Figure 9.
Exploration route map. (a). Mountain shadow map, (b). slope map.
Table 3.
Route information.
4.1. Exploration Route of the Trough Zone
4.1.1. Geological Characteristics
The geological structure around the Zhurong rover landing area is complex and diverse, which has also raised many scientific issues worthy of research. Troughs are commonly found in Utopia Planitia and are considered related to volatile substance activity. Regarding the origin of troughs, there are three formation mechanisms: a tectonic uplift model, a fold overlay model and a volume compaction model. The survey of trough valleys supports the volumetric compaction model formation mechanism and proposes a two-stage evolution process [27]. In the first stage, fine-grained sediment is deposited in the Utopia basement via hydrological processes. In the second stage, this sedimentary material, while still wet, undergoes volume compaction to form polygonal troughs. Alternatively, the sedimentary material was frozen before volume compaction occurs, and partial superimposition of later sedimentary material forms smaller-diameter troughs. The model suggests troughs have a double-layered subsurface structure, providing observational evidence of possible long-term water activity on Mars.
Aiming at the relationship between the trough valley and the hydrogeological environment, the Mars RoPeR can accurately detect subsurface stratification and thickness in the trough area. Detailed information on Mars’ subsurface structure and physical properties is the key basis for studying the evolution of Mars’ geology and habitable environment. It is also a crucial aspect of Mars exploration. The geomorphological and geological features of the Martian surface are the tip of the iceberg for the entire study of Martian geology. More significant information is stored underground. Mars Rover Penetrating Radar can image the subterranean shallow structures in the inspection area. It can also deepen people’s understanding of key scientific issues such as groundwater or ice formation and the evolution of the Utopia Planitia. The MarSCoDe can detect elements and compound components on the surface of troughs, helping us understand its material composition and formation process.
4.1.2. The Route Design of the Trough Zone
Based on the above scientific problems and current location of the Zhurong rover, the Zhurong rover continued to drive eastward and finally reached the trough. Based on the terrain images and the navigable flat routes found, for the troughs, two exploration routes are designed (Figure 9). One route starts from the hibernation position of the Zhurong rover, with a length of 34 km (Table 4). The other route starts from the cone unit and reaches a new trough position, with a length of 35 km (Table 4). A total of 17 observation points are designed in these two routes (Figure 9). In this area, the Zhurong rover will use the onboard RoPeR and MarSCoDe to detect and analyze the surrounding geology and terrain. The precision and accuracy of the detection data are also affected by many factors, such as the radar power, the detection frequency, and the signal-to-noise ratio. Therefore, detailed testing and calibration are required before using the radar to ensure the reliability and accuracy of the detection data. As shown in Table 4, both exploration routes targeting the trough satisfy the slope restriction of less than 18 degrees. The topography traversed by the routes is generally flat, indicating favorable overall exploration conditions. The red observation point of interest is set for troughs and valleys. If volatile components such as water ice are detected, it can indicate that there is water ice in the region. Through detection, scientific problems such as the double-layer underground structure of troughs and the material state and composition of volatile components such as water ice may be solved.
Table 4.
Detailed information table of the trough exploration route.
4.2. Exploration Route of the Cone Unit
4.2.1. Geological Characteristics
Cone units are a special geological formation, often accompanied by radially occurring eolian landforms. At present, there are many hypotheses about the origin of cone units, such as mud volcanoes [37], volcanic rootless constructs [38] and volcanic cinder cones [39]. Among them, the mud volcano hypothesis has attracted attention. The mud volcano hypothesis suggests that cone units typically form during lava eruptions or gas explosion events. When lava spews out of the subterranean crater, it carries fine particles to the surface. These particles rapidly cool and solidify. After a long accumulation period, the fine-grained matter gradually accumulates and forms a special conical landform with a central depression and an upwardly extending edge [40]. Mud volcanoes are long processes that take hundreds or thousands of years to complete. In this process, suitable geological and environmental conditions are needed, such as sufficient mud formation conditions, temperature, and gas permeability of underground rock formations. In addition, gas explosions may also form landform features similar to those of mud volcanoes.
4.2.2. The Route Design of the Cone Unit
To verify the mud volcano hypothesis, we need to conduct further detection on the concave cone, such as physical detection and sampling analysis. The MarSCoDe carried by the Zhurong rover can analyze the material element composition of the concave cone. The MarSCoDe uses strong laser pulses to heat the targeted rock surface or Martian minerals to form plasma gas. The content and type of elements can be obtained by analyzing the gas spectrum. MSCam examines the reflection spectra of rocks, soil and other minerals in the surface environment, summarizes the reflection spectrum information of different substances in different spectral channels, identifies the composition types of the star’s surface, and determines the distribution of material types on Mars’ surface. The MSCam can obtain spectral information of the landform but also take high-definition surface images to obtain the bedding structure, detailed features and environmental conditions of vertebral body development. The MCS measures atmospheric physical characteristics, such as wind speed, wind direction, air pressure, and air temperature, in the inspection area. By using landing rovers, we can gain a deeper understanding of the internal structure, chemical composition, and history of the cones. This will help to determine whether the mud volcano hypothesis is true.
Therefore, the Zhurong rover will continue to travel south along the predetermined route. After multiple terrain surveys and trajectory planning, it finally arrived at an area known to have cone units on the surface. The Zhurong rover can reach the root of the mud volcano, exploring around the mud volcano to detect its eruption material, but it cannot reach the top of the mud volcano. The exploration route around the cone unit is also divided into two segments. One segment begins at the first cone unit encountered along the path and spans 12 km. The other segment starts at the endpoint of the second trough exploration route described in Section 4.1.2 and measures 13 km. A total of 17 observation points are established along these two segments (Figure 9). These include two observation points of interest for the pitted cones and five observation points of interest for the possible cones. Due to the complex geological structure of the area where the cone fields are formed, there are 10 observation points of interest. The cone field terrain is undulating, and to meet the slope limit requirement as much as possible, the Zhurong rover should travel along the outer edge of the cone field, as shown in Figure 9. For the cone units, the green points represent interesting observation points. Table 5 presents the slope conditions of the terrain along the route. It can be seen that the maximum slope value in this section is 17.8 degrees, which meets the slope restriction. In this area, the MarSCoDe, MSCam and MCS carried by the Zhurong rover will conduct comprehensive and multi-directional detection of cone units to further study Mars’ geological evolution and the questions related to planet formation history.
Table 5.
Detailed information table of the cone unit exploration route.
4.3. Exploration Route of the Mesa Zone
4.3.1. Geological Characteristics
The mesa terrain resembles a high-altitude region, generally occurring approximately 350 km from the boundary between Mars’ southern highlands and lowlands. Some scholars believe the mesas in the Utopia Planitia area are an erosional remnant of Noahian sedimentary strata, which were formed by a continuous and thick near-polar layered sedimentary sequence. Based on this conclusion, some scholars propose the evolution history of the mesas: oceanic activity in the early and middle Noahian formed thicker sedimentary layers. The Martian climate cooled during the late Noahian, with surface temperatures largely dependent on altitude, which caused oceans to freeze. Under adiabatic cooling, water or ice in the northern lowlands gradually accumulated into ice and snow on the southern plateau, which caused the groundwater table to drop. Subsequent erosion formed the Secondary Mesas Unit and the Primary Mesas Unit, representing two distinct stages of groundwater loss in the northern lowlands. Late Occidental outflow channels transported large volumes of water and sediment to the northern plains, contributing to sea level rise. The oceanic features of the Noah Ocean were overshadowed by late Occidental currents, leaving only the mesas [34].
4.3.2. The Route Design of the Mesa Zone
To verify the evolutionary history of the mesas, we need to collect more samples and data and use advanced analysis techniques and tools to reason and explain them. To obtain the mesas’ morphological characteristics and composition information, we can use the MSCam, RoPeR and NaTeCam mounted on the Zhurong rover to photograph and detect them. The MSCam can capture images in different wavelength ranges and obtain information such as the color and reflectivity of the sides of mesas to help us analyze its geological structure and landform features. The RoPeR has high-frequency and low-frequency channels, which can reveal the subsurface structure near the mesas at different resolutions. High-frequency channels can provide higher resolution and detect subsurface structures within 10 m, helping us better understand the mesas’ geological characteristics and landforms. The low-frequency channel can penetrate deeper into the subsurface, revealing deeper geological structure and rock composition information [41]. The NaTeCam takes wide-angle pictures, which is convenient for examining the morphology and geological structure.
Finally, the Zhurong rover will continue to drive southward along the predetermined route, passing through the trough and cone unit area. After completing numerous landform detections and trajectory planning, the rover finally reaches the mesa area. The route length is 32 km, and the slope conditions of the terrain along the route are shown in Table 6 and Figure 9. Similarly, we designed 10 observation points around the mesas, which have high terrain, so the Zhurong rover should travel along the edge of the mesas as much as possible and conduct exploration missions. From these observation points of interest, we can explore the sedimentary environment of the root of the mesas and provide the structural information and material composition information for its formation. The blue points are observation points of interest set up for the mesas area (Figure 9). By setting these points, the geological structure, landform features, and surface composition of the region can be detected, which is of substantial scientific importance. Therefore, multiple detection tasks utilizing the MSCam, RoPeR and NaTeCam will be launched here.
Table 6.
Slope table of terrain traversed by mesa exploration route.
5. Conclusions and Prospects
This study centers on geological mapping and engineering application design within the landing area of the Zhurong rover, fully exhibiting the scientific accomplishments derived from the Tianwen-1 probe’s HiRIC data and offering a novel perspective for Mars exploration. Contrasted with prior research, this study distinguishes itself in the following ways:
Firstly, a detailed 1:250,000-scale geological map of the landing area was constructed. Unlike the study by Tanaka et al. [9] on the geological history of Mars’ Amazonian north polar regions, which utilized lower-resolution data from the Mars Global Surveyor and Odyssey spacecraft, this research leverages higher-resolution HiRIC data. This enables more precise documentation of the landing area’s geographic context in Utopia Planitia, furnishing planetary scientists with a more comprehensive reference for interpreting Martian geological processes. This work significantly enhances our understanding of the stratigraphy and structural features in Utopia Planitia, establishing a robust foundation for comparative studies of Martian terrains.
Secondly, a 126 km theoretical rover traverse route with 43 interesting observation points was designed based on systematic mapping of major geomorphic units, combined with slope and structural analyses. Unlike prior studies on the Zhurong landing site (e.g., Wu et al. [7]) that focused on describing local geological features, this study systematically provides strategies for route design and observation point selection by integrating topographic, geological, and accessibility considerations. The proposed route offers critical references for future missions, an aspect underexplored in previous research.
However, due to the confidentiality of the specific engineering parameters of the Zhurong rover, information such as energy consumption cannot be obtained. Currently, only the climbing capability information verified on the ground [17] and the average speed information under ideal conditions [36] are available, making it impossible to establish an energy consumption model. Therefore, this study only considers slope constraints to design an ideal exploration route, without comprehensive consideration of multiple alternative routes. In actual engineering operations, alternative routes for each section need to be designed and evaluated by integrating multiple factors. It is hoped that follow-up studies can address these issues.
Collectively, this study significantly advances the comprehension of Martian geology and fosters the development of integrating remote sensing data with mission operations. It offers practical guidance for future Mars and other planetary exploration endeavors, underscoring its scientific and applicative significance.
Author Contributions
H.D. and E.Z. contributed equally to this study. Conceptualization, T.H.; methodology, T.H.; investigation, L.L.; data curation, H.D. and E.Z.; writing—original draft preparation, L.L.; writing—review and editing, H.D., E.Z., Y.H. and W.M.; supervision, W.M. and T.H. All authors have read and agreed to the published version of the manuscript.
Funding
This research was funded by the National Key Research and Development Program of China, grant number 2019YFE0123300.
Data Availability Statement
The DEM and DOM are available from the Planet Exploration Program Scientific Data Release System, http://124.17.81.212:8081/marsdata/ (accessed on 9 July 2025).
Acknowledgments
We thank the team of Lunar and Planet Exploration Program Ground Application System (GRAS) for providing the datasets to the public.
Conflicts of Interest
The authors declare no conflicts of interest.
References
- Zhu, X.; Chu, Y. The Overall Design of Tianwen 1 Mars Orbiter. China Aerosp. 2021, 06, 25–31. [Google Scholar]
- Li, C.; Zhang, R.; Yu, D.; Dong, G.; Liu, J.; Geng, Y.; Sun, Z.; Yan, W.; Ren, X.; Su, Y.; et al. China’s Mars exploration mission and science investigation. Space Sci. Rev. 2021, 217, 57. [Google Scholar] [CrossRef]
- Zou, Y.; Zhu, Y.; Bai, Y.; Wang, L.; Jia, Y.; Shen, W.; Fan, Y.; Liu, Y.; Wang, C.; Zhang, A.; et al. Scientific objectives and payloads of Tianwen-1, China’s first Mars exploration mission. Adv. Space Res. 2021, 67, 812–823. [Google Scholar] [CrossRef]
- Wang, L.; Zhu, Y.; Zhang, B.; Shen, W.; Li, X.; Xue, B.; Li, Y.; Xu, W.; Sun, S.; Cai, Z.; et al. Design and Verification of Scientific Exploration Mode of Zhurong Mars Rover. Chin. J. Space Sci. 2023, 43, 485–498. [Google Scholar] [CrossRef]
- Mcgill, G.E. Buried topography of Utopia, Mars: Persistence of a giant impact depression. J. Geophys. Res. 1989, 94, 2753–2759. [Google Scholar] [CrossRef]
- Searls, M.L.; Banerdt, W.B.; Phillips, R.J. Utopia and Hellas basins, Mars: Twins separated at birth. J. Geophys. Res. Planets 2006, 111, E08005. [Google Scholar] [CrossRef]
- Wu, X.; Liu, Y.; Zhang, C.; Wu, Y.; Zhang, F.; Du, J.; Liu, Z.; Xing, Y.; Xu, R.; He, Z.; et al. Geological characteristics of China’s Tianwen-1 landing site at Utopia Planitia, Mars. Icarus 2021, 370, 114657. [Google Scholar] [CrossRef]
- Head, J.W.; Kreslavsky, M.A.; Pratt, S. Northern lowlands of Mars: Evidence for widespread volcanic flooding and tectonic deformation in the Hesperian Period. J. Geophys. Res. Planets 2002, 107, 5003. [Google Scholar] [CrossRef]
- Tanaka, K.L.; Skinner, J.A.; Hare, T.M. Geologic Map of the Northern Plains of Mars; Series 2888; U.S. Geological Survey: Reston, VA, USA, 2005. [Google Scholar] [CrossRef]
- Smith, D.E.; Zuber, M.T.; Frey, H.V.; Garvin, J.B.; Head, J.W.; Muhleman, D.O.; Pettengill, G.H.; Phillips, R.J.; Solomon, S.C.; Zwally, H.J.; et al. Mars Orbiter Laser Altimeter: Experiment summary after the first year of global mapping of Mars. J. Geophys. Res. Planets 2001, 106, 23689. [Google Scholar] [CrossRef]
- Meng, Q.; Wang, D.; Wang, X.; Li, W.; Yang, X.; Yan, D.; Li, Y.; Cao, Z.; Ji, Q.; Sun, T.; et al. High Resolution Imaging Camera (HiRIC) on China’s First Mars Exploration Tianwen-1 Mission. Space Sci. Rev. 2021, 217, 42. [Google Scholar] [CrossRef]
- Kneissl, T.; van Gasselt, S.; Neukum, G. 2011. Map-projection-independent crater sizefrequency determination in GIS environments—New software tool for ArcGIS. Planet. Space Sci. 2011, 59, 1243–1254. [Google Scholar] [CrossRef]
- Yue, Z.; Di, K.; Liu, Z.; Michael, G.; Jia, M.; Xin, X.; Liu, B.; Peng, M.; Liu, J. Lunar regolith thickness deduced from concentric craters in the CE-5 landing area. Icarus 2019, 329, 46–54. [Google Scholar] [CrossRef]
- Skinner, J.A., Jr.; Huff, A.E.; Black, S.R.; Buban, H.C.; Fortezzo, C.M.; Gaither, T.A.; Hare, T.M.; Hunter, M.A. Planetary geologic mapping protocol—2022. In Techniques and Methods; 11–B13; U.S. Geological Survey: Reston, VA, USA, 2022; 28p. [Google Scholar] [CrossRef]
- U.S. Geological Survey. FGDC Digital Cartographic Standard for Geologic Map Symbolization (PostScript Implementation). In Techniques and Methods; 11-A2; U.S. Geological Survey: Reston, VA, USA, 2006. Available online: http://pubs.usgs.gov/tm/2006/11A02/ (accessed on 10 May 2025).
- Zevenbergen, L.W.; Thorne, C.R. Quantitative analysis of land surface topography. Earth Surf. Process. Landforms 1987, 12, 47–56. [Google Scholar] [CrossRef]
- Pan, D.; Jia, Y.; Yuan, B.; Liu, Y.; Dang, Z.; Lin, Y.; Wang, R.; Chen, M.; Wei, Q.; Zhao, Z.; et al. Design and verification of the active suspension mobility system of the Zhurong Mars rover. Sci. Sin. Technol. 2022, 52, 278–291. [Google Scholar] [CrossRef]
- Buczkowski, D.L.; McGill, G.E. Topography within circular grabens: Implications for polygon origin, Utopia Planitia, Mars. Geophys. Res. Lett. 2002, 29, 1155. [Google Scholar] [CrossRef]
- Buczkowski, D.L.; Cooke, M.L. Formation of double-ring circular grabens due to volumetric compaction over buried impact craters: Implications for thickness and nature of cover material in Utopia Planitia, Mars. J. Geophys. Res. Planets 2004, 109, E02006. [Google Scholar] [CrossRef]
- Williams, R.M.; Irwin, R.P.; Burr, D.M.; Harrison, T.; McClelland, P. Variability in martian sinuous ridge form: Case study of Aeolis Serpens in the Aeolis Dorsa, Mars, and insight from the Mirackina paleoriver, South Australia. Icarus 2013, 225, 308–324. [Google Scholar] [CrossRef]
- Davis, J.M.; Banham, S.G.; Grindrod, P.M.; Boazman, S.J.; Balme, M.R.; Bristow, C.S. Morphology, Development, and Sediment Dynamics of Elongating Linear Dunes on Mars. Geophys. Res. Lett. 2020, 47, e2020GL088456. [Google Scholar] [CrossRef]
- Zhao, J.; Huang, J.; Kraft, M.D.; Xiao, L.; Jiang, Y. Ridge-like lava tube systems in southeast Tharsis, Mars. Geomorphology 2017, 295, 831–839. [Google Scholar] [CrossRef]
- Huang, J.; Edwards, C.S.; Horgan, B.H.; Christensen, P.R.; Kraft, M.D.; Xiao, L. Identification and mapping of dikes with relatively primitive compositions in Thaumasia Planum on Mars: Implications for Tharsis volcanism and the opening of Valles Marineris. Geophys. Res. Lett. 2012, 39, L17201. [Google Scholar] [CrossRef]
- Korteniemi, J.; Raitala, J.; Aittola, M.; Ivanov, M.A.; Kostama, V.-P.; Öhman, T.; Hiesinger, H. Dike indicators in the Hadriaca Patera–Promethei Terra region, Mars. Earth Planet. Sci. Lett. 2010, 294, 466–478. [Google Scholar] [CrossRef]
- Mills, M.M.; McEwen, A.S.; Okubo, C.H. A Preliminary Regional Geomorphologic Map in Utopia Planitia of the Tianwen-1 Zhurong Landing Region. Geophys. Res. Lett. 2021, 48, e2021GL094629. [Google Scholar] [CrossRef]
- Ulrich, M.; Morgenstern, A.; Güntheret, F.; Reiss, D.; Bauch, K.E.; Hauber, E.; Rössler, S.; Schirrmeister, L. Thermokarst in Siberian ice-rich permafrost: Comparison to asymmetric scalloped depressions on Mars. J. Geophys. Res. Planets 2010, 115, E10009. [Google Scholar] [CrossRef]
- Buczkowski, D.L.; Seelos, K.D.; Cooke, M.L. Giant polygons and circular graben in western Utopia basin, Mars: Exploring possible formation mechanisms. J. Geophys. Res. Planets 2012, 117, E08010. [Google Scholar] [CrossRef]
- Barlow, N.G. A review of Martian impact crater ejecta structures and their implications for target properties. In Large Meteorite Impacts III; GSA: Boulder, CO, USA, 2005; Volume 384, pp. 433–442. [Google Scholar] [CrossRef]
- Singh, P.; Sarkar, R.; Porwal, A. Orbital remote sensing of impact-induced hydrothermal systems on Mars. Ore Geol. Rev. 2019, 108, 101–111. [Google Scholar] [CrossRef]
- Tanaka, K.L.; Fortezzo, C.M.; Hayward, R.K.; Rodriguez, J.P.; Skinner, J.A. History of plains resurfacing in the Scandia region of Mars. Planet. Space Sci. 2011, 59, 1128–1142. [Google Scholar] [CrossRef]
- Baker, V.R. Water and the evolutionary geological history of Mars. Ital. J. Geosci. 2006, 125, 357–369. [Google Scholar]
- Winebrenner, D.P.; Koutnik, M.R.; Waddington, E.D.; Pathare, A.V.; Murray, B.C.; Byrne, S.; Bamber, J.L. Evidence for ice flow prior to trough formation in the martian north polar layered deposits. Icarus 2008, 195, 90–105. [Google Scholar] [CrossRef]
- Oehler, D.Z.; Allen, C.C. Evidence for pervasive mud volcanism in Acidalia Planitia, Mars. Icarus 2010, 208, 636–657. [Google Scholar] [CrossRef]
- Zhang, T.; Wang, L.; Saidamat, A.; Xiao, L.; Huang, J. Evolution History of Mesas in the Southern Utopia Planitia and Implications for the Ancient Oceans on Mars. J. Earth Sci. 2023, 34, 940–950. [Google Scholar] [CrossRef]
- Shen, Y.; Zou, M.; Dang, Z.; Chen, B.; Li, Y. Trafficability Analysis for Mars Rover: Present and Development. Remote Sens. 2023, 31, 729–745. [Google Scholar] [CrossRef]
- Chen, J.; Xing, Y.; Li, Z.; Mao, X.; Teng, B.; Liu, X.; Jia, Y.; Gu, P. Autonomous environment sensing and obstacle avoidance technology of Zhurong Mars rover. Sci. Sin. Technol. 2022, 52, 1186–1197. [Google Scholar] [CrossRef]
- Chu, J.; Ivanov, M.A.; Nikishin, A.M. Genetic Types of Mud Volcanism in the Cydonia and Acidalia Regions of Mars. Mosc. Univ. Geol. Bull. 2023, 78, 293–303. [Google Scholar] [CrossRef]
- Lanagan, P.D.; McEwen, A.S.; Keszthelyi, L.P.; Thordarson, T. Rootless cones on Mars indicating the presence of shallow equatorial ground ice in recent times. Geophys. Res. Lett. 2001, 28, 2365–2367. [Google Scholar] [CrossRef]
- Lanz, J.K.; Wagner, R.; Wolf, U.; Kröchert, J.; Neukum, G. Rift zone volcanism and associated cinder cone field in Utopia Planitia, Mars. J. Geophys. Res. Planets 2010, 115, E12019. [Google Scholar] [CrossRef]
- Chicarro, A.F. Mars Express—Science Summary After Five Years in Orbit. In Proceedings of the 40th Lunar and Planetary Science Conference, Woodlands, TX, USA, 23–27 March 2009; Volume 11, p. 1392. Available online: https://www.lpi.usra.edu/meetings/lpsc2009/pdf/1392.pdf (accessed on 10 May 2025).
- Liu, H.; Li, J.; Meng, X.; Zhou, B.; Fang, G. An Analogical Experiment of Mars Rover Penetrating Radar Onboard Chinese “Zhurong” Martian Rover on Dry/Water Ice Detection. J. Electron. Inf. Technol. 2022, 44, 1336–1342. [Google Scholar] [CrossRef]
Disclaimer/Publisher’s Note: The statements, opinions and data contained in all publications are solely those of the individual author(s) and contributor(s) and not of MDPI and/or the editor(s). MDPI and/or the editor(s) disclaim responsibility for any injury to people or property resulting from any ideas, methods, instructions or products referred to in the content. |
© 2025 by the authors. Licensee MDPI, Basel, Switzerland. This article is an open access article distributed under the terms and conditions of the Creative Commons Attribution (CC BY) license (https://creativecommons.org/licenses/by/4.0/).