Article

A Deep Reinforcement Learning Method with a Low Intercept Probability in a Netted Synthetic Aperture Radar

School of Information and Communication Engineering, University of Electronic Science and Technology of China, Chengdu 611731, China
*
Author to whom correspondence should be addressed.
Remote Sens. 2025, 17(14), 2341; https://doi.org/10.3390/rs17142341
Submission received: 26 June 2025 / Revised: 4 July 2025 / Accepted: 5 July 2025 / Published: 8 July 2025
(This article belongs to the Special Issue Array and Signal Processing for Radar (Second Edition))

Abstract

A deep reinforcement learning (DRL)-based power allocation method is proposed to achieve a low probability of intercept (LPI) in a netted synthetic aperture radar (SAR). To provide a physically meaningful and intuitive assessment of a netted radar for LPI performance, a netted circular equivalent vulnerable radius (NCEVR) is proposed and adopted. For SAR detection performance, the resolution, signal-to-noise ratio in a single pulse, and signal-to-noise ratio in SAR imaging are integrated at the task level. The LPI performance is achieved by minimizing NCEVR within the constraints of SAR detection performance. The powers in multiple moments are optimized using the DRL proximal policy optimization algorithm with the designed reward and observation. A DRL-based solver is provided for LPI radar, which handles problems that are difficult to optimize using traditional methods. The effectiveness is verified by simulations.

1. Introduction

A synthetic aperture radar (SAR) is an all-weather, high-resolution imaging system, which is widely used in military reconnaissance applications [1,2]. With the increasing complexity of the battlefield environment and the development of electronic technology, the survival of a radar in combat is seriously threatened [3]. To ensure survivability, it is necessary to develop a SAR with low probability of intercept (LPI). The LPI radar technology has been greatly developed since it was proposed [4]. A netted radar system consisting of several multiple input multiple output (MIMO) radars has more robust detection and LPI performance [5,6,7,8,9,10,11,12]. In this paper, a power allocation optimization method of a netted MIMO radar is proposed, aiming to implement LPI in SARs.
The resource of the radar is optimized by LPI techniques, resulting in good detection performance and LPI performance. Currently, the performance metric of LPI for a netted radar is still an interesting issue. Existing LPI metrics for a netted radar mainly include interception factor, interception probability, and radiated power. The interception factor for a netted radar is proposed in [13], which equates the netted radar to a single radar without considering the distribution of the radars, thus calculating the equivalent interception factor. The equivalent interception factor is minimized under the condition of the mutual information for target parameter estimation, achieving LPI by adjusting the powers of the netted radar. The interception factor of the netted radar is also used as the LPI metric in [14], which is minimized by optimizing the power allocation and target assignment under the constraint of a minimum mean square error. As touching the interception probability for a netted radar, several papers achieve LPI by minimizing it [6,15,16,17]. For instance, Ref. [6] minimizes the interception probability of the radar system by optimizing the revisit interval, dwell time, and transmit power under the constraint of target tracking performance. Similarly, multiple approaches are proposed in target search and target tracking scenarios [15,16,17], which minimize the interception probability for a netted radar under the constraints of detection performance, thus enhancing the LPI performance. However, the interception probability for a netted radar is a function of the interceptor, which usually requires the known parameters and locations of the interceptors. It is not easy to obtain in practice. The radiated power for a netted radar is used as the LPI performance metric in several papers [18,19,20,21,22]. The system’s radiated energy is considered an objective function to be minimized by optimizing the node selection, dwell time, bandwidth, and power while satisfying the constraint of target tracking accuracy [18,19]. The LPI performance of the radar system is enhanced while maintaining a certain level of target tracking performance. The radiated power of the radar system is considered a constraint in [20,21,22]. The target tracking performance is improved by optimizing the node selection, dwell time, power, and bandwidth, which realizes the LPI performance by the certain radar system power. The probability of being intercepted by an enemy reconnaissance aircraft reduces with a reduction in the radiated power due to the reduction in the propagation strength of the radar signal in space. But the LPI performance is considered indirectly; it is difficult for radiated power to achieve a quantitative and intuitive assessment of LPI. Circular equivalent vulnerable radius (CEVR) is proposed as an LPI metric for a single radar, which is calculated by the easily intercepted area [23]. It is an intuitive LPI metric, but the complexity of the calculation results in few applications. The LPI metric for a netted radar is still an interesting concern. Hence, the CEVR is extended to netted radars in this paper.
Existing LPI methods can be classified into two kinds: maximizing the current detection performance while satisfying the condition of the current LPI performance, and minimizing the current LPI performance while satisfying the condition of the current detection performance. The long-term performance at the task level has to be considered in some scenarios. In SAR, the result is imaged based on data acquired over the entire aperture time. It is necessary to consider the detection performance over the mission period as a whole. Similarly, for LPI performance, one should only consider the effect of the current action on the current situation, which does not optimize the performance over the entire task period. It can not guarantee the performance of the whole task. Therefore, it is necessary to consider the long-term performance of the whole task to ensure the overall optimization of the entire mission for LPI in SAR. Due to scheduling during the entire task in multiple moments, traditional optimization methods may no longer be applicable, which poses a challenge to the solver.
With the development of artificial intelligence technology, deep reinforcement learning (DRL) has become a novel solver for radar resource scheduling in recent years [24]. The optimal action policy is optimized using a data-driven approach, which utilizes the accumulated interaction data between the agent and the environment [25]. DRL not only considers the scheduling for the current moment but also the scheduling over the entire task period for multiple moments. At the same time, it has the characteristic of adaptability, which avoids the complex solution process of traditional optimization methods. In the single-target tracking scenario, a DRL-based resource allocation method is proposed to achieve better long-term and short-term tracking performance, which optimizes node selection and power allocation using a deep deterministic policy gradient (DDPG) method [26]. For multi-target tracking, the DRL method is also adopted to schedule the beam selection and transmit power, resulting in better multi-target tracking performance [27,28]. In the air combat scenario, to ensure the survival and the detection performance of aircraft, a DQN-based reinforcement learning method is employed to achieve real-time scheduling of sensor resources in a dynamic environment, which considers the threat level of the target, the accumulated power radiation, and the acquisition of detection information [29]. In the multi-target detection scenario, a domain knowledge-assisted DRL framework was proposed to achieve better target detection probability by allocating the power of netted MIMO radar, which utilizes the generated timely reward and final task reward to train the policy network [30]. In the integration of target detection and communication scenario, DRL is used to optimize massive MIMO systems to improve the probability of detecting weak targets in strong clutter environments by controlling the number of targets to be focused [31]. In the LPI radar scenario, Ref. [32] considered the transmit signal power and the cumulative signal-to-noise ratio (SNR) intercepted by the electronic intelligence (ELINT) system by optimizing the transmit signal power and the modulation strategy and realizing the LPI in SAR imaging using the reinforcement learning Q-learning algorithm. The LPI performance is considered by the long-term cumulative SNR intercepted by ELINT, and the SAR imaging performance is considered by the current power at each moment without long-term performance. Reinforcement learning-based resource scheduling methods have been applied in multiple scenarios; however, the research in SAR with LPI is not sufficient.
Deep reinforcement learning-based scheduling methods achieve better long-term performance through data-driven approaches, and they can be applied to problems that are difficult to optimize for traditional methods. In this paper, a reinforcement learning-based resource scheduling method is proposed to reduce the probability of a netted MIMO radar being intercepted in SAR detection. For the LPI performance, based on CEVR [23], we propose and adopt the netted circular equivalent vulnerable radius (NCEVR) to provide a physically meaningful and intuitive assessment of a netted radar. For the SAR detection performance, multiple factors of the resolution, single-pulse SNR, and SNR in SAR imaging are considered at the level of the entire long-term imaging task. The LPI performance is achieved by optimizing the power at multiple moments in the entire synthetic aperture time by minimizing the cumulative NCEVR while maintaining the SAR detection performance. The innovation of this paper is as follows: 1. A reinforcement learning-based LPI method for a netted radar is proposed in SAR detection, which is achieved by the joint control of power at multiple moments in aperture time considered at the entire task level. 2. A netted radar LPI metric, NCEVR, is proposed by considering the interactions of multiple radars in areas susceptible to interception. It achieves a physically meaningful and intuitive assessment of LPI performance for any radar distribution and number. 3. Due to the complex computation of NCEVR and the joint scheduling on multiple moments for the performance, it is difficult to solve for traditional methods. This paper provides a novel solver for the intractable problems in LPI radar scenarios.
The rest of this paper is organized as follows. In Section 2, the performance characterizations of SAR imaging and LPI are introduced, and the optimization model of NCEVR in netted radar SAR imaging is described. In Section 3, the observation, action, reward, and the proposed algorithm are designed, and the applicability of the algorithm to the optimization model is described. The proposed method is tested, and the simulations are presented in Section 4. The conclusions are presented in Section 5.

2. Problem Formulation

A netted MIMO radar is considered, which is used to achieve LPI for SAR in spotlight mode. In this section, the performance characterizations of low interception and SAR detection are presented separately. And the optimization model of the netted LPI for a SAR is established.

2.1. Performance Characterization of SAR Detection

In this subsection, the performance characterization of a SAR is introduced, which includes the single-pulse SNR, the SNR in SAR imaging, and the range and azimuth resolution.

2.1.1. Single-Pulse SNR

For a MIMO radar, according to the radar equation [33], the single-pulse SNR can be described as follows:
S N R P m , n , t = P T m , t G T G R λ 2 σ G RP ( 4 π ) 3 R m , n , t 4 K T R F R B R ,
where m, n, and t are the number of radar, target, and time, respectively; for example, S N R P m , n , t is the SNR for a single pulse for radar m to target n at time t. P T m , t is the transmitting pulse power of the radar m at time t. G T and G R are the gains of the transmitting and receiving antennas for all radars. λ is the signal wavelength. σ is the radar cross-section (RCS) of the target, which is a reflectivity number that normalizes per unit area [34]. G RP is the pulse compression gain attributed to the range processing. R m , n , t is the distance between the radar m and the target n at time t. K is the Boltzmann constant. T R , F R , and B R represent absolute temperature, noise figure, and bandwidth, respectively, for all radar receivers. The single-pulse SNR is a function of transmit power and distance when the radar system and the target are fixed.

2.1.2. SNR in SAR Imaging

A SAR is a high-resolution imaging radar technology that utilizes the echoes reflected by the target during the aperture time. The SNR in SAR imaging is a key performance measure that is critical for obtaining high-quality images [34,35]. The imaging process can be regarded as a two-dimensional matched filtering operation in both range and azimuth dimensions [36]. A good SNR improves signal coherence and suppresses noise, leading to the features of the targets not being lost in the noise, and thus making detection more accurate and reliable [37]. Conversely, a low SNR leads to blurry shapes of the structures and mixed pixels after filtering [38,39,40]. Thus, the SNR in SAR imaging is a fundamental performance metric that critically determines image quality. For the single-pulse SNR fixed at each moment, the SNR in SAR imaging of target n for radar m can be described as [34]:
S N R m , n = S N R P m , n , t 0 G A = S N R P m , n , t 0 N 0
where S N R P m , n , t 0 is used to represent the SNR over the entire measurement line. G A is the azimuth process gain due to N 0 coherent pulse integrals. For a more general scenario, when the single-pulse SNR varies, S N R m , n is modified as follows:
S N R m , n = t = 1 T S N R P m , n , t N t
where T is the overall number of time steps for SAR imaging. N t is the pulse number at step t. For the netted radar, the integrated SNR after coherent integration of M radars can be expressed as follows:
S N R n = m = 1 M S N R m , n
To ensure the SNR requirements are met, the system can be characterized as follows:
S N R n S N R th
where S N R th is the threshold in SAR imaging.

2.1.3. Range and Azimuth Resolution

The resolution of SAR is an important parameter of imaging capability, which affects the clarity and detail of SAR imaging. The resolution is usually divided into range resolution and azimuth resolution. The range resolution ρ R is a function with respect to the radar bandwidth B R , which can be described as follows [33]:
ρ R = c 2 B R
where c is the speed of light. The azimuth resolution of SAR in spotlight mode can be described as follows [41]:
ρ A = λ 4 sin ( Δ θ / 2 ) cos θ c .
where ρ A is the azimuth resolution. Δ θ is the beam rotation angle during synthetic aperture time. θ c is the beam center oblique angle. For a given target, the azimuth resolution depends on the beam angle of the start time and the end time.
In order to obtain clear images, the resolution is usually required to be better than the threshold, which can be described as follows:
ρ R ρ Rth
ρ A ρ Ath
Usually, the PRF of the SAR should be greater than a threshold to avoid aliasing in the azimuthal direction. The PRF can be obtained as follows [34]:
f P = 2 k v D .
where k is a constant factor; typically, k 1.5 . v is the platform velocity in the horizontal and orthogonal to the target direction. D is the physical aperture dimension of the antenna.

2.2. Performance Characterization of LPI Radar

With the increasing complex electromagnetic threats, netted radar is being used in low-intercept radar systems to achieve better performance, while at the same time, the characterization of LPI in netted radars is still a topic of interest. In this paper, a new low-intercept performance metric called NCEVR is proposed for netted radars based on CEVR [23]. It achieves the evaluation of LPI performance for any radar distribution and number, which can be described as follows:
N C E V R t = A r e a P I 1 , t N I > S N R Ith or P I 2 , t N I > S N R Ith or or P I M , t N I > S N R Ith / π 1 2
where N C E V R t is the netted circular equivalent vulnerable radius at time t. P I m , t is the power of radar m received by the interceptor at time t. N I is the noise power of the interceptor. S N R Ith is the required SNR of the interceptor satisfying a certain detection probability p D and a certain false alert probability p F . Function A r e a represents the area that satisfies the condition. It can be seen that the netted radar vulnerability area is calculated, and then the equivalent radius is calculated based on the area. Specifically, according to the radar equation, P I m , t can be described as follows:
P I m , t = P A m , t ( 4 π ) R I n 2 = P T m , t T E f P ( 4 π ) R I n 2
where P A m , t = P T m , t T E f P is the average transmitting power of radar m at time t. T E is the effective pulse width, and f P is the pulse repetition frequency. R I m is the distance between radar m and the interceptor. N I can be described as follows:
N I = K T I F I B I
where T I , F I , and B I are the absolute temperature, the noise figure, and the bandwidth of the interceptor receiver, respectively. The relationship between S N R Ith , p D , and p F can be described as follows [16]:
p D = 1 2 erfc ln p F S N R Ith + 0.5
It should be noted that NCEVR is not a simple summation of CEVR but considers multiple radars in the vulnerability areas. It takes into account the interactions of multiple radars on the vulnerability areas, providing a physically meaningful and intuitive evaluation of LPI for a netted radar. However, the need to identify and compute the vulnerability areas when calculating NCEVR also poses significant challenges for traditional optimization methods.

2.3. Optimization Model of NCEVR in Netted Radar SAR Imaging

The coherent combining echoes from multiple pulses increased the SNR in the SAR image, but it also increased the probability of being intercepted. Therefore, it is necessary to consider low interception performance and SAR detection performance comprehensively. An optimization method is used to obtain the transmit power at each moment, minimizing the probability of interception at a certain SAR detection performance. In our paper, only signals with a single-pulse SNR greater than the threshold are considered to be echo signals, and the indicator function I m , n , t can be expressed as follows:
I m , n , t = 1 , if S N R P m , n , t S N R Pth 0 , else ,
where S N R Pth is the single-pulse SNR threshold. According to (3), (4), and (15), the SNR in SAR imaging for target n until aperture time T can be modified as follows:
S N R n = m = 1 M t = 1 T S N R P m , n , t I m , n , t N t
In the absence of the azimuthal direction aliasing, the resolution is obtained from the beam rotation angle and the beam center oblique angle at a certain PRF during the synthetic aperture time. However, in order to minimize the N C E V R t , the proposed LPI netted radar system adjusts the transmit strategy at each moment, which can not guarantee the continuity of the aperture time. For example, the radar only transmits to the target at the start position and the end position, whereas it does not transmit in the span. It causes a very high sidelobe due to the lack of acquisition at the positions between the start and end. Therefore, we calculate the resolution using the beam rotation angle and the beam center oblique angle during continuous acquisition, thus satisfying the resolution without azimuthal aliasing. For a known radar, the specific process is shown in Algorithm 1. In summary, the data that satisfy the single pulse SNR are used for SAR imaging. Then, by judging whether the data acquisition is consecutive or not, the start and end positions of consecutive acquisitions are updated, and the corresponding resolution is calculated and recorded, respectively. Finally, the resolution of each target during the whole task time is calculated.
Algorithm 1 Calculate the azimuth resolution of LPI netted radar for SAR
Input: The positions P o s m , t of the M radars in time T. The positions of the N targets. The single-pulse signal-to-noise ratio S N R p m , n , t from M radars to N targets in time T.
Output: Azimuth resolution ρ A n of each target for the whole task time.
  1:
Initialize the record of azimuth resolution Rec m , n , t with element .
  2:
for  t = 1 t o T do
  3:
     for  m = 1 t o M  do
  4:
         for  n = 1 t o N  do
  5:
              if  ( S N R P m , n , t S N R Pth and S N R P m , n , t + 1 S N R Pth ) or t = 1  then
  6:
                  Obtain the start position during continuous acquisition P o s start = P o s m , t . Obtain the end position during continuous acquisition P o s end = P o s m , t + 1 .
  7:
                  Calculate the the beam rotation angle Δ θ and beam center oblique angle θ c . Calculate the azimuth resolution ρ A m , n , t from radar m to target n at time t, and store in Rec m , n , t .
  8:
              end if
  9:
              if  S N R P m , n , t S N R Pth and S N R P m , n , t + 1 S N R Pth  then
10:
                  Update the end position during continuous acquisition P o s end = P o s m , t + 1 .
11:
                  Calculate the the beam rotation angle Δ θ and beam center oblique angle θ c . Calculate the azimuth resolution ρ A m , n , t from radar m to target n at time t, and store in Rec m , n , t .
12:
              end if
13:
         end for
14:
     end for
15:
end for
16:
Calculate the azimuth resolution of target n at time t; ρ A n , t = min m Rec m , n , t . Calculate the azimuth resolution of target n for the whole task time; ρ A n = min t ρ A n , t = min m , t Rec m , n , t .
In this paper, the cumulative NCEVR in the whole task time is minimized under the conditions of a single-pulse SNR, an SNR in SAR imaging, and the range and azimuth resolution, thus achieving LPI for the netted radar. It should be noted that the single-pulse SNR is included in the calculation of S N R I n in (16) and the calculation of ρ A n in Algorithm 1. The optimization model can be described as follows:
minimize P T m , t t = 1 T N C E V R t s . t . S N R n S N R th , n ρ A n ρ Ath , n ρ R n ρ Rth , n P A m , t P max , m , t P A m , t P min , m , t ,
where P max and P min are the upper and lower limits of the average transmitting power P A m , t , respectively.

3. Data-Driven Resource Allocation Policy Method

In this paper, a deep reinforcement learning method, proximal policy optimization (PPO) [42] is adopted to solve the optimization model. The proposed specific algorithm based on PPO and the applicability to the optimization model are described separately.

3.1. Algorithm

The observation, action, and reward of the agent are presented separately. For a certain SAR, the observation at time step t is defined as follows:
obs t = Pos t , CR A t , CR E t
where Pos t is the M radar positions at time t; specifically,
Pos t = P o s 1 , t , , P o s M , t
CR A t is the completion rate of the azimuth resolution for N targets at time t; specifically,
CR A t = min ρ Ath ρ A 1 , t , 1 , , min ρ Ath ρ A N , t , 1
The highest completion rate is 1. ρ A n , t can be obtained as shown in line 16 of Algorithm 1. CR S t is the completion rate of the SNR in imaging for N targets at time t; specifically,
CR S t = min S N R 1 , t S N R th , 1 , , min S N R N , t S N R th , 1
Element S N R n , t is the SNR in SAR imaging of target n until time t for the netted radar. Similar to the SNR until aperture time T as shown in (16), S N R n , t can be described as follows:
S N R n , t = m = 1 M i = 1 t S N R P m , n , i I m , n , i N i
The observation contains information on the positions and the completion rates. The radar adjusts the transmitting power according to the observation.
The action at time step t is defined as follows:
act t = P T 1 , t , , P T M , t
It is the optimization variables that control the transmitting pulse power of M radars to achieve an LPI netted radar in SAR detection.
The reward is the core component of deep reinforcement learning, which is used to guide the agent to achieve the optimal strategy. In order to achieve a better strategy, the total reward r t includes the primary reward r P t and auxiliary reward r A t . In our method, it can be described as follows:
r t = r P t + r A t
Specifically, r P t can be described as follows:
r P t = α 1 N C E V R t + α 2 r cond 1 t + α 3 r cond 2 t
where α n is the coefficient constant of the corresponding reward. N C E V R t is the reward to realize the LPI performance by maximizing the cumulative rewards in reinforcement learning, which corresponds to t = 1 T N C E V R t . r cond 1 t is the reward for the azimuth resolution constraint, which is defined as follows:
r cond 1 t = 5 , if t = T and n , ρ A n ρ Ath 5 , if t = T and n , ρ A n > ρ Ath 0 , else
r cond 2 t is the reward for the SNR in SAR imaging, which is defined as follows:
r cond 2 t = 5 , if t = T and n , S N R n S N R th 5 , if t = T and n , S N R n < S N R th 0 , else
To maximize returns, the strategy tends to satisfy the constraints with training.
For the strategy converging better, the auxiliary reward r A t is considered, which can be defined as follows:
r A t = α 4 Δ PA t + α 5 Δ PS t + α 6 Δ NA t + α 7 Δ NS t
where Δ PA t and Δ PS t are the improving completion rate of the azimuth resolution and SNR in imaging for the targets at time t. Δ NA t and Δ NS t are the improved satisfied number of the azimuth resolution and SNR in imaging for the targets at time t. Specifically, the improving completion rate of the azimuth resolution Δ PA t is defined as follows:
Δ PA t = n = 1 N C R A t , n n = 1 N C R A t 1 , n
where C R A t , n is the n -th element of CR A t , which is the completion rate of the azimuth resolution for the n -th target at time t. i = n N C R A t , n is the total completion rate of the azimuth resolution at time t. Thus, Δ PA t is the improving completion rate compared to the previous moment. Similar to CR A t , the improving completion rate of the SNR in imaging Δ PS t is defined as follows:
Δ PS t = n = 1 N C R S t , n n = 1 N C R S t 1 , n
where C R S t , n is the n -th element of CR S t . The improving satisfied number of the azimuth resolution Δ NA t is defined as follows:
Δ NA t = n = 1 N 1 { C R A t , n = 1 } n = 1 N 1 { C R A t 1 , n = 1 }
i = n N 1 { C R A t , n = 1 } is the total satisfied number of the azimuth resolution at time t, where the completion rate C R A t , n = 1 . Thus, Δ NA t is the improvement satisfied number compared to the previous moment. Similar to Δ NA t , the improvement satisfied number of the SNR in imaging Δ NS t is defined as follows:
Δ NS t = n = 1 N 1 { C R S t , n = 1 } n = 1 N 1 { C R S t 1 , n = 1 }
In our paper, the proximal policy optimization (PPO) method is adopted to realize the LPI netted radar for SAR imaging. The algorithm is shown in Algorithm 2. The policy network π is used for controlling radar action. Value network V is used for estimating the cumulative reward. N train is the training epoch. N update is the number of stochastic gradient descent (SGD) iterations in each epoch. After training, the radar action in time T can be obtained, realizing LPI in SAR imaging. The optimization results are obtained utilizing the interaction of the agent with the environment through a data-driven approach. The agent learns the optimal strategy through a trial-and-error process. Compared with traditional optimization methods, it can effectively handle complex models and avoid the process that is difficult to solve.
Algorithm 2 LPI netted radar for SAR imaging in PPO
  1:
Initialize the policy network π with parameter ψ , initialize the value network V with parameter ϕ , and initialize the hyperparameter of PPO.
  2:
for  n train = 1 t o N train do
  3:
    Initialize the replay buffer D. Initialize the positions of the N targets and the positions P o s m , t of the M radars in time T.
  4:
    for  t t o T  do
  5:
        Calculate the observation obs t according to (18). Calculate action act t = π obs t ψ . Calculate the reward r t according to (24).
  6:
        if  t < T  then
  7:
           Calculate obs t + 1 .
  8:
        else
  9:
           Go to step 3.
10:
        end if
11:
        Store ( obs t , act t , r t , obs t + 1 ) in replay buffer D.
12:
    end for
13:
    for  n update = 1 t o N update  do
14:
        Sample mini-batch of transitions from D. Update parameters ψ and parameters ϕ based on PPO.
15:
    end for
16:
end for

3.2. Applicability to the Optimization Model

The original optimization problem as shown in (17) can be relaxed to the following unconstrained problem by the Lagrangian relaxation method [43], which can be described as follows:
minimize P A m , t t = 1 T N C E V R t + n = 1 N μ n S N R th S N R n + n = 1 N β n ρ A n ρ Ath
where μ n and β n are the Lagrange multipliers corresponding to inequality constraints.
Based on the DRL theory, the agent learns the optimal strategy by maximizing the objective function. The objective function J π θ is the expectation of cumulative discount reward, which can be defined as [44]:
J π ψ = E τ ρ ψ ( τ ) t = 0 T γ t r t
where ψ is the parameters of the policy network π . τ is the trajectory observed by the agent. ρ ψ is the probability distribution of the trajectory. γ [ 0 , 1 ] is the reward discount factor, which is used to denote the importance of the current reward for the future. The total reward r t can be divided into the primary reward r P t and the auxiliary reward r A t . The potential-based reward shaping is used to design the auxiliary reward r A t , which can accelerate the convergence of the algorithm under the optimal policy invariance [45]. Thus, the objective function of the optimal policy can be simplified to
J π ψ = E τ ρ ψ ( τ ) t = 0 T γ t r P t
According to (25) and (35) can be described as follows:
J π ψ = E τ ρ ψ ( τ ) [ t = 0 T γ t α 1 N C E V R t + γ t α 2 r cond 1 t + γ t α 3 r cond 2 t = E τ ρ ψ ( τ ) [ ( t = 0 T γ t α 1 N C E V R t ) + γ T α 2 r cond 1 t + γ T α 3 r cond 2 t
When γ = 1 ,maximizing J π ψ is equivalent to minimizing the original problem with Lagrangian relaxation as shown in (33). μ n , β n , α n , and the value of r cond 1 t and r cond 2 t are coefficients that correspond to each other. For example, (33) can correspond to α 1 = 1 in (36). When S N R 1 < S N R th , r cond 2 t = 5 α 3 ; this corresponds to μ 1 being equal to a value such that μ 1 S N R th S N R 1 = 5 α 3 and μ n 1 = 0 . In summary, the optimal solution of the optimization model as shown in (17) can be solved by the proposed method. However, the algorithm is not easy to converge when γ = 1 [46], which leads to bad results. In practice, γ can be set to converge to 1, thus obtaining a suboptimal solution to the original optimization model.

4. Simulation

In this section, the proposed method’s performance is verified by evaluating the simulations performed. The optimization model in (17) can be solved not only by the proposed algorithm based on PPO but also by other intelligent optimization algorithms. The particle swarm optimization algorithm [47] is used for comparison, which optimizes the transmitting power of the netted radar at all times, referred to as PSO-A. Furthermore, a conventional situation with fixed transmitting power across all times is considered and optimized using particle swarm optimization, referred to as PSO-S. The simulation setting and simulation results are introduced in turn.

4.1. Simulation Setting

As shown in Figure 1, an LPI netted radar consisting of 4 movement radars was considered, which realized SAR imaging with a high resolution. The total time of the task was 198 s with 99 time steps. The initial positions of the radar were [10 km, 10 km], [10 km, 18 km], [10 km, 22 km], and [10 km, 30 km], respectively, and the velocities were the same [100 m/s, 0 m/s]. The positions of the 10 targets were [20 km, 0 km], [25 km, 5 km], [15 km, 12 km], [20 km, 14 km], [25 km, 16 km], [20 km, 26 km], [12 km, 40 km], [15 km, 40 km], [27 km, 40 km], and [28 km, 40 km], respectively. The RCS of each target was 1. For the radars, the transmitting antenna gain G T was 25 dB, and the receiving antenna gain G R was 25 dB. The signal wavelength λ was 0.03 m. The pulse repetition frequency f P was 2000 Hz, and the pulse width T E was about 2.1 × 10 6 s. The pulse compression gain G RP was 30 dB. The absolute temperature of the receiver T r was 290 K, and the noise figure F r was 3 dB. The single-pulse SNR threshold S N R Pth was set to −30 dB. The SNR threshold in SAR imaging S N R th was set to 40 dB. The azimuth resolution threshold ρ Ath and range resolution threshold ρ Rth were both 0.1 m. In order to satify the range resolution ρ R 0.1 m, the bandwidth B R was set to 1.5 GHz according to (6). The upper limit P max and lower limit P min of the average transmitting power were set to 1 and 0, respectively. Regarding the interceptor, the receiver temperature, noise figure, and bandwidth were T I = 290 K, F I = 3 dB, and B I = 1.5 GHz. The required SNR of the interceptor S N R Ith was set to 15 dB, whose detection probability p D was about 0.99, with the false alert probability p F = 1 × 10 7 , according to (14).
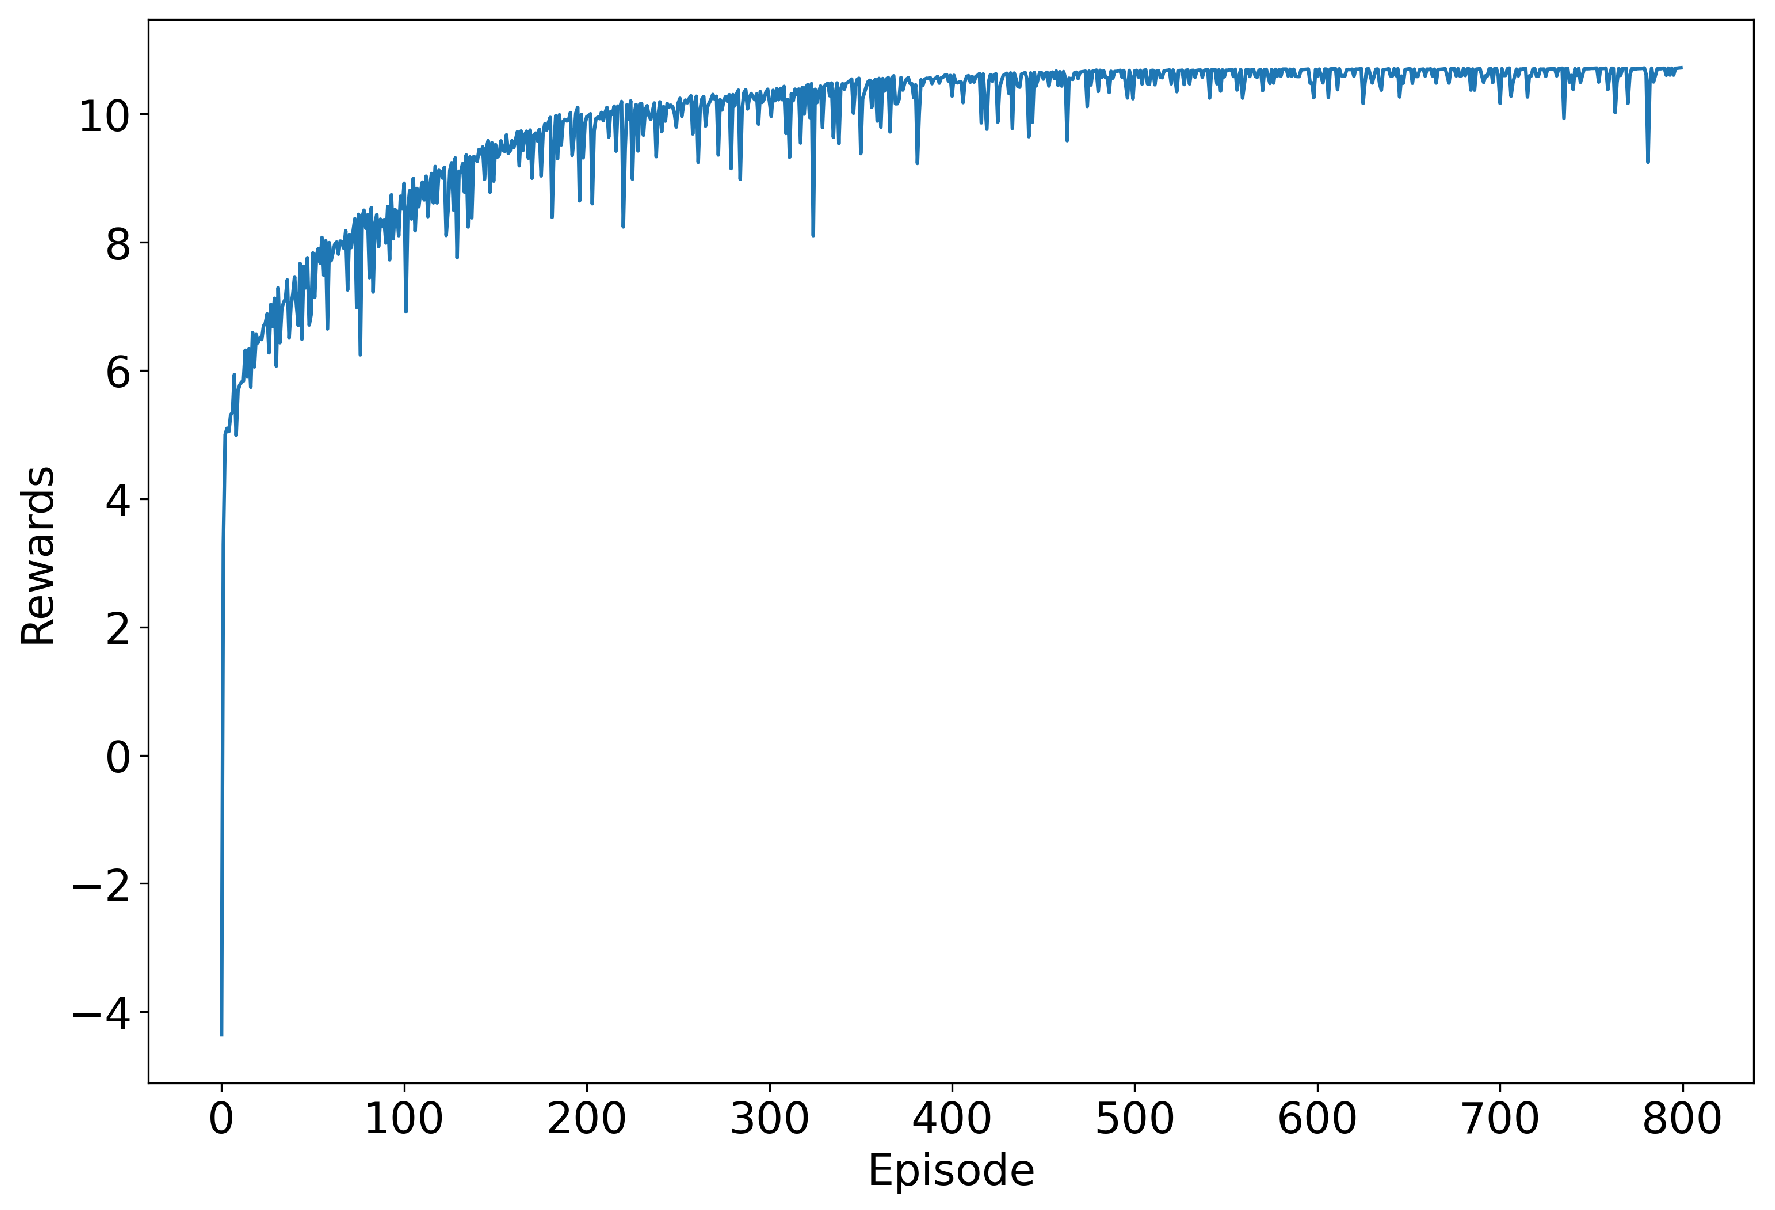
In this study, the policy network ψ and the value network V were constructed as fully connected neural networks with two hidden layers, each containing 256 neurons. The coefficient constants of the reward were set to α 1 = 2 × 10 5 , α 2 = 1 , α 3 = 1 , α 4 = 2 , α 5 = 2 , α 6 = 0.2 , and α 7 = 0.2 . The reward discount factor γ was set to 0.99. The replay buffer size D m was 10,000. The learning rate decreased gradually from 1 × 10 5 to 1 × 10 7 . The training epoch N train was 800, and the number of SGD iterations N update in each epoch was 30. As shown in the reward in Figure 2, the algorithm gradually converged with the network training.

4.2. Simulation Results

In scenario one, the average transmitting power P A m , t of 4 radars was obtained after the policy network ψ was trained, as shown in Figure 3. The results were obtained by minimizing the total NCEVR in task time subject to constraints on detection performance. It can be seen that, compared with Radar 2 and Radar 3, the average transmitting power of Radar 1 and Radar 4 is higher, which is because the distance of the target at the top (Target 1) and the bottom (Targets 7, 8, 9, 10) in scenario one is farther. In particular, Radar 4 has to take on more SAR imaging and transmit more power since multiple long-range targets are at the top.
The easily intercepted area corresponding to the transmitting power is shown in Figure 4. Due to space limitations, only a few moments are shown. It should be noted that the easily intercepted area is not the sum of the respective radars’ areas, which should take into account the radar’s positional distribution due to the overlap. The easily intercepted areas for PPO and PSO-A are presented in the first and second rows of Figure 4, respectively. While both methods optimize the transmitting power across all time steps, their computational architectures differ fundamentally, with PPO’s deep reinforcement learning framework contrasting with PSO’s intelligent optimization algorithms. The easily intercepted area for PSO-S is presented in the third row of Figure 4, resulting from the fixed transmitting power configuration in the conventional scenario, where transmitting powers are optimized using PSO. Since each radar’s transmitting power remains fixed, the easily intercepted area remains constant across all time steps.
The proposed PPO method enhances LPI performance while maintaining imaging performance. To verify its LPI performance, we compare the results of PPO, PSO-A, and PSO-S, where NCEVR computed from the easily intercepted area for a netted radar is evaluated at different time, as shown in Figure 5.
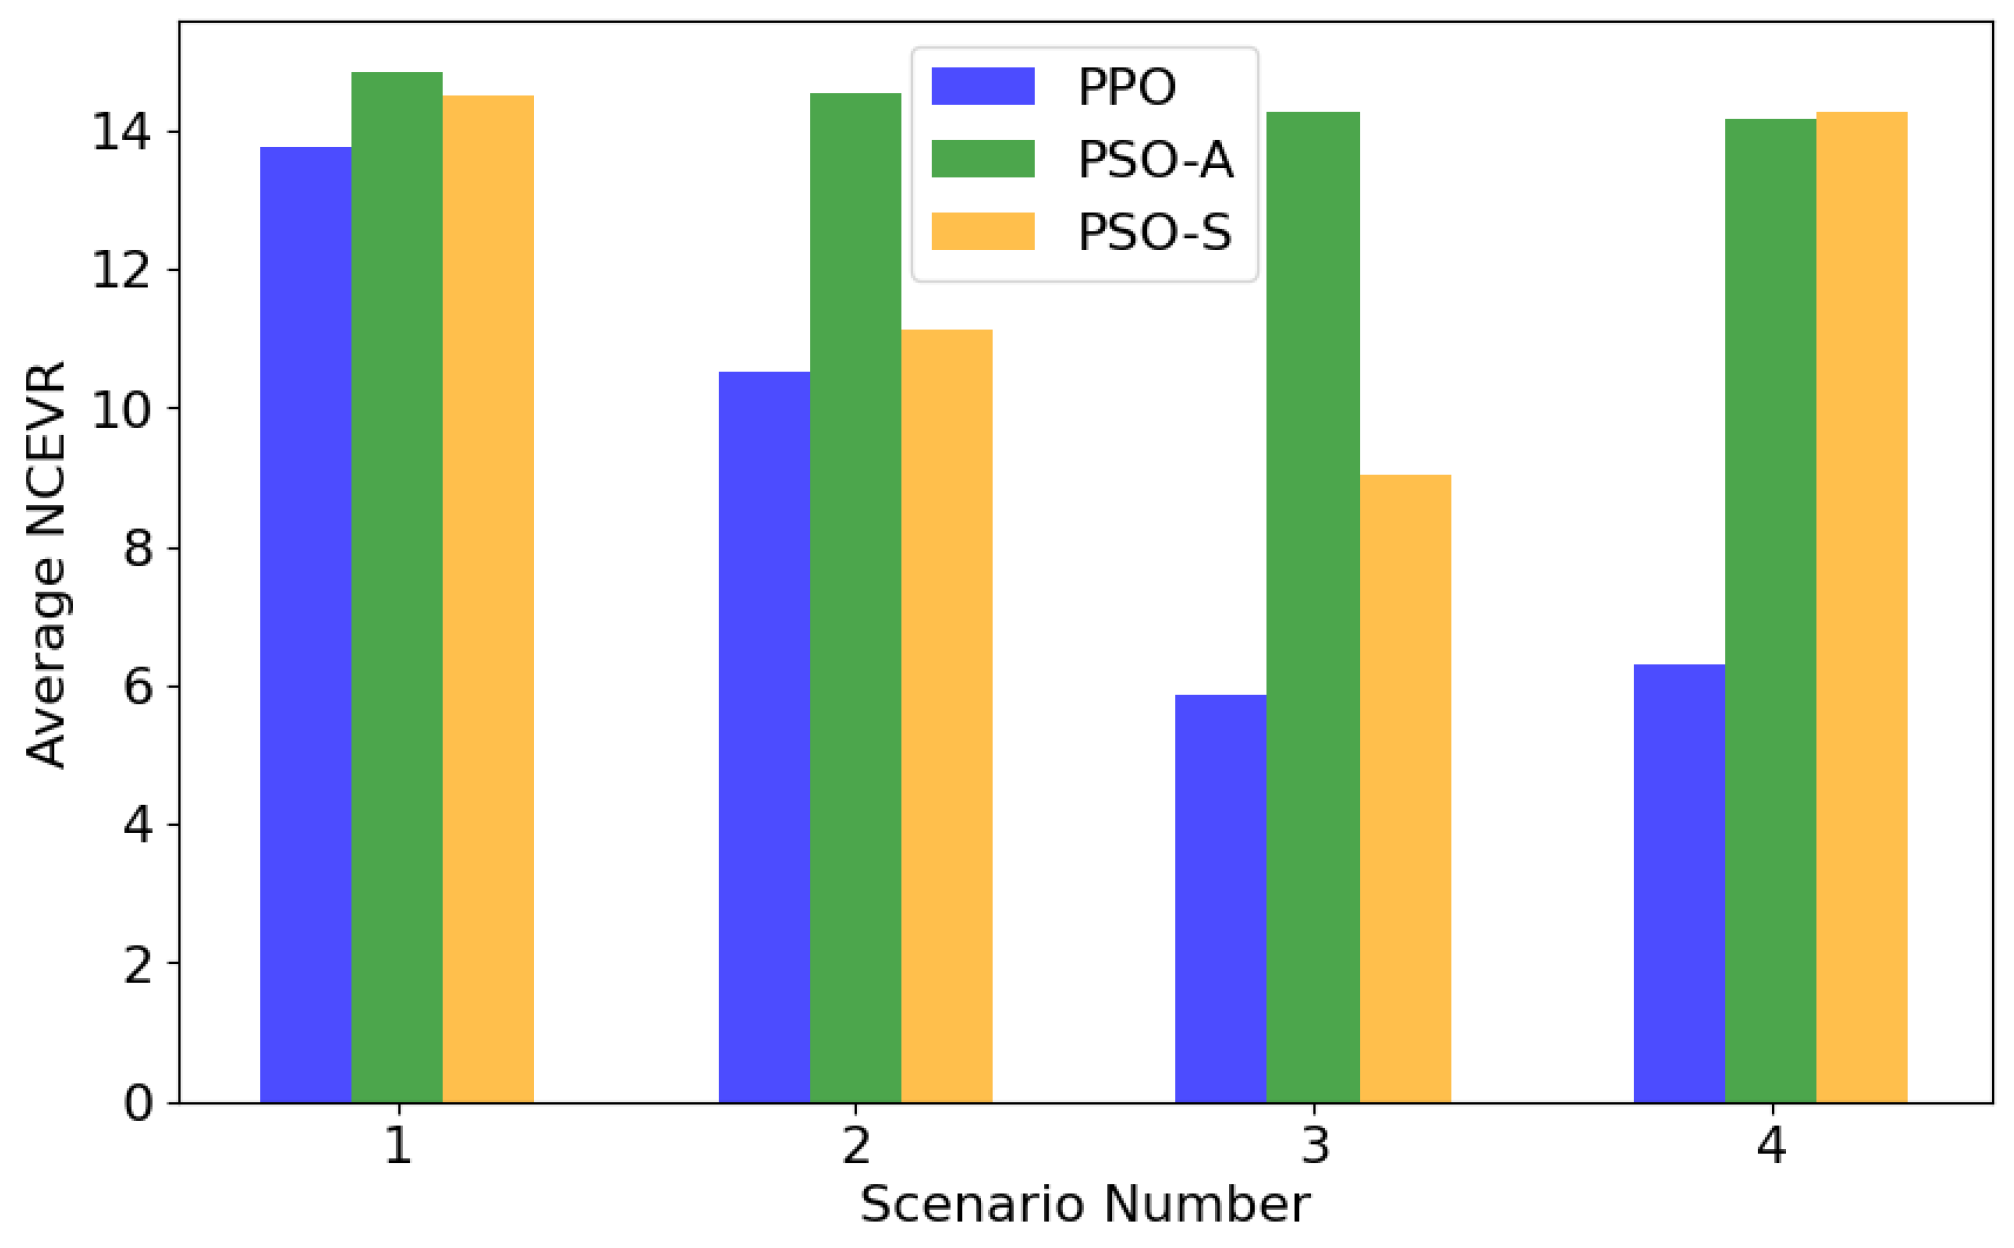
For the proposed PPO-based method, the mid-mission NCEVR is larger than that of PSO-A and PSO-S, but the NCEVR of PPO is smaller at most of the other moments. The objective function is to optimize the cumulative NCEVR over the entire task time; the results are shown in Figure 6, scenario one. The average NCEVR in the task time for PPO is 13.77, which is less than 14.85 for PSO-A and 14.50 for PSO-S. It should be noted that the PSO-S method can be viewed as a special case of the more general PSO-A approach. In theory, if both algorithms converge to their global optima, PSO-A should achieve performance that is either superior or at least equivalent to that of PSO-S. However, the long-term power allocation problem, which involves optimizing transmit power for multiple radars over time, poses a significant challenge for PSO-A. Due to the high dimensionality and non-convexity of the problem, PSO-A tends to fall into local optima. Therefore, a reinforcement learning-based method, PPO, was adopted to solve the long-term optimization problem in this study. By leveraging its ability to explore and exploit high-dimensional state-action spaces effectively, the proposed PPO avoids local optima and achieves better LPI performance.
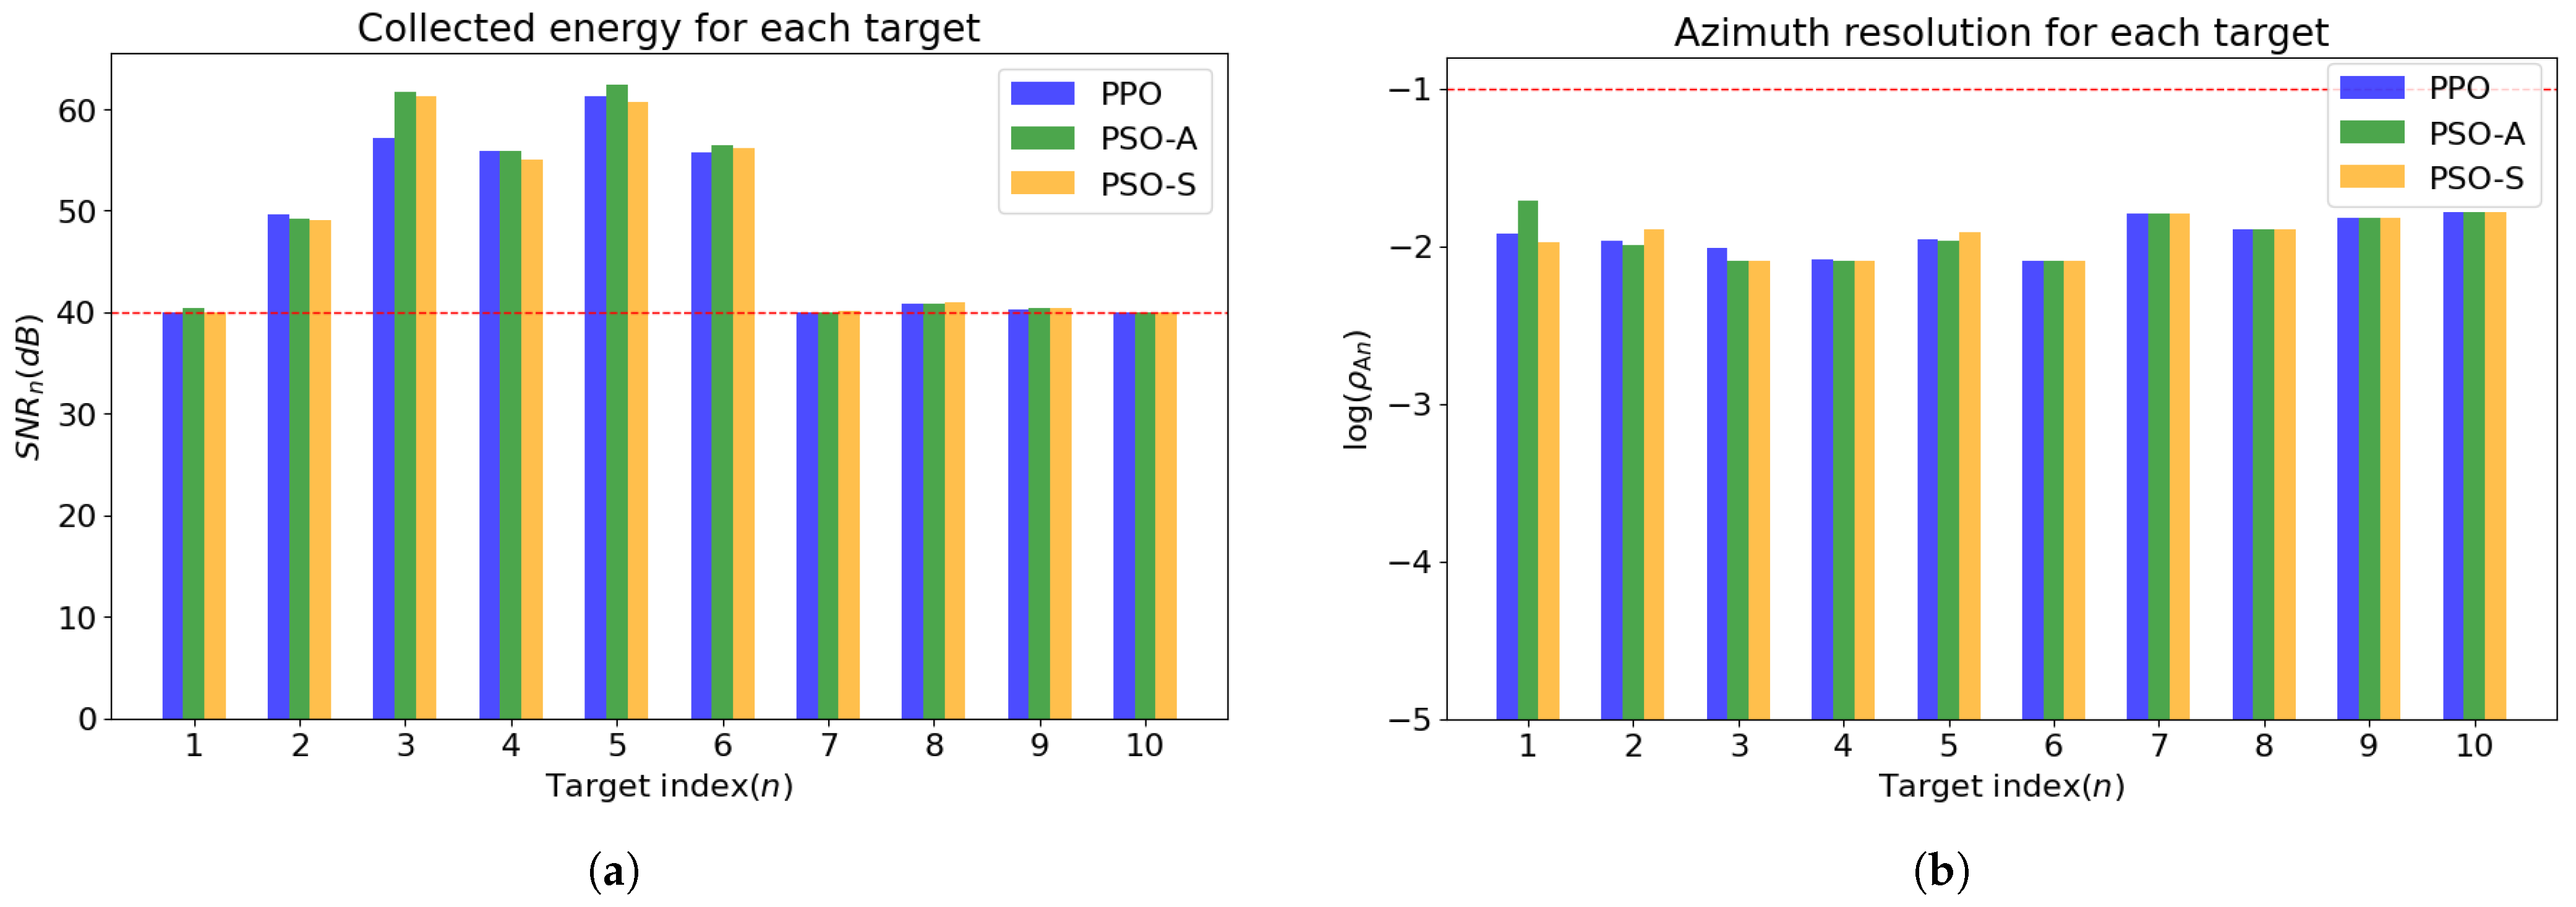
To verify the imaging performance, the SNR in SAR imaging and the azimuth resolution of 10 targets are shown in Figure 7, where the red dashed line is the threshold. The SNR in the SAR imaging of the targets S N R n is greater than the threshold, and the azimuth resolution of the targets ρ A n is less than the threshold, satisfying the constraints. As for the range resolution ρ R , it is ensured by the radar bandwidth B R in (6).
To further verify the SAR imaging performance, the back projection (BP) algorithm was adopted [48]. In the BP algorithm, the target signal energy distributed across multiple echoes is concentrated at its true position through phase compensation and coherent integration, thereby reconstructing the image. Meanwhile, the noises in the echoes do not accumulate due to incoherence. Therefore, the imaging performance is represented by the sum of the SNR of multiple radars at multiple times, that is, the sum SNR after coherent accumulation in (16). The mean square error (MSE) of 10 targets in scenario one after the BP algorithm imaging is shown in Figure 8. Targets with a higher SNR generally exhibit a lower MSE.
Due to space limitations, part of the imaging results are shown in Figure 9, corresponding to the maximum MSE = 0.0043 (target 8) and minimum MSE = 0.0022 (target 6) in Figure 8 for the proposed method. As shown in Figure 9a, the ground truths of all targets are identical, featuring a 0.3 m × 0.3 m square with a 0.1 m × 0.1 m hollow centered at its midpoint. Target 8, which produced the worst imaging result (highest MSE) under the proposed PPO method, PPO, PSO-A, and PSO-S, achieved similar imaging results as shown in the second row of Figure 9, meeting the required SAR imaging performance. Target 6, which achieved the minimum MSE among all targets under the proposed PPO method, exhibited imaging results with significantly reduced noise as shown in Figure 9e. In general, the proposed PPO method achieved satisfactory imaging of the targets while providing better LPI performance compared with PSO-A and PSO-S.
The proposed PPO method’s LPI performance improvement compared with PSO-A and PSO-S is related to the scenarios. A specific case in scenario two is considered as shown in Figure 10a.
The transmitting power of the PPO method is shown in Figure 11a. Radar 1 continuously emits power toward the targets to ensure LPI and imaging performance, as it operates at a shorter distance to the targets. Since the transmitting power of PPO is similar to the fixed power of PSO-S in conventional scenarios, PPO achieves an average NCEVR of 10.58, which is comparable to PSO-S’s 11.12 as shown in Figure 6, scenario two.
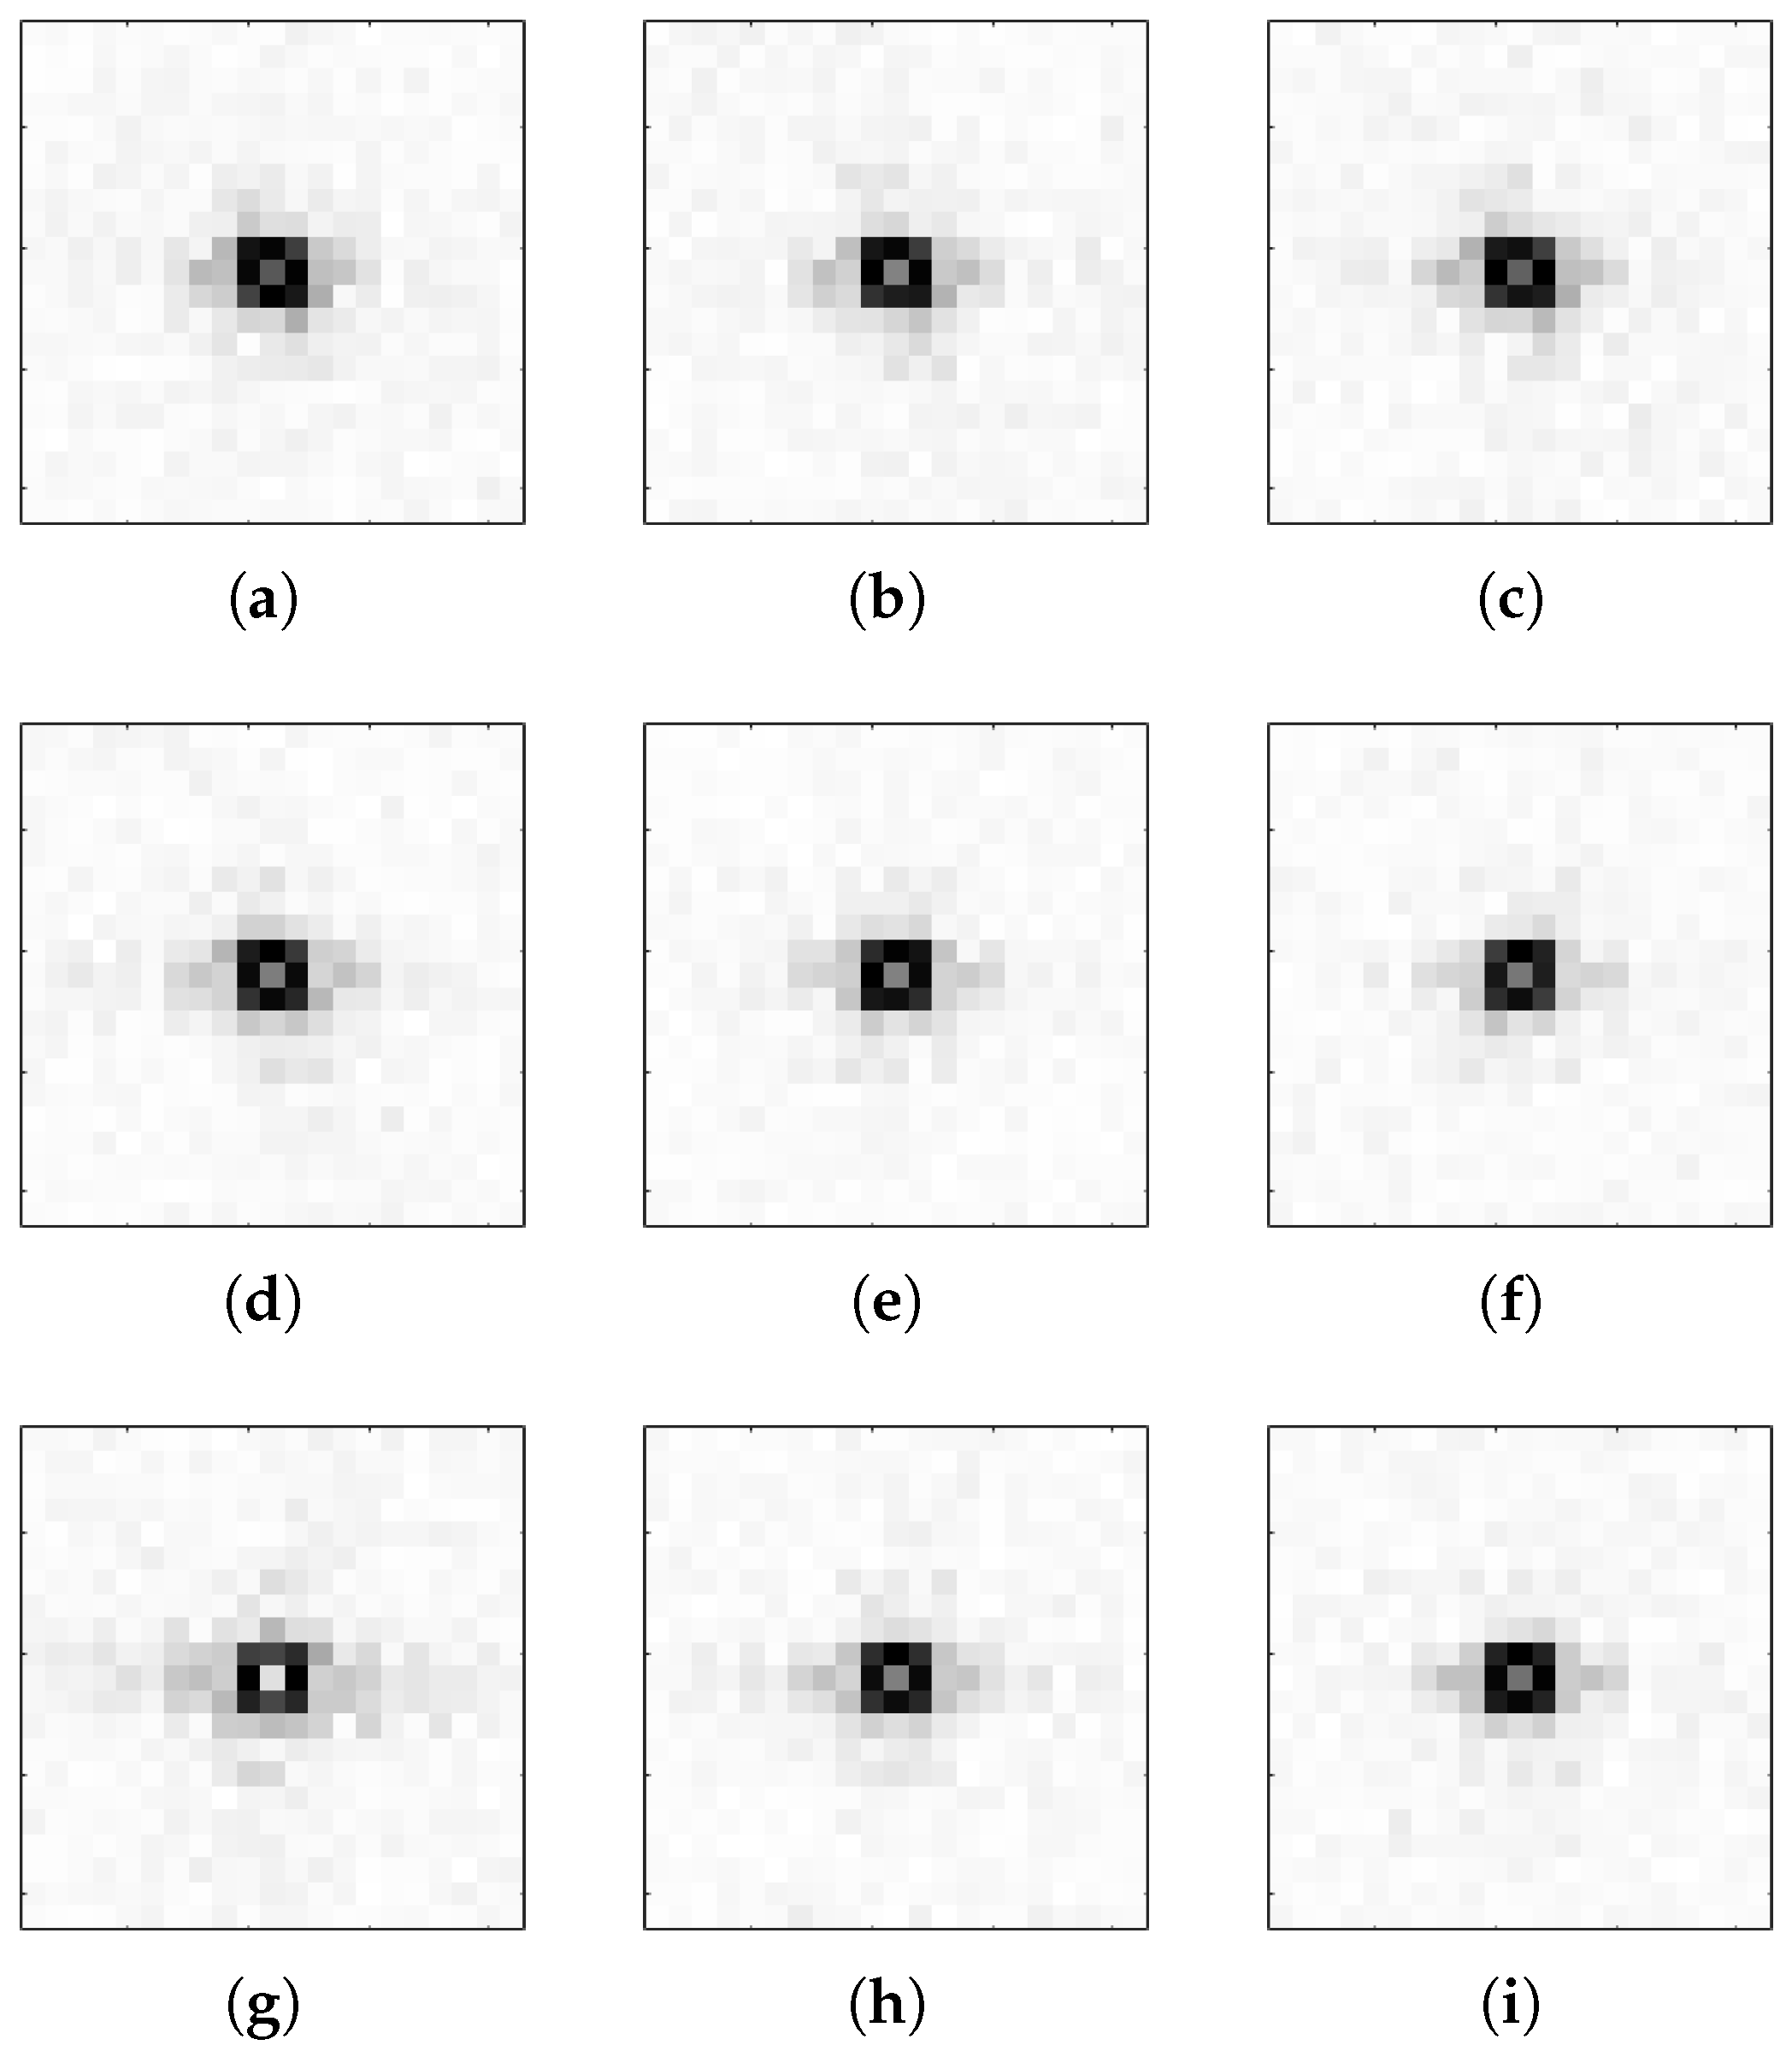
As for the imaging results, due to space limitations, the targets with maximum MSE = 0.0043 for PPO are shown in the first row of Figure 12. The results are intentionally chosen to reflect the worst imaging performance of PPO. Nevertheless, PPO achieves satisfactory imaging results compared to PSO-A and PSO-S.
In scenario three of Figure 10b, the transmitting power of the PPO method is presented in Figure 11b. Since the five targets are located at the starting position of Radar 1, it tends to transmit power at this time. Meanwhile, since three of the five targets [12 km, 3 km], [14 km, 3 km], and [16 km, 3 km] are relatively far away from Radar 1, targets [16 km, 13 km] and [18 km, 15 km] are also adequately detected during the scanning of these three targets, eliminating the need for other radars to operate. When they move away from these targets, Radar 1 stops transmitting, ensuring that the NCEVR is minimized for the entire task. In this scenario, the conventional fixed transmitting power approach in PSO-S is no longer suitable. As a result, PPO achieves an average NCEVR of 5.88, significantly lower than PSO-S’s 9.05 as shown in Figure 6, scenario three. And PSO-A converged to a local optimum solution, resulting in 14.25. As shown in the second row of Figure 12, the target with maximum MSE = 0.0037 for PPO is selected to show its worst-case imaging performance. The results show that PPO achieves the best LPI performance with similar imaging performance.
In scenario four of Figure 10c, a randomly generated scenario is also considered to verify the proposed PPO-based method. The transmitting power is shown in Figure 11c. The imaging results of the target with maximum MSE=0.0047 for PPO are shown in the third row of Figure 12. Within SAR imaging performance constraints, PPO minimizes LPI through optimal transmit power allocation over the whole mission. As shown in Figure 6 scenario four, PPO achieves an average NCEVR of 6.30, which is less than 14.18 for PSO-A and 11.75 for PSO-S. In summary, the proposed PPO algorithm explores the optimal action using a deep reinforcement learning method. It is illustrated and validated in different scenarios, which achieves better performance compared with PSO-A and PSO-S.

5. Conclusions

In this paper, a PPO-based reinforcement learning method is proposed to achieve LPI for netted radar in SAR imaging. For the LPI performance, this paper proposes NCEVR based on CEVR, which provides a physically meaningful characterization of the LPI performance for netted radar. For SAR imaging performance, the single-pulse SNR, the SNR in SAR imaging, and the resolution ratio are considered and verified using the BP algorithm. It should be noted that the LPI performance and SAR imaging performance in this paper are the comprehensive results of radar resource scheduling at different moments during the entire time. A PPO-based method is employed to optimize the cumulative NCEVR for the whole mission, with the constraints of the SAR imaging performance. The proposed method was verified through simulation experiments, and its LPI performance was better than that of the comparison algorithm.

Author Contributions

Conceptualization, L.X., Z.C. and H.L.; methodology, L.X. and Z.C.; supervision, M.L. and H.L.; validation, L.X.; formal analysis, L.X. and Z.C.; investigation, L.X. and Z.C.; resources, L.X., Z.C. and M.L.; data curation, L.X.; writing—original draft preparation, L.X.; writing—review and editing, Z.C. and M.L.; visualization, L.X.; project administration, M.L. and H.L.; funding acquisition, Z.C. and H.L. All authors have read and agreed to the published version of the manuscript.

Funding

This work was supported in part by the National Natural Science Foundation of China under Grant 62231006 and in part by the Municipal Government of Quzhou under Grant 2023D040.

Data Availability Statement

Certain portions of the data are being used in ongoing related research and projects; premature disclosure may disrupt the progression of these studies or affect the outcomes of associated experiments. To ensure research integrity and orderly project advancement, the feasibility of data disclosure will be evaluated after all related research and projects are completed. For interested researchers, reasonable data requests will be assessed by the corresponding author, and the necessary data support will be provided within permissible boundaries.

Conflicts of Interest

The authors declare no conflicts of interest.

References

  1. Brenner, A.R.; Ender, J.H. Demonstration of advanced reconnaissance techniques with the airborne SAR/GMTI sensor PAMIR. IEE Proc.-Radar Sonar Navig. 2006, 153, 152–162. [Google Scholar] [CrossRef]
  2. Ren, H.; Zhou, R.; Zou, L.; Tang, H. Hierarchical Distribution-Based Exemplar Replay for Incremental SAR Automatic Target Recognition. IEEE Trans. Aerosp. Electron. Syst. 2025, 61, 6576–6588. [Google Scholar] [CrossRef]
  3. Butt, F.A.; Jalil, M. An overview of electronic warfare in radar systems. In Proceedings of the 2013 The International Conference on Technological Advances in Electrical, Electronics and Computer Engineering (TAEECE), Konya, Turkey, 9–11 May 2013; pp. 213–217. [Google Scholar]
  4. Schleher, D.C. Low probability of intercept radar. In Proceedings of the International Radar Conference, Arlington, VA, USA, 6–9 May 1985; pp. 346–349. [Google Scholar]
  5. Li, J.; Stoica, P. MIMO radar with colocated antennas. IEEE Signal Process. Mag. 2007, 24, 106–114. [Google Scholar] [CrossRef]
  6. Shi, C.; Zhou, J.; Wang, F. LPI based resource management for target tracking in distributed radar network. In Proceedings of the 2016 IEEE Radar Conference (RadarConf), Philadelphia, PA, USA, 2–6 May 2016; pp. 1–5. [Google Scholar]
  7. Yi, W.; Yuan, Y.; Hoseinnezhad, R.; Kong, L. Resource scheduling for distributed multi-target tracking in netted colocated MIMO radar systems. IEEE Trans. Signal Process. 2020, 68, 1602–1617. [Google Scholar] [CrossRef]
  8. Zhang, H.; Xie, J.; Zong, B. Bi-objective particle swarm optimization algorithm for the search and track tasks in the distributed multiple-input and multiple-output radar. Appl. Soft Comput. 2021, 101, 107000. [Google Scholar] [CrossRef]
  9. Sun, H.; Li, M.; Zuo, L.; Zhang, P. Joint radar scheduling and beampattern design for multitarget tracking in netted colocated MIMO radar systems. IEEE Signal Process. Lett. 2021, 28, 1863–1867. [Google Scholar] [CrossRef]
  10. Zheng, W.; Shi, J.; Li, Y.; Huang, Z.; Zhang, Z.; Li, Z. D 2 AF-Net: A Dual-Domain Adaptive Fusion Method for Radar Deception Jamming Recognition. IEEE Trans. Aerosp. Electron. Syst. 2025, 1–15. [Google Scholar] [CrossRef]
  11. Zhang, H.; Liu, W.; Zhang, Q.; Zhang, L.; Liu, B.; Xu, H.X. Joint Power, Bandwidth, and Subchannel Allocation in a UAV-Assisted DFRC Network. IEEE Internet Things J. 2025, 12, 11633–11651. [Google Scholar] [CrossRef]
  12. Zhang, H.; Weijian, L.; Zhang, Q.; Taiyong, F. A robust joint frequency spectrum and power allocation strategy in a coexisting radar and communication system. Chin. J. Aeronaut. 2024, 37, 393–409. [Google Scholar] [CrossRef]
  13. Shi, C.; Zhou, J.; Wang, F. Low probability of intercept optimization for radar network based on mutual information. In Proceedings of the 2014 IEEE China Summit & International Conference on Signal and Information Processing (ChinaSIP), Xi’an, China, 9–13 July 2014; pp. 683–687. [Google Scholar]
  14. She, J.; Zhou, J.; Wang, F.; Li, H. LPI optimization framework for radar network based on minimum mean-square error estimation. Entropy 2017, 19, 397. [Google Scholar] [CrossRef]
  15. Lu, X.; Yi, W.; Lai, Y.; Su, Y. LPI-based joint node selection and power allocation strategy for target tracking in distributed MIMO radar. In Proceedings of the 2022 25th International Conference on Information Fusion (FUSION), Linköping, Sweden, 4–7 July 2022; pp. 1–7. [Google Scholar]
  16. Shi, C.; Zhou, J.; Wang, F. Adaptive resource management algorithm for target tracking in radar network based on low probability of intercept. Multidimens. Syst. Signal Process. 2018, 29, 1203–1226. [Google Scholar] [CrossRef]
  17. Liu, D.; Wang, F.; Shi, C.; Zhang, J. LPI based optimal power and dwell time allocation for radar network system. In Proceedings of the 2016 CIE International Conference on Radar (RADAR), Guangzhou, China, 10–13 October 2016; pp. 1–5. [Google Scholar]
  18. Shi, C.; Ding, L.; Wang, F.; Salous, S.; Zhou, J. Low probability of intercept-based collaborative power and bandwidth allocation strategy for multi-target tracking in distributed radar network system. IEEE Sens. J. 2020, 20, 6367–6377. [Google Scholar] [CrossRef]
  19. Zhang, W.; Shi, C.; Zhou, J. LPI-based joint node selection and power allocation for target localization in non-coherent distributed MIMO radar with low complexity. In Proceedings of the IET International Radar Conference (IET IRC 2020), Online, 4–6 November 2020; Volume 2020, pp. 138–143. [Google Scholar]
  20. Hu, J.; Zuo, L.; Varshney, P.K.; Gao, Y. Resource Allocation for Distributed Multi-Target Tracking in Radar Networks with Missing Data. IEEE Trans. Signal Process. 2024, 72, 718–734. [Google Scholar] [CrossRef]
  21. Xie, M.; Yi, W.; Kirubarajan, T.; Kong, L. Joint node selection and power allocation strategy for multitarget tracking in decentralized radar networks. IEEE Trans. Signal Process. 2017, 66, 729–743. [Google Scholar] [CrossRef]
  22. Su, Y.; He, Z.; Cheng, T.; Wang, J. Joint Node and Resource Scheduling Strategy for the Distributed MIMO Radar Network Target Tracking via Convex Programming. In Proceedings of the IGARSS 2022-2022 IEEE International Geoscience and Remote Sensing Symposium, Kuala Lumpur, Malaysia, 17–22 July 2022; pp. 4098–4101. [Google Scholar]
  23. Wu, P.H. On sensitivity analysis of low probability of intercept (LPI) capability. In Proceedings of the MILCOM 2005-2005 IEEE Military Communications Conference, Atlantic City, NJ, USA, 17–20 October 2005; pp. 2889–2895. [Google Scholar]
  24. Shyalika, C.; Silva, T.; Karunananda, A. Reinforcement learning in dynamic task scheduling: A review. SN Comput. Sci. 2020, 1, 306. [Google Scholar] [CrossRef]
  25. Li, Y. Deep Reinforcement Learning: An Overview. arXiv 2017, arXiv:1701.07274. [Google Scholar]
  26. Shi, Y.; Jiu, B.; Yan, J.; Liu, H. Data-driven radar selection and power allocation method for target tracking in multiple radar system. IEEE Sens. J. 2021, 21, 19296–19306. [Google Scholar] [CrossRef]
  27. Shi, Y.; Jiu, B.; Yan, J.; Liu, H.; Li, K. Data-driven simultaneous multibeam power allocation: When multiple targets tracking meets deep reinforcement learning. IEEE Syst. J. 2020, 15, 1264–1274. [Google Scholar] [CrossRef]
  28. Shi, Y.; Zheng, H.; Li, K. Data-Driven Joint Beam Selection and Power Allocation for Multiple Target Tracking. Remote Sens. 2022, 14, 1674. [Google Scholar] [CrossRef]
  29. He, J.; Wang, Y.; Liang, Y.; Hu, J.; Yan, S. Learning-based airborne sensor task assignment in unknown dynamic environments. Eng. Appl. Artif. Intell. 2022, 111, 104747. [Google Scholar] [CrossRef]
  30. Wang, Y.; Liang, Y.; Zhang, H.; Gu, Y. Domain knowledge-assisted deep reinforcement learning power allocation for MIMO radar detection. IEEE Sens. J. 2022, 22, 23117–23128. [Google Scholar] [CrossRef]
  31. Zhai, W.; Wang, X.; Cao, X.; Greco, M.S.; Gini, F. Reinforcement learning based dual-functional massive MIMO systems for multi-target detection and communications. IEEE Trans. Signal Process. 2023, 71, 741–755. [Google Scholar] [CrossRef]
  32. Yuan, Y.; Liu, X.; Zhang, T.; Cui, G.; Kong, L. Reinforcement Learning-Enhanced Adaption of Signal Power and Modulation for LPI Radar System. IEEE Trans. Aerosp. Electron. Syst. 2024, 60, 8555–8568. [Google Scholar] [CrossRef]
  33. Richards, M.A. Fundamentals of Radar Signal Processing; Mcgraw-Hill: New York, NY, USA, 2005; Volume 1. [Google Scholar]
  34. Doerry, A.W. Performance Limits for Synthetic Aperture Radar; Technical Report; Sandia National Laboratories (SNL): Albuquerque, NM, USA; Livermore, CA, USA, 2006. [Google Scholar]
  35. Van Zyl, J.J. Synthetic Aperture Radar Polarimetry; John Wiley & Sons: Hoboken, NJ, USA, 2011. [Google Scholar]
  36. Wei, J.; Li, Y.; Yang, R.; Li, L.; Guo, L. Method of high signal-to-noise ratio and wide swath SAR imaging based on continuous pulse coding. IEEE J. Sel. Top. Appl. Earth Obs. Remote Sens. 2022, 15, 2185–2196. [Google Scholar] [CrossRef]
  37. Makas, E.; Aslan, A.R. Spaceborne SAR System Design Considerations: Minimizing Satellite Size and Mass, System Parameter Trade-Offs, and Optimization. Appl. Sci. 2024, 14, 9661. [Google Scholar] [CrossRef]
  38. Jiang, M.; Guarnieri, A.M. Distributed scatterer interferometry with the refinement of spatiotemporal coherence. IEEE Trans. Geosci. Remote Sens. 2020, 58, 3977–3987. [Google Scholar] [CrossRef]
  39. Jiang, M.; Hooper, A.; Tian, X.; Xu, J.; Chen, S.N.; Ma, Z.F.; Cheng, X. Delineation of built-up land change from SAR stack by analysing the coefficient of variation. ISPRS J. Photogramm. Remote Sens. 2020, 169, 93–108. [Google Scholar] [CrossRef]
  40. Zhao, Y.; Jiang, M. Integration of optical and SAR imagery for dual PolSAR features optimization and land cover mapping. IEEE J. Miniaturization Air Space Syst. 2022, 3, 67–76. [Google Scholar] [CrossRef]
  41. Liu, H.-Y.; Song, H.-J.; Cheng, Z.-J. Comparative study on stripmap mode, spotlight mode, and sliding spotlight mode. J. Univ. Chin. Acad. Sci. 2011, 28, 410. [Google Scholar]
  42. Schulman, J.; Wolski, F.; Dhariwal, P.; Radford, A.; Klimov, O. Proximal policy optimization algorithms. arXiv 2017, arXiv:1707.06347. [Google Scholar]
  43. Fisher, M.L. The Lagrangian relaxation method for solving integer programming problems. Manag. Sci. 1981, 27, 1–18. [Google Scholar] [CrossRef]
  44. Bilgin, E. Mastering Reinforcement Learning with Python: Build Next-Generation, Self-Learning Models Using Reinforcement Learning Techniques and Best Practices; Packt Publishing Ltd.: Birmingham, UK, 2020. [Google Scholar]
  45. Ng, A.Y.; Harada, D.; Russell, S. Policy invariance under reward transformations: Theory and application to reward shaping. In Proceedings of the ICML, Bled, Slovenia, 27–30 June 1999; Volume 99, pp. 278–287. [Google Scholar]
  46. Kim, M.; Kim, J.S.; Choi, M.S.; Park, J.H. Adaptive discount factor for deep reinforcement learning in continuing tasks with uncertainty. Sensors 2022, 22, 7266. [Google Scholar] [CrossRef] [PubMed]
  47. Kennedy, J.; Eberhart, R. Particle swarm optimization. In Proceedings of the ICNN’95-International Conference on Neural Networks, Perth, WA, Australia, 27 November–1 December 1995; Volume 4, pp. 1942–1948. [Google Scholar]
  48. Desai, M.D.; Jenkins, W.K. Convolution backprojection image reconstruction for spotlight mode synthetic aperture radar. IEEE Trans. Image Process. 1992, 1, 505–517. [Google Scholar] [CrossRef] [PubMed]
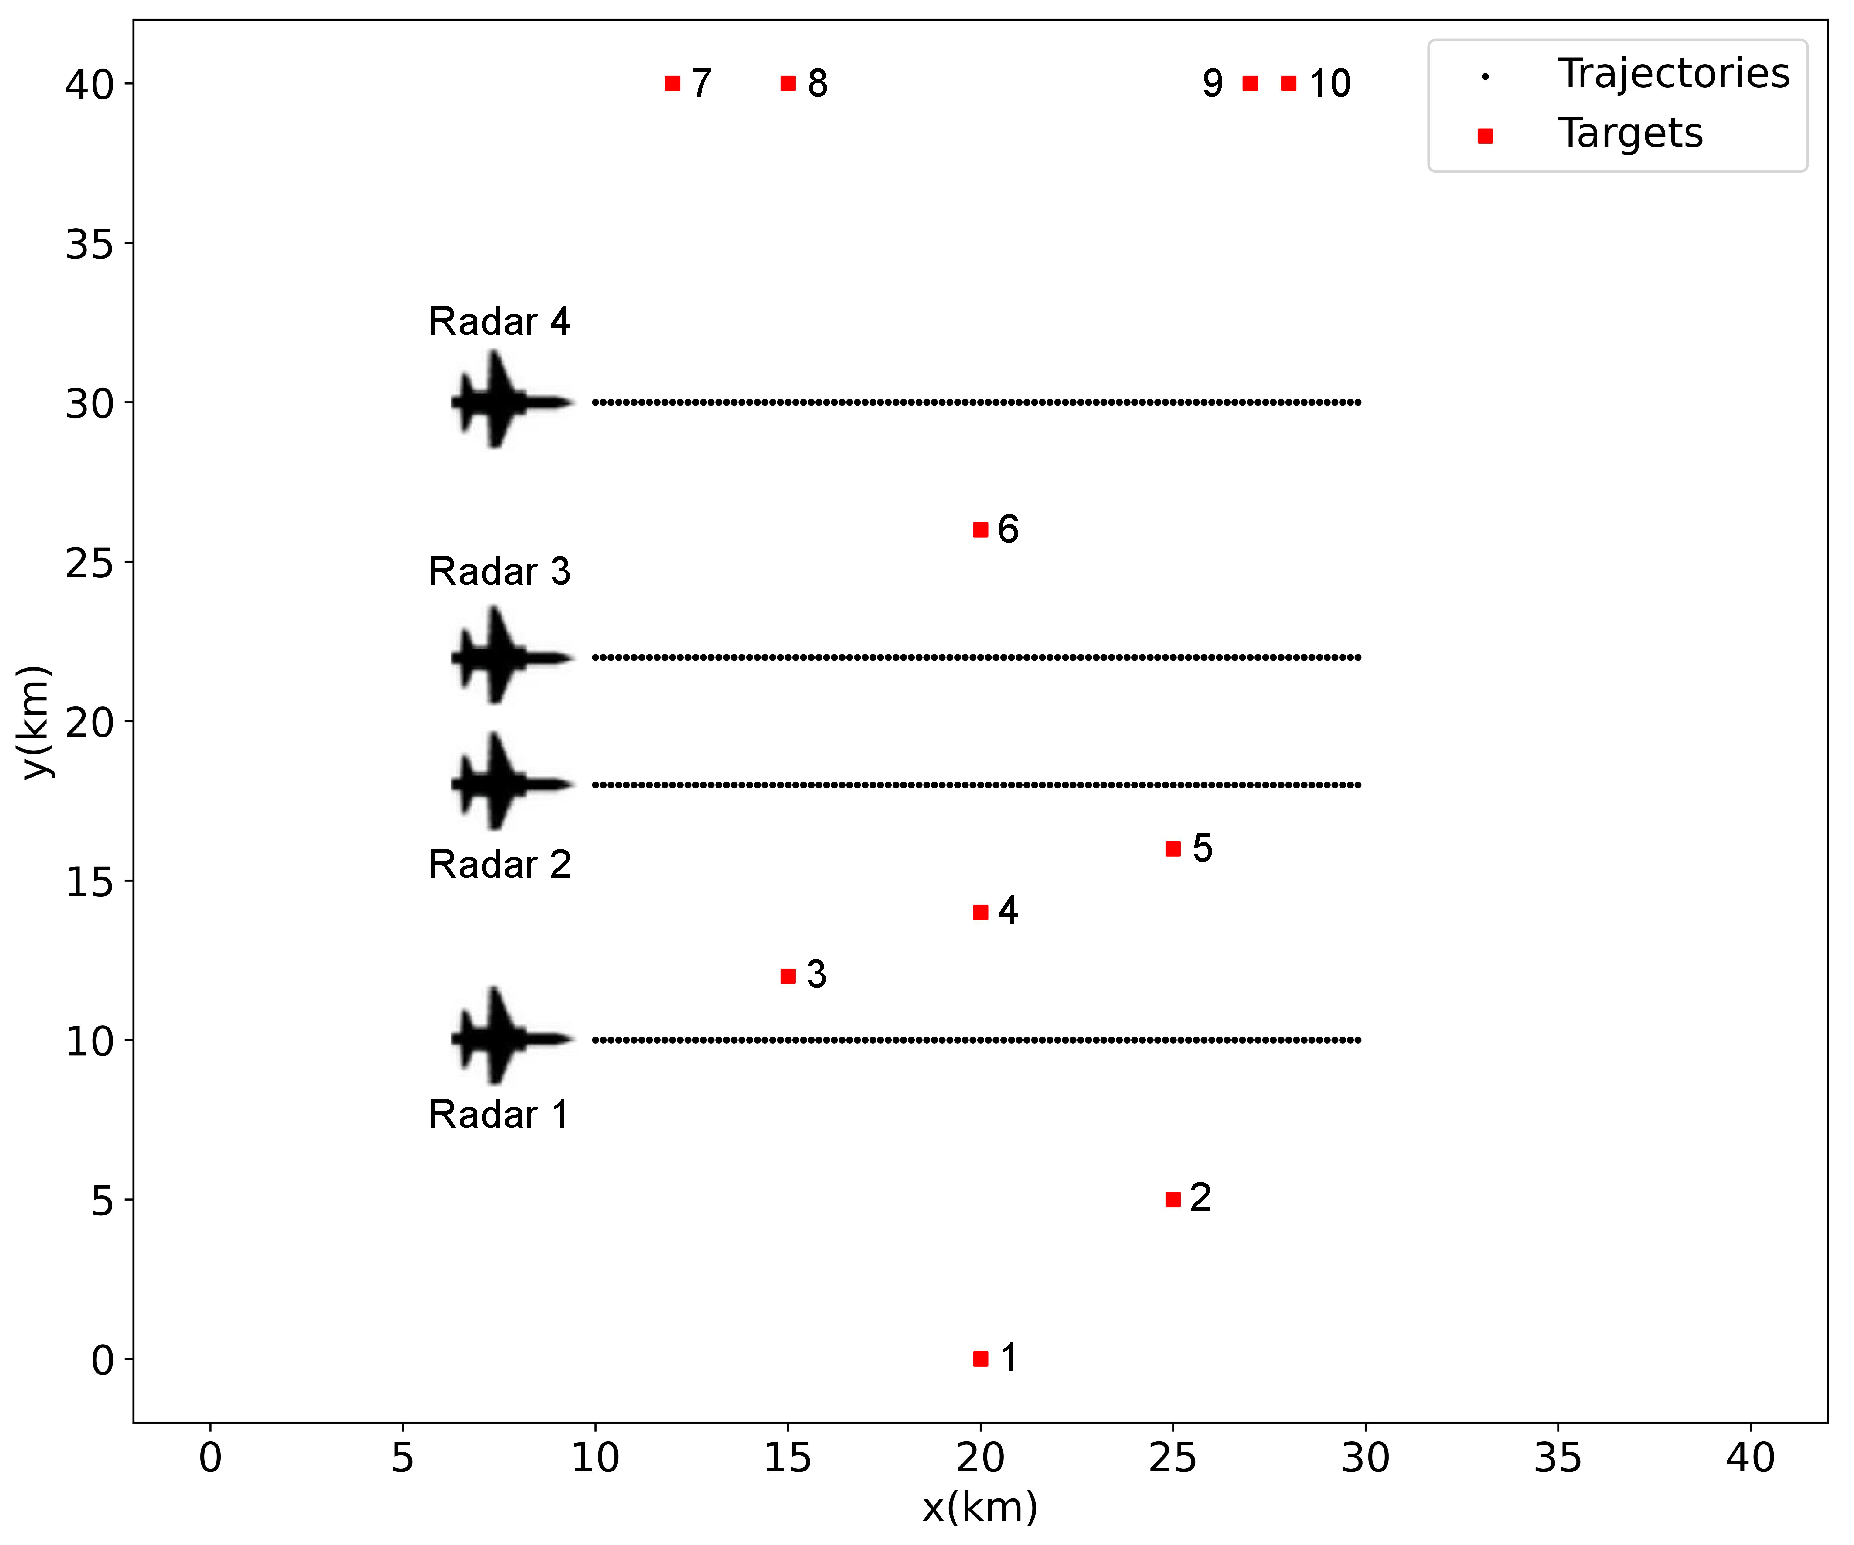
Figure 1. Target positions and radar trajectories in scenario one.
Remotesensing 17 02341 g001
Figure 2. Reward for the training process in scenario one.
Remotesensing 17 02341 g002
Figure 3. The average transmitting power P A m , t in scenario one.
Remotesensing 17 02341 g003
Figure 4. The easily intercepted area in scenario one. (a) Time index 1 for PPO. (b) Time index 25 for PPO. (c) Time index 50 for PPO. (d) Time index 75 for PPO. (e) Time index 99 for PPO. (f) Time index 1 for PSO-A. (g) Time index 25 for PSO-A. (h) Time index 50 for PSO-A. (i) Time index 75 for PSO-A. (j) Time index 99 for PSO-A. (k) Time index 1 for PSO-S. (l) Time index 25 for PSO-S. (m) Time index 50 for PSO-S. (n) Time index 75 for PSO-S. (o) Time index 99 for PSO-S.
Remotesensing 17 02341 g004
Figure 5. The NCEVR of PPO, PSO-A, and PSO-S at each time in scenario one.
Remotesensing 17 02341 g005
Figure 6. The average NCEVR in the task time for PPO, PSO-A, and PSO-S.
Remotesensing 17 02341 g006
Figure 7. (a) The SNR in the SAR imaging of each target S N R n in scenario one. (b) The azimuth resolution of each target ρ A n in scenario one.
Remotesensing 17 02341 g007
Figure 8. MSE of 10 targets for PPO, PSO-A, and PSO-S in scenario one.
Remotesensing 17 02341 g008
Figure 9. Imaging results in scenario one. (a) Ground truth for all targets. (b) Target 8 for PPO. (c) Target 8 for PSO-A. (d) Target 8 for PSO-S. (e) Target 6 for PPO. (f) Target 6 for PSO-A. (g) Target 6 for PSO-S.
Remotesensing 17 02341 g009
Figure 10. Target positions and radar trajectories in different scenarios. (a) Scenario two. (b) Scenario three. (c) Scenario four.
Remotesensing 17 02341 g010
Figure 11. The average transmitting power P A m , t in different scenarios. (a) Scenario two. (b) Scenario three. (c) Scenario four.
Remotesensing 17 02341 g011
Figure 12. Imaging results of the target with a maximum MSE for PPO. (a) PPO in scenario two. (b) PSO-A in scenario two. (c) PSO-S in scenario two. (d) PPO in scenario three. (e) PSO-A in scenario three. (f) PSO-S in scenario three. (g) PPO in scenario four. (h) PSO-A in scenario four. (i) PSO-S in scenario four.
Remotesensing 17 02341 g012
Disclaimer/Publisher’s Note: The statements, opinions and data contained in all publications are solely those of the individual author(s) and contributor(s) and not of MDPI and/or the editor(s). MDPI and/or the editor(s) disclaim responsibility for any injury to people or property resulting from any ideas, methods, instructions or products referred to in the content.