Article

TIAR-SAR: An Oriented SAR Ship Detector Combining a Task Interaction Head Architecture with Composite Angle Regression

by
Yu Gu
*,
Minding Fang
and
Dongliang Peng
School of Automation, Hangzhou Dianzi University, Hangzhou 310018, China
*
Author to whom correspondence should be addressed.
Remote Sens. 2025, 17(12), 2049; https://doi.org/10.3390/rs17122049
Submission received: 7 May 2025 / Revised: 8 June 2025 / Accepted: 11 June 2025 / Published: 13 June 2025

Abstract

Oriented ship detection in Synthetic Aperture Radar (SAR) images has broad applications in maritime surveillance and other fields. While deep learning advancements have significantly improved ship detection performance, persistent challenges remain for existing methods. These include the inherent misalignment between regression and classification tasks and the boundary discontinuity problem in oriented object detection. These issues hinder efficient and accurate ship detection in complex scenarios. To address these challenges, we propose TIAR-SAR, a novel oriented SAR ship detector featuring a task interaction head and composite angle regression. First, we propose a task interaction detection head (Tihead) capable of predicting both oriented bounding boxes (OBBs) and horizontal bounding boxes (HBBs) simultaneously. Within the Tihead, a “decompose-then-interact” structure is designed. This structure not only mitigates feature misalignment but also promotes feature interaction between regression and classification tasks, thereby enhancing prediction consistency. Second, we propose a joint angle refinement mechanism (JARM). The JARM addresses the non-differentiability problem of the traditional rotated Intersection over Union (IoU) loss through the design of a composite angle regression loss (CARL) function, which strategically combines direct and indirect angle regression methods. A boundary angle correction mechanism (BACM) is then designed to enhance angle estimation accuracy. During inference, BACM dynamically replaces an object’s OBB prediction with its corresponding HBB if the OBB exhibits excessive angle deviation when the angle of the object is near the predefined boundary. Finally, the performance and applicability of the proposed methods are evaluated through extensive experiments on multiple public datasets, including SRSDD, HRSID, and DOTAv1. Experimental results derived from the use of the SRSDD dataset demonstrate that the mAP50 of the proposed method reaches 63.91%, an improvement of 4.17% compared with baseline methods. The detector achieves 17.42 FPS on 1024 × 1024 images using an RTX 2080 Ti GPU, with a model size of only 21.92 MB. Comparative experiments with other state-of-the-art methods on the HRSID dataset demonstrate the proposed method’s superior detection performance in complex nearshore scenarios. Furthermore, when further tested on the DOTAv1 dataset, the mAP50 can reach 79.1%.

1. Introduction

Synthetic Aperture Radar (SAR) is an active microwave remote sensing technology that achieves high-resolution imaging [1] by emitting electromagnetic waves, receiving the reflected signals from objects, and synthesizing an equivalent large-aperture antenna based on the motion of the radar platform. It has extensive application value in fields such as smart oceans, national defense security, and disaster emergency response [2,3,4,5]. In particular, in the field of maritime surveillance, ship detection based on SAR images has gradually become a core focus of maritime observation research due to its unique advantages of all-weather capability, wide coverage, and high resolution. However, with the substantial growth in SAR image quality and volume, traditional detection methods, including constant false alarm rate (CFAR) approaches reliant on statistical characteristics of clutter and manual thresholds, are increasingly failing to adapt to complex, dynamic maritime environments [6,7].
With the in-depth development of deep learning theory and its wide application in general object detection, SAR ship detection with deep learning methods has gradually dominated the mainstream. However, unlike optical images, SAR images lack discriminative color and texture features while suffering from inherent speckle noise and defocusing artifacts [8]. Significant intra-class variations in ship appearance further challenge detection, caused by differing imaging perspectives and resolutions. Moreover, ships tend to be distributed in arbitrary orientations and dense arrangements in complex maritime scenarios and are frequently characterized by unclear boundaries. As shown in Figure 1a, oriented bounding boxes (OBBs), unlike horizontal boxes (HBBs), can precisely capture ships’ true scale and heading. Thus, the development of oriented SAR ship detection models has attracted increasing attention [9,10].
Currently, oriented SAR ship detection models are typically implemented by adding an additional angle regression branch to the detection head and optimizing the corresponding loss function to improve orientation awareness. However, this direct angle regression paradigm yields bounding boxes of inadequate quality, frequently resulting in poor classification accuracy and inconsistent angle predictions. The main reasons for this are as follows: (1) Existing detection heads employing multi-task decoupling, such as parallel detection heads [11,12,13], typically employ stacked convolutions to establish two or more independent branches for learning task-specific features. However, they lack essential cross-task information interaction capabilities [14,15,16], impeding feature alignment across tasks. This limitation becomes particularly pronounced in SAR ship imagery, where ships frequently appear in dense clusters with arbitrary orientations. The inconsistency in predictions results in a more obvious degradation in detection performance, particularly affecting the model’s fine-grained recognition capabilities. (2) Regression-based methods for angle estimation frequently suffer from boundary discontinuity problems (BDPs), including periodicity of angles (PoAs) and square-like detections (SLDs). While classification-based approaches like CSL [17] and GCL [18] mitigate this issue through discrete angle encoding, their excessive parameterization hinders optimization. Fundamentally, BDPs stem from ideal predictions lying outside the constrained angular domain. As illustrated in Figure 1b, visually similar predicted OBBs exhibit substantially different angular losses and regression paths. This causes abrupt loss transitions during optimization, impairing model convergence. For high-aspect-ratio objects like ships, even minor angle deviations induce severe performance degradation in detection metrics.
To solve the above issues, we propose TIAR-SAR, a task interaction and composite angle regression-based oriented SAR ship detector. Inspired by feature alignment techniques and indirect angle regression methods from general object detection, our framework introduces a task interaction head (Tihead) architecture. It employs task decomposition and interaction to aggregate features, significantly enhancing cross-task information interaction while improving optimization efficiency for SAR ship classification and regression tasks. The proposed Tihead outputs OBBs and HBBs simultaneously, and a joint angle refinement mechanism (JARM) is designed based on these outputs. In JARM, a composite angle regression loss (CARL) function that combines direct and indirect approaches is first proposed, which guides OBBs regression using HBBs as references, thus enhancing angle prediction accuracy. We then design a boundary angle correction mechanism (BACM) that replaces severely deviated OBB predictions with the network’s HBB outputs during inference, triggered by an IoU threshold criterion.
Figure 1. SAR ship detection. (a) Different forms of annotation; (b) BDP caused by POAs when using the Smooth L1 [19] angle loss function. The red OBB indicates the ground truth, while the blue and green OBBs represent the two OBB predictions at the angle boundary. The arrows indicate the regression path.
Remotesensing 17 02049 g001
The main contributions of this paper are as follows:
(1)
To improve ship detection performance under complex maritime scenarios, an oriented object detector named TIAR-SAR, which is based on task interaction and angle regression, is designed. TIAR-SAR mainly includes two core parts: the Tihead and JARM.
(2)
To enhance the consistency of predictions in regression and classification tasks, the Tihead adopts task decomposition to strengthen feature convergence and promote the flow of feature information between different tasks through task interaction, ultimately improving feature alignment.
(3)
To improve the estimation accuracy of ship angle, JARM combines CARL with a BACM to alleviate the BDP in oriented object detection. It enhances the accuracy of angle estimation without additional computational burden.
(4)
Experimental results derived from using the SRSDD and HRSID datasets show that our proposed methods achieve advanced detection performance with fewer model parameters compared to most existing methods. Experiments on the DOTAv1 dataset further verify its generality and robustness.
The rest of the paper is organized as follows: Section 2 focuses on related research work. Section 3 presents an overview of our model and several proposed measures in detail. Section 4 verifies the effectiveness and applicability of our method. Section 5 discusses existing problems and future directions for improvement. Section 6 summarizes and analyzes the experimental results.

2. Related Work

2.1. SAR Ship Detection

SAR ship detection is a critical technology in remote sensing for maritime surveillance. However, as noted in [20], there are currently few publicly available SAR ship detection datasets compared to general object detection datasets using visible images, and most research primarily relies on limited datasets, such as SRSDD [21], HRSID [22], LS-SSDD [23], etc. The main work on SAR ship detection mainly involves data preprocessing, model design, and the optimization of loss functions. In terms of data preprocessing, BoxPaste [24] is the first to apply the copy-and-paste method from instance segmentation to SAR ship detection. Next, SCP [25] introduces data resampling methods for oriented SAR ship detection, alleviating class imbalance issues. Regarding model design, Sun et al. [26] present a dual-branch architecture for feature extraction and fusion, which effectively identifies the most discriminative local detailed features for SAR ship objects. PVT-SAR [27] utilizes Transformers to construct a multi-scale detection network, overcoming the limitations of the sensitivity of CNN to noise due to its receptive field, thereby enhancing detection capabilities in nearshore scenarios. BiFA-YOLO [6] builds a bidirectional information interaction fusion network from top-down and bottom-up perspectives, effectively aggregating multi-scale features and improving detection performance in high-resolution SAR ship images. MGSFA-Net [28] introduces the scattering features into the deep learning model to characterize the features of ship objects more comprehensively. Additionally, models like AEDet [29], RMCD-Net [30], and RBFA-Net [31] have also made effective improvements to SAR ship detection under diverse maritime scenarios. Then, in terms of loss functions, GPD loss [32] models ships’ elliptical scattering properties and mitigates regression loss imbalance for objects of varying scales and orientations. Zhang et al. [33] designed GAP loss, which can more quickly distinguish positive samples from many negative samples compared to AP loss [34] and Focal loss [35], achieving higher accuracy. Xu et al. [36] proposed TDIoU loss as an innovative approach to address inconsistencies in angle boundary and loss metrics within the regression of OBB, accelerating network convergence. Yu et al. [37] introduced a novel regression-based loss function, ECIoU, which enhances the bounding box and model convergence localization speed. Guan et al. [38] used shape-NWD loss to reduce the sensitivity of IoU to the positional deviation of small ship objects.

2.2. Multi-Task Detection Head Network

As an essential object detection component, multi-task detection heads are employed to output the predictions of position, class, and confidence for each object. The coupled detection head [19] first proposed in Fast-RCNN requires fewer parameters and is characterized by a faster speed, but it has many limitations in improving detection performance. Usually, the object detection task primarily contains two subtasks: localization and classification. However, these two tasks have conflicting demands for information from the feature map. Specifically, localization focuses on the boundary information of objects, while classification requires semantic information. Parallel decoupled detection heads [39] have been widely adopted by detection models such as YOLOX and YOLOv8, which can effectively alleviate this inconsistency in information requirements, allowing the two branches to learn parameters independently without influencing each other. Subsequently, He et al. [11] and Zhuang et al. [40] developed multi-branch detection head structures based on parallel heads, which are suitable for more complex tasks. However, this is not the optimal solution, as the highest classification scores and localization scores in the predictions output by the detection head often do not appear simultaneously on the same predicted bounding box. This indicates that there is still a spatial inconsistency issue between the two subtasks. The task-aligned head (T-head) [15] achieves an improved balance between learning feature interactions and capturing task-specific features while also facilitating alignment via a task-aligned predictor. Recently, Zhou et al. [16] proposed a multi-perception detection head (Unihead) structure that integrates deformation perception, global perception, and cross-task perception into a multi-task detection head. Among them, the cross-task perception innovatively designs a cross-task interaction Transformer to promote interaction between the classification and localization branches, thereby aligning the two tasks.

2.3. Oriented Object Detection and Loss Function

Existing oriented object detectors are mainly developed from horizontal detectors. For example, R2CNN [41] adds a regression parameter for the rotation angle to locate oriented bounding boxes, while Gliding Vertex [42] designs a loss function to regress the coordinates of four vertices for locating polygons. Currently, oriented object detectors are widely employed in the text detection and remote sensing fields. Among them, two-stage methods such as RoI Transformer [43], Oriented R-CNN [44], etc., generally have higher detection accuracy, while one-stage methods like R3Det [45], S2ANet [46], RetinaNet-O [35], etc., achieve faster detection speeds. Existing oriented object detectors predominantly employ regression-based methods to directly predict object angles. However, when the angle is regressed directly, the BDP tends to appear due to the periodicity of the angle. Therefore, many effective methods have been proposed. Researchers have aimed to make improvements by designing new loss functions, including overall optimization losses such as Pixel IoU Loss [47], KFIoU Loss [48], ProbIoU [49], etc., which are engineered approximations replacing the non-differentiable Rotated Intersection over Union (RIoU) to better measure the difference between predictions and ground truth. Similarly, KLD Loss [50], GWD Loss [51], etc., transform OBBs into 2D Gaussian distributions for measuring differences. In addition, the single-parameter regression loss for angles, including IoU-Smooth L1 loss [52] and Modulated loss [53], eliminates loss mutations by applying boundary constraints, thus reducing model learning difficulty.

3. Methodology

This section mainly introduces the specific architecture of the proposed TIAR-SAR model and the details of several methods, mainly including the task interaction detection head (Tihead) and a joint angle refinement mechanism (JARM).

3.1. The Proposed TIAR-SAR Model

First, a single-stage oriented object detection model for SAR ship objects, namely TIAR-SAR, is proposed, as shown in Figure 2. Similar to the methods in [54,55], TIAR-SAR defines the OBB prediction output using a five-parameter long-edge representation. However, its angle output range is [−90, 90), as mentioned in [56], as this design not only fully considers the distribution characteristics of ship objects but also provides support for the design of our novel angle loss function. First, the input SAR ship image undergoes multi-scale receptive field feature extraction through the LSKNet-T [57] backbone network. Next, after adjusting the channel dimension of the feature map with a standard convolution kernel of 1 × 1, a set of pyramid-structured feature map outputs (C1, C2, C3) is obtained. Then, the FPN and PAN networks are employed for further feature fusion, resulting in (P1, P2, P3). Following this, the Tihead is utilized for multi-task feature interaction, outputting the predicted information of each object, including the position of the OBB (PosR), the position of the HBB (PosH), confidence (Conf), class (Cls), and angle (Ang). The JARM is then used to optimize angle estimation. The CARL function is employed during the training stage for efficient OBB regression to improve the accuracy of angle estimation, while BACM utilizes HBB predictions during the inference stage to dynamically replace severely deviated OBB predictions, thereby achieving boundary correction.
Furthermore, to assess the effectiveness of the proposed methods rationally, a baseline model is designed for SAR ship-oriented object detection. Specifically, the baseline model discussed herein, consistent with TIAR-SAR, uses the same backbone and feature fusion network, but the key difference is that the baseline model adopts a prevalent parallel detection head and employs a concise Smooth L1 as the angle loss function.

3.2. Task Interaction Detection Head

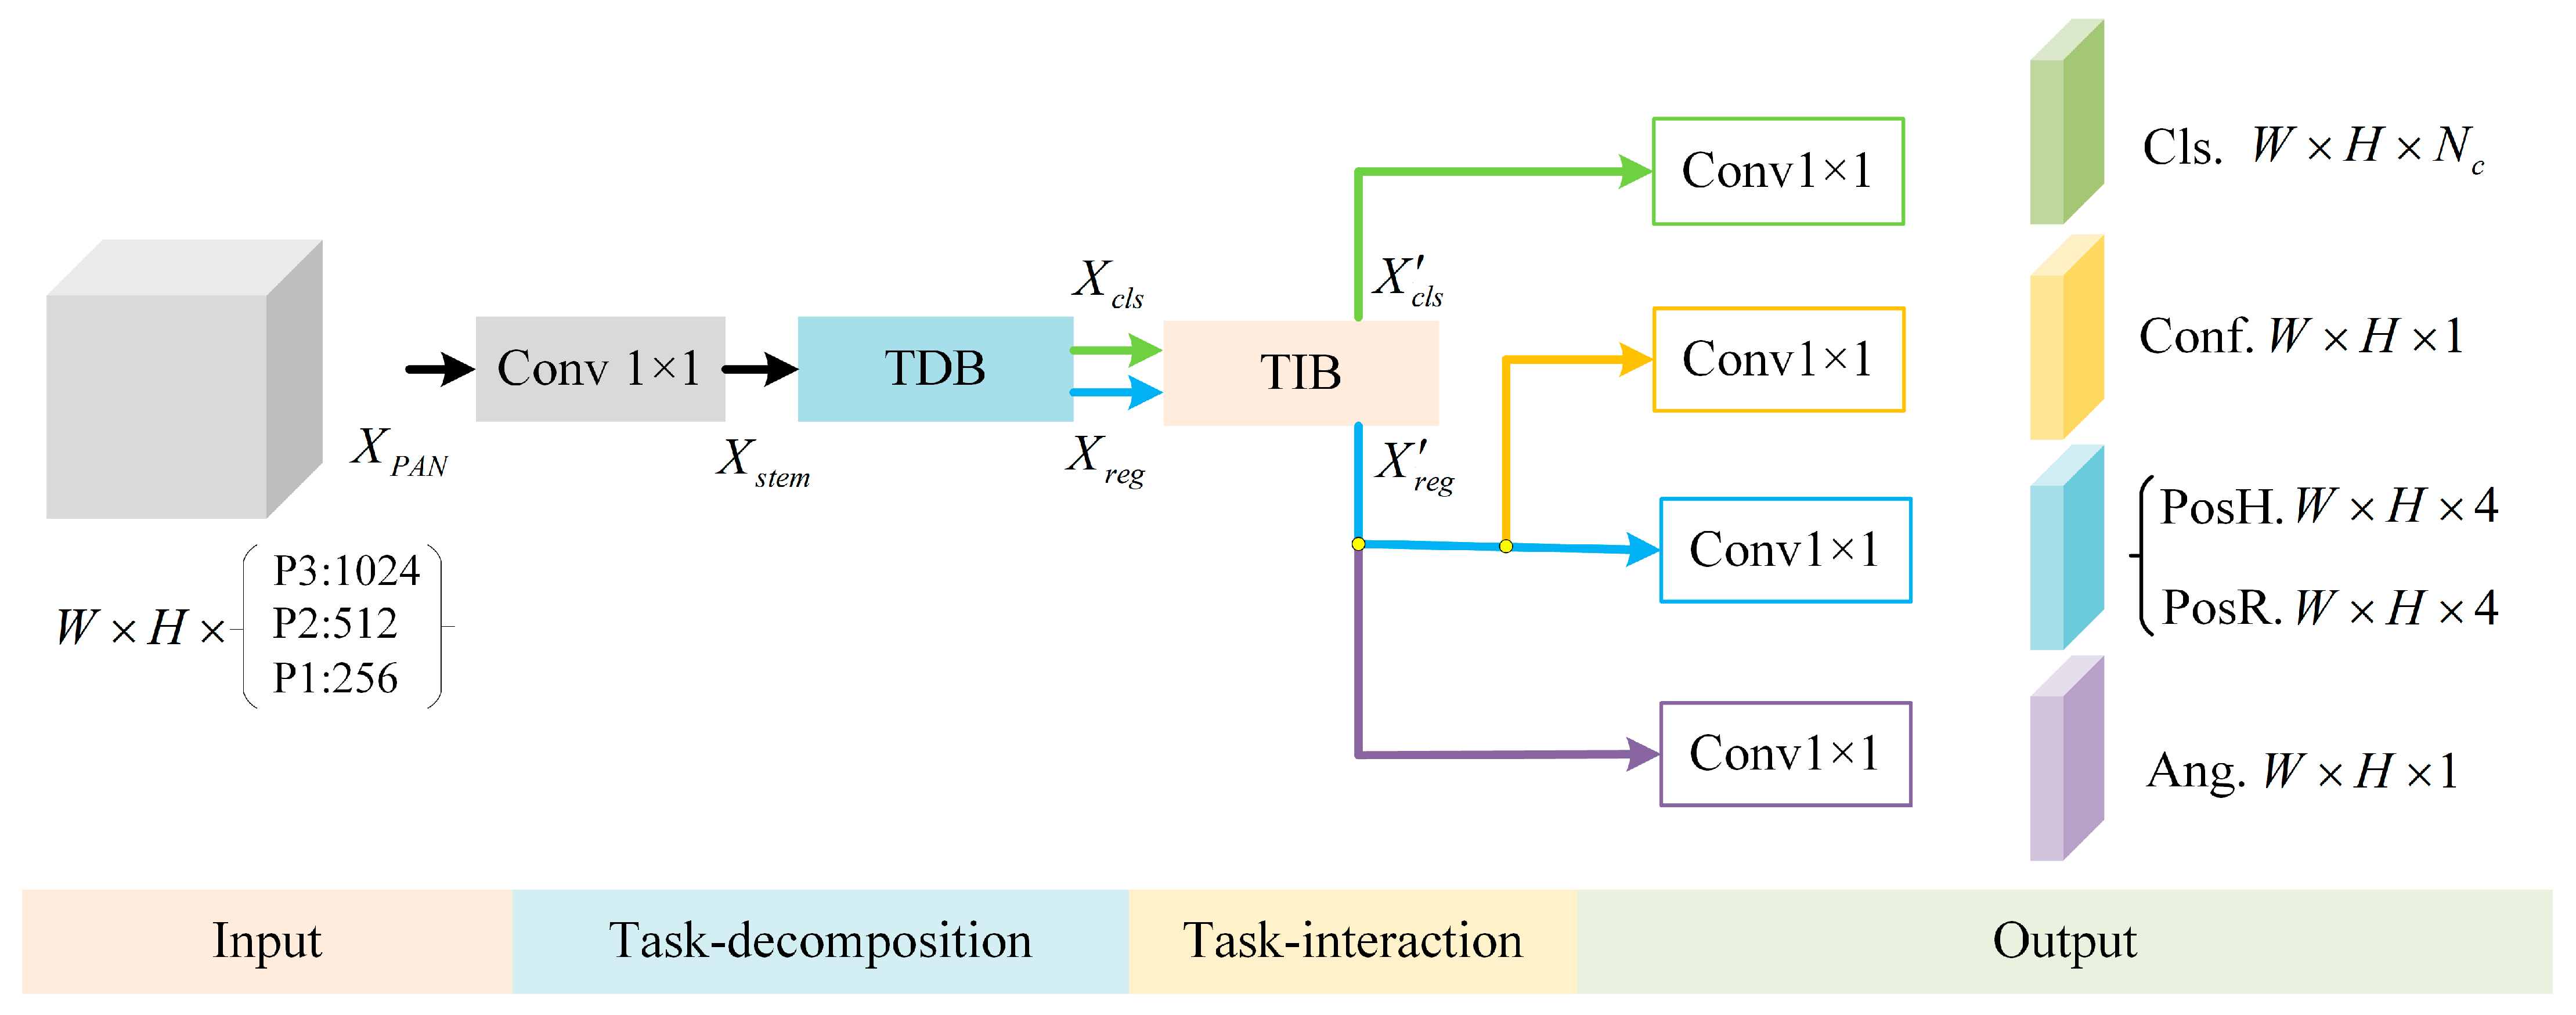
The inconsistency in predictions between regression tasks and classification tasks significantly limits the model’s ability to recognize and detect multi-category ship objects in SAR images. Inspired by the feature interaction design of T-head [15] and the cross-task perception design of Unihead [16], we first propose a detection head paradigm based on task decomposition and interaction, namely the task interaction head (Tihead), which can simultaneously output both HBBs and OBBs. Figure 3 illustrates the overall structure of the Tihead, primarily driven by two core modules: the task decomposition block (TDB) and the task interaction block (TIB). Specifically, the coupled features from PAN are decomposed into two feature branches with different task preferences by TDB, and then, feature interaction is performed in TIB to achieve task alignment. Finally, the output channels are adjusted, and prediction results for each task are generated, with the position prediction output including both HBB and OBB. The following section will provide a detailed introduction to the Tihead.
First, the task-specific feature information is decomposed from coupled feature maps. As illustrated in Figure 4, TDB applies several consecutive 2D convolutions to the output X P A N of the PAN network to obtain a series of original feature maps with different depths, denoted as X o r i 1 ~ N . The details are shown in (1).
X o r i i = f c o n v 3 × 3 ( f c o n v 1 × 1 ( X P A N ) ) , i = 1 f c o n v 3 × 3 ( X o r i i 1 ) , i > 1 , i { 1 , 2 , , N }
where f c o n v 1 × 1 and f c o n v 3 × 3 represent standard convolutions with kernels of size 1 and 3, respectively. Then, layer attention [15] (Layera) is utilized to filter these original feature maps X o r i 1 ~ N , thereby obtaining feature maps X t d and X t d , which are biased towards classification and regression tasks, respectively, facilitating the aggregation of task-specific feature information. Subsequently, channel attention (CA) is set up in the classification branch to enhance the semantic information of the feature map, while spatial attention (SA) is configured in the regression branch to improve the model’s ability to perceive objects’ spatial positions and boundaries. The specific formulas are shown in (2).
X t d = L a y e r a ( C a t ( i = 1 N X o r i i ) ) X t d = L a y e r a ( C a t ( i = 1 N X o r i i ) ) X c l s = f c a ( X t d ) X t d X t d X r e g = f s a ( X t d ) X x d X x d
Here, C a t ( ) is the channel concatenation operation, while f s a and f c a denote spatial and channel attention, respectively. indicates element-wise multiplication, and indicates element-wise addition.
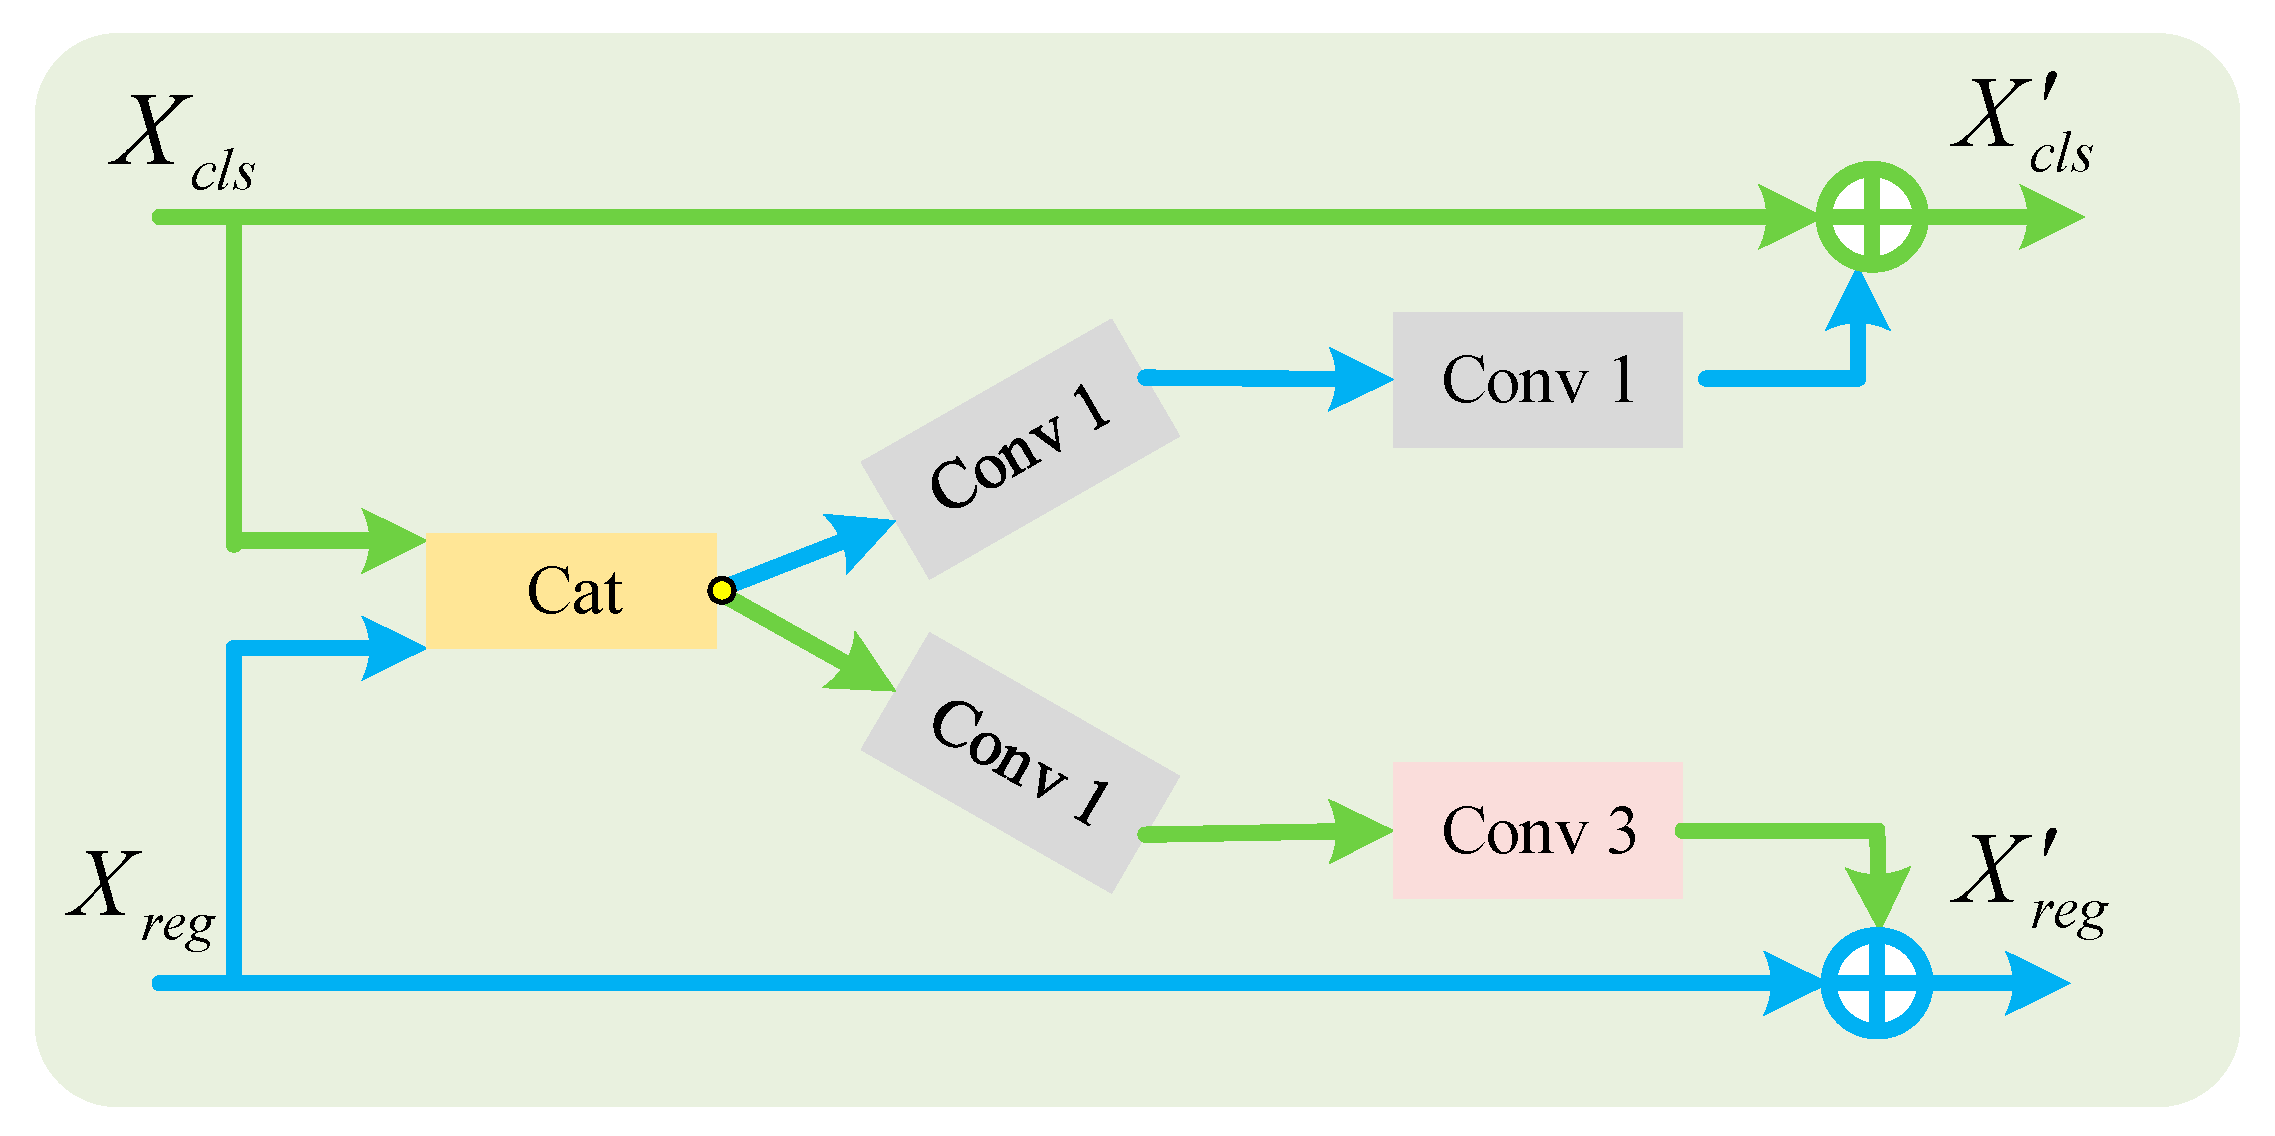
Next, feature information for different task branches is aggregated. As shown in Figure 5, after task decomposition by TDB, the classification feature X c l s and the regression feature X r e g are concatenated using channel concatenation in the TIB. Then, two lightweight convolution branches are adopted to process these mixed features separately. The classification branch consists of two stacked 1 × 1 convolutions, while the regression branch uses one 1 × 1 convolution combined with a 3 × 3 convolution due to the need for spatial perception. Finally, the processed feature information is merged back into the main path through these branches, which enhances the flow of feature information between the classification and regression branches, enabling efficient task interaction and improving the consistency between classification and regression. Then, the task feature maps X r e g and X c l s are output for subsequent processing. The specific formulas are shown in (3).
X c l s = f c o n v 1 × 1 ( f c o n v 1 × 1 ( C a t ( X c l s , X r e g ) ) ) X c l s X r e g = f c o n v 3 × 3 ( f c o n v 1 × 1 ( C a t ( X r e g , X c l s ) ) ) X r e g
After TIB conducts the task interaction for classification and regression branches, as illustrated in Figure 3, the Tihead utilizes several 1 × 1 standard convolutions to adjust the output dimensions and ultimately outputs four components: angle regression, position regression, and confidence prediction from the regression task branch and category prediction from the classification task branch. Among these, the position regression branch outputs HBBs and OBBs simultaneously, providing support for subsequent tasks. The specific output format is shown in (4).
o u t p u t = ( r x , r y , r w , r h , θ O B B , x , y , w , h H B B , p c o n f , p c l s )
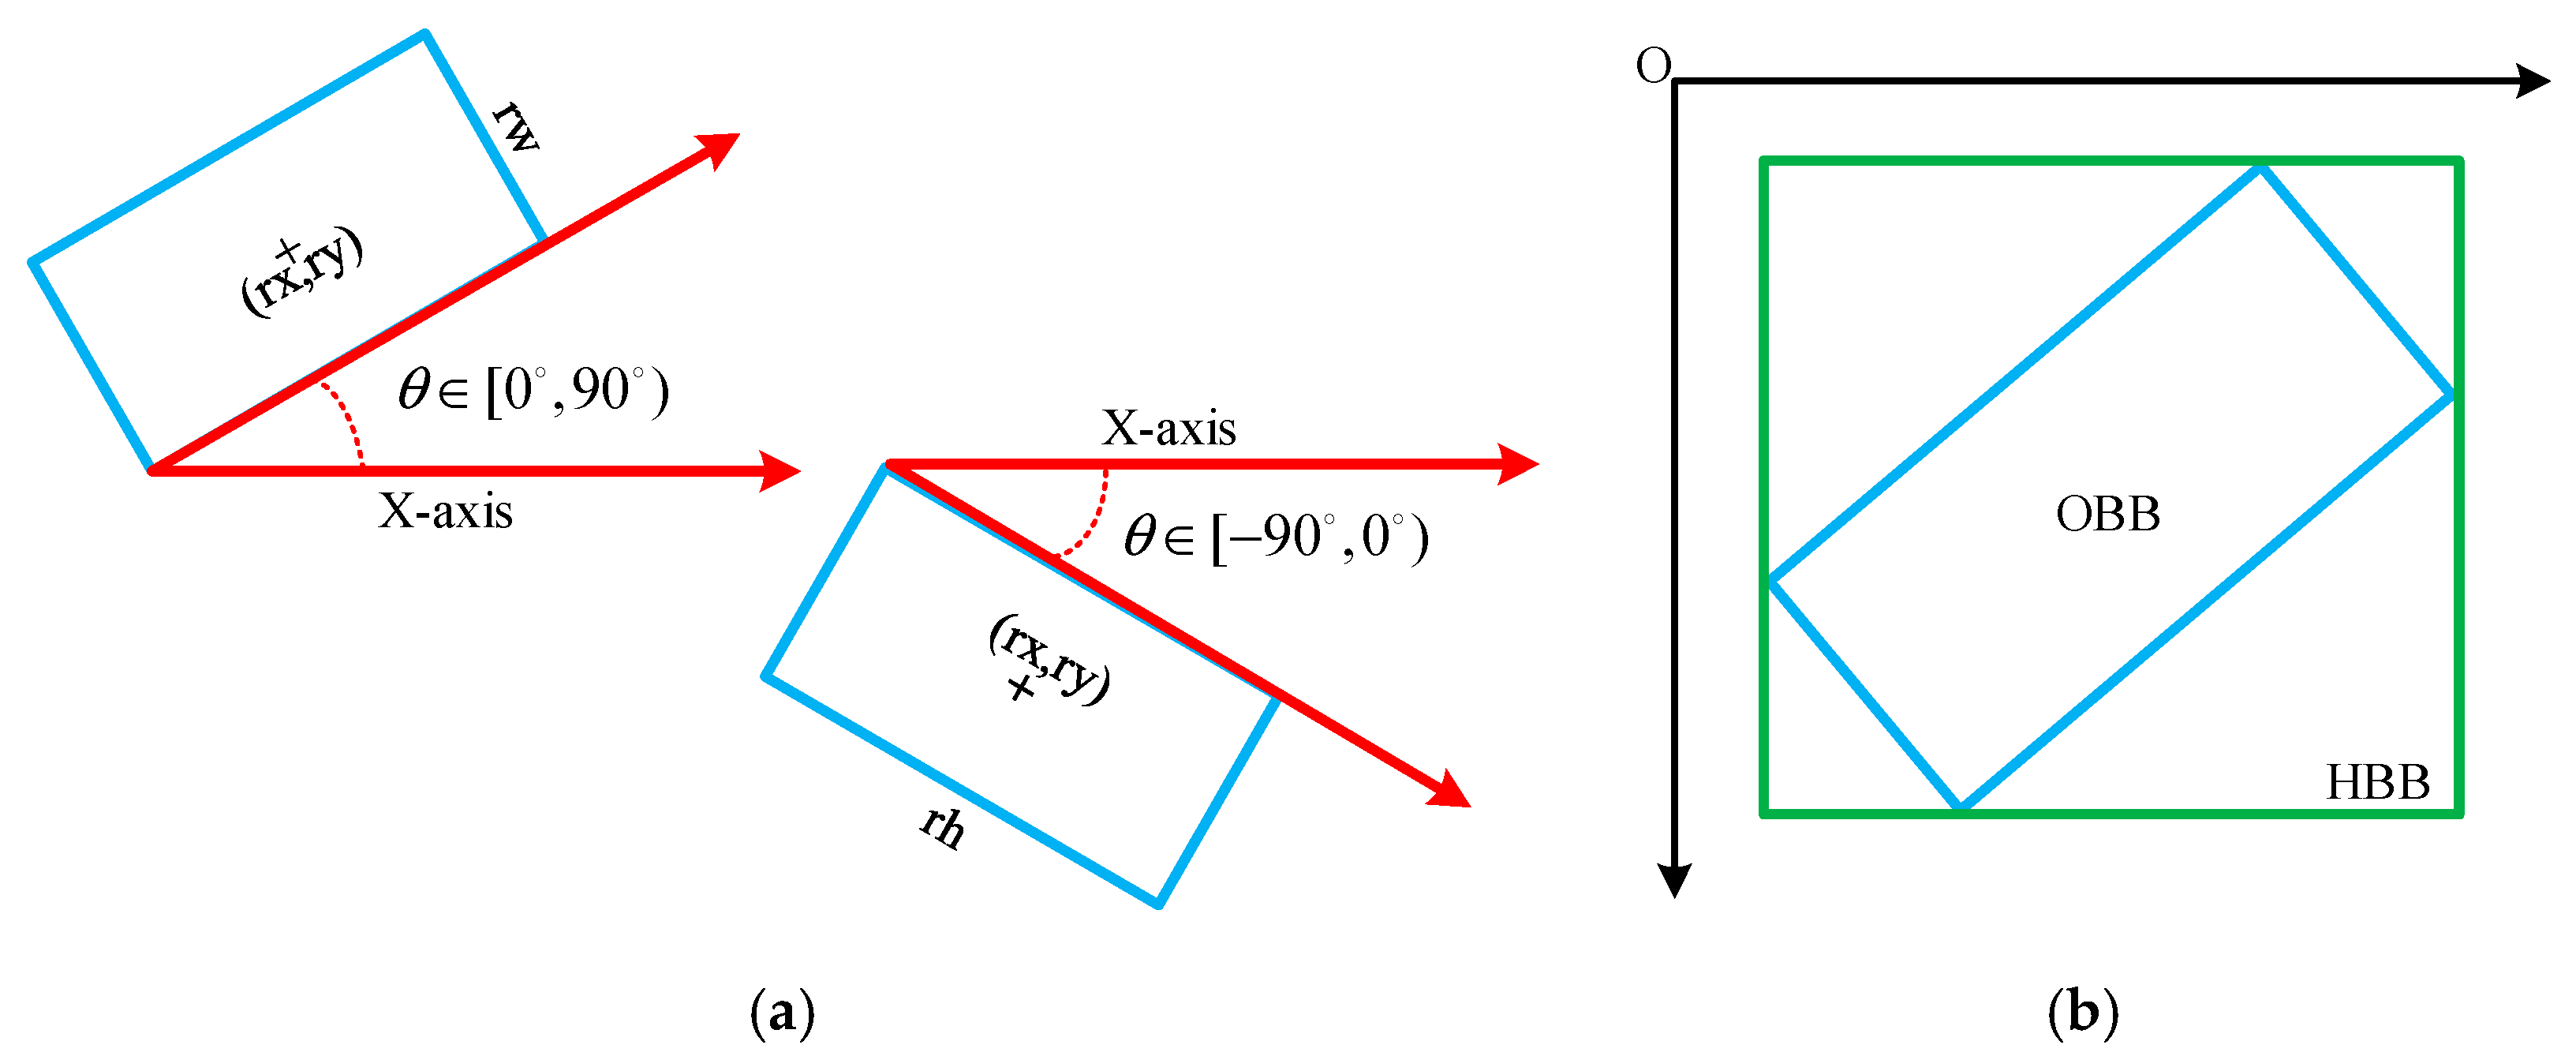
where ( r x , r y , r w , r h , θ ) represents the position coordinate prediction of the object’s OBB, and θ is the angle prediction and is defined within the range of [ 90 , 90 ) , as depicted in Figure 6a. Similarly, ( x , y , w , h ) represents the position coordinate prediction of the object’s HBB. The relative positional relationship between HBB and OBB is illustrated in Figure 6b. P c o n f denotes the confidence level of the object, which ideally is labeled as 1 for the object and 0 for the background. P c l s represents the probability distribution of the object category.

3.3. Joint Angle Refinement Mechanism

To optimize the angle estimation accuracy of SAR ships, a joint angle refinement mechanism (JARM) is proposed. In the JARM, a combined direct and indirect regression method is used to improve the angle estimation accuracy, and a boundary angle correction mechanism (BACM) is employed during the inference stage to correct OBB predictions with significant deviations.

3.3.1. Composite Angle Regression Loss Function Based on HBBs and OBBs

To address the accuracy of angle estimation and avoid the non-differentiability issue of the RIoU loss, a composite angle regression loss (CARL) is proposed. Previous studies [35,37] have shown that HBB is effective in OBB regression. Inspired by them, the proposed CARL is defined as a combination of direct and indirect regression losses by incorporating HBB, as shown in (5) and (6). Specifically, when the predicted angle θ has a different sign from its ground truth θ , Smooth L1 loss is employed for angle loss computation to perform the initial and direct regression, which quickly reduces the discrepancy between the predicted angle and its ground truth. Otherwise, as shown in (7), h b b c —computed based on ground truth OBB t o b b and predicted angle θ —is used to indirectly calculate loss with the ground truth HBB t h b b , achieving further regression. At this stage, the speed of angle regression slows down, making this indirect angle optimization process more refined and solving the non-differentiability problem of RIoU. In addition, α is used as a scaling factor to adjust the angle loss and is set to 0.05. Figure 7 illustrates the coarse-to-fine adjustment strategy of CARL in the angle regression process.
(1)
Direct regression loss: θ × θ < 0 .
L CARL = 0.5 × ( θ θ ) 2 , i f θ θ < 1 θ θ 0.5 , o t h e r w i s e
(2)
Indirect regression loss: θ × θ 0 .
L CARL = α × 0.5 × ( h b b c w h t h b b w h ) 2 , i f h b b c w h t h b b w h < 1 h b b c w h t h b b w h 0.5 , o t h e r w i s e
h b b c h h b b c w = sin ( θ ) cos ( θ ) cos ( θ ) sin ( θ ) t o b b h t o b b w
Moreover, the loss of HBB is used as a regularization term to improve the prediction of OBB during the training stage. Therefore, our multi-task loss function L consists of five parts and can be described as shown below:
L = λ 1 L o b b ( r b , r b ) + λ 2 L C A R L ( θ , θ ) + λ 3 L h b b ( b , b ) + λ 4 L o b j ( p c o n f , p c o n f ) + λ 5 L c l s ( p c l s , p c l s )
where b and r b represent the ground truth values of HBB and OBB, respectively. The position losses, L o b b and L h b b , adopt EIoU loss [58] to maintain the aspect ratio of the predicted bounding boxes, which helps improve the accuracy of angle estimation. The confidence loss L o b j , and the classification loss L c l s adopt BCE loss. Hyperparameters λ i (i = 1, 2, 3, 4, 5) are used to control the weight distribution of different losses and set to {0.05, 0.05, 0.05, 1, 0.5} by referring to the parameterization of the YOLOv8 and YOLOX models.

3.3.2. Boundary Angle Correction Mechanism

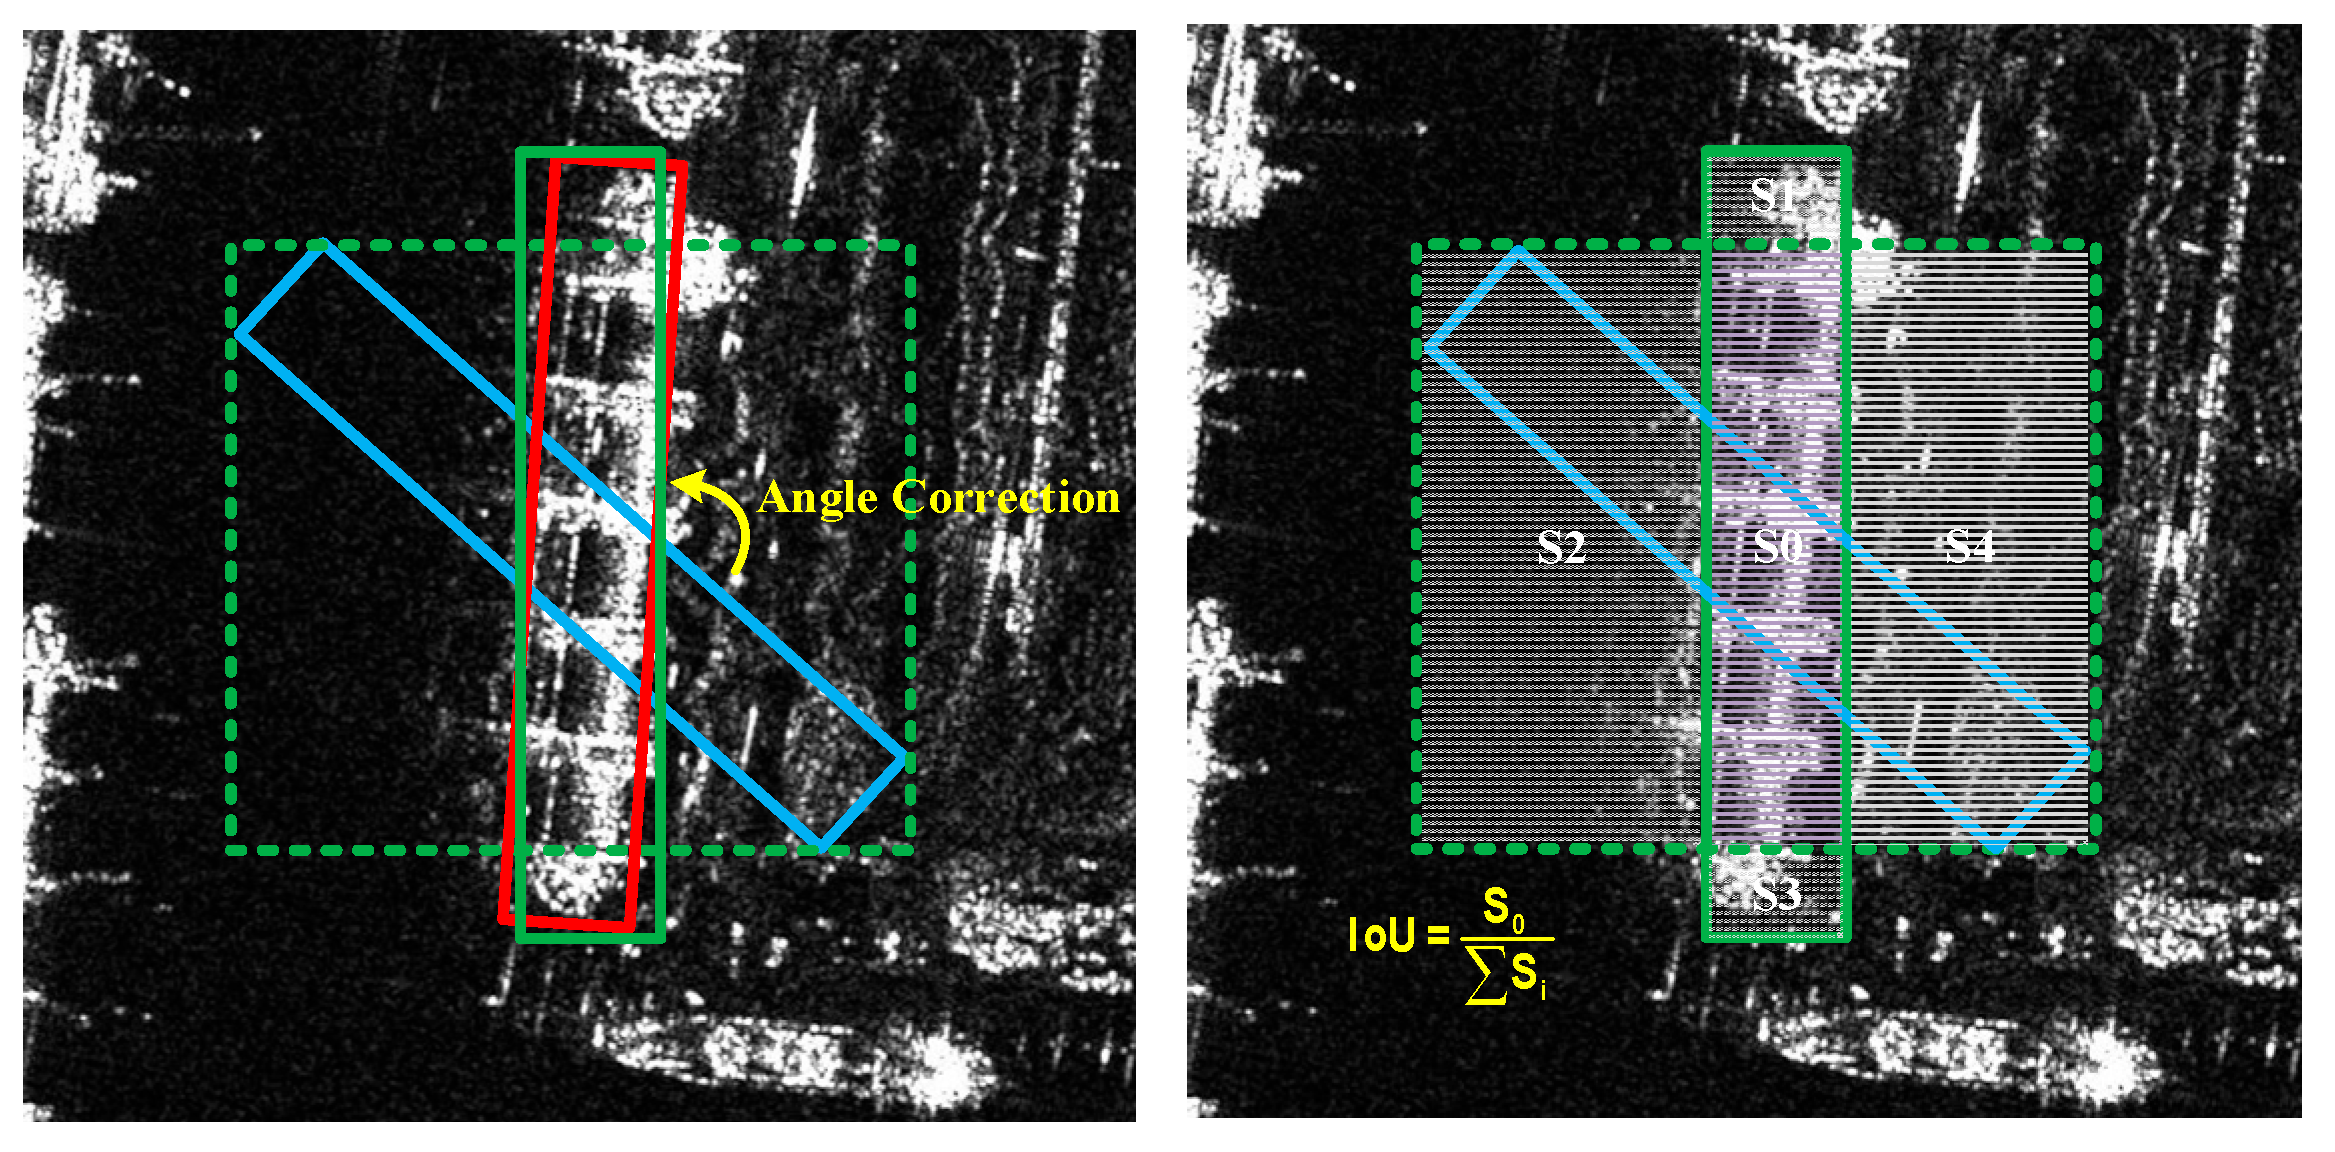
Since the object angle is defined as [ 90 ° , 90 ° ) , there will often be a large deviation in the angle estimation when the object is in the vertical direction, which causes a sharp decrease in RIoU and even leads to missed detections of ship objects. Previously, the Gliding vertex introduced an obliquity factor to select the horizontal or oriented object detection as the final detection result. Xu et al. [55] assessed whether the angle estimation is accurate by calculating the IoU between HBB computed based on the predicted OBB and the predicted HBB. We propose BACM as an angle correction mechanism during the model inference stage, which adopts HBB as prior information to perform angle correction on the inaccurate predictions of OBB near the angle boundaries, as shown in Figure 8.
Specifically, as shown in Table 1, the angle estimation of OBB is considered inaccurate when the IoU between the minimum bounding rectangle of the OBB prediction h b b i o and the HBB prediction h b b i p is below a threshold factor β . In such cases, the original OBB prediction o b b i p will be replaced with the HBB prediction as the final detection results y i , thus effectively mitigating the BDP. In short, BACM is a data post-processing method, and its core design idea is that HBB can avoid the angle estimation problem present in OBB. It is also accurate in localizing the ship object.

4. Results

In this section, TIAR-SAR is implemented based on the PyTorch (version 1.10.0) deep learning framework, with hardware configuration including an Intel(R) Xeon(R) Platinum 8336C CPU @ (2.30 GHz, RTX4090 GPU, and 125 GB of memory). We introduce the experimental datasets, parameter settings, and the evaluation metrics. Then, we evaluate the effectiveness and robustness of the proposed methods on multiple public datasets, including SRSDD, HRSID, and DOATv1.

4.1. Datasets

(1)
SRSDD: The SRSDD dataset is used for multi-category SAR ship-oriented object detection. All images in the dataset have a resolution of 1 m and 1024 × 1024 pixels per image. The dataset includes six fine-grained ship categories—oil tanker (C1), bulk carrier (C2), fishing boat (C3), law enforcement vessel (C4), dredger (C5), and container ship (C6)—with a total of 2884 ship instances. Among all dataset images, data from nearshore scenarios account for 63.1%, with complex maritime backgrounds and numerous interferences. The training set consists of 532 images, and the test set comprises 134 images.
(2)
HRSID: The OBB labels of the HRSID dataset are obtained from the minimum bounding rectangles through instance segmentation annotations. This SAR ship dataset consists of 5604 images, covering 16,951 ship objects and including various offshore and nearshore scenarios. The image resolutions vary from 1 m to 5 m. The training set and test set have 3623 images and 1955 images, respectively.
(3)
DOTAv1: The DOTAv1 dataset [59] collects 2806 aerial images from multiple platforms. The objects in DOTAv1 exhibit a wide range of scales, orientations, and shapes. This dataset includes 15 categories: baseball diamonds (BDs), planes (PLs), bridges (BRs), ground tracks fields (GTFs), ships (SHs), small vehicles (SVs), large vehicles (LVs), tennis courts (TCs), basketball courts (BCs), storage tanks (STs), harbors (HBs), soccer ball fields (SBFs), roundabouts (RAs), swimming pools (SPs), and helicopters (HCs). The number of images in the training set, validation set, and test set is 1411, 458, and 937, respectively.
Table 2 contains more detailed information about the experimental datasets.

4.2. Evaluation Metric and Experimental Settings

First, evaluation metrics, including recall (R), precision (P), and average precision (AP), are often used to assess deep learning models’ detection performance in the context of SAR ship images. R, P, and AP are defined as follows:
R = T P T P + F N P = T P T P + F P
A P = 0 1 P ( R ) d ( R )
where TP, FP, and FN refer to the number of correct detections, false alarms, and missed detections, respectively. R denotes the ratio of correctly detected positive samples to all actual positive samples, reflecting the completeness of the detection, while P denotes the ratio of true positive samples to the predicted positive samples, reflecting the accuracy of the detection. A P denotes the area under the PR curve, which synthesizes the precision stability under different recall rates and represents the overall performance of the model under a single category. The mean average precision (mAP) is the average of A P across all categories, which is used to measure the overall performance of the model across all categories, as shown in (11). Like most previous research works, we employ the VOC12 [60] method for mAP calculation as the default, but for a fair comparison with [29], we also use the VOC07 [61] method for mAP calculation in part of the experiments. Then, as (12) demonstrates, the F1 score, effectively balancing precision and recall, serves as a more robust evaluation metric in cases of class imbalance. Additionally, the frames per second (fps) metric is used to evaluate detection speed and real-time performance, while the weight capacity of the model is utilized to assess model size.
m A P = 1 N i = 1 N A P i
F 1 = 2 × P × R P + R
In terms of model training, SGD is adopted as the optimizer, and the initial learning rate is 1 × 10⁻². Momentum and weight decay are set to 0.937 and 0.0005, respectively. In addition, Table 3 lists the other training hyperparameters. For model testing, to ensure a fair comparison, on the HRSID and DOTAv1 datasets, both mAP and F1 are calculated under conditions where the IoU threshold is 0.5 (mAP50), the confidence threshold is 0.01, and the NMS threshold is 0.3. On the SRSDD dataset, the NMS threshold is set to 0.3.

4.3. Ablation Experiments

Given the rich variety of maritime scenarios and diverse categories of ships in the SRSDD dataset, it becomes challenging to achieve accurate position detection and fine-grained ship classification. Therefore, in ablation experiments, we select the SRSDD dataset to fully evaluate our proposed methods.
Effectiveness of the Tihead: As listed in Table 4, compared to other detection heads, the proposed Tihead enhances the information flow capability between classification and regression tasks. Table 4 shows that the Tihead achieves optimal detection performance with almost no additional increase in model capacity compared to most methods, achieving the best or second-best detection results in five out of six categories. Moreover, the mAP50 of the Tihead is 1.31%, 0.58%, and 0.18% higher than that of Parallel heads, T-head, and even the latest Unihead, respectively. This is mainly attributed to the Tihead’s unique feature structure of decomposing first and then interacting. The decomposition of tasks promotes the high convergence of feature information required by classification and regression tasks, while task interaction aligns the prediction distributions of regression and classification, thereby enhancing the consistency of model predictions. The detection results of different detection heads on the SRSDD test dataset are shown in Figure 9. It can be noted that the Tihead accurately identifies all ship object categories in multi-category scenarios, demonstrating its ability to provide the model with more effective fine-grained recognition capabilities.
Effectiveness of the JARM: Table 5 shows several classical methods for angle estimation. It can be seen that the mAP50 of the JARM is 1.94% and 1.54% higher than Smooth L1 and GCL, respectively. To more accurately reflect the accuracy of angle estimation, we count the average error of the angles (AAE). As shown in Table 5, the JARM also achieves the best angle estimation accuracy, with an AAE of only 6.74%, lower than Smooth L1’s 8.41% and GCL’s 11.76%. This is mainly due to the CARL adopting a combined direct and indirect angle regression approach, achieving precise angle estimation, from coarse to fine. Figure 10 shows the detection results of classification-based and regression-based methods under angle boundary conditions. It can be found that, due to the efficient correction method of BACM, it does not exhibit large angle estimation deviations like other methods, such as Smooth L1. The JARM has more accurate angle estimation than other methods, and is an effective way to alleviate the BDP.
The Tihead and JARM have been separately verified in previous experiments via comparison with other methods. In Table 6, we verify the comprehensive performance gain of the baseline model after combining the JARM and Tihead. By comparing Experiment 2 with Experiment 3 in Table 6, it can be seen that the Tihead achieves a greater performance leap after integrating JARM, with an increase of 2.23% in mAP50. This indicates that JARM can effectively adapt to and promote the performance release of the Tihead. Meanwhile, by comparing Experiment 1 with Experiment 4, we find that our proposed model improves mAP50 by 4.17% compared to the baseline model. This is because the CARL in the JARM adopts a regression strategy that combines direct and indirect approaches, making ship object angle estimation more accurate. In terms of F1 score, our proposed method ultimately facilitates an improvement of 5.05% to 65.96%. Specifically, from the P and R data columns in Table 6, it can be seen that both the proposed Tihead and JARM can significantly improve the detection precision of the model, and the false alarms of the ships are suppressed. In particular, the JARM also efficiently improves the recall of the model, and the miss-detection problem of the ships is alleviated.

4.4. Comparison with Several State-of-the-Art Methods

To verify the detection performance of TIAR-SAR, a performance comparison with current classical and state-of-the-art oriented object detectors is conducted on two SAR ship datasets, SRSDD and HRSID.
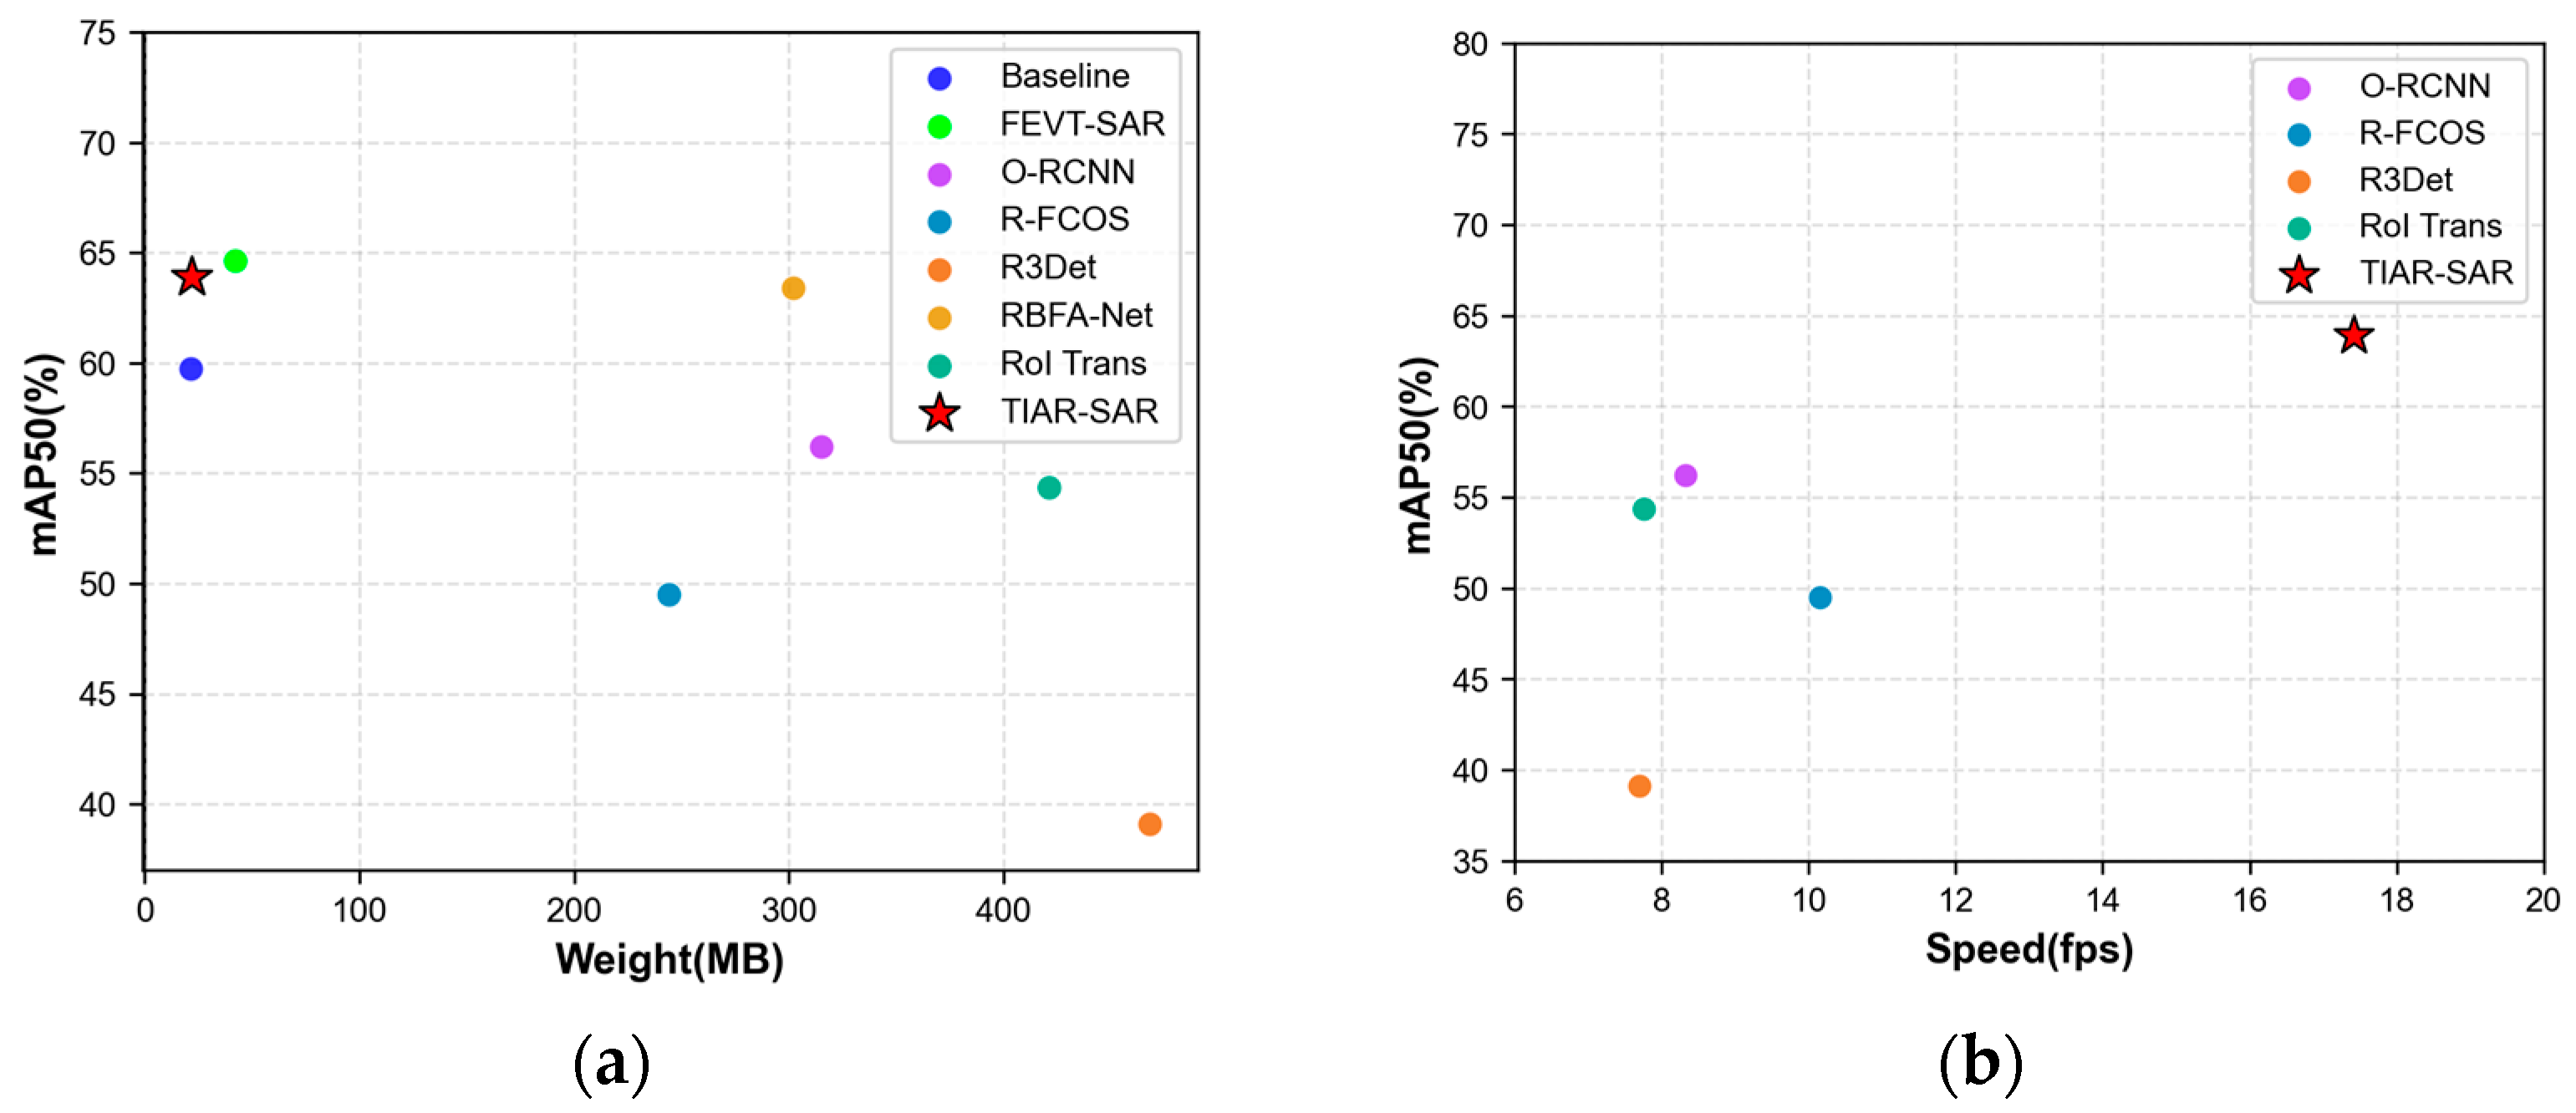
The quantitative results based on the SRSDD dataset are shown in Table 7. The proposed method achieves the best detection performance in two out of six categories (namely C2 and C4) and reaches an advanced level in mAP50, only 0.72% lower than the latest FEVT-SAR. However, it reduces the model capacity by 50% compared to the former, offering better overall efficiency. Moreover, with the lightweight backbone network and detection head design, as well as the efficient JARM, the model achieves a detection speed on RTX 2080 Ti of 17.42 fps, significantly surpassing classic one-stage detectors such as R-FCOS and R3Det. A visualization of the relationship between model size, detection speed, and mAP is shown in Figure 11.
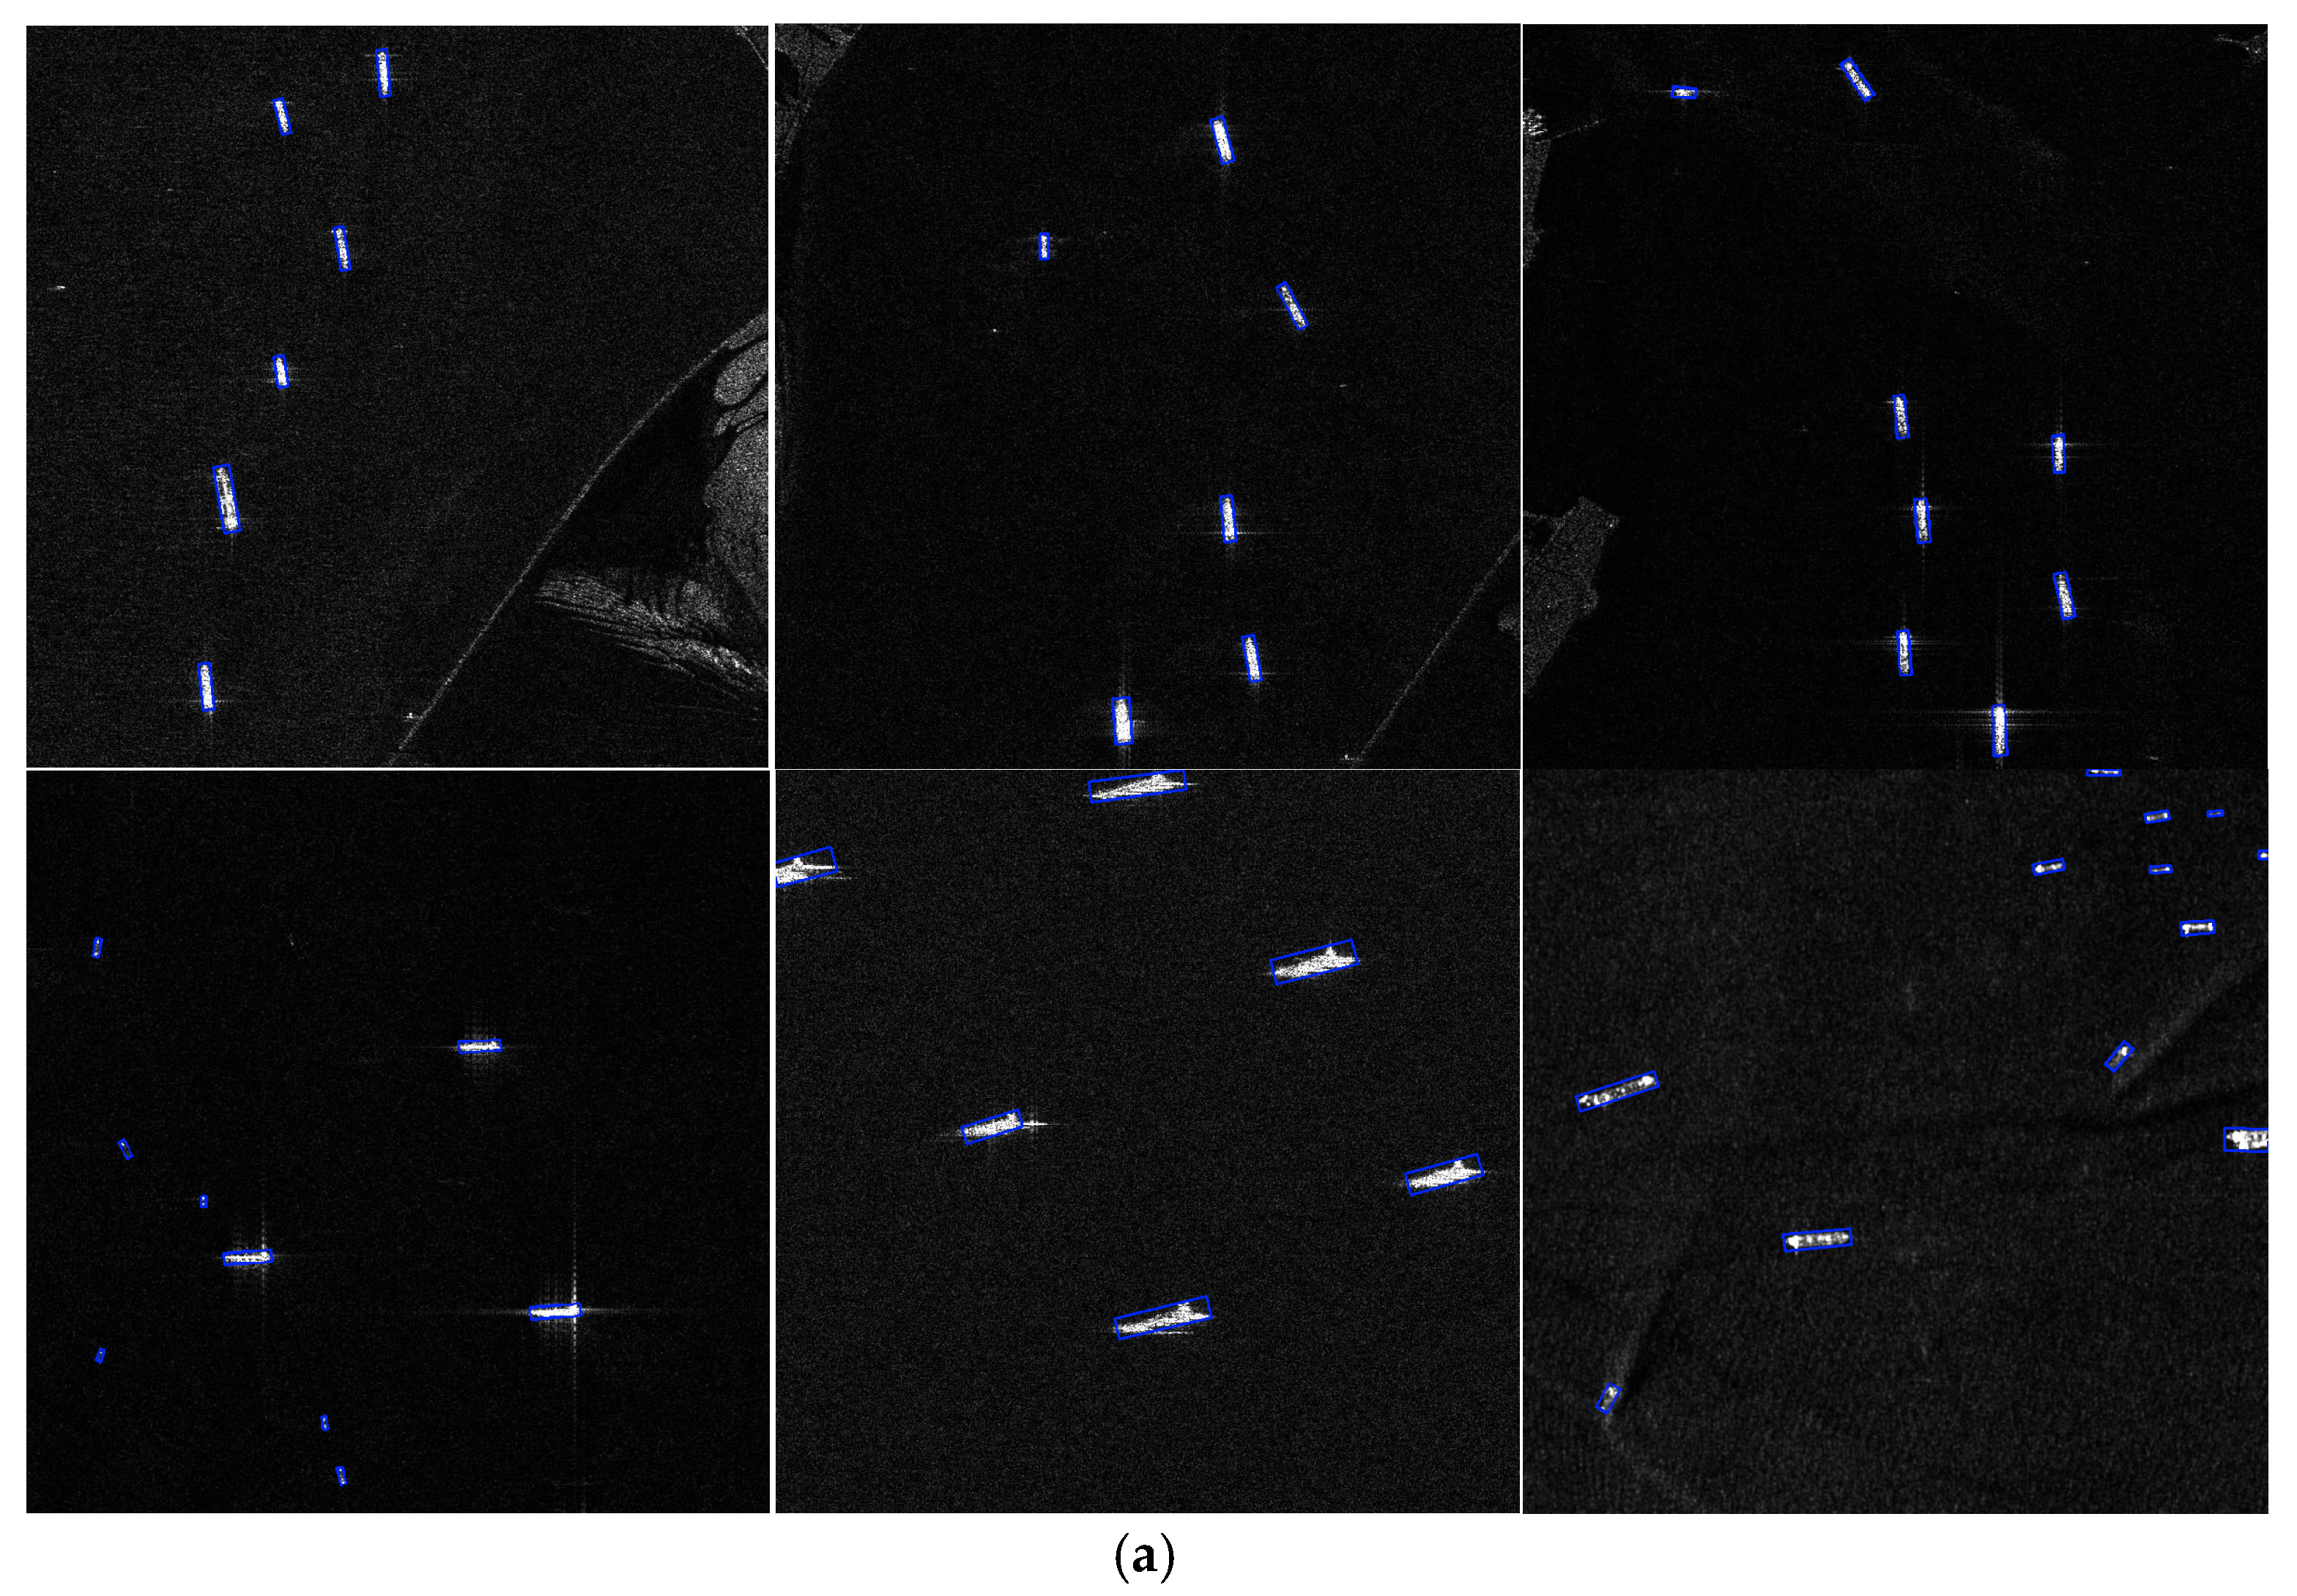
Moreover, quantitative comparison experiments on the HRSID dataset are shown in Table 8. It can be observed that for offshore scenarios, all detectors perform at a similar level, with mAP50 (VOC07) scores consistently falling within the range of 90–91. This is primarily because, in the offshore scenarios of the HRSID dataset, ship objects exhibit prominent features, and the maritime background is clean, with almost no noise interference. However, for nearshore scenarios, TIAR-SAR outperforms classical oriented object detectors such as Oriented-RCNN, RoI-Transformer, and S2ANet by 35.6%, 11.5%, and 10.6%, respectively, and also surpasses more novel methods like AEDet and FEVT-SAR by 0.7% and 1.9%. This advantage is mainly attributed to the fact that ships in nearshore scenarios often appear densely arranged with unclear boundaries, making more precise localization and orientation estimation crucial for detection results. Finally, the proposed TIAR-SAR achieves an mAP50 (VOC07) of 88.6 across all scenarios in the HRSID dataset. TIAR-SAR demonstrates accurate detection in offshore scenarios while maintaining low false alarm rates and high detection rates in nearshore scenarios, as illustrated in Figure 12.

4.5. Generalization Ability

To further evaluate the generality ability of the proposed TIAR-SAR, we conducted validation experiments using the large-scale visible light general object detection dataset DOTAv1, which contains multiple categories, such as car, plane, etc. Then, after the prediction results are obtained on the test dataset, they are submitted to the official website of DOTA for evaluation. Due to the large image sizes, consistent with [63], the images are cropped at a size of 1024 × 1024 with a stride of 512. As shown in Table 9, TIAR-SAR achieves the best detection performance in 7 out of 15 categories and surpasses R3Det, ReDet, and Oriented RCNN by 3.2%, 2.8%, and 0.7%, respectively, in the mAP50. This indicates that our proposed TIAR-SAR also exhibits excellent detection performance for general objects in visible-light images, demonstrating superior detection robustness. As illustrated in Figure 13, the proposed model accurately distinguishes boundaries and estimates angles even when objects are arbitrarily oriented and densely distributed.

5. Discussion

To address the challenges of fine-grained category recognition and insufficient accuracy in angle estimation for ship objects in SAR images, the Tihead and JARM are proposed, achieving a good balance in terms of mAP metrics, detection speed, and model capacity. However, similar to existing methods, there is still some error in estimating the angle of ship objects when they are densely distributed, and such error cannot be completely avoided yet. The SLD problem has also not been effectively resolved. Additionally, classification accuracy requires further improvement. From the ablation study, although the proposed Tihead achieves a significant increase in mAP compared to the Parallel head when combined with the JARM, overall, it remains at a relatively low level. In brief, there remains significant potential for improving multi-category SAR ship-oriented object detection.
Next, on the one hand, the design of the model can be further optimized. The interaction structure of the Tihead designed in this paper is relatively simple, which may have certain performance limitations in complex, large-scale scenarios. It is possible to consider introducing the Transformer or Mamba structure to optimize the feature correlation and interaction between multiple tasks. On the other hand, the JARM can continue to be refined. For instance, dynamic deformable convolution can be employed to adaptively learn the arbitrarily oriented features of ship objects and can be combined with content-aware attention to suppress background interference and enhance the separation capability for dense objects. Furthermore, DCL can be used for initial preliminary angle estimation, limiting the angle to a small discrete interval, followed by fine-tuning within this interval using regression. It can effectively combine the strengths of both classification-based and regression-based angle estimation methods, thereby improving the SLD problem.

6. Conclusions

To respond to the complex SAR ship detection scenarios, an oriented object detector based on task interaction and composite angle regression is proposed, namely TIAR-SAR. It includes two components: the Tihead and JARM. Specifically, the Tihead adopts a novel detection head paradigm based on decomposition–interaction, which not only enhances the aggregation ability of feature information for each task but also effectively strengthens the information flow between classification and regression tasks, thereby enhancing the fine-grained recognition ability of the model. During the training stage, the JARM uses CARL to achieve optimization of angle estimation, from coarse to fine, effectively improving the accuracy of ship angle estimation. In the inference stage, the JARM employs a BACM to correct OBB predictions with large angular deviations, ultimately alleviating the BDP. Experiments on SAR ship datasets such as SRSDD and HRSID verified the effectiveness of the proposed TIAR-SAR compared to state-of-the-art models, while transfer experiments on the DOTAv1 visible-light dataset demonstrated its superior robustness. In addition, in terms of detection speed, TIAR-SAR achieves a speed of 17.42 fps on 1024 × 1024 images on RTX 2080Ti, whose real-time performance is better than the previous mainstream detection models.
In terms of future work, as mentioned earlier, the proposed TIAR-SAR model still has a slightly lower performance in dense ship detection and fine-grained ship category recognition. Therefore, more effective methods need to be developed to solve these problems. In addition to continuing to optimize the design of detection heads and loss functions, as described in the Section 5, we could also design a new feature extraction backbone network and a multi-scale information fusion network to capture the massive fine-grained features of the SAR ship. We could also further reduce the model capacity and improve the real-time detection performance through pruning, quantizing, etc.

Author Contributions

Conceptualization, M.F. and Y.G.; methodology, M.F. and Y.G.; software, M.F. and Y.G.; validation, M.F., Y.G. and D.P.; writing—original draft preparation, M.F.; writing—review and editing, Y.G. and D.P.; supervision, Y.G.; project administration, Y.G. All authors have read and agreed to the published version of the manuscript.

Funding

This research was funded by the Zhejiang Provincial Natural Science Foundation of China under Grant No. LZ23F030002.

Data Availability Statement

The original contributions presented in this study are included in the article. Further inquiries can be directed to the corresponding author.

Conflicts of Interest

The authors declare no conflicts of interest.

References

  1. Deng, Y.; Tang, S.; Chang, S.; Zhang, H.; Liu, D.; Wang, W. A novel scheme for range ambiguity suppression of spaceborne SAR based on underdetermined blind source separation. IEEE Trans. Geosci. Remote Sens. 2025, 63, 5207915. [Google Scholar] [CrossRef]
  2. Sun, J.; Zou, H.; Deng, Z.; Li, M.; Cao, X.; Ma, Q. Oriented inshore ship detection and classification based on cascade RCNN. Syst. Eng. Electron. 2020, 42, 1903–1910. [Google Scholar]
  3. Zhang, Y.; Li, Q.; Zang, F. Ship detection for visual maritime surveillance from non-stationary platforms. Ocean Eng. 2017, 141, 53–63. [Google Scholar] [CrossRef]
  4. Zhang, X.; Zhang, S.; Sun, Z.; Liu, C.; Sun, Y.; Ji, K.; Kuang, G. Cross-sensor SAR image target detection based on dynamic feature discrimination and center-aware calibration. IEEE Trans. Geosci. Remote Sens. 2025, 63, 5209417. [Google Scholar] [CrossRef]
  5. Guan, T.; Chang, S.; Deng, Y.; Xue, F.; Wang, C.; Jia, X. Oriented SAR Ship Detection Based on Edge Deformable Convolution and Point Set Representation. Remote Sens. 2025, 17, 1612. [Google Scholar] [CrossRef]
  6. Sun, Z.; Leng, X.; Lei, Y.; Xiong, B.; Ji, K.; Kuang, G. BiFA-YOLO: A novel YOLO-based method for arbitrary-oriented ship detection in high-resolution SAR images. Remote Sens. 2021, 13, 4209. [Google Scholar] [CrossRef]
  7. Liu, T.; Yang, Z.; Yang, J.; Gao, G. CFAR Ship Detection Methods Using Compact Polarimetric SAR in a K-Wishart Distribution. IEEE J. Sel. Top. Appl. Earth Obs. Remote Sens. 2019, 12, 3737–3745. [Google Scholar] [CrossRef]
  8. Zhang, L.; Zhang, Y.; Yu, Y.; Ma, Y.; Jiang, H. Survey on object detection in tilting box for remote sensing images. Nat. Remote Sens. Bull. 2022, 26, 1723–1743. [Google Scholar] [CrossRef]
  9. Pan, D.; Gao, X.; Dai, W.; Fu, J.; Wang, Z.; Sun, X.; Wu, Y. SRT-Net: Scattering Region Topology Network for Oriented Ship Detection in Large-Scale SAR Images. IEEE Trans. Geosci. Remote Sens. 2024, 62, 5202318. [Google Scholar] [CrossRef]
  10. Sun, Y.; Sun, X.; Wang, Z.; Fu, K. Oriented Ship Detection Based on Strong Scattering Points Network in Large-Scale SAR Images. IEEE Trans. Geosci. Remote Sens. 2022, 60, 5218018. [Google Scholar] [CrossRef]
  11. He, B.; Zhang, Q.; Tong, M.; He, C. Oriented ship detector for remote sensing imagery based on pairwise branch detection head and SAR feature enhancement. Remote Sens. 2022, 14, 2177. [Google Scholar] [CrossRef]
  12. Ge, Z.; Liu, S.; Wang, F.; Li, Z.; Sun, J. Yolox: Exceeding yolo series in 2021. arXiv 2021, arXiv:2107.08430. [Google Scholar]
  13. Dai, X.; Chen, Y.; Xiao, B.; Chen, D.; Liu, M.; Yuan, L.; Zhang, L. Dynamic head: Unifying object detection heads with attentions. In Proceedings of the IEEE/CVF Conference on Computer Vision and Pattern Recognition, Virtual, 20–25 July 2021; pp. 7373–7382. [Google Scholar]
  14. Wu, Y.; Chen, Y.; Yuan, L.; Liu, Z.; Wang, L.; Li, H.; Fu, Y. Rethinking classification and localization for object detection. In Proceedings of the IEEE/CVF Conference on Computer Vision and Pattern Recognition, Seattle, WA, USA, 14–19 June 2020; pp. 10186–10195. [Google Scholar]
  15. Feng, C.; Zhong, Y.; Gao, Y.; Scott, M.R.; Huang, W. TOOD: Task-Aligned One-Stage Object Detection. In Proceedings of the 2021 IEEE International Conference on Computer Vision (ICCV), Montreal, QC, Canada, 10–17 October 2021; pp. 3490–3499. [Google Scholar]
  16. Zhou, H.; Yang, R.; Zhang, Y.; Duan, H.; Huang, Y.; Hu, R.; Li, X.; Zheng, Y. Unihead: Unifying multi-perception for detection heads. IEEE Trans. Neural Netw. Learn. Syst. 2024, 36, 9565–9576. [Google Scholar] [CrossRef]
  17. Yang, X.; Yan, J.; He, T. Arbitrary-Oriented Object Detection with Circular Smooth Label. In Proceedings of the European Conference on Computer Vision (ECCV), Glasgow, UK, 23–28 August 2020; pp. 677–694. [Google Scholar]
  18. Yang, X.; Hou, L.; Zhou, Y.; Wang, W.; Yan, J. Dense label encoding for boundary discontinuity free rotation detection. In Proceedings of the IEEE/CVF Conference on Computer Vision and Pattern Recognition, Nashville, TN, USA, 19–25 June 2021; pp. 15819–15829. [Google Scholar]
  19. Girshick, R. Fast r-cnn. In Proceedings of the IEEE International Conference on Computer Vision, Santiago, Chile, 11–18 December 2015; pp. 1440–1448. [Google Scholar]
  20. Li, J.; Xu, C.; Su, H.; Gao, L.; Wang, T. Deep Learning for SAR Ship Detection: Past, Present and Future. Remote Sens. 2022, 14, 2712. [Google Scholar] [CrossRef]
  21. Lei, S.; Lu, D.; Qiu, X.; Ding, C. SRSDD-v1.0: A High-Resolution SAR Rotation Ship Detection Dataset. Remote Sens. 2021, 13, 5104. [Google Scholar] [CrossRef]
  22. Wei, S.; Zeng, X.; Qu, Q.; Wang, M.; Su, H.; Shi, J. HRSID: A high-resolution SAR images dataset for ship detection and instance segmentation. IEEE Access 2020, 8, 120234–120254. [Google Scholar] [CrossRef]
  23. Zhang, T.; Zhang, X.; Ke, X.; Zhan, X.; Shi, J.; Wei, S.; Pan, D.; Li, J.; Su, H.; Zhou, Y.; et al. LS-SSDD-v1.0: A Deep Learning Dataset Dedicated to Small Ship Detection from Large-Scale Sentinel-1 SAR Images. Remote Sens. 2020, 12, 2997. [Google Scholar] [CrossRef]
  24. Suo, Z.; Zhao, Y.; Chen, S.; Hu, Y. BoxPaste: An Effective Data Augmentation Method for SAR Ship Detection. Remote Sens. 2022, 14, 5761. [Google Scholar] [CrossRef]
  25. Fang, M.; Gu, Y.; Peng, D. FEVT-SAR: Multi-category Oriented SAR Ship Detection Based on Feature Enhancement VisionTransformer. IEEE J. Sel. Top. Appl. Earth Obs. Remote Sens. 2024, 18, 2704–2717. [Google Scholar] [CrossRef]
  26. Sun, Z.; Leng, X.; Zhang, X.; Xiong, B.; Ji, K.; Kuang, G. Ship Recognition for Complex SAR Images via Dual-Branch Transformer Fusion Network. IEEE Geosci. Remote Sens. Lett. 2024, 21, 4009905. [Google Scholar] [CrossRef]
  27. Zhou, Y.; Jiang, X.; Xu, G.; Yang, X.; Liu, X.; Li, Z. PVT-SAR: An Arbitrarily Oriented SAR Ship Detector with Pyramid Vision Transformer. IEEE J. Sel. Top. Appl. Earth Obs. Remote Sens. 2023, 16, 291–305. [Google Scholar] [CrossRef]
  28. Zhang, X.; Feng, S.; Zhao, C.; Sun, Z.; Zhang, S.; Ji, K. MGSFA-Net: Multiscale Global Scattering Feature Association Network for SARShip Target Recognition. IEEE J. Sel. Top. Appl. Earth Observ. Remote Sens. 2024, 17, 4611–4625. [Google Scholar] [CrossRef]
  29. Zhou, K.; Zhang, M.; Zhao, H.; Tang, R.; Lin, S.; Cheng, X.; Wang, H. Arbitrary-Oriented Ellipse Detector for Ship Detection in Remote Sensing Images. IEEE J. Sel. Topics Appl. Earth Observ. Remote Sens. 2023, 16, 7151–7162. [Google Scholar] [CrossRef]
  30. Shao, Z.; Zhang, X. A high accuracy detection network for rotated multi-class SAR ship detection. In Proceedings of the IEEE International Geoscience and Remote Sensing Symposium, Pasadena, CA, USA, 16–21 July 2023; pp. 4954–4957. [Google Scholar]
  31. Shao, Z.; Zhang, X.; Zhang, T.; Xu, X.; Zeng, T. RBFA-Net: A Rotated Balanced Feature-Aligned Network for Rotated SAR Ship Detection and Classification. Remote Sens. 2022, 14, 3345. [Google Scholar] [CrossRef]
  32. Sun, Z.; Leng, X.; Zhang, X.; Zhou, Z.; Xiong, B.; Ji, K.; Kuang, G. Arbitrary-direction SAR ship detection method for multi-scale imbalance. IEEE Trans. Geosci. Remote Sens. 2025, 63, 5208921. [Google Scholar] [CrossRef]
  33. Zhang, L.; Liu, Y.; Qu, L.; Cai, J.; Fang, J. A Spatial Cross-Scale Attention Network and Global Average Accuracy Loss for SAR Ship Detection. Remote Sens. 2023, 15, 350. [Google Scholar] [CrossRef]
  34. Chen, K.; Li, J.; Lin, W.; See, J.; Wang, J.; Duan, L.; Chen, Z.; He, C.; Zou, J. Towards Accurate One-Stage Object Detection with AP-Loss. In Proceedings of the IEEE/CVF Conference on Computer Vision and Pattern Recognition (CVPR), Long Beach, CA, USA, 15–20 June 2019; pp. 5119–5127. [Google Scholar]
  35. Lin, T.Y.; Goyal, P.; Girshick, R.; He, K.; Dollár, P. Focal loss for dense object detection. In Proceedings of the IEEE International Conference on Computer Vision, Venice, Italy, 22–29 October 2017; pp. 2980–2988. [Google Scholar]
  36. Xu, Z.; Gao, R.; Huang, K.; Xu, Q. Triangle Distance IoU Loss, Attention-Weighted Feature Pyramid Network, and Rotated-SAR Ship Dataset for Arbitrary-Oriented SAR Ship Detection. Remote Sens. 2022, 14, 4676. [Google Scholar] [CrossRef]
  37. Yu, J.; Wu, T.; Zhang, X.; Zhang, W. An Efficient Lightweight SAR Ship Target Detection Network with Improved Regression Loss Function and Enhanced Feature Information Expression. Sensors 2022, 22, 3447. [Google Scholar] [CrossRef]
  38. Guan, T.; Chang, S.; Wang, C.; Jia, X. SAR Small Ship Detection Based on Enhanced YOLO Network. Remote Sens. 2025, 17, 839. [Google Scholar] [CrossRef]
  39. Tian, Z.; Shen, C.; Chen, H.; He, T. Fcos: Fully convolutional one-stage object detection. In Proceedings of the IEEE/CVF International Conference on Computer Vision, Seoul, Republic of Korea, 27 October–2 November 2019; pp. 9627–9636. [Google Scholar]
  40. Zhuang, J.; Qin, Z.; Yu, H.; Chen, X. Task-Specific Context Decoupling for Object Detection. arXiv 2023, arXiv:2303.01047. [Google Scholar]
  41. Jiang, Y.; Zhu, X.; Wang, X.; Yang, S.; Li, W.; Wang, H.; Fu, P.; Luo, Z. R2CNN: Rotational region CNN for orientation robust scene text detection. arXiv 2017, arXiv:1706.09579. [Google Scholar]
  42. Xu, Y.; Fu, M.; Wang, Q.; Wang, Y.; Chen, K.; Xia, G.-S.; Bai, X. Gliding vertex on the horizontal bounding box for multi-oriented object detection. IEEE Trans. Pattern Anal. Mach. Intell. 2020, 43, 1452–1459. [Google Scholar] [CrossRef] [PubMed]
  43. Ding, J.; Xue, N.; Long, Y.; Xia, G.S.; Lu, Q. Learning RoI transformer for oriented object detection in aerial images. In Proceedings of the IEEE/CVF Conference on Computer Vision and Pattern Recognition, Long Beach, CA, USA, 15–21 June 2019; pp. 2849–2858. [Google Scholar]
  44. Xie, X.; Cheng, G.; Wang, J.; Yao, X.; Han, J. Oriented R-CNN for object detection. In Proceedings of the IEEE/CVF International Conference on Computer Vision, Montreal, BC, Canada, 11–17 October 2021; pp. 3520–3529. [Google Scholar]
  45. Yang, X.; Yan, J.; Feng, Z.; He, T. R3det: Refined single-stage detector with feature refinement for rotating object. In Proceedings of the AAAI Conference on Artificial Intelligence, Vancouver, BC, Canada, 2–9 February 2021; pp. 3163–3171. [Google Scholar]
  46. Han, J.; Ding, J.; Li, J.; Xia, G.-S. Align deep features for oriented object detection. IEEE Trans. Geosci. Remote Sens. 2021, 60, 5602511. [Google Scholar] [CrossRef]
  47. Chen, Z.; Chen, K.; Lin, W.; See, J.; Yu, H.; Ke, Y.; Yang, C. Piou loss: Towards accurate oriented object detection in complex environments. In Proceedings of the European Conference on Computer Vision, Glasgow, UK, 23–28 August 2020; pp. 195–211. [Google Scholar]
  48. Yang, X.; Zhou, Y.; Zhang, G.; Yang, J.; Wang, W.; Yan, J.; Zhang, X.; Tian, Q. The KFIoU loss for rotated object detection. arXiv 2022, arXiv:2201.12558. [Google Scholar]
  49. Murrugarra-Llerena, J.; Kirsten, L.N.; Zeni, L.F.; Jung, C.R. Probabilistic Intersection-Over-Union for Training and Evaluation of Oriented Object Detectors. IEEE Trans. Image Process. 2024, 33, 671–681. [Google Scholar] [CrossRef]
  50. Yang, X.; Yang, X.; Yang, J.; Ming, Q.; Wang, W.; Tian, Q.; Yan, J. Learning high-precision bounding box for rotated object detection via kullback-leibler divergence. Adv. Neural Inf. Process. Syst. 2021, 34, 18381–18394. [Google Scholar]
  51. Yang, X.; Yan, J.; Ming, Q.; Wang, W.; Zhang, X.; Tian, Q. Rethinking rotated object detection with gaussian wasserstein distance loss. In Proceedings of the International Conference on Machine Learning, Vienna, Austria, 18–24 July 2021; pp. 11830–11841. [Google Scholar]
  52. Yang, X.; Yang, J.; Yan, J.; Zhang, Y.; Zhang, T.; Guo, Z.; Sun, X.; Fu, K. Scrdet: Towards more robust detection for small, cluttered and rotated objects. In Proceedings of the IEEE/CVF International Conference on Computer Vision, Seoul, Republic of Korea, 27 October–2 November 2019; pp. 8232–8241. [Google Scholar]
  53. Qian, W.; Yang, X.; Peng, S.; Yan, J.; Guo, Y. Learning modulated loss for rotated object detection. In Proceedings of the AAAI Conference on Artificial Intelligence, Online, 2–9 February 2021; pp. 2458–2466. [Google Scholar]
  54. Wang, H.; Huang, Z.; Chen, Z.; Song, Y.; Li, W. Multigrained angle representation for remote-sensing object detection. IEEE Trans. Geosci. Remote Sens. 2022, 60, 1–13. [Google Scholar] [CrossRef]
  55. Xu, Y.; Gu, Y.; Peng, D.; Liu, J.; Chen, H. An Improved YOLOv3 Model for Arbitrary Direction Ship Detection in Synthetic Aperture Radar Images. J. Mil. Eng. 2021, 42, 1698–1707. [Google Scholar]
  56. Yang, X.; Yan, J.; He, T. On the Arbitrary-Oriented Object Detection: Classification based Approaches Revisited. Int. J. Comput. Vis. 2022, 130, 1340–1365. [Google Scholar] [CrossRef]
  57. Li, Y.; Li, X.; Dai, Y.; Hou, Q.; Liu, L.; Liu, Y.; Cheng, M.M.; Yang, J. LSKNet: A Foundation Lightweight Backbone for Remote Sensing. In Proceedings of the IEEE International Conference on Computer Vision, Paris, France, 2–6 October 2023; pp. 1–22. [Google Scholar]
  58. Zhang, Y.-F.; Ren, W.; Zhang, Z.; Jia, Z.; Wang, L.; Tan, T. Focal and efficient IOU loss for accurate bounding box regression. Neurocomputing 2022, 506, 146–157. [Google Scholar] [CrossRef]
  59. Xia, G.S.; Bai, X.; Ding, J.; Zhu, Z.; Belongie, S.; Luo, J.; Datcu, M.; Pelillo, M.; Zhang, L. DOTA: A Large-Scale Dataset for Object Detection in Aerial Images. In Proceedings of the IEEE Conference on Computer Vision and Pattern Recognition, Salt Lake City, UT, USA, 18–23 June 2018; pp. 3974–3983. [Google Scholar]
  60. Everingham, M.; Eslami, S.M.A.; Van Gool, L.; Williams, C.K.I.; Winn, J.; Zisserman, A. The Pascal Visual Object Classes Challenge: A Retrospective. Int. J. Comput. Vis. 2014, 111, 98–136. [Google Scholar] [CrossRef]
  61. Everingham, M.; Van Gool, L.; Williams, C.K.I.; Winn, J.; Zisserman, A. The Pascal Visual Object Classes (VOC) Challenge. Int. J. Comput. Vis. 2010, 88, 303–338. [Google Scholar] [CrossRef]
  62. Zhu, M.; Hu, G.; Zhou, H.; Wang, S.; Feng, Z.; Yue, S. A Ship Detection Method via Redesigned FCOS in Large-Scale SAR Images. Remote Sens. 2022, 14, 1153. [Google Scholar] [CrossRef]
  63. Cai, X.; Lai, Q.; Wang, Y.; Wang, W.; Sun, Z.; Yao, Y. Poly kernel inception network for remote sensing detection. In Proceedings of the IEEE/CVF Conference on Computer Vision and Pattern Recognition, Seattle, WA, USA, 16–22 June 2024; pp. 27706–27716. [Google Scholar]
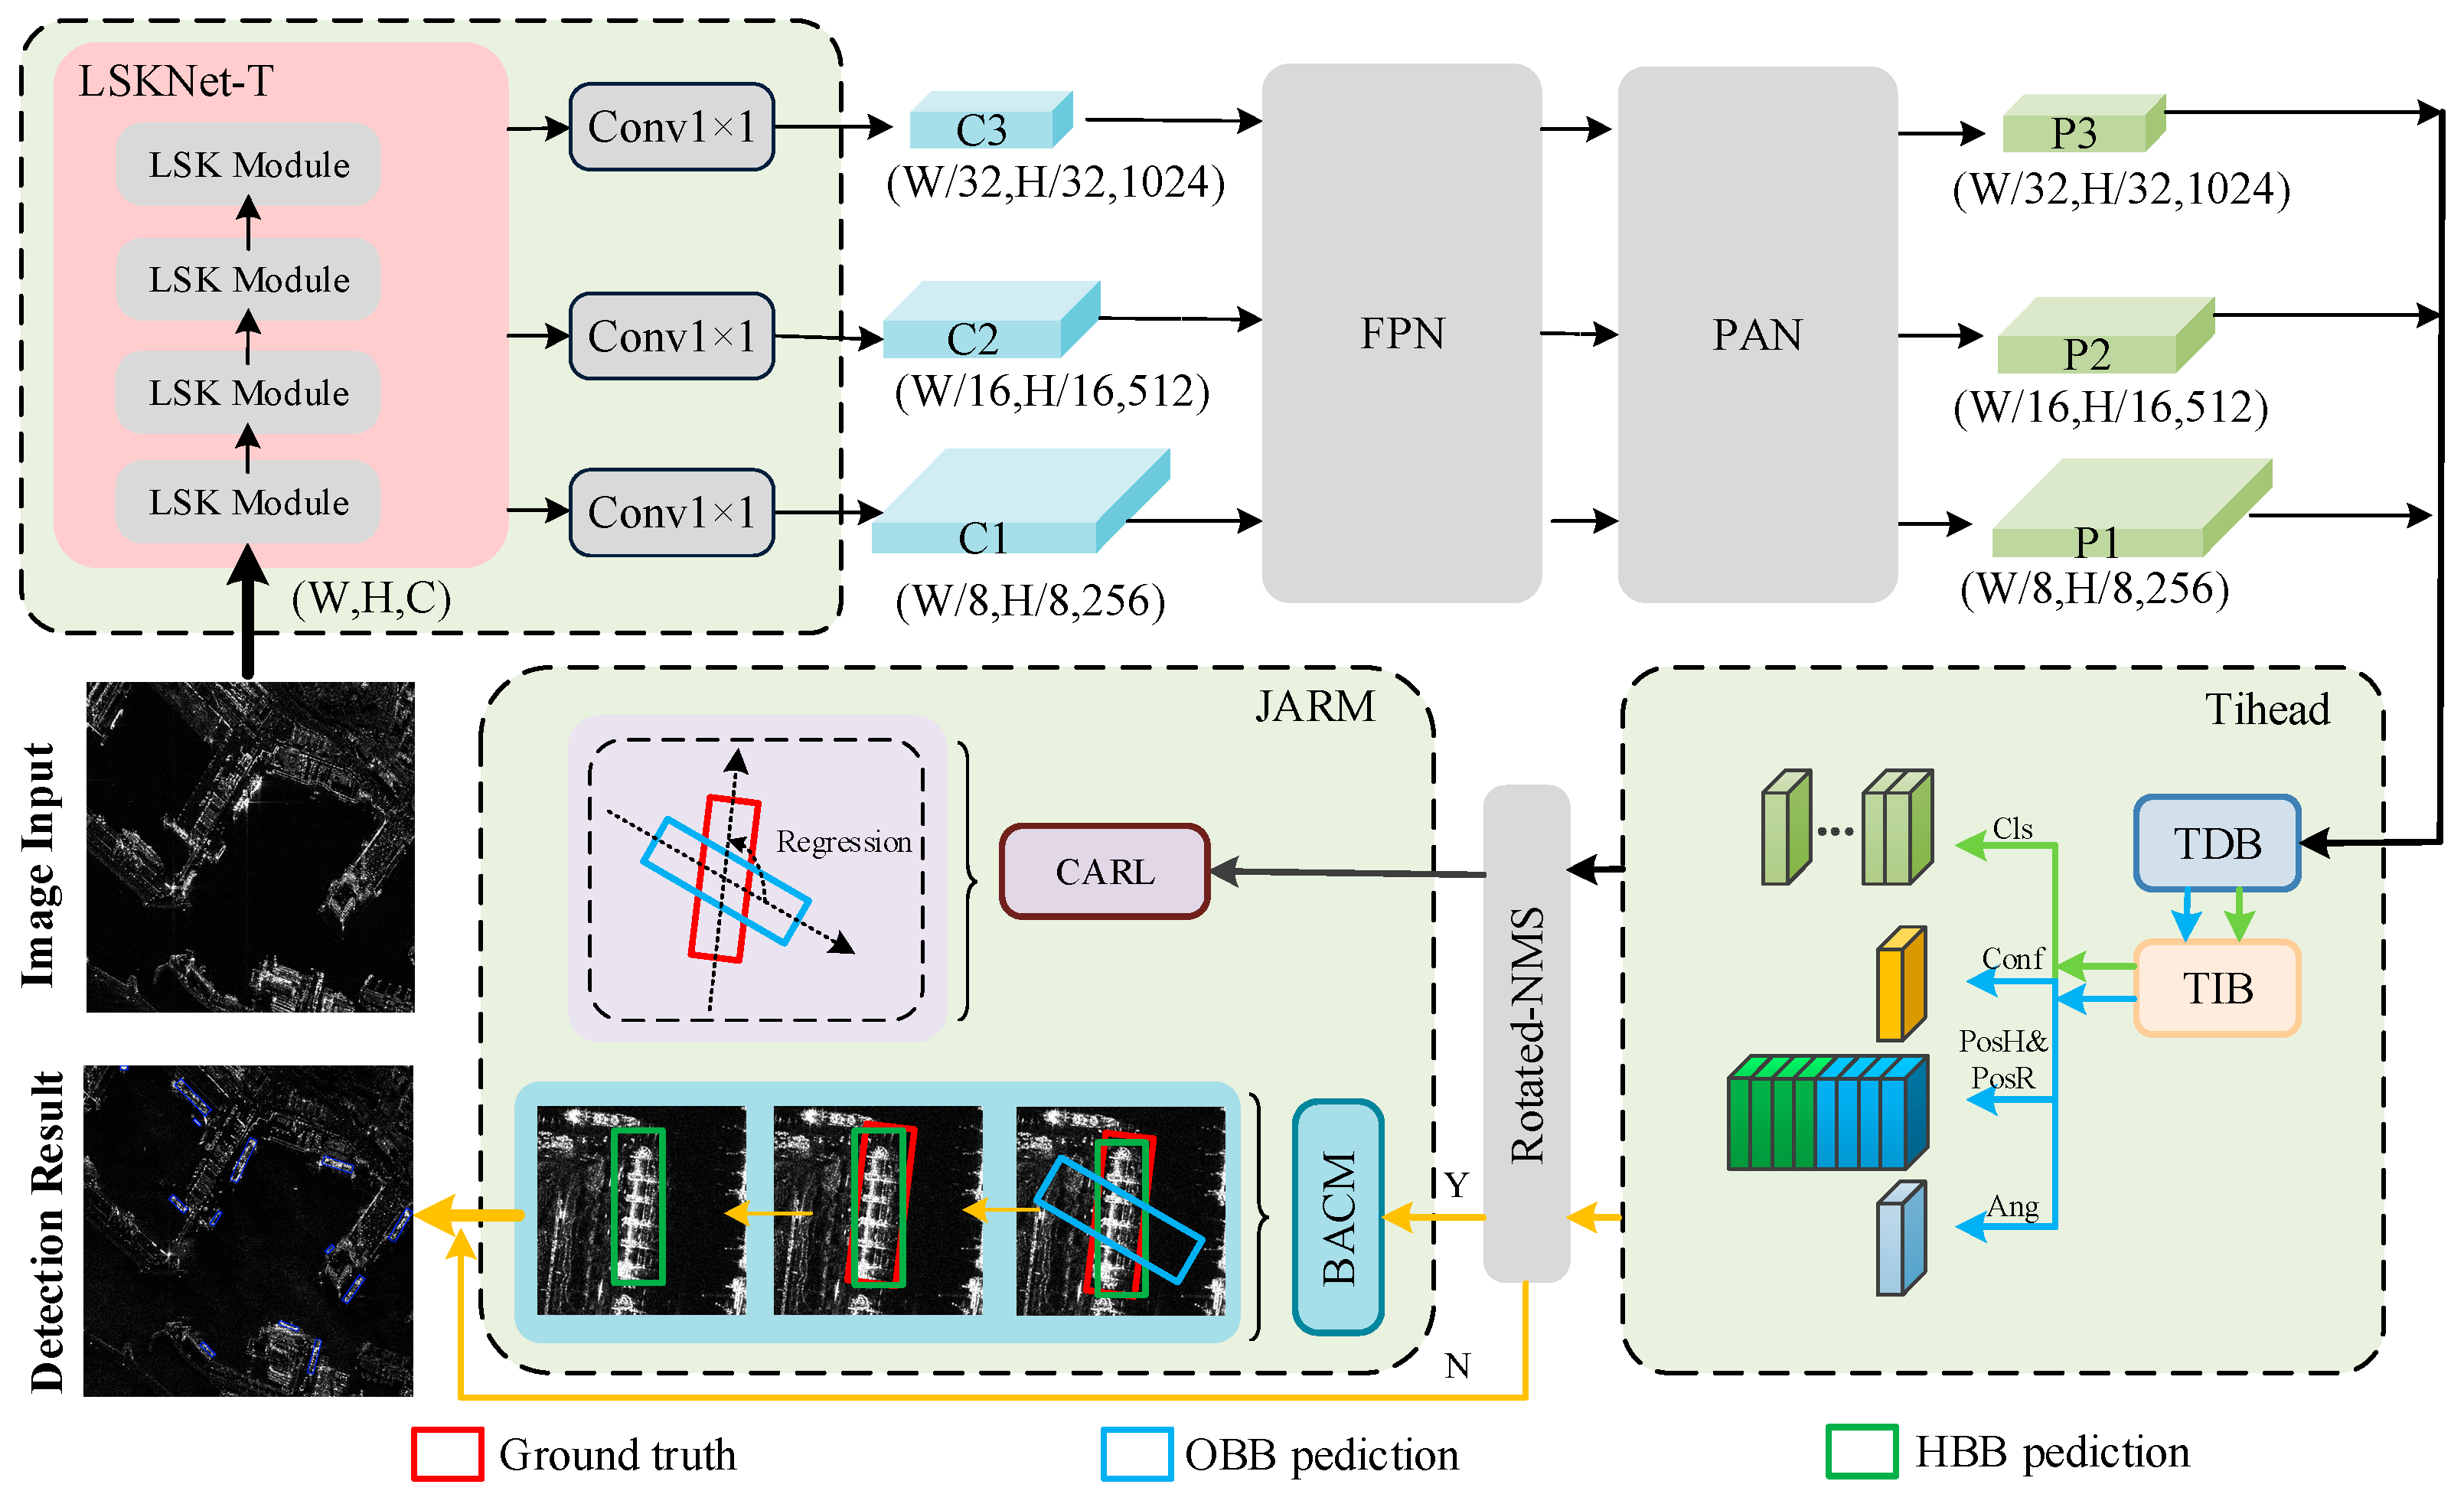
Figure 2. The overall structure of TIAR-SAR.
Remotesensing 17 02049 g002
Figure 3. The structure of the task interaction detection head. N c denotes the number of categories. W and H represent the width and height of the feature map, respectively.
Remotesensing 17 02049 g003
Figure 4. The design of TDB. G A P indicates the global average pooling, F c indicates the full connection layer, and w is the weight value of layer attention.
Remotesensing 17 02049 g004
Figure 5. The design of TIB.
Remotesensing 17 02049 g005
Figure 6. The position output of the Tihead. (a) Definition of OBBs; (b) relative positional relationship between HBB and OBB.
Remotesensing 17 02049 g006
Figure 7. Schematic diagram of CARL. t o b b , p o b b , and t h b b denote the ground truth of OBB, the prediction of OBB, and the ground truth of HBB, respectively. h b b c is an intermediate variable computed based on ground truth OBB t o b b and predicted angle θ .
Remotesensing 17 02049 g007
Figure 8. The refinement process of BACM during the inference stage. The green, blue, and red solid lines represent the HBB prediction, OBB prediction, and ground truth, respectively. The green dashed line indicates the minimum bounding rectangle of the predicted OBB.
Remotesensing 17 02049 g008
Figure 9. Detection results in multi-category scenarios. (a) Parallel head; (b) T-head; (c) Unihead; and (d) Tihead (ours). Blue dashed-line ellipses indicate category detection errors. The different colors indicate the category of ship.
Remotesensing 17 02049 g009
Figure 10. Detection results in boundary scenarios. (a) Smooth L1; (b) CSL; (c) GCL; and (d) JARM (ours). The different colors indicate the category of ship.
Remotesensing 17 02049 g010
Figure 11. Visualization of the relationship between model size and detection speed with mAP50. (a) Model size and mAP; (b) detection speed and mAP; the red pentagram represents our proposed model.
Remotesensing 17 02049 g011
Figure 12. Detection results on the HRSID test dataset. (a) Offshore scenario; (b) nearshore scenario; yellow dashed-line ellipses indicate false alarms, and green dashed-line ellipses indicate missed detections.
Remotesensing 17 02049 g012aRemotesensing 17 02049 g012b
Figure 13. Detection results on the DOTAv1 test dataset. The different colors indicate the category of object.
Remotesensing 17 02049 g013
Table 1. The correction process of BACM.
The correction process of BACM
1 :   Input :   HBB   prediction   h b b i p , OBB prediction o b b i p
2 :   h b b i o = m i n A r e a R e c t ( o b b i o )
3 :   Threshold   factor   β = 0.3
4 :   for   i = 1  to  N  do
5 :     if   I o U ( h b b i p , h b b i o ) < β  then
6 :        y i = h b b i p
7:     else
8 :        y i = o b b i p
9:     end if
10: end for
11:  Output :   Final   detection   results   { y i }
Note: m i n A r e a R e c t ( ) is an OpenCV function, which is utilized to calculate the minimum bounding rectangle of the OBB.
Table 2. Details of the experimental datasets.
DatasetsResolutionImage SizeImagesCategoriesPolarization
SRSDD1 m1024 × 10246666HH, VV
HRSID0.5 m, 1 m, 3 m800 × 80056041HH, VV, HV,
VH
DOTAv10.1 m~2 m800~4000280615-
Table 3. Train hyperparameters.
DatasetsEpochBatch SizeInput Size (Train/Test)
SRSDD30041024 × 1024
HRSID1508800 × 800
DOTAv16041024 × 1024
Table 4. Comparison of different detection head types on the SRSDD dataset.
Head TypeC1C2C3C4C5C6mAP50 (%)Model Size (MB)
Coupled head41.7654.6114.5076.0068.8437.1648.8116.04
Parallel head48.9972.4323.8210067.1046.0959.7421.39
T-head52.5164.6932.5010070.7142.4060.4723.95
Unihead50.6163.1835.8494.2969.7051.5960.8721.22
Tihead (ours)52.9857.5436.3010072.1947.3161.0521.91
Table 5. Comparison with different angle estimation methods on the SRSDD dataset.
MethodsCategorymAP50 (%)AAE (%)
Smooth L1Regression59.748.41
CSLClassification56.239.43
GCLClassification60.1411.76
JARM (ours)Regression61.686.74
Table 6. Ablation experiments on the SRSDD dataset.
TiheadJARMPRmAP50 (%)F1 (%)Weights (MB)
1 61.1060.7259.7460.9121.39
2 65.5259.7961.0562.5221.91
3 64.5463.2361.6863.8721.40
469.1363.0763.9165.9621.92
Table 7. Comparison with other advanced methods on the SRSDD dataset.
MethodsC1C2C3C4C5C6mAP50 (%)Weights (MB)Speed (fps)
R-FCOS [21,62]54.8847.3625.125.4583.0081.1149.4924410.15
R3Det [21,45]44.6142.9818.321.0954.2773.4839.124687.69
RoI Trans * [21,43]61.4348.8932.8927.2779.4176.4154.384217.75
O-RCNN * [21,44]63.5557.5635.3527.2777.5076.1456.233158.32
RMCD-Net [30]56.5162.2836.7354.5281.7178.0061.62--
RBFA-Net [31]59.3957.3641.5173.4877.1771.6263.42302-
FEVT-SAR [25]48.1155.7735.2110077.2771.3964.6342.17-
TIAR-SAR (ours)55.7069.2633.1010070.8454.5463.9121.9217.42
Note: * indicates two-stage detector. The detection speed is carried out on the RTX 2080 Ti.
Table 8. Comparison with other advanced methods on the HRSID dataset.
MethodsMetric TypeInshore (mAP50)Offshore (mAP50)All (mAP50)
RetinaNet-O [29,35]VOC0749.890.075.9
S2ANet [29,46]VOC0766.690.880.6
RoI Trans * [29,43]VOC0765.790.880.3
Gliding Vertex * [29,42]VOC0757.590.678.6
O-RCNN * [29,44]VOC0741.690.262.7
AEDet [29]VOC0776.590.888.2
FEVT-SAR [25]VOC1278.6-89.6
YOLOv8m-OBBVOC0774.890.786.6
VOC1275.797.187.9
TIAR-SAR (ours)VOC0777.290.688.6
VOC1280.597.490.3
Note: * indicates two-stage detector.
Table 9. Comparison with other advanced methods on the DOTAv1 test dataset.
MethodsPLBDBRGTFSVLVSHTCBCSTSBFRAHASPHCmAP50
SASM86.479.052.569.877.376.086.790.982.685.760.168.274.072.262.474.9
O-RepPoint87.083.254.171.280.278.487.390.986.086.359.970.573.572.359.076.0
R3Det89.682.449.871.780.081.487.890.984.286.161.166.673.173.960.075.9
S2ANet89.784.251.971.980.883.588.390.887.086.965.069.575.880.261.977.8
Redet *88.882.654.074.078.184.188.090.987.885.861.860.476.068.163.676.3
RoI Trans *89.385.655.874.774.779.188.190.987.486.961.764.377.875.466.177.2
O-RCNN *89.784.255.877.680.384.588.190.987.686.166.970.277.573.662.978.4
TIAR-SAR (ours)89.383.552.979.781.184.888.390.887.188.162.069.275.780.772.579.1
Note: * indicates two-stage detector. Except for TIAR-SAR, the experimental data of other methods are quoted from [63].
Disclaimer/Publisher’s Note: The statements, opinions and data contained in all publications are solely those of the individual author(s) and contributor(s) and not of MDPI and/or the editor(s). MDPI and/or the editor(s) disclaim responsibility for any injury to people or property resulting from any ideas, methods, instructions or products referred to in the content.