1. Introduction
Synthetic Aperture Radar (SAR) possesses the capability to operate in all weather conditions and at any time of day, and its applications have been extensively expanded into various fields such as Earth science, climate change monitoring, and environmental protection [
1]. In the realm of maritime surveillance, SAR technology has been deeply applied [
2], covering areas from military security monitoring and control of illegal immigration activities to fisheries resource management, maintenance of marine protected areas, and addressing the rapidly growing demands of global maritime trade. Currently, the ability to remotely monitor and track vessels in various complex scenarios is particularly crucial [
3].
SAR technology has evolved from single-polarization to dual-polarization, full polarimetric, and compact polarimetric operating modes. Single-polarization SAR data, relying primarily on intensity information, has been widely used for ship detection due to its simplicity and data availability. Classical methods like CFAR and its variants operate on image intensity. Other approaches have explored Doppler information for moving ship detection, ship wakes/shadows, or change detection from image time series.
However, these single-channel methods exhibit certain limitations. Intensity-based detectors often struggle with low Signal-to-Clutter Ratios, especially for small ships or in complex sea states, leading to high false alarm rates or missed detections. While Doppler methods are effective for moving targets, they are less suitable for stationary or slow-moving vessels, or ships moving tangentially to the radar line of sight. Wake detection is dependent on favorable sea conditions and ship characteristics and is not universally applicable. Change detection requires multi-temporal data and precise co-registration, limiting its utility for rapid, wide-area surveillance.
These limitations have motivated the exploration of polarimetric SAR (PolSAR) data, which provides richer scattering information. Dual-polarization and compact polarimetric SAR systems can obtain more polarization information. Full polarimetric SAR systems, by alternately transmitting and simultaneously receiving orthogonally polarized electromagnetic waves, can acquire complete polarization information about targets, thereby enhancing the capability of SAR systems to detect and classify ship targets and offering stronger practical application potential [
4,
5].
While fully polarimetric SAR captures comprehensive target backscattering information, its conventional implementation necessitates alternating transmit polarizations. This operational requirement mandates a doubling of the Pulse Repetition Frequency (PRF). Consequently, constraints imposed by range ambiguities effectively halve the achievable mapping swath width [
6,
7,
8]. Furthermore, acquiring the full scattering matrix inherently results in a doubling of the data volume compared to dual-polarization systems, assuming identical resolution and imaging geometry. Moreover, during Earth observation, the optimal dynamic ranges of the co-polarized (HH/VV) and cross-polarized (HV/VH) channels of full polarimetric SAR echo signals exhibit significant differences. Practical systems typically employ channel gain control and complex internal calibration loops to compensate for these differences, which also increases the payload weight and calibration complexity.
In large-scale maritime ship detection tasks, the swath width of SAR systems is of paramount importance as it determines the exponential improvement in search efficiency and timeliness. To overcome the shortcomings of full polarimetric SAR, improve the mapping width, and simplify the system design, Souyris et al. [
9] first proposed the concept of compact polarimetric SAR in 2005. Currently, more and more spaceborne SAR systems are being equipped with compact polarimetric modes [
10,
11,
12,
13,
14,
15]. These modes, with wider mapping widths than full polarization modes, have attracted significant attention in ship detection [
16,
17,
18,
19].
It should be noted that only standard dual-polarization (DP) modes, such as HH/HV or VV/VH configurations, offer architectural simplification over fully polarimetric (FP) systems. In contrast, the compact polarimetry (CP) and the Generalized Compact Polarimetry (GCP) modes discussed herein necessitate the transmission of circular or elliptical polarization. While this does not confer an advantage in terms of system simplicity compared to FP systems, their primary benefit lies in enabling double the mapping swath width relative to an FP SAR operating under conventional alternating polarization schemes.
In this study, all polarimetric SAR modes employing a single-transmit, dual-receive (STDR) architecture are collectively referred to as GCP modes. Historically, within the evolution of polarimetric SAR, STDR configurations were initially designated as dual-polarization (DP) modes. However, with the advent of compact polarimetry (CP)—which also utilizes an STDR architecture—modes transmitting specific polarizations such as right-/left-hand circular (RHC/LHC) or
linear were termed ‘compact polarimetry’. This nomenclature emerged to differentiate these specific configurations, rather than classifying them under the broader DP category, as illustrated conceptually in
Figure 1.
This study employs the term ‘GCP mode’ to encompass all STDR polarimetric configurations, including those involving the transmission of arbitrary elliptical polarizations, thereby extending beyond the scope of conventional CP and standard DP modes. While technically all STDR configurations could fall under the broader category of ‘dual polarization’, applying this label universally risks ambiguity, as ‘dual polarization’ is frequently used in the literature to refer specifically to the standard linear configurations (e.g., HH/HV or VV/VH). To prevent potential confusion and maintain clarity, this study explicitly defines the term ‘dual-polarization (DP) mode’ as referring exclusively to these standard HH/HV or VV/VH configurations. Consequently, all STDR modes investigated herein, including conventional DP and CP types, are classified under the umbrella term ‘GCP modes’.
This research focuses on identifying which specific configuration among the multitude of GCP modes yields the optimal performance for ship detection. It investigates whether conventional compact polarimetry (CP) represents the superior choice within this broader set and explores the potential to attain detection accuracies comparable to those of fully polarimetric SAR (FP-SAR) through judicious selection of an optimal GCP mode. These core questions form the foundation of the investigation presented in this paper.
1.1. State of the Art
Research focused on direct, comparative analyses of ship detection performance across different polarization modes remains relatively limited. While numerous studies have investigated ship detection utilizing data acquired in various specific polarization modes (e.g., single, dual, compact, or full polarimetry) and developed corresponding detection methodologies, systematic evaluations comparing their relative effectiveness head to head are less common.
Some investigations have compared single-polarization (Single Pol, typically single-transmit, single-receive), dual-polarization (DP) and compact polarization (CP) (both single-transmit, dual-receive, STDR), and fully polarimetric (FP, typically dual-transmit, dual-receive) modes. The outcomes are generally predictable: FP modes tend to outperform STDR modes (DP/CP), which, in turn, outperform Single Pol modes. This hierarchy is largely attributable to the increased information content provided by the additional one or two polarization channels available in FP and STDR systems, respectively, compared to Single Pol.
In contrast, the present study concentrates on the comparative detection performance among different GCP modes. The objective is to determine which specific STDR configuration achieves the optimal performance while leveraging the inherent advantage of the doubled mapping swath width compared to conventional alternating-transmit FP systems. Since all GCP modes by definition in this work utilize the same number of receive channels (two), establishing their relative superiority based on metrics like detection accuracy or Target-to-Clutter Ratio (TCR) is not straightforward and lacks an intuitive answer based solely on channel count.
Below, some relevant studies are summarized, starting with those involving comparisons.
In 2019, Fan et al. [
16] proposed a U-Net-based ship detection method for compact polarimetric SAR (CPSAR) images. Compared to Faster R-CNN, this method reported improvements of 6.54% in precision and 8.28% in recall. This work compared CPSAR images against single-polarization and linear dual-polarization modes, concluding that CPSAR holds an advantage for ship detection, albeit with an accuracy improvement stated to be less than 1%. In 2024, Zhang et al. [
17] introduced an enhanced CPSAR ship detection method leveraging YOLOv8, deformable convolutions, and attention mechanisms. Their findings indicated superior recall, precision, and mean Average Precision (mAP) for the CP SPAN dataset compared to an HH single-channel dataset, with a notable 4.5% difference in recall. However, this study did not include a comparison with DP datasets.
These examples underscore that the research systematically comparing different polarization modes for ship detection to determine the optimal configuration remains limited. Furthermore, existing comparisons often lack comprehensiveness and systematic rigor, notably, by generally not evaluating the full spectrum of possible GCP modes beyond conventional CP and standard DP configurations.
While the majority of publicly available SAR ship detection datasets consist of single-polarization intensity images, a growing body of research has explored the utility of FP, DP, and CPSAR data. In contrast to the comparative studies mentioned above, much research effort has focused on developing detection techniques tailored to the specific polarization modes described below.
Fully Polarimetric (FP) Mode: Several studies concentrated on leveraging the rich information content of FP data. For instance, Jin et al. [
20] introduced a lightweight Patch-to-Pixel Convolutional Neural Network (P2P-CNN) considering both the target and its surroundings, achieving superior results compared to other methods. Zhang et al. [
21] proposed a method based on scattering mechanisms and wave polarization anisotropy, using a joint scattering–anisotropy (joint-SA) detector for identifying weakly scattering targets. Other research has explored optimal polarimetric rotation domain features using Support Vector Machines (SVM) [
22], few-shot learning approaches [
23], the Degree of Polarization (DOP) [
24], lightweight theory-driven networks (LT-Net) [
25], simultaneous diagonalization transformation (SDT) [
26], and dualistic cascaded convolutional neural networks (DCCNN) [
27]. These studies demonstrate the potential of FP data for achieving high detection accuracy and robustness.
Dual-Polarization (DP) Mode: Offering a balance between detection performance and swath width, DP data is a popular choice. Xie et al. [
28] presented a two-stage feature fusion strategy combining Histogram of Oriented Gradients (HOG) features with DP SAR data. Xu et al. [
29] proposed a Group-Wise Feature Enhancement and Fusion Network (GWFEF-Net) for improved SAR ship detection. Further studies focused on dual-branch deep networks (DBDN) for ship classification [
30], squeeze-and-excitation Laplacian pyramid networks with dual-polarization feature fusion (SE-LPN-DPFF) [
31], quadratic matched filters (QMF) [
32], dual-polarization image feature fusion networks (DPFF-Net) [
33], the CFAR-DP-FW deep learning framework [
34], dual-polarization information-guided networks (DPIG-Net) [
35], and improved CFAR algorithms for large-scale ship classification [
36]. This body of work highlights the effectiveness of DP data for ship detection and classification, particularly when combined with advanced feature extraction and fusion techniques, demonstrating that integrating polarimetric information enhances detection accuracy.
Collectively, the research reviewed above suggests that DP and CP modes represent viable alternatives to FP data for ship detection tasks, offering advantages such as wider swath coverage. However, it also underscores the need for further investigation to fully characterize their capabilities and limitations, particularly through systematic comparative analyses—like the one undertaken in this paper—across a wider range of polarization configurations within the STDR framework.
1.2. Research Objectives and Contributions
Reviewing the current state of the art reveals that substantial advancements have been made in polarimetric SAR (PolSAR) ship detection in recent years. Nevertheless, the majority of the existing research efforts concentrate on optimizing detection algorithms tailored to specific, predetermined polarization modes. Comparative performance analyses across different modes—such as standard dual polarization (DP), conventional compact polarimetry (CP), and the broader GCP—remain limited and often lack systematic rigor. Consequently, a comprehensive and systematic investigation to identify the optimal polarization mode within the GCP framework specifically for ship detection is notably absent from the literature.
Furthermore, several studies [
16,
17,
19,
37,
38] carry an implicit assumption that conventional compact polarimetry (CP) universally offers superior performance compared to standard dual-polarization (DP) modes. By adapting and extending the established theory of GCP measurements [
39] to the domain of ship detection, this research critically examines this presupposition. This study demonstrates scenarios where specific DP configurations can potentially outperform conventional CP modes in certain ship detection contexts.
Therefore, the primary objective of this research is to conduct a systematic investigation into the selection of the optimal GCP mode for SAR ship detection. This study aims to determine which polarization configurations yield the best performance for this specific application, thereby contributing both theoretical insights and practical guidelines for mode selection in operational scenarios.
The main contributions of this paper are as follows:
First Systematic Application of GCP to Ship Detection: This work presents the first systematic investigation employing a comprehensive range of GCP modes specifically for the task of ship detection. Datasets for diverse GCP configurations were synthesized using simulations based on fully polarimetric (FP) data, and the performance implications of these modes were experimentally validated in ship detection scenarios.
Optimal Mode Selection Strategy: This paper proposes and validates a strategy for selecting the optimal transmit polarization mode specifically for ship detection, demonstrating how leveraging the distinct performance characteristics associated with different GCP configurations can be used to optimize detection accuracy.
Comparative Performance Analysis and Novel Optimization Perspective: A systematic comparison of Target-to-Clutter Ratio (TCR) and ship detection accuracy is conducted across conventional polarization modes (including horizontal (H), vertical (V), right-hand circular (RHC), left-hand circular (LHC), and linear modes) and a comprehensive set of GCP modes. This comparison elucidates the distinct impacts of various transmit polarizations on ship detection performance and highlights the critical importance of selecting task-appropriate modes. This paper introduces and substantiates the concept of “optimization at the information source”—selecting the optimal polarization mode—as a complementary approach to traditional detection algorithm optimization for enhancing overall system performance.
Implications for System Design: This research offers novel insights and theoretical support for adaptive polarization mode configuration in practical PolSAR system design. It particularly demonstrates that judicious GCP mode selection can yield significant performance enhancements when dealing with diverse vessel types and complex background clutter scenarios.
The remainder of this paper is organized as follows:
Section 2 details the theoretical background and characteristics of the GCP modes.
Section 3 describes the methodology, including the dataset used and experimental setup.
Section 4 presents the experimental results, provides analysis and discussion, and outlines potential directions for future research. Finally,
Section 5 concludes the paper with a summary of the key findings.
2. Theoretical Analysis
The main content of this chapter involves several key points: the proposal to designate all single-transmit, dual-receive (STDR) polarimetric configurations as GCP modes; the argument that all GCP modes possess essentially equivalent inherent information capacity relative to one another such that no mode is fundamentally superior solely based on this capacity; and the analysis concluding that variations in the specific information content captured by different GCP modes are jointly determined by the transmit polarization and the observed target. A core tenet of this research is that, for ship detection, a specific GCP mode should exist that yields the optimal performance. Subsequent experiments utilizing the FPSD dataset identified such an optimal GCP mode, thereby supporting this viewpoint.
2.1. Proposal of GCP Mode
The GCP mode refers to all single-transmit, dual-receive polarization modes, including dual-polarization and compact polarimetry modes. Essentially, the GCP SAR system is a single-transmit, dual-receive SAR system. The GCP mode includes more general polarization modes where elliptical polarization is transmitted. The definition of elliptical polarization is briefly introduced below.
The time-domain vector expression of the electric field strength with propagation direction
z is
The attenuation factor a is the same on all components of the electric field vector and does not affect the polarization characteristics. The amplitude of H is equal to the amplitude of V. The polarization situation is only determined by the phase difference . When the phase difference is 0, the polarization mode is linear polarization. When the phase difference is , the polarization mode is circular polarization. Elliptical polarization refers to all forms of polarization except linear polarization and circular polarization. The polarization ellipse is defined by the following three parameters:
The amplitude
A of the ellipse is determined by the major and minor axes of the ellipse:
The elliptical orientation angle
is defined as the angle between the major axis of the ellipse and the x-axis direction:
Ellipticity angle
is defined as follows:
The polarization state of elliptical polarization is typically determined by the ellipticity angle and the ellipse orientation angle, as illustrated in
Figure 2. In this paper, the transmitted polarization is represented by [
,
], where
is the orientation angle and
is the ellipticity angle. When
= 0, the polarization ellipse degenerates into linear polarization, and when
is 0°, 45°, and 90°, the corresponding polarization modes are horizontal polarization (H),
linear polarization, and vertical polarization (V), respectively. When
= ±45°, the polarization ellipse degenerates into left-handed circular polarization (L) or right-handed circular polarization (R). Since circular polarization has no inherent directionality theoretically, any ellipse orientation angle in the range of [−90°, 90°] can be regarded as L or R polarization. Therefore, linear and circular polarization are special cases of elliptical polarization.
Similar to DP SAR, CP SAR also belongs to the single-transmit, dual-receive mode, with the main difference being the transmitted polarization mode. The DP mode transmits H or V linear polarization, while the mode in compact polarimetry transmits 45° linear polarized electromagnetic waves and the DCP and CTLR modes transmit R or L circularly polarized waves. All are single-polarization transmission modes. At the receiving end, the DP, , and CTLR modes all receive HV polarization, while the DCP mode receives RL polarization. Although HV and RL are formally different, both form orthogonal polarization bases and can be equivalently expressed via polarization basis transformation. Therefore, from a reception mechanism perspective, DP and CP have no essential difference. Given the generality of the transmitted polarization, the GCP mode is defined as a more generalized mode that includes both DP and CP. Theoretically, GCP can encompass all possible transmitted polarization forms, and the specific forms will be compared in the subsequent chapters of this paper to assess the performance of different modes in ship detection tasks.
2.2. Information Equivalence of GCP Modes
Given that the primary difference in GCP modes lies in the transmitted polarization, the key question is as follows: Which mode among HV linear polarization, RL circular polarization, and other elliptical polarization modes provides the best target information for ship detection tasks?
The core argument regarding the fundamental information equivalence of GCP modes, which we first introduced in our previous work [
39], can be summarized as follows:
1. Equivalent Potential Information Capacity: All single-transmit, dual-receive (STDR) configurations—whether standard linear dual-polarization (DP), conventional compact polarimetry (CP, e.g., employing circular or linear transmit polarization), or more general elliptical transmit modes falling under the GCP umbrella—are fundamentally equivalent in terms of their potential information capacity. This equivalence stems from their shared architecture: transmitting a single, known polarization state while coherently receiving signals in two orthogonal polarization bases. Consequently, no specific GCP configuration (e.g., CP) possesses an inherent ‘information advantage’ that makes it fundamentally superior to any other (e.g., linear DP) based solely on the quantity of information channels. The reverse also holds true.
2. Source of Performance Differentiation: Despite this equivalence in potential capacity, the specific information content captured and its practical utility for a particular application (such as ship detection) demonstrably differ among various GCP modes. These performance variations arise directly from the interaction between the chosen transmit polarization and the unique polarimetric scattering characteristics exhibited by the target of interest and its surrounding environment (i.e., clutter).
In the existing literature, compact polarimetry (CP) SAR modes are often described as possessing specific advantages relative to traditional dual-polarization (DP) modes. Some studies point out that certain CP modes exhibit rotational invariance properties and enable wider imaging swaths compared to full polarimetry (FP) [
17,
37,
38]. Furthermore, CP modes are often suggested to capture richer polarimetric information than linear DP modes [
16,
17,
19,
37,
38], or allow for the extraction of more diverse scattering features through various signal combinations. This reportedly results in superior performance over DP in specific applications, such as sea ice monitoring [
37], environmental monitoring [
38], or ship detection [
16,
17], sometimes achieving classification accuracies approaching those of FP modes [
38]. These perceived advantages are frequently attributed to the ability of CP modes—particularly those transmitting circular polarization—to effectively transmit and/or process information related to both horizontal (H) and vertical (V) polarization components simultaneously [
19,
37,
38]. Such studies highlight the practical value and potential of CP modes under specific observation conditions and application scenarios.
However, it is contended that equating these observed performance advantages or enhanced feature extraction capabilities—often noted under specific imaging conditions or for particular target classes—with an inherent superiority in ‘information content’ in the information-theoretic sense warrants careful assessment. Consider, for instance, the transmission of right-hand circular (RHC) polarization. The inference that RHC transmission inherently captures more information than standard DP modes (transmitting only horizontally or vertically) merely because RHC polarization can be represented as a combination of H and V components
lacks logical rigor. By the same token, H polarization can likewise be decomposed into left-hand circular (LHC) and RHC components
. Appealing solely to the mathematical decomposition of polarization states cannot, therefore, substantiate a claim of greater inherent information in CP modes, nor does it explain why
linear CP modes (also decomposable into H and V) exhibit suboptimal performance in many practical cases. From an information theory standpoint, assuming the receiver completely measures the backscattered signal in a fixed orthogonal basis (e.g., horizontally and vertically), the essential difference between DP and CP modes lies in the choice of the transmit polarization state. While different transmit polarizations interact distinctly with the target’s scattering properties, the measurements are ultimately projected onto the same complete receive basis, and the resulting information can be mathematically interconverted through basis transformations. DP and CP thus represent different choices of transmit basis, not a difference in the fundamental information capacity. Thus, it is posited that circular-transmit CP modes and linear-transmit DP modes possess equivalent information capacity under ideal conditions. They provide measurements reflecting different combinations of the target’s scattering matrix elements; while the total capacity remains the same, the specific information content and consequent application potential differ owing to the distinct interactions between the chosen transmit polarization and the target.
In Equations (
5) and (
6),
represents the scattering vector of the DCP mode with R-polarized transmission,
represents the scattering vector of the DP mode with H-polarized transmission, and
represents the scattering matrix corresponding to the transmission of Q polarization and reception of P polarization. This notation is adopted throughout the paper. Equations (
5) and (
6) further illustrate the relationship between the DCP mode with R-polarized transmission in the linear polarization basis and the full polarization mode, as well as the relationship between the DP mode with H-polarized transmission in the circular polarization basis and the full polarization mode. From Equations (
5) and (
6), it is evident that, if the DP mode with linear polarization transmission is expressed in the circular polarization basis (RL), it takes the same form as the CP mode with circular polarization transmission in the linear polarization basis. Therefore, the DP mode can be viewed as a “compact polarization” mode in the circular polarization basis.
Unlike the full polarization mode, which can obtain complete polarization information and has optimal polarization performance, the GCP mode cannot acquire full polarization information, and thus different GCP modes cannot be equivalently transformed into one another. Specifically, the reception polarization in GCP modes is complete, meaning it can be converted between HV linear polarization reception and RL circular polarization reception. In contrast, the transmission and reception in the full polarization mode are both complete, and, theoretically, full polarization can be equivalently transformed between linear full polarization and circular full polarization via polarization basis transformation. However, the transmission polarization in GCP modes is incomplete. For example, when transmitting H linear polarization, the information for V linear polarization is missing, making it impossible to form a complete polarization basis, and thus the signal transmitted with circular polarization cannot be converted. Similarly, when transmitting a single circular polarization, it is impossible to convert to the signal transmitted with linear polarization.
Furthermore, while some spaceborne SAR systems may generate the required CP transmit waveform (e.g., circular) through the simultaneous, phase-controlled transmission of H and V components, this implementation detail does not imply that such CP modes provide inherently more polarimetric information than standard DP modes (which transmit horizontally or vertically exclusively on a given pulse). Complete polarimetric characterization of a target requires measuring the full 2 × 2 Sinclair matrix S, which fundamentally necessitates probing the target with two linearly independent transmit polarization states and measuring the scattered response in two linearly independent receive states. The critical point regarding CP implementations—even those involving simultaneous H and V transmission—is that the transmitted H and V signals are intrinsically coupled to form a single, well-defined polarization state (e.g., RHC or LHC). They cannot be independently modulated or interpreted as the two distinct, linearly independent transmit probes required to fully determine S. Consequently, like standard DP modes, which also employ only a single-transmit polarization (e.g., H or V), these CP modes inherently capture only a projection of the full Sinclair matrix information onto a lower-dimensional subspace (typically resulting in two complex measurements per pulse, corresponding to a column or row vector related to S, as exemplified by Equation (
6)). It is impossible to reconstruct the complete S from this incomplete projection alone. Therefore, the fundamental polarimetric information capacity of such a CP mode—defined by the ability to retrieve the complete Sinclair matrix—remains equivalent to that of conventional modes transmitting a single linear polarization state (like H, V, or
). No additional information gain, in the sense of measuring more independent elements of the Sinclair matrix, is realized, nor does this implementation represent a greater diversity of independent polarimetric measurements compared to any other single-transmit, dual-receive (STDR) mode.
Additionally, ref. [
19] points out that, in some studies, if appropriately analyzed, CPSAR observations have been shown to be essentially equivalent to FPSAR observations in certain cases and almost always superior to single-polarization SAR and DPSAR. However, it is believed that, since the CP mode does not possess a higher information capacity than the DP mode, the CP observation results are not necessarily always superior to the DP mode. A more accurate statement would be “in some cases” rather than “almost always”. In the subsequent ship detection experiments in this paper, the conclusion that the DP mode outperforms the CP mode in specific application scenarios will be further verified.
2.3. Joint Determination of GCP Mode Information Content by Transmission Polarization and Target Characteristics
This section, building upon the previous work [
39], further extends the analysis of GCP modes on ship scattering signals for the first time, exploring the physical mechanisms that cause some GCP modes to perform better in ship detection. This analysis, in the new research context, lays the foundation for ship detection tasks.
The echo signal is the result of the interaction between the transmitted electromagnetic wave and the observed object. The polarization of the transmitted electromagnetic wave, the geometric structure of the observed object, and its dielectric properties all affect the amount of information contained in the echo signal. For SAR images, within a resolution cell, the scattering matrix comes from the coherent summation of all scatterers’ backscattering within that cell.
In Equation (
7), S represents the scattering matrix of a resolution cell,
N is the number of scatterers within that cell,
represents the weight of each scatterer, and
is the scattering matrix of the k-th scatterer. Different polarization waves scatter differently for the same object. The scattering matrix for a typical target under different transmitted bases is shown in
Table 1.
From
Table 1, it can be observed that, for typical targets, different transmitted polarization modes result in varying target visibility. Under some polarizations, the target is clearly observable, while under other polarization modes, it may be difficult to detect. In real-world scenarios, targets generally have more complex scattering characteristics, and the coherent summation of different scattering centers may enhance the echo signal under certain polarization modes while causing signal attenuation in others.
In ship detection tasks, variations in ship types, sea conditions, and radar viewing angles affect the echo characteristics under different polarization modes, resulting in different information being obtained, which ultimately impacts the detection performance (refer to
Figure 3). By comparing
Figure 3a and
Figure 3c, it can be observed that the amplitude images of the co-polarization channel HH and VV are relatively bright, while the marine clutter under VV polarization is more pronounced than under HH. Due to differences in the transmitted polarization and ship structures, the ship targets in these two polarization modes also perform differently. Under H polarization, the ship outline is clearer, while under V polarization, certain areas of the ship’s midsection show stronger scattering. Furthermore, in the co-polarization channel HH and VV, ships usually exhibit higher backscatter intensity, making their contours and texture features more distinct against the ocean background. Thus, the HH and VV polarization channels play an important role in ship detection.
Further comparisons of
Figure 3a and
Figure 3b, as well as
Figure 3c and
Figure 3d, correspond to the amplitude of the co-polarization channel (H and V) and cross-polarization channels (HV and VH). It can be observed that the scattering intensity in the cross-polarization channels HV and VH is relatively weaker, but the contrast between the ship and the sea surface is higher, and the signal-to-noise ratio (SNR) is better than in the HH and VV polarization channels (refer to references [
29,
36]). Additionally, near strong scatter points on the ship, the sidelobe intensity in the cross-polarization channels is much lower than in the co-polarization channel and, in some cases, almost invisible. This characteristic could become an advantage of the cross-polarization channels against complex backgrounds. However, despite the ability of the HV channel to effectively suppress sea clutter, it also reduces the backscatter intensity of ship targets, causing some ships to appear smaller or even disappear in this polarization mode. Therefore, the cross-polarization channels have both advantages and disadvantages in ship detection tasks and need to be carefully considered in different application scenarios.
Figure 3e,f show the compact polarimetry mode with L polarization transmitted and H and V polarization received. It can be observed that the HL polarization channel performs between the HH and VV polarization channels. The sea surface clutter is weaker in the HL channel compared to the VV channel, but the ship signal strength is also lower than in the HH channel. Additionally, unlike the DP mode, the L polarization mode does not have distinct cross-polarization channels, and the ship targets in the HL and VL channels are generally clearer, with the HL channel having a higher SNR than the VL channel.
Figure 3g,h show the GCP mode with [−10, −5] polarization transmitted and H and V polarization received. The amplitude images in this mode are generally similar to those in H polarization. Compared to
Figure 3c,e, there is no obvious weakening or interruption of the small ship in the center. However, the HT channel has slightly lower amplitude than the HH channel, while the VT channel has slightly higher amplitude than the VH channel. This may be why the information complementarity between the two polarization channels reaches the optimal effect, achieving the best balance between scattering intensity and SNR. At the same time, the scattering response remains strong, which results in the [−10, −5] polarization mode achieving the highest detection accuracy in the ship detection experiment, surpassing all other modes in
Figure 3. In fact, this mode is also the one with the highest detection accuracy among all GCP modes.
From the far-right side of the eight images, it can also be observed that, for some ship targets, the sidelobe characteristics of the strong scatter points show noticeable differences between the channels. In some channels, the sidelobes are weak, while in others, they are stronger. This could lead to misdetections in some cases. For example, as will be demonstrated in the detection results presented in
Section 4.2.3, certain modes may incorrectly detect sidelobes or parts of ships as whole entities due to such sidelobe characteristics.
To summarize the preceding discussion, factors such as the polarimetric scattering characteristics of ship targets, the polarimetric response of the surrounding sea clutter, and the sidelobe artifacts arising from strong scatterers collectively affect ship detection performance. These influences are quantitatively reflected in the Target-to-Clutter Ratio (TCR), a fundamentally important metric in the field of ship detection, which is evaluated for different GCP modes in
Section 4. Different GCP modes exhibit varying sensitivities to these factors, consequently impacting detection performance. Furthermore, for any given GCP mode, the information complementarity between its two received polarization channels plays a critical role in optimizing detection performance.
Based on the above analysis, this study proposes the following core argument: In ship detection tasks, different ship types, radar observation angles, and transmitted polarization modes all affect the amount of echo information between the ship and the sea surface acquired by the GCP mode, thereby leading to differences in the performance of different GCP modes in ship detection tasks. Therefore, theoretically, there should exist a GCP mode that achieves the optimal detection performance in specific tasks. Furthermore, in complex scenarios (such as nearshore, port, and river areas) for ship detection, or in certain application scenarios where specific targets exhibit strong scattering responses to specific polarization modes, selecting an appropriate GCP mode may provide more significant advantages.
3. Experimental Methodology and Dataset
To evaluate the performance of various GCP modes for ship detection, this study conducts comparative analyses based on both Target-to-Clutter Ratio (TCR) values and ship detection accuracy. For the accuracy assessment, two deep learning-based object detection methods are employed: Faster R-CNN and RetinaNet. To preserve the complete polarimetric information inherent in each GCP mode, the complex-valued data from the two receive channels of each mode are utilized as direct input to the detectors. This approach allows for an analysis of how this direct polarimetric information influences detection results and ensures a fair comparison across the different modes investigated. This section details the experimental methodology, the dataset utilized, specific implementation details, and the evaluation metrics employed.
3.1. Ship Detection Method: Faster R-CNN and RetinaNet
Traditional SAR ship detection relied on sea–land segmentation, CFAR detection, and handcrafted features, facing limitations in complex scenes. The transition to deep learning began with the SSDD dataset in 2017, leading to significant performance improvements [
40]. Currently, research on deep learning-based ship detection is exploding [
41,
42,
43,
44,
45,
46,
47,
48,
49,
50,
51,
52,
53,
54,
55,
56,
57,
58,
59]. A mainstream deep learning method with high accuracy was chosen for the ship detection experiments.
This study employs the one-stage detector RetinaNet [
60] and the two-stage detector Faster R-CNN [
61].
RetinaNet consists of a backbone network and two task-specific subnetworks responsible for classification and bounding box regression, respectively. Faster R-CNN incorporates a backbone network, a Region Proposal Network (RPN) for generating object proposals, and a final detection subnet for classification and regression. Both detectors were implemented using models available in the open-source MMDetection framework [
62].
To balance model performance and computational efficiency, the widely used ResNet50 [
63] architecture was selected as the backbone network for both methods. To address the significant variations in ship target scales (ranging from small nearshore boats to large ocean-going vessels), a Feature Pyramid Network (FPN) [
64] is integrated following the ResNet50 backbone. The FPN constructs multi-scale feature maps by combining semantically rich features from higher layers with high-resolution features from lower layers via top-down pathways and lateral connections. This allows the detector to effectively handle objects at different scales, capturing fine details for small ships and sufficient context for large ones.
In the Faster R-CNN architecture, the RPN generates candidate region proposals based on predefined anchors and is trained using a combination of cross-entropy loss for objectness classification and L1 loss for bounding box regression. Following the RPN, the RoIAlign layer [
65] extracts fixed-size feature maps for each proposal. Finally, the detection subnet concurrently performs classification to determine the presence of a ship and refines the bounding box coordinates for accurate localization. RetinaNet, being a one-stage detector, directly predicts class probabilities and bounding box offsets from the multi-scale feature maps generated by the backbone and FPN.
3.2. Dataset
To facilitate a comprehensive comparison of GCP mode effectiveness in the absence of dedicated real-world GCP datasets, the simulation of GCP mode data from existing fully polarimetric (FP) data was opted for.
The data used in this study comes from the FPSD dataset, first introduced in paper [
25]. This public dataset contains 853 Pauli pseudo-color images (in JPG format) and multilook complex data (in TIF format) with a total of 1714 ship targets from AIRSAR, UAVSAR, and RadarSAT-2. FPSD includes a variety of scenes, and 85.18% of the ship targets are smaller than 32 × 32 pixels
2, classified as small targets.
3.3. Experimental Details
The dataset used in this study provides nine-channel multilook complex data in TIF format, with these channels corresponding to the nine coefficient values in the upper-right corner of the covariance matrix: C11, C12R, C12I, C13R, C13I, C22, C23R, C23I, and C33.
where
L is the number of looks,
i denotes the i-th pixel, and superscript * denotes the conjugate transpose. The diagonal elements of C (C11, C22, and C33) are real values, while other elements of C are complex values.
where
k denotes the scattering vector of each pixel.
For a GCP mode defined by a transmit polarization state with ellipse orientation angle
and ellipticity angle
, the received backscattered wave
in the H/V basis can be obtained from the FP Sinclair matrix
S using
where
is the transmitted wave. The corresponding 2 × 2 GCP covariance matrix can be calculated by
where
and
represent the GCP mode scattering vectors of the transmitting
T polarization and receiving H and V polarizations. The relationship between
and the full polarization C matrix provided by the dataset is as follows:
For the subsequent ship detection experiments comparing GCP modes, we utilized the intensities of the three unique elements of the Hermitian matrix (specifically, the magnitudes ) as the three input channels to the detection models. For the reference FP mode comparison, the six real-valued channels derived from the unique elements of the 3 × 3 FP covariance matrix C (representing the magnitudes ) were used as the six input channels.
Given that raw SAR data often exhibits a high dynamic range, with significant intensity variations between ship targets and the sea surface leading to high image contrast, direct input into the model might hinder the discernment of subtle details. Therefore, prior to inputting the data into the ResNet backbone, a logarithmic transformation was applied. This pre-processing step helped to compress the dynamic range, yielding a data distribution closer to a Gaussian distribution, which consequently enhanced model training stability and generalization capability.
Additionally, the mean and standard deviation for each GCP mode were calculated for normalization to ensure stable data distribution. Default random flipping was used for data augmentation.
Before model training, network weights were re-initialized. While the models within the MMDetection framework typically default to using ResNet-50 weights pre-trained on ImageNet (via init cfg=dict(type=‘Pretrained’, checkpoint=‘torchvision://resnet50’)), this approach was tailored for three-channel RGB inputs. To ensure a fair comparison in subsequent experiments, particularly against the six-channel FP input data, this default was deviated from. Instead, Kaiming initialization (init cfg=dict(type=‘Kaiming’, layer=‘Conv2d’)) was employed for all models, regardless of the number of input channels. Kaiming initialization is specifically designed for networks utilizing ReLU activation functions and aids in maintaining stable gradient propagation between layers, thereby improving training effectiveness.
Regarding the loss function, the model by default uses two types of losses: CrossEntropyLoss for the classification task and L1Loss for bounding box regression. By default, their loss weight ratio is 1:1. In this ship detection task, since the dataset contains only a single class (ship), the main task of the detection subnet is to determine the presence of a target and accurately regress its bounding box. Therefore, the loss weight ratio was adjusted to 1:2 to place more emphasis on bounding box regression, thus improving target localization accuracy.
During training, the Stochastic Gradient Descent (SGD) optimizer with an initial learning rate of 0.0025 was used, and a linear warm-up strategy was applied. For the first 500 iterations, the learning rate gradually increased from 0.00025 (10% of the initial learning rate) to 0.0025. The learning rate decayed in stages during training, reducing to 10% of the current value at the 8th and 11th epochs. The hyperparameter settings for the optimizer were as follows: momentum was 0.9, weight decay was 0.0001, and the total number of training epochs was 12.
Throughout the experiments, a baseline model was first established by training specifically on the standard HH/HV dual-polarization (DP) mode data. This baseline training employed a staged iterative strategy involving 10 independent training sequences, each lasting 12 epochs, for a total of 120 training epochs. For the initial 12-epoch sequence, model parameters were initialized using the Kaiming method and trained from scratch. For each subsequent sequence (from the second to the tenth), training commenced by loading the model weights that had achieved the highest AP50 score during the immediately preceding 12-epoch sequence. This progressive parameter updating strategy effectively leverages the optimal weights obtained in prior stages, mitigating potential instabilities associated with repeated random initializations, and serves to enhance the overall Average Precision achieved during the baseline training phase.
From the 120 epochs of this baseline H polarization training, the epoch yielding the absolute highest AP50 accuracy was identified (epoch 53 for the Faster R-CNN algorithm; epoch 77 for RetinaNet). This specific set of optimal baseline weights was then used as the initialization point for training models on all simulated GCP mode datasets. To ensure result stability and robustness, each GCP mode was trained for a total of 36 epochs structured as three consecutive 12-epoch sequences. The first 12-epoch sequence was initialized using the best H polarization model weights (from epoch 53 or 77, respectively). The second and third 12-epoch sequences were initialized by loading the weights corresponding to the highest AP50 score achieved within the immediately preceding 12-epoch sequence for that specific GCP mode. The final reported performance for each GCP mode corresponds to the highest AP50 score attained at any epoch across its full 36-epoch training process.
The above experimental details are modifications to the default settings, and any unmentioned parts followed the default configuration of MMDetection version 3.3.0. The experiments were conducted on a PC with the following computational resources: GPU model, NVIDIA RTX 2080 Ti; CPU model, i7-10700; RAM, 32 GB. PyTorch version 1.11.0 and MMDetection version 3.3.0 (based on Python 3.8) were used as the deep learning frameworks, and CUDA 11.3 was used to accelerate the training process.
3.4. Evaluation Indices
Consistent with the original dataset, the generated GCP mode data followed the COCO format. The training and testing datasets were strictly separated to avoid overfitting due to data leakage. The model was trained using only the training set data and evaluated on the testing set. The final evaluation indices included AP50 accuracy and mAP (mean Average Precision) as well as recall.
AP50 (Average Precision at IOU = 0.5) is a widely used metric utilized to evaluate the detection performance of object detection models. It measures the average precision when the Intersection over Union (IOU) threshold is set to 0.5. AP50 is a comprehensive metric that reflects a model’s ability to correctly detect and localize objects within an image, balancing precision and recall. A higher AP50 value indicates better overall detection performance, where the model not only detects more objects but also maintains a low false-positive rate. This metric is crucial for assessing the model’s ability to accurately detect and localize ship targets. For detection tasks, AP50 is considered the primary evaluation metric in this study.
mAP (mean Average Precision) is a commonly used metric in object detection tasks, providing a comprehensive evaluation of model performance across multiple IOU thresholds. mAP is calculated by averaging the Average Precision (AP) over a range of IOU values from 0.5 to 0.95 in steps of 0.05. Each AP value represents the precision achieved at a specific recall level for a given IOU threshold, and the overall mAP is an aggregate of these values. This allows mAP to evaluate a model’s performance not only for a fixed IOU (such as 0.5) but also across different levels of localization accuracy. A higher mAP value indicates that the model has a strong overall detection ability and robustness across different object sizes and varying levels of overlap between predicted and ground truth bounding boxes.
Recall is a fundamental evaluation metric in object detection used to measure a model’s ability to identify all relevant instances within a dataset. Specifically in ship detection, it quantifies the fraction of actual ship targets present in the images that are successfully detected by the model. Recall is calculated as the ratio of true positives (TP)—correctly identified ships—to the sum of true positives and false negatives (FN)—ships that the model failed to detect (recall = TP/(TP + FN)). A high recall score signifies that the model effectively minimizes missed detections, finding a large proportion of the existing ships. This metric is particularly critical in applications like maritime surveillance or search and rescue, where failing to detect a present ship (a false negative) can have serious consequences. While often evaluated alongside precision, recall specifically highlights the comprehensiveness and completeness of the detection results.
4. Experimental Results
This chapter primarily presents the experimental results obtained for both the Target-to-Clutter Ratio (TCR) analysis and the final ship detection performance evaluations followed by the corresponding analysis and discussion.
4.1. TCR and Detection Results for Classic Dual-Polarization and Compact Polarimetry Modes
4.1.1. TCR Results
This subsection presents the results of the Target-to-Clutter Ratio (TCR) analysis. The TCR serves as a fundamental metric quantifying the strength of a target signal relative to that of the surrounding background clutter. It plays a foundational role in radar target detection, particularly within the domain of ship detection. The TCR value directly reflects the ‘contrast’ or ‘saliency’ of a ship target against the sea surface background environment as observed under a specific polarization mode. Before any effective detection algorithm can be successfully applied, the target must exhibit sufficient distinguishability from the clutter in at least one observable feature dimension—the most basic being the intensity measured in the polarization channel(s). Otherwise, detection is inherently impossible.
Achieving a sufficiently high TCR for a given polarization mode is a necessary, though not sufficient, condition for more sophisticated downstream polarimetric information-processing techniques to effectively enhance detection performance. If the target’s intensity is submerged within the clutter level across all available channels (i.e., it has a low TCR), relying solely on polarimetric information is unlikely to ‘create’ a detectable target signature ex nihilo.
The TCR is formally defined as the ratio between the target signal intensity (or power) and the intensity (or power) of the surrounding background clutter signal. It quantifies the relative level of the target’s echo energy compared to the energy of its local background environment. A higher TCR value generally implies that the target is more easily distinguishable from the background clutter, thus benefiting subsequent detection and recognition algorithms. Conversely, a lower TCR value indicates a weaker target signal or stronger background clutter, increasing the difficulty of detection. TCR is typically expressed in decibels (dB) and is calculated as follows:
where
is the average power of the target region and
is the average power of the clutter region.
For different polarization modes, the power used for TCR calculation is typically determined as follows: For the fully polarimetric (FP) mode, the TCR is often based on the total power (SPAN), which corresponds to in the 3 × 3 covariance matrix representation derived from the Pauli or lexicographic scattering vector. For dual-polarization (DP) modes, the calculation depends on the specific configuration (e.g., HH/HV or VV/VH), typically using the sum of intensities from the corresponding 2 × 2 covariance matrix. Similarly, for GCP modes, the TCR is calculated using the total power from the 2 × 2 GCP covariance matrix. In the implementation used in this study, the target region consisted of the pixels within the annotated ship boundaries provided by the dataset. The corresponding clutter region was defined as the area containing adjacent, presumably homogeneous sea surface pixels, selected by extending a five-pixel-wide border outwards from the annotated target region.
Two distinct average TCR values were calculated to provide complementary insights:
1. Intensity-Averaged TCR (
): This metric was computed by first averaging the intensities of all target pixels across all targets
, then averaging the intensities of all corresponding clutter pixels
, and finally calculating the ratio of these two grand averages:
This represents a pixel-level average, reflecting the overall energy level of the target pixels relative to the background pixels within the dataset samples. It provides additional insight regarding the overall impact of the polarization mode on total target signal strength but is susceptible to being heavily influenced by large, high-intensity targets.
2. Self-Averaged TCR (
): This metric involves calculating an individual TCR value for each distinct target
first. The final
is then obtained by averaging these individual per-target TCR values across all
targets:
This represents a target-level average and reflects the average local contrast for individual targets. It is the more standard and commonly used approach, measuring the typical ease of distinguishing a single target from its immediate surroundings, irrespective of target size (as each target contributes equally to the final average). It is suitable for comparing the typical visibility of individual targets across different polarization modes.
It is acknowledged that other imaging parameters, such as spatial resolution and incidence angle, can also influence TCR values. However, as these are fixed within the scope of the dataset used, their effects are not explicitly investigated here. Nevertheless, it is important to recognize their potential impact. The primary focus of this study remains the influence of the chosen polarization mode as a critical factor affecting the TCR.
Observing the TCR results presented in
Table 2, it can be seen that the
values are generally higher than the
values for this dataset. This is attributed to the prevalence of numerous small, faint targets within the dataset; the
metric, which assigns equal weight to both faint/small targets and bright/large targets, is consequently reduced by the lower TCR of the former group.
For the metric, the H mode achieved the highest value at 11.95 dB, surpassing the R and L modes by 0.53 dB and 1.53 dB, respectively. The mode exhibited results similar to the L mode. The V mode performed the worst, with a 2.57 dB lower than H. Similarly, for the metric, the H mode also ranked highest at 10.98 dB, outperforming the R and L modes by 2.21 dB and 2.30 dB, respectively. Again, the mode’s performance was comparable to the L mode. The V mode registered the lowest , falling 3.41 dB below H.
Overall, both TCR metrics show a consistent trend: H polarization provided a clear advantage, followed by the R and L modes (with R slightly higher than L), and, finally, the V mode exhibited a significantly poorer performance. This finding aligns with other research indicating that V polarization, while potentially beneficial for observing sea surface phenomena due to its strong interaction with sea clutter, consequently yields the lowest Target-to-Clutter Ratio for ship detection.
4.1.2. Detection Results
Comparing the detection accuracy results for the five classic STDR polarization modes shown in
Table 2, a strong consistency was observed between the two detection methods, Faster R-CNN and RetinaNet. As illustrated in
Figure 4, the Pearson correlation coefficient between the AP50 scores obtained by the two methods across various modes was 0.946. This indicates that the relative performance ranking of the polarization modes remained stable regardless of the detector choice, with minimal significant discrepancies between the methods. Broadly, the performance ranking across nearly all metrics aligned with the TCR results; the H mode was generally optimal, followed by the R and L modes, with the V mode performing worst. This consistency between the detection performance and the TCR is further highlighted in
Figure 5.
Specifically considering the AP50 accuracy metric for the Faster R-CNN algorithm, among the standard DP and classic CP modes, the highest accuracy was achieved by the H-transmit DP mode at 81.8%. This was 0.9% and 2.4% higher than the second-ranked R-transmit and L-transmit CP modes, respectively. The V-transmit DP mode yielded the lowest accuracy at 77.6%, 4.2% below the H mode. Similarly, the RetinaNet algorithm yielded results highly consistent with those of Faster R-CNN. While the absolute AP50 values showed minor numerical variations between the two methods for each mode, the relative performance ranking among the modes remained identical: the H mode again achieved the highest AP50 accuracy at 82.4%, outperforming R and L modes by 0.4% to 3.5%. The V mode performed worst at 77.0%, 5.4% lower than the H mode.
Considering the results from both detection methods, the H polarization mode demonstrated the best performance among these classic configurations. This is primarily attributed to it having the highest TCR values, which facilitate better separation between ship targets and the background during detection. Conversely, the V polarization mode exhibited the poorest TCR. Visually, ship edge features appeared less distinct in V polarization compared to H, while sea clutter was more prominent (as suggested by the visual examples in
Figure 3), leading to lower detection accuracy and the overall worst detection performance.
The mode performed similarly to the L mode, generally positioned between the R and L modes, and did not exhibit standout performance. This result further supports the earlier analysis: although the mode’s transmitted wave is synthesized from H and V components, this does not inherently imply richer polarimetric information content relevant for detection. In fact, for ship superstructures often dominated by horizontal and vertical structures, the scattering response might be stronger for pure H or V transmissions. The potentially weaker response to the incident wave could explain its performance being inferior to the H mode. However, it is conceivable that, if the dataset predominantly featured ships with major structural orientations near 45°, the mode’s echo strength might have exceeded that of H or V, potentially leading to improved detection outcomes in such specific scenarios.
The R and L polarization modes yielded intermediate performance between the H and V modes. The R mode consistently showed superior TCR metrics compared to the L mode. Correspondingly, across both detectors, the R mode outperformed the L mode on nearly all six calculated detection metrics (as shown in
Table 2). This reinforces the observation that the TCR influences detection performance to a significant degree. Whether the superiority of R over L observed here is specific to this dataset or holds more generally requires further investigation. Conversely, the finding that the H mode outperforms the V mode in both TCR and detection accuracy is likely a more universally applicable conclusion, aligning with results from other studies on sea surface phenomena and ship detection.
Based on the detection results in this subsection, it appears that, while a higher TCR generally provides an advantage for detection, often correlating with higher accuracy, the relationship is not strictly linear, especially when considering the full range of polarimetric information. Among the classic DP and CP modes, there is a strong correspondence: high-TCR modes tend to yield high detection accuracy. However, the TCR is not the sole determinant; richer polarimetric information also contributes significantly. A clear example is the fully polarimetric (FP) mode. Although its TCR (as calculated by SPAN) was not the highest, often being similar to the R/L modes, its detection performance consistently surpassed all other modes by a significant margin (achieving top-tier accuracy and recall metrics, as will be detailed in
Section 4.2). This demonstrates the substantial benefit of complete polarimetric information for target detection.
The not strictly linear relationship between the TCR and detection accuracy can be partly attributed to the information utilized by the detection algorithms. While the TCR calculation relies on the total power (
for STDR modes), the deep learning detectors receive additional input, specifically, the magnitude of the cross-term
(using
as the three input channels for the STDR modes, compared to six channels for FP). Polarimetric information beyond simple intensity is known to be valuable. Some studies emphasize that amplitude differences provide clear morphological features aiding pixel-level detection [
20]. Others suggest that using both amplitude and phase information from the covariance matrix as input yields better classification accuracy than using real and imaginary parts [
66]. Furthermore, specific polarimetric features such as
have been identified as potentially key inputs [
29,
31]. This feature tends to be very low for natural targets exhibiting reflection symmetry (like sea clutter) but significantly higher for asymmetric man-made structures like ships. This can lead to a higher Signal-to-Clutter Ratio (SCR) compared to single intensity channels and potentially suppress speckle noise, thus enhancing class separability for improved classification and detection. It is hypothesized that the
element utilized as input for the GCP modes in our study captures analogous polarimetric correlation information between the two receive channels, providing benefits similar to features like
.
In summary, concerning the comparison between classic dual-polarization and compact polarimetry modes, the detection results obtained using both Faster R-CNN and RetinaNet align closely with the TCR analysis. The H polarization mode consistently exhibited the highest TCR and achieved the best detection accuracy and recall. The R mode slightly outperformed the L mode in both TCR and detection metrics. The V polarization mode consistently ranked last, displaying significantly the poorest TCR, detection accuracy, and recall rates among the classic modes evaluated.
4.2. TCR and Detection Results for GCP Modes
To further investigate the detection accuracy of GCP modes, GCP modes with elliptical orientation angles ranging from −90° to 90° (in increments of 20°) and elliptical ellipticity angles from −45° to 45° (in increments of 10°) were simulated. Cases for a 0° orientation angle, ±45° orientation angles, and a 0° ellipticity angle were also included, resulting in a total of 143 GCP modes. The ship detection performance under these different GCP modes was systematically analyzed.
4.2.1. TCR Results for GCP Modes
Figure 6 displays the TCR results across the 143 GCP modes. Key observations included the following:
For , the mode achieving the maximum value (12.18 dB) corresponded to the GCP configuration [−10, −15], forming a distinct peak in the results space. Conversely, the lowest (9.34 dB) was observed for the [90, 5] mode, with the V mode being the second lowest, only 0.04 dB higher. The difference between the best- and worst-performing modes was approximately 2.8 dB. Within this metric, the R mode outperformed the L mode by 1.0 dB.
For , the peak performance (10.98 dB) occurred for the H mode configuration. The V mode exhibited the lowest (7.57 dB), falling 3.42 dB below the optimal H mode. Notably, the [−10, −15] mode, which peaked in terms of , showed no distinct advantage in . The difference between R and L modes was minimal (0.09 dB), unlike the larger gap observed in .
The results, with the H mode being optimal and the V mode performing worst, align with findings reported in other oceanographic remote sensing studies. The observation that the [−10,−15] mode yielded the highest suggests that, for this specific dataset, the overall scattering response from all ship targets, weighted by their size and intensity, might be strongest for this particular elliptical polarization.
The discrepancy between the optimal modes identified by and stems from their different calculation methods: reflects the ratio of average intensities across all target/clutter pixels, thus being significantly influenced by larger, brighter targets, while represents the average of per-target TCR values, giving equal weight to each target regardless of size and reflecting typical local contrast.
4.2.2. Detection Results for GCP Modes
The detection results across the full set of GCP modes are visualized in
Figure 7,
Figure 8 and
Figure 9. These results clearly show that the detection performance varied considerably among different GCP configurations. For both Faster R-CNN and RetinaNet detectors, the difference in AP50 accuracy between the best-performing and worst-performing GCP modes exceeded 6%, representing a substantial performance gap.
The heatmaps reveal localized peaks (‘hotspots’) and discernible patterns across the GCP modes’ space, suggesting that certain GCP modes capture more effective polarimetric information for enhancing ship detection.
While the results from the two detectors are not perfectly identical, significant consistencies exist. For instance, the relative performance ranking among the classic DP and CP modes (H near the peak, R generally > L, V near the trough) is largely preserved. Comparing the AP50 heatmaps for Faster R-CNN (
Figure 7) and RetinaNet (
Figure 8) reveals similar overall trends, although strict point-by-point agreement is not absolute. The mAP metric, being an average over multiple IoU thresholds [0.5:0.95], inherently exhibits more complex behavior, and the results show a somewhat greater divergence between the two methods compared to AP50. Similar trends are also evident for the recall metric (
Figure 9).
To quantify the consistency, the Pearson correlation coefficient between the AP50 accuracies achieved by the two detectors across all 143 polarization modes was calculated. As shown in
Figure 10, a moderate positive correlation was found (r = 0.375, N = 143,
p < 0.001). This statistically significant correlation indicates that the observed positive trend in performance agreement between the two methods is unlikely to be due to random chance, although the correlation strength is moderate.
Differences between the detectors can be attributed to their distinct architectures (two stages vs. one stage) and inherent stochastic factors during the training process, which persisted despite efforts to mitigate them through multiple training runs. However, it can be argued that the observed consistencies, particularly the clustering of high-performing modes and the substantial performance gaps (several percent accuracy) between different modes—often exceeding typical noise levels expected from detector variability alone—reflect systematic differences attributable to the polarimetric modes themselves. The non-random, clustered nature of the performance peaks further supports the idea that these patterns represent genuine polarimetric effects rather than purely stochastic noise.
Figure 11 illustrates the relationship between
and Faster R-CNN AP50 accuracy (correlation r = 0.448). Comparing TCR results with detection performance, several trends emerge. The H mode, possessing a high TCR, consistently ranks among the better-performing modes for detection accuracy, sometimes achieving the best or near-best results among GCP modes. Conversely, the V mode and its neighboring configurations exhibit poor detection performance, mirroring their consistently low TCR values. However, discrepancies exist: five GCP modes are identified that achieve higher detection accuracy than the H mode despite having lower TCR values. Notably, one specific GCP mode, [−10, −5], demonstrates superiority over the H mode in both TCR and AP50 accuracy. Furthermore, the GCP mode with the absolute highest
, namely, [−10, −15], does not translate this TCR advantage into the top detection performance, as detailed in
Table 3.
For ease of analysis and comparison,
Table 3 consolidates the performance metrics for the optimal GCP mode identified for each key indicator alongside the results for the standard DP and classic CP modes.
As is evident from
Table 3, the optimal GCP mode varies depending on the specific evaluation metric and detector used. For the ship detection task using the Faster R-CNN detector, the GCP mode yielding the highest AP50 accuracy (82.3%) was the right-hand elliptical configuration [−10, −5]. This represents the closest performance among GCP modes to the FP AP50 accuracy of 87.0%. Compared to the classic modes, this optimal GCP mode provides accuracy gains of +0.5% (vs. H), +4.7% (vs. V), +1.4% (vs. R), +2.9% (vs. L), and +3.3% (vs.
). The highest mAP accuracy (28.9%) with Faster R-CNN was achieved by the left-hand elliptical GCP mode [−10, 35]. Although mAP values were inherently lower due to averaging over IoU thresholds [0.5:0.95], this mode still offered improvements of +2.4% (vs. H), +3.6% (vs. V), +2.2% (vs. R), +3.0% (vs. L), and +2.7% (vs.
) over the classic modes, approaching the FP mAP of 33.2%. For the RetinaNet detector, the GCP mode [−50, 35] demonstrated the best performance for both the AP50 accuracy and recall metrics, as shown in
Figure 9.
Overall, these results indicate that, among the classic DP and CP modes, V polarization consistently performs worst across all metrics and is not recommended for ship detection with this dataset. H polarization emerges as the best among these classic modes, exhibiting top performance in nearly all indicators, making it the recommended choice if restricted to conventional DP/CP options.
However, when considering the broader set of GCP modes, configurations exist that demonstrably outperform even the best classic modes. Based on a holistic view of the detection results, the GCP mode [−10, −5] is recommended. As detailed in
Table 4, this mode achieved superior performance compared to all classic DP and CP modes across nearly every detection metric evaluated, with gains ranging from 0.1% to 5.5%. This strongly suggests that, for ship detection within this dataset, the [−10, −5] configuration represents the optimal polarimetric mode among those tested, maximizing the acquisition of relevant information for improving detection accuracy. This accuracy enhancement stems not from algorithmic optimization (as the same detectors were used for all modes) but is attributed to the superior information-gathering capability inherent to this specific GCP mode’s interaction with the targets and clutter.
Nevertheless,
Table 3 also highlights that the ‘optimal’ mode can shift if focusing narrowly on a specific metric or detector. This validates the central hypothesis: the truly optimal polarization mode is not fixed but is contingent upon the specific detection task and the performance indicators prioritized. Selecting the mode that performs best for the metric of interest is key to achieving peak performance. These findings demonstrate that no single polarization mode holds absolute superiority for ship detection; rather, careful selection based on task requirements is necessary for optimal results. The above results and analysis demonstrate that there is no universally superior polarization mode in ship detection tasks. Instead, the optimal polarization mode must be chosen based on the specific task to achieve the best detection performance. The polarization mode that provides the best performance should be selected depending on the metric of greatest concern.
4.2.3. Analysis of Visual Results (Example Scenes)
The detected images are shown in
Figure 12 and
Figure 13 to visualize the results, with the confidence threshold set to 0.3. Each column shows the ground truth as the top image followed by the outputs of the full polarization, H, V, R, L,
, and [−10, −5] polarization modes. The selected images represent four typical scenarios: (1) dense small ships; (2) ship targets surrounded by other scattering points; (3) large ships near the coast; (4) mixed large and small ships.
It can be observed that the test results in these actual scenarios show the following:
Dense Small Ships (e.g., No. 00026): In this scenario, both H and R modes produce one redundant bounding box. Other modes, including FP, perform well, consistently detecting multiple small targets accurately, similar to the FP reference. Differences in sea surface rendering were also observed, with R, L, and modes exhibiting more pronounced sea texture compared to others.
Ship Near Other Scatterers (e.g., No. 00296): Here, the FP mode generates numerous false alarms (FAs), misidentifying seven small islands and a landmass segment as ships. The [−10, −5] GCP mode demonstrates the best performance, with only three island FAs. The H mode is second best, misdetecting four islands and two landmass areas. Other classic modes perform poorly, generally misclassifying eight islands and two landmasses.
Large Ship Near Coast (e.g., No. 00471): In this scene, the FP mode exhibits few redundant detections and high localization accuracy but fails to detect one of two closely spaced ships. The [−10, −5] mode yields the fewest redundant boxes among all modes tested. Other modes show some redundancy and lower localization precision, although all successfully distinguish the target from the background without generating false alarms.
Mixed Large and Small Ships (e.g., No. 00641): In this challenging mixed scenario, the FP mode displays excellent balance, detecting targets of varying sizes with high confidence, achieving perfect detection (no false alarms or missed detections, including sidelobes mistaken for targets), reaffirming its status as the top-performing mode overall. Among the STDR modes, [−10, −5] performs best, with only a single instance of a sidelobe being misdetected as a ship. Other modes not only have more redundant boxes on the larger vessels and adjacent ships but also generate false alarms on non-target areas. The V mode performs worst, producing numerous false detections. For reference to the scattering characteristics of sidelobes and clutter under different polarizations, see
Figure 3.
Summary of Visual Results: The results across these four scenarios highlight the performance variability between polarization modes in different contexts, underscoring the significant impact of mode selection on practical detection outcomes. While the FP mode offers a robust and balanced performance across diverse targets and backgrounds, specific GCP modes, notably [−10, −5], can achieve excellent results in certain scenarios, closely approaching FP-level performance. The ability to select an optimal GCP mode, thereby enhancing detection while retaining the double swath width advantage over FP, holds considerable practical importance. These visual results provide compelling experimental evidence guiding polarization mode selection for ship detection and suggest that future PolSAR system designs should incorporate the flexibility offered by GCP modes to optimize performance.
4.3. Discussion
Compared to the single-polarization methods discussed earlier (e.g., intensity-based, Doppler-based, or wake detection methods), the proposed GCP approach offers distinct advantages. While single-channel methods exploit specific phenomenological signatures, they may not be robust across diverse target types and sea conditions. For instance, Doppler methods fail for stationary ships, and wake visibility is highly variable. In contrast, polarimetry, and specifically optimized GCP, leverages the inherent differences in scattering mechanisms between man-made ship structures (often characterized by dihedral and trihedral reflections) and the sea surface (predominantly Bragg or tilted-Bragg scattering).
The results demonstrate that, by optimizing the transmit polarization state within the GCP framework, the Target-to-Clutter Ratio (TCR) can be significantly enhanced. This enhancement is fundamental and directly benefits subsequent detection algorithms, as evidenced by the improved AP50 scores for both Faster R-CNN and RetinaNet. This “information source optimization” provides a more fundamental improvement than relying solely on a single physical observable (like intensity or Doppler shift) or a transient feature (like a wake). While methods like change detection can be powerful with appropriate data, the GCP approach presented in this study enhances the information content of each individual acquisition, making it valuable even for single-pass surveillance scenarios.
It is important to note that polarimetric methods generally require more complex sensor hardware and data processing compared to single-polarization systems. However, the demonstrated performance gains, particularly in challenging detection scenarios, can justify this increased complexity for critical applications like maritime surveillance. Furthermore, this work focused on optimizing existing polarimetric capabilities rather than proposing entirely new hardware, exploring the best use of the available degrees of freedom.
The analysis reveals the necessity of dynamically selecting the optimal polarization mode based on specific task requirements. Methodological innovations presented in this study include the development of a complete workflow for simulating GCP modes from FP data, offering a potential new paradigm for applying deep learning techniques to multi-channel polarimetric data. Data pre-processing methods optimized for GCP data in the context of ship detection were also designed and evaluated, and criteria for selecting GCP modes tailored to this application were proposed.
Based on the findings of this study, the current recommendations for polarization mode selection are as follows: Among the classic DP and CP modes, H polarization is strongly recommended, validating its often-assumed utility with the highest TCR and generally optimal detection performance in this category. Conversely, V polarization is the least recommended, confirming and extending findings from previous research suggesting its unsuitability for ship detection. When considering the full range of tested GCP modes, the [−10, −5] configuration emerges as the most recommended overall. This mode demonstrated superior or near-optimal performance with both Faster R-CNN and RetinaNet detectors and outperformed the classic DP/CP modes across almost all evaluated metrics.
It is crucial to acknowledge that these conclusions are based on experiments conducted solely on the FPSD dataset used in this study. Future work should aim to validate these findings across a broader range of FP datasets. Currently, the availability of complex-valued FP datasets suitable for simulating diverse GCP modes for ship detection remains limited, constraining large-scale comparative polarimetric studies. However, as the volume of PolSAR data archives continues to grow and more comprehensive datasets become available, the judicious selection of polarization modes for ship detection is poised to become an increasingly important research focus.
It is important to acknowledge certain theoretical and practical considerations relevant to polarimetric mode selection. Theoretically, assuming coherent dual-polarization reception, any receive polarization basis can be synthesized from any other complete basis via linear transformation without fundamental loss of information. (In practice, factors such as system noise, detector sensitivity, signal saturation, and image formation processing can impact this idealized assumption regarding the receive basis transformation). Within the GCP framework investigated here, for a given, fixed imaging geometry, the primary degree of freedom influencing performance lies in the selection of the elliptical transmit polarization. However, it is well established that the choice of imaging geometry itself—particularly the incidence angle—generally affects which transmit polarization state is optimal. This is primarily because variations in incidence angle alter the Target-to-Clutter Ratio (TCR) differently for different polarization states. While this effect may be more pronounced for airborne or shipborne radar systems which often operate over a wider range of geometries compared to spaceborne SAR, it remains a pertinent factor. Consequently, the findings and the specific optimal GCP modes identified in this study are valid under the specific imaging geometry conditions inherent to the dataset utilized. Investigating the optimal GCP mode selection across diverse imaging geometries remains an important avenue for future research.
The optimal GCP mode selected in this study is suitable for the FPSD dataset; however, it may not be the optimal mode for different datasets. Therefore, future research could explore how to predict the optimal GCP mode in advance for a given detection task and ship type to improve practicality. For example, rotation indices, similar to those based on scattering mechanisms and wave polarization anisotropy [
21] and optimal polarimetric rotation domain features [
22], can be introduced to identify the best mode. Moreover, polarization roll-invariant features, which are considered to perform better than conventional polarization features, could also be considered to achieve superior performance [
67]. More importantly, polarization roll-invariant features are insensitive to ship direction, which can effectively reduce the impact of ship orientation changes on optimal polarization mode selection. The TCR metric proved valuable in this study, although its correlation with deep learning detection performance was not perfectly linear. For targets with low TCR values, the polarimetric information captured by certain modes likely plays a crucial role in successful detection, beyond what TCR alone reflects. Further research is warranted to better understand the complex relationship between TCR characteristics and optimal mode selection criteria.
The potential influence of stochastic effects (‘noise’) arising from the deep learning detection algorithms must also be considered. While strategies (e.g., multiple training runs, iterative weight loading) were implemented to minimize such effects, their potential presence is acknowledged. However, it is argued that the observed performance differences are unlikely solely attributable to random algorithmic variations. Consider the H mode as a case study: It underwent significantly more training (156 total epochs = 120 baseline + 36 specific) and benefits intrinsically from a high TCR. If random fluctuations were the dominant factor determining performance peaks, one might expect this combination of an extended training duration and a favorable TCR to maximize the probability of the H mode achieving top scores through chance alone. Yet the results demonstrate that several GCP modes, despite being trained for only 36 epochs, still outperformed the H mode. Conversely, the V mode consistently underperformed significantly. These substantial and often consistent performance differences between modes, along with the clustered (non-random) nature of performance peaks observed in the GCP parameter space, strongly suggest that systematic variations inherent to the polarimetric modes themselves—reflecting the utility of the specific polarimetric information they capture—are the primary driver of the observed results, discernible above the level of algorithmic noise.
While the two chosen detectors (Faster R-CNN and RetinaNet) showed moderate overall consistency, discrepancies were noted for certain specific GCP modes. This implies that detection results can be influenced by the choice of detector architecture, which is suboptimal from the perspective of identifying a universally ‘best’ polarization mode. Ideally, an optimal mode would demonstrate robust high performance across various detection algorithms. Further research is needed to identify such stable, high-performing modes. Nonetheless, the shared consistencies and the clear advantages demonstrated by certain GCP configurations should not be overlooked, even acknowledging these individual variations.
Future investigations will aim to extend this comparative analysis to include other prominent detector architectures, such as those from the YOLO series, to further ascertain the universality of the benefits observed from GCP mode optimization across an even wider range of deep learning models.
Future research could further explore the selection of optimal GCP modes in ship classification tasks. Compared to ship detection, ship classification is more complex and requires more polarization information, making the choice of input data crucial [
68,
69]. In situations where the information is inherently incomplete, the initial selection of the optimal GCP mode to capture as much information as possible becomes particularly important.
Moreover, for tasks that require high accuracy, or tasks where certain ships respond strongly to specific polarization modes, selecting the optimal GCP mode can achieve the greatest performance improvement. This optimization approach, starting from the information acquisition source, can be combined with improvements in detection algorithms to achieve higher detection accuracy. Future research is anticipated on optimal polarization modes in ship classification tasks, as compared to simple ship detection. Such research is expected to fully harness the potential of optimal polarization modes.
5. Conclusions
This research posits that the selection of an optimal polarimetric mode for SAR applications is fundamentally dependent on the intricate interaction between the transmitted polarization state and the scattering characteristics of both the target and its background environment. Consequently, the optimal mode is likely task-dependent, necessitating mode selection tailored to the specific application scenario to achieve peak performance. This perspective challenges traditional assumptions, such as assumptions of the universal superiority of circular compact polarimetry, and its validity has been experimentally demonstrated herein for ship detection.
The effectiveness of Generalized Compact Polarimetry (GCP) modes for ship detection using Synthetic Aperture Radar was evaluated. The experimental results demonstrate that optimizing the GCP transmit polarization can yield significant performance enhancements compared to traditional dual-polarization (DP, transmitting horizontally or vertically) and classic compact polarimetry (CP, transmitting R, L, or ) modes. Specifically, using the FPSD dataset, the recommended [−10, −5] GCP mode achieved Target-to-Clutter Ratio (TCR) gains ranging from 0.2 dB to 2.7 dB over the five aforementioned conventional baseline modes. Employing the Faster R-CNN detector, this GCP mode improved AP50 detection accuracy by 0.5% to 4.7% (specifically, +0.5% vs. H, +4.7% vs. V, +1.4% vs. R, +2.9% vs. L, and +3.3% vs. ). With the RetinaNet detector, the corresponding accuracy improvements ranged from 0.1% to 5.5% (+0.1% vs. H, +5.5% vs. V, +0.5% vs. R, +3.6% vs. L, and +2.3% vs. ). This performance uplift originated from the better match between the chosen GCP mode’s interaction with the target/sea scene rather than from improvements in the detection algorithm itself. Furthermore, a comprehensive evaluation based on mAP and recall metrics further revealed that the choice of the optimal GCP mode is intertwined with specific task requirements (e.g., prioritizing precision vs. recall) and target characteristics, validating the necessity of optimizing polarization mode design for specific application contexts.
This study represents the first systematic evaluation comparing the impact of a wide range of polarization modes, including the full GCP space, on ship detection accuracy, thereby revealing the latent potential of optimized GCP modes for this application. Beyond enhancing detection performance, this research provides theoretical insights and experimental evidence to inform future PolSAR system design and mode selection strategies, introducing the concept of “optimization at the information source”. Future research directions include validating the robustness of GCP modes for target classification and in more complex sea state conditions, exploring methods to predict the optimal GCP mode based on target scattering characteristics to enhance practical utility, and extending the analysis to multi-band, multi-resolution data and more complex target scenarios. Concurrently, the practical aspects of hardware design and calibration for GCP systems warrant deeper investigation. It is hoped that this work stimulates further academic discussion and engineering applications in advanced polarimetric SAR.


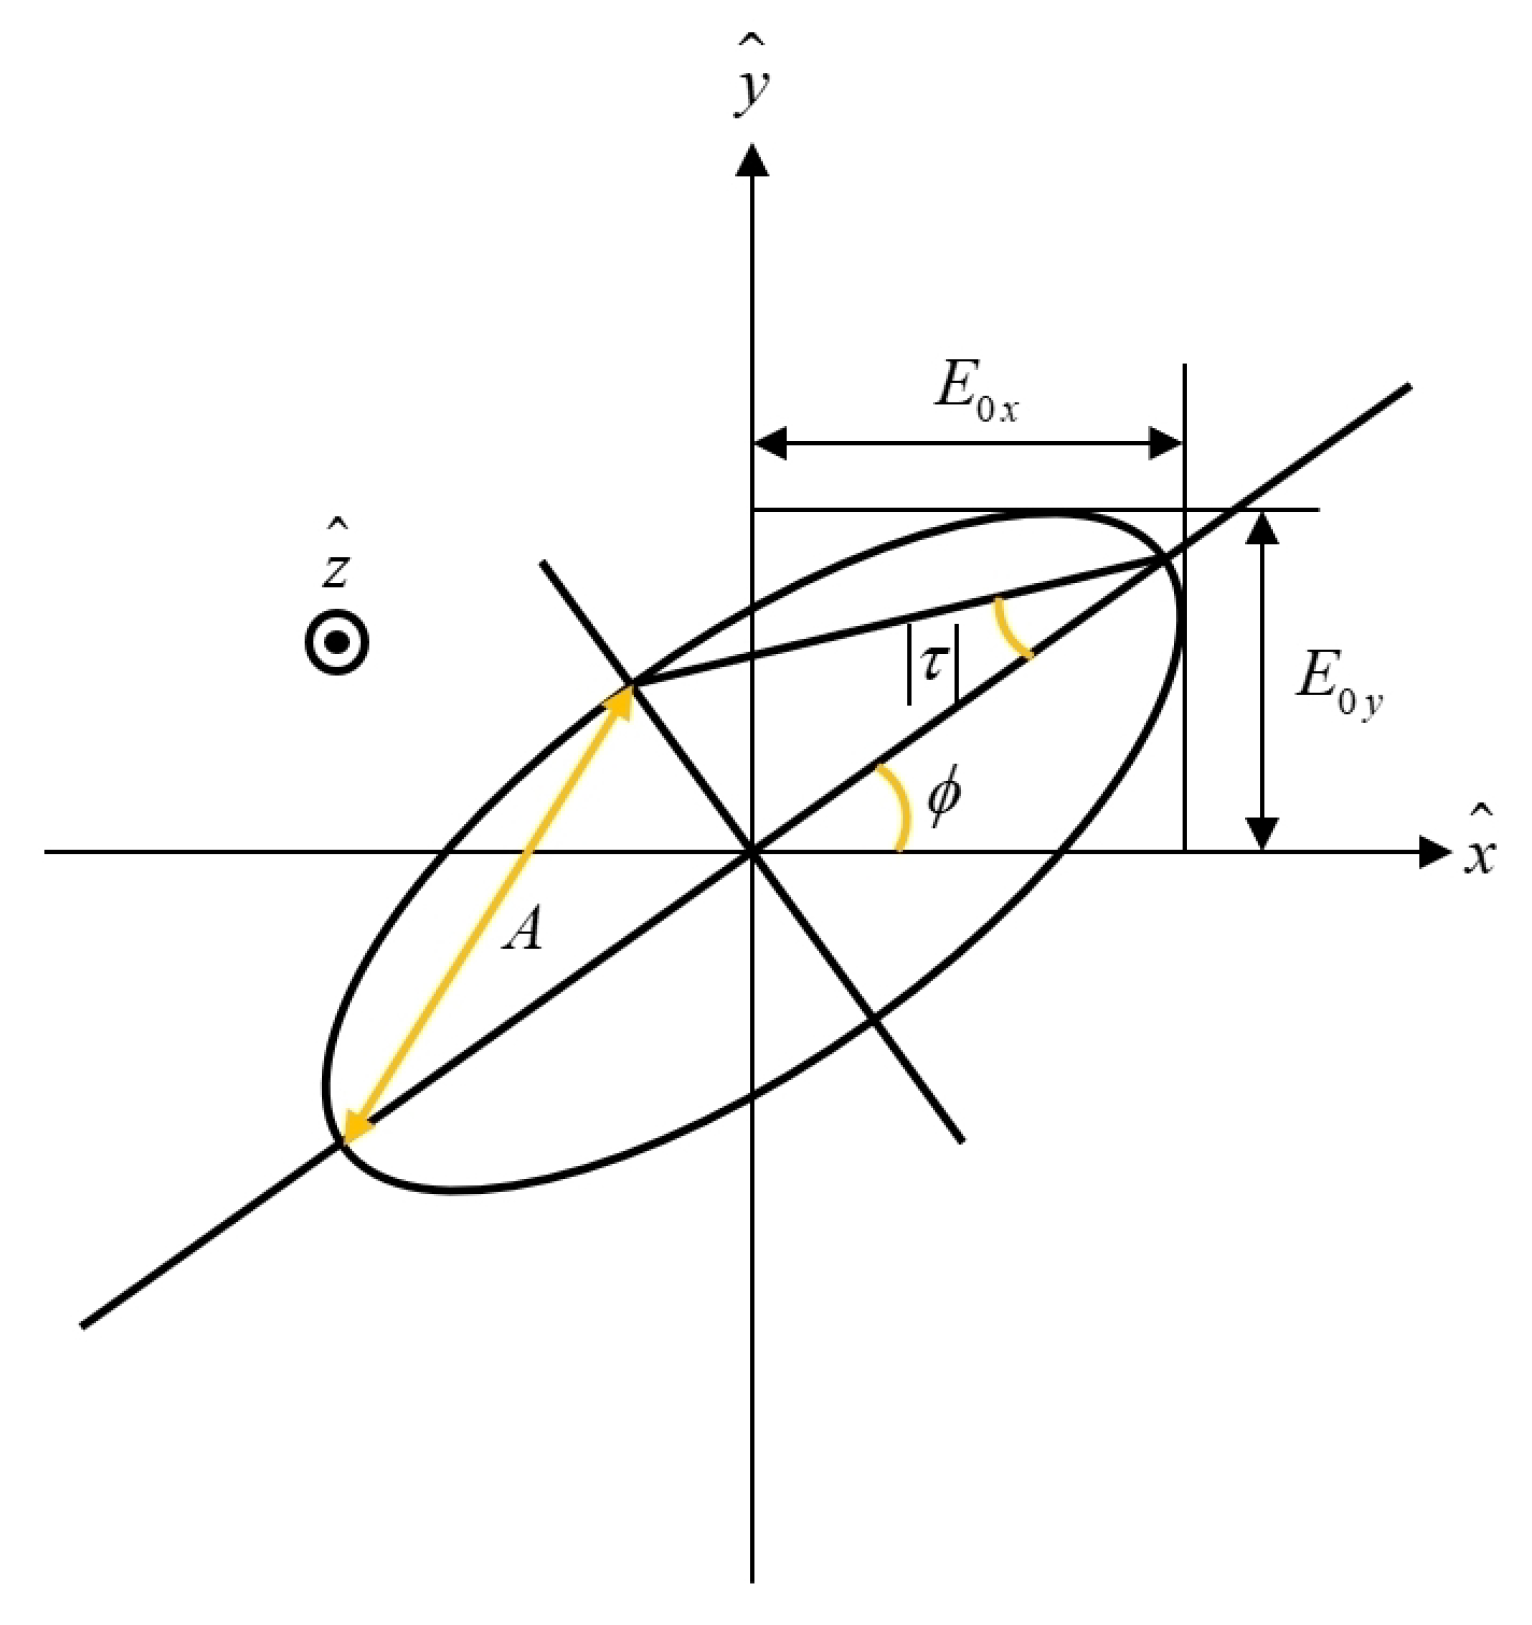
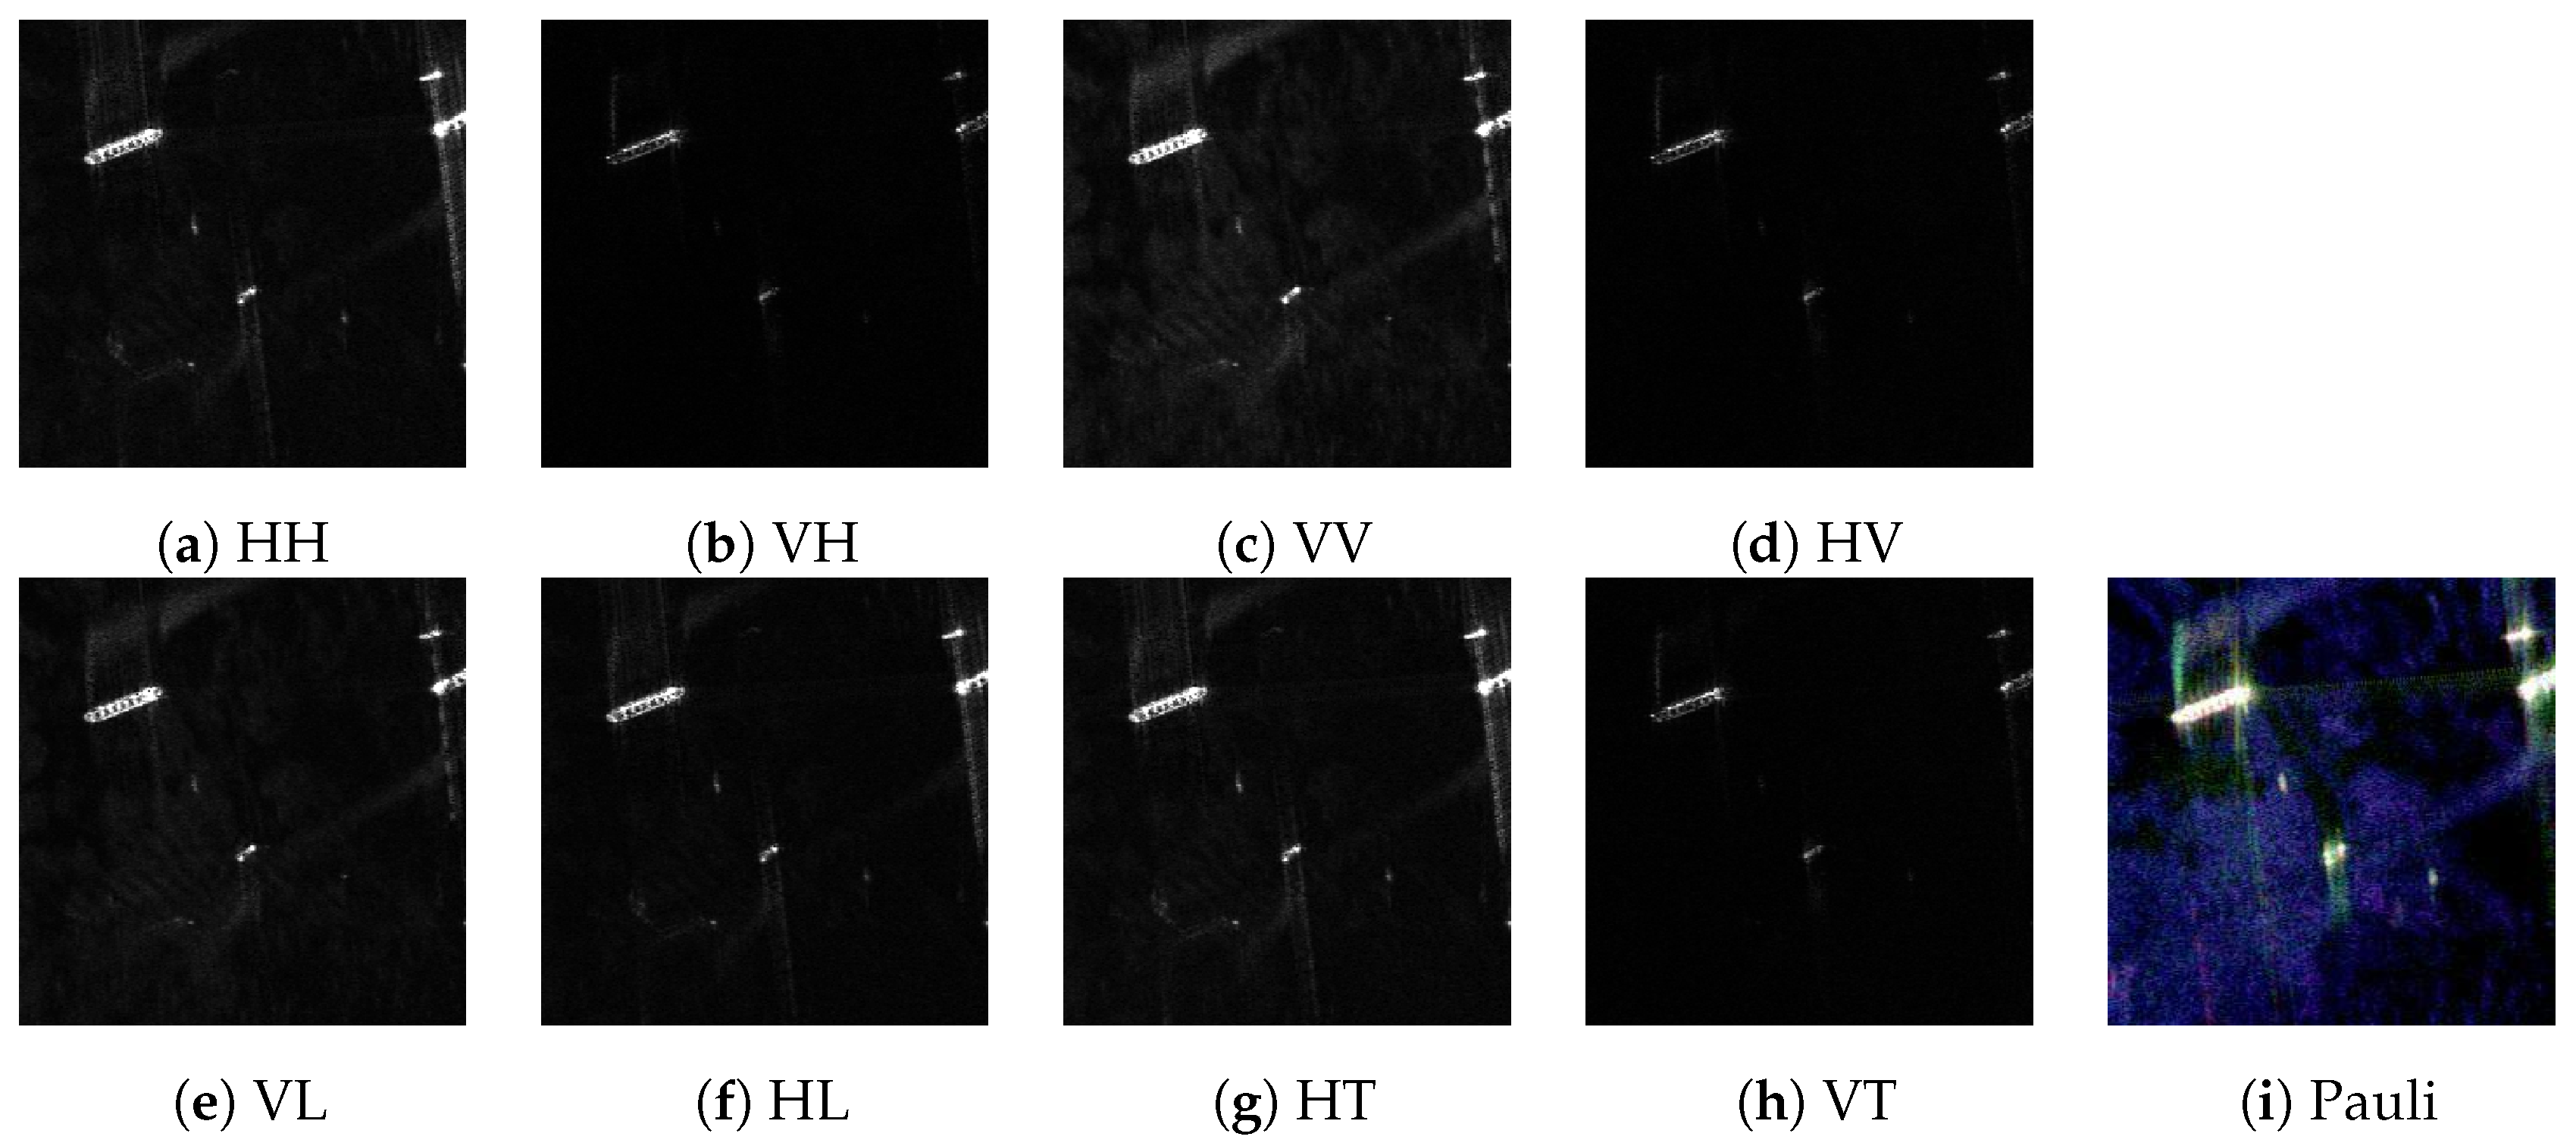
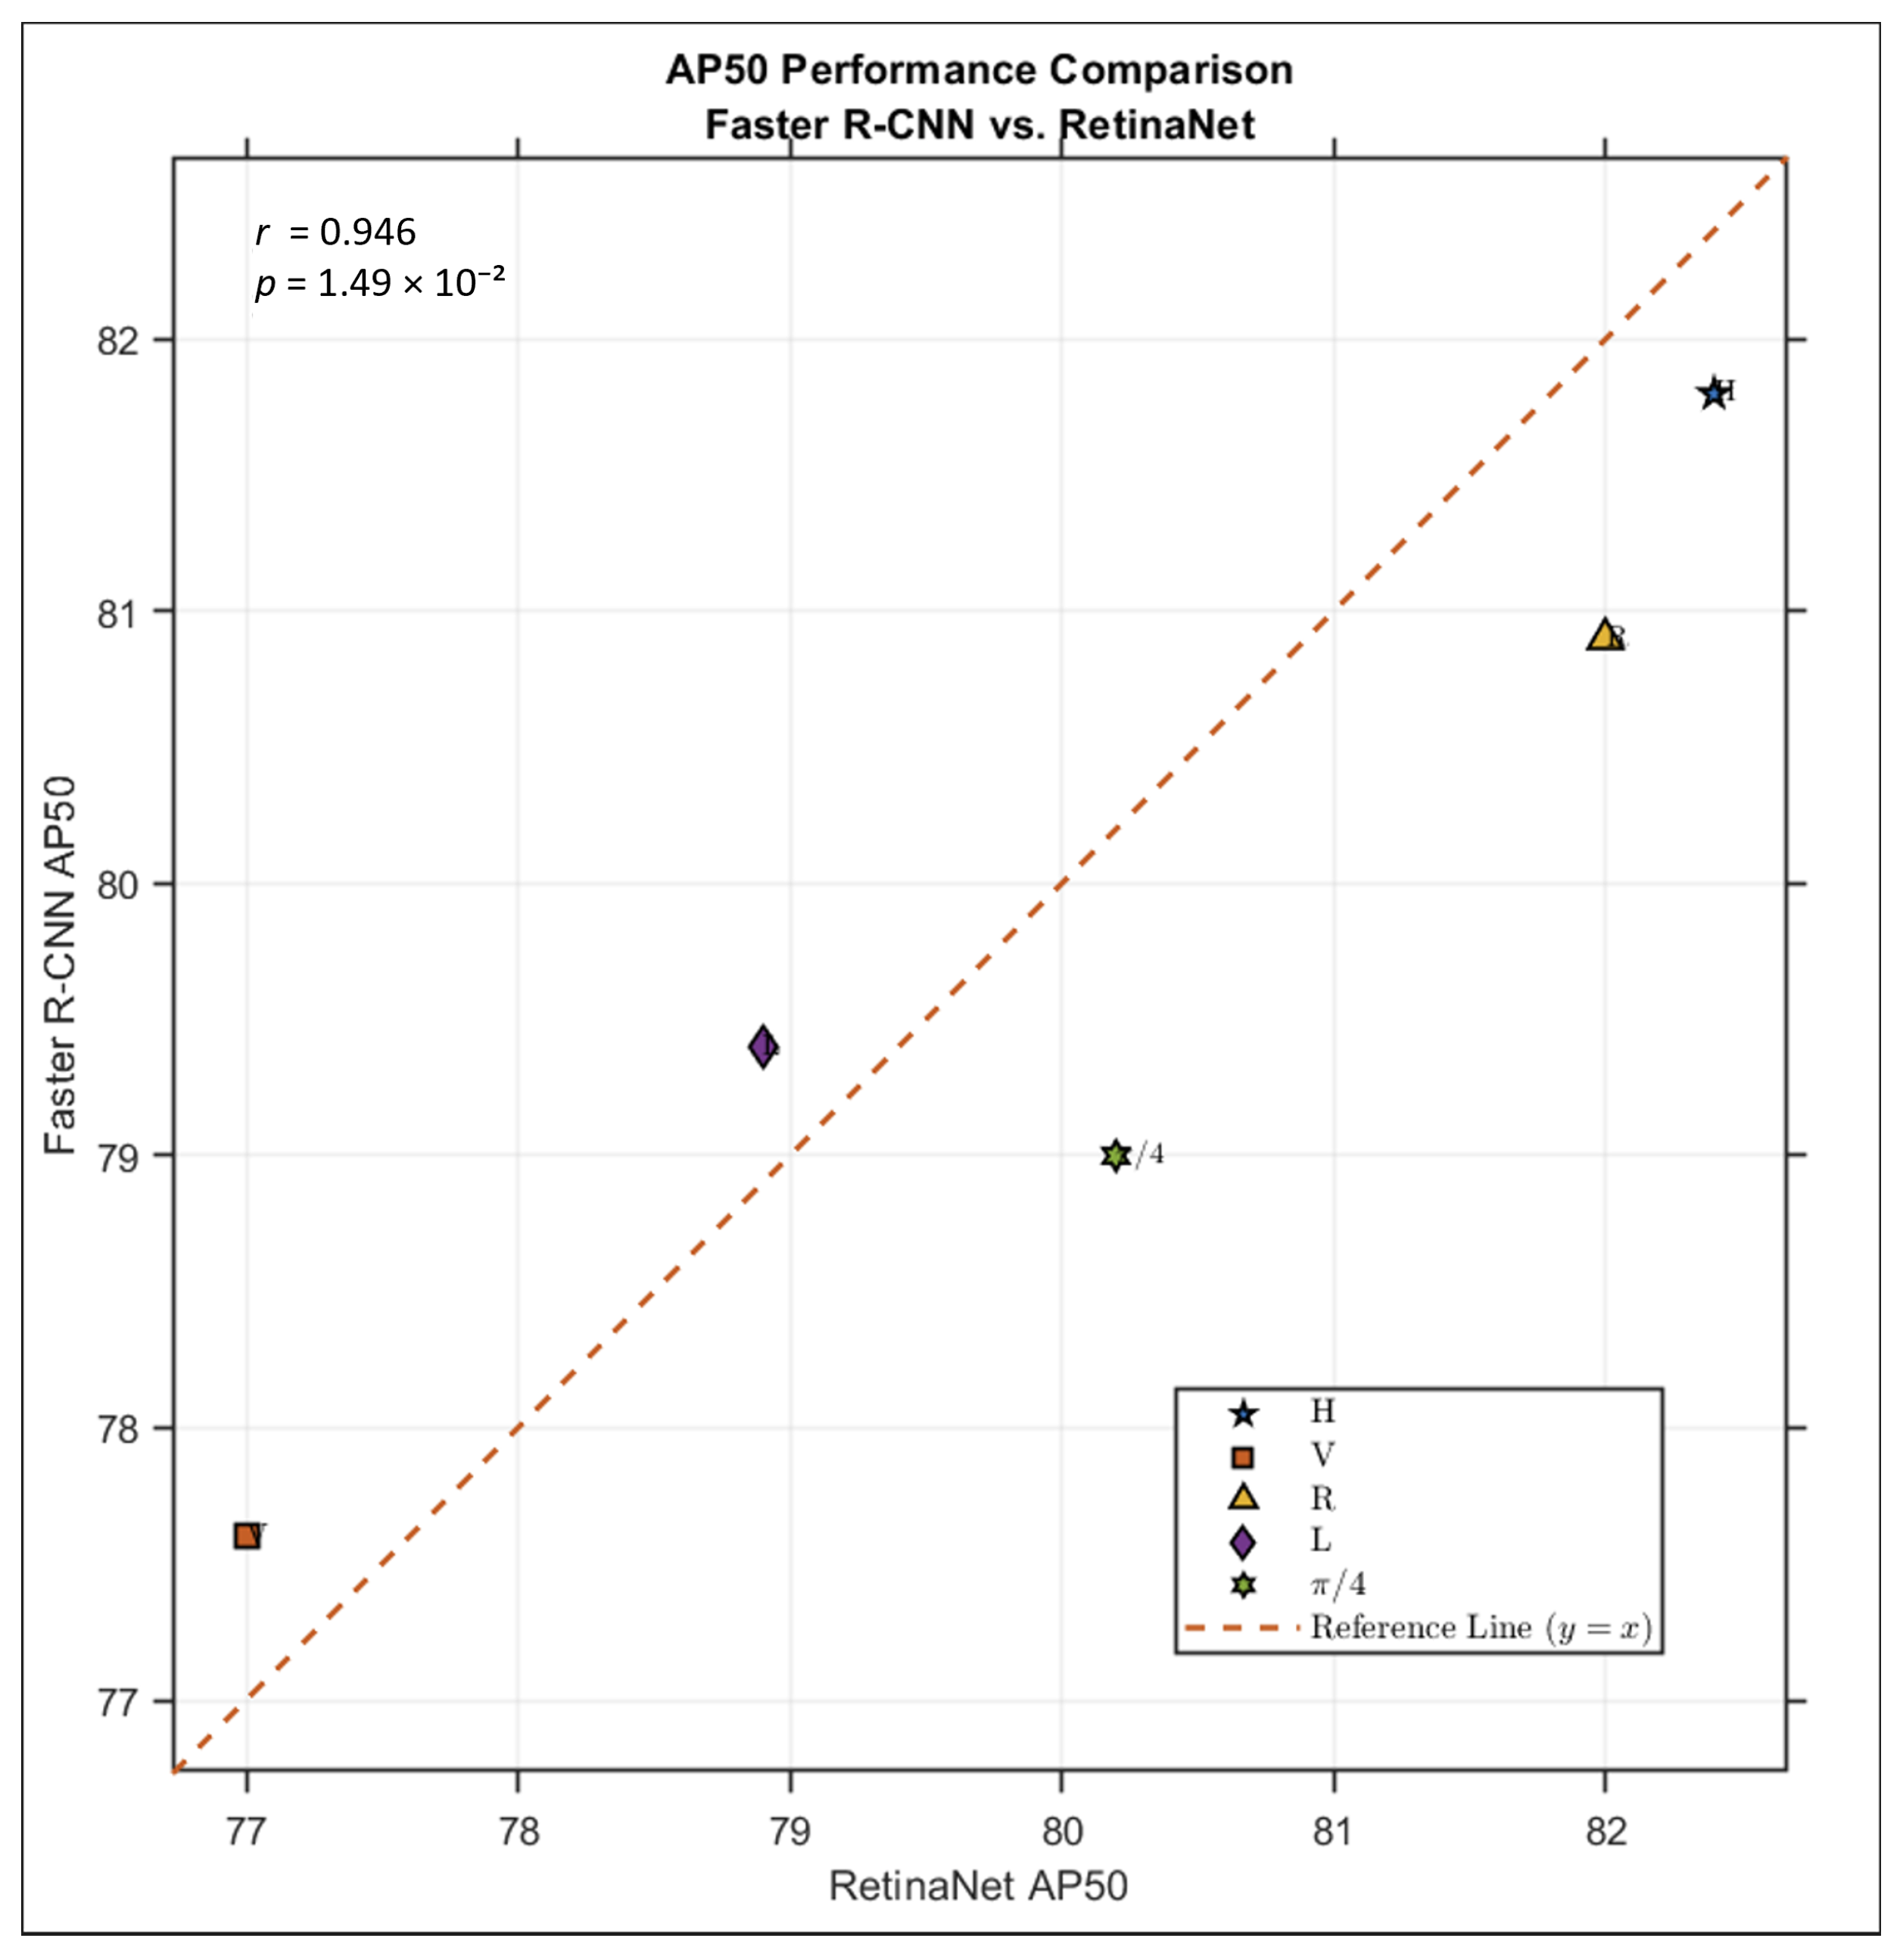
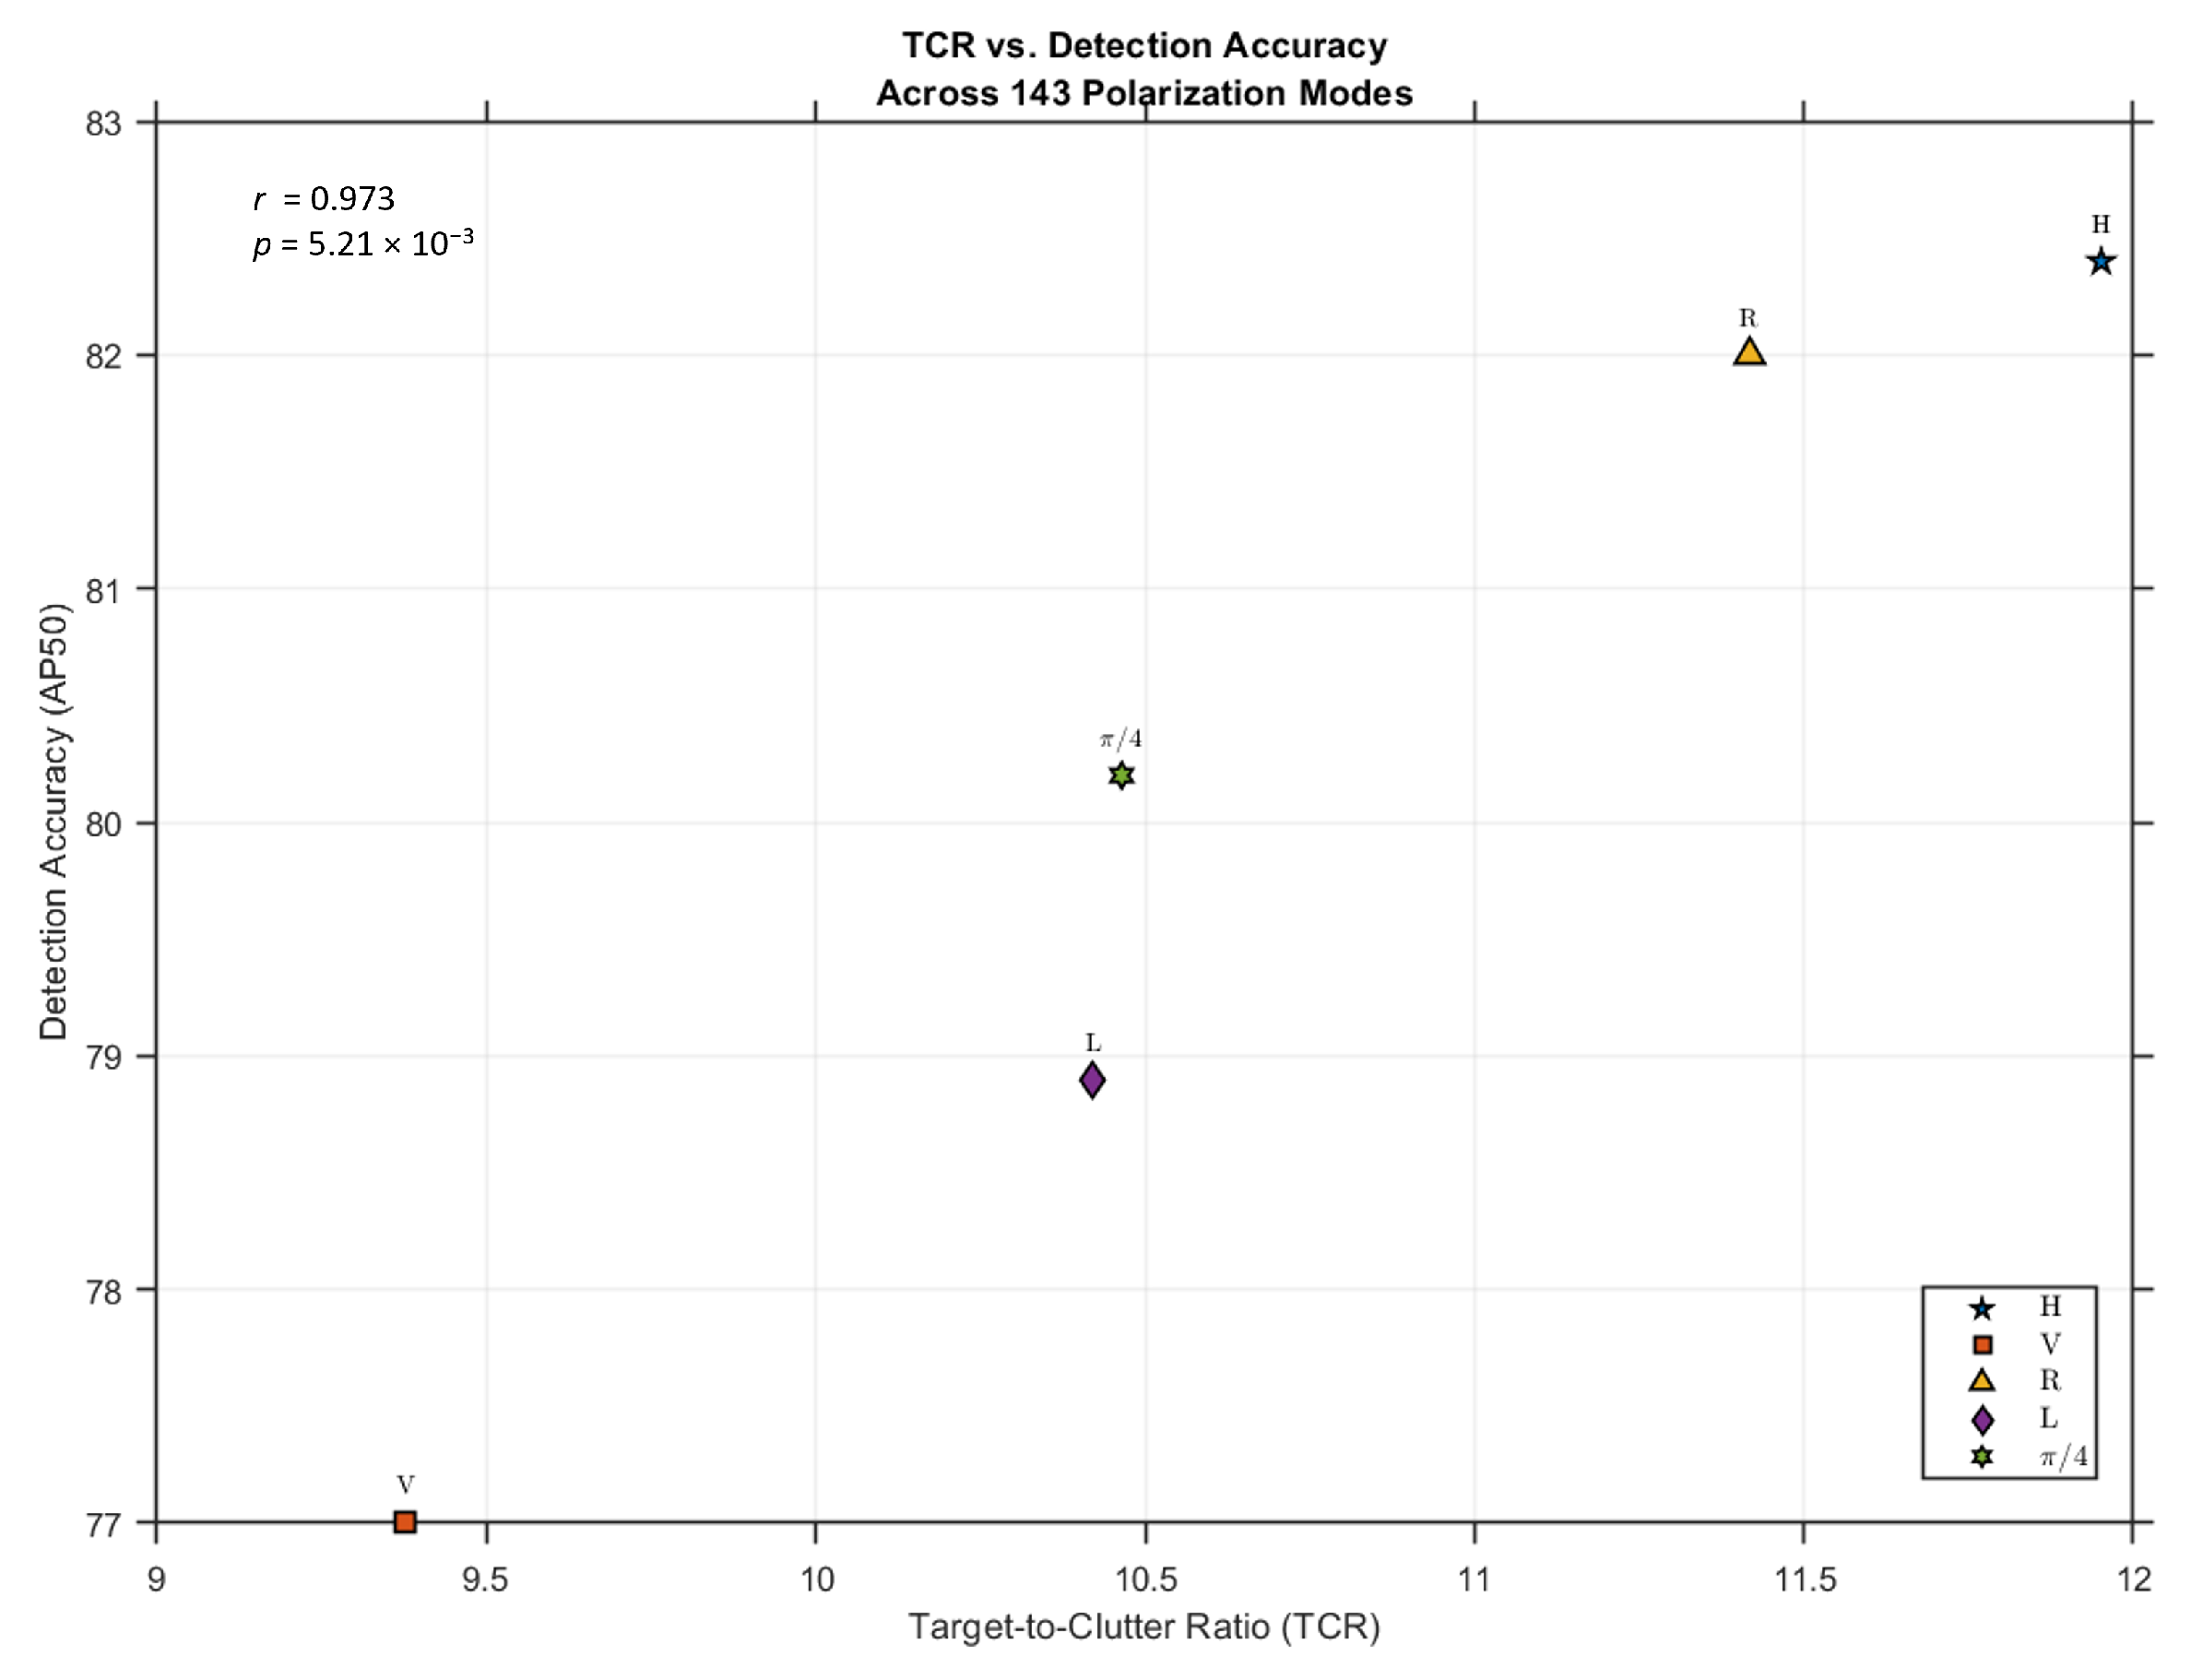
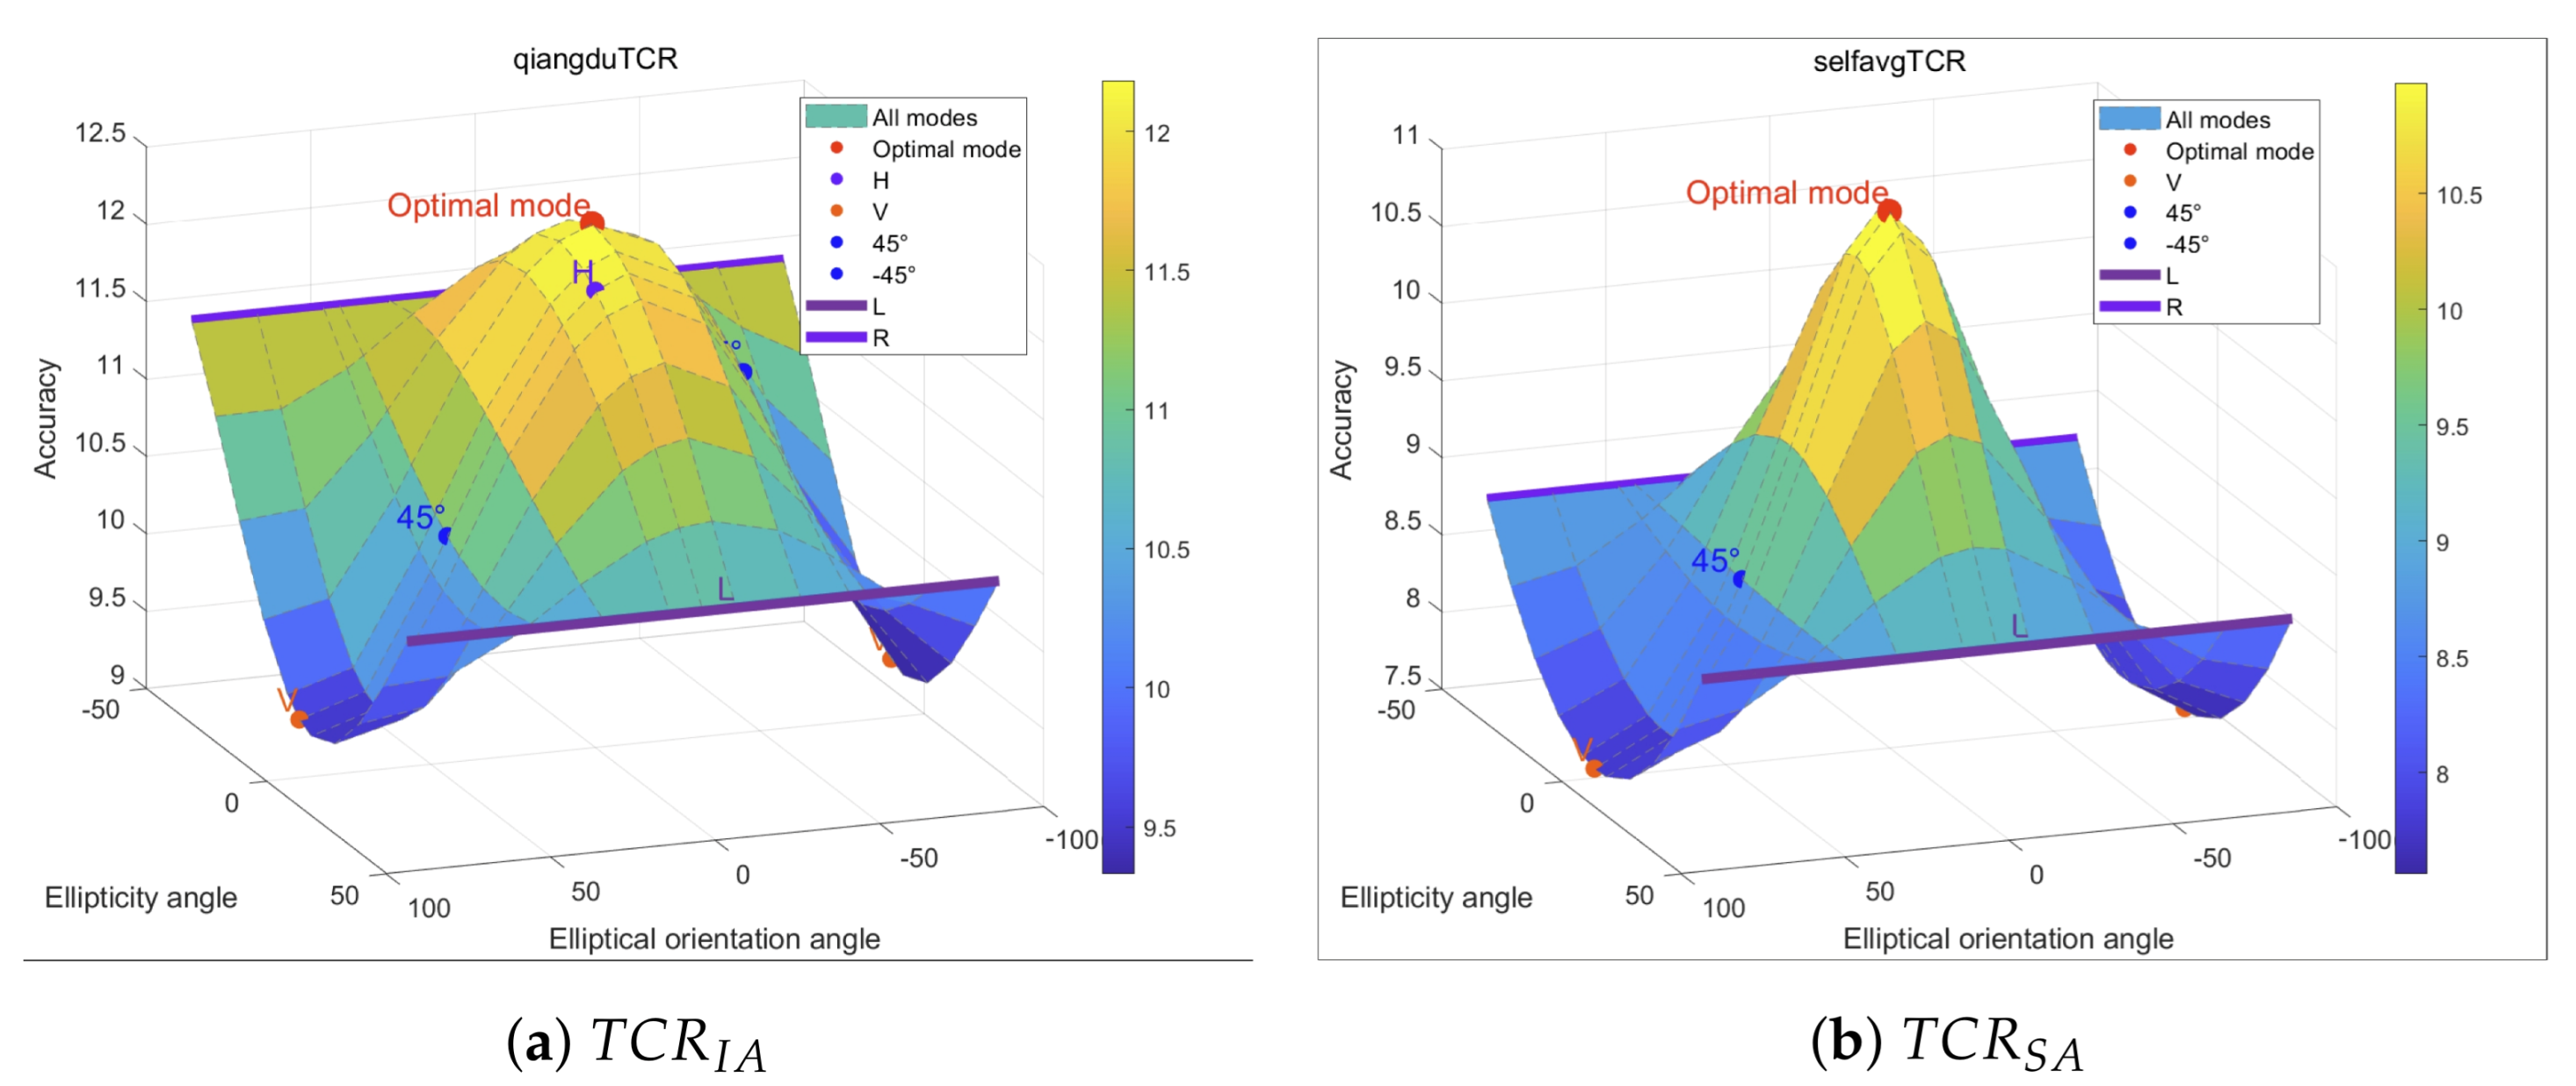

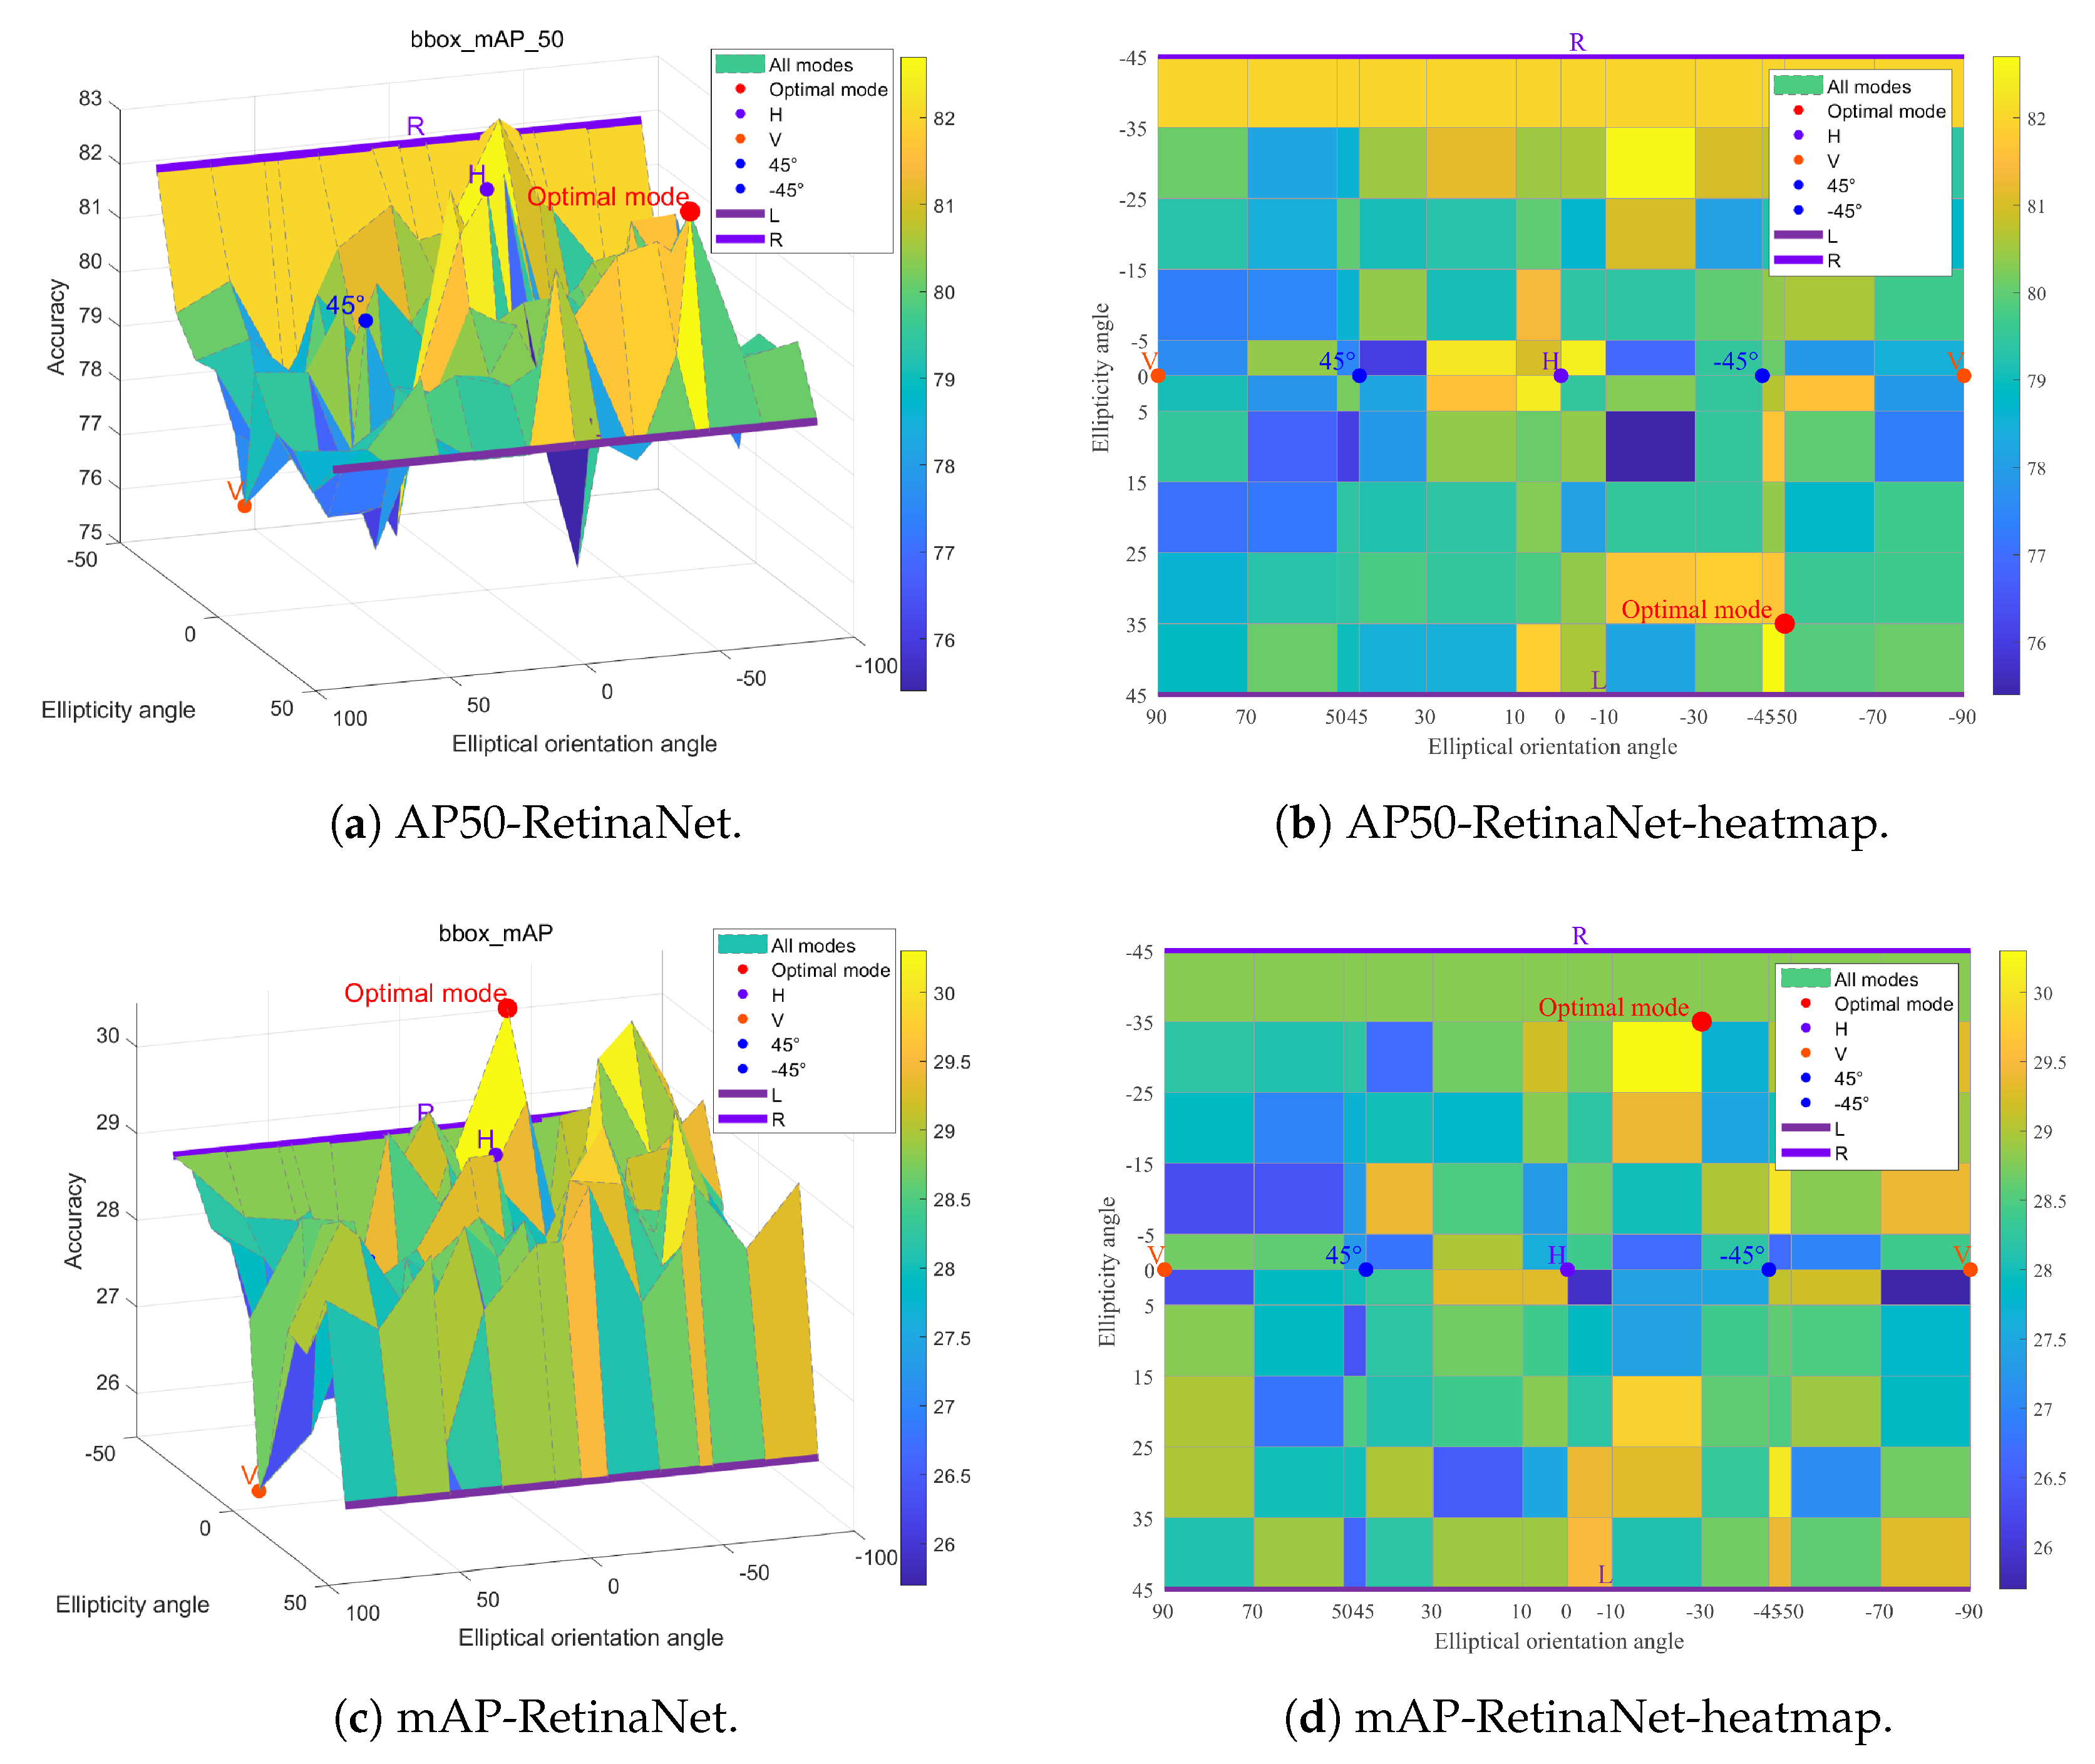
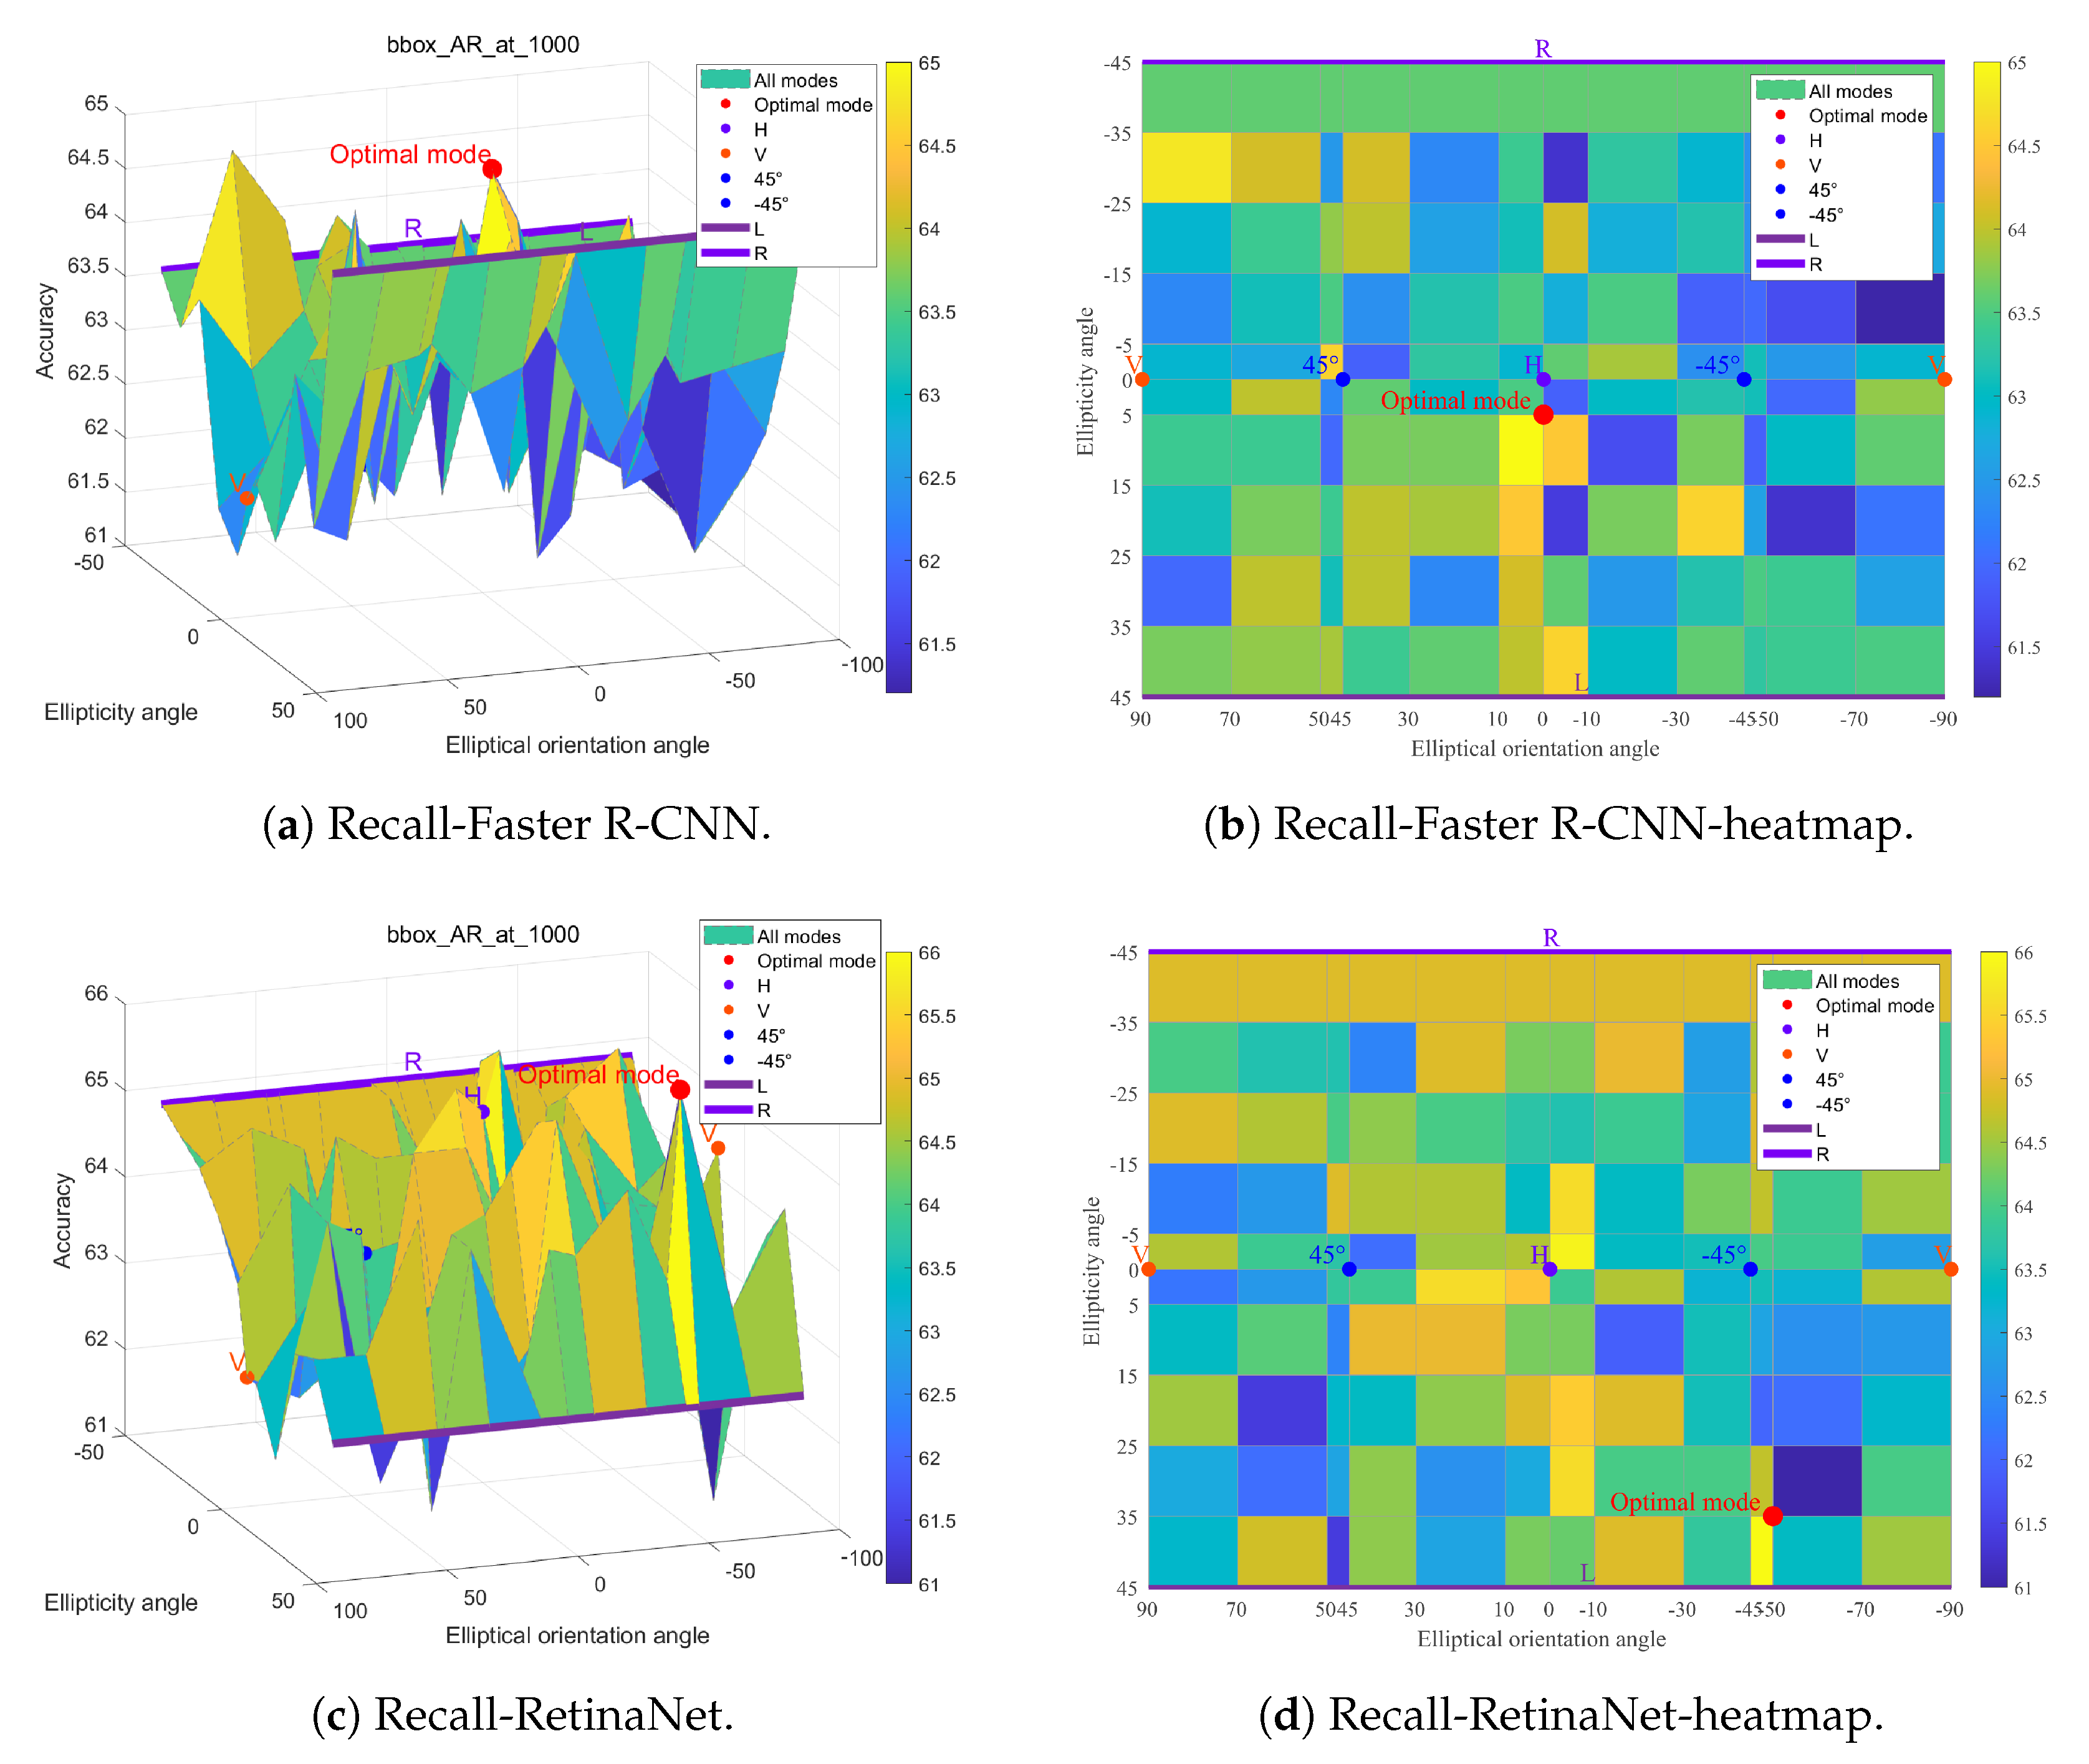
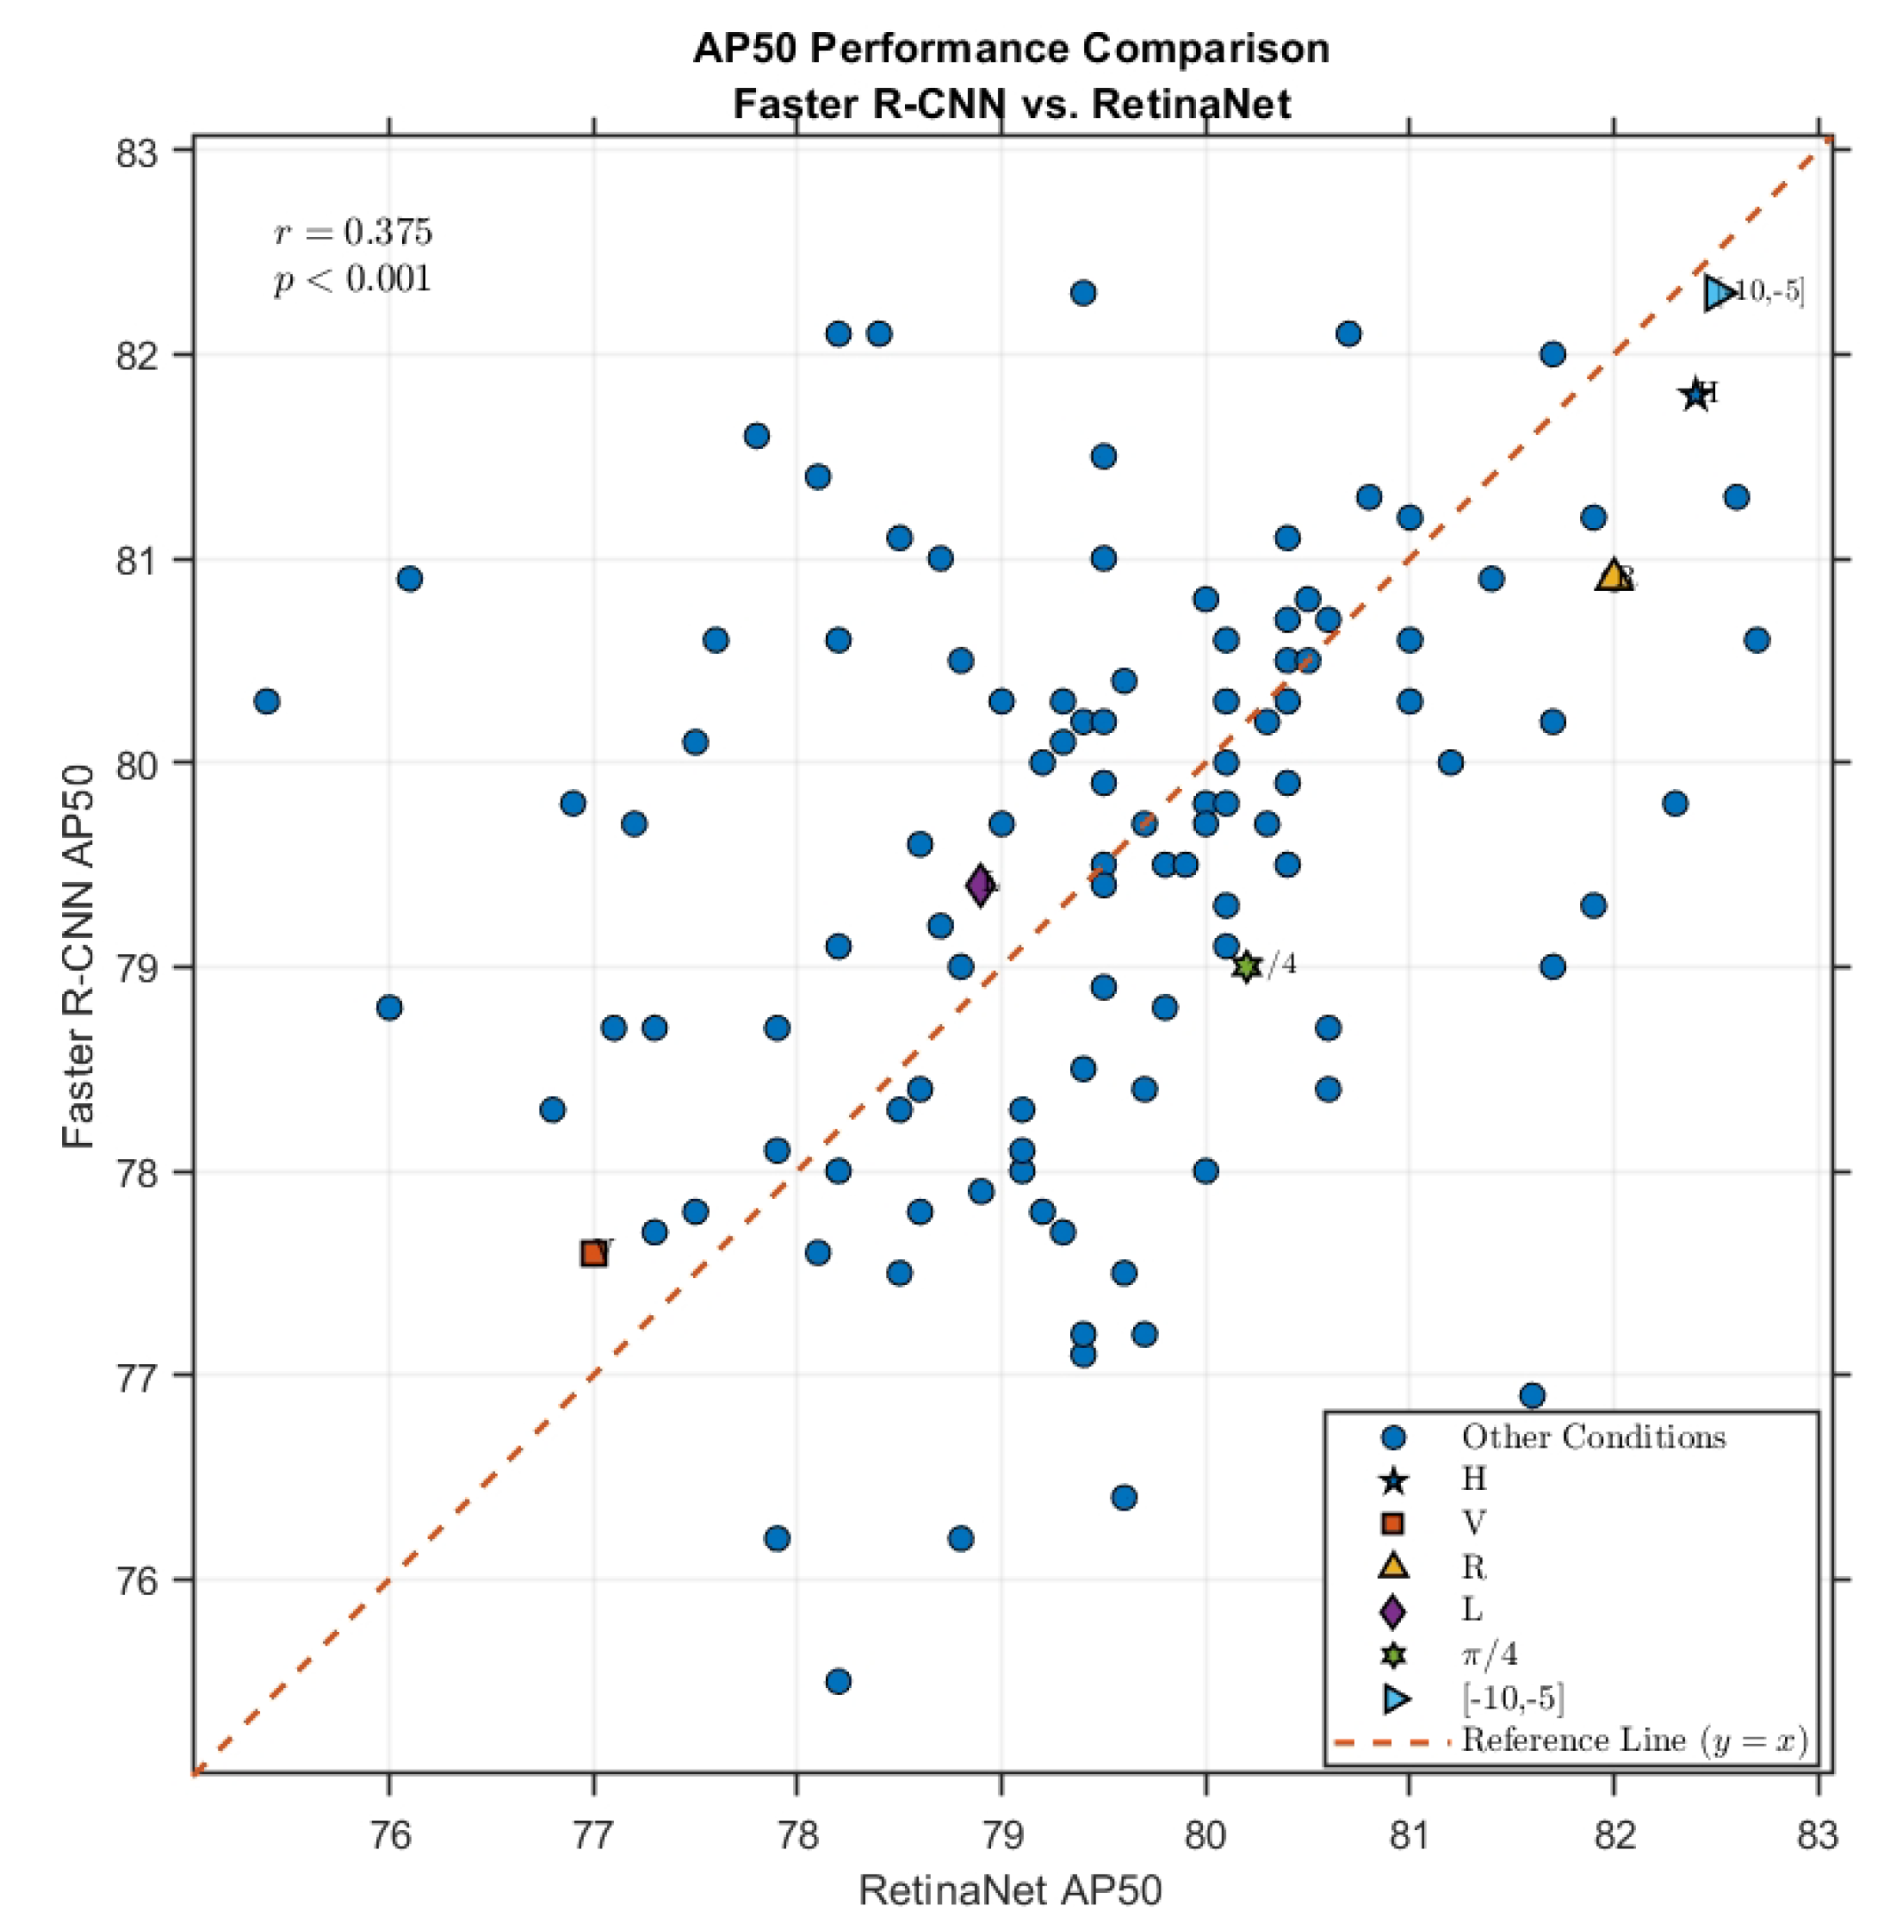
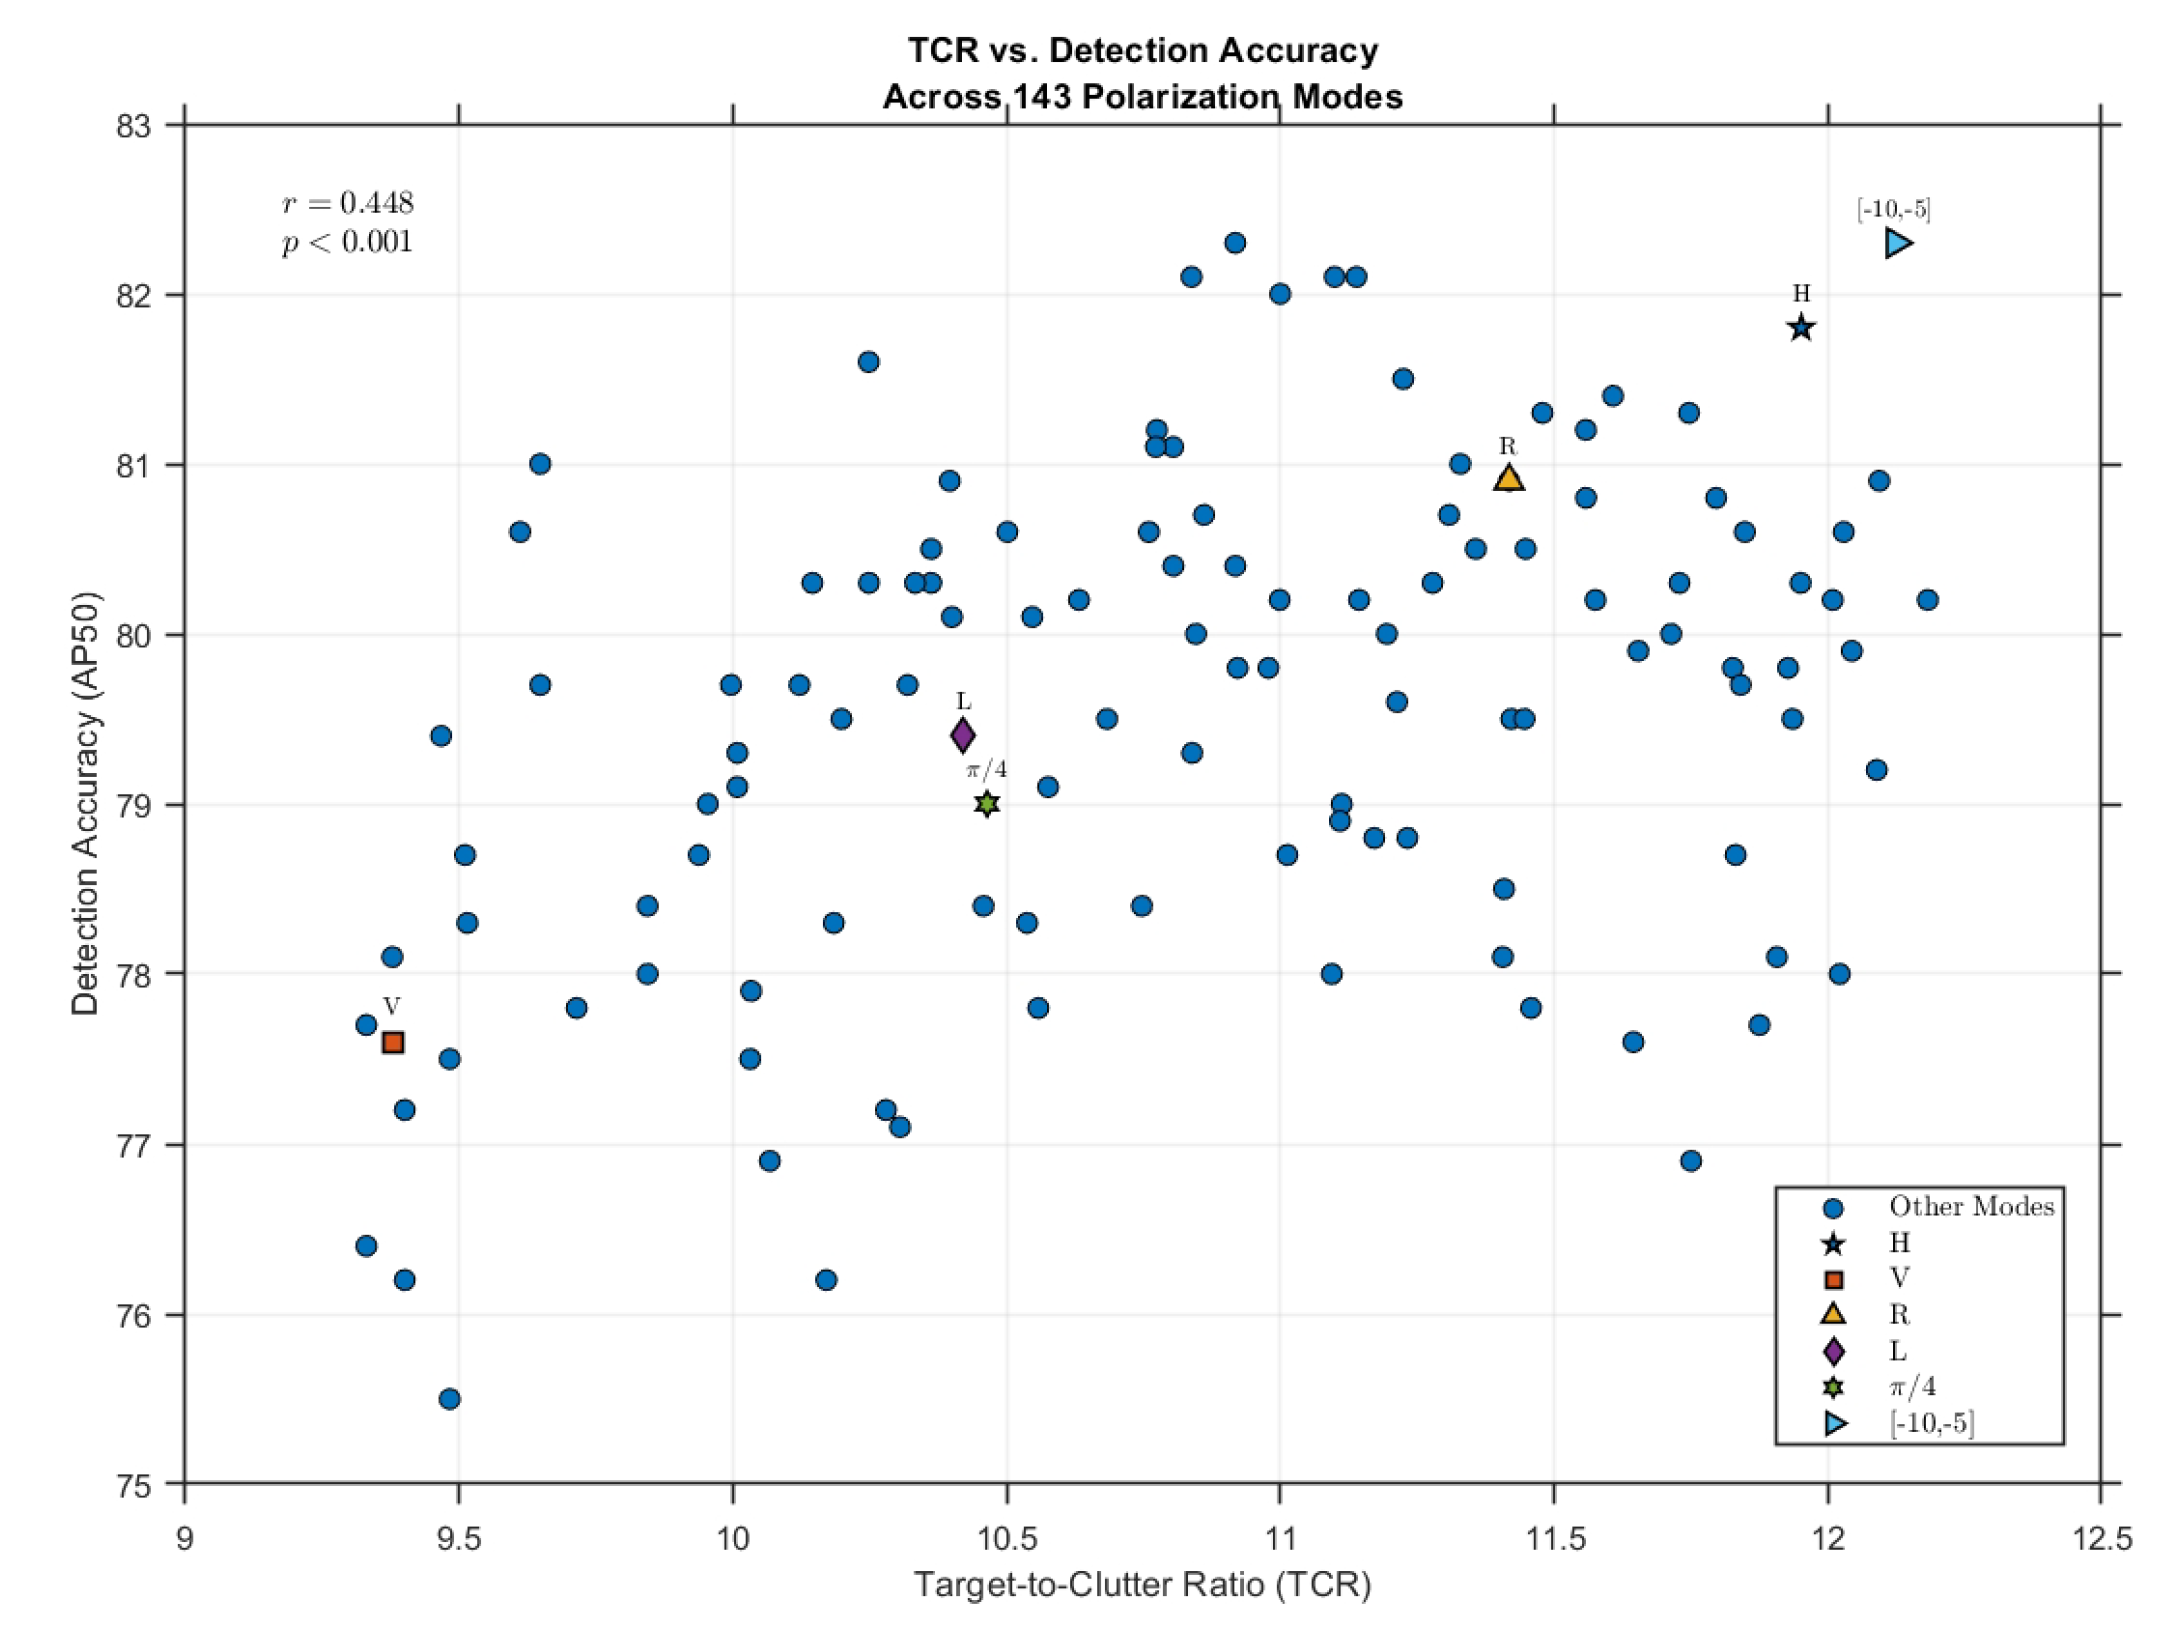

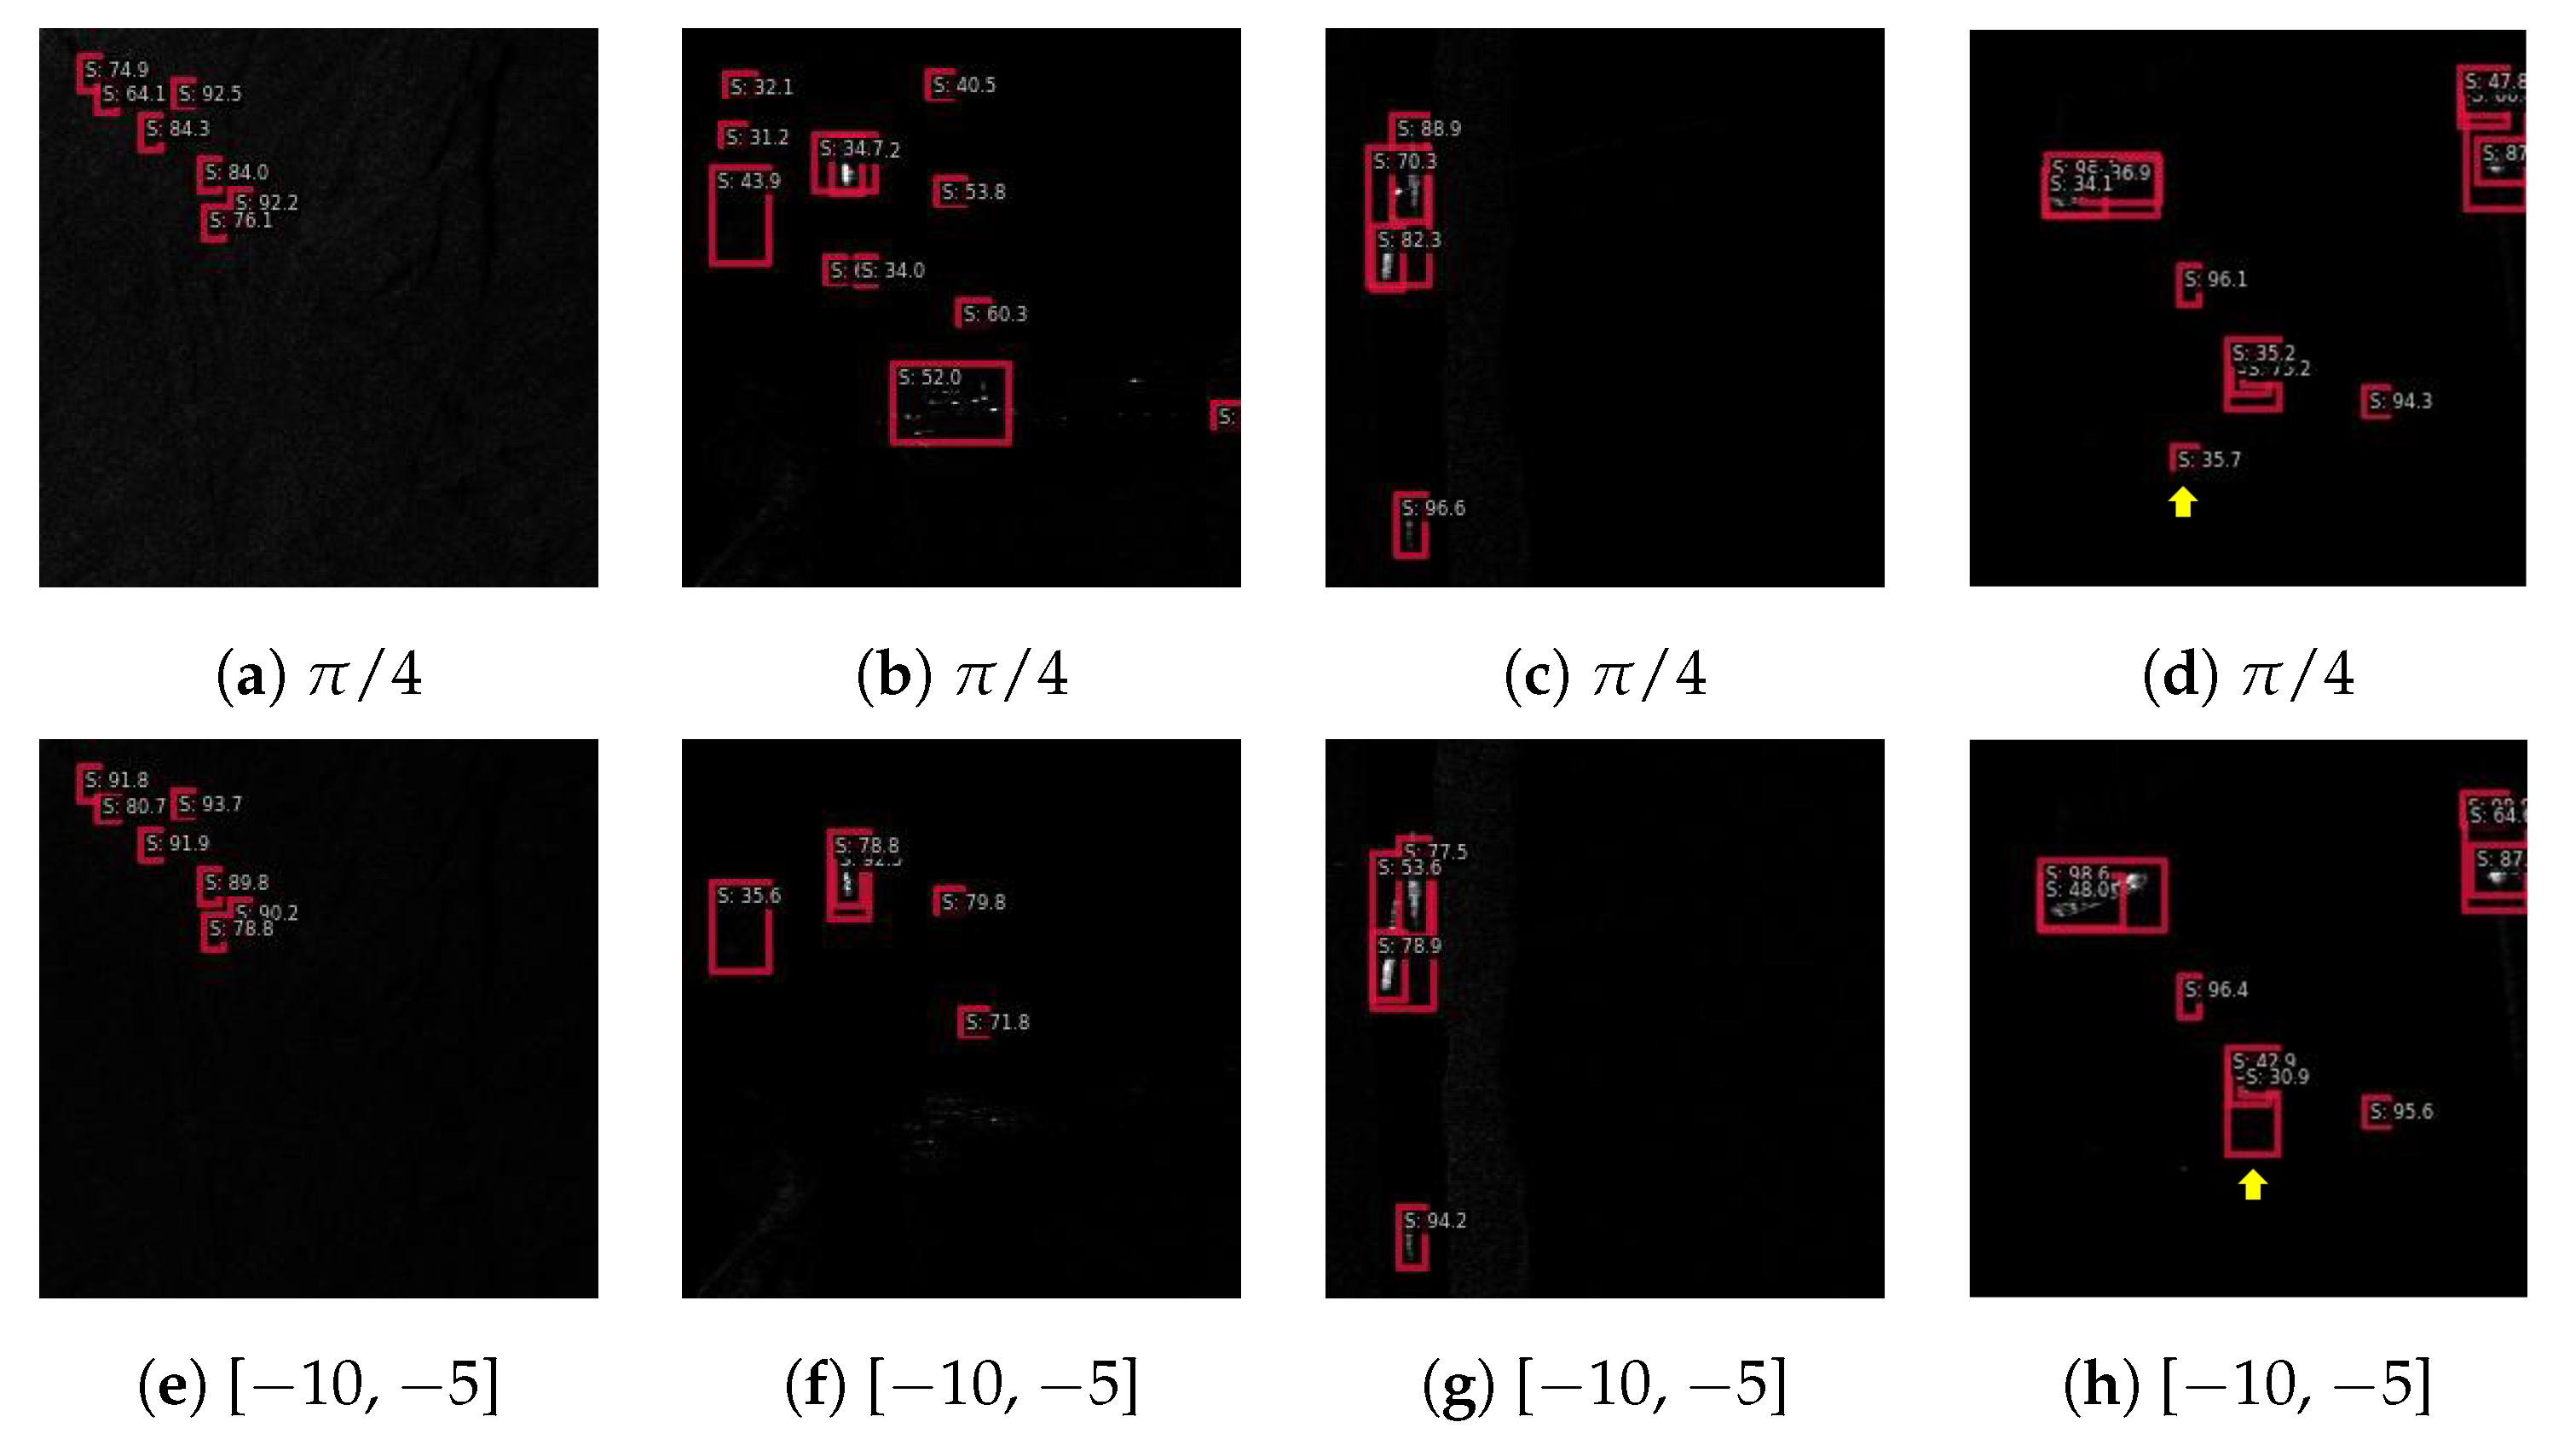
