

Utilizing Remote Sensing for Sponge City Development: Enhancing Flood Management and Urban Resilience in Karachi


Abstract
1. Introduction
2. Literature Review
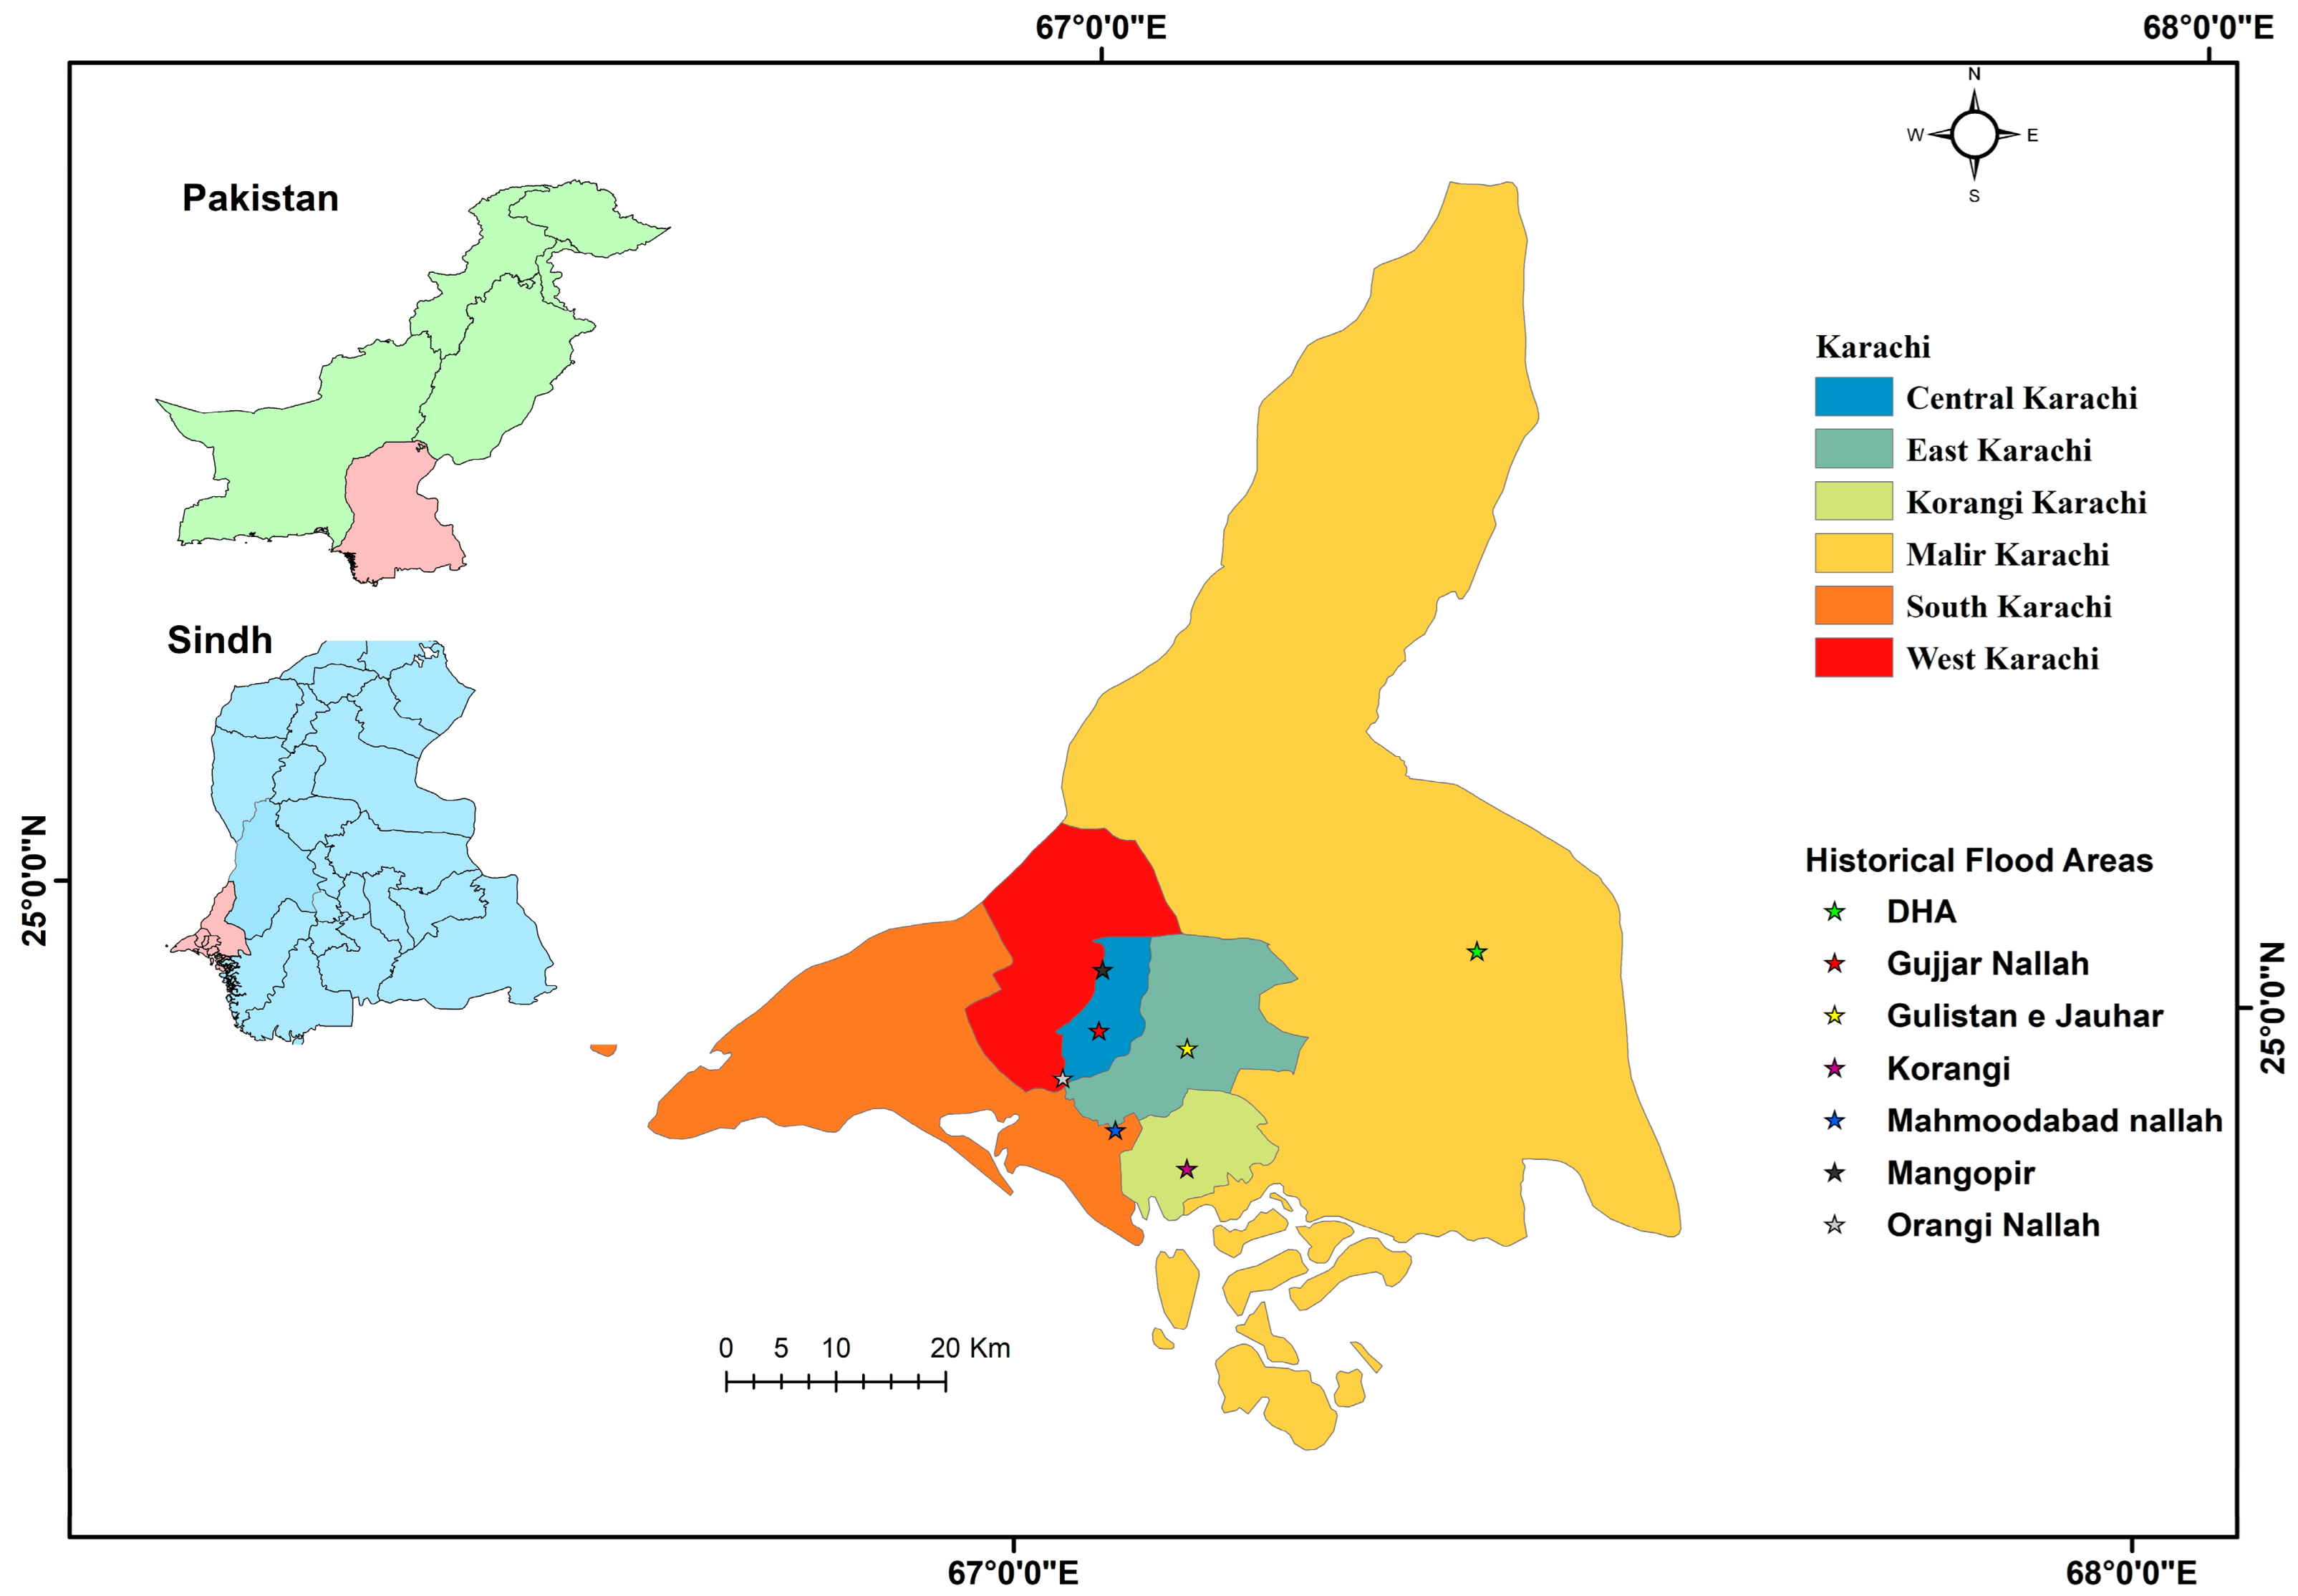
3. Case Study Area
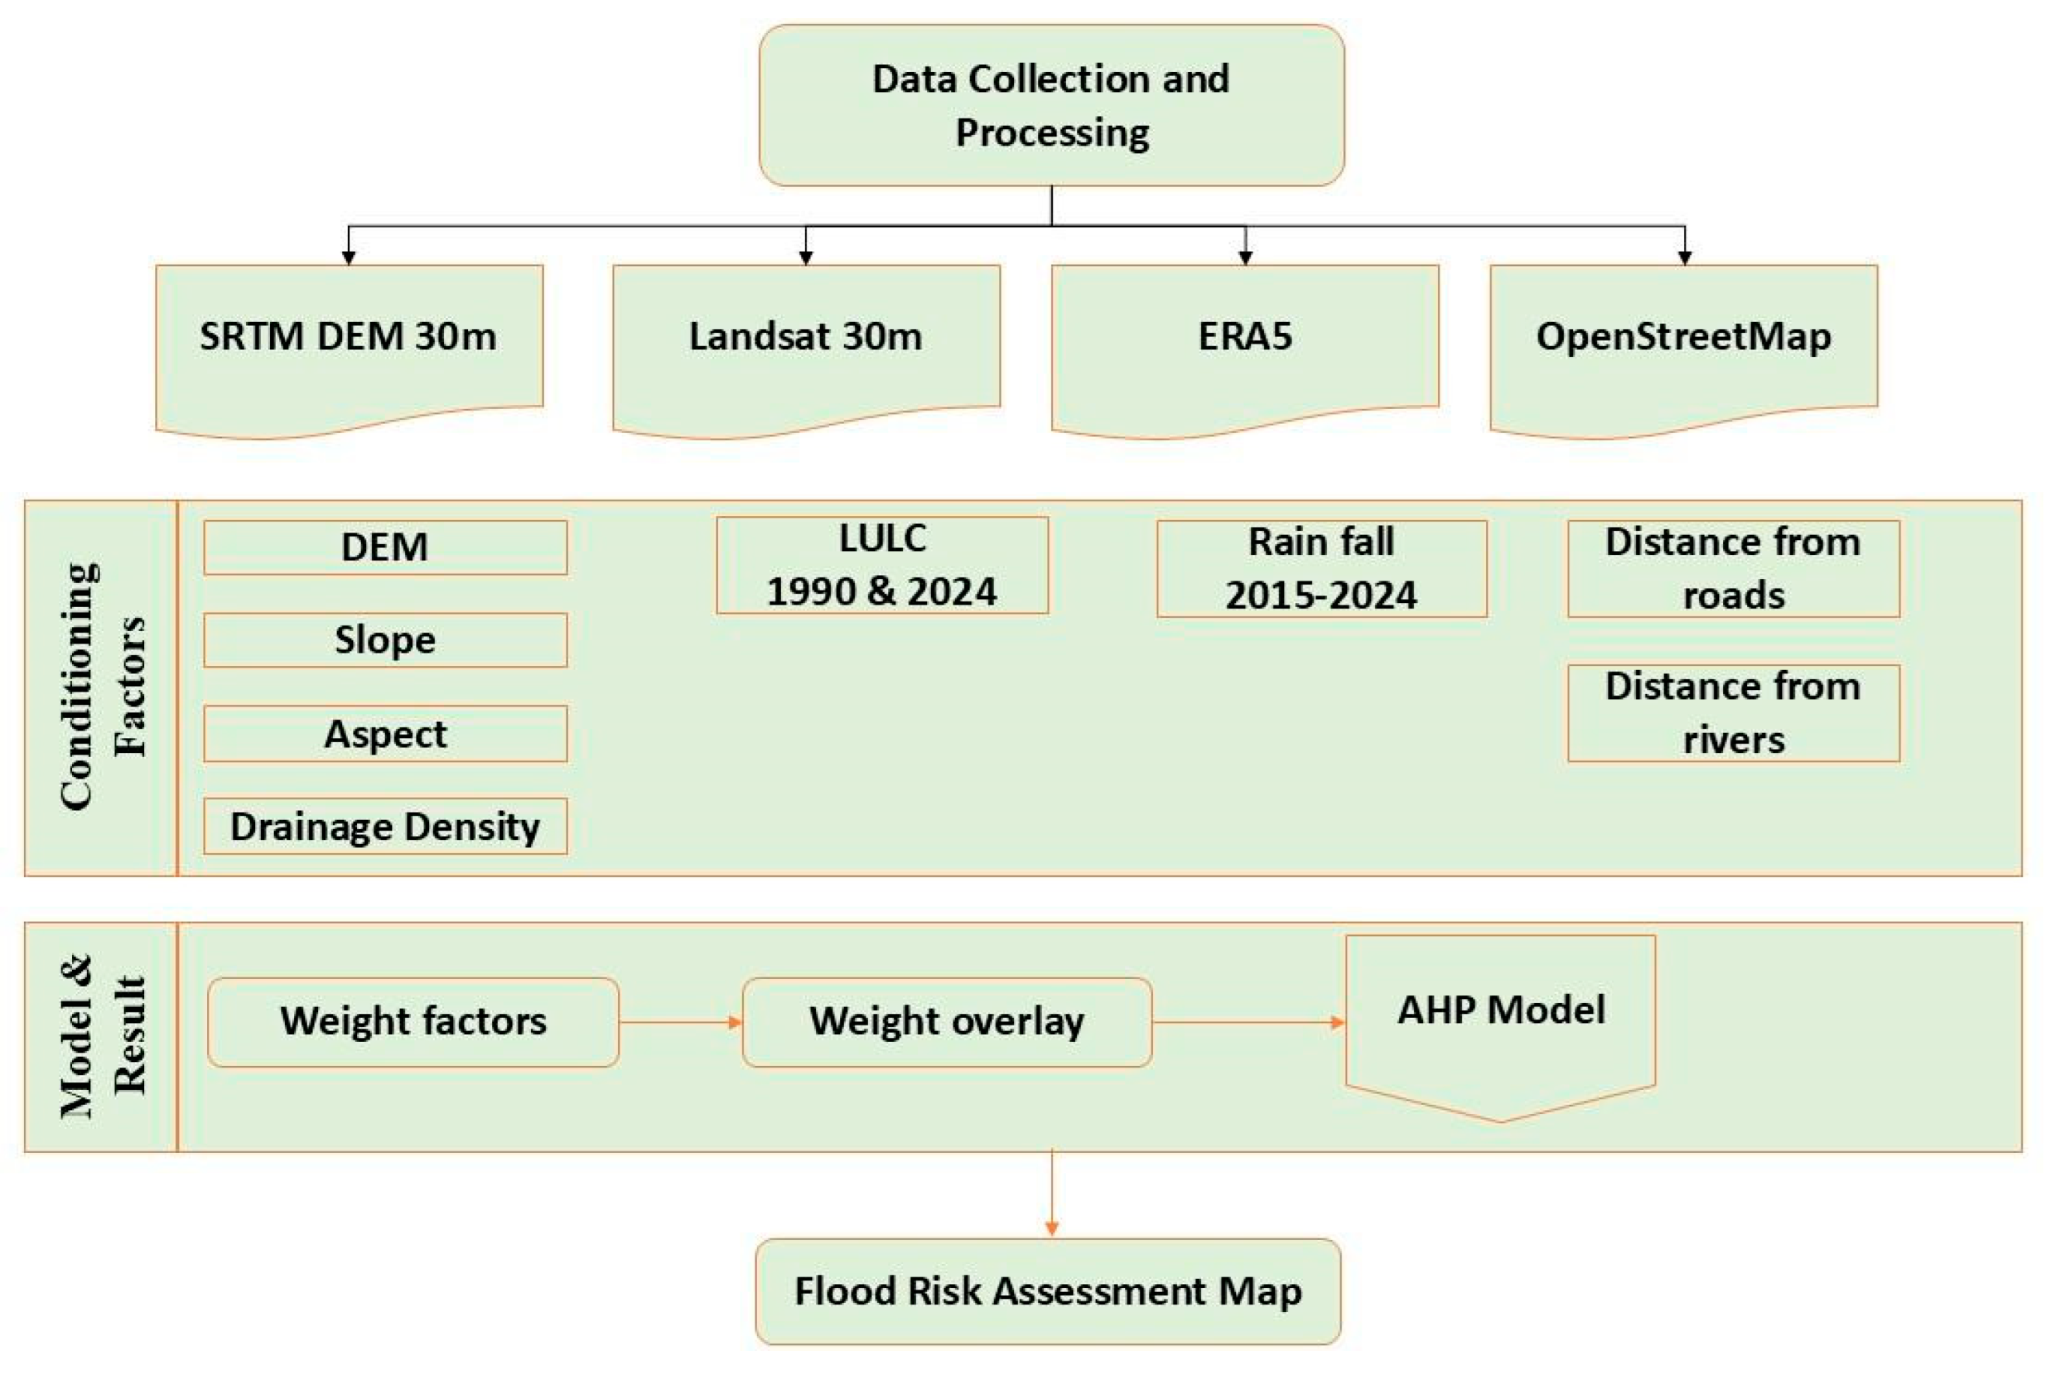
4. Materials and Methods
Selection of Flood-Conditioning Factors
5. Results
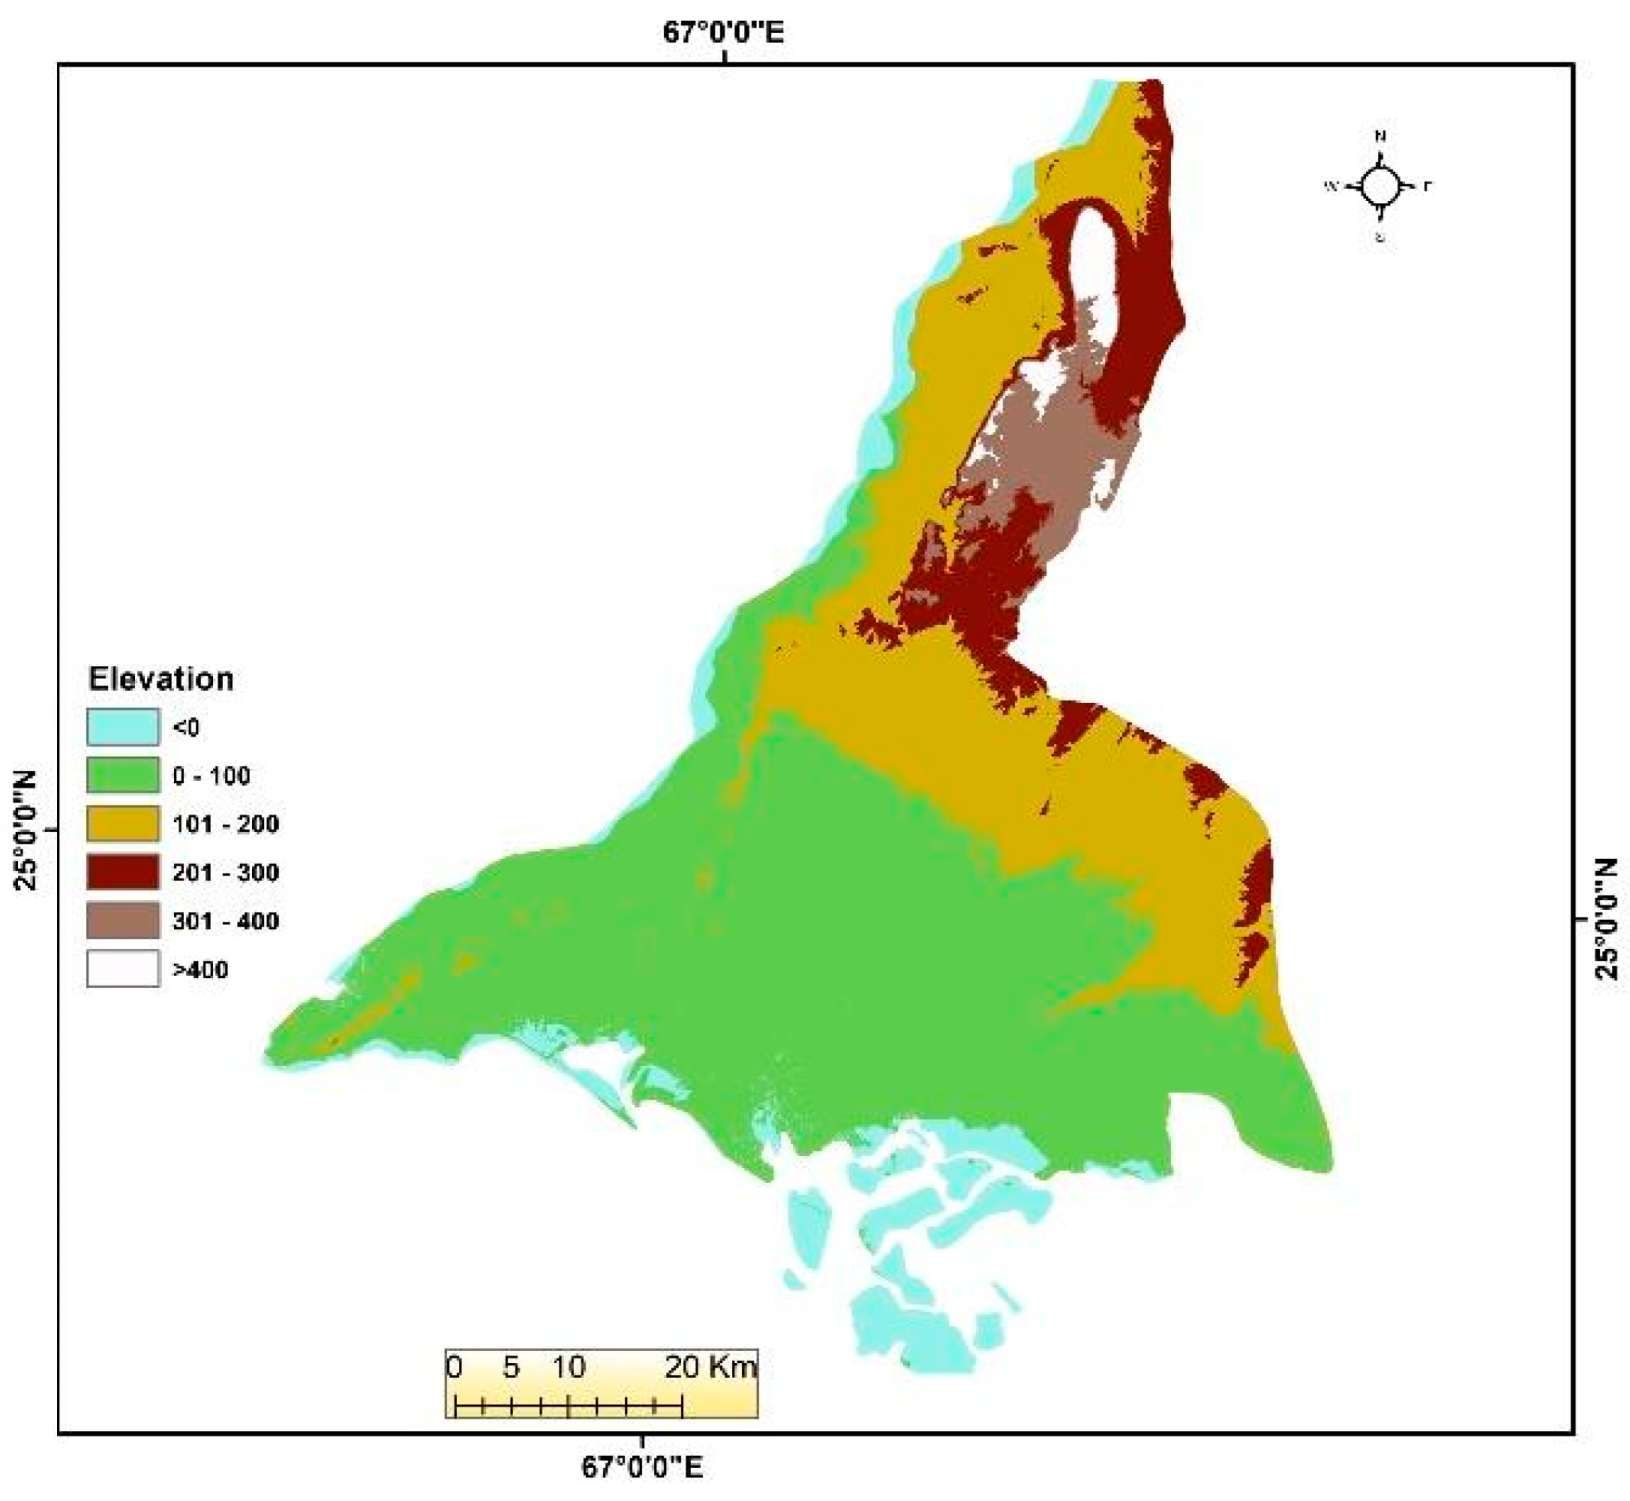
5.1. Elevation
5.2. Rainfall
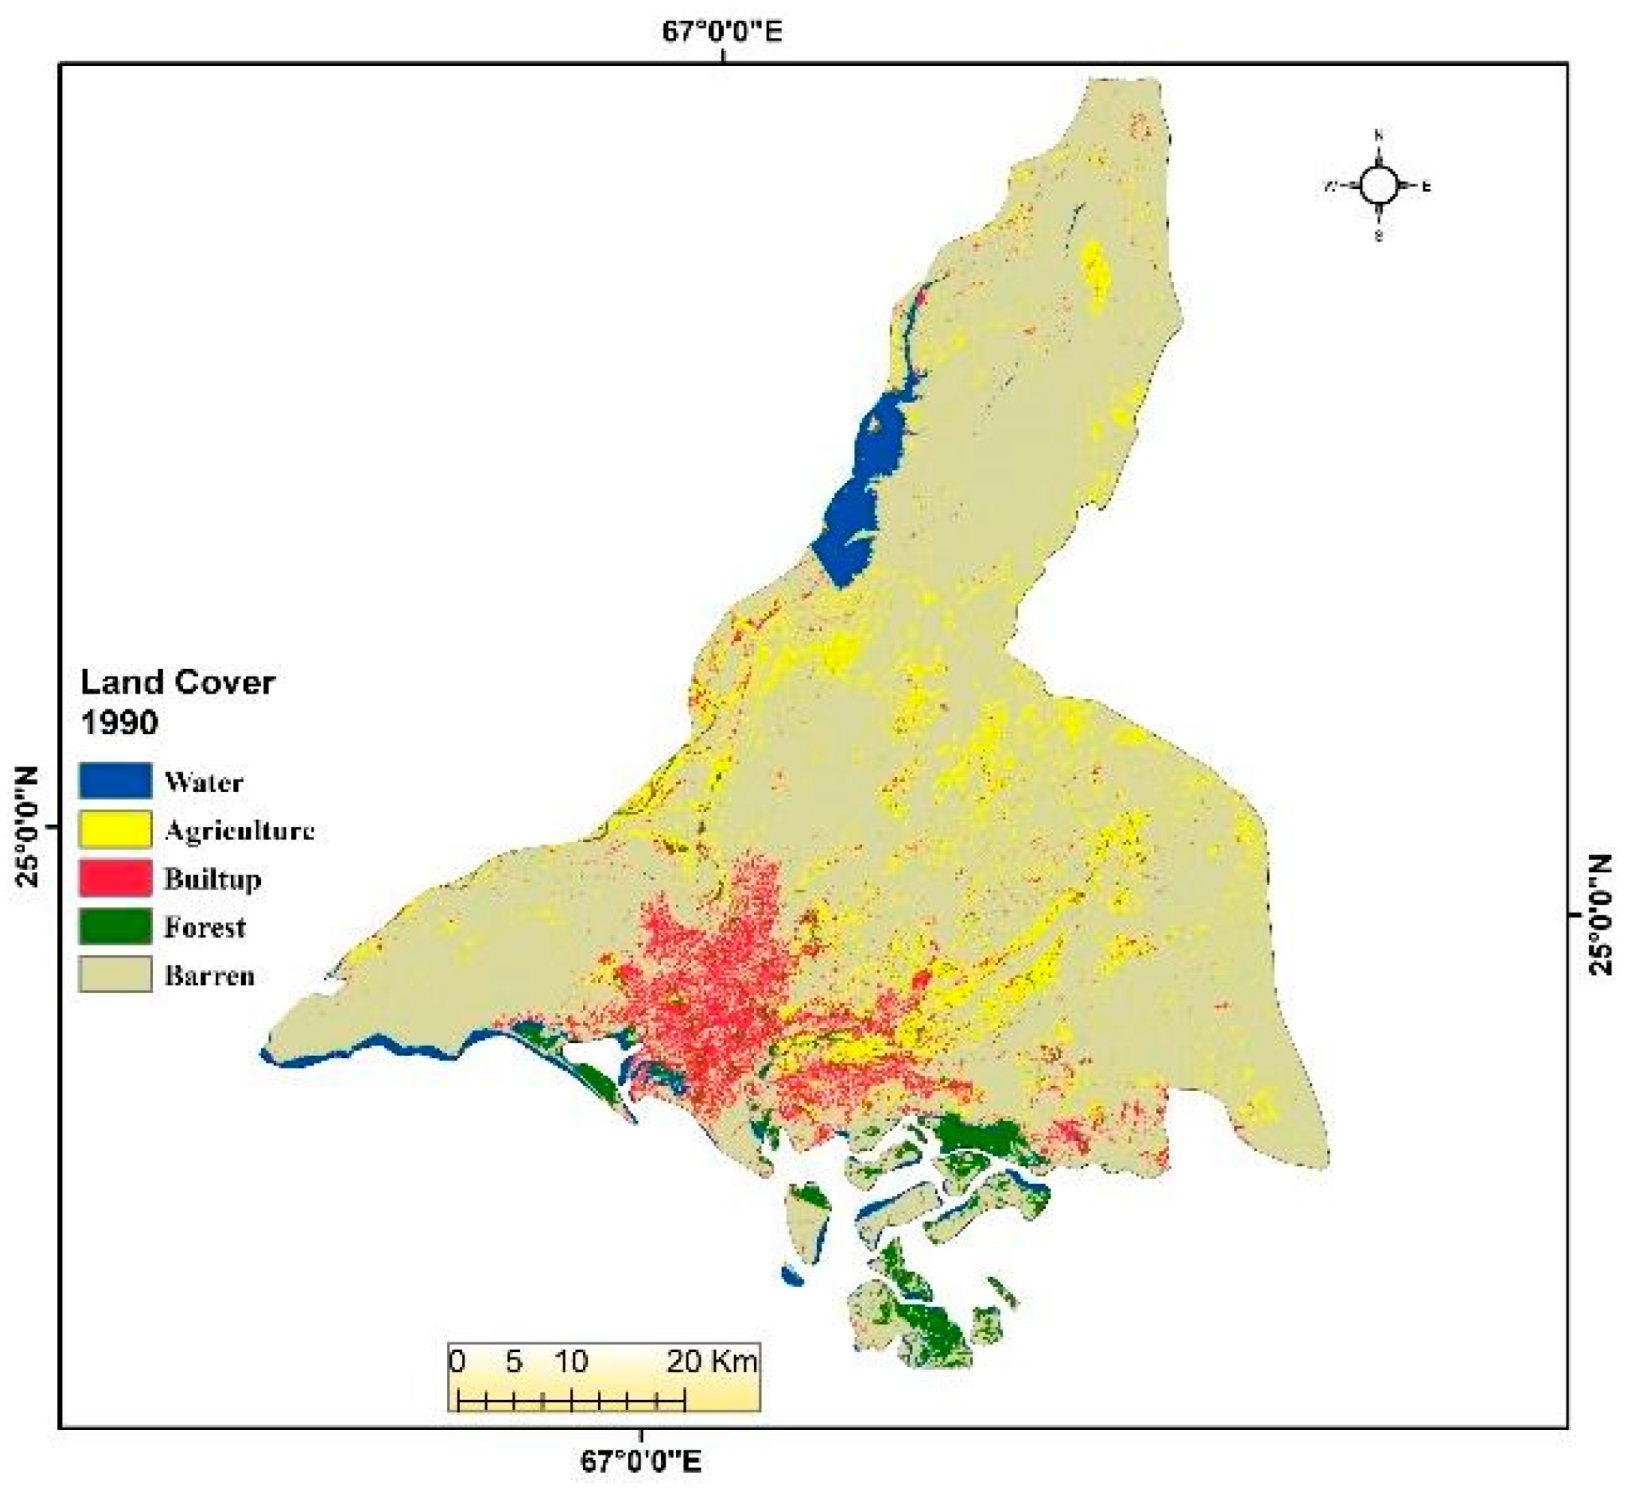
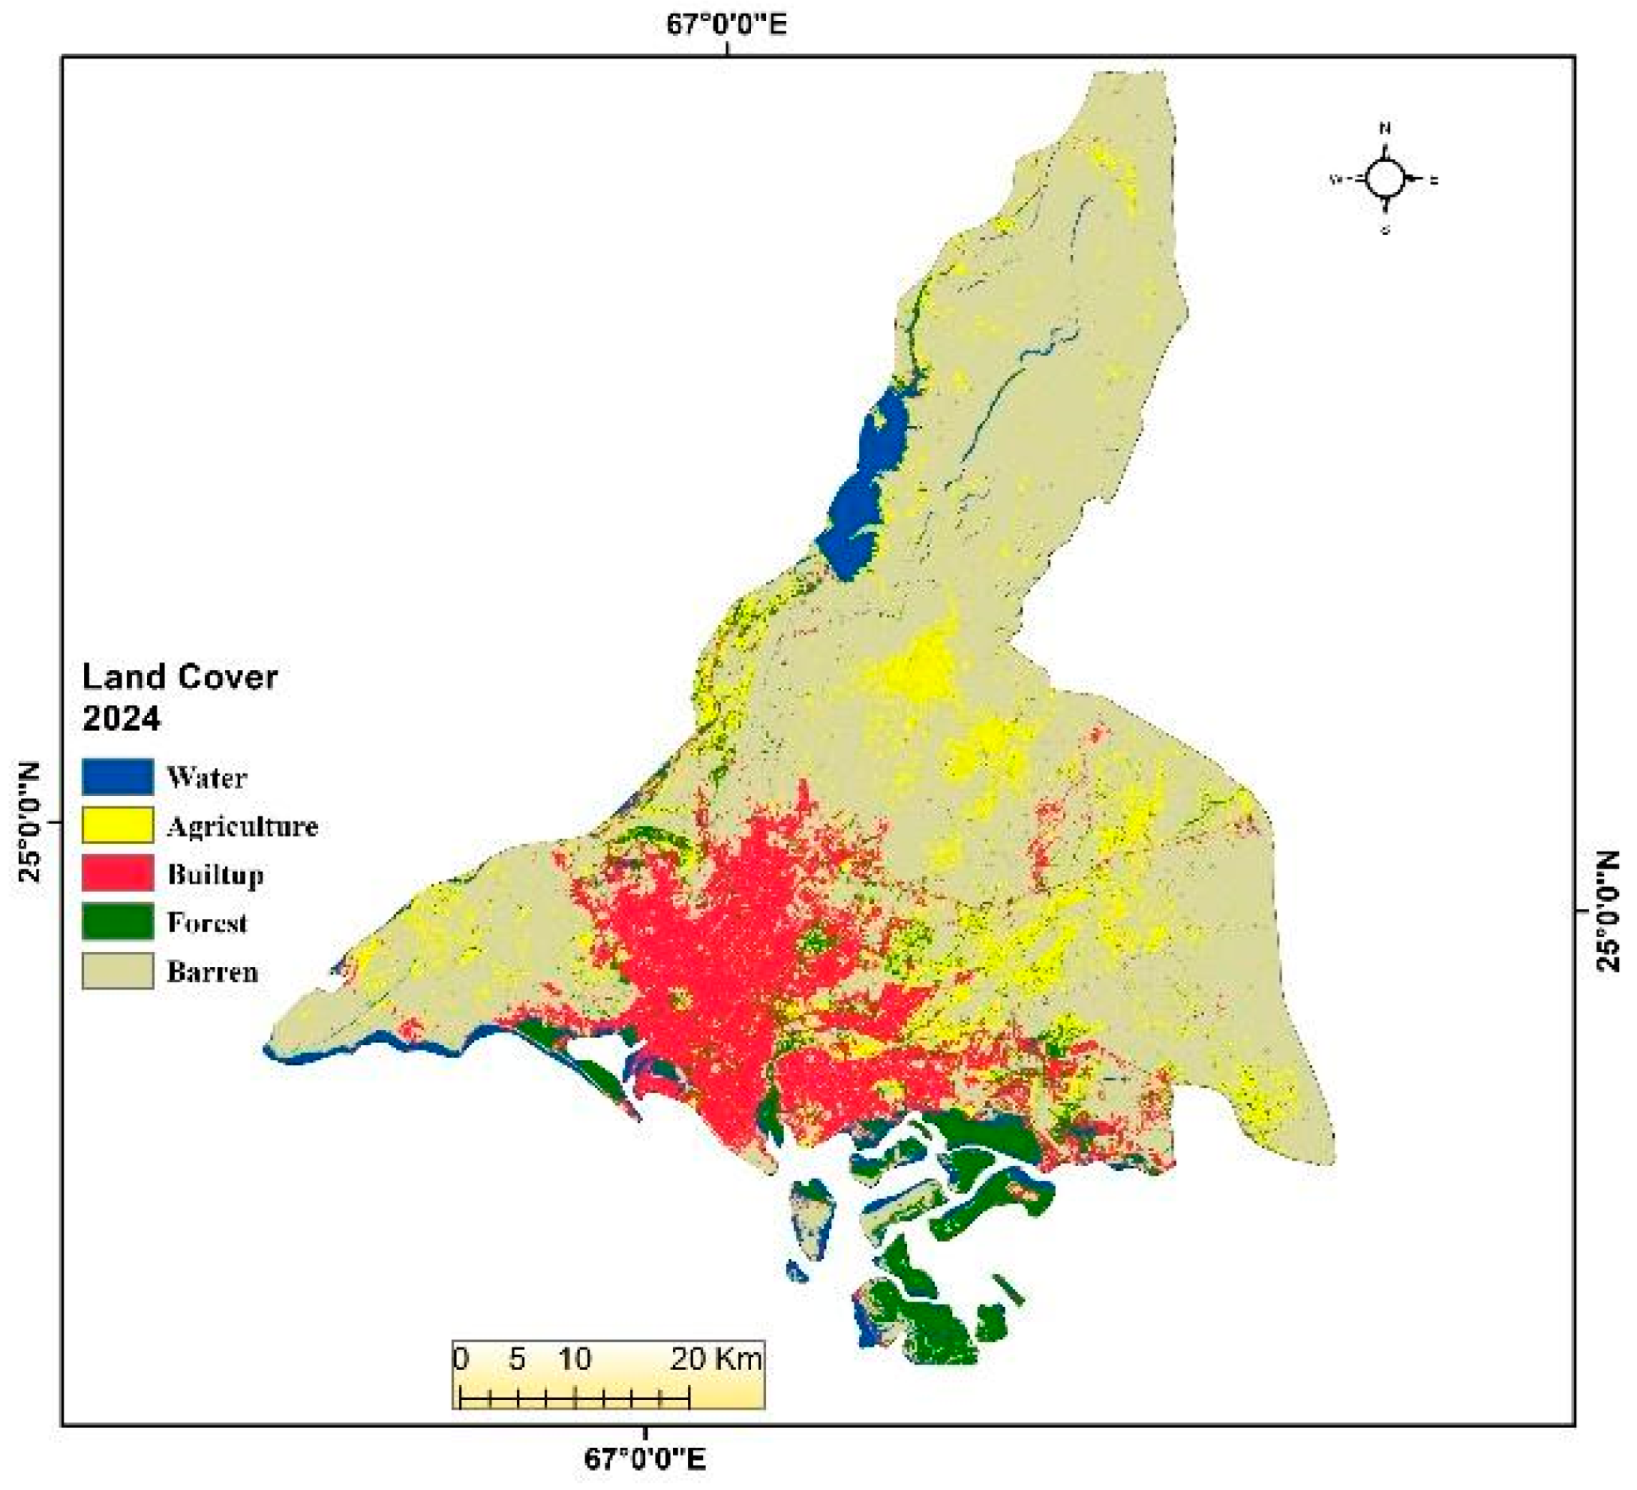
5.3. Land Use/Land Cover (LULC)
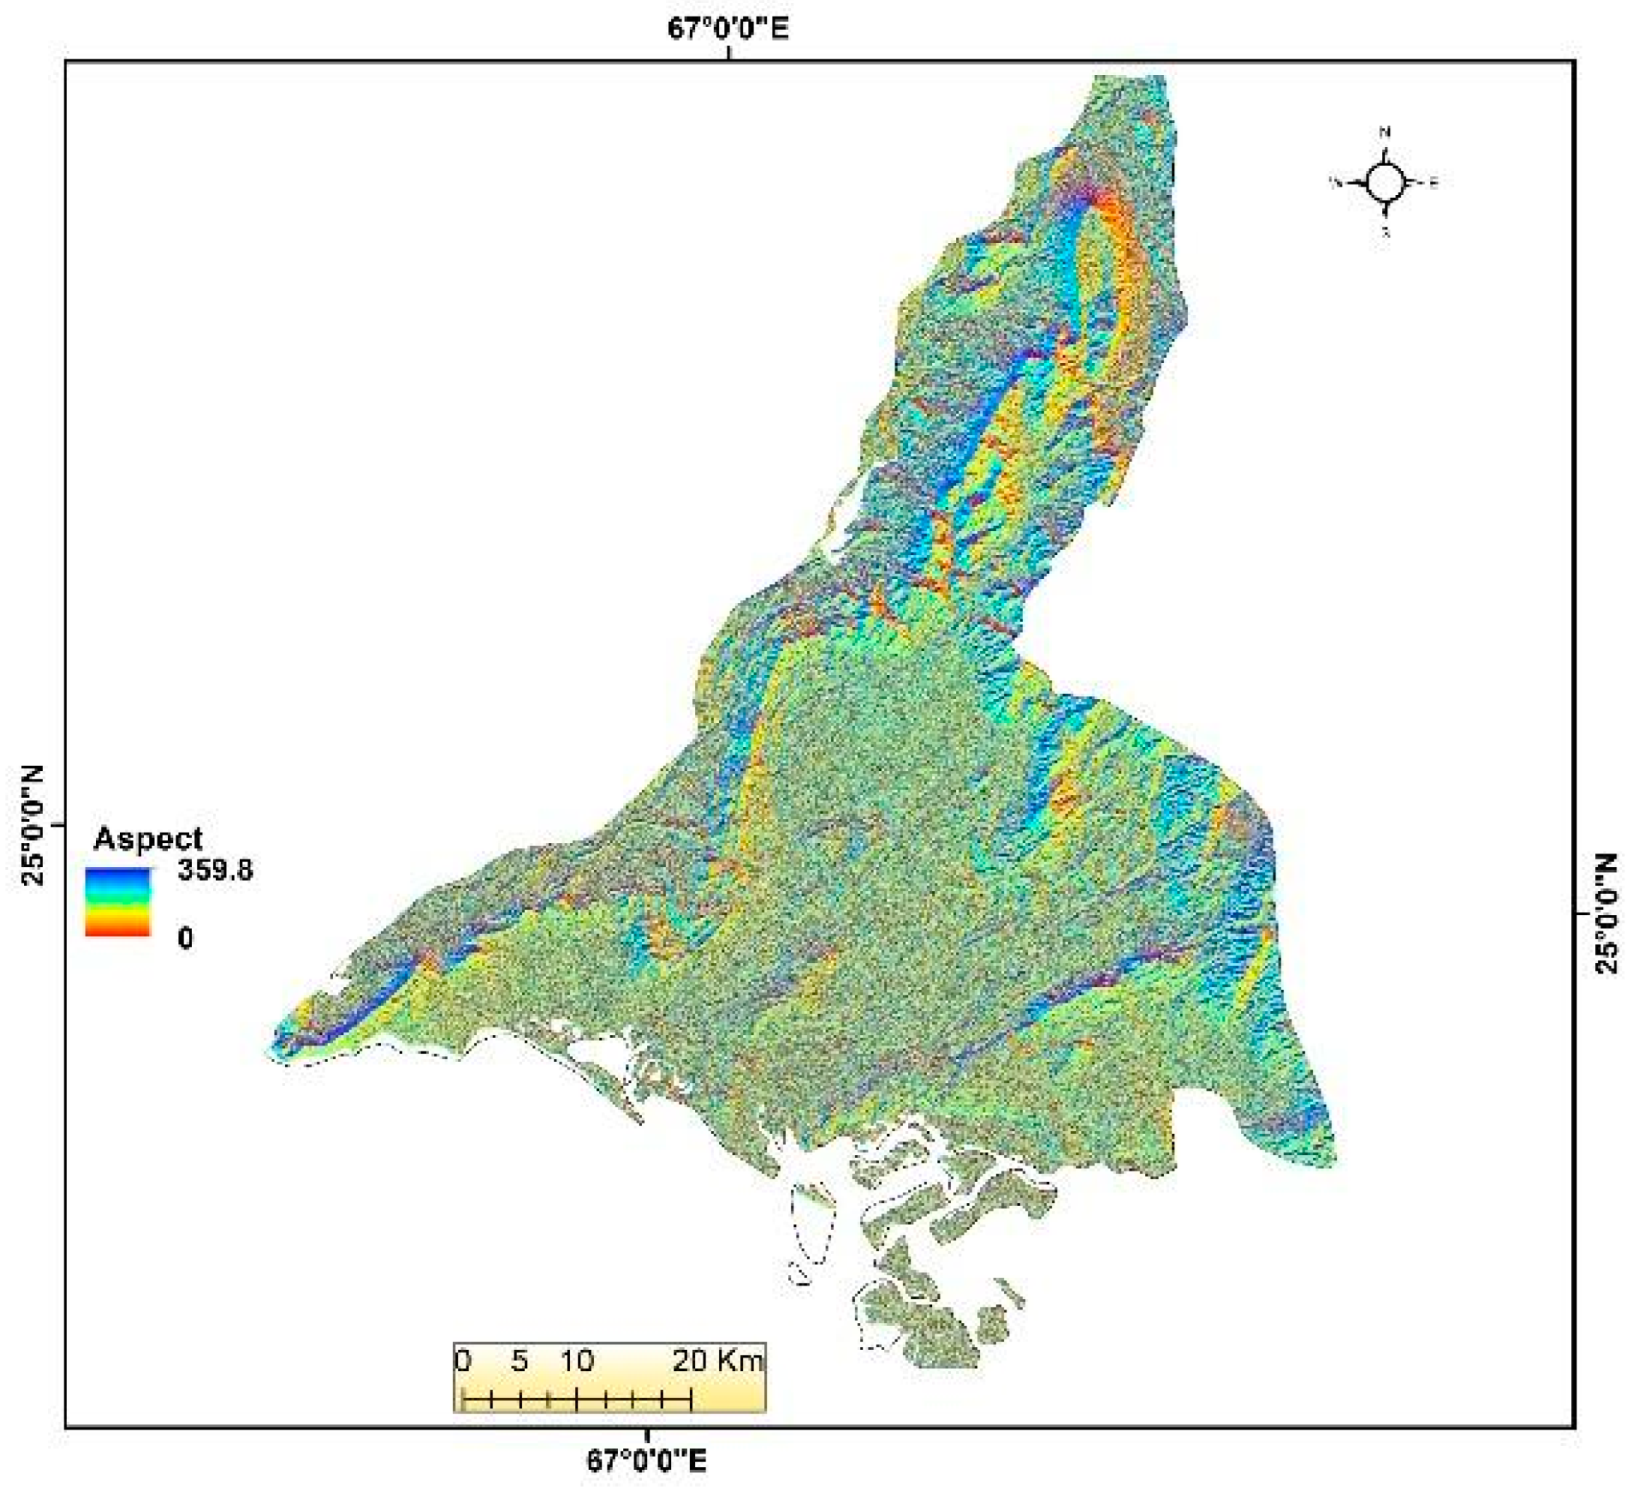
5.4. Aspect
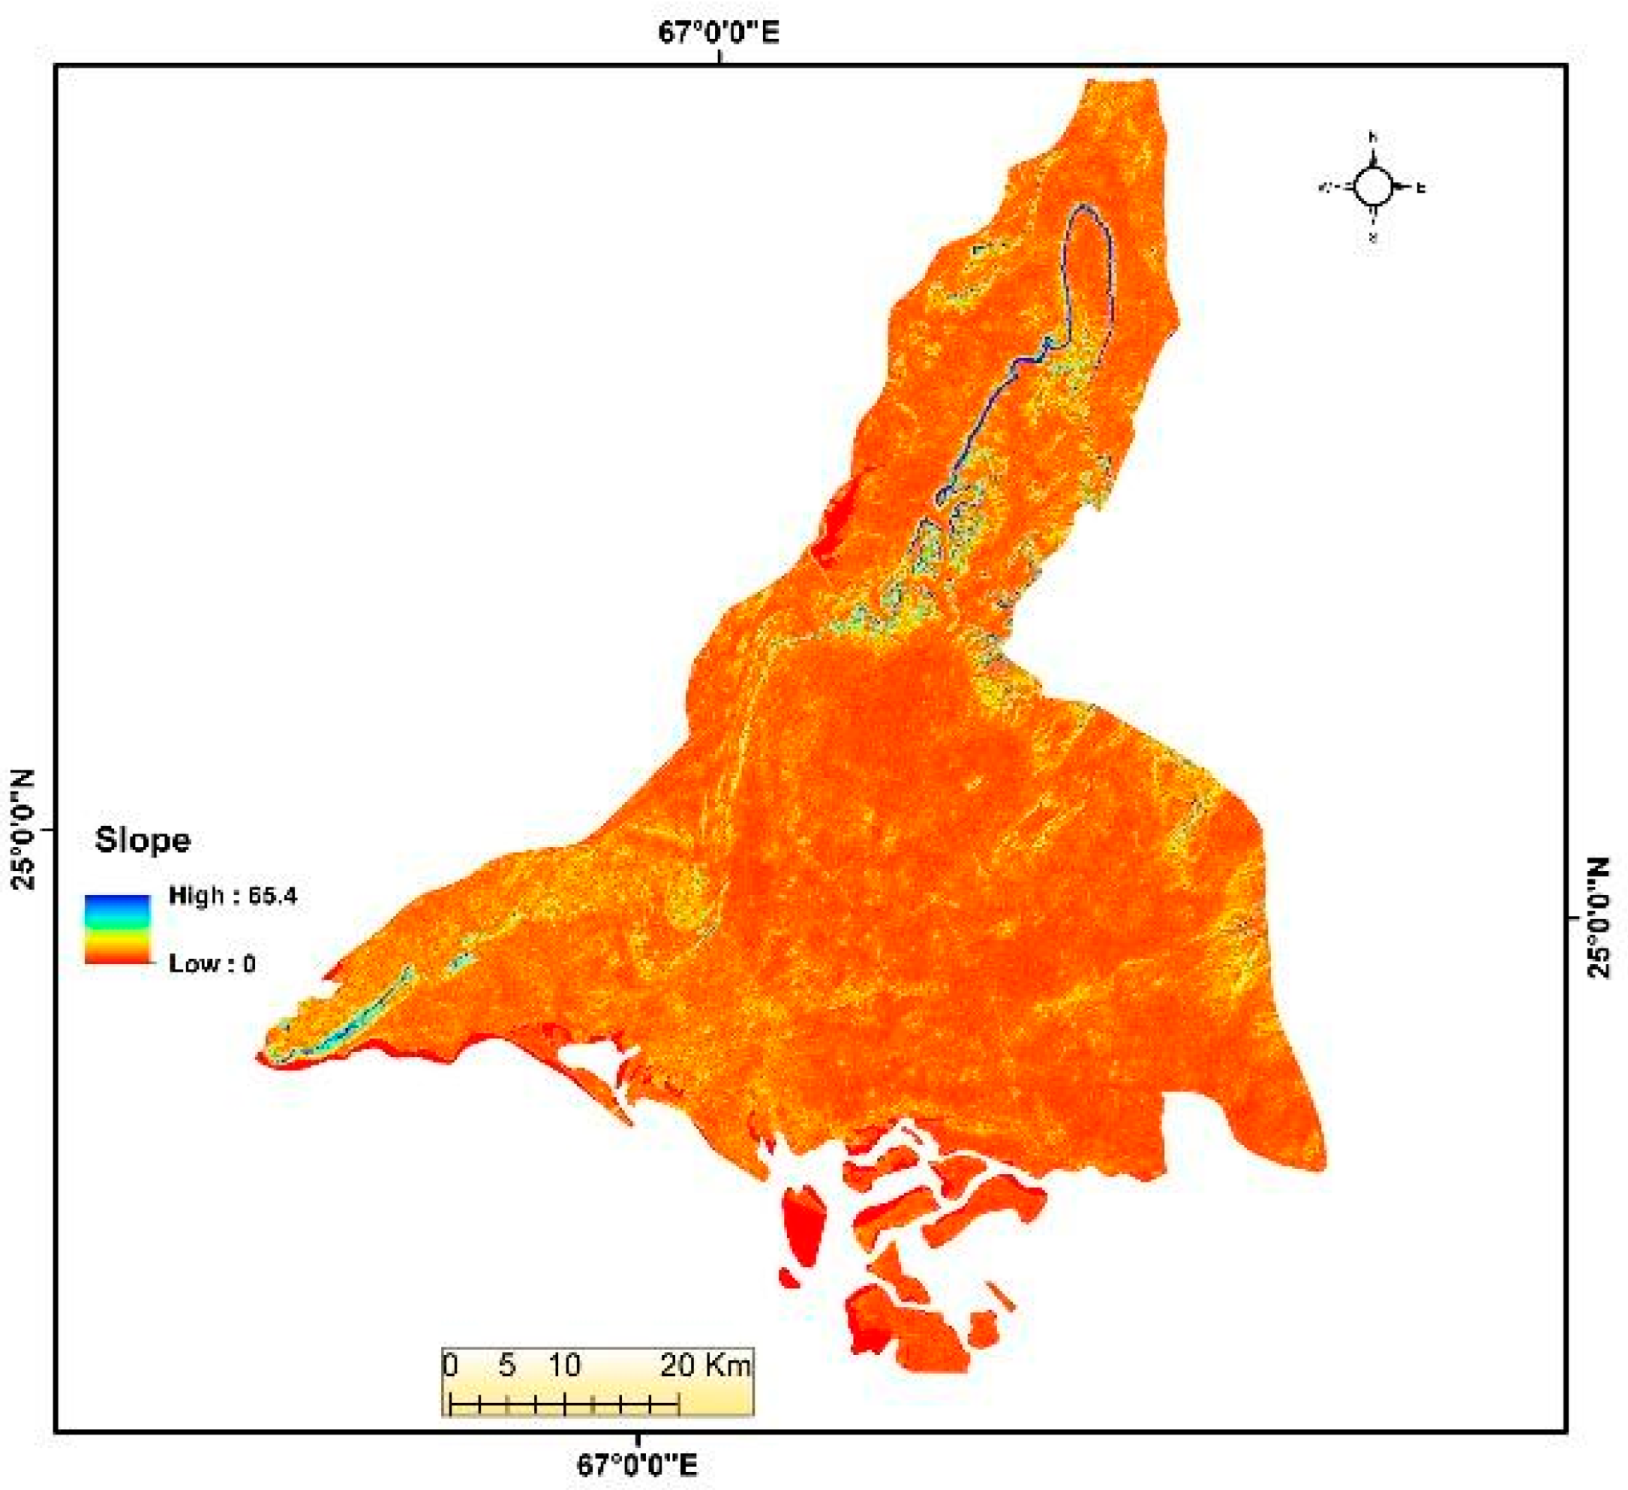
5.5. Slope
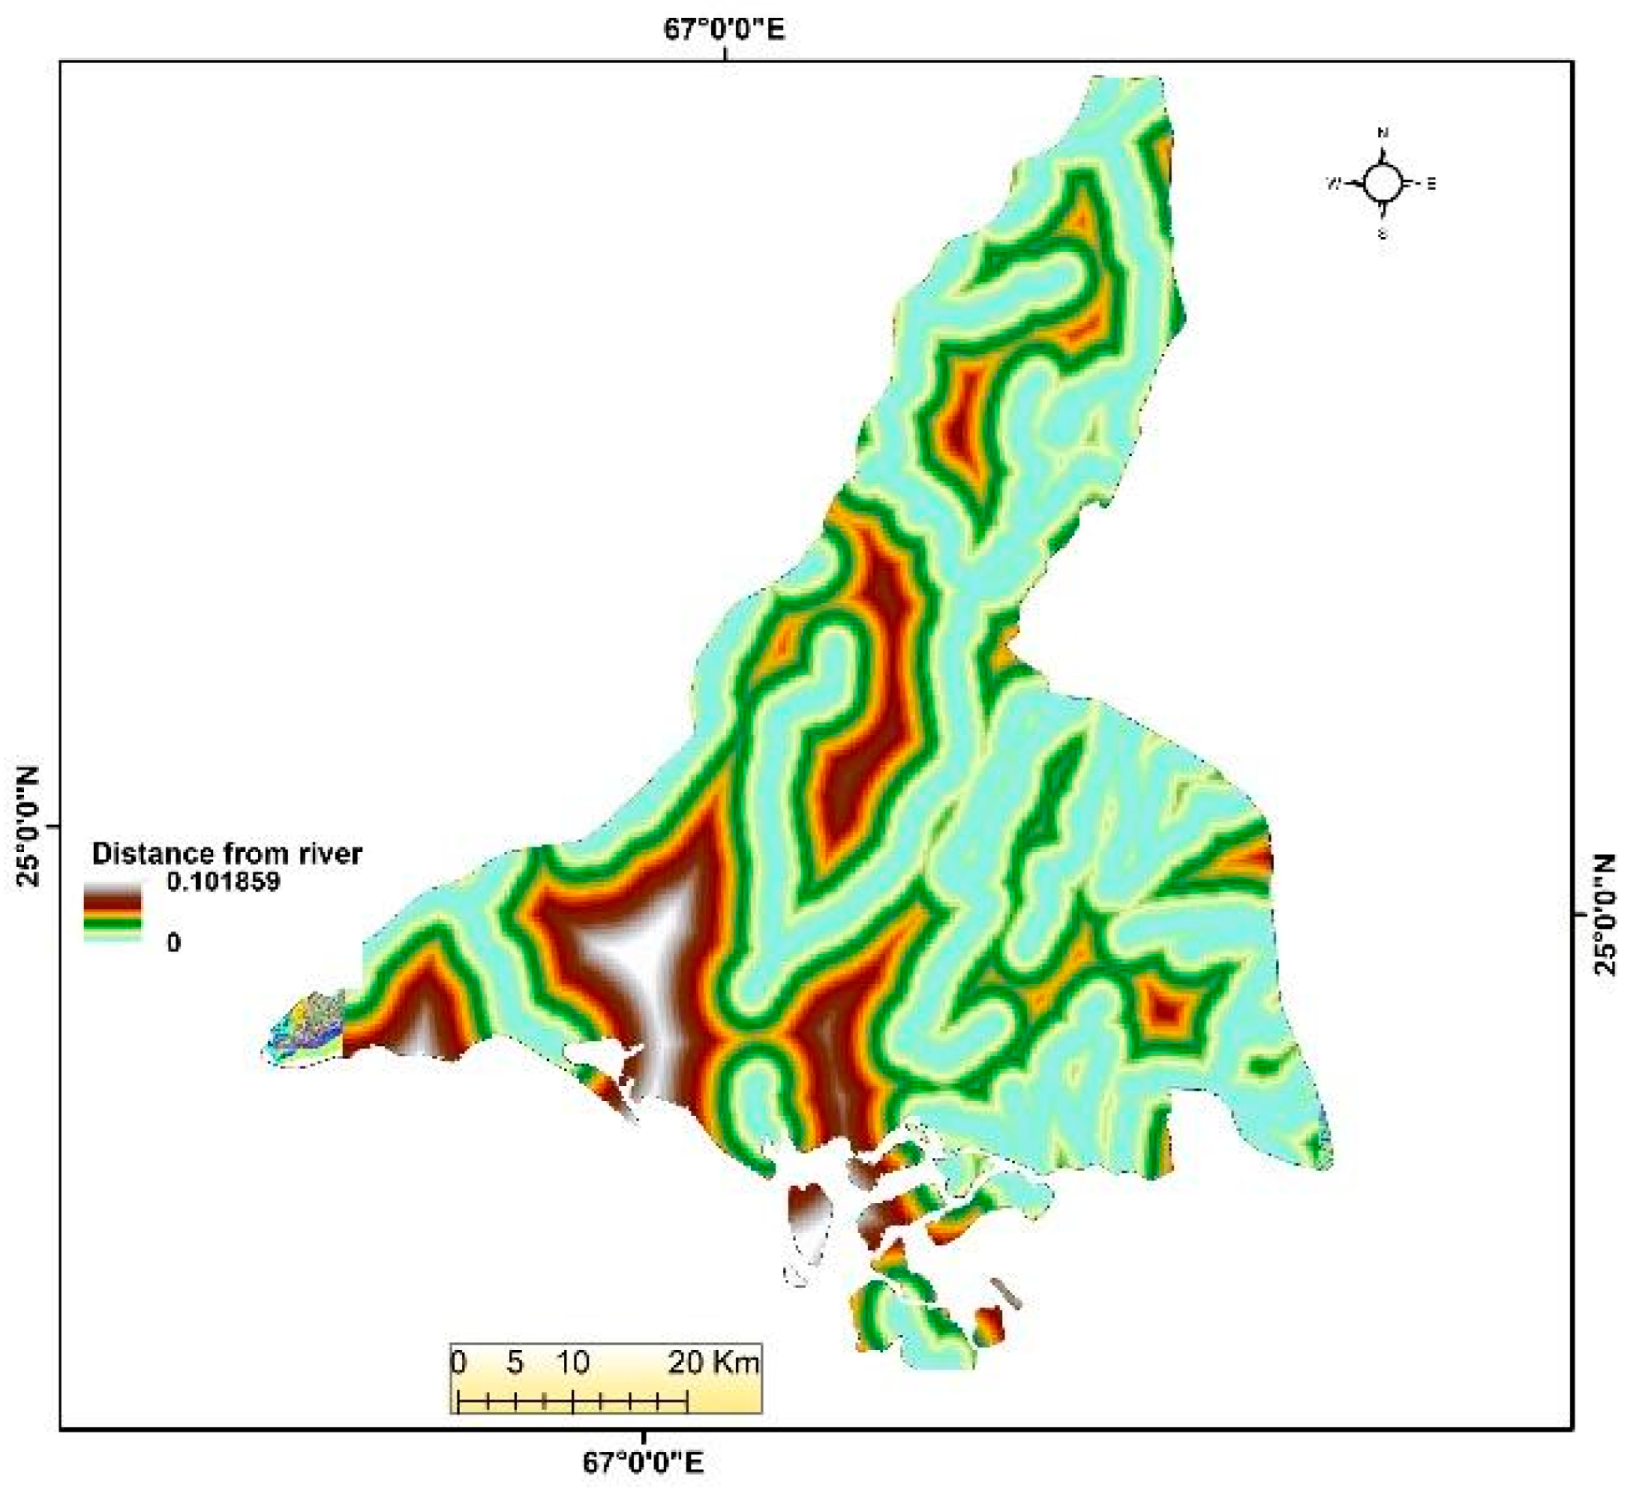
5.6. Distance from Rivers
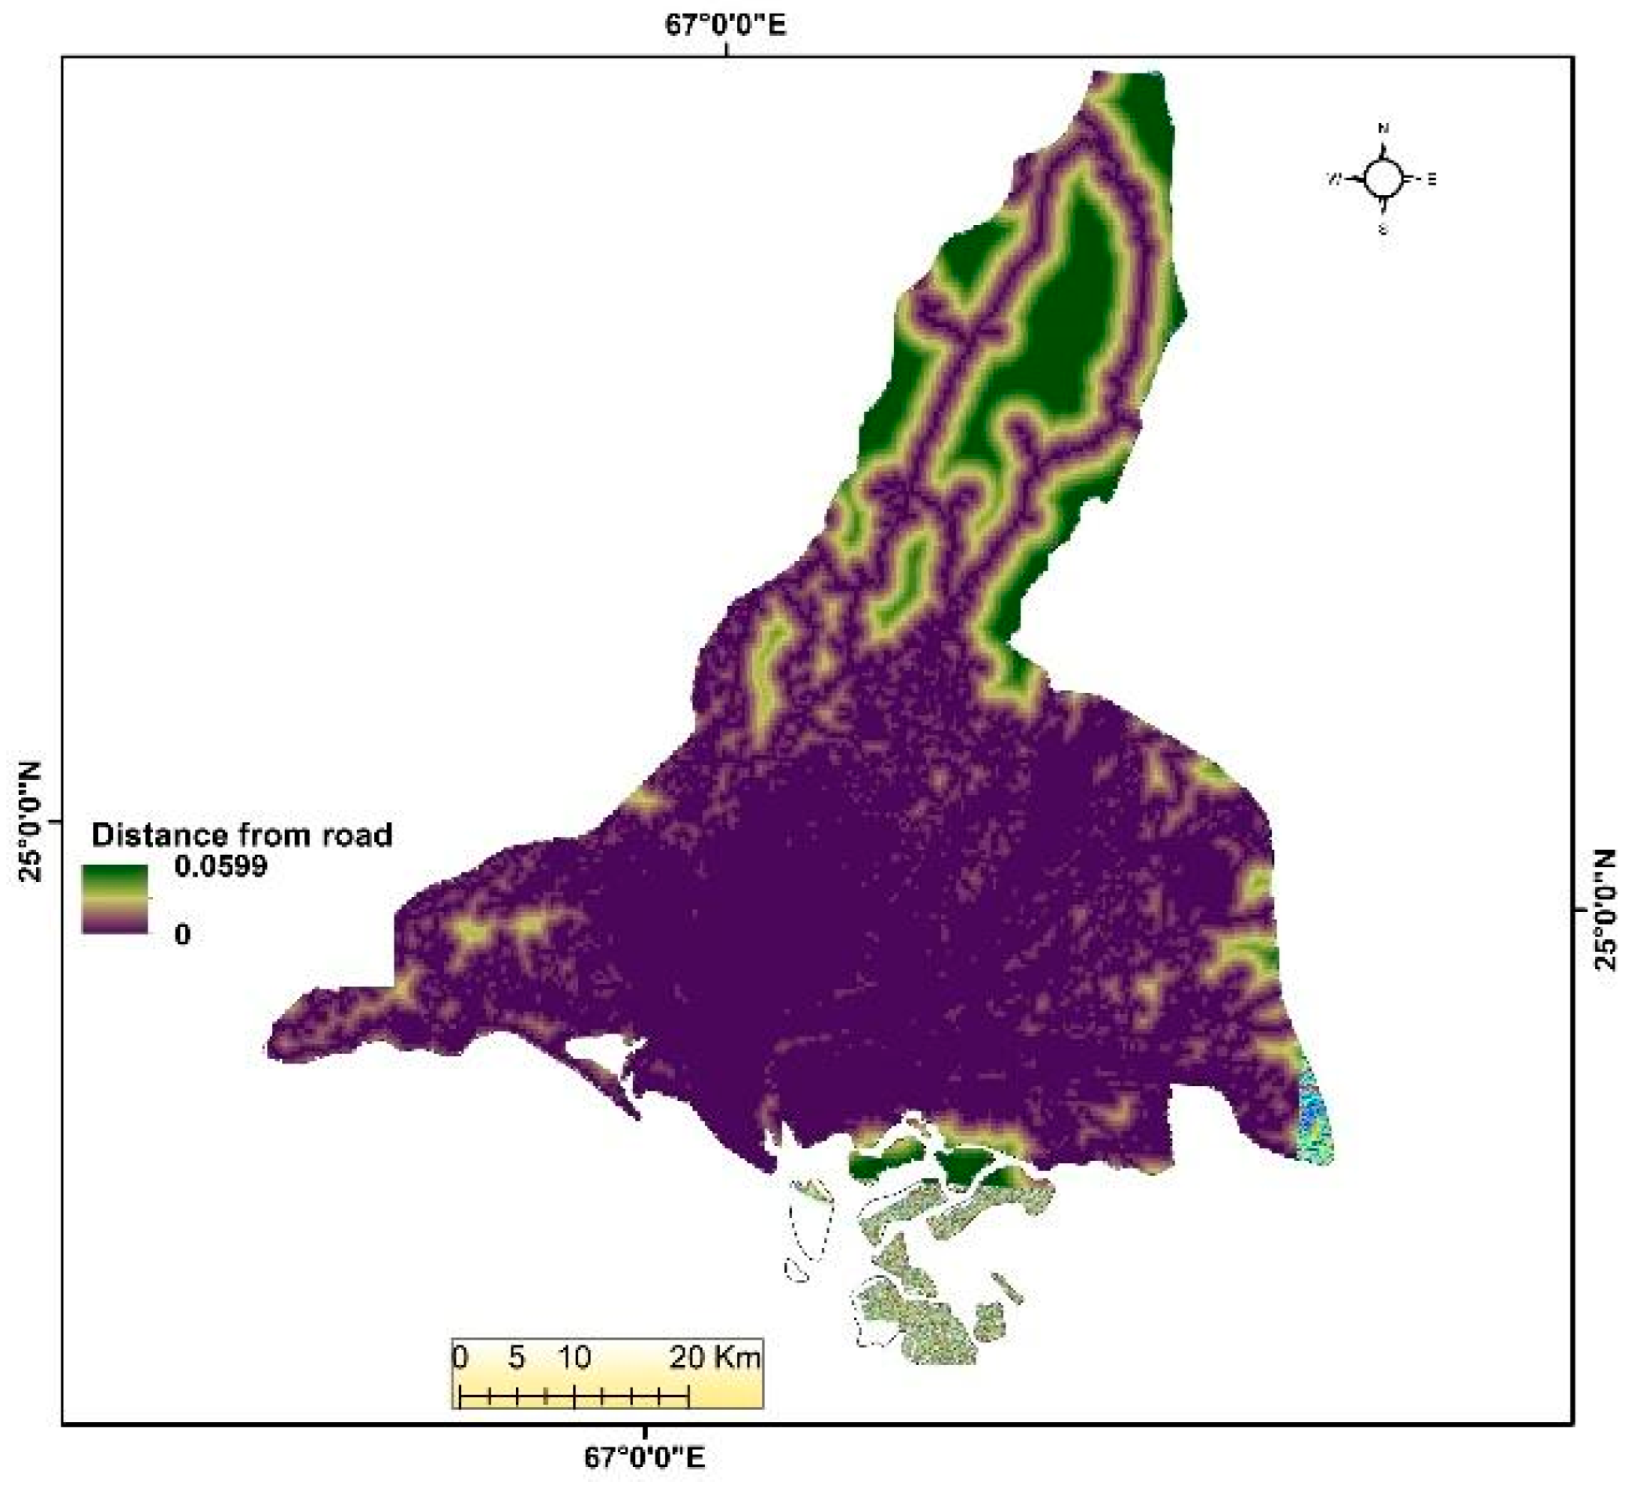
5.7. Distance from Roads
5.8. Drainage Density
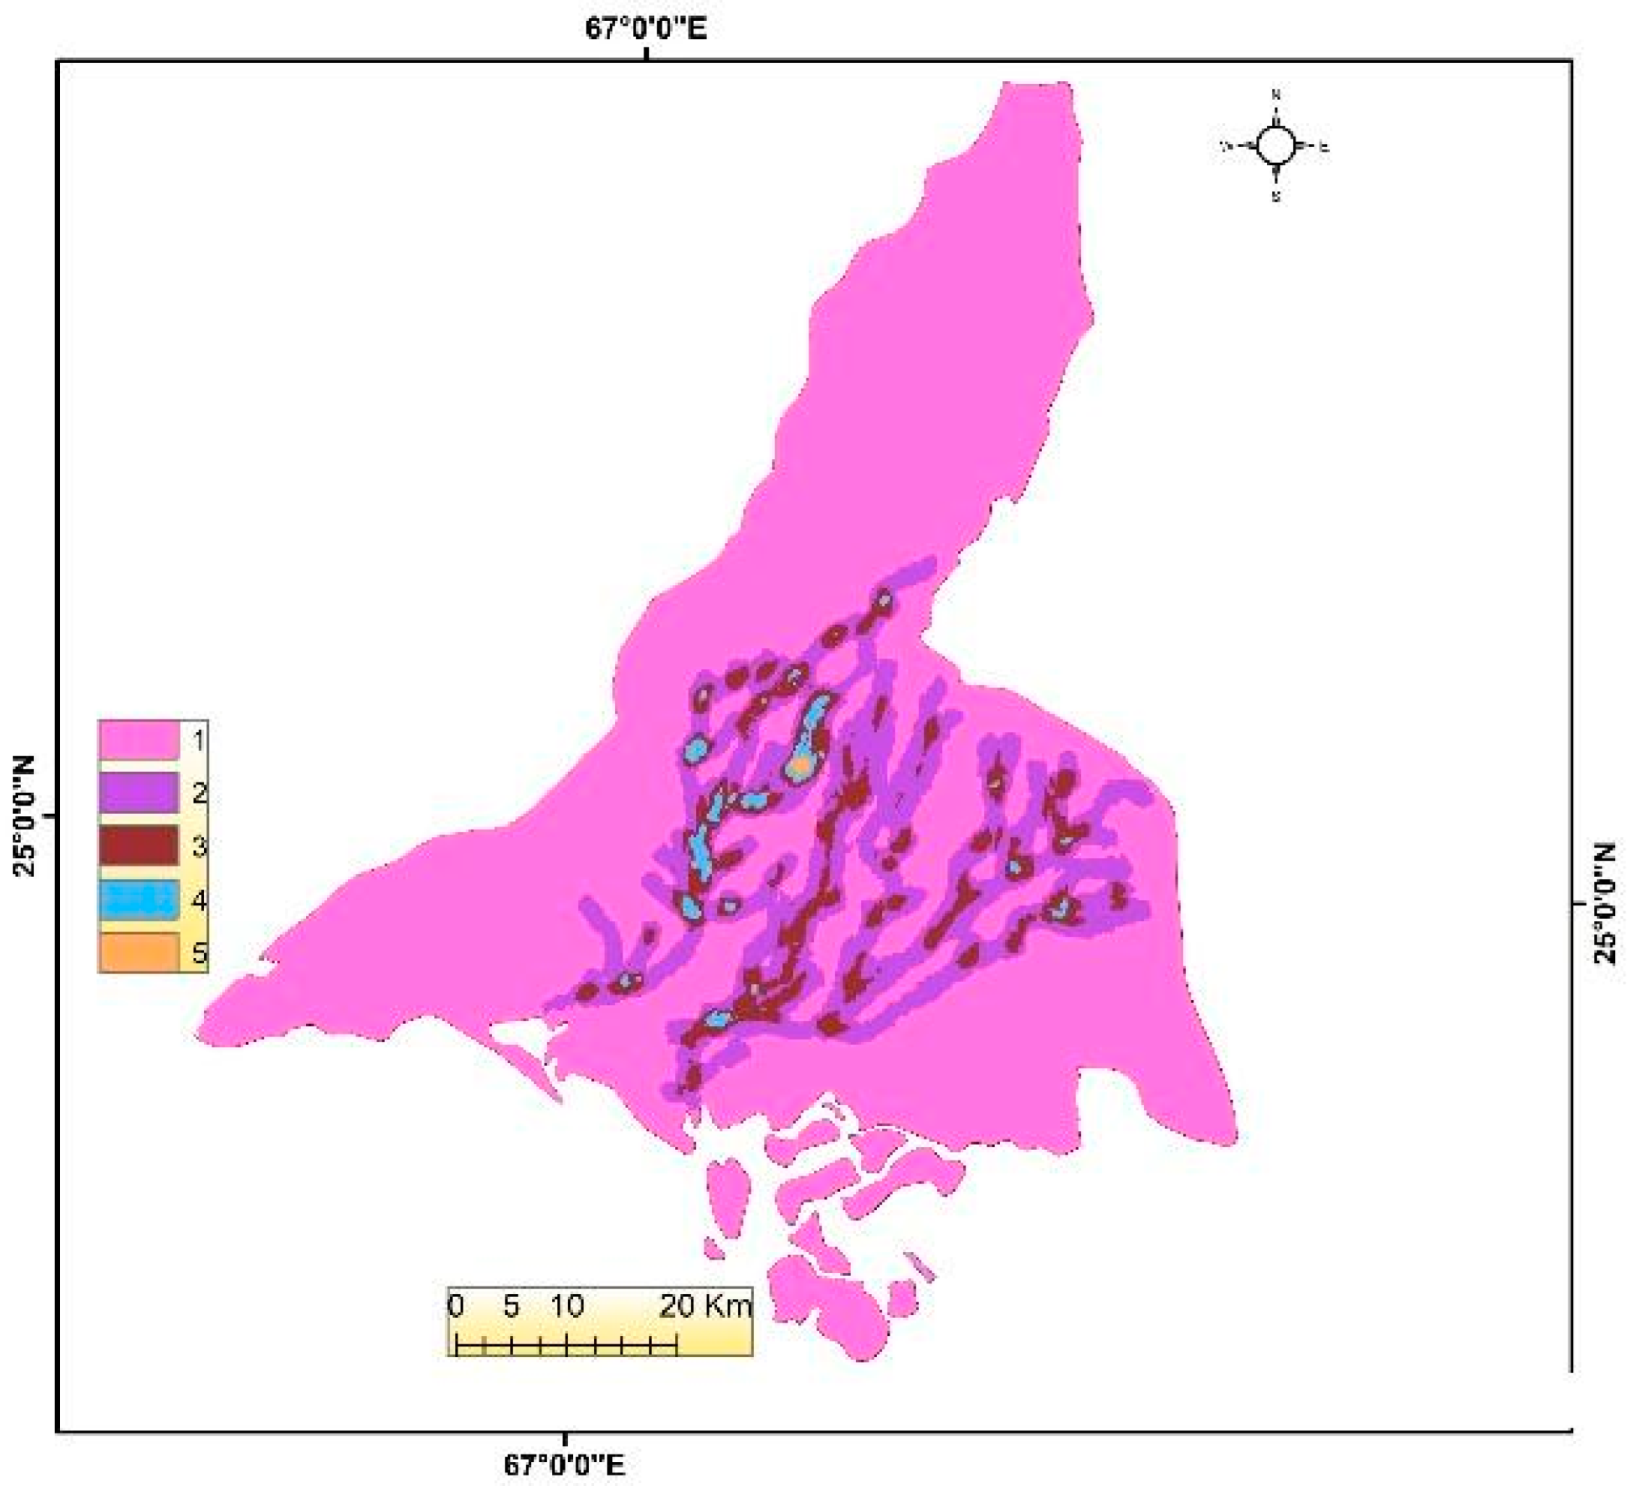
5.9. Flood Risk Assessment Map of Karachi
6. Discussion
7. Conclusions
Author Contributions
Funding
Data Availability Statement
Acknowledgments
Conflicts of Interest
Abbreviations
| GIS | Geographic Information Systems |
| AHP | Analytical Hierarchy Process |
| SC | sponge city |
| NBS | Nature-Based Solutions |
| MCDA | Multi-Criteria Decision Analysis |
| LULC | land use/land cover |
| DEM | Digital Elevation Model |
| SRTM | Shuttle Radar Topography Mission |
| CR | Consistency Ratio |
| CI | Consistency Index |
| DHA | Defense Housing Authority |
References
- Sridhar, K.S.; Mavrotas, G. Urbanization in the Global South: Perspectives and Challenges; Routledge: London, UK, 2021; pp. 1–300. [Google Scholar]
- Kim, H.; Lee, D.-K.; Sung, S. Effect of urban green spaces and flooded area type on flooding probability. Sustainability 2016, 8, 134. [Google Scholar] [CrossRef]
- Kabisch, N.; Frantzeskaki, N.; Pauleit, S.; Naumann, S.; Davis, M.; Artmann, M.; Bonn, A. Nature-based solutions to climate change mitigation and adaptation in urban areas: Perspectives on indicators, knowledge gaps, barriers, and opportunities for action. Ecol. Soc. 2016, 21, 39. [Google Scholar] [CrossRef]
- Wang, J.; Xue, F.; Jing, R.; Lu, Q.; Huang, Y.; Sun, X.; Zhu, W. Regenerating Sponge City to Sponge Watershed through an Innovative Framework for Urban Water Resilience. Sustainability 2021, 13, 5358. [Google Scholar] [CrossRef]
- Wang, W.; Wang, S. Sustainable Stormwater Management for Different Types of Water-Scarce Cities: Environmental Policy Effect of Sponge City Projects in China. Sustainability 2024, 16, 5685. [Google Scholar] [CrossRef]
- Li, H.; Ding, L.; Ren, M.; Li, C.; Wang, H. Sponge city construction in China: A survey of the challenges and opportunities. Water 2017, 9, 594. [Google Scholar] [CrossRef]
- Bah, A.; Hongbo, Z.; Bah, A.; Jufang, H.; Zhumei, L. Study of the applicability of Sponge City concepts for flood mitigation based on LID (low impact development) measures: A case study in Conakry City, Republic of Guinea. Water Sci. Technol. 2023, 88, 901–921. [Google Scholar] [CrossRef] [PubMed]
- Soni, L.; Iqbal, A.; Waheed, F.; Shah, A.A.; Akbar, N. Challenges and considerations of applying nature-based solutions for future mega-cities: Implications for Karachi as a Sponge City. Hum. Settl. Sustain. 2025, 1, 50–61. [Google Scholar] [CrossRef]
- Tirmizi, O.; Khan, S.D.; Mirzaee, S.; Fattahi, H. Hazard potential in Southern Pakistan: A study on the subsidence and neotectonics of Karachi and surrounding areas. Remote Sens. 2023, 15, 1290. [Google Scholar] [CrossRef]
- Khan, M.J.; Hasan, S.A. GIS-based screening model of coastal city Karachi for plantation of biofuel source. Sci. Rep. 2020, 10, 4666. [Google Scholar] [CrossRef]
- Dayo, A.N.; Ahmed, S.F. Urban Heat Island: Its causes and impact for depletion of resources. Int. J. Sci. Tech. Res. 2020, 9, 297–304. [Google Scholar]
- Urban Resource Centre. Evaluating Solutions to Karachi’s Urban Flooding Crisis. Available online: https://urckarachi.org/evaluating-solutions-to-karachis-urban-flooding-crisis/ (accessed on 6 March 2025).
- Chan, F.K.S.; Griffiths, J.A.; Higgitt, D.; Xu, S.; Zhu, F.; Tang, Y.T.; Thorne, C.R. “Sponge City” in China—A breakthrough of planning and flood risk management in the urban context. Land Use Policy 2018, 76, 772–778. [Google Scholar] [CrossRef]
- Alves, R.A.; Dos Santos, M.M.; Rudke, A.P.; Venturin, P.R.F.; Martins, J.A. Site selection for nature-based solutions for stormwater management in urban areas: An approach combining GIS and multi-criteria analysis. J. Environ. Manag. 2024, 359, 120999. [Google Scholar] [CrossRef] [PubMed]
- Guan, X.; Wang, J.; Xiao, F. Sponge city strategy and application of pavement materials in sponge city. J. Clean. Prod. 2021, 303, 127022. [Google Scholar] [CrossRef]
- Frantzeskaki, N.; McPhearson, T. Mainstream nature-based solutions for urban climate resilience. BioScience 2022, 72, 113–115. [Google Scholar] [CrossRef]
- Kim, Y.; Eisenberg, D.A.; Bondank, E.N.; Chester, M.V.; Mascaro, G.; Underwood, B.S. Fail-safe and safe-to-fail adaptation: Decision-making for urban flooding under climate change. Clim. Change 2017, 145, 397–412. [Google Scholar] [CrossRef]
- Tian, Y.; Jim, C.Y.; Tao, Y. Challenges and strategies for greening the compact city of Hong Kong. J. Urban Plan. Dev. 2012, 138, 101–109. [Google Scholar] [CrossRef]
- Manandhar, B.; Cui, S.; Wang, L.; Shrestha, S. Urban flood hazard assessment and management practices in South Asia: A review. Land 2023, 12, 627. [Google Scholar] [CrossRef]
- Doost, Z.H.; Yaseen, Z.M. Allocation of reservoirs sites for runoff management towards sustainable water resources: Case study of Harirud River Basin, Afghanistan. J. Hydrol. 2024, 634, 131042. [Google Scholar] [CrossRef]
- Pourghasemi, H.R.; Razavi-Termeh, S.V.; Kariminejad, N.; Hong, H.; Chen, W. An assessment of metaheuristic approaches for flood assessment. J. Hydrol. 2020, 582, 124536. [Google Scholar] [CrossRef]
- Elkhrachy, I. Flash flood hazard mapping using satellite images and GIS tools: A case study of Najran City, Kingdom of Saudi Arabia (KSA). Egypt. J. Remote Sens. Space Sci. 2015, 18, 261–278. [Google Scholar] [CrossRef]
- Ozkiper, O.; Allegri, E.; Bianconi, A.; Pham, H.V.; Furlan, E.; Simide, R.; Critto, A. A GIS-MCDA approach to map environmental suitability of Posidonia oceanica meadows as blue nature-based solutions in the Mediterranean eco-region. Sci. Total Environ. 2024, 955, 176803. [Google Scholar] [CrossRef]
- Garcia-Cuerva, L.; Berglund, E.Z.; Rivers, L. An integrated approach to place Green Infrastructure strategies in marginalized communities and evaluate stormwater mitigation. J. Hydrol. 2018, 559, 648–660. [Google Scholar] [CrossRef]
- Wang, S.; Wang, H. Extending the Rational Method for assessing and developing sustainable urban drainage systems. Water Res. 2018, 144, 112–125. [Google Scholar] [CrossRef] [PubMed]
- Jiménez Ariza, S.L.; Martínez, J.A.; Muñoz, A.F.; Quijano, J.P.; Rodríguez, J.P.; Camacho, L.A.; Díaz-Granados, M. A multicriteria planning framework to locate and select sustainable urban drainage systems (SUDS) in consolidated urban areas. Sustainability 2019, 11, 2312. [Google Scholar] [CrossRef]
- Panahi, M.R.; Mousavi, S.M.; Rahimzadegan, M. Delineation of groundwater potential zones using remote sensing, GIS, and AHP technique in Tehran–Karaj plain, Iran. Environ. Earth Sci. 2017, 76, 792. [Google Scholar] [CrossRef]
- Rajasekhar, M.; Sudarsana Raju, G.; Bramaiah, C.; Deepthi, P.; Amaravathi, Y.; Siddi Raju, R. Delineation of groundwater potential zones of semi-arid region of YSR Kadapa District, Andhra Pradesh, India using RS, GIS and analytic hierarchy process. Remote Sens. Land 2018, 2, 76–86. [Google Scholar]
- Pourghasemi, H.R.; Kariminejad, N.; Amiri, M.; Edalat, M.; Zarafshar, M.; Blaschke, T.; Cerda, A. Assessing and mapping multi-hazard risk susceptibility using a machine learning technique. Sci. Rep. 2020, 10, 3203. [Google Scholar] [CrossRef]
- Pradhan, B. Flood susceptible mapping and risk area delineation using logistic regression, GIS and remote sensing. J. Spat. Hydrol. 2010, 9, 2. [Google Scholar]
- Youssef, A.M.; Pradhan, B.; Hassan, A.M. Flash flood risk estimation along the St. Katherine road, southern Sinai, Egypt using GIS based morphometry and satellite imagery. Environ. Earth Sci. 2011, 62, 611–623. [Google Scholar] [CrossRef]
- Jelokhani-Niaraki, M.; Malczewski, J. Decision complexity and consensus in Web-based spatial decision making: A case study of site selection problem using GIS and multicriteria analysis. Cities 2015, 45, 60–70. [Google Scholar] [CrossRef]
- Altafi Dadgar, M.; Zeaieanfirouzabadi, P.; Dashti, M.; Porhemmat, R. Extracting of prospective groundwater potential zones using remote sensing data, GIS, and a probabilistic approach in Bojnourd basin, NE of Iran. Arab. J. Geosci. 2017, 10, 114. [Google Scholar] [CrossRef]
- Dano, U.L.; Balogun, A.L.; Matori, A.N.; Wan Yusouf, K.; Abubakar, I.R.; Said Mohamed, M.A.; Pradhan, B. Flood susceptibility mapping using GIS-based analytic network process: A case study of Perlis, Malaysia. Water 2019, 11, 615. [Google Scholar] [CrossRef]
- Nachappa, T.G.; Piralilou, S.T.; Gholamnia, K.; Ghorbanzadeh, O.; Rahmati, O.; Blaschke, T. Flood susceptibility mapping with machine learning, multi-criteria decision analysis and ensemble using Dempster Shafer Theory. J. Hydrol. 2020, 590, 125275. [Google Scholar] [CrossRef]
- Souissi, D.; Zouhri, L.; Hammami, S.; Msaddek, M.H.; Zghibi, A.; Dlala, M. GIS-based MCDM–AHP modeling for flood susceptibility mapping of arid areas, southeastern Tunisia. Geocarto Int. 2020, 35, 991–1017. [Google Scholar] [CrossRef]
- Das, B.; Pal, S.C. Assessment of groundwater vulnerability to over-exploitation using MCDA, AHP, fuzzy logic and novel ensemble models: A case study of Goghat-I and II blocks of West Bengal, India. Environ. Earth Sci. 2020, 79, 104. [Google Scholar] [CrossRef]
- Jhariya, D.; Kumar, T.; Dewangan, R.; Pal, D.; Dewangan, P.K. Assessment of groundwater quality index for drinking purpose in the Durg district, Chhattisgarh using GIS and MCDA techniques. J. Geol. Soc. India 2017, 89, 453–459. [Google Scholar] [CrossRef]
- Andualem, T.G.; Demeke, G.G. Groundwater potential assessment using GIS and remote sensing: A case study of Guna Tana landscape, upper Blue Nile Basin, Ethiopia. J. Hydrol. Reg. Stud. 2019, 24, 100610. [Google Scholar] [CrossRef]
- Arulbalaji, P.; Padmalal, D.; Sreelash, K. GIS and AHP techniques based delineation of groundwater potential zones: A case study from southern Western Ghats, India. Sci. Rep. 2019, 9, 2082. [Google Scholar] [CrossRef]
- Kumar, T.; Gautam, A.K.; Kumar, T. Appraising the accuracy of GIS-based multi-criteria decision making technique for delineation of groundwater potential zones. Water Resour. Manag. 2014, 28, 4449–4466. [Google Scholar] [CrossRef]
- Yang, Y.; Guo, H.; Chen, L.; Liu, X.; Gu, M.; Pan, W. Multiattribute decision making for the assessment of disaster resilience in the Three Gorges Reservoir Area. Ecol. Soc. 2020, 25, 5. [Google Scholar] [CrossRef]
- Asare, P.; Atun, F.; Pfeffer, K. Spatial multi-criteria analysis for discovering nature-based solutions location for urban flood mitigation in Accra. Appl. Spat. Anal. Policy 2024, 17, 207–239. [Google Scholar] [CrossRef]
- Pacetti, T.; Cioli, S.; Castelli, G.; Bresci, E.; Pampaloni, M.; Pileggi, T.; Caporali, E. Planning Nature-Based Solutions against urban pluvial flooding in heritage cities: A spatial multi-criteria approach for the city of Florence (Italy). J. Hydrol. Reg. Stud. 2022, 41, 101081. [Google Scholar] [CrossRef]
- Pittman, S.J.; Stamoulis, K.A.; Antonopoulou, M.; Das, H.S.; Shahid, M.; Delevaux, J.M.; Mateos-Molina, D. Rapid site selection to prioritize coastal seascapes for nature-based solutions with multiple benefits. Front. Mar. Sci. 2022, 9, 832480. [Google Scholar] [CrossRef]
- Roa, O.H.; Cotti, D.; Aste, N.; Bustillos-Ardaya, A.; Schneiderbauer, S.; Soto, I.T.; Walz, Y. Deriving targeted intervention packages of nature-based solutions for climate change adaptation and disaster risk reduction: A geospatial multi-criteria approach for building resilience in the Puna region, Peru. Nat. Based Solut. 2023, 4, 100090. [Google Scholar]
- Guida, R.J.; Swanson, T.L.; Remo, J.W.; Kiss, T. Strategic floodplain reconnection for the Lower Tisza River, Hungary: Opportunities for flood-height reduction and floodplain-wetland reconnection. J. Hydrol. 2015, 521, 274–285. [Google Scholar] [CrossRef]
- Highfield, W.E.; Brody, S.D.; Shepard, C. The effects of estuarine wetlands on flood losses associated with storm surge. Ocean Coast. Manag. 2018, 157, 50–55. [Google Scholar] [CrossRef]
- Wu, Q.; Lane, C.R.; Li, X.; Zhao, K.; Zhou, Y.; Clinton, N.; Lang, M.W. Integrating LiDAR data and multi-temporal aerial imagery to map wetland inundation dynamics using Google Earth Engine. Remote Sens. Environ. 2019, 228, 1–13. [Google Scholar] [CrossRef]
- Mubeen, A.; Ruangpan, L.; Vojinovic, Z.; Sanchez Torrez, A.; Plavšić, J. Planning and suitability assessment of large-scale nature-based solutions for flood-risk reduction. Water Resour. Manag. 2021, 35, 3063–3081. [Google Scholar] [CrossRef]
- Nikolaos, S.; Kleomenis, K.; Elias, D.; Panagiotis, S.; Panagiota, L.; Vagelis, P.; Christos, C. A robust remote sensing–spatial modeling–remote sensing (RMR) approach for flood hazard assessment. In Spatial Modeling in GIS and R for Earth and Environmental Sciences; Elsevier: Amsterdam, The Netherlands, 2019; pp. 391–410. [Google Scholar]
- Guerrero, P.; Haase, D.; Albert, C. Locating spatial opportunities for nature-based solutions: A river landscape application. Water 2018, 10, 1869. [Google Scholar] [CrossRef]
- Chen, J.; Hill, A.A.; Urbano, L.D. A GIS-based model for urban flood inundation. J. Hydrol. 2009, 373, 184–192. [Google Scholar] [CrossRef]
- Topal, T.U.; Baykal, T.U.Ğ.B.A. Monitoring the changes of Lake Uluabat Ramsar site and its surroundings in the 1985–2021 period using RS and GIS methods. Glob. NEST J. 2023, 25, 103–114. [Google Scholar]
- Nguyen, T.T.; Ngo, H.H.; Guo, W.; Wang, X.C.; Ren, N.; Li, G.; Liang, H. Implementation of a specific urban water management—Sponge city. Sci. Total Environ. 2019, 652, 147–162. [Google Scholar] [CrossRef] [PubMed]
- Luo, K.; Wang, Z.; Sha, W.; Wu, J.; Wang, H.; Zhu, Q. Integrating sponge city concept and neural network into land suitability assessment: Evidence from a satellite town of Shenzhen metropolitan area. Land 2021, 10, 872. [Google Scholar] [CrossRef]
- Ullah, S.; Ali, U.; Rashid, M.; Haider, S.; Kisi, O.; Vishwakarma, D.K.; Raza, A.; Alataway, A.; Dewidar, A.Z.; Mattar, M.A. Evaluating land use and climate change impacts on Ravi River flows using GIS and hydrological modeling approach. Sci. Rep. 2024, 14, 22080. [Google Scholar] [CrossRef] [PubMed]
- Wang, Y.; Hong, H.; Chen, W.; Li, S.; Pamučar, D.; Gigović, L.; Drobnjak, S.; Tien Bui, D.; Duan, H. A hybrid GIS multi-criteria decision-making method for flood susceptibility mapping at Shangyou, China. Remote Sens. 2018, 11, 62. [Google Scholar] [CrossRef]
- El-Magd, S.A.A. Flash flood hazard mapping using GIS and bivariate statistical method at Wadi Bada’a, Gulf of Suez, Egypt. J. Geosci. Environ. Prot. 2019, 7, 372–385. [Google Scholar] [CrossRef]
- Khoirunisa, N.; Ku, C.-Y.; Liu, C.-Y. A GIS-based artificial neural network model for flood susceptibility assessment. Int. J. Environ. Res. Public Health 2021, 18, 1072. [Google Scholar] [CrossRef]
- Ha, H.; Bui, Q.D.; Nguyen, H.D.; Pham, B.T.; Lai, T.D.; Luu, C. A practical approach to flood hazard, vulnerability, and risk assessing and mapping for Quang Binh province. Environ. Dev. Sustain. 2023, 25, 1101–1130. [Google Scholar] [CrossRef]
- Samanta, S.; Pal, D.K.; Palsamanta, B. Flood susceptibility analysis through remote sensing, GIS and frequency ratio model. Appl. Water Sci. 2018, 8, 66. [Google Scholar] [CrossRef]
- Sarkar, D.; Mondal, P. Flood vulnerability mapping using frequency ratio (FR) model: A case study on Kulik river basin, Indo-Bangladesh Barind region. Appl. Water Sci. 2020, 10, 17. [Google Scholar] [CrossRef]
- Thongley, T.; Vansarochana, C. Landslide susceptibility assessment using frequency ratio model at Ossey watershed area in Bhutan. Eng. Appl. Sci. Res. 2021, 48, 56–64. [Google Scholar] [CrossRef]
- Gapihan, A.; Malkawi, F. Transforming Karachi into a more livable city begins with public spaces. In World Bank Blogs; World Bank: Washington, DC, USA, 2021; Available online: https://blogs.worldbank.org/sustainablecities/transforming-karachi-morelivable-city-begins-public-spaces (accessed on 8 April 2025).
- Baqa, M.F.; Lu, L.; Chen, F.; Nawaz-ul-Huda, S.; Pan, L.; Tariq, A.; Li, Q. Characterizing spatiotemporal variations in the urban thermal environment related to land cover changes in Karachi, Pakistan, from 2000 to 2020. Remote Sens. 2022, 14, 2164. [Google Scholar] [CrossRef]
- Wells, C.; Petty, C.; Saggioro, E.; Cornforth, R.J. Pakistan climate change impact storylines based on existing literature. In Zenodo; Technical Report; Walker Institute, University of Reading: Reading, UK, 2023; pp. 1–117. [Google Scholar]
- Gajani, A.M. Spatial Patterns of Urban Heat Islands and Green Space Cooling Effects in the Urban Microclimate of Karachi. 2024; Unpublished work. [Google Scholar]
- Sajjad, M.; Chan, J.C.; Chopra, S.S. Rethinking disaster resilience in high-density cities: Towards an urban resilience knowledge system. Sustain. Cities Soc. 2021, 69, 102850. [Google Scholar] [CrossRef]
- Mesa-Mingorance, J.L.; Ariza-López, F.J. Accuracy assessment of digital elevation models (DEMs): A critical review of practices of the past three decades. Remote Sens. 2020, 12, 2630. [Google Scholar] [CrossRef]
- Saaty, R.W. The analytic hierarchy process—What it is and how it is used. Math. Model. 1987, 9, 161–176. [Google Scholar] [CrossRef]
- Al-Kindi, K.M.; Alabri, Z. Investigating the role of the key conditioning factors in flood susceptibility mapping through machine learning approaches. Earth Syst. Environ. 2024, 8, 63–81. [Google Scholar] [CrossRef]
- Saaty, T.L. Decision Making with Dependence and Feedback: The Analytic Network Process, 1st ed.; RWS Publications: Pittsburgh, PA, USA, 1996; Volume 4922. [Google Scholar]
- Senan, C.P.; Ajin, R.S.; Danumah, J.H.; Costache, R.; Arabameri, A.; Rajaneesh, A.; Sajinkumar, K.S.; Kuriakose, S.L. Flood vulnerability of a few areas in the foothills of the Western Ghats: A comparison of AHP and F-AHP models. Stoch. Environ. Res. Risk Assess. 2023, 37, 527–556. [Google Scholar] [CrossRef]
- Iftikhar, A. Flood Hazard and Vulnerability Mapping Using Geospatial Techniques: A Case Study of Karachi. Master’s Thesis, National University of Sciences and Technology, Islamabad, Pakistan, 2021. [Google Scholar]
- Daily Times. Sporadic Rains in Karachi Submerge Parts of City Causing Prolonged Power Outages. Daily Times, 12 July 2022. Available online: https://dailytimes.com.pk/974992/sporadic-rains-in-karachi-submerge-parts-of-city-causing-prolonged-power-outages/ (accessed on 17 May 2023).
- The News International. Roads Are Submerged by Rainwater with No Drainage System in Place. The News International, 30 July 2019. Available online: https://www.thenews.com.pk/print/505499-roads-submerged-by-rainwater-with-no-drainage-system-in-place (accessed on 27 March 2025).
- The Express Tribune. CM to LG Dept: Clean City’s Nullahs Before Monsoon Season. The Express Tribune. 3 May 2021. Available online: https://tribune.com.pk/story/2298786/cm-to-lg-dept-clean-citys-nullahs-before-monsoon-season (accessed on 27 March 2025).
- Lee, S.; Rezaie, F. Data used for GIS-based flood susceptibility mapping. Data Geol. Ecol. Oceanogr. Space Sci. Polar Sci. 2022, 41, 1–15. [Google Scholar] [CrossRef]
- Allafta, H.; Opp, C. GIS-based multi-criteria analysis for flood-prone areas mapping in the transboundary Shatt Al-Arab basin, Iraq-Iran. Geomatics Nat. Hazards Risk 2021, 12, 2087–2116. [Google Scholar] [CrossRef]
- Rana, S.S.; Habib, S.A.; Sharifee, M.N.H.; Sultana, N.; Rahman, S.H. Flood risk mapping of the flood-prone Rangpur division of Bangladesh using remote sensing and multi-criteria analysis. Nat. Hazards Res. 2024, 4, 20–31. [Google Scholar] [CrossRef]
- Taromideh, F.; Fazloula, R.; Choubin, B.; Emadi, A.; Berndtsson, R. Urban flood-risk assessment: Integration of decision-making and machine learning. Sustainability 2022, 14, 4483. [Google Scholar] [CrossRef]
- Wang, Z.; Lai, C.; Chen, X.; Yang, B.; Zhao, S.; Bai, X. Flood hazard risk assessment model based on random forest. J. Hydrol. 2015, 527, 1130–1141. [Google Scholar] [CrossRef]
- Zevenbergen, C.; Fu, D.; Pathirana, A. Transitioning to sponge cities: Challenges and opportunities to address urban water problems in China. Water 2018, 10, 1230. [Google Scholar] [CrossRef]
- Sun, T.; Cheng, W.; Abdelkareem, M.; Al-Arifi, N. Mapping prospective areas of water resources and monitoring land use/land cover changes in an arid region using remote sensing and GIS techniques. Water 2022, 14, 2435. [Google Scholar] [CrossRef]
- Liu, B.; Xu, C.; Yang, J.; Lin, S.; Wang, X. Effect of land use and drainage system changes on urban flood spatial distribution in Handan City: A case study. Sustainability 2022, 14, 14610. [Google Scholar] [CrossRef]


| Variable | Data Source | Description |
|---|---|---|
| Elevation | DEM (SRTM) | Represents the terrain height, influencing water accumulation |
| Slope | Derived from DEM | Determines the rate of surface runoff |
| Aspect | Derived from DEM | Indicates the direction of slope exposure, affecting water flow |
| Rainfall | ERA 5 | Represents precipitation intensity, a key factor in flooding |
| Drainage Density | Hydrography datasets | Indicates the concentration of rivers/streams in an area |
| Distance from the River | Hydrography datasets | Proximity to rivers increases flood susceptibility |
| Distance from Road | Road network data | Areas near roads may have altered drainage patterns |
| Land Use/Land Cover (LULC)1990 & 2024 | (Landsat 5 and 8) | Represents land cover types affecting runoff and infiltration |
| Factors | Elevation | Slope | Aspect | Drainage Density | Rainfall | Distance from Rivers | Distance from Roads | LULC |
|---|---|---|---|---|---|---|---|---|
| Elevation | 0.0323 | 0.0435 | 0.0314 | 0.036 | 0.0279 | 0.0305 | 0.0317 | 0.0286 |
| Slope | 0.0323 | 0.0435 | 0.0519 | 0.036 | 0.0423 | 0.0388 | 0.0452 | 0.0571 |
| Aspect | 0.1613 | 0.1304 | 0.1572 | 0.1092 | 0.1691 | 0.1385 | 0.2262 | 0.1714 |
| Drainage Density | 0.0968 | 0.1304 | 0.1572 | 0.1092 | 0.0845 | 0.0914 | 0.1131 | 0.1143 |
| Rainfall | 0.0968 | 0.087 | 0.0786 | 0.1092 | 0.0845 | 0.0914 | 0.0747 | 0.0571 |
| Distance from Rivers | 0.2903 | 0.3043 | 0.3145 | 0.3275 | 0.2536 | 0.277 | 0.2262 | 0.2857 |
| Distance from Roads | 0.2258 | 0.2174 | 0.1572 | 0.2183 | 0.2536 | 0.277 | 0.2262 | 0.2286 |
| LULC | 0.0645 | 0.0435 | 0.0519 | 0.0546 | 0.0845 | 0.0554 | 0.0566 | 0.0571 |
| Variable | Weight | Rank |
|---|---|---|
| Rainfall | 0.2849 | 1st |
| Drainage Density | 0.2255 | 2nd |
| Elevation | 0.1579 | 3rd |
| Slope | 0.1121 | 4th |
| LULC | 0.0849 | 5th |
| Aspect | 0.0585 | 6th |
| Distance from Rivers | 0.0434 | 7th |
| Distance from Roads | 0.0327 | 8th |
Disclaimer/Publisher’s Note: The statements, opinions and data contained in all publications are solely those of the individual author(s) and contributor(s) and not of MDPI and/or the editor(s). MDPI and/or the editor(s) disclaim responsibility for any injury to people or property resulting from any ideas, methods, instructions or products referred to in the content. |
© 2025 by the authors. Licensee MDPI, Basel, Switzerland. This article is an open access article distributed under the terms and conditions of the Creative Commons Attribution (CC BY) license (https://creativecommons.org/licenses/by/4.0/).
Share and Cite
Iqbal, A.; Soni, L.; Qazi, A.W.; Nazir, H. Utilizing Remote Sensing for Sponge City Development: Enhancing Flood Management and Urban Resilience in Karachi. Remote Sens. 2025, 17, 1818. https://doi.org/10.3390/rs17111818
Iqbal A, Soni L, Qazi AW, Nazir H. Utilizing Remote Sensing for Sponge City Development: Enhancing Flood Management and Urban Resilience in Karachi. Remote Sensing. 2025; 17(11):1818. https://doi.org/10.3390/rs17111818
Chicago/Turabian StyleIqbal, Asifa, Lubaina Soni, Ammad Waheed Qazi, and Humaira Nazir. 2025. "Utilizing Remote Sensing for Sponge City Development: Enhancing Flood Management and Urban Resilience in Karachi" Remote Sensing 17, no. 11: 1818. https://doi.org/10.3390/rs17111818
APA StyleIqbal, A., Soni, L., Qazi, A. W., & Nazir, H. (2025). Utilizing Remote Sensing for Sponge City Development: Enhancing Flood Management and Urban Resilience in Karachi. Remote Sensing, 17(11), 1818. https://doi.org/10.3390/rs17111818