Article

Evaluation of MODIS and VIIRS BRDF Parameter Differences and Their Impacts on the Derived Indices

1
State Key Laboratory of Remote Sensing and Digital Earth, Faculty of Geographical Science, Beijing Normal University, Beijing 100875, China
2
Institute of Remote Sensing Science and Engineering, Faculty of Geographical Science, Beijing Normal University, Beijing 100875, China
3
Beijing Engineering Research Center for Global Land Remote Sensing Products, Faculty of Geographical Science, Beijing Normal University, Beijing 100875, China
4
School of Remote Sensing and Information Engineering, Wuhan University, Wuhan 430079, China
*
Author to whom correspondence should be addressed.
Remote Sens. 2025, 17(11), 1803; https://doi.org/10.3390/rs17111803
Submission received: 16 April 2025 / Revised: 16 May 2025 / Accepted: 19 May 2025 / Published: 22 May 2025
(This article belongs to the Special Issue Remote Sensing of Solar Radiation Absorbed by Land Surfaces)

Abstract

:
Multi-angle remote sensing observations play an important role in the remote sensing of solar radiation absorbed by land surfaces. Currently, the Moderate Resolution Imaging Spectroradiometer (MODIS) and Visible Infrared Imaging Radiometer Suite (VIIRS) teams have successively applied the Ross–Li kernel-driven bidirectional reflectance distribution function (BRDF) model to integrate multi-angle observations to produce long time series BRDF model parameter products (MCD43 and VNP43), which can be used for the inversion of various surface parameters and the angle correction of remote sensing data. Even though the MODIS and VIIRS BRDF products originate from sensors and algorithms with similar designs, the consistency between BRDF parameters for different sensors is still unknown, and this likely affects the consistency and accuracy of various downstream parameter inversions. In this study, we applied BRDF model parameter time-series data from the overlapping period of the MODIS and VIIRS services to systematically analyze the temporal and spatial differences between the BRDF parameters and derived indices of the two sensors from the site scale to the region scale in the red band and NIR band, respectively. Then, we analyzed the sensitivity of the BRDF parameters to variations in Normalized Difference Hotspot–Darkspot (NDHD) and examined the spatiotemporal distribution of zero-valued pixels in the BRDF parameter products generated by the constraint method in the Ross–Li model from both sensors, assessing their potential impact on NDHD derivation. The results confirm that among the three BRDF parameters, the isotropic scattering parameters of MODIS and VIIRS are more consistent, whereas the volumetric and geometric-optical scattering parameters are more sensitive and variable; this performance is more pronounced in the red band. The indices derived from the MODIS and VIIRS BRDF parameters were compared, revealing increasing discrepancies between the albedo and typical directional reflectance and the NDHD. The isotropic scattering parameter and the volumetric scattering parameter show responses that are very sensitive to increases in the equal interval of the NDHD, indicating that the differences between the MODIS and VIIRS products may strongly influence the consistency of NDHD estimation. In addition, both MODIS and VIIRS have a large proportion of zero-valued pixels (volumetric and geometric-optical parameter layers), whereas the spatiotemporal distribution of zero-valued pixels in VIIRS is more widespread. While the zero-valued pixels have a minor influence on reflectance and albedo estimation, such pixels should be considered with attention to the estimation accuracy of the vegetation angular index, which relies heavily on anisotropic characteristics, e.g., the NDHD. This study reveals the need in optimizing the Clumping Index (CI)-NDHD algorithm to produce VIIRS CI product and highlights the importance of considering BRDF product quality flags for users in their specific applications. The method used in this study also helps improve the theoretical framework for cross-sensor product consistency assessment and clarify the uncertainty in high-precision ecological monitoring and various remote sensing applications.

1. Introduction

The bidirectional reflectance distribution function (BRDF), which parametrically describes the pattern of surface reflectance with respect to the observation angle [1], is the core theoretical framework for characterizing the anisotropic reflectance properties of features in quantitative remote sensing. However, it is challenging to directly construct the complete BRDF shape because remote sensors can acquire reflection information from only limited angles [2]. The BRDF model can be applied to extend the limited remote sensing data to the whole observation space to reconstruct the anisotropic reflectance variations in the hemispherical space, which provides an effective and convenient way to quantitatively estimate surface parameters such as the leaf area index (LAI), clumping index (CI), reflectance, and albedo [3,4,5,6,7,8,9,10]. The spectral and angular information in the BRDF model contributes to the accurate inversion of surface characteristics and supports the application of remote sensing data in land cover classification, radiation balance, ecosystem monitoring, etc. [11].
Land surface BRDF models are generally categorized into empirical, semi-empirical, and physical models. The semi-empirical BRDF model integrates the strengths of both empirical and physical models by parameterizing certain complex factors within the physical model, thereby maintaining computational efficiency while retaining physical interpretability. For example, the semi-empirical kernel-driven BRDF model represents surface reflectance as a weighted sum of kernel functions, which are formulated on the basis of approximate physical assumptions that decompose anisotropic reflectance into isotropic scattering, volumetric scattering, and geometric-optical scattering components. The isotropic scattering kernel describes the scattering characteristics of the Lambertian surface, the volumetric scattering kernel represents the anisotropic scattering of the horizontal homogeneous layers [12], and geometrical-optical scattering kernels simulate scattering variations induced by the three-dimensional structure of the feature, interprojected shadows, etc. [13,14]. Over the years, various kernel functions have been developed and validated to address diverse remote sensing applications, including Rossthick, Rossthin, LiSparse, LiDense, and LiTransit [13,14,15,16,17]. These kernel functions and the BRDF models of kernel combinations have been validated through numerous observations to confirm robust BRDF simulation and inversion capabilities in different application scenarios [18,19,20,21,22]. Therefore, the kernel-driven BRDF model serves as the main algorithm for deriving surface albedo and directional reflectance from multi-angle remote sensing observations such as the Polarization and Directionality of the Earth’s Reflectances (POLDER), MODIS, Multi-angle Imaging Spectroradiometer (MISR), VIIRS, and Earth Polychromatic Imaging Camera (EPIC) [3,23,24,25,26,27].
Since 2000, the MODIS team has generated the BRDF, Albedo, and NBAR product suite via a kernel-driven BRDF model that uses the RossThick-LiSparseReciprocal (RTLSR) kernel combination as the main operational algorithm to integrate multi-angle remote sensing observations acquired by MODIS aboard the Terra and Aqua satellites [24,28]. In 2012, VIIRS, similar in design to MODIS, was launched aboard the Suomi-NPP satellite. Similarly, the multi-angle observations acquired by VIIRS were integrated with RTLSR algorithms to produce the VIIRS BRDF product suite [25], which continues MODIS’s long-term Earth record [29,30]. The long-term, publicly available, and standardized BRDF products provided by the official MODIS and VIIRS teams facilitate the estimation of medium-resolution surface parameters, such as albedo and reflectance, and support investigations into the structural and physiological parameters of vegetation, such as NDVI, LAI, CI, tree height, and vegetation phenology [3,7,9,31,32,33,34,35]. Researchers have long utilized MODIS data for the estimation of various geophysical parameters. With the release of VIIRS data, the migration of cross-sensor algorithms and long time-series parameter inversion have been further developed [29].
However, ensuring the consistency and accuracy of cross-sensor algorithms and parameters is a persistent challenge in research, necessitating special attention to the uncertainties introduced by differences in sensor characteristics. Although MODIS and VIIRS share functional similarities, they still exhibit significant differences in terms of observation time, effective spatial resolution, spectral response, etc. First, MODIS is on board the Terra and Aqua satellites, which have transit times of 10:30 a.m. and 1:30 p.m. local time, respectively, whereas VIIRS is on board the Suomi-NPP satellite, which has a transit time of 1:30 p.m. It is possible that the quality and quantity of data from multi-angle observations used for BRDF parameter fitting are affected by issues such as atmospheric conditions and surface states caused by differences in transit times [36]. Second, MODIS provides data at spatial resolutions of 250 m, 500 m, and 1 km, whereas VIIRS offers resolutions of 375 m and 750 m [37,38]. A higher spatial resolution enables the detection of finer surface features, enhancing the retrieval of detailed information. However, it may also increase data variability and noise, potentially introducing greater uncertainty in quantitative analyses. Third, the spectral band configurations and sensor response functions of MODIS and VIIRS are different, which influences their sensitivity to various surface features. Such differences can impact the consistency of BRDF parameter retrievals and the estimation of derived variables.
Recently, validation via multi-angle datasets and in situ measurements has demonstrated that the estimated surface directional reflectances and albedos obtained from MODIS and VIIRS exhibit strong consistency [25]. However, the estimation of vegetation structure parameters (e.g., NDHD and CI estimation) depends on the variability in surface anisotropy, as characterized by the BRDF parameters. This dependence may increase uncertainty in the BRDF parameter fitting process, making parameter estimation more sensitive to potential uncertainties in the data source and leading to greater differences in the results when the same algorithm is applied across different sensor data [39]. In the estimation and evaluation of different downstream parameters, it is very important to compare and analyze the consistency of the input BRDF data before exploring the consistency of the parameter estimation results. However, the current consistency assessment of BRDF parameter products between different sensors is still limited and needs to be further investigated. The consistency and potential problems of cross-sensor BRDF products must be considered and evaluated, and the specific impacts of the process of inverting the derived angular indices (e.g., NDHD) and its effects on the accuracy and consistency of the estimation results are also worthy of research, as this would help clarify some of the considerations in the application of BRDF products in the future.
This study applied the RossThickChen-LiSparseReciprocal (RTCLSR) kernel-driven BRDF model to assess the consistency of the BRDF parameter products and derived indices from MODIS and VIIRS in the red band and NIR band, respectively. In addition, we examined the response of the BRDF parameters to variations in the equal NDHD intervals and the spatial and temporal distributions of the zero-valued BRDF parameters and their impact on the NDHD estimation. Section 2 describes the study area, the datasets utilized, and the specific methods. Section 3 describes the results of the consistency assessment of the BRDF products at the site and regional scales and the analysis of the distribution and effects of zero-valued BRDF pixels. Section 4 discusses the potential sources of differences between the two products and promising solutions. Section 5 presents the main conclusions of this study.

2. Materials

2.1. MODIS BRDF Parameter Product

The Moderate Resolution Imaging Spectroradiometer (MODIS) Bidirectional Reflectance Distribution Function and Albedo (BRDF/Albedo) Model Parameter product (MCD43A1 Version 6.1) provides kernel-driven BRDF model kernel coefficients for multiple bands at a 500 m resolution. All high-quality, cloud-free, multi-angle surface reflectance data collected by MODIS on the Terra and Aqua satellites are utilized over a 16-day period to provide both adequate sampling of the viewing geometry and sufficient observations, and then the BRDF model of the RossThick-LiSparseReciprocal kernel combination is applied to derive the BRDF model parameters for isotropic, volumetric, and geometric kernels (fiso, fvol, and fgeo), which are also spectrally dependent on the BRDF kernel weights. The model parameters and kernel-driven BRDF model provide a concise structure for the anisotropic reflectance of the hemispherical space and facilitate the computation of key surface properties, including surface reflectance, albedo, and vegetation indices.

2.2. VIIRS Suomi-NPP BRDF Parameter Product

The NASA/NOAA Suomi National Polar Orbiting Partnership (Suomi-NPP) Visible Infrared Imaging Radiometer Suite (VIIRS) (VNP43IA1, Collection V001) Bidirectional Reflectance Distribution Function and Albedo (BRDF/Albedo) Model Parameter product provide BRDF model kernel coefficients for the I1, I2, and I3 bands at a 500 m resolution. The VNP43IA1 product is generated using a similar algorithm to MCD43A1. However, unlike MCD43A1, which derives parameters from all multi-angle observations collected by MODIS aboard the Terra and Aqua satellites, VNP43IA1 relies only on observations from the VIIRS aboard the Suomi-NPP satellite.

2.3. Study Area

The Benchmark Land Multisite Analysis and Intercomparison of Products 2.1 (BELMANIP 2.1) network collected data from 445 sites worldwide dedicated to the validation and intercomparison of remote sensing land surface products [40,41,42]. These sites were selected on the basis of geographic diversity, ecosystem representativeness, and the availability of long-term data, and cover various biomes, land cover types, and climatic conditions. Each site has homogeneous surface features and a relatively flat topography over a 10 km2 area, providing a reliable basis for the robust assessment and comparison of the performance of moderate-resolution remote sensing products.
In this study, we focused on vegetation-covered surfaces and selected 359 sites from the BELMANIP 2.1 network that were predominantly covered by vegetation between 2015 and 2017 (Figure 1). These sites were identified on the basis of the IGBP classification scheme from the MODIS Land Cover Type product (MCD12Q1), ensuring that their dominant land cover types fell into IGBP classes 1–12. We analyzed the consistency of the MODIS and VIIRS BRDF products and their impacts on the derived indices in two bands (the red band and NIR band) that are strongly related to vegetation. The spatial and time-series comparisons based on these sites provide a robust foundation for assessing the cross-sensor consistency and accuracy of the BRDF products, further increasing the reliability of subsequent product applications.
In addition, we extended the study to the regional scale by conducting a detailed comparative analysis of the BRDF products and their derived indices in the Contiguous United States (CONUS). The CONUS has diverse terrains that include vast plains and rolling mountains, as well as diverse ecosystems from humid eastern forests to arid western deserts. The rich terrain and ecological diversity provide ideal conditions for evaluating BRDF products in different environments. We downloaded August 2016 time-series data from the MODIS and VIIRS BRDF for the CONUS from Google Earth Engine and applied them to assess the consistency of the BRDF products and their derived indices.

3. Methods

3.1. BRDF Model and the Derived Indices

The kernel-driven BRDF model with the RossThickChen-LiSparseReciprocal (RTCLSR) kernel combination is employed in this study to derive BRDF-related surface indices, including hotspot reflectance (Rhot), darkspot reflectance (Rdark), white-sky albedo (WSA), black-sky albedo (BSA), and Normalized Difference Hotspot-Darkspot (NDHD). This model is described by Roujean et al. [18] as a linear combination of isotropic, volumetric, and geometric-optical (GO) scattering components [Equation (1)].
R θ i , θ v , φ , λ = f i s o λ + f v o l λ K v o l θ i , θ v , φ + f g e o λ K g e o θ i , θ v , φ
where R θ i , θ v , φ , λ is the reflectance in band λ in the angular geometry represented by the solar zenith angle ( θ i ), view zenith angle ( θ v ), and relative azimuth angle ( φ ). Kvol is the volumetric kernel derived from the RossthickChen volumetric scattering radiative model [Equation (2)]. The RossthickChen kernel is a modification of the Rossthick kernel that was proposed by Jiao et al., who introduced hotspot parameters (C1 and C2 represent the hotspot height and hotspot width, respectively) to increase the reconstruction accuracy of the hotspot effect [17]. Kgeo is the GO kernel derived from the LiSparseReciprocal geometric shadow casting model [Equation (3)]. ξ is the phase angle and is defined in Equation (4). fiso, fvol, and fgeo are spectrally dependent coefficients, which represent the weights of the corresponding scattering kernels.
K R T C = π / 2 ξ cos ξ + sin ξ cos θ v + cos θ i × ( 1 + C 1 e ξ C 2 ) π 4
K L S R = O θ i , θ v , φ sec θ i sec θ v + 1 2 1 + cos ξ sec θ i sec θ v
cos ξ = cos θ i cos θ v + sin θ i sin θ v cos φ
Since the RTC kernel only corrects the shape of the BRDF in the hotspot region and inherits the rest from the RT kernel, the obtained BRDF parameter products derived from the standard RTLSR model should be applicable for use in the RTCLSR model in most cases [7]. Jiao et al. conducted a comprehensive comparison of BRDF parameters retrieved from RTCLSR and RTLSR models using MODIS and POLDER data, demonstrating high consistency between the two models in the red and NIR bands [3]. These results support the direct use of BRDF parameters from RTLSR-based products (MCD43A1, VNP43IA1) as inputs to the RTCLSR model for calculating derived indices, without the need for re-inversion. Moreover, the RTCLSR model enables a more accurate estimation of various indices that characterize surface reflectance anisotropy at different levels. For example, Rhot and Rdark, which characterize surface scattering and shading properties in specific directions, as well as WSA and BSA, which describe the surface reflectance characteristics under purely diffuse and direct illumination conditions, serve as key input parameters for energy-balance studies. The NDHD is defined by Equation (5); it retains the directional information of the BRDF parameters and is highly sensitive to structural features. The comparison and evaluation of these key parameters reveal the differences between the MODIS and VIIRS BRDF products and provide reference for improving the inversion of directional parameters and increasing the applicability of remote sensing products.
N D H D = R h o t R d a r k / R h o t + R d a r k

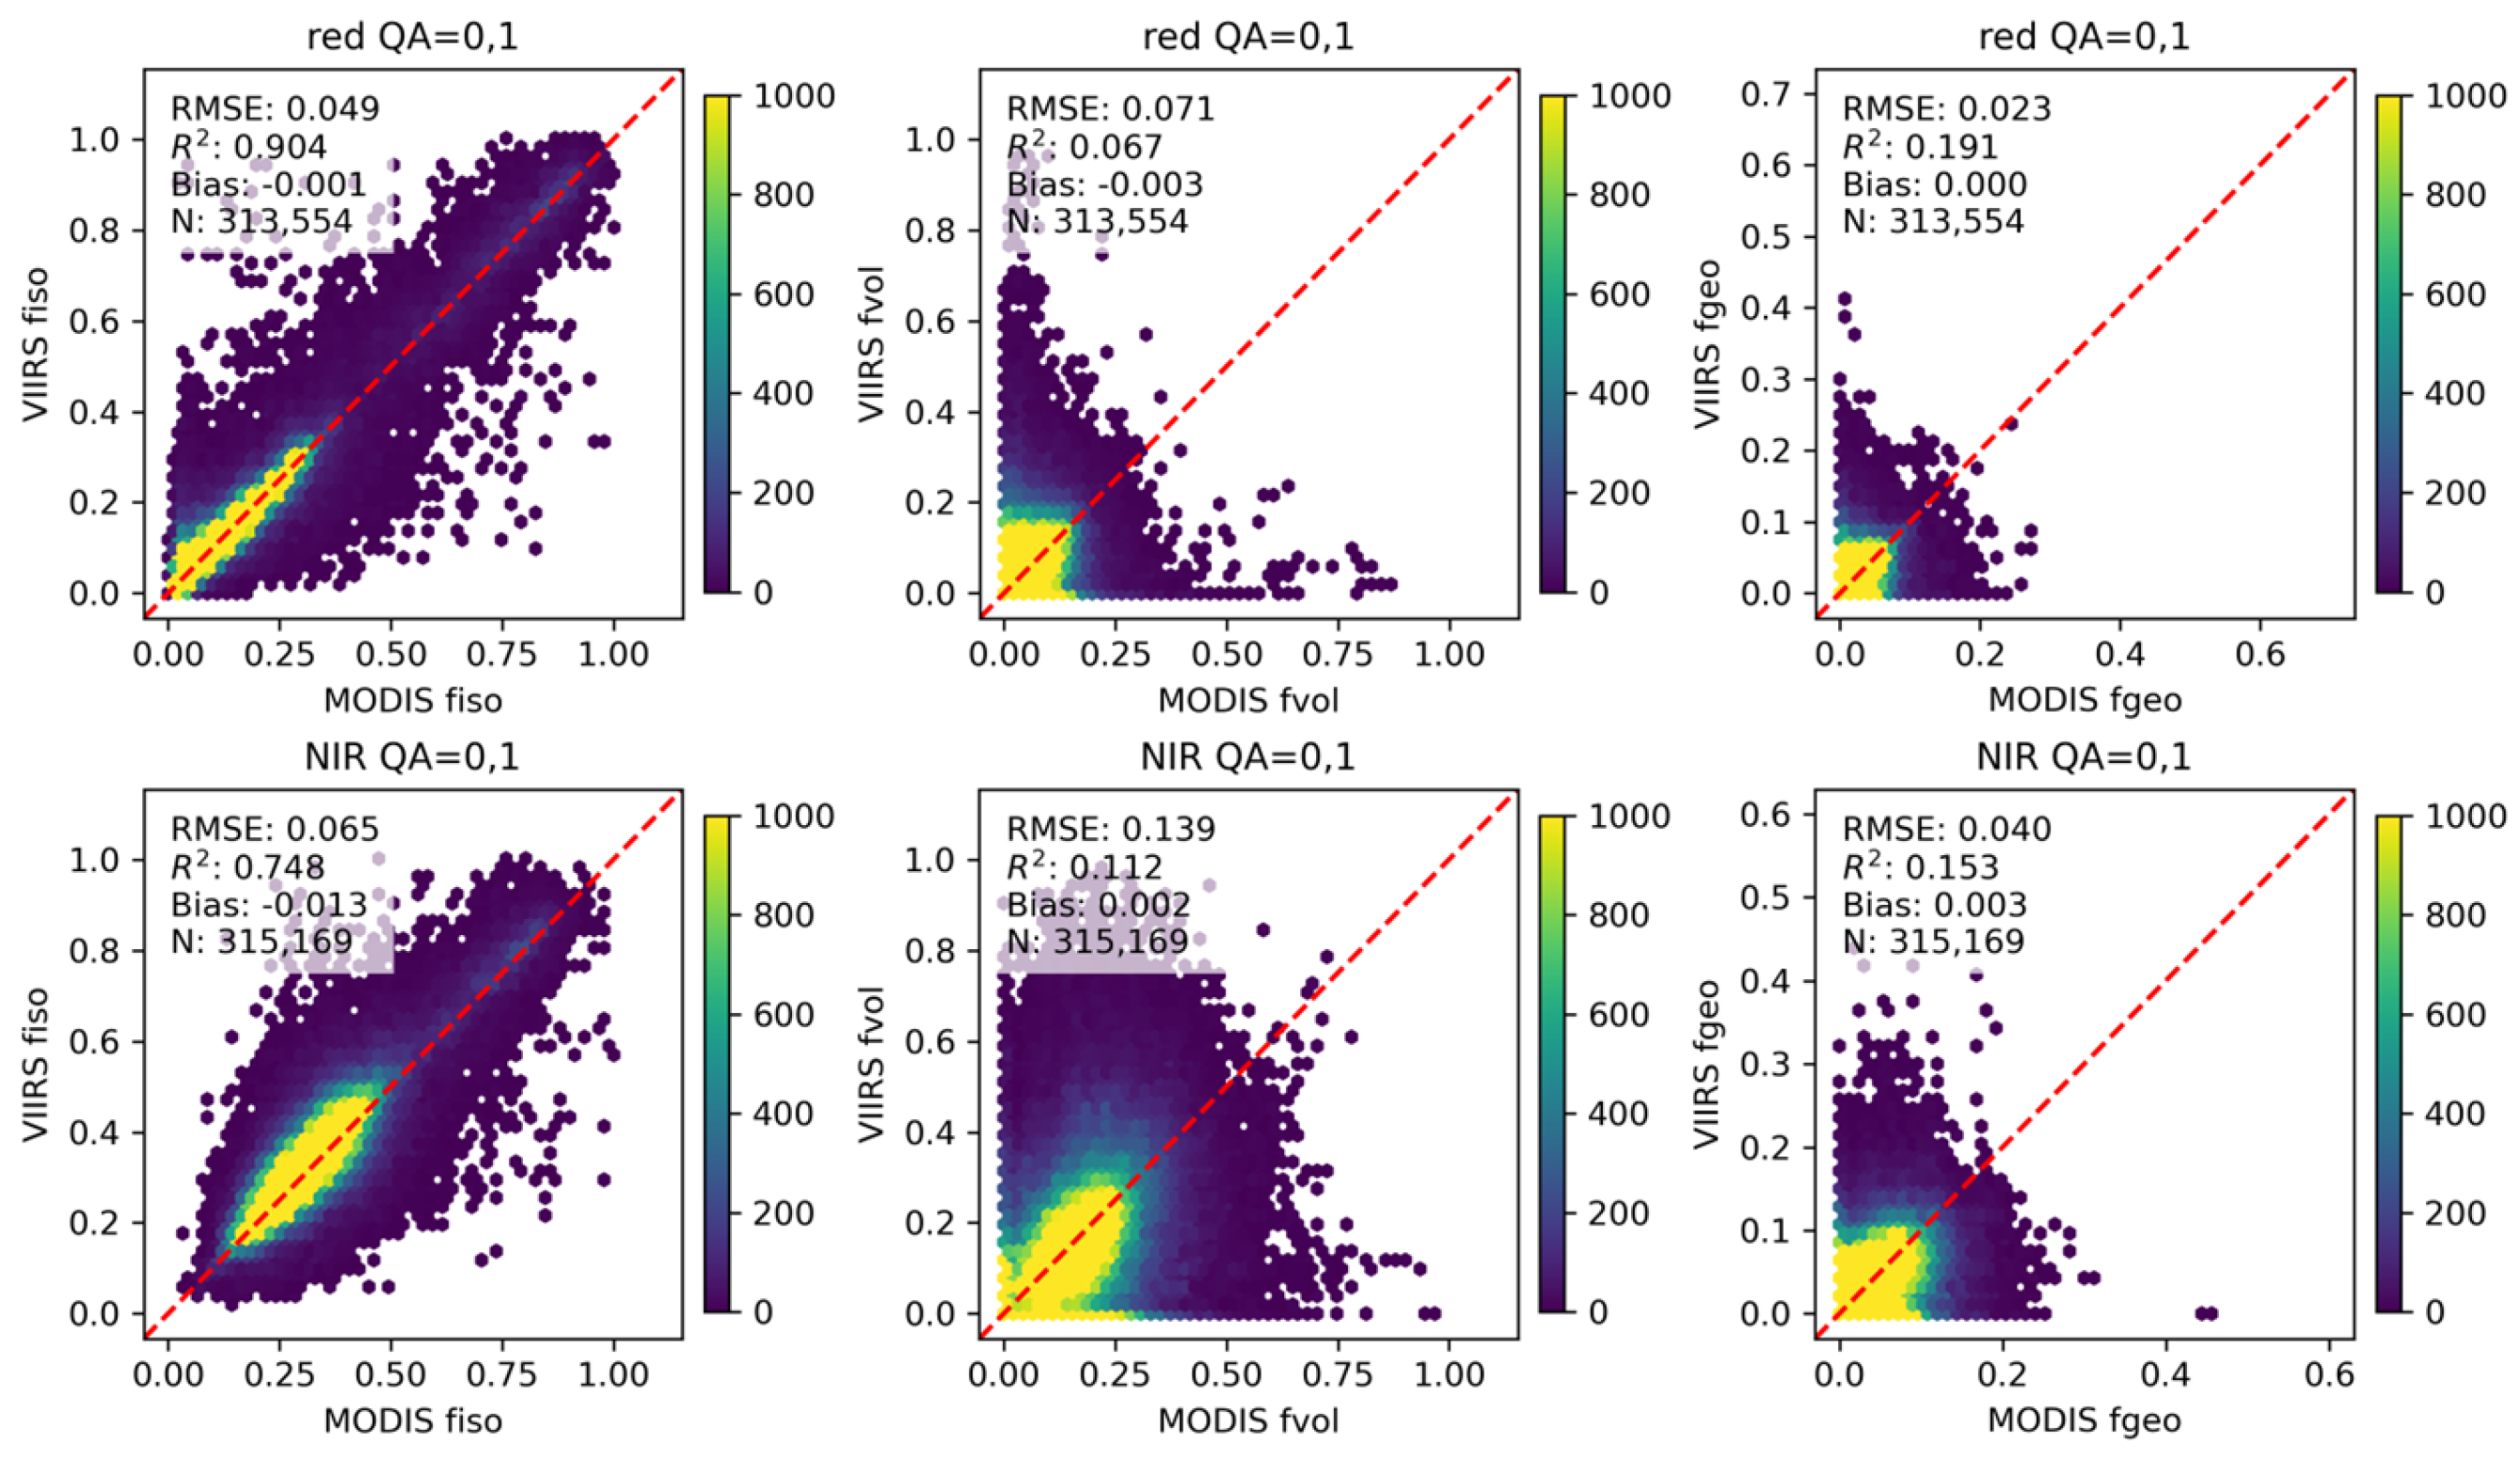
3.2. Assessment of the Consistency Between the BRDF Parameters and Derived Indices

To assess the consistency of the MODIS and VIIRS BRDF parameters systematically, we utilized the BRDF products of the 359 selected sites from the BELMANIP 2.1 network in the two bands (red band and NIR band). We filtered the data to include only those pixels for which the quality assurance flags (QA) of both MCD43A1 and VNP43IA1 products were 0 or 1, which corresponded to retrievals derived from the full inversion algorithm (QA = 0) and magnitude inversion algorithm (QA = 1), respectively. Considering the potential differences in spectral response functions (SRFs) between MODIS (B1/B2) and VIIRS (I1/I2), we collected the SRF profiles for each band and integrated them with measured spectral data to calculate band-specific conversion coefficients. The results showed excellent agreement between MODIS and VIIRS (R2 > 0.999). Therefore, spectral discrepancies were not further emphasized in this study.
The root mean square error (RMSE), bias, coefficient of determination (R2), and relative root mean square error (rRMSE) [Equations (6)–(9)] were applied to quantify the consistency of the BRDF model parameters (fiso, fvol, and fgeo) and the derived indices. Given that the BRDF model parameters exhibit more extreme sensitivities because they are limited by observational distributions, model fitting, noise, etc., time-series surface parameters such as typical directional reflectance (Rhot and Rdark), albedo (WSA and BSA), and NDHD were simultaneously derived from the BRDF parameters for comparison; we analyzed how the differences in the BRDF model parameters propagated to the inversion results of the various parameters.
R M S E = i = 1 N A i B i 2 N
B i a s = i = 1 N A i B i N
R 2 = 1 i = 1 N A i B i 2 i = 1 N A m e a n B i 2
r R M S E = 1 A m e a n × i = 1 N A i B i 2 N
In these equations, Ai denotes the MODIS parameters, Bi denotes the VIIRS parameters, and N denotes the number of samples. Amean represents the average of all Ai values.
We then expanded the analysis to a regional scale, focusing on the contiguous United States (CONUS) as the study area, and computed the mean and relative differences in the BRDF parameters between the two sensors. Assuming that changes at the surface during a month are negligible, the coefficient of variation (CV) was used to measure the degree of variability in the BRDF parameters [Equation (10)]. A small CV indicates that the parameter is stable over time, whereas a high CV may reflect seasonal variations or significant fluctuations in the observed conditions.
C V = 1 A m e a n × i = 1 N A m e a n A i 2 N

3.3. Analysis of the Response of the BRDF Parameters to the NDHD

The different types of derived indices have distinct meanings and applications and are influenced by fluctuations in the BRDF parameters. In this study, NDHD is used as an example to investigate the response of the BRDF parameters as the input data to variations in NDHD. High-quality (QA = 0) MODIS BRDF data from 359 sites were selected and used as inputs to the RTCLSR model to reconstruct Rhot and Rdark at a specific solar zenith angle (30°) and to calculate the NDHD; the NDHD calculation process is complex because of the numerous interacting variables. Therefore, we partitioned the range of the NDHD into small intervals at 0.1, investigated the distributions of the corresponding BRDF parameters as the NDHD increased in equal intervals, and determined the most sensitive parameters influencing the NDHD variations. The mechanism by which the BRDF parameter product performance affected the calculation results downstream was thoroughly analyzed to support the optimization of product applications and reduce uncertainty.

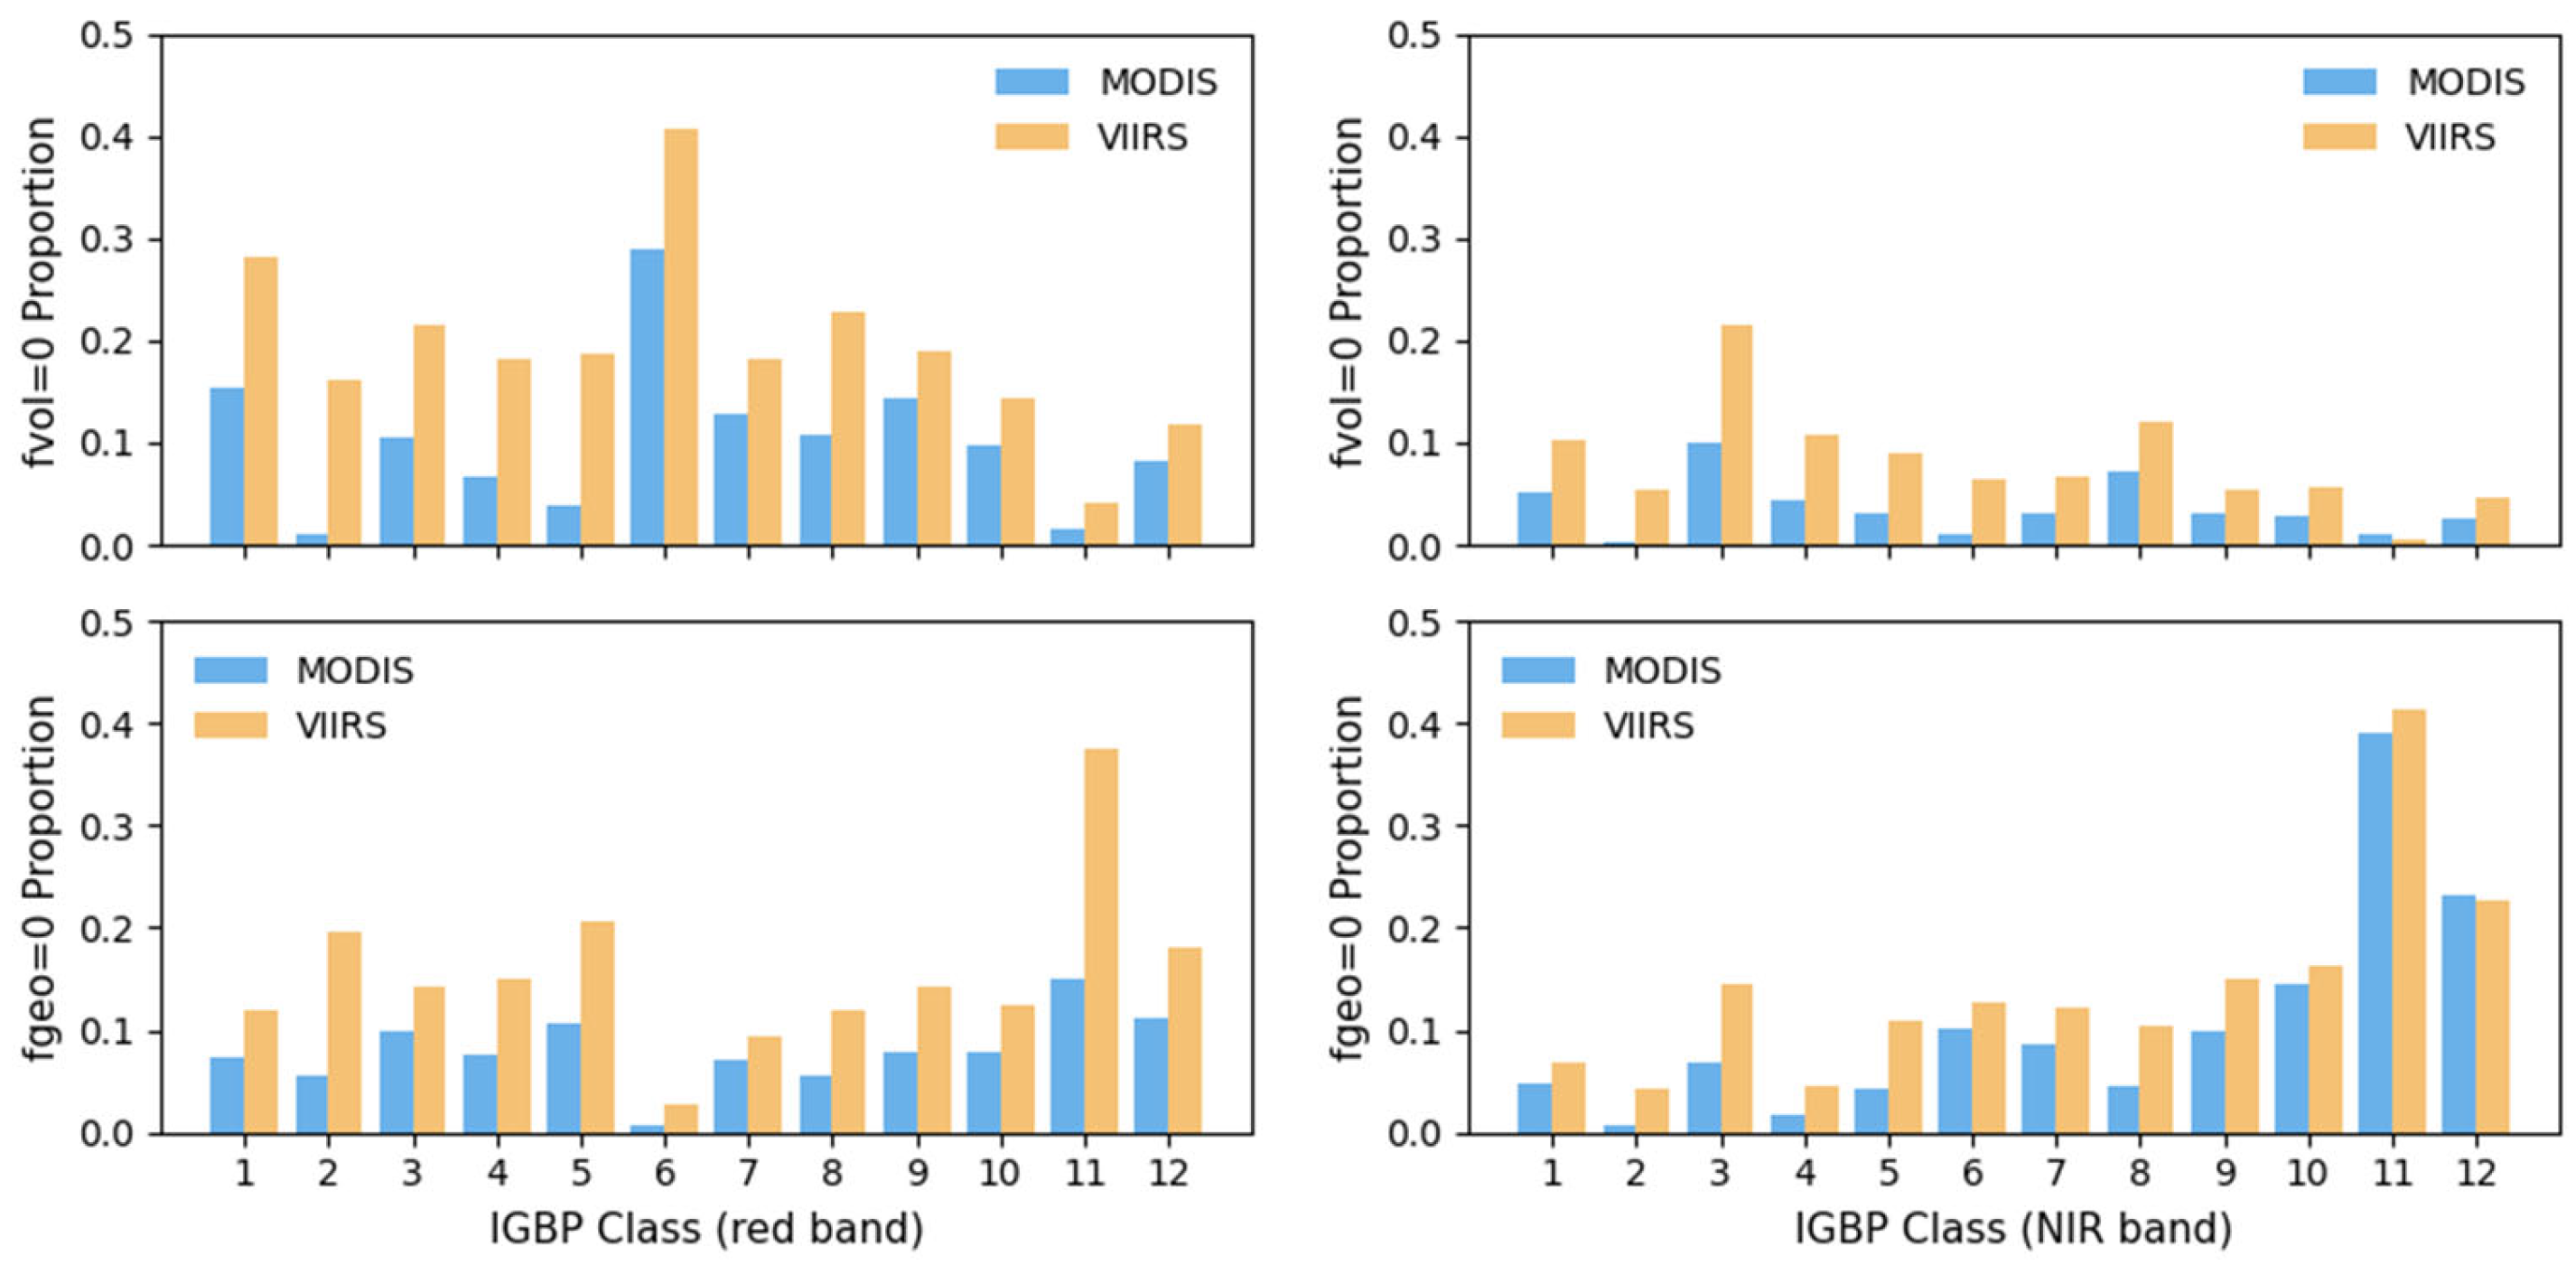
3.4. Statistical and Impact Analysis of the BRDF Parameter Zero-Valued Pixel Distributions

Among the parameters of the kernel-driven BRDF model, fvol and fgeo are crucial for reconstructing anisotropic reflection patterns. Moreover, the anisotropic reflection properties of the surface captured by the BRDF parameters are represented more directly and sensitively than are the properties measured as surface reflectance and albedo at specific angles. Owing to inherent limitations of the model and observation data constraints, there are some cases in which the fvol and fgeo inversion values of the pixels are set to zero during the multi-angle observation and BRDF model fitting process. This is reasonable in model simulations, but these cases still face limitations and uncertainties in characterizing actual anisotropic reflection patterns. First, we analyzed the variations in the distribution of zero-valued pixels across months and land cover types over the period of 2015–2017, using all available data at the 359 sites from the BELMANIP 2.1 network, and mapped their global spatial distribution. Next, we filtered out a dataset containing all pixels for which the MODIS fvol was nonzero and VIIRS fvol was zero. This dataset was used to evaluate the impact of setting fvol to zero on the reconstruction of Rhot and Rdark and the estimation of NDHD, thereby clarifying the potential effect of setting fvol to zero on subsequent parameter calculations.

4. Results

4.1. Consistency of the BRDF Parameters and Differences in the Derived Indices

Figure 2 shows the results of comparing the consistency of the BRDF parameter products obtained from the MODIS and VIIRS sensors in the red and NIR bands, applying data from 359 vegetation-covered sites of the BELMANIP 2.1 network from 2015 to 2017. Table 1 extends the results in Figure 2 by adding the results of the consistency comparison of the indices derived from the BRDF parameters. The results show that both the BRDF parameters and the indices derived from MODIS and VIIRS data exhibit hierarchical differences. First, the BRDF products show significant differences between MODIS and VIIRS data, with the fvol layers exhibiting weak correlations: RMSE = 0.071 and R2 = 0.067 in the red band and RMSE = 0.139 and R2 = 0.112 in the NIR band. fgeo exhibits the next highest discrepancy, with RMSE = 0.023 and R2 = 0.191 in the red band and RMSE = 0.040 and R2 = 0.153 in the NIR band. In contrast, the fiso layers demonstrate the highest consistency, with RMSE = 0.049 and R2 = 0.904 in the red band and RMSE = 0.065 and R2 = 0.748 in the NIR band. Second, the typical directional reflectances (Rhot and Rdark) at a 30° solar zenith angle are derived from the BRDF parameters. Rdark exhibit a stronger correlation than Rhot, with R2 = 0.9434 in the red band and R2 = 0.8597 in the NIR band, whereas Rhot has R2 = 0.8187 in the red band and R2 = 0.6510 in the NIR band. Third, the WSA and BSA, which characterize the total reflectance integrated across all directions in hemispherical space under diffuse and direct scattering conditions, result in smaller differences than the reflectance (R2 > 0.94 in the red band and R2 > 0.84 in the NIR band). Finally, the correlation of the NDHD (R2 = 0.2388 in the red band and R2 = 0.1921 in the NIR band) derived from MODIS and VIIRS is intermediate between the BRDF parameter and the typical directional reflectance. This is primarily due to the structure of its formulas and the type of anisotropic reflection. NDHD uses the BRDF parameters to extract and enhance directional reflectance information from the surface, enabling it to capture structural vegetation features to some degree while remaining sensitive to varying observational conditions.
In fact, the consistency of each parameter varies across the bands, and the rRMSEs of all the parameters in the NIR band are smaller than those in the red band. In particular, the difference in the anisotropic scattering parameters fvol and fgeo in the red band can even exceed the values of the parameters themselves, with rRMSEs exceeding 100% in the red band and exceeding 80% in the NIR band for both parameters. These large rRMSE values are primarily due to the inherently small absolute magnitudes of fvol and fgeo, especially in the red band. When parameter values are close to zero, even minor absolute differences can result in disproportionately high relative errors, which amplify the apparent discrepancies in percentage-based metrics. Nevertheless, the results provide valuable insights into both the mechanisms and the extent to which differences in BRDF parameters propagate into the calculation of derived indices. It is evident that the existing differences in BRDF products pose a significant challenge to maintaining the consistency of angular indices such as NDHD.

4.2. Comparison of Spatial Consistency of BRDF Parameters Within the Contiguous United States

The results in Section 3.1 show the differences in the BRDF products and derived parameters of the two sensors in the 359 sites from the BELMANIP 2.1 network. In this section, we further expand the study area from the site scale to the regional scale, exploring whether such differences are widespread within the contiguous United States (CONUS). Figure 3 shows the differences between the monthly averages of the MODIS and VIIRS BRDF parameters in the red band and NIR band over the CONUS in August 2016 (fVIIRSfMODIS). Similar to the results for the sites, the difference in the fiso layer is minimal, wheras fvol and fgeo show significant and more widely distributed overall differences, and the VIIRS BRDF parameter is slightly overestimated compared to MODIS, similar to the VIIRS overestimation in the reflectance values of the site data. In addition, the relative differences in the three BRDF parameters in the NIR band are both numerically and spatially smaller than those in the red band. These spatial differences reflect systematic discrepancies between the two sensor products, providing a regional-scale assessment of inter-sensor consistency.
Figure 4 shows the spatial distributions of the CVs for the three BRDF parameters in the red band and NIR band for the MODIS and VIIRS sensors, respectively, which are used to compare the temporal stability of the BRDF parameters between the two sensors. The results indicate that the spatiotemporal variability of the BRDF parameters is not only dependent on the scattering component, but it also reveals significant differences in the response of different bands, suggesting that band selection is crucial for shaping the variation pattern of the BRDF parameters. The distributions of the fiso CV values for both MODIS and VIIRS show low variability, suggesting that the stability of the anisotropic scattering components is high. The CVs of fvol and fgeo for the VIIRS data are generally greater than those for the MODIS data, indicating stronger spatiotemporal fluctuations in the anisotropic scattering components. In particular, regions with high variability of fvol and fgeo are more widely distributed in the VIIRS BRDF data, indicating that the sensor is more sensitive to directional scattering, which may increase uncertainties in BRDF estimation under different observational conditions.

4.3. Response of the BRDF Parameters to Variations in the NDHD

Figure 5 shows the variations in the distributions of the BRDF parameters (fiso, fvol, and fgeo) and the hotspot and darkspot reflectances (Rhot and Rdark) with increasingly equal NDHD intervals. In the red band, fiso decreases and fvol increases, while fgeo remains almost constant with increasing NDHD, which indicates that the volumetric scattering component contributes more strongly to the BRDF model fit in the high-NDHD region. Rhot and Rdark are derived from the BRDF parameters as a basis for the NDHD calculation, and the trend of Rhot with increasing NDHD is a slow decrease followed by a slow increase, whereas Rdark continues to decrease. In the NIR band, fiso decreases slowly, fvol increases significantly, and fgeo increases slowly, indicating the greater role of the geometric-optical scattering component in the NIR band. Moreover, Rhot and Rdark in the NIR band increase and decrease, respectively, with increasing NDHD. In summary, the sensitivity of NDHD to changes in the BRDF parameters exhibits a clear component dependence, with fiso and fvol showing the greatest sensitivity to NDHD, decreasing and increasing as NDHD increases; in contrast, fgeo demonstrates band-specific variations but is less sensitive. The BRDF parameters clearly have a complex influence on the key derived indices, and their accuracy and stability may significantly impact the estimation precision of the downstream parameters and the performance of the algorithm. Since fvol directly governs the volumetric scattering effect that drives NDHD variability, its accuracy has a significant impact on the reliability of NDHD. In contrast, the limited sensitivity of fgeo observed in this analysis indicates that its influence on NDHD is smaller. Therefore, the subsequent discussion focuses on fvol, which plays a more critical role in NDHD estimation.

4.4. Spatiotemporal Distribution of the Zero-Valued Pixels of the BRDF Parameter

Figure 6 shows the proportions of zero-valued pixels for the MODIS and VIIRS BRDF parameters (fvol and fgeo) in each month at the 359 sites from the BELMANIP 2.1 network. The results indicate a significant proportion of pixels with zero values for both the MODIS and VIIRS BRDF parameter products, with similar seasonal fluctuations observed for the data from the two sensors. The proportion of zero-valued pixels in fvol peaks from March to April, whereas the proportion of zero-valued pixels in fgeo peaks mid-year. The number of zero-valued pixels varies across bands and sensors. First, there are significantly more zero-valued pixels in the red band than in the NIR band; there are approximately twice as many for fvol, whereas the difference in the proportions for fgeo is smaller. Second, the proportion of zero-valued pixels for fvol and fgeo in VIIRS are significantly greater than those in MODIS; the proportions of zero-valued pixels for fvol in VIIRS (more than 13% in the red band and more than 5% in the NIR band) are nearly twice those in MODIS (more than 6% in the red band and more than 2.5% in the NIR band), and the difference in the proportion of zero-valued pixels for fgeo is greater in the red band and smaller in the NIR band.
Figure 7 shows the proportions of zero-valued pixels for the MODIS and VIIRS BRDF parameters (fvol and fgeo) at each IGBP class at the 359 sites from the BELMANIP 2.1 network. It indicates that the proportion of fvol zero-valued pixels varies significantly among the 12 different IGBP classes (including forests, shrubs, grasslands, crops, etc.); the proportion of zero-valued pixels in the VIIRS data is generally greater than that of MODIS. In addition, the proportion of fvol zero-valued pixels is significantly greater in the red band than in the NIR band and is especially pronounced for sparse vegetation and bare ground (e.g., grassland, shrubland, and bare soil). This may be attributed to the strong absorption in the red band, which suppresses multiple scattering and consequently weakens the volumetric scattering component. In contrast, in the NIR band, the high reflectance of vegetation increases multiple scattering and the contribution of volumetric scattering, resulting in a lower proportion of fvol zero-valued pixels. In the red band, the shading effects of leaves and the directional characteristics of the canopy structure contribute to geometric-optical scattering, which makes fgeo difficult to ignore for most land cover types. Conversely, strong multiple scattering reduces the influence of geometric-optical scattering, particularly in areas with sparse vegetation or flat surfaces (e.g., croplands and bare soil), leading to a greater proportion of fgeo zero-valued pixels. Overall, the band dependence of zero-valued pixels in the BRDF parameters reflects the modulation effect of the spectral properties of vegetation on anisotropic scattering, which warrants further analysis in the context of more detailed spectral–structural relationships.
The distribution of zero-valued pixels for MODIS and VIIRS have systematic global differences between MODIS and VIIRS, as shown in Figure 8, where VIIRS has significantly more days with fvol and fgeo set to zero than MODIS does, especially in the red band. First, the distribution of the difference in the number of zero-setting days differs between the red and NIR bands, with the red band having more regions in yellow-green, indicating that the number of days with zero-valued pixels of the VIIRS parameter in the red band exceeds 30 in more regions than it is for MODIS. This may be due to the high sensitivity of the red band to surface characteristics (e.g., vegetation cover, soil type, and moisture content) and its vulnerability to changes in atmospheric conditions (e.g., aerosols and water vapor) and surface type, whereas the NIR band, owing to its greater penetration and reduced atmospheric scattering effects, provides a more stable reflectance signal, which can be compensated through parameter fitting.
Furthermore, the parameters may also be set to zero due to the inadequate conditions of the observation geometry or the potential systematic problems of inversion algorithms. Specifically, the stability and accuracy of the inversion process may be compromised by changes in feature information resulting from the observation geometry or by the limited adaptability of the inversion algorithm to complex surfaces, an issue that requires further investigation. The distributions of the fvol and fgeo zero-valued pixels can significantly influence VIIRS data quality and applications, with the potential result that the VIIRS data can introduce uncertainties in the calculation of downstream products, especially in certain geographic regions or specific seasons. Therefore, it is important to quantify the effect of the distribution of zero-valued pixels and to account for the outliers of fvol and fgeo values to reduce their impact on the results.

4.5. Effect of the Zero-Valued Pixels of the BRDF Parameter on the Derived Index Estimation

Figure 9 illustrates the impact of fvol zero-valued pixels on the typical directional reflectance simulation and NDHD estimation. Among the indices derived from the MODIS and VIIRS BRDF parameters, Rdark has the highest correlation, followed by Rhot, whereas NDHD has the weakest correlation. The estimation results of Rhot and Rdark for both sensors are constrained by the fvol zero setting but exhibit good agreement in the red band (Rhot: R2 = 0.838, RMSE = 0.071; Rdark: R2 = 0.943, RMSE = 0.036) and in the NIR band (Rhot: R2 = 0.595, RMSE = 0.102; Rdark: R2 = 0.859, RMSE = 0.065). NDHD differs greatly, with RMSE = 0.245 and R2 = 0.145 in the red band and RMSE = 0.170 and R2 = 0.093 in the NIR band. NDHD normalizes the anisotropic reflectance simulated by the BRDF model, and a zero value of fvol significantly results in an incomplete characterization of the optical properties of the vegetation canopy, which compromises the accuracy of the NDHD estimation. Notably, the number of zero-valued pixels of VIIRS fvol is substantially greater in the red band than in the NIR band, which may have important implications for the estimation of indices that depend on BRDF anisotropy, such as the NDHD. It is quite possible that this will reduce their spatiotemporal completeness and introduce potential uncertainties in time-series analysis or cross-sensor comparisons.
Figure 10 shows the daily and monthly NDHDs for the four BELMANIP sites with different IGBP classes, with the blue and green vertical lines indicating that fvol is equal to zero for the corresponding dates. Importantly, the stability of most NDHD time-series results fluctuates in the presence of a zero-valued fvol because the weighting coefficient of the volumetric scattering kernel fails to provide enough information. However, if fvol is zero, fgeo still provides anisotropic scattering information, which helps maintain relatively small fluctuations in NDHD. When the value of fgeo is zero or very small, it is insufficient to support the stability of the NDHD and rapidly converges to zero. Moreover, the presence of zero-valued pixels increases the standard deviation of the monthly averaged NDHD, and the VIIRS data and the derived indices exhibit greater fluctuations and uncertainties.

5. Discussion

5.1. Potential Problems with BRDF Inversion

The fluctuations in the BRDF parameter significantly affect the estimation of derived indices that are sensitive to anisotropic reflection, and a wide distribution of zero-valued BRDF pixels may jeopardize the further application of the BRDF parameter product, particularly in producing consistent remote sensing CI products from MODIS to VIIRS, which rely on the sensitive hotspot reflectance. The impact of zero-valued BRDF parameter pixels on the estimation of derived indices is not necessarily absolute; assigning zero values to parameters in the fitting process can be justified for valid multi-angle observations, but it may contribute to the overfitting of anisotropic reflection in the hemispherical space.
Existing BRDF products rely on a limited set of multi-angle observations. MODIS BRDF products are jointly generated from multi-angle observations acquired by MODIS aboard the Terra and Aqua satellites, whereas VIIRS BRDF products are derived from VIIRS observations obtained with a single satellite. For example, the VNP43 product is derived from VIIRS observations aboard the Suomi-NPP satellite, whereas the VJ143 product originates from VIIRS data on the JPSS-1 satellite. Although VIIRS was designed as the successor to MODIS, significant differences remain. One key difference is its larger swath width, which enables VIIRS to acquire more observations at larger zenith angles [37]. However, as the zenith angle increases, the atmospheric influence on observations can introduce greater uncertainties, and the effect of shadow overlap among features becomes increasingly complex [43]. The kernel-driven model is considered to have a better fitting ability for interpolation from small to medium zenith angles and may struggle to accurately capture mutual occlusion and projection variations when extrapolating to large zenith angles, potentially leading to distortions in the fitting process due to noise or observational uncertainties [22]. Another key difference is that VIIRS on a single platform collects fewer observations than does MODIS on two platforms. The VNP43 product of interest in this study is generated from multi-angle observations collected by the VIIRS onboard the Suomi-NPP satellite, which crosses the equator at 1:30 p.m., whereas the MODIS onboard the Terra satellite crosses the equator at 10:30 a.m. This SNPP-VIIRS observation is more likely to be contaminated, especially in the tropics and mid-latitudes where convection is active; in contrast, many regions have not yet formed or are in the early stages of cloud development during the morning, which has less impact on the MODIS observations. However, BRDF parameter inversion relies on sufficient high-quality multi-angle observations to accurately characterize surface anisotropy, whereas inadequate angular sampling can oversimplify BRDF inversion and increase susceptibility to noise-induced distortions.
The differences between MODIS and VIIRS are also influenced by factors such as radiometric calibration differences [44] and inconsistencies in effective spatial resolution [25]. These processing procedures applied to sensor observations are also highly likely to introduce systematic biases, which in turn affect the retrieval of BRDF parameters. For example, the effective spatial resolutions of MODIS and VIIRS are different. The original multi-angle observations are first resampled onto a fixed spatial grid with a nominal resolution of 500 m. Based on these gridded observations, BRDF parameters are then derived through a semi-empirical, kernel-driven BRDF model, which models surface anisotropy by fitting kernel coefficients. However, the effective spatial resolution of these products is inherently coarser than the nominal grid size due to the spatial aggregation and smoothing effects introduced during the compositing and inversion processes. Previous studies have shown that the effective resolution of MODIS 500 m BRDF/Albedo/NBAR products typically remains below 1 km, while VIIRS gridded products exhibit median effective resolutions under 600 m [45]. Consequently, even though both MODIS and VIIRS BRDF products are provided at a nominal 500 m resolution, the actual surface areas represented by each pixel can differ between the two sensors. The mismatch in spatial representativeness becomes particularly significant in regions with strong surface heterogeneity, where variations in land cover or surface structure within a pixel can lead to noticeable differences in the BRDF parameters. In such cases, parameters representing anisotropic scattering components are especially sensitive to these differences, which may result in larger inter-sensor differences.
In addition to the impact of upstream observation sampling on the BRDF inversion accuracy, the limitations of the algorithms are also important. Both the MODIS and VIIRS BRDF products use the RTLSR model as the main algorithm and use atmospherically corrected surface reflectance observations collected over a 16-day period as inputs. The optimal BRDF model parameters are derived by minimizing the sum of squared errors between the observations and model simulations through iterative optimization to determine the globally optimal solution. Non-negativity constraints are introduced to ensure the physical plausibility of the BRDF model parameters, allowing the solutions of the kernel coefficients to remain physically meaningful and free from the interference of anomalous data; this is expected to balance the model complexity and physical consistency to derive high-quality BRDF parameter products. For cases in which the inversion fails in the main algorithm, the backup algorithm is enabled, which is designed to incorporate assumptions about the stability of surface reflectance characteristics along with prior knowledge to mitigate anomalies in the BRDF parameter fitting caused by insufficient observations. However, when the observations are affected by noise or errors introduced for atypical surfaces and extreme geometric conditions, the non-negative constraints on kernel coefficients in the main algorithm and the reliance on default parameters in the backup algorithm may simplify actual scattering contributions and surface anisotropy and lead to the forced assignment of zero values to volumetric or geometric scattering parameters.
In contrast, the MODIS BRDF operational algorithm retains advantages in current product evaluation and applications due to its longer history and multiple iterations of data versions. These advantages establish a robust foundation for MODIS data in diverse remote sensing applications and provide a benchmark for assessing the quality of future VIIRS BRDF parameter products.

5.2. Considerations for the Application of the BRDF Model Parameters Products

The semi-empirical kernel-driven BRDF model can effectively characterize the directional reflectance properties of the surface and facilitate rapid inversion, which remains a critical advantage for its sustained application to large-scale remote sensing datasets. However, the uncertainty issues associated with BRDF parameter products, as noted in this study, highlight the necessity for users to critically assess product quality and applicability in practical applications. For the estimation of derived indices that depend on spectral information, users should selectively utilize the products on the basis of the required accuracy in specific spectral bands, considering surface characteristics and the requirements of the application (e.g., vegetation index calculation or soil reflectance analysis), while avoiding the indiscriminate use of low-quality parameters. Specifically, it is recommended to prioritize data with a QA value of zero from the mandatory quality layer of the A1 products (MCD43A1 and VNP43IA1), as these retrievals are based on sufficient multi-angle observations and represent high-confidence results. For applications requiring stricter quality control or higher accuracy, users are further encouraged to incorporate the detailed quality information from the A2 products (MCD43A2 and VNP43IA2). Similar to A1, the A2 products use QA values ranging from 0 to 3, with lower values indicating better retrieval quality. We recommend selecting data with the lowest possible QA values (i.e., high-quality data) to ensure reliable results. When broader spatial and temporal coverage is prioritized, users should utilize the comprehensive quality classification provided by the A2 products to balance data availability with quality considerations. This flexible approach allows users to tailor their data selection strategies according to specific application needs and precision requirements.
In particular, the estimation of surface structural parameters, which depends on directional reflection information, requires sufficient coverage of a certain direction by multi-angle observations and sufficient BRDF information transferred from observations to simulations, both of which significantly affect the accuracy of BRDF modeling and parameter estimation. Typical directional reflectance contains rich surface structural and physiological information, which can be used for the classification and identification of surface features and estimation of vegetation structure and biochemical parameters. However, the application of typical directional reflectance, especially hotspot reflectance, is limited by the significant underestimation of the hotspot signature reconstructed by the RTLSR model, so Jiao et al. added the hotspot parameter to the volumetric scattering kernel to address this problem [17]. This approach is ineffective for pixels with kernel coefficients set to zero because the corresponding kernel functions cannot contribute to reconstructing the BRDF shape or simulating hotspot reflectance. It is almost impossible to set fvol and fgeo to zero simultaneously, so the RossThick-LiSparseReciprocal_Chen (RTLSR_C) model with hotspot signature corrections for both volumetric and geometric-optical scattering kernels is a potential solution [46]. In this model, the hotspot-corrected geometric-optical kernels remain effective even when fvol is set to zero, thereby improving the accuracy of hotspot reconstruction. However, the actual effectiveness of this method requires comprehensive validation.
In addition, BRDF parameter products have been obtained continuously, and the considerable overlap between MODIS and VIIRS offers valuable opportunities for cross-sensor data integration. BRDF parameters are not directly measurable, making direct cross-sensor data fusion challenging. However, these parameters can be used to derive many physically meaningful measurable parameters (e.g., surface reflectance and albedo), which serve as intermediaries for developing a fusion framework that leverages extensive data sources and integrates data models to ensure cross-sensor product consistency. The integration of cross-sensor data is crucial for ecological monitoring, climate change research, and the continuity of long-term remote sensing datasets. On the one hand, integrating the long-term observation records of MODIS and VIIRS can reduce the occasional observation interruptions in single-sensor observations and expand the temporal continuity of data coverage. On the other hand, integrated and optimized cross-sensor data can offer more reliable remote sensing parameter estimates for global change studies, vegetation dynamics monitoring, and surface energy balance estimation. In the future, with the deployment of increasingly advanced sensors, cross-sensor data fusion will further increase the accuracy and expand the applicability of remote sensing products.

6. Conclusions

This study systematically analyzes the differences between MODIS and VIIRS BRDF parameter products, emphasizing the spatiotemporal variability of the differences in BRDF parameters and their derived indices. Two questions are explored: what differences exist in the BRDF parameter products, and how these differences potentially affect the derived index estimation. The comparison of MODIS and VIIRS BRDF parameter products reveals that fiso, which characterizes isotropic scattering and represents the reflectances in the direction of nadir view and nadir sun, is in highly consistent among the three BRDF parameters, with rRMSE = 33.37% in the red band and rRMSE = 19.78% in the NIR band; however, the fvol and fgeo, which characterize anisotropic scattering and angular patterns, differ significantly across sensor products. Thus, the differences in the input data affect the cross-sensor consistency of the surface-derived indices estimated from the BRDF parameters in a hierarchical way, with albedo being the least affected, followed by reflectance, whereas NDHD is more affected due to its sensitivity to surface anisotropy (e.g., in the red band, the rRMSE for albedo is less than 30%, and typical directional reflectance is more than 30% but less than 40%, whereas the rRMSE for NDHD is 53.32%).
In addition, zero-valued pixels in the fvol and fgeo layers are widespread and have periodic fluctuations in both the MODIS and VIIRS data, which are especially significant in certain land cover types and bands. However, VIIRS has a higher proportion of zero-valued pixels in the BRDF parameter product statistics than MODIS, which is more significant in the red band. This not only affects the quality of VIIRS data but is also likely to affect its reliability in various environmental remote sensing applications, such as ecological monitoring and vegetation angular index inversion. To clarify the potential impact of BRDF parameters on the estimation of derived indices, NDHD is used as an example to examine the sensitivity of different BRDF parameters to NDHD variations and investigate how the distribution of zero-valued pixels in key parameters affects NDHD estimation. The findings indicate that fiso and fvol exhibit the greatest sensitivity to NDHD variations, whereas the presence of zero-valued pixels in the fvol layer significantly increases uncertainty in NDHD estimation, thereby inevitably having an influence on the accurate inversion of vegetation structure parameters, such as the clumping index (CI); in theory, this is because the CI is linearly related to the NDHD in the multi-angular inversion algorithm. This reveals the necessity that the CI-NDHD algorithm must be adjusted and optimized when used in generating a high-quality VIIRS CI product.
In summary, this study focuses on vegetation angular index estimation to analyze the differences and potential issues in BRDF products. Given that BRDF products serve as important input data in a direct or indirect way for certain studies, these possible problems should be fully considered and resolved. Therefore, we suggest prioritizing BRDF parameter product quality, conducting cross-sensor consistency assessment of MODIS and VIIRS data, and exploring their synergistic integration to develop high-quality, cross-sensor-consistent datasets. These efforts will contribute to advancing the theoretical framework for cross-sensor product consistency assessment and enhancing data reliability in long-term global environmental monitoring and climate change research.

Author Contributions

Conceptualization, C.W. and Z.J.; methodology, C.W. and Z.J.; formal analysis, C.W. and Y.F.; investigation, C.W. and F.Y.; software, C.W. and Y.F.; data curation, J.G., G.G. and Z.T.; writing—original draft preparation, C.W.; writing—review and editing, Z.J., Y.F. and Z.L.; visualization, C.W. and Z.J.; supervision, S.C. and X.D.; funding acquisition, Z.J. and C.W. All authors have read and agreed to the published version of the manuscript.

Funding

This research was funded by the Major Program of the Natural Science Foundation of China (42090013), the General Program of the Natural Science Foundation of China (42471352), and the Open Fund of State Key Laboratory of Remote Sensing and Digital Earth and Beijing Engineering Research Center for Global Land Remote Sensing Products (Grant No. OF202404).

Data Availability Statement

All satellite remote sensing data used in this study are openly and freely available. The MODIS BRDF/Albedo Model Parameters product (MCD43A1, V061) and VIIRS BRDF/Albedo Model Parameters product (VNP43IA1, V001) are available at https://search.earthdata.nasa.gov/search, accessed on 18 May 2025.

Acknowledgments

MODIS data and VIIRS data were obtained from the NASA EOSDIS Land Processes Distributed Active Archive Center (LPDAAC). We sincerely appreciate the opportunity and invitation for publishing this paper in Remote Sensing. We are grateful for the insightful comments and suggestions from all the anonymous reviewers and the editor.

Conflicts of Interest

The authors declare no conflict of interest.

References

  1. Nicodemus, F.E.; Richmond, J.C.; Hsia, J.J.; Ginsberg, I.W.; Limperis, T. Geometrical Considerations and Nomenclature for Reflectance; National Bureau of Standards: Gaithersburg, MD, USA, 1977. [Google Scholar]
  2. Barnsley, M.J.; Strahler, A.H.; Morris, K.P.; Muller, J. Sampling the Surface Bidirectional Reflectance Distribution Function (BRDF): 1. Evaluation of Current and Future Satellite Sensors. Remote Sens. Rev. 1994, 8, 271–311. [Google Scholar] [CrossRef]
  3. Bacour, C.; Bréon, F.-M. Variability of Biome Reflectance Directional Signatures as Seen by POLDER. Remote Sens. Environ. 2005, 98, 80–95. [Google Scholar] [CrossRef]
  4. Pisek, J.; Chen, J.M.; Nilson, T. Estimation of Vegetation Clumping Index Using MODIS BRDF Data. Int. J. Remote Sens. 2011, 32, 2645–2657. [Google Scholar] [CrossRef]
  5. Chen, J.M.; Menges, C.H.; Leblanc, S.G. Global Mapping of Foliage Clumping Index Using Multi-Angular Satellite Data. Remote Sens. Environ. 2005, 97, 447–457. [Google Scholar] [CrossRef]
  6. Wei, S.; Fang, H. Estimation of Canopy Clumping Index from MISR and MODIS Sensors Using the Normalized Difference Hotspot and Darkspot (NDHD) Method: The Influence of BRDF Models and Solar Zenith Angle. Remote Sens. Environ. 2016, 187, 476–491. [Google Scholar] [CrossRef]
  7. Jiao, Z.; Dong, Y.; Schaaf, C.B.; Chen, J.M.; Román, M.; Wang, Z.; Zhang, H.; Ding, A.; Erb, A.; Hill, M.J.; et al. An Algorithm for the Retrieval of the Clumping Index (CI) from the MODIS BRDF Product Using an Adjusted Version of the Kernel-Driven BRDF Model. Remote Sens. Environ. 2018, 209, 594–611. [Google Scholar] [CrossRef]
  8. Cui, L.; Jiao, Z.; Dong, Y.; Sun, M.; Zhang, X.; Yin, S.; Ding, A.; Chang, Y.; Guo, J.; Xie, R. Estimating Forest Canopy Height Using MODIS BRDF Data Emphasizing Typical-Angle Reflectances. Remote Sens. 2019, 11, 2239. [Google Scholar] [CrossRef]
  9. Zhang, X.; Jiao, Z.; Zhao, C.; Yin, S.; Cui, L.; Dong, Y.; Zhang, H.; Guo, J.; Xie, R.; Li, S.; et al. Retrieval of Leaf Area Index by Linking the PROSAIL and Ross-Li BRDF Models Using MODIS BRDF Data. Remote Sens. 2021, 13, 4911. [Google Scholar] [CrossRef]
  10. Cui, L.; Zhang, J.; Dai, Y.; Xie, R.; Zhu, Z.; Sun, M.; Zhang, X.; He, L.; Zhang, H.; Dong, Y.; et al. Influence of BRDF Models and Solar Zenith Angles on Forest Above-Ground Biomass Derived from MODIS Multi-Angular Indices. Forests 2024, 15, 541. [Google Scholar] [CrossRef]
  11. Roberts, G. A Review of the Application of BRDF Models to Infer Land Cover Parameters at Regional and Global Scales. Prog. Phys. Geogr. Earth Environ. 2001, 25, 483–511. [Google Scholar] [CrossRef]
  12. Myneni, R.B.; Asrar, G.; Hall, F.G. A Three-Dimensional Radiative Transfer Method for Optical Remote Sensing of Vegetated Land Surfaces. Remote Sens. Environ. 1992, 41, 105–121. [Google Scholar] [CrossRef]
  13. Li, X.; Strahler, A.H. Geometric-Optical Bidirectional Reflectance Modeling of the Discrete Crown Vegetation Canopy: Effect of Crown Shape and Mutual Shadowing. IEEE Trans. Geosci. Remote Sens. 1992, 30, 276–292. [Google Scholar] [CrossRef]
  14. Wanner, W.; Li, X.; Strahler, A.H. On the Derivation of Kernels for Kernel-Driven Models of Bidirectional Reflectance. J. Geophys. Res. Atmos. 1995, 100, 21077–21089. [Google Scholar] [CrossRef]
  15. Lucht, W.; Schaaf, C.B.; Strahler, A.H. An Algorithm for the Retrieval of Albedo from Space Using Semiempirical BRDF Models. IEEE Trans. Geosci. Remote Sens. 2000, 38, 977–998. [Google Scholar] [CrossRef]
  16. Jiao, Z.; Ding, A.; Kokhanovsky, A.; Schaaf, C.; Bréon, F.-M.; Dong, Y.; Wang, Z.; Liu, Y.; Zhang, X.; Yin, S.; et al. Development of a Snow Kernel to Better Model the Anisotropic Reflectance of Pure Snow in a Kernel-Driven BRDF Model Framework. Remote Sens. Environ. 2019, 221, 198–209. [Google Scholar] [CrossRef]
  17. Jiao, Z.; Schaaf, C.B.; Dong, Y.; Román, M.; Hill, M.J.; Chen, J.M.; Wang, Z.; Zhang, H.; Saenz, E.; Poudyal, R. A Method for Improving Hotspot Directional Signatures in BRDF Models Used for MODIS. Remote Sens. Environ. 2016, 186, 135–151. [Google Scholar] [CrossRef]
  18. Roujean, J.; Leroy, M.; Deschamps, P. A Bidirectional Reflectance Model of the Earth’s Surface for the Correction of Remote Sensing Data. J. Geophys. Res. Atmos. 1992, 97, 20455–20468. [Google Scholar] [CrossRef]
  19. Huang, X.; Jiao, Z.; Dong, Y.; Zhang, H.; Li, X. Analysis of BRDF and Albedo Retrieved by Kernel-Driven Models Using Field Measurements. IEEE J. Sel. Top. Appl. Earth Obs. Remote Sens. 2012, 6, 149–161. [Google Scholar] [CrossRef]
  20. Jin, Y.; Schaaf, C.B.; Gao, F.; Li, X.; Strahler, A.H.; Lucht, W.; Liang, S. Consistency of MODIS Surface Bidirectional Reflectance Distribution Function and Albedo Retrievals: 1. Algorithm Performance. J. Geophys. Res. Atmos. 2003, 108, 2002JD002803. [Google Scholar] [CrossRef]
  21. Li, H.; Yan, K.; Gao, S.; Song, W.; Mu, X. Revisiting the Performance of the Kernel-Driven BRDF Model Using Filtered High-Quality POLDER Observations. Forests 2022, 13, 435. [Google Scholar] [CrossRef]
  22. Chang, Y.; Jiao, Z.; Zhang, X.; Mei, L.; Dong, Y.; Yin, S.; Cui, L.; Ding, A.; Guo, J.; Xie, R.; et al. Assessment of Improved Ross–Li BRDF Models Emphasizing Albedo Estimates at Large Solar Angles Using POLDER Data. IEEE Trans. Geosci. Remote Sens. 2021, 59, 9968–9986. [Google Scholar] [CrossRef]
  23. Wanner, W.; Strahler, A.H.; Hu, B. Global BRDF and Albedo from the EOS MODIS and MISR Sensors. Natl. Remote Sens. Bull. 1997, 143–148. [Google Scholar]
  24. Schaaf, C.B.; Gao, F.; Strahler, A.H.; Lucht, W.; Li, X.; Tsang, T.; Strugnell, N.C.; Zhang, X.; Jin, Y.; Muller, J.-P.; et al. First Operational BRDF, Albedo Nadir Reflectance Products from MODIS. Remote Sens. Environ. 2002, 83, 135–148. [Google Scholar] [CrossRef]
  25. Liu, Y.; Wang, Z.; Sun, Q.; Erb, A.M.; Li, Z.; Schaaf, C.B.; Zhang, X.; Román, M.O.; Scott, R.L.; Zhang, Q.; et al. Evaluation of the VIIRS BRDF, Albedo and NBAR Products Suite and an Assessment of Continuity with the Long Term MODIS Record. Remote Sens. Environ. 2017, 201, 256–274. [Google Scholar] [CrossRef]
  26. EPIC Science Team DSCOVR EPIC L2 Multi-Angle Implementation of Atmospheric Correction (MAIAC) Version 02 2020. Available online: https://asdc.larc.nasa.gov/project/DSCOVR/DSCOVR_EPIC_L2_MAIAC_02 (accessed on 18 May 2025).
  27. Zhang, H.; Jiao, Z.; Dong, Y.; Li, X. Evaluation of BRDF Archetypes for Representing Surface Reflectance Anisotropy Using MODIS BRDF Data. Remote Sens. 2015, 7, 7826–7845. [Google Scholar] [CrossRef]
  28. Schaaf, C.B.; Liu, J.; Gao, F.; Strahler, A.H. Aqua and Terra MODIS Albedo and Reflectance Anisotropy Products. In Land Remote Sensing and Global Environmental Change; Ramachandran, B., Justice, C.O., Abrams, M.J., Eds.; Remote Sensing and Digital Image Processing; Springer: New York, NY, 2010; Volume 11, pp. 549–561. ISBN 978-1-4419-6748-0. [Google Scholar]
  29. Román, M.O.; Justice, C.; Paynter, I.; Boucher, P.B.; Devadiga, S.; Endsley, A.; Erb, A.; Friedl, M.; Gao, H.; Giglio, L.; et al. Continuity between NASA MODIS Collection 6.1 and VIIRS Collection 2 Land Products. Remote Sens. Environ. 2024, 302, 113963. [Google Scholar] [CrossRef]
  30. Román, M.O.; Justice, C.; Csiszar, I.; Key, J.R.; Devadiga, S.; Davidson, C.; Wolfe, R.; Privette, J. Pre-Launch Evaluation of the NPP VIIRS Land and Cryosphere EDRs to Meet NASA’s Science Requirements. In Proceedings of the 2011 IEEE International Geoscience and Remote Sensing Symposium, Vancouver, BC, Canada, 24–29 July 2011; pp. 154–157. [Google Scholar]
  31. Pisek, J.; Rautiainen, M.; Nikopensius, M.; Raabe, K. Estimation of Seasonal Dynamics of Understory NDVI in Northern Forests Using MODIS BRDF Data: Semi-Empirical Versus Physically-Based Approach. Remote Sens. Environ. 2015, 163, 42–47. [Google Scholar] [CrossRef]
  32. Wei, S.; Fang, H.; Schaaf, C.B.; He, L.; Chen, J.M. Global 500 m Clumping Index Product Derived from MODIS BRDF Data (2001–2017). Remote Sens. Environ. 2019, 232, 111296. [Google Scholar] [CrossRef]
  33. Yang, T.; Wang, C.; Li, G.; Luo, S.; Xi, X.; Gao, S.; Zeng, H. Forest Canopy Height Mapping over China Using GLAS and MODIS Data. Sci. China-Earth Sci. 2015, 58, 96–105. [Google Scholar] [CrossRef]
  34. Yang, X.; Liu, Y.; Wu, Z.; Yu, Y.; Li, F.; Fan, W. Forest Age Mapping Based on Multiple-Resource Remote Sensing Data. Environ. Monit. Assess. 2020, 192, 734. [Google Scholar] [CrossRef]
  35. Li, Y.; Jiao, Z.; Zhao, K.; Dong, Y.; Zhou, Y.; Zeng, Y.; Xu, H.; Zhang, X.; Hu, T.; Cui, L. Influence of Varying Solar Zenith Angles on Land Surface Phenology Derived from Vegetation Indices: A Case Study in the Harvard Forest. Remote Sens. 2021, 13, 4126. [Google Scholar] [CrossRef]
  36. Lucht, W.; Roujean, J.-L. Considerations in the Parametric Modeling of BRDF and Albedo from Multiangular Satellite Sensor Observations. Remote Sens. Rev. 2000, 18, 343–379. [Google Scholar] [CrossRef]
  37. Wolfe, R.E.; Nishihama, M.; Lin, G.; Tewari, K.P.; Montano, E. MODIS and VIIRS Geometric Performance Comparison. In Proceedings of the 2012 IEEE International Geoscience and Remote Sensing Symposium, Munich, Germany, 22–27 July 2012; pp. 5017–5020. [Google Scholar]
  38. Cao, C.; DeLuccia, F.J.; Xiong, X.; Wolfe, R.; Weng, F. Early On-Orbit Performance of the Visible Infrared Imaging Radiometer Suite Onboard the Suomi National Polar-Orbiting Partnership (S-NPP) Satellite. IEEE Trans. Geosci. Remote Sens. 2014, 52, 1142–1156. [Google Scholar] [CrossRef]
  39. Zhang, Z.; Zhang, Y.; Chen, J.M.; Ju, W.; Migliavacca, M.; El-Madany, T.S. Sensitivity of Estimated Total Canopy SIF Emission to Remotely Sensed LAI and BRDF Products. J. Remote Sens. 2021, 2021, 9795837. [Google Scholar] [CrossRef]
  40. Baret, F.; Morissette, J.T.; Fernandes, R.A.; Champeaux, J.L.; Myneni, R.B.; Chen, J.; Plummer, S.; Weiss, M.; Bacour, C.; Garrigues, S.; et al. Evaluation of the Representativeness of Networks of Sites for the Global Validation and Intercomparison of Land Biophysical Products: Proposition of the CEOS-BELMANIP. IEEE Trans. Geosci. Remote Sens. 2006, 44, 1794–1803. [Google Scholar] [CrossRef]
  41. Weiss, M.; Baret, F.; Block, T.; Koetz, B.; Burini, A.; Scholze, B.; Lecharpentier, P.; Brockmann, C.; Fernandes, R.; Plummer, S. On Line Validation Exercise (OLIVE): A Web Based Service for the Validation of Medium Resolution Land Products. Application to FAPAR Products. Remote Sens. 2014, 6, 4190–4216. [Google Scholar] [CrossRef]
  42. Garrigues, S.; Lacaze, R.; Baret, F.; Morisette, J.T.; Weiss, M.; Nickeson, J.E.; Fernandes, R.; Plummer, S.; Shabanov, N.V.; Myneni, R.B.; et al. Validation and Intercomparison of Global Leaf Area Index Products Derived from Remote Sensing Data. J. Geophys. Res. Biogeosci. 2008, 113. [Google Scholar] [CrossRef]
  43. Ma, X.; Huete, A.; Tran, N.N.; Bi, J.; Gao, S.; Zeng, Y. Sun-Angle Effects on Remote-Sensing Phenology Observed and Modelled Using Himawari-8. Remote Sens. 2020, 12, 1339. [Google Scholar] [CrossRef]
  44. Cao, C.; Xiong, J.; Blonski, S.; Liu, Q.; Uprety, S.; Shao, X.; Bai, Y.; Weng, F. Suomi NPP VIIRS Sensor Data Record Verification, Validation, and Long-Term Performance Monitoring. J. Geophys. Res. Atmos. 2013, 118, 11664–11678. [Google Scholar] [CrossRef]
  45. Campagnolo, M.L.; Sun, Q.; Liu, Y.; Schaaf, C.; Wang, Z.; Román, M.O. Estimating the Effective Spatial Resolution of the Operational BRDF, Albedo, and Nadir Reflectance Products from MODIS and VIIRS. Remote Sens. Environ. 2016, 175, 52–64. [Google Scholar] [CrossRef]
  46. Dong, Y.; Jiao, Z.; Cui, L.; Zhang, H.; Zhang, X.; Yin, S.; Ding, A.; Chang, Y.; Xie, R.; Guo, J. Assessment of the Hotspot Effect for the PROSAIL Model with POLDER Hotspot Observations Based on the Hotspot-Enhanced Kernel-Driven BRDF Model. IEEE Trans. Geosci. Remote Sens. 2019, 57, 8048–8064. [Google Scholar] [CrossRef]
Figure 1. Global distribution of the 359 vegetation-covered sites selected from the BELMANIP 2.1 network.
Remotesensing 17 01803 g001
Figure 2. Scatter plots between the MODIS and VIIRS BRDF parameters in the red band (top) and NIR band (bottom).
Remotesensing 17 01803 g002
Figure 3. Spatial distributions of the relative differences in the monthly mean BRDF parameters from MODIS and VIIRS in the red band (ac) and NIR band (df) across the CONUS in August 2016.
Remotesensing 17 01803 g003
Figure 4. Spatial distribution of the coefficient of variation in time-series BRDF parameters for each pixel from MODIS and VIIRS in the red band (af) and NIR band (gl) over CONUS for August 2016.
Remotesensing 17 01803 g004
Figure 5. Distributions of the means and standard deviations of three BRDF parameters, Rhot, and Rdark in the bar graphs as functions of different NDHD ranges (intervals of 0.1). The left panel shows the results for the red band, and the right panel shows the results for the NIR band. The subplots on the right and top sides of the bar graphs present the probability density as functions of the variables mentioned above.
Remotesensing 17 01803 g005
Figure 6. The variation in the proportion of zero-valued pixels with fvol (top) and fgeo (bottom) for each month in the MODIS and VIIRS BRDF products using 359 sites (2015–2017) from the BELMANIP 2.1 network. The left panel shows the results for the red band, and the right panel shows the results for the NIR band.
Remotesensing 17 01803 g006
Figure 7. The variation in the proportion of zero-valued pixels with fvol (top) and fgeo (bottom) for each IGBP class of 12 IGBP classes (including forests, shrubs, grasslands, crops, etc.) in the MODIS and VIIRS BRDF products using 359 sites (2015–2017) from the BELMANIP 2.1 network. The left panel shows the results for the red band, and the right panel shows the results for the NIR band.
Remotesensing 17 01803 g007
Figure 8. Global distributions of the zero-value differences in the BRDF parameters (fvol and fgeo) between MODIS and VIIRS (fVIIRSfMODIS) in the red band (a,b) and NIR band (c,d).
Remotesensing 17 01803 g008
Figure 9. Impact of setting fvol to zero on the simulation of typical directional reflectance (Rhot and Rdark) and NDHD estimation in the red band (top) and NIR band (bottom).
Remotesensing 17 01803 g009
Figure 10. Impacts of setting fvol to zero on the daily and monthly NDHD estimation results. The results for four sites are shown, with each subplot labeled with the site’s IGBP class and specific latitude and longitude information. For the daily NDHD time series, the vertical lines in the background indicate whether fvol value is zero for the corresponding sensor; the blue vertical lines represent that the MODIS fvol value is zero, and the green vertical lines represent that the VIIRS fvol value is zero.
Remotesensing 17 01803 g010aRemotesensing 17 01803 g010b
Table 1. Statistical comparison of BRDF parameters and derived indices between MODIS and VIIRS in red and NIR bands using 359 sites (2015–2017) from BELMANIP 2.1 network.
BandMetricRMSER2BiasrRMSE (%)
Redfiso0.04880.9035−0.001333.37
fvol0.07150.0666−0.0027139.34
fgeo0.02290.19110.0002105.83
Rhot0.07410.8187−0.003339.21
Rdark0.03520.9434−0.001231.62
WSA0.03700.9403−0.002129.27
BSA0.03410.9475−0.001628.79
NDHD0.18950.23880.015753.32
NIRfiso0.06480.7477−0.012719.78
fvol0.13860.11220.002080.23
fgeo0.04000.15330.002992.62
Rhot0.08560.6510−0.011220.43
Rdark0.04760.8597−0.016719.19
WSA0.05170.8411−0.016317.17
BSA0.04390.8822−0.016516.05
NDHD0.11240.19210.023041.78
Disclaimer/Publisher’s Note: The statements, opinions and data contained in all publications are solely those of the individual author(s) and contributor(s) and not of MDPI and/or the editor(s). MDPI and/or the editor(s) disclaim responsibility for any injury to people or property resulting from any ideas, methods, instructions or products referred to in the content.

