Article

Cross-Level Adaptive Feature Aggregation Network for Arbitrary-Oriented SAR Ship Detection

1
School of Information and Communication Engineering, University of Electronic Science and Technology of China, Chengdu 611731, China
2
School of Aeronautics and Astronautics, Xihua University, Sichuan 610039, China
*
Author to whom correspondence should be addressed.
Remote Sens. 2025, 17(10), 1770; https://doi.org/10.3390/rs17101770
Submission received: 9 April 2025 / Revised: 14 May 2025 / Accepted: 15 May 2025 / Published: 19 May 2025

Abstract

:
The rapid progress of deep learning has significantly enhanced the development of ship detection using synthetic aperture radar (SAR). However, the diversity of ship sizes, arbitrary orientations, densely arranged ships, etc., have been hindering the improvement of SAR ship detection accuracy. In response to these challenges, this study introduces a new detection approach called a cross-level adaptive feature aggregation network (CLAFANet) to achieve arbitrary-oriented multi-scale SAR ship detection. Specifically, we first construct a hierarchical backbone network based on a residual architecture to extract multi-scale features of ship objects from large-scale SAR imagery. Considering the multi-scale nature of ship objects, we then resort to the idea of self-attention to develop a cross-level adaptive feature aggregation (CLAFA) mechanism, which can not only alleviate the semantic gap between cross-level features but also improve the feature representation capabilities of multi-scale ships. To better adapt to the arbitrary orientation of ship objects in real application scenarios, we put forward a frequency-selective phase-shifting coder (FSPSC) module for arbitrary-oriented SAR ship detection tasks, which is dedicated to mapping the rotation angle of the object bounding box to different phases and exploits frequency-selective phase-shifting to solve the periodic ambiguity problem of the rotated bounding box. Qualitative and quantitative experiments conducted on two public datasets demonstrate that the proposed CLAFANet achieves competitive performance compared to some state-of-the-art methods in arbitrary-oriented SAR ship detection.

1. Introduction

On account of its outstanding operating characteristics such as all-day and all-night, all-weather, long-range, high-resolution imaging and so forth, synthetic aperture radar (SAR) serves as an essential tool for marine domain awareness and monitoring. Ship detection plays a significant role in the interpretation of SAR images, which is intended to mine crucial intelligence information from large-scale SAR images in complex sea situations. In the early days, under the paradigm of constant false alarm rate (CFAR) detection, a variety of CFAR variants [1,2,3,4] were proposed for SAR ship detection tasks. It is well known that the reliability of a CFAR-based detector is highly dependent on the detection threshold calculated from the statistical distribution of sea clutter. Nevertheless, it is difficult to effectively analyze the statistical traits of sea clutter and ship objects under some distribution model assumptions due to the complex and variable characteristics of the ocean environment. In addition, it is worth mentioning that the detection inefficiency of CFAR-based detectors is due to non-end-to-end processing. Therefore, the performance of CFAR-based detectors is often undesirable in complex ocean scenes.
As of late, deep learning technology has flourished across various applications due to its ability for end-to-end spontaneous learning. In the field of SAR image interpretation, deep learning demonstrates broad applicability across tasks such as object detection, recognition, and tracking. Among them, as an upstream task of SAR image interpretation, the quality of object detection is bound to affect the decision-making results of subsequent recognition and tracking tasks. As a consequence, scholars have recently put their efforts into deep learning-based SAR target detection and proposed a series of detection algorithms with excellent achievements [5,6,7,8,9,10,11]. For instance, Cui et al. [12] integrated the spatial shuffle-group attention mechanism with CenterNet [13] to achieve object detection in large-scale SAR imagery. Fan et al. [14] came up with an improved YOLO [15,16] network to promote the detection performance of small objects. Fu et al. [17] presented an anchor-free approach relying on feature balancing and refinement networks to achieve multi-scale SAR ship object detection. Guo et al. [18] proposed an enhanced version of CenterNet, i.e., CenterNet++, to achieve densely arranged ship object detection in large-scale SAR imagery. Zhou et al. [19] devised an anchor-free framework with multi-level feature refinement to boost the detection accuracy of multi-scale ship objects in large-scale SAR imagery.
It is well known that the above-mentioned methods all have a common assumption that the ship object is parked on the sea in a horizontal direction. Although these methods perform better than traditional object detection methods, they are extremely unrobust in complex application scenarios, especially in scenarios with densely arranged ships, complex sea clutter, etc., as shown in Figure 1a. As illustrated by the detection results in Figure 1a, it is clear that the horizontal detection boxes cannot be better matched with the ship area, which makes it easy to miss detection. In other words, the horizontal bounding box is not suitable for arbitrary-oriented ship detection in complex SAR application scenarios.
In response to the limitations of horizontal boxes in practical application, rotating boxes have been proposed as an alternative to strengthen the applicability of deep learning-based detection methods in practical scenarios. The rotating boxes are capable of adapting to changes in object orientation, which can avoid the overlapping of adjacent target detection boxes, thus alleviating the problem of missing detection, as shown in Figure 1b. Therefore, scholars have recently put a lot of effort into carrying out arbitrary-orientated ship detection in large-scale SAR imagery. To list a few examples, Sun et al. [20] proposed a multi-scale feature balancing arbitrary-oriented detection framework to achieve SAR ships detection. Xie et al. [21] proposed a feature refinement and calibration method to extract more discriminative features for arbitrary-orientated SAR ship detection tasks. Zhang et al. [22] presented a dynamic label assignment mechanism for oriented remote sensing object detection. Fu et al. [23] devised a scattering-keypoint-guided network to achieve ship object detection in high-resolution SAR imagery. Sun et al. [24] developed a strong scattering point network for oriented ship detection in large-scale SAR images. However, the above methods fail to address the inherent limitation of rotated bounding boxes, angle periodicity ambiguity. Zhou et al. [25] proposed an elliptical representation-based rotated bounding detector for ship detection tasks. Ju et al. [26] proposed a five-parameter polar coordinate representation method to characterize rotation for arbitrary-oriented SAR ship detection tasks, which are capable of addressing the problem of rotated bounding box (RBB) boundary discontinuity. However, these methods have two shortcomings that make them unable to solve the angle period ambiguity problem well. One is that the loss function takes into account more constraints to avoid local optimal solutions. Another is that the back propagation chain is so complicated that it is prone to the gradient disappearance problem.
Furthermore, it should be mentioned that ship objects in large-scale SAR imagery often exhibit the characteristics of multi-scale detection in real application scenarios, as shown in Figure 2. In other words, the detection model needs to adapt not only to changes in the orientation of the ship but also to changes in scale. For this purpose, scholars have recently conducted extensive exploration into multi-scale ship object detection in large-scale SAR imagery. For instance, Liu et al. [27] presented a multi-scale feature pyramid network embedding with a spatial information-focusing function to achieve multi-scale ship detection in SAR imagery. Zhao et al. [28] devised a pyramid attention expansion network to improve the detection accuracy of aircraft objects in SAR imagery. Wan et al. [29] developed a multi-scale enhancement representation learning approach to obtain rich multi-scale features of ship objects in large-scale SAR imagery. The above-mentioned methods introduce a variety of attention mechanisms to enhance the detection quality of SAR detection tasks. However, a crucial problem is ignored in most detection methods, that is, the semantic gap in feature fusion, which results in unbalanced detection effects of objects with various scales. Therefore, in order to solve the semantic gap problem in feature fusion, Tang et al. [30] proposed to integrate a deformable convolution into the top-down path of the feature pyramid, aiming to alleviate the semantic gap problem of multi-scale feature fusion. Wan et al. [31] proposed semantic flow alignment and Gaussian label matching to achieve small ship object detection. The above methods demonstrate that the semantic gap remains a critical bottleneck in multi-scale feature fusion, and existing approaches still fail to address this issue effectively. In feature fusion, exploring the correlations between features can better maintain feature consistency and thus bridge the semantic gap. Therefore, we propose a cross-level adaptive feature aggregation mechanism to address the semantic gap problem.
To summarize, existing methods have made significant progress in SAR ship detection by leveraging deep learning techniques, introducing rotated bounding boxes to handle arbitrary orientations, and developing multi-scale feature fusion strategies to address scale variations. However, these approaches still face several challenges: (1) Horizontal bounding box-based methods are limited in complex scenarios with dense arrangements and arbitrary orientations, often resulting in inaccurate detections. (2) While rotated bounding box methods improve localization for oriented objects, they introduce new problems such as angle periodicity ambiguity, which are not fully addressed by current solutions. (3) Multi-scale feature fusion methods enhance detection performance for objects of varying sizes, but the semantic gap between features at different levels remains a critical bottleneck, leading to inconsistent detection performance.
In light of the challenges above, we put forward a cross-level adaptive feature aggregation network to achieve arbitrary-oriented ship detection in large-scale SAR imagery. The main contributions and novelties of this paper are summarized as follows:
(1)
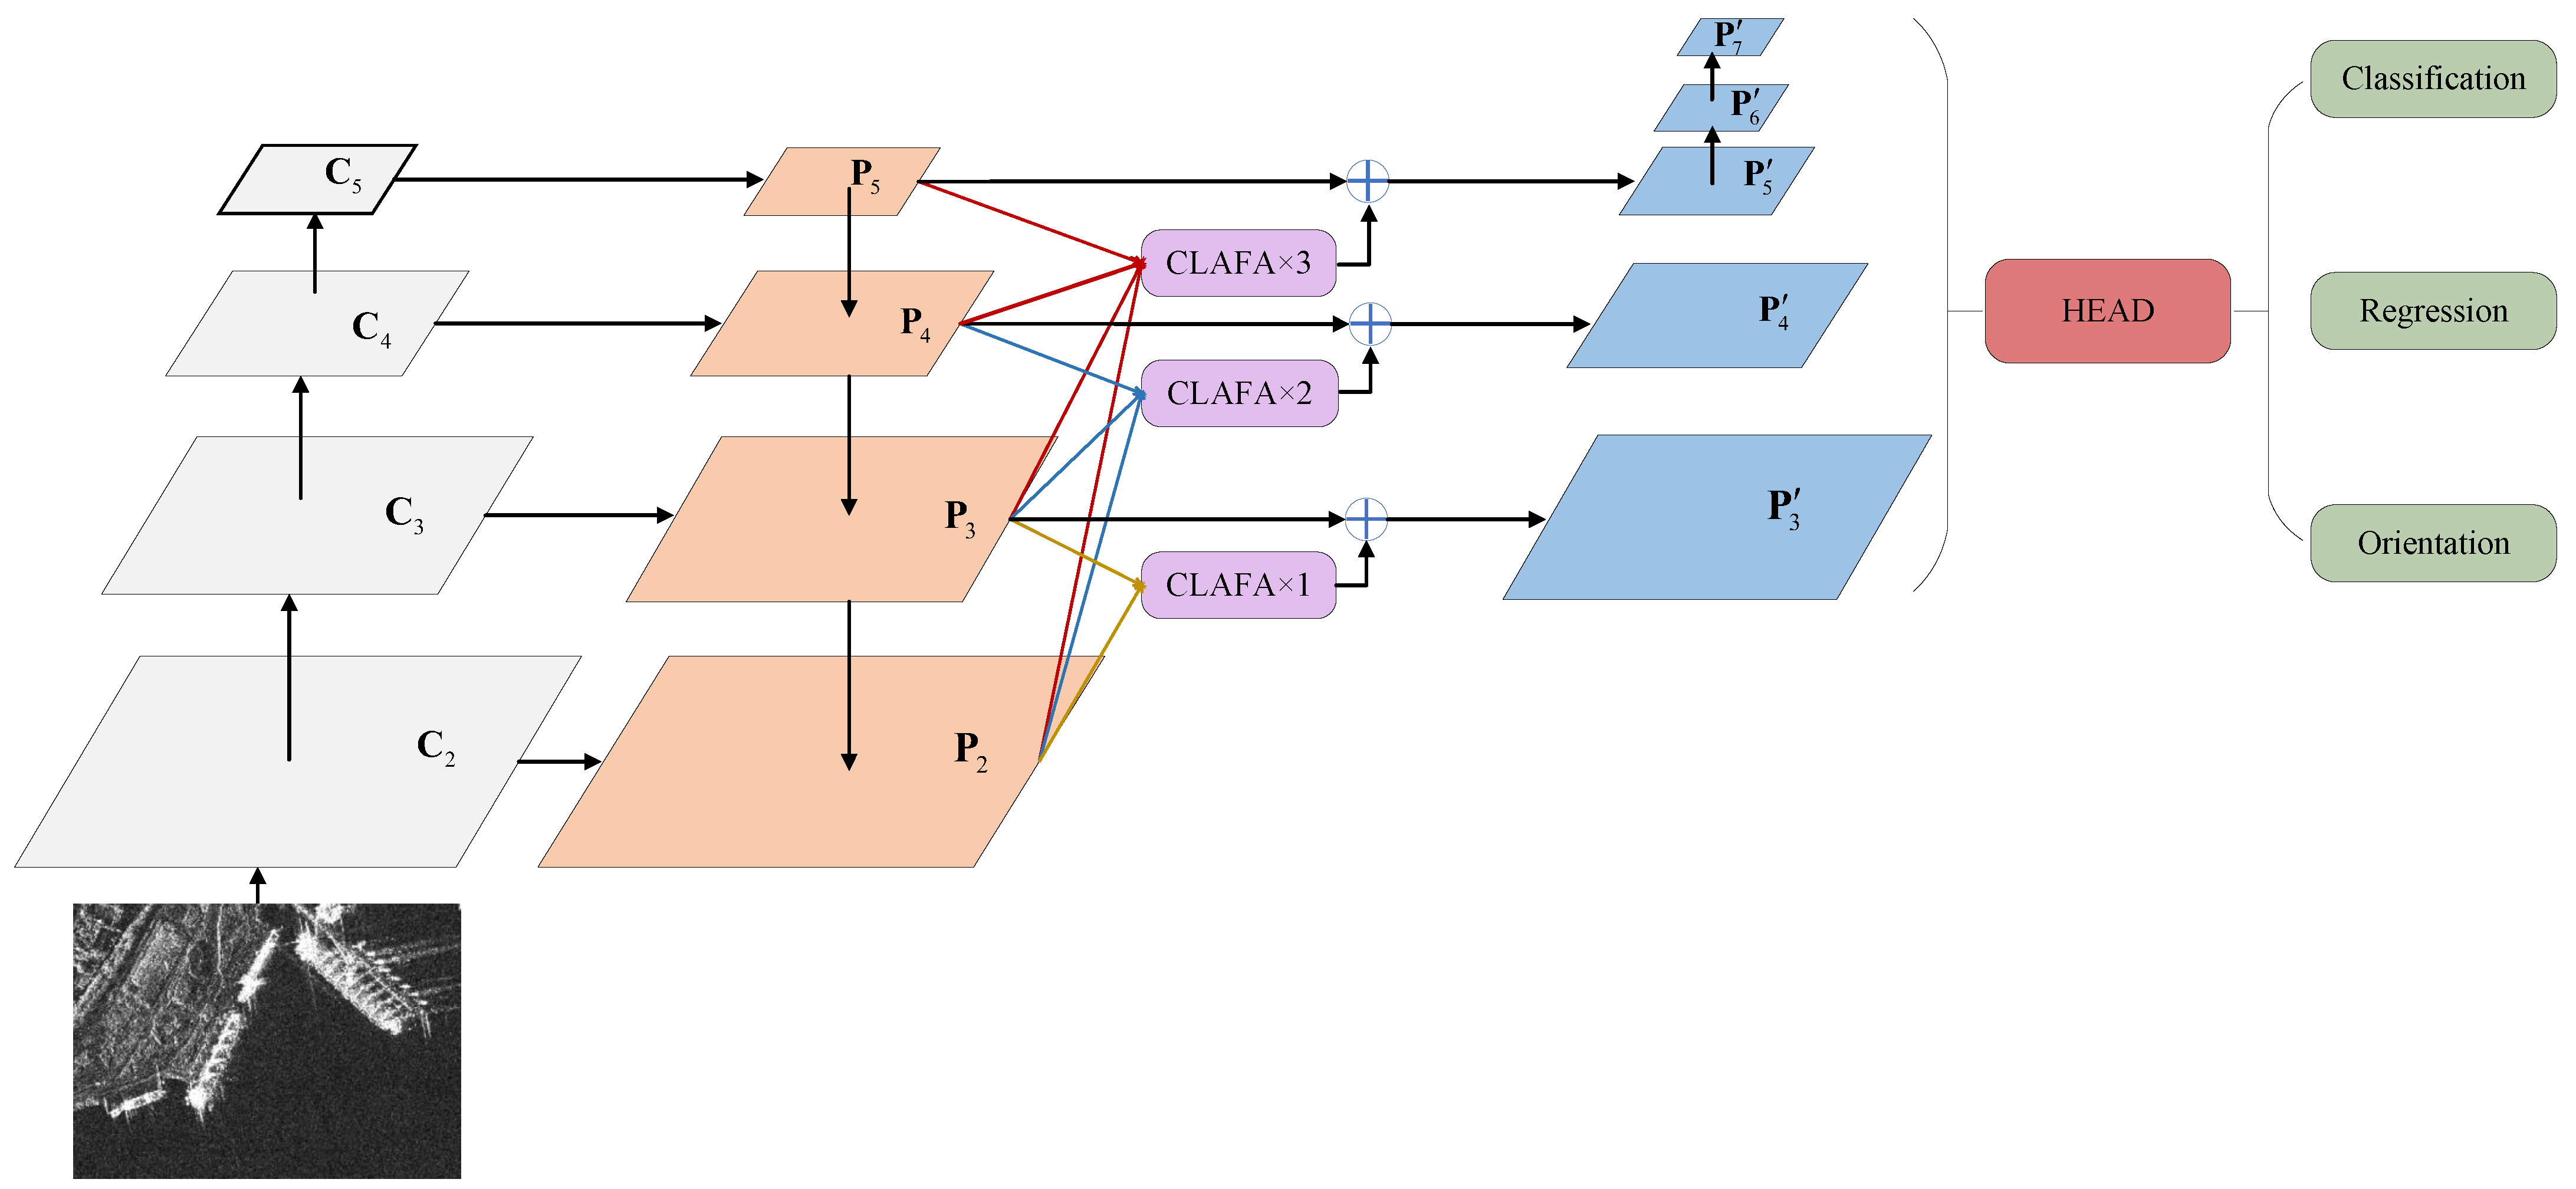
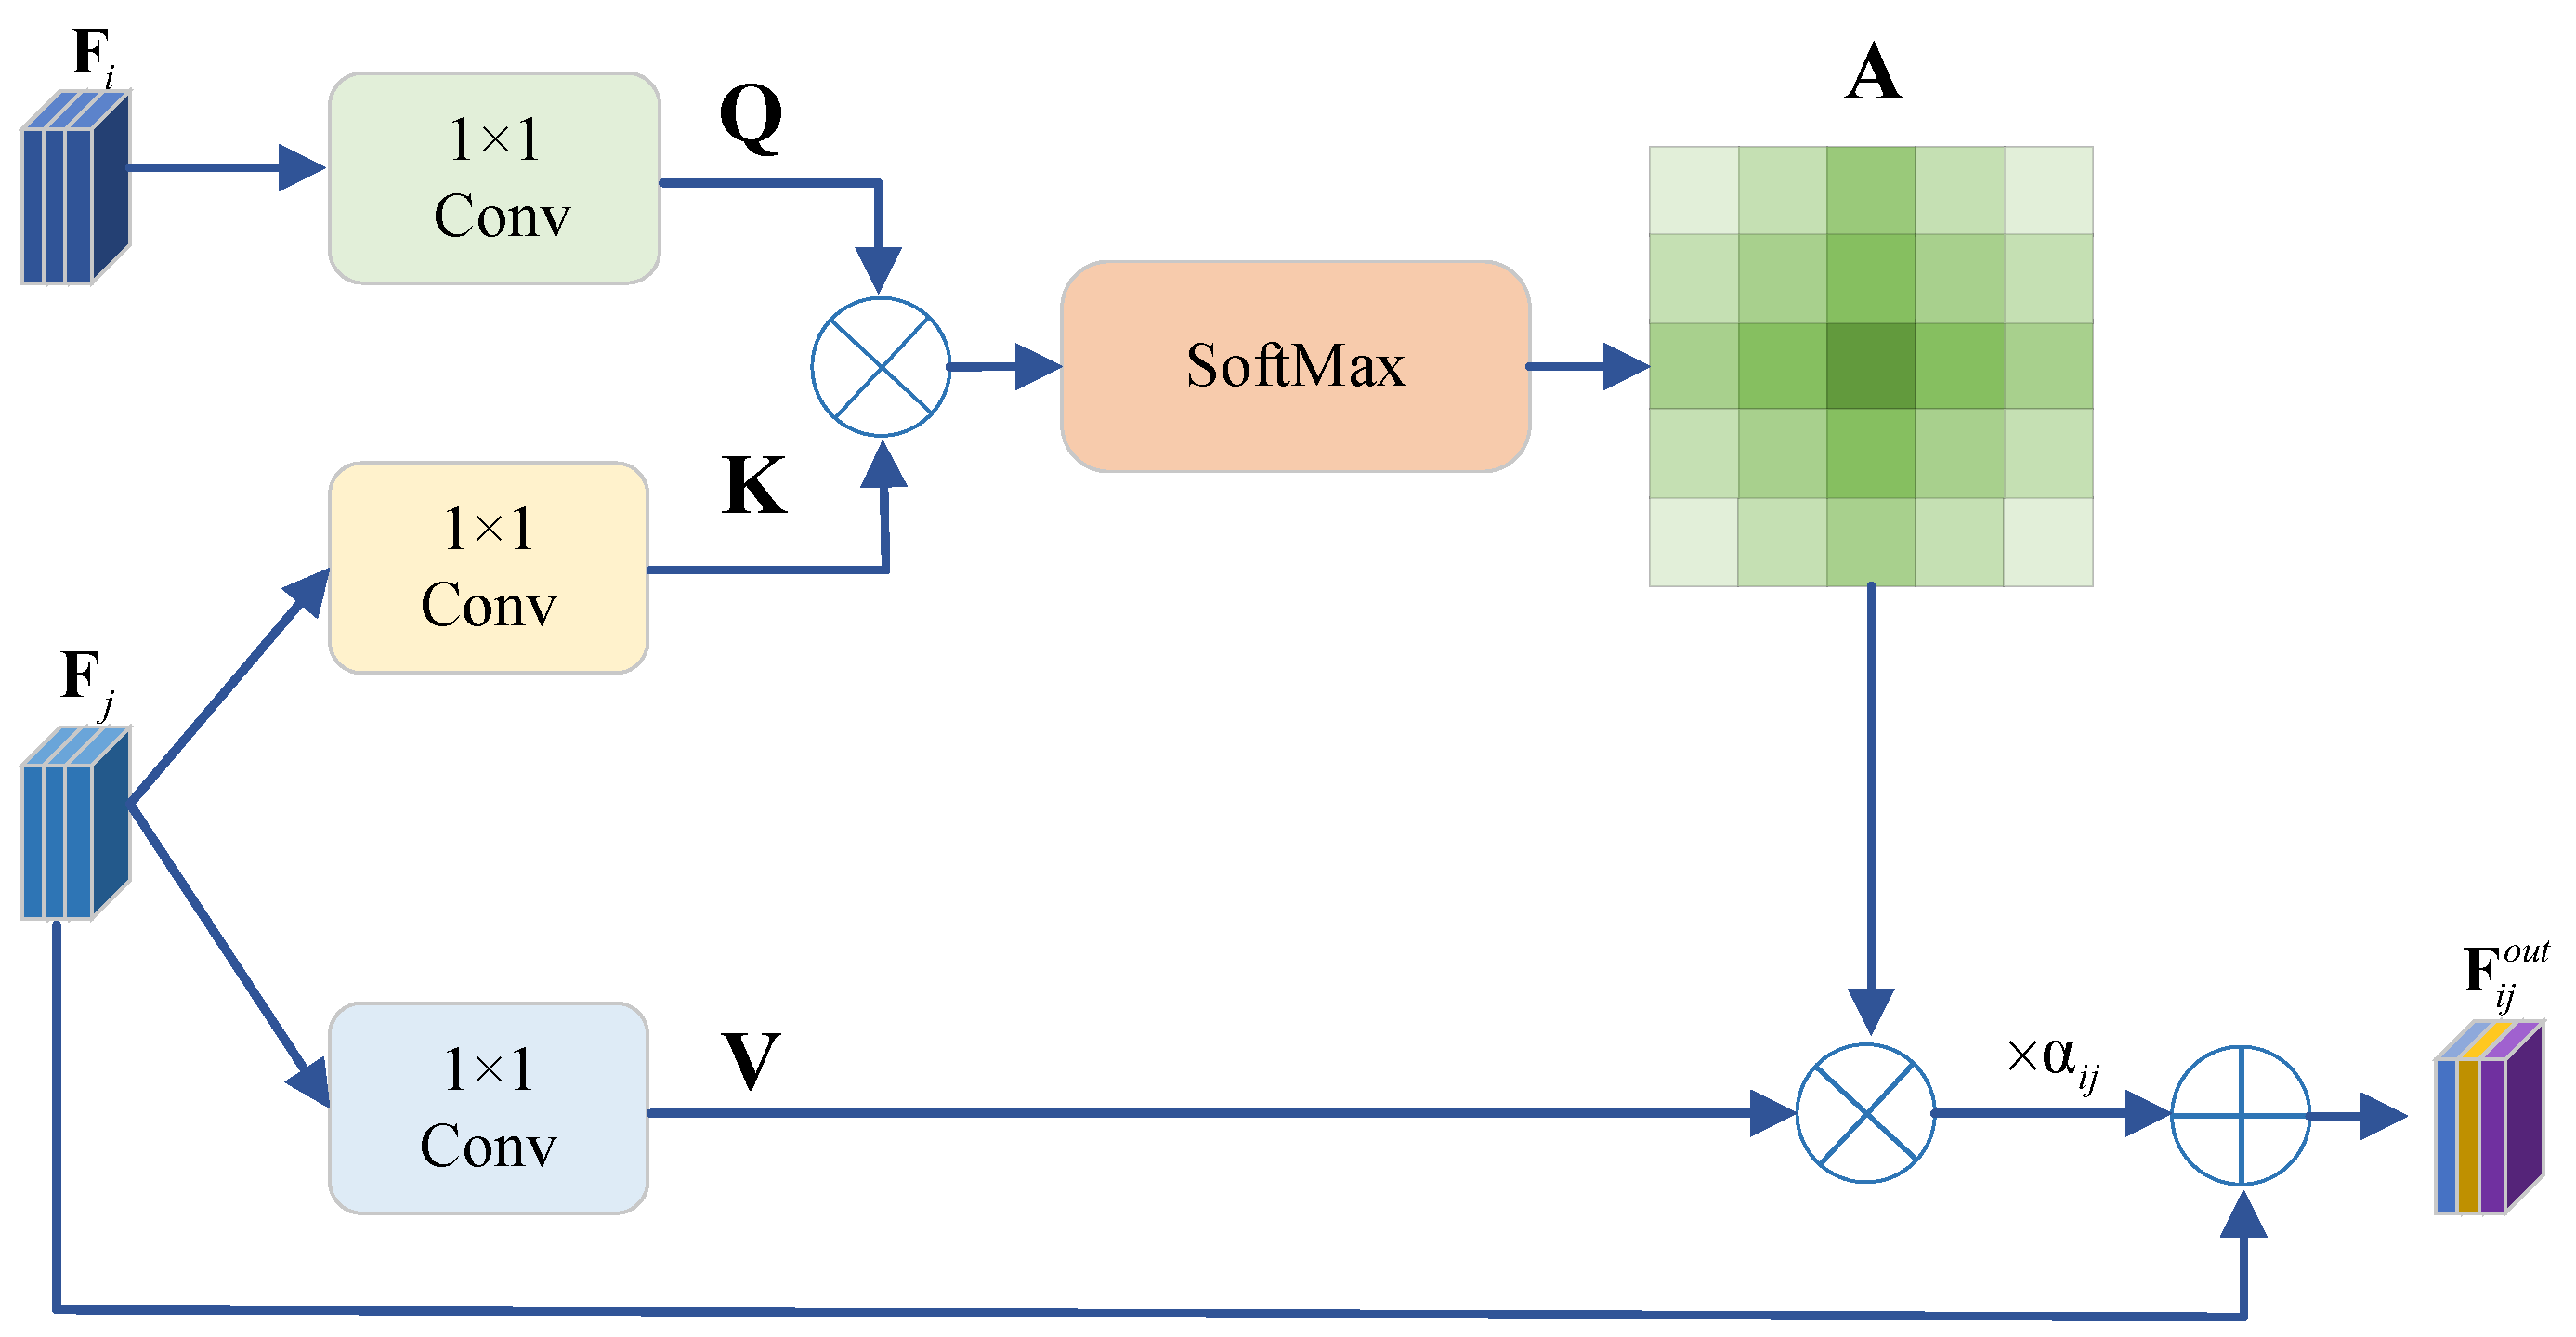
In response to the semantic gap in the multi-level feature fusion stage, we propose a cross-level adaptive feature aggregation mechanism, which resorts to the cross-level feature similarity to achieve multi-scale adaptive feature fusion. The proposed module utilizes the self-attention-based similarity calculation mechanism but is equipped with a unique cross-level global acceptance field, which enables shallow features extracted from shallow layers of the backbone to capture similarities with deep features extracted from later deep layers. Briefly speaking, the proposed method is capable of assigning weights to shallow features based on similarity to ensure consistency between features at different levels, thereby solving the semantic gap problem inherent in feature pyramids.
(2)
To effectively address the angle period ambiguity problem of rotated bounding box detection, we propose a frequency-selective phase-shifting coder. By mapping angles to cosine functions, it achieves a continuous representation of angles. Moreover, considering the inherent differences in periodic ambiguity between rectangular and square shapes, the encoder uses frequency selection to map angles of different shapes, ensuring the correctness of shape-specific encoding.
(3)
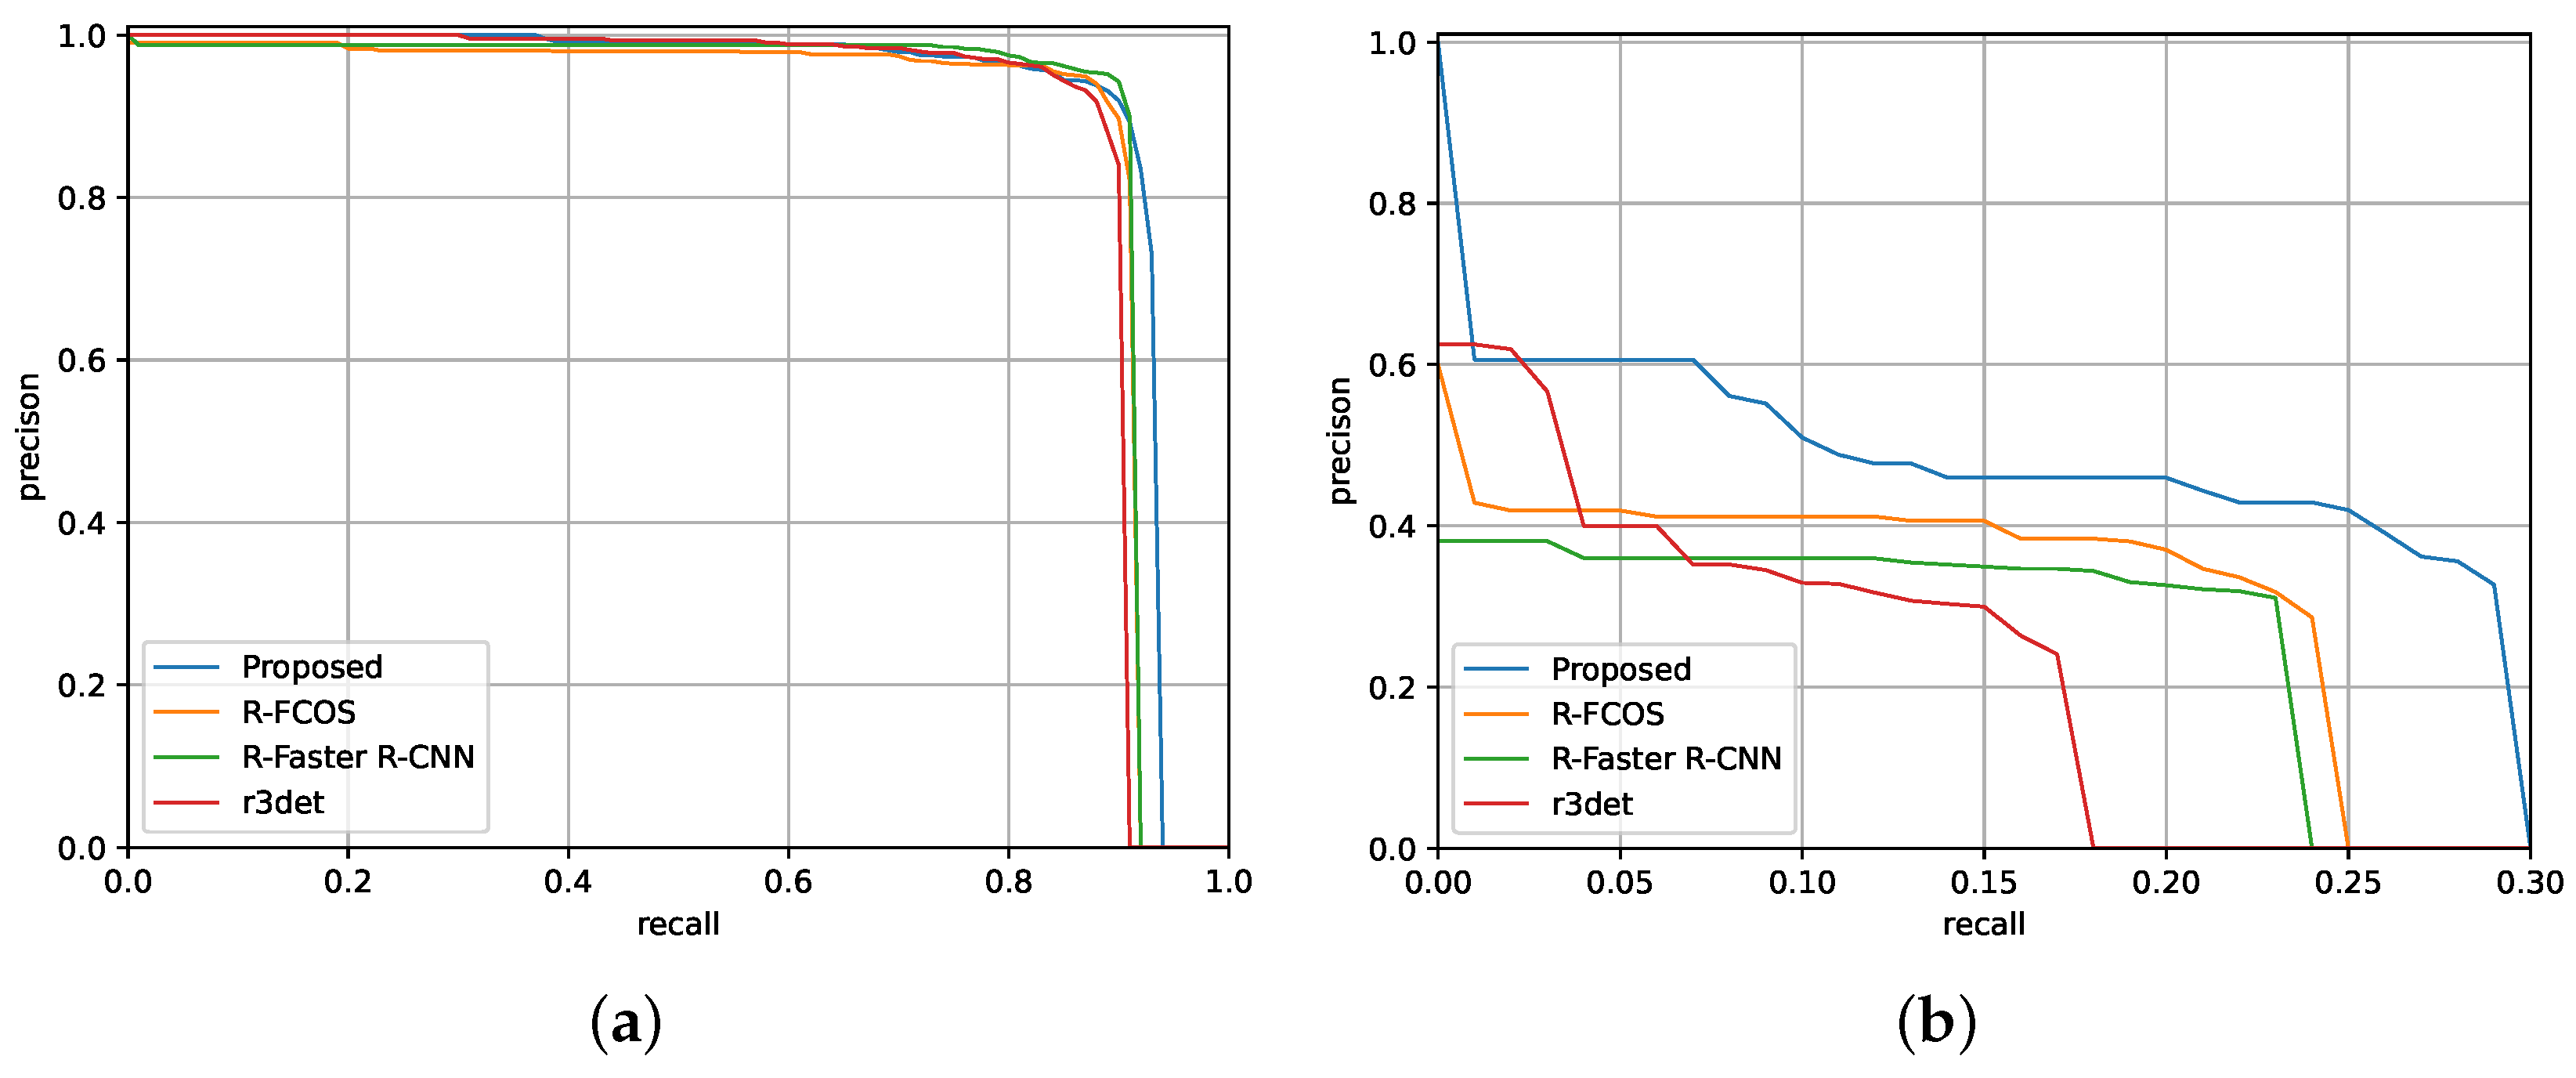
To demonstrate the effectiveness of the proposed approach, extensive qualitative and quantitative experiments are carried out on two publicly accessible baseline datasets. A set of ablation tests and analytical experiments comprehensively demonstrate the reliability of the proposed method. Moreover, the experimental results of two types of comprehensive evaluation protocols and precision–recall (PR) curves on two public datasets illustrate that the proposed method is superior to state-of-the-art SAR ship detection methods.
The remainder of this paper is arranged as follows. Section 2 elaborates on the overall flowchart and key components of the proposed method. In Section 3, many qualitative and quantitative experiments are performed on two publicly accessible datasets to analyze and demonstrate the effectiveness of the proposed approach. Section 4 provides the conclusion of this paper.

2. Methodology

2.1. Overview

It is well recognized that anchor-free methods, by regressing edges directly rather than using predefined anchor boxes, are capable of detecting objects of various shapes. In the academic community, the anchor-free detection framework is recognized for two merits, i.e., simple network architecture and efficient training and inference. In view of these advantages, the anchor-free architecture serves as the foundational framework for the proposed method. The overall framework of our CLAFANet is composed of three components, i.e., feature extraction, feature fusion, and multi-task detection heads, as is depicted in Figure 3. Considering the powerful feature abstraction capability of the residual network, we leverage ResNet50 [32] as the backbone network to extract features across multiple levels. In the feature fusion component, the classic feature pyramid network (FPN) [33] is employed as the foundational structure, and we resort to the self-attention [34] mechanism to achieve cross-level adaptive feature fusion, so as to eliminate the semantic gap for multi-scale feature fusion. As shown in Figure 3, { C 2 , C 3 , C 4 , C 5 } represent the output feature maps from different levels of the backbone network. { P 2 , P 3 , P 4 , P 5 } denote the multi-scale feature maps initially fused by the FPN. { P 3 , P 4 , P 5 } correspond to the features processed by the CLAFA module to address the semantic gap problem. In addition, { P 6 , P 7 } are generated specifically for large-scale objects. It should be specifically noted that, for all the aforementioned feature layers, the spatial dimensions at the i-th layer are given by ( H / s i ) × ( W / s i ) , where H and W denote the height and width of input SAR image and s i = 2 i ( i = 2 , , 7 ) indicates the downsampling factor at the i-th layer. The multi-task detection head is composed of classification, regression, and orientation prediction. Among them, the classification component and regression component are constructed with four convolutional layers, respectively. In order to conveniently characterize the rotating object with any orientation, the five-parameter representation is adopted, i.e., (x, y, w, h, θ ), in which (x, y) denotes the coordinates of the center point and w, h, and θ represent the width, height, and angle of the rotated bounding box. The rotation angle θ is defined within the range of [ π /2, + π /2), where θ = 0 corresponds to the positive x-axis. A detailed introduction to the proposed method is provided in the following.

2.2. Cross-Level Feature Fusion

Feature pyramid networks are the primary method for achieving multi-level feature fusion in deep learning object detection frameworks. Nevertheless, the inherent defects of FPNs restrict the detection capability of multi-scale ship detection in large-scale SAR imagery. Generally speaking, on one hand, there exists a notable semantic discrepancy between low-level features and high-level features due to their distinct levels of abstraction, which makes the effective integration of multi-scale features face major challenges. On the other hand, traditional FPN fusion strategies with the top-down path only propagate semantic information along one direction, which limits the capability of the network to obtain detailed information and positioning information. Over the years, scholars have continued to improve on these deficiencies, but they have not yet obtained an admirable result. As a consequence, we propose a cross-level adaptive feature aggregation (CLAFA) mechanism to achieve cross-level feature fusion under the framework of a FPN. To be specific, on the basis of self-attention, the CLAFA first calculates the correlation between each pair of pixels in different feature layers to weight all pixels accordingly and then achieves feature fusion under the condition of ensuring feature scale consistency. In addition, we construct dual-path information transmission with top-down and bottom-up to transmit low-level localization information to higher-level ones, aiming to enhance the localization information of the ship objects. The detailed framework of cross-level feature fusion is drawn in Figure 3. Among them, the CLAFA module is plotted in Figure 4. Unlike traditional self-attention, where Q, K, and V are generated from the same feature map, the CLAFA constructs Q, K, and V from different levels of the feature pyramid, enabling adaptive cross-scale correlation modeling. This design allows the CLAFA to bridge the semantic gap and aggregate complementary information across scales, which is particularly beneficial for complex SAR ship detection scenarios. Hereinafter, the CLAFA module is introduced in detail.
Let F i and F j be two features from any level P 2 P 5 in the feature pyramid network, which can be used as the input of the cross-level adaptive feature aggregation module, as demonstrated in Figure 4. It should be emphasized that F j is a shallower feature than F i . Mathematically, it can be expressed as follows:
j = 2 , 3 , 4 i = 5 2 , 3 i = 4 2 i = 3
In order to minimize the semantic gap in the process of cross-level feature fusion, the proposed cross-level adaptive feature aggregation module resorts to the idea of a self-attention mechanism to integrate the low-level features into high-level features according to the underlying correlation between different level features. Concretely, F i R C × ( H / s i ) × ( W / s i ) , in which H and W symbolize the height and width of the input SAR image and s i represents the scale of subsamples at the i-th layer. First, F i is reshaped as a new feature Q with the size of R N i × C after passing through the convolution operation with a kernel size of 1 × 1, where N i = (H/ s i ) × (W/ s i ). Likewise, F j is reshaped as a feature K R C × N i after being fed to the convolution operation with a kernel size of 1 × 1. Then, Q and K are multiplied in an element-wise operation to make it easier to calculate the spatial correlation between the two features. Generally, the above process is mathematically represented as follows:
Q = c o n v 1 ( W 1 ; F i )
K = c o n v 2 ( W 2 ; F j )
A = s o f t m a x ( r e s h a p e ( Q ) × r e s h a p e ( K ) )
where A describes the semantic correlation of two features in different spatial positions. Among them,
a i j = A ( i , j ) = e x p ( Q i · K j ) i = 1 N i e x p ( Q i · K j )
where W 1 and W 2 , respectively, denote the parameters to be learned for the two convolution kernels, both having a size of 1 × 1, and a i j represents the correlation of the i-th location of F i on the j-th location of F j . By doing so, it is capable of learning the correlation between features from distinct levels, which is beneficial to alleviate the problem of semantic inconsistency between features across multiple levels.
Similarly, the feature F j is reshaped as the feature V via a convolution operation with the kernel size of 1 × 1. To integrate the features of the i-th level into the j-th level, a controllable contribution parameter α i j is introduced, i.e.,
F i j = α i j · V · A T
where α i j is a learnable parameter initialized to 0.
Finally, we leverage the skip connection to reuse the feature F j to minimize the loss of useful information in this level, yielding:
F i j o u t = F i j F j
where ⊕ refers to element-wise addition operation.
Based on the above cross-level adaptive feature aggregation method, the semantic gap between features from distinct levels can be alleviated by effectively mining the correlation between features at different levels, thereby boosting the model’s proficiency in identifying objects of varying sizes effectively.

2.3. Multi-Task Detection Heads

The proposed multi-task detection head consists of three components, i.e., the regression, classification, and orientation prediction tasks, as plotted in Figure 5. These branches operate at each spatial location of the fused feature maps P i ( i = 3 , , 7 ) . For every position on these feature maps, the branches jointly predict the presence of an object, the bounding box parameters, and the orientation. By densely applying these predictions across all locations and levels, the network generates multiple candidate bounding boxes for each input image. The final detections are obtained after post-processing such as non-maximum suppression. In the following, the multi-task detection head is introduced in detail.

2.3.1. Regression Task

The regression head is an important component of the target detection framework, which is responsible for regression prediction of the object position. In the object position regression head, the features of all levels fused in the pyramid fusion network are input, namely, P 3 P 7 . To perform the classification, regression, and orientation prediction tasks, it should be necessary to establish a mapping relation from the position on the feature map P i (i = 3, , 7) to the corresponding position on the original SAR image. Assuming that the coordinate point ( x , y ) on the original SAR image corresponds to the coordinate point ( x , y ) on the feature map P i , the mapping relationship can be described as follows:
x = s i ( x + 0.5 ) y = s i ( y + 0.5 )
where s i denotes the sampling scale in P i and s i = 2 i . Unlike YOLO, which predicts a variable offset within each cell and uses a sigmoid activation to constrain this offset to the [ 0 , 1 ] range, our method fixes this offset at 0.5. The addition of 0.5 in the mapping formula accounts for the fact that each location ( x , y ) on the feature map P i represents the center of a receptive field rather than its top-left corner. By adding 0.5, the mapping aligns the center of the feature map cell to the corresponding position in the original SAR image, ensuring more accurate localization and reducing offset errors caused by quantization.
In the proposed method, the predicted bounding box at each position is represented as d = ( L , R , T , B ) , where these four parameters denote the offsets from the bounding box center ( x , y ) to its left, right, top, and bottom edges in the rotated box, respectively. If the center position ( x , y ) falls within the bounding box of any ground truth (GT), the pixel is treated as a positive sample and assigned to GT. Conversely, if it falls outside the bounding box of all GT, it is treated as a negative sample, and this sample does not need to be involved in regression loss calculations. For any positive sample, the regression box d = ( L , R , T , B ) can be defined as:
L = x x 0 , T = y y 0 R = x 1 x , B = y 1 y
where the coordinates ( x 0 , y 0 ) and ( x 1 , y 1 ) represent the positions of the top-left and bottom-right corners of the bounding box in the ground truth image, in order. The scale range for regression at level i is defined as [ m i 1 , m i ] . The value of m i is determined as:
m i = 0 i = 2 2 i + 3 i = 3 , 4 , 5 , 6 i = 7
If a position on the feature map does not satisfy m i 1 m a x ( L , T , R , B ) m i , it will be treated as a negative sample.

2.3.2. Classification Task

The classification task of the proposed CLAFANet is aligned with FCOS [35], which scales the output value to [0,1] through the sigmoid function. Namely, the final classification confidence score c x , y 1 at the position ( x , y ) is calculated as follows:
c x , y 1 = 1 1 + e c x , y
where c x , y denotes the network’s output prior to applying the activation function.
Similar to FCOS, at the coordinate ( x , y ) , the centerness target is defined as follows:
c x , y 2 = c e n t e r n e s s = m i n ( L , R ) m a x ( L , R ) × m i n ( T , B ) m a x ( T , B )
The final score s x , y at position ( x , y ) , applied for NMS [36] ranking, is calculated based on the classification confidence c x , y 1 and the centerness c x , y 2 , i.e.,
s x , y = c x , y 1 · c x , y 2

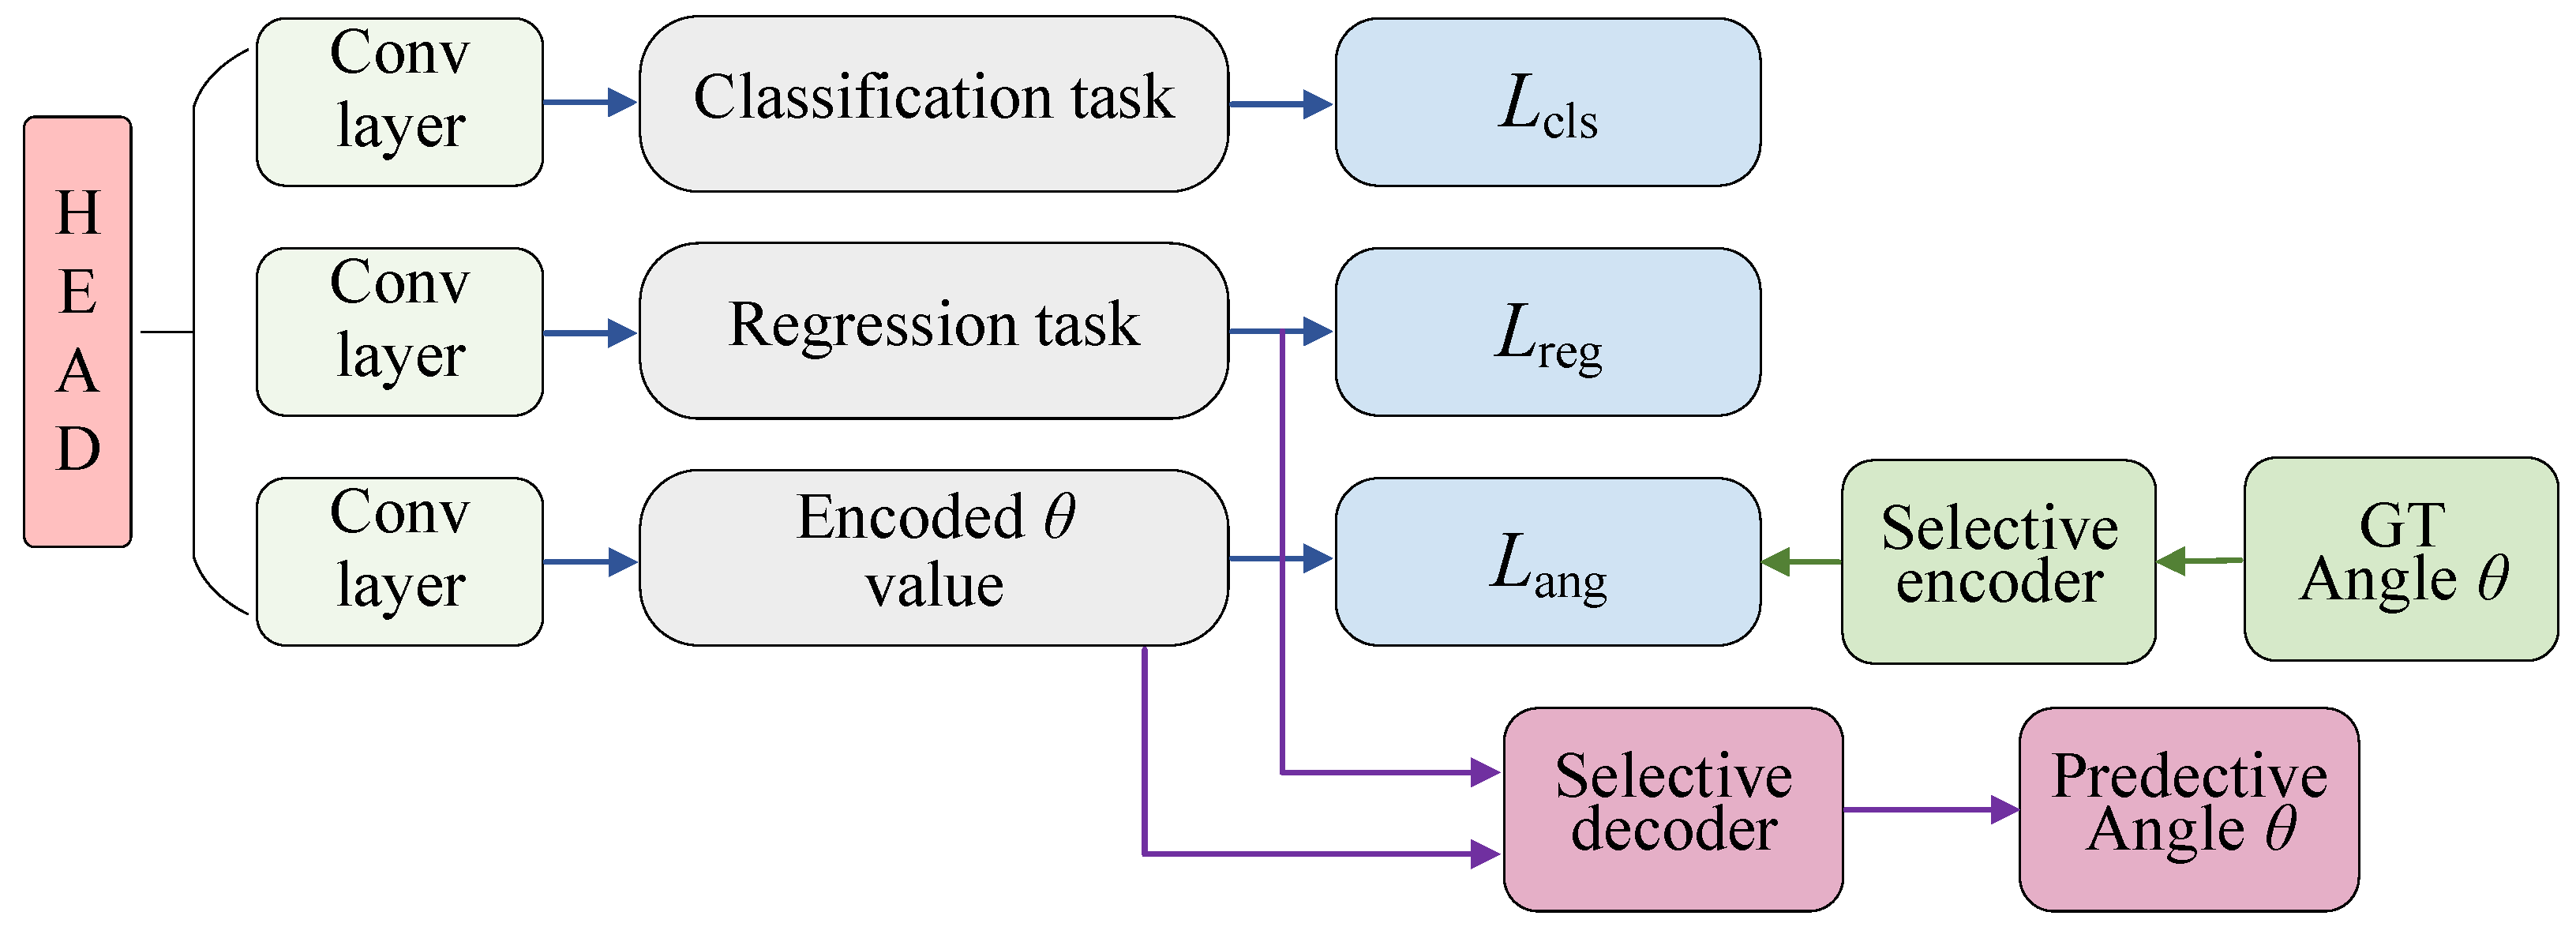
2.3.3. Orientation Prediction Task

The task of the orientation prediction head is to estimate the orientation of the ship object. Although the direction of a bounding box can be represented by a unit vector to avoid the discontinuity problem inherent in angle representation, we choose to use angles because the final rotated bounding box requires the angle to be directly combined with spatial parameters (center coordinates, width, and height) to construct the box. The angle-based representation provides a more straightforward and interpretable way to define the orientation and facilitates the integration of all box parameters. In this paper, we propose the frequency-selective phase-shifting coder to estimate the orientation of ships with arbitrary orientation in large-scale SAR imagery. During the training phase, the aspect ratio of each ground truth bounding box is calculated to adaptively select the appropriate encoding strategy for supervising the model; during the inference phase, the aspect ratio of each predicted bounding box is computed to adaptively choose the corresponding decoding method for obtaining the final orientation estimation, as depicted in Figure 5. In simple terms, the orientation prediction is divided into rectangular box orientation prediction and square box orientation prediction. Hereinafter, the frequency-selective phase-shifting coder-based ship orientation prediction process is described:
(a) Orientation prediction for rectangle box: We take the definition of the angle of “long edge 90” as an example, where the angle of the detection box is determined by the long edge and the x-axis with its range defined as [ π / 2 , + π / 2 ) . Symbols are defined as follows:
  • θ 1 : the orientation angle, which lies within the range of [ π /2, + π /2);
  • φ 1 : the first phase corresponding to the first frequency, lying within the range of [ π , + π );
  • N step : the number of phase-shifting steps;
  • X 1 : data encoded on the basis of the first phase, X 1 = { x n |n = 1,2,…, N step }.
The frequency-selective phase-shifting coder-based ship orientation prediction consists of three steps: mapping, encoding, and decoding.
Mapping: We all know that the period of a sin or cos function is 2 π , but the rectangle will be the same as itself after rotating 180°. Therefore, it is essential to formulate a mapping function to match the orientation of the rectangle with the value of the sin or cos function. The mapping function is defined as follows:
φ 1 = 2 θ 1
During the inference process, the output orientation angle is derived by mapping φ 1 :
θ 1 = 1 2 φ 1
Encoding: After obtaining the phase φ 1 via Equation (14), the following encoding operation is performed:
x n = cos ( φ 1 + 2 n π N step )
where n = 1, 2, …, N step . That is to say, the raw φ 1 is encoded into a smooth representation X 1 .
Decoding: The decoding operation is performed on X 1 to calculate the rotation angle φ 1 , i.e.,
φ 1 = f d e c ( X 1 ) = arctan n = 1 N step x n sin 2 n π N step n = 1 N step x n cos 2 n π N step
where the arctan is realized by the arctan2 function. This ensures that the output lies within the range of ( π , + π ], and Φ ( · ) = f d e c ( · ) .
(b) Orientation prediction for square box: If the detection box of the ship is square after the regression, then the angle ambiguity problem will occur according to the conventional rotating box prediction method. That is to say, whether a box is rotated 90° or 180°, it is the same as the original prediction box. On this matter, we propose an additional mapping function for square box orientation prediction. Some symbols are defined as follows:
  • θ 2 : the orientation angle, which lies within the range of [ π /4, + π /4);
  • φ 2 : the second phase corresponding to second frequency, which lies within the range of [ π , + π );
  • X 2 : data encoded on the basis of the second phase, X 2 = { x n |n = 1,2, …, N step }.
As with the rectangular box, the square box orientation prediction also includes the same three stages.
Mapping: Different from orientation prediction for a rectangle box, the mapping function for a square box is defined as follows:
φ 2 = 4 θ 2
During the inference process, the output orientation angle is derived by mapping φ 2 :
θ 2 = 1 4 φ 2
Encoding: After calculating the phase φ 2 by Equation (18), φ 2 is encoded into a smooth representation X 2 as follows:
x n = cos ( φ 2 + 2 n π N step )
Decoding: Similar to the encoding process of orientation prediction for a rectangle box, the decoding operation on X 2 is as follows:
φ 2 = Φ ( X 2 )
During the training phase, the length L t and width W t of each ground truth (GT) box can be directly obtained, allowing the calculation of the aspect ratio r t = L t W t . In this study, GT boxes with aspect ratios in the range of 0.95 r 1.05 are regarded as square boxes, and the square encoding method described in Section 2.3.3 (a) is adopted for supervision. For other cases, the rectangular encoding method described in Section 2.3.3 (b) is used.
Similarly, during the inference phase, the length L p = T + B and width W p = L + R of the predicted box can be easily obtained from the regression branch by Equation (9), and the aspect ratio r p = L p W p can be calculated. When the aspect ratio of the predicted box falls within 0.95 r p 1.05 , the square decoding method described in Section 2.3.3 (a) is applied for angle decoding. Otherwise, the rectangular decoding method described in Section 2.3.3 (b) is used to obtain the final predicted angle.

2.4. Loss Function

The proposed FSPSC relies on angle coding for ship orientation prediction, namely, it merely concerns the regression problem related to θ . Based on Equations (16) and (20), the encoded data in the phase-shift mod fall within the range of [−1, 1]. However, the output generated by the convolution layer during the orientation task may exceed this range. To ensure consistency between these numerical ranges and enhance training stability, we conduct the following transformation on the output feature as follows:
X Pred = 2 × s i g m o i d ( X Feat ) 1
where X F e a t represents the convolution layer output feature in the orientation prediction task and X P r e d denotes the predicted encoded data within the range of [−1, 1].
For the angle branch, we leverage L1 loss for optimization, i.e.,
L ang = l 1 | X GT X Pred |
where X G T denotes the ground truth phase-shifting patterns, which are derived from the orientation angle of annotated boxes. We optimize the angle and spatial parameters separately. Therefore, B ( x y w h p ) is used to denote the predicted bounding box and B ( x y w h t ) represents the ground truth bounding box. The regression loss can be calculated as follows:
L b o x = l I o U ( B ( x y w h p ) , B ( x y w h t ) )
where L b o x adopts the IoU loss from UnitBox [37].
The classification loss can be represented as follows:
L c l s = l f o c a l ( C p , C t )
where C p represents the predicted classification score, while C t represents true label. L c l s adopts the focal loss [38]. In addition, the predicted centerness is denoted as c e n t e r n e s s p , and the ground truth centerness is denoted as c e n t e r n e s s t . The centerness loss can be expressed as:
L c e n = l b c e ( c e n t e r n e s s p , c e n t e r n e s s t )
where L c e n adopts the binary cross-entropy loss.
The total loss of the proposed CLAFANet is given as follows:
L = ω 1 L cls + ω 2 L box + ω 3 L cen + ω 4 L ang
where ω 1 , ω 2 , ω 3 , and ω 4 are the weight factors to balance the significance of each loss.

3. Experimental Results

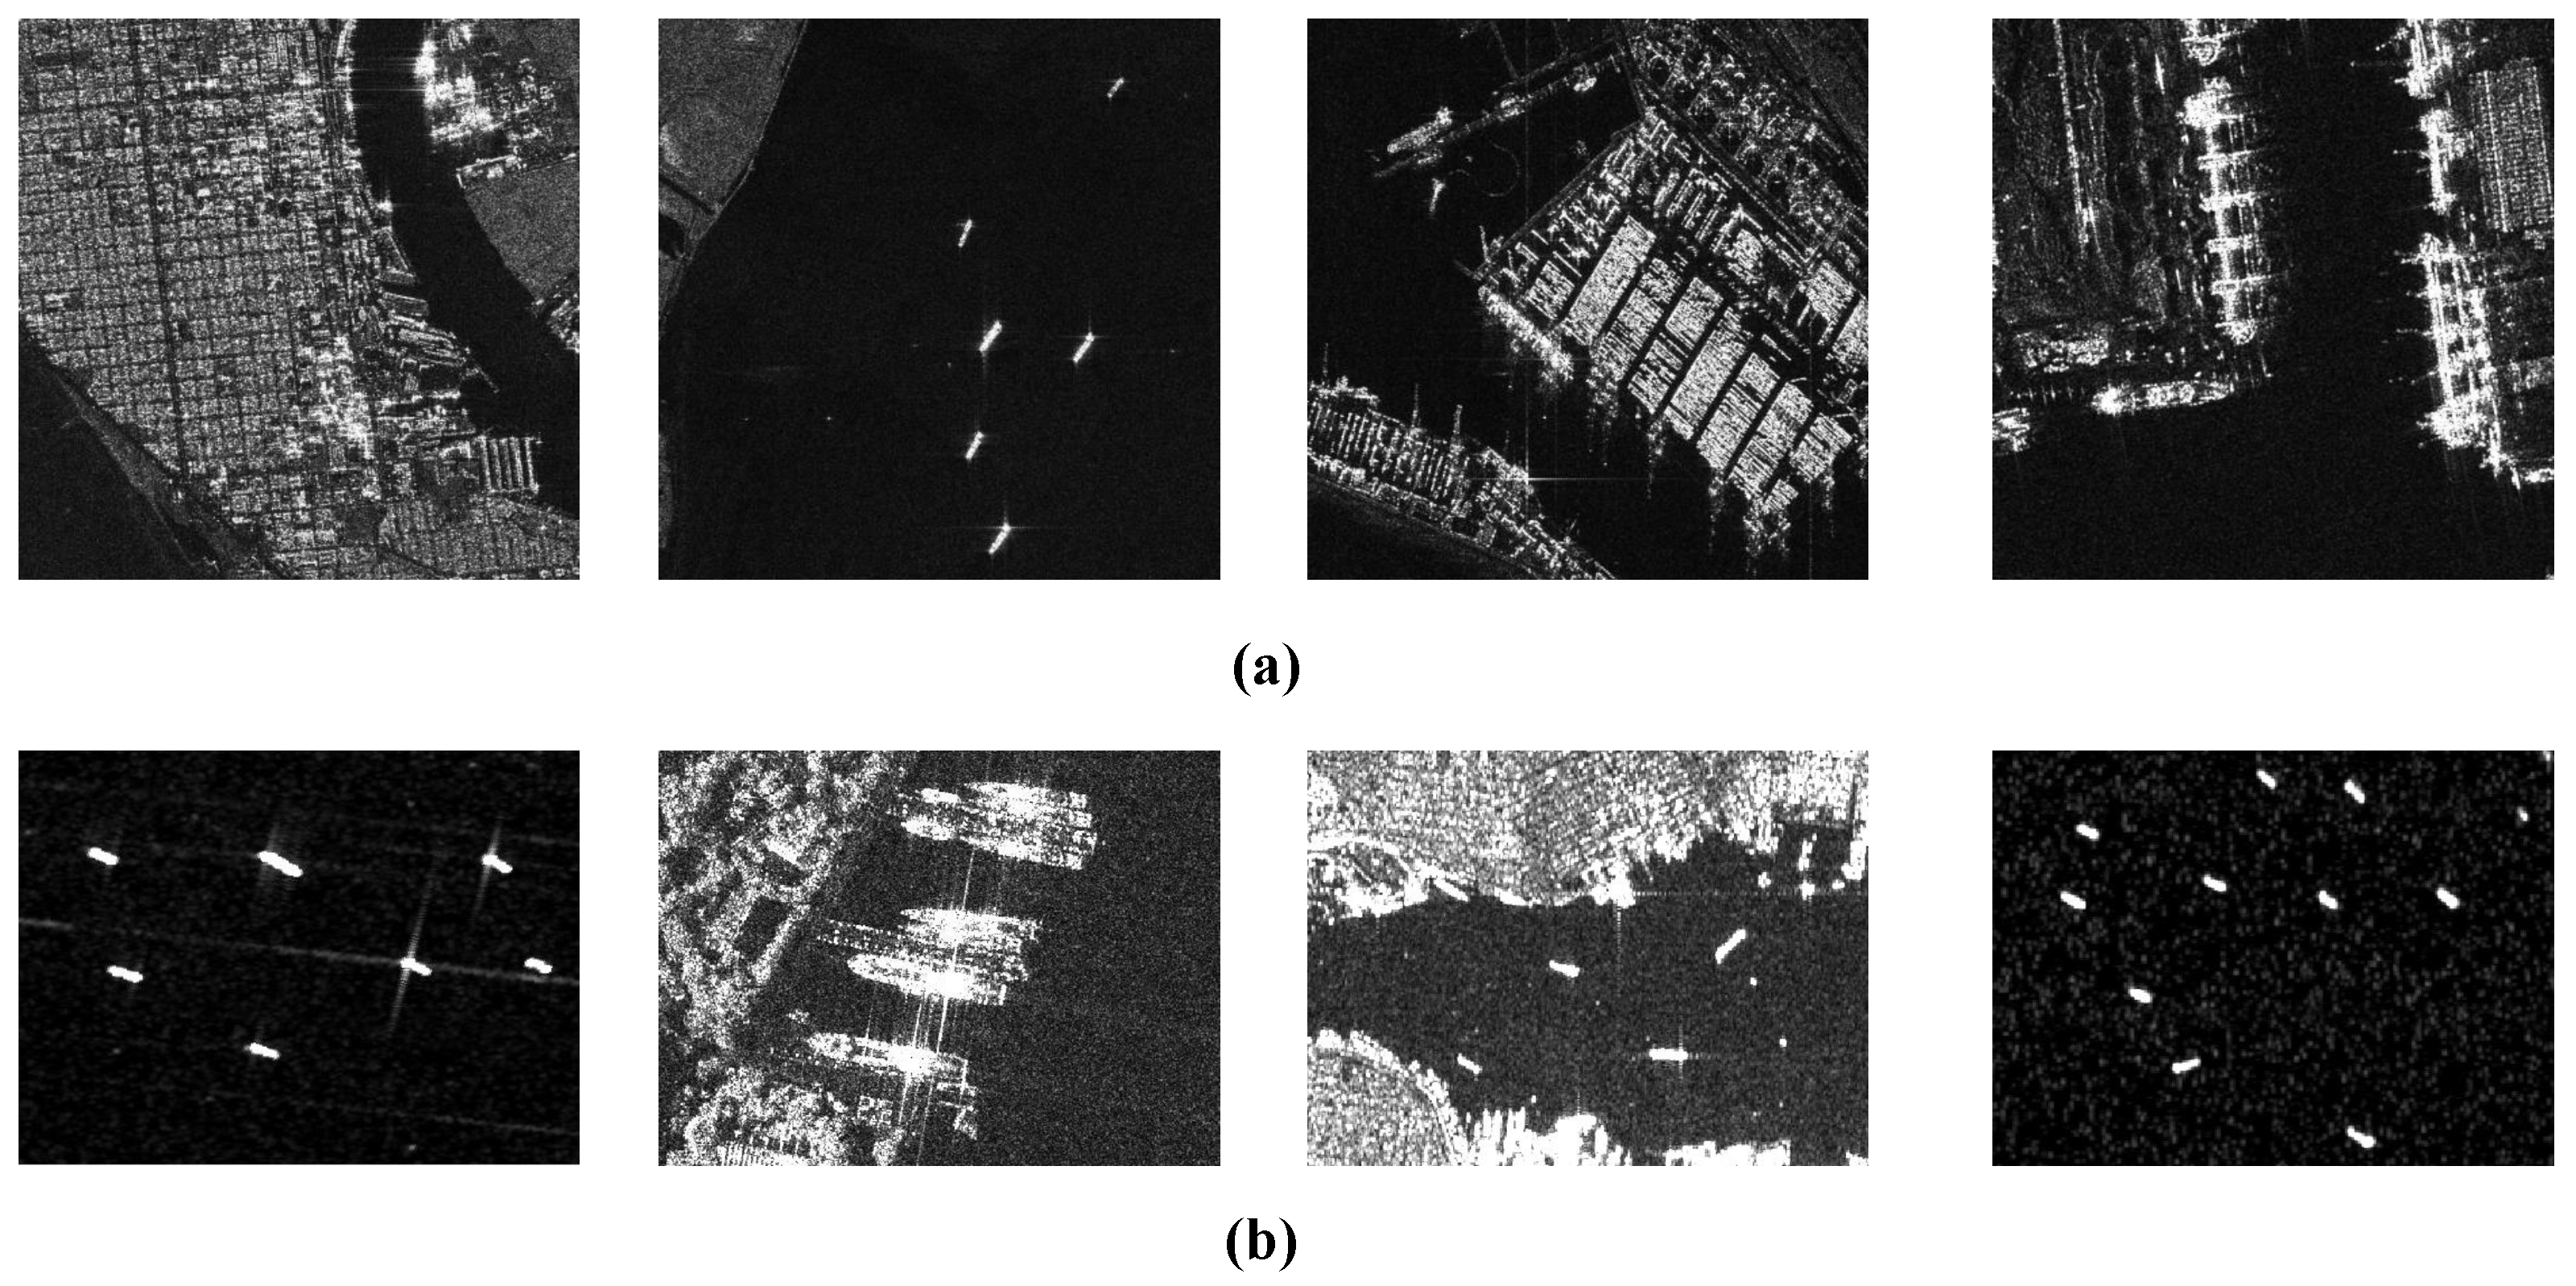
3.1. Dataset Description

In order to evaluate the effectiveness and superiority of the proposed method, two publicly available datasets, i.e., the SAR ship detection dataset (SSDD) [39] and the high-resolution SAR images dataset (HRSID) [40], are adopted to conduct performance evaluation for ship detection in SAR imagery. Figure 6 depicts SAR ship objects in different scenarios from the two datasets. Hereinafter, the two SAR ship datasets are introduced in detail.
SAR images in the SSDD were acquired from RadarSat-2, TerraSAR-X, and Sentinel-1. Images were captured with four polarization types (HH, HV, VV, VH) at diverse resolutions, ranging from 1 to 15 m. The SSDD contains 1160 ship images. These images show ships in various orientations and scales, taken from numerous inland port and offshore areas. Each image is annotated with ground truth (GT) bounding boxes indicating the precise locations of ships.
There exist 5604 high-resolution SAR images in the HRSID, and these images contain 16,951 ship instances in total. According to the construction process of the Microsoft Common in Object Context (COCO) dataset, the HRSID consists of SAR images that vary in terms of resolutions, polarizations, sea states, ocean regions, and coastal ports. In particular, the resolution of SAR image is 0.5 m, 1 m, 3 m, and so forth. All ship instances are annotated with ground truth (GT) bounding boxes for precise localization.

3.2. Evaluation Metrics

In the following evaluation experiments, we exploit two sets of evaluation protocols, i.e., VOC [41] and COCO [42], to comprehensively appraise the efficiency of the detector in SAR ship detection tasks. The COCO evaluation protocol consists of six indicators: mAP, AP 50 , AP 75 , AP s , AP m , AP l . Among them, mAP refers to average precision (AP) values for various intersection over union (IoU) thresholds spanning from 0.5 to 0.95. The a r e a is defined as the region covered by the rotated bounding box. A P s , A P m , and A P l intuitively reflect the detection performance of the model for ship objects of different scales, representing the mAP for small ( a r e a < 32 2 pixels), medium ( 32 2 < a r e a < 64 2 pixels), and large ( a r e a > 64 2 pixels) ship objects, respectively. As illustrated in Figure 1, horizontal bounding boxes often encompass background or neighboring objects, allowing a predicted box that contains substantial background or adjacent targets to still yield a high IoU with the ground truth, which may lead to incorrect predictions. In contrast, oriented bounding boxes fit the target much more closely, so achieving a high rotated IoU requires the predicted box to precisely enclose the object, leading to more accurate results. Therefore, for ship objects with arbitrary orientation, we define the rotated IoU between each predicted bounding box R p and the ground truth bounding box R g t as follows:
I o U = a r e a ( R p ) a r e a ( R gt ) a r e a ( R p ) a r e a ( R gt )
The VOC evaluation protocol includes precision (P), recall (R), F1 score, and average precision (AP). Among them, precision and recall are defined as follows:
P r e c i s i o n = Q TP Q TP + Q FP
R e c a l l = Q TP Q TP + Q FN
where Q T P , Q F P , and Q F N represent the number of true positives, false positives, and false negatives, respectively.
Since precision and recall may not adequately mirror the performance of the detector, F 1 score integrating precision and recall is introduced for comprehensively evaluating detector performance, which is calculated as:
F 1 = 2 × P r e c i s i o n × R e c a l l P r e c i s i o n + R e c a l l
Based on accuracy and recall, another metric, i.e., precision–recall curves (PRCs), can be obtained.
As is widely acknowledged, the average precision (AP) represents the most prevalently utilized metric for evaluating the performance of a detector. It is computed as the area beneath the precision–recall curve (PRC) for each class, defined in the following manner:
A P = P ( R ) d R
AP 50 denotes the AP value calculated when the IoU equals 0.5. Similarly, AP 75 represents the value of the AP calculated at IoU = 0.75.
To comprehensively evaluate both the complexity and efficiency of our model, we report two key metrics: the number of parameters (Params) and frames per second (FPS). Params indicates the total count of learnable parameters in the network, reflecting the capacity and computational requirements of the network. FPS measures the inference speed by quantifying how many input images or frames the model can process per second, thereby representing the real-time performance of the model.

3.3. Experimental Settings

In this paper, the stochastic gradient descent (SGD) optimizer is employed to optimize the proposed method. The learning rate of the optimizer is set to 0.001, and the exponential decay strategy with a decay factor of 0.9 is utilized to adjust the learning rate. In the following experiments, the SSDD is divided into a training dataset and test dataset in a ratio of 4:1, and the HRSID is split into a training dataset and test dataset in a ratio of 4:1. The hyper-parameters ω 1 , ω 2 , ω 3 , and ω 4 in Equation (27) are set to 1, 1, 1, and 0.2, respectively. The proposed method is implemented with the PyTorch 1.13.0 framework in Python 3.8.17, and all experiments were conducted on a personal computer with a hardware configuration of an Intel(R) Core(TM) i7-9750CPU@2.60 GHz, 24.0 G RAM NVIDIA GeForce RTX3090Ti GPU.

3.4. Ablation Experiments

The cross-level adaptive feature aggregation mechanism and the frequency-selective phase-shifting coder module are two vital components to promote the detection performance of the SAR ship in the proposed method. Therefore, we deploy a range of ablation experiments to assess and analyze the efficacy of each element. In this section, the cross-level adaptive feature aggregation mechanism and the frequency-selective phase-shifting coder module are abbreviated as the CLAFA and FSPSC, respectively. For briefness, the proposed method without the CLAFA is termed as Model 1, and the proposed method without the FSPSC is termed as Model 2. The ablation experiments are conducted on two datasets. The rotated fully convolutional one-stage (R-FCOS) detection method is leveraged as the baseline in this section. Table 1 and Table 2 list all evaluation indicators of different methods on the two datasets, in which ✓ means that the component is reserved and ✗ indicates that the component is removed. It should be mentioned that bold represents the best result in Table 1.
Table 1 reveals that, in comparison with the baseline, there is an improvement in the VOC indicators of the proposed method, which contains only the FSPSC. For multi-scale ship detection, one can see that the values of the three indexes AP s , AP m , and AP l of the proposed method containing only the FSPSC are all higher than those of the baseline. Likewise, the proposed method containing only the CLAFA also has different degrees of improvement in both evaluation protocols compared with the baseline. Note that the proposed method with two components greatly boosts ship detection performance. In particular, for large-, medium-, and small-scale SAR ships, the AP of the proposed method shows an increase of at least 2% compared to the baseline on the SSDD.
In contrast to the SSDD, the SAR application scenarios in the HRSID are diverse and more complex. From the experimental results in Table 2, one can see that all detection indicators of Model 1 and Model 2 are still better than the baseline. The two comprehensive indicators of these proposed models, namely, F1 score and mAP, are more than 2% higher than the baseline. The proposed method performs slightly worse than the baseline on large-scale ships, while other indicators are significantly promoted. When using the CLAFA alone, the AP for large-scale targets increases significantly due to improved cross-level feature fusion. However, when combined with the FSPSC, this improvement is less pronounced. This is likely because the additional tasks and complexity introduced by the FSPSC may interfere with the semantic representations enhanced by the CLAFA, leading to reduced effectiveness for large-scale target detection. The ablation experiments conducted on the two datasets reveal that each component of the proposed method makes a contribution to the enhancement of ship detection performance from a quantitative perspective.
In addition to detection accuracy, we also analyze the complexity and inference speed of the proposed models. As shown in Table 1 and Table 2, the addition of the CLAFA and FSPSC leads to a slight increase in the number of parameters from 32.1 M to 33.2 M. Although the inference speed is marginally reduced, the proposed method achieves notable gains in accuracy and robustness with minimal computational overhead.
In order to comprehensively demonstrate the efficacy of each component, a set of visualization experiments are conducted on the SSDD. The visual detection results are shown in Figure 7, where the first line investigates the detection performance of multi-scale ships and the second line analyzes the accuracy prediction of object orientation. From the experimental result in Figure 7a, one can see that the proposed method with the CLAFA improves false alarms when detecting multi-scale ship objects compared to the baseline method. Moreover, it can be observed from Figure 7b that the proposed method with the FSPSC can better solve the problem of inaccurate orientation prediction caused by angle ambiguity in the baseline. These qualitative and quantitative ablation experiments comprehensively demonstrate the contribution of each element of the proposed method to improving SAR ship detection.

3.5. Contrastive Experiments

3.5.1. Comprehensive Assessment

To substantiate the effectiveness and superiority of the proposed method, this section conducts a set of comparison experiments on the two SAR datasets. Several state-of-the-art rotated box detection methods are considered, including R-FCOS [35], R-Faster R-CNN [43], R3Det [44], OrientedFormer [45], and FPNFormer [46]. Table 3 and Table 4 present the detection results of each method on the SSDD and HRSID, respectively. It can be observed from Table 3 that the mAP of the proposed method is 1.7% greater than that of the second best detector, R-Faster R-CNN, and AP 75 is also increased by 4.8%. In addition, the detection capability of the proposed method is improved to varying degrees on multi-scale SAR ship objects.
Based on the experimental results shown in Table 3, it can be observed that the three VOC detection indicators of the proposed method are increased by 1–2% compared with the second-best detector. For multi-scale ship target detection, although the performance of AP 50 is equivalent to that of the second-best detector, the proposed method performs better on large-, medium-, and small-scale ships. In fact, the reason why the performance of R-Faster-R-CNN is comparable to that of the proposed method is that the two-stage method enhances the detection accuracy at the sacrifice of increased computational complexity. Overall, the proposed method outperforms all competing methods.
As shown in Table 4, the proposed CLAFANet also achieves the best overall performance on the HRSID compared to other state-of-the-art methods. Specifically, CLAFANet attains the highest mAP, surpassing the second-best detector, OrientedFormer, by 1.1%. In terms of F1 score, precision, and recall, CLAFANet consistently outperforms all competing approaches. Notably, for the more challenging small- and medium-sized ships ( AP s and AP m ), CLAFANet demonstrates clear advantages, achieving average improvements of 3% and 6%, respectively, compared to other methods. Even for large-scale ships, the AP l of CLAFANet is significantly higher than that of other detectors, indicating its strong adaptability to diverse target scales and complex SAR backgrounds.
In addition to accuracy, we also consider model efficiency. As shown in Table 3 and Table 4, CLAFANet introduces only a slight increase in parameter count compared to the baseline, rising from 32.1 M to 33.2 M. It remains much smaller than the two-stage detector R-Faster-R-CNN and is also more efficient in parameter count than the one-stage method R3Det. Although the inference speed decreases slightly compared to the fastest baseline, CLAFANet maintains reasonable detection efficiency and achieves significant improvements in accuracy and robustness. This balance between performance and resource consumption demonstrates the practical value of CLAFANet for real-world SAR ship detection.

3.5.2. PRC Analysis

The precision–recall curve is another form of evaluation mode for the detector, which presents the relationship between accuracy and recall. The PRC curve is also highly appropriate for evaluating the performance of the detector under the condition of background clutter and object imbalance in large-scale SAR imagery. In this section, we draw on two types of PRCs on the two datasets with IoUs of 0.5 and 0.75, respectively. The larger the area beneath the PRC curve, the more excellent the algorithm performance. Figure 8 and Figure 9 depict the PRC of each method for rotated bounding box ship detection on the SSDD and HRSID, respectively. From the experimental results in the two figures, one can observe that the area beneath the PRC curve of the proposed method is better than that of other methods on both datasets under different IoU conditions. In particular, the performance of the proposed method with IoU = 0.75 is much better than that of the competitors. The curve at IoU = 0.75 drops more sharply than that at IoU = 0.5, mainly because the higher the IoU threshold, the higher localization precision requirement. Many predicted boxes number of true positives at IoU = 0.5 are excluded at IoU = 0.75, causing both precision and recall to decrease rapidly. Therefore, the curve at IoU = 0.75 provides a stricter assessment of localization accuracy and robustness. These qualitative results further demonstrate the superiority of the proposed method in SAR ship detection.

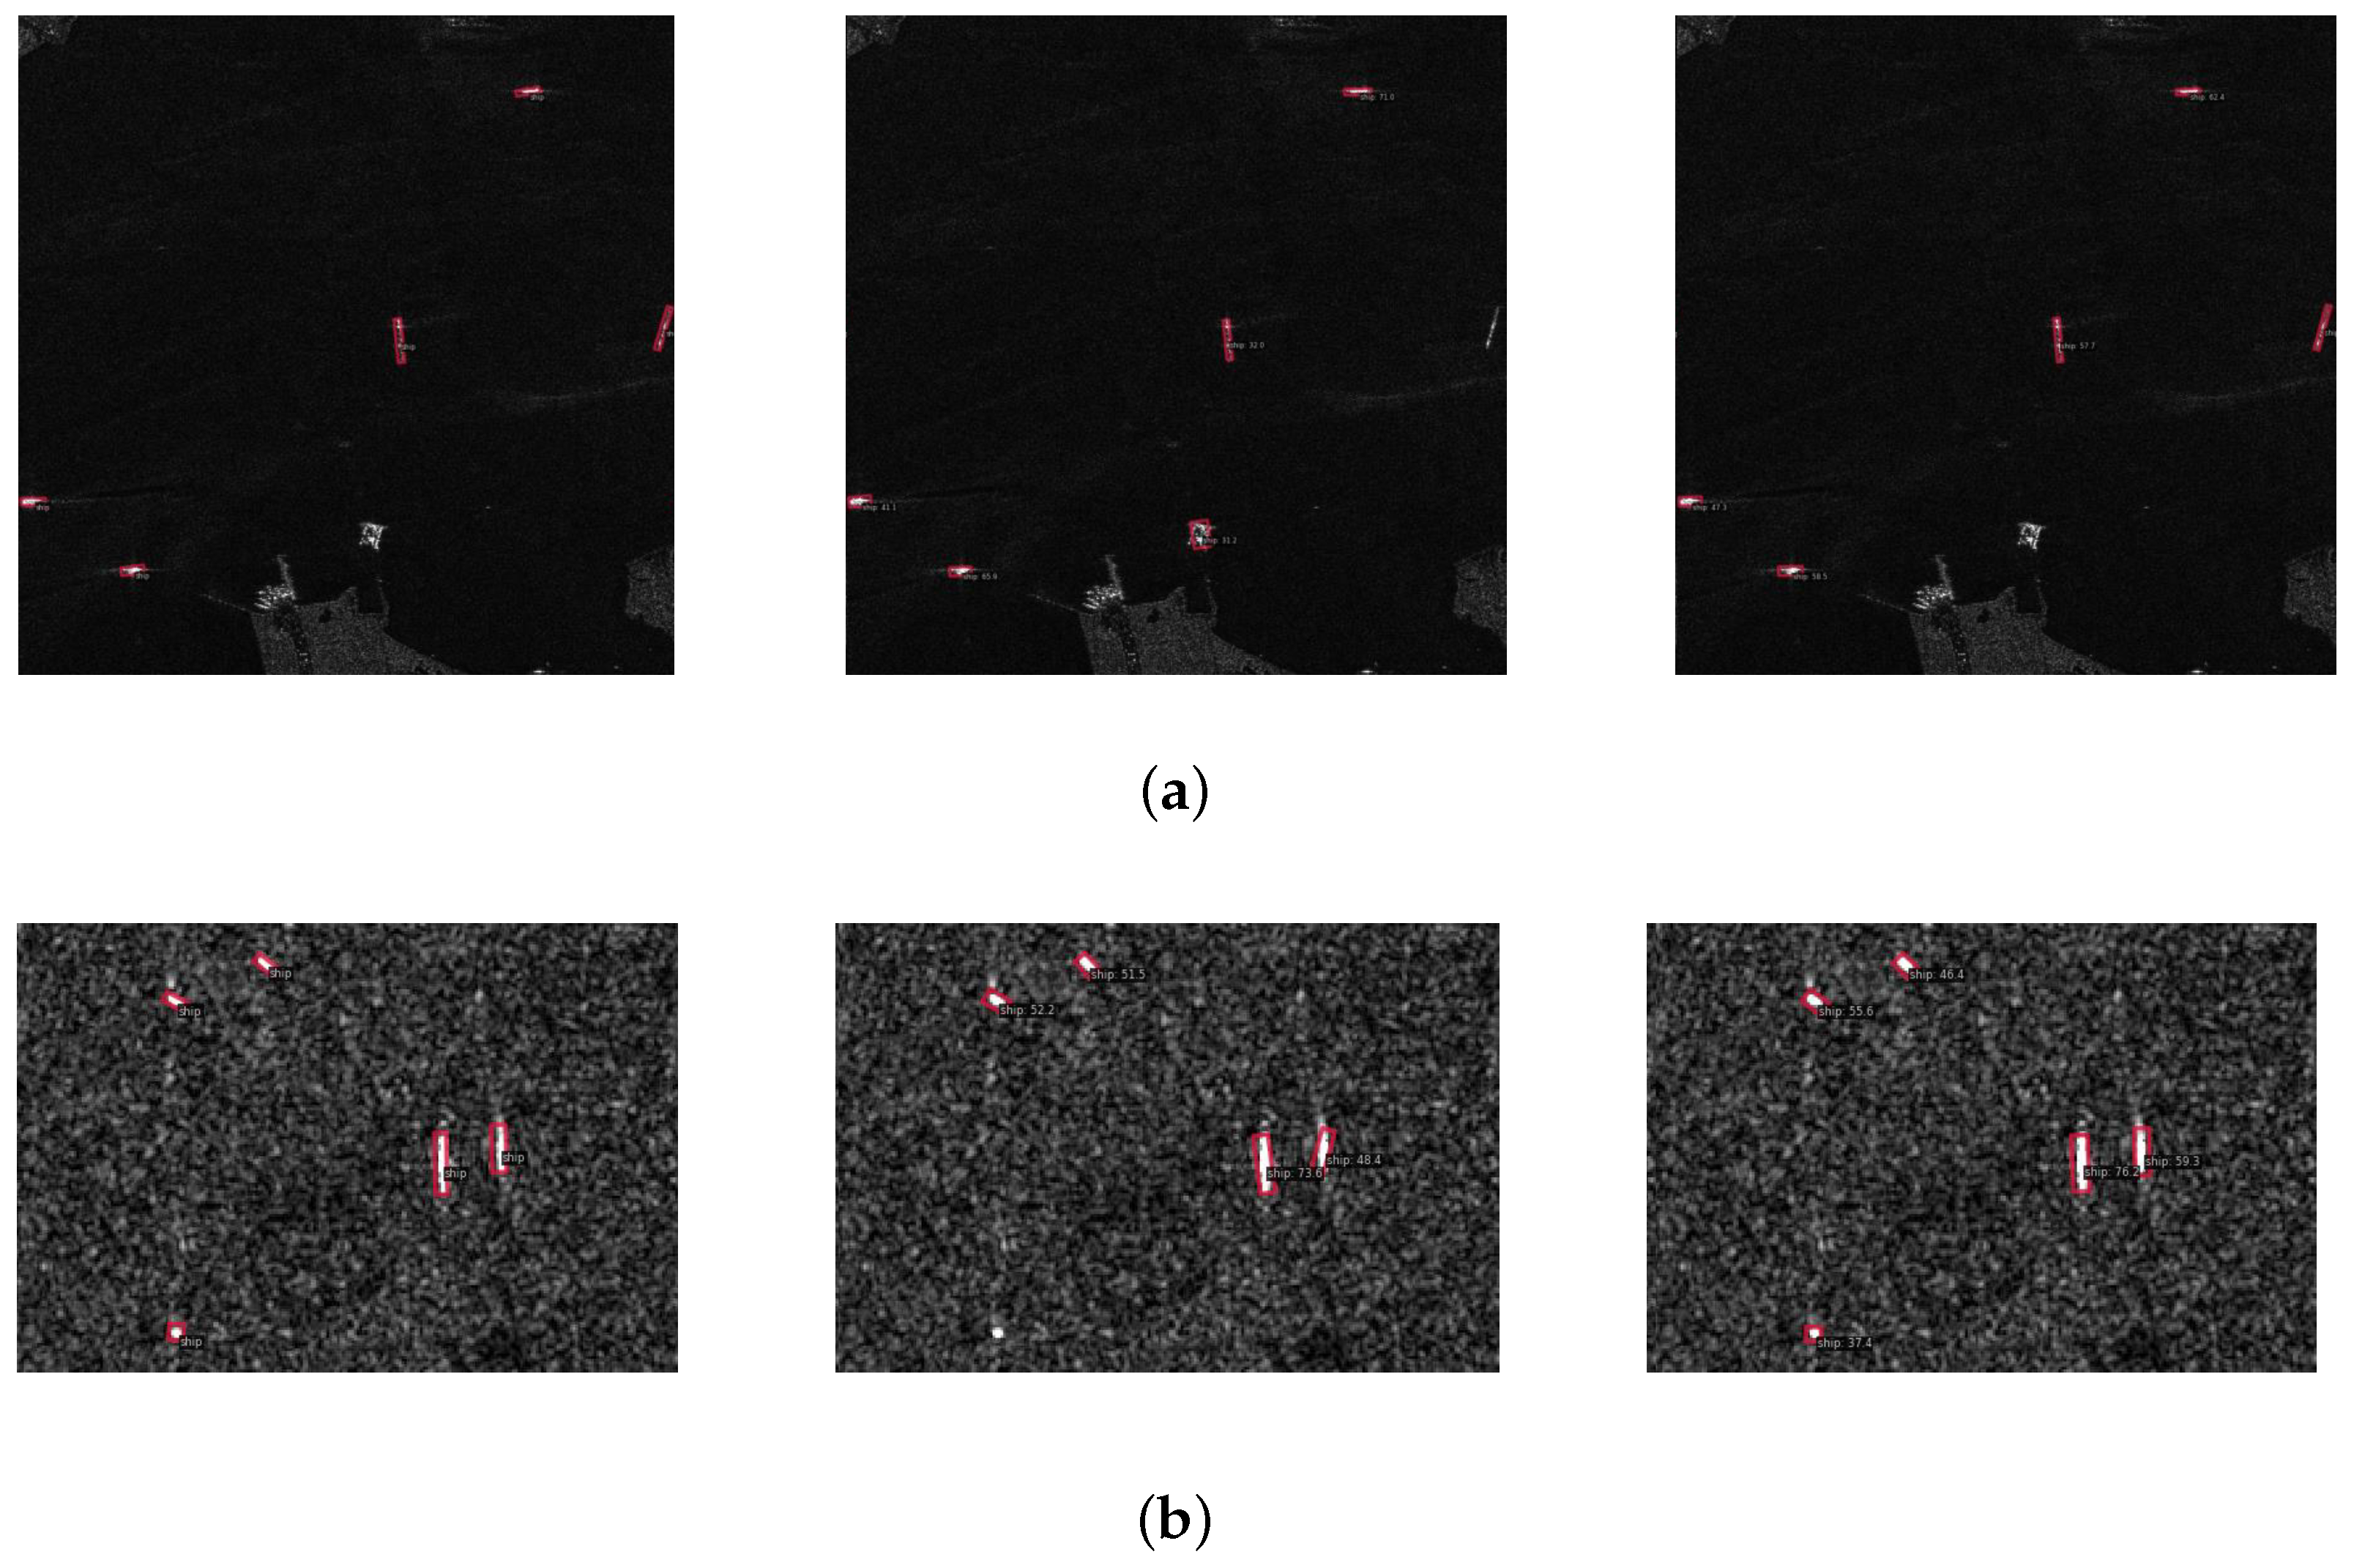
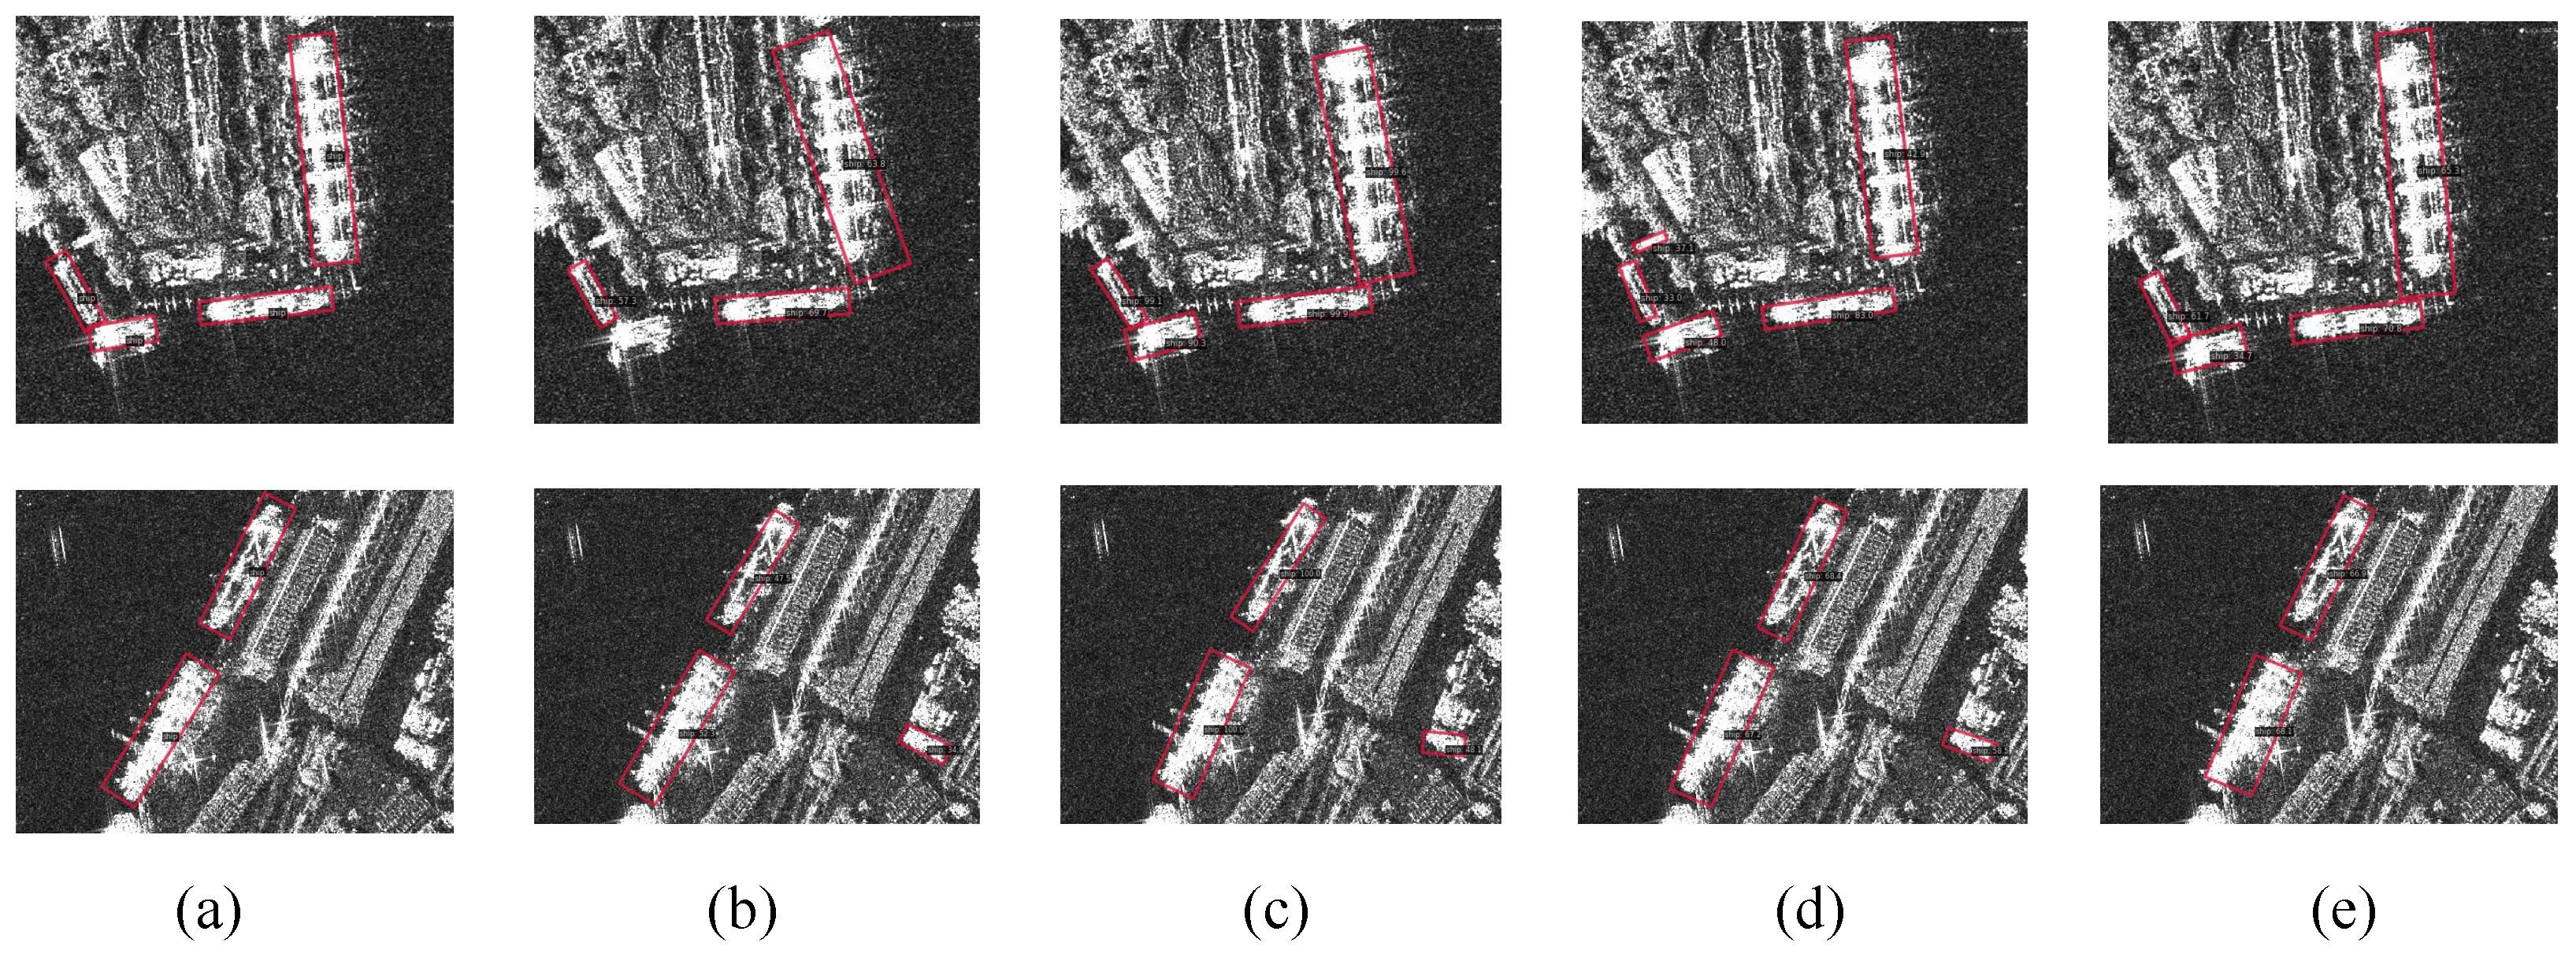
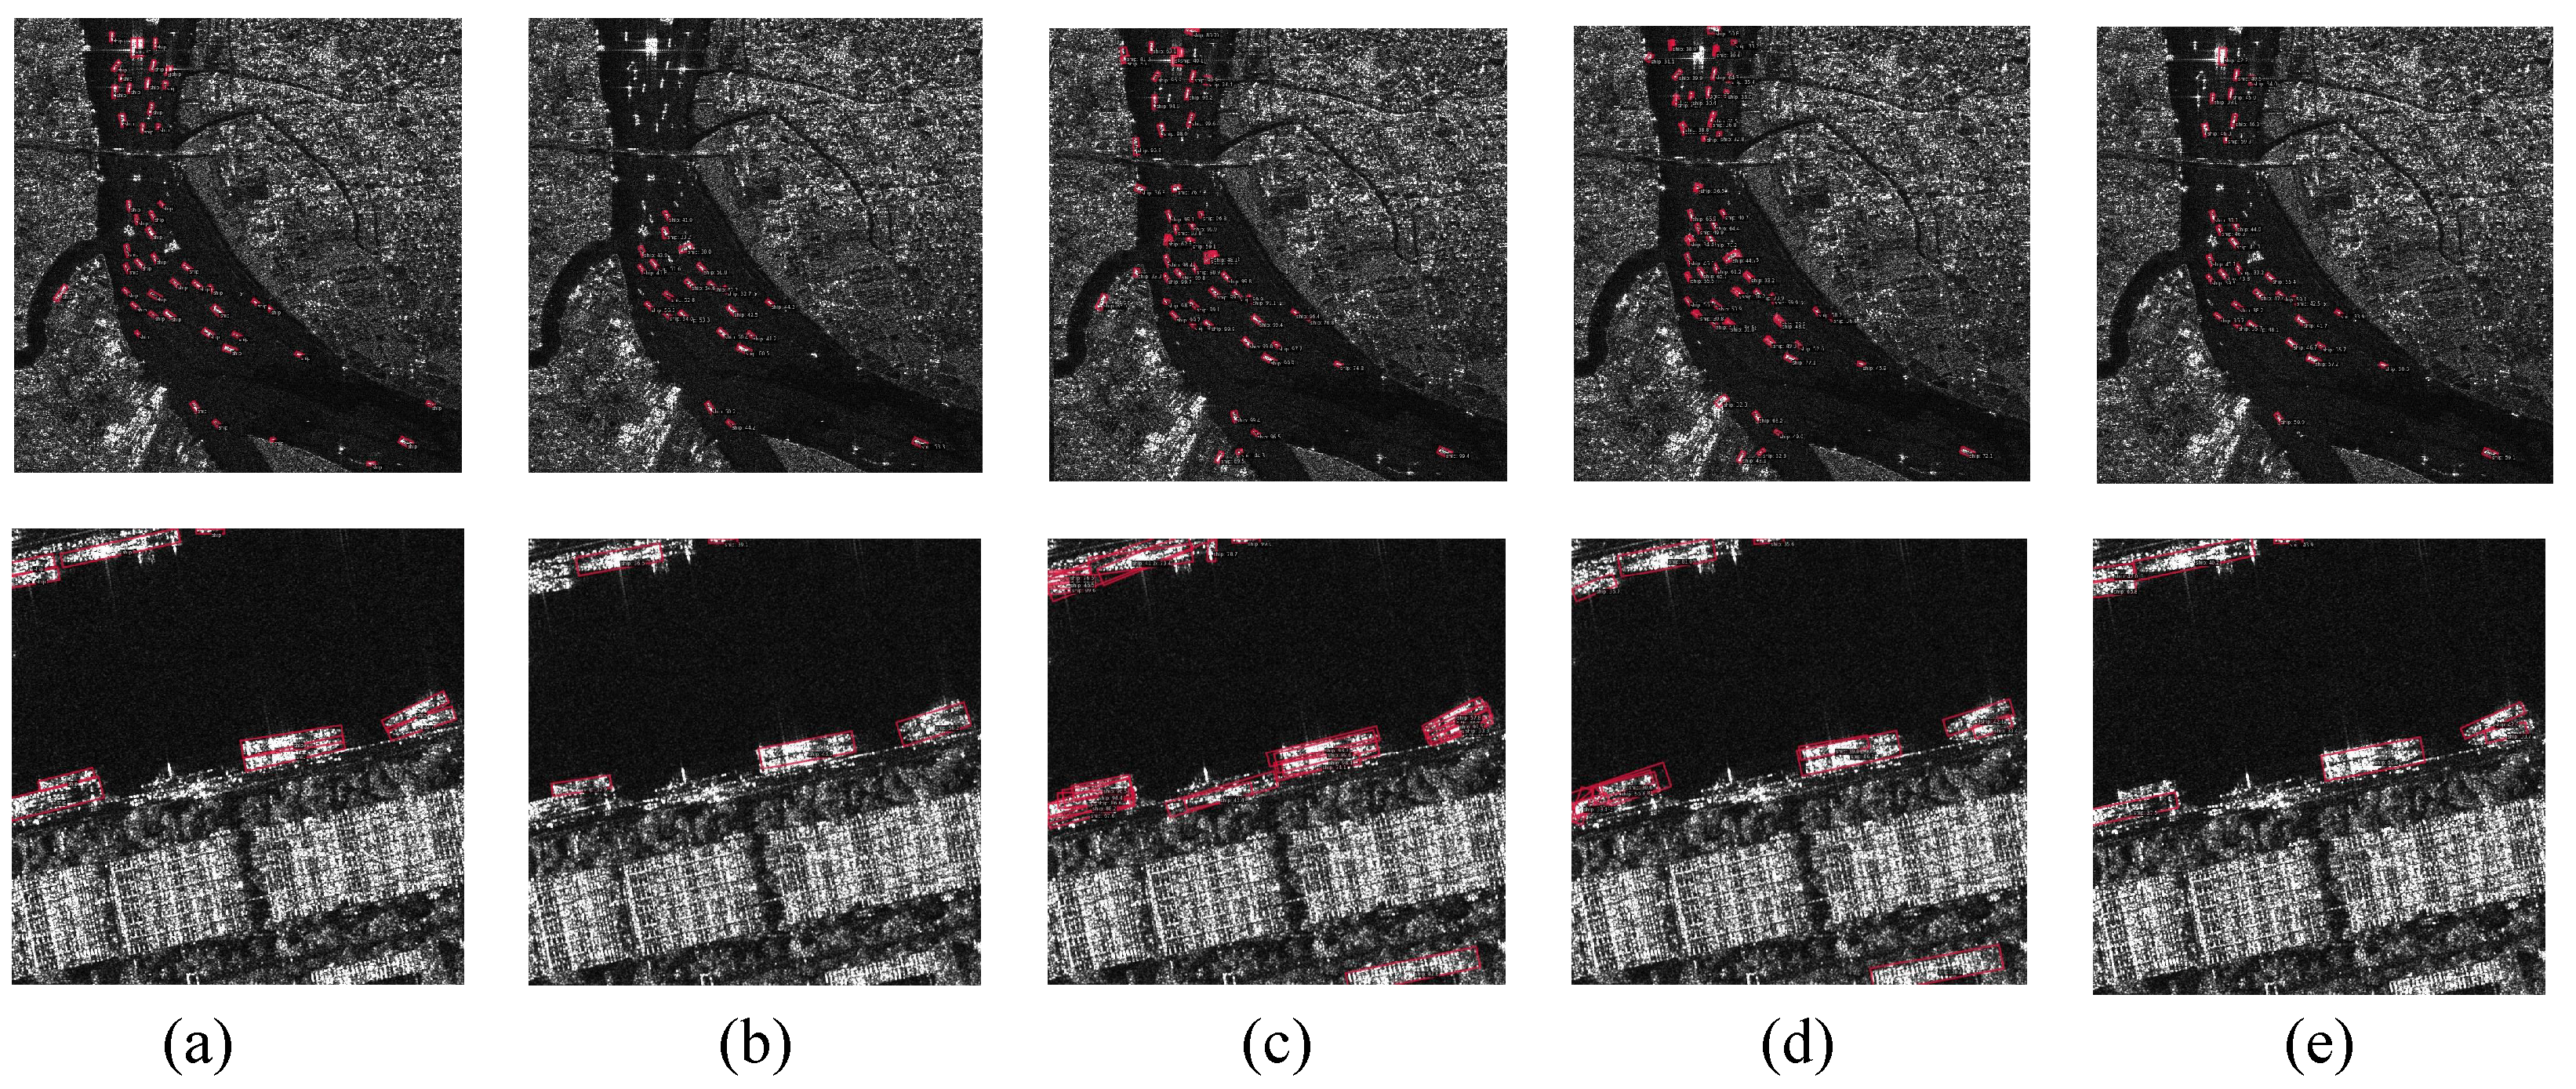
3.5.3. Visual Analysis

To intuitively verify the performance of the proposed model, we select two representative images each from the SSDD and the HRSID for visualization analysis. The experimental results are shown in Figure 10. It can be observed that the other three competing methods, namely, R-FCOS, R-Faster R-CNN, and R3Det, all suffer from false alarms and missed detection to varying degrees. In contrast, our method achieves more accurate angle estimation. Furthermore, the proposed method reliably avoids the interference of land-like ship objects and ensures precise localization of ship objects without false alarms or missed detection. These results demonstrate that the proposed method effectively addresses the challenge of complex background interference and guarantees the total encirclement of ship objects.
As illustrated in Figure 11, on the HRSID dataset, there are scenarios with densely distributed small objects and substantial land interference. In these cases, R-FCOS misses many small objects. Although R-Faster R-CNN and R3Det are able to detect small objects, they produce numerous redundant false alarms on similar land objects. Compared to R-FCOS, our method detects more ship objects, and compared to the other two methods, it significantly reduces false alarms. This indicates that the proposed modules effectively enhance the detection of small- and multi-scale objects. The second row of results shows that when objects are affected by both near-shore interference and densely arranged ships, our method partially alleviates these issues. Although a few missed detections remain, the number of false alarms is drastically reduced compared to other methods, which is an acceptable trade-off. These visual results indicate that our approach achieves a good balance between false alarms and missed detection.

4. Conclusions

This paper proposes a novel detection approach called a cross-level adaptive feature aggregation network to achieve arbitrary-oriented SAR ship detection. The proposed method is composed of two innovations. One is that the cross-level adaptive feature aggregation mechanism is proposed to alleviate the semantic gap problem between features from distinct levels during multi-level feature fusion, thereby improving the multi-scale ship detection performance. The other is that the frequency-selective phase-shifting coder-based orientation prediction method is presented to realize arbitrary-oriented SAR ship detection without angle ambiguity. A series of qualitative and quantitative experiments on two datasets that are publicly accessible illustrate that the proposed method surpasses some state-of-the-art competitors for arbitrary-oriented SAR ship detection tasks.

Author Contributions

Conceptualization, L.Q.; methodology, L.Q. and J.H.; software, L.Q. and L.Z.; validation, L.Q., J.H., H.R., and Y.Z.; formal analysis, L.Q.; investigation, L.Q. and L.Z.; resources, H.R.; data curation, J.H., J.L., and X.L.; writing—original draft preparation, L.Q.; writing—review and editing, J.H., X.L., and H.R.; visualization, J.H. and J.L.; supervision, H.R.; project administration, Y.Z.; funding acquisition, L.Z. and H.R. All authors have read and agreed to the published version of the manuscript.

Funding

This research was supported by the National Science Foundation of China (Grant 42027805 and 62201124).

Data Availability Statement

The code is available at: https://github.com/cyrh/CLAFANet (accessed on 14 May 2025).

Conflicts of Interest

The authors declare no conflicts of interest.

References

  1. di Bisceglie, M.; Galdi, C. CFAR detection of extended objects in high-resolution SAR images. IEEE Trans. Geosci. Remote Sens. 2005, 43, 833–843. [Google Scholar] [CrossRef]
  2. Conte, E.; De Maio, A.; Ricci, G. Recursive estimation of the covariance matrix of a compound-Gaussian process and its application to adaptive CFAR detection. IEEE Trans. Signal Process. 2002, 50, 1908–1915. [Google Scholar] [CrossRef]
  3. An, W.; Xie, C.; Yuan, X. An improved iterative censoring scheme for CFAR ship detection with SAR imagery. IEEE Trans. Geosci. Remote Sens. 2013, 52, 4585–4595. [Google Scholar]
  4. Ai, J.; Mao, Y.; Luo, Q.; Xing, M.; Jiang, K.; Jia, L.; Yang, X. Robust CFAR ship detector based on bilateral-trimmed-statistics of complex ocean scenes in SAR imagery: A closed-form solution. IEEE Trans. Aerosp. Electron. Syst. 2021, 57, 1872–1890. [Google Scholar] [CrossRef]
  5. Shi, H.; Fang, Z.; Wang, Y.; Chen, L. An adaptive sample assignment strategy based on feature enhancement for ship detection in SAR images. Remote Sens. 2022, 14, 2238. [Google Scholar] [CrossRef]
  6. Yao, C.; Xie, P.; Zhang, L.; Fang, Y. ATSD: Anchor-free two-stage ship detection based on feature enhancement in SAR images. Remote Sens. 2022, 14, 6058. [Google Scholar] [CrossRef]
  7. Wang, J.; Cui, Z.; Jiang, T.; Cao, C.; Cao, Z. Lightweight deep neural networks for ship target detection in SAR imagery. IEEE Trans. Image Process. 2022, 32, 565–579. [Google Scholar] [CrossRef]
  8. Wang, Z.; Wang, R.; Ai, J.; Zou, H.; Li, J. Global and local context-aware ship detector for high-resolution SAR images. IEEE Trans. Aerosp. Electron. Syst. 2023, 59, 4159–4167. [Google Scholar] [CrossRef]
  9. Tang, H.; Gao, S.; Li, S.; Wang, P.; Liu, J.; Wang, S.; Qian, J. A lightweight SAR image ship detection method based on improved convolution and YOLOv7. Remote Sens. 2024, 16, 486. [Google Scholar] [CrossRef]
  10. Yu, N.; Ren, H.; Deng, T.; Fan, X. A lightweight radar ship detection framework with hybrid attentions. Remote Sens. 2023, 15, 2743. [Google Scholar] [CrossRef]
  11. Zhang, X.; Zhang, S.; Sun, Z.; Liu, C.; Sun, Y.; Ji, K.; Kuang, G. Cross-sensor SAR image target detection based on dynamic feature discrimination and center-aware calibration. IEEE Trans. Geosci. Remote Sens. 2025, 63, 1–17. [Google Scholar] [CrossRef]
  12. Cui, Z.; Wang, X.; Liu, N.; Cao, Z.; Yang, J. Ship detection in large-scale SAR images via spatial shuffle-group enhance attention. IEEE Trans. Geosci. Remote Sens. 2020, 59, 379–391. [Google Scholar] [CrossRef]
  13. Duan, K.; Bai, S.; Xie, L.; Qi, H.; Huang, Q.; Tian, Q. Centernet: Keypoint triplets for object detection. In Proceedings of the IEEE/CVF International Conference on Computer Vision, Seoul, Republic of Korea, 27 October–2 November 2019; pp. 6569–6578. [Google Scholar]
  14. Fan, X.; Hu, Z.; Zhao, Y.; Chen, J.; Wei, T.; Huang, Z. A small ship object detection method for satellite remote sensing data. IEEE J. Sel. Top. Appl. Earth Obs. Remote Sens. 2024, 17, 11886–11898. [Google Scholar] [CrossRef]
  15. Redmon, J.; Divvala, S.; Girshick, R.; Farhadi, A. You only look once: Unified, real-time object detection. In Proceedings of the IEEE Conference on Computer Vision and Pattern Recognition, Las Vegas, NV, USA, 27–30 June 2016; pp. 779–788. [Google Scholar]
  16. Redmon, J.; Farhadi, A. YOLO9000: Better, faster, stronger. In Proceedings of the IEEE Conference on Computer Vision and Pattern Recognition, Honolulu, HI, USA, 21–26 July 2017; pp. 7263–7271. [Google Scholar]
  17. Fu, J.; Sun, X.; Wang, Z.; Fu, K. An anchor-free method based on feature balancing and refinement network for multiscale ship detection in SAR images. IEEE Trans. Geosci. Remote Sens. 2020, 59, 1331–1344. [Google Scholar] [CrossRef]
  18. Guo, H.; Yang, X.; Wang, N.; Gao, X. A CenterNet++ model for ship detection in SAR images. Pattern Recognit. 2021, 112, 107787. [Google Scholar] [CrossRef]
  19. Zhou, Y.; Wang, S.; Ren, H.; Hu, J.; Zou, L.; Wang, X. Multi-Level Feature-Refinement Anchor-Free Framework with Consistent Label-Assignment Mechanism for Ship Detection in SAR Imagery. Remote Sens. 2024, 16, 975. [Google Scholar] [CrossRef]
  20. Sun, Z.; Leng, X.; Zhang, X.; Zhou, Z.; Xiong, B.; Ji, K.; Kuang, G. Arbitrary-Direction SAR Ship Detection Method for Multiscale Imbalance. IEEE Trans. Geosci. Remote Sens. 2025, 63, 1–21. [Google Scholar] [CrossRef]
  21. Xie, X.; You, Z.H.; Chen, S.B.; Huang, L.L.; Tang, J.; Luo, B. Feature enhancement and alignment for oriented object detection. IEEE J. Sel. Top. Appl. Earth Obs. Remote Sens. 2023, 17, 778–787. [Google Scholar] [CrossRef]
  22. Zhang, X.; Wu, Y.; Zhang, G.; Yuan, Y.; Cheng, G.; Wu, Y. Shape-Dependent Dynamic Label Assignment for Oriented Remote Sensing Object Detection. IEEE J. Sel. Top. Appl. Earth Obs. Remote Sens. 2024, 18, 132–146. [Google Scholar] [CrossRef]
  23. Fu, K.; Fu, J.; Wang, Z.; Sun, X. Scattering-keypoint-guided network for oriented ship detection in high-resolution and large-scale SAR images. IEEE J. Sel. Top. Appl. Earth Obs. Remote Sens. 2021, 14, 11162–11178. [Google Scholar] [CrossRef]
  24. Sun, Y.; Sun, X.; Wang, Z.; Fu, K. Oriented ship detection based on strong scattering points network in large-scale SAR images. IEEE Trans. Geosci. Remote Sens. 2021, 60, 1–18. [Google Scholar] [CrossRef]
  25. Zhou, K.; Zhang, M.; Zhao, H.; Tang, R.; Lin, S.; Cheng, X.; Wang, H. Arbitrary-oriented ellipse detector for ship detection in remote sensing images. IEEE J. Sel. Top. Appl. Earth Obs. Remote Sens. 2023, 16, 7151–7162. [Google Scholar] [CrossRef]
  26. Ju, M.; Niu, B.; Zhang, J. FPDDet: An Efficient Rotated SAR Ship Detector Based on Simple Polar Encoding and Decoding. IEEE Trans. Geosci. Remote Sens. 2023, 61, 5218915. [Google Scholar] [CrossRef]
  27. Liu, S.; Chen, P.; Zhang, Y. A multi-scale feature pyramid SAR ship detection network with robust background interference. IEEE J. Sel. Top. Appl. Earth Obs. Remote Sens. 2023, 16, 9904–9915. [Google Scholar] [CrossRef]
  28. Zhao, Y.; Zhao, L.; Li, C.; Kuang, G. Pyramid attention dilated network for aircraft detection in SAR images. IEEE Geosci. Remote Sens. Lett. 2020, 18, 662–666. [Google Scholar] [CrossRef]
  29. Wan, H.; Chen, J.; Huang, Z.; Xia, R.; Wu, B.; Sun, L.; Yao, B.; Liu, X.; Xing, M. AFSar: An anchor-free SAR target detection algorithm based on multiscale enhancement representation learning. IEEE Trans. Geosci. Remote Sens. 2021, 60, 5219514. [Google Scholar] [CrossRef]
  30. Tang, L.; Tang, W.; Qu, X.; Han, Y.; Wang, W.; Zhao, B. A scale-aware pyramid network for multi-scale object detection in SAR images. Remote Sens. 2022, 14, 973. [Google Scholar] [CrossRef]
  31. Wan, H.; Chen, J.; Huang, Z.; Du, W.; Xu, F.; Wang, F.; Wu, B. Orientation Detector for Small Ship Targets in SAR Images Based on Semantic Flow Feature Alignment and Gaussian Label Matching. IEEE Trans. Geosci. Remote Sens. 2023, 61, 5218616. [Google Scholar] [CrossRef]
  32. He, K.; Zhang, X.; Ren, S.; Sun, J. Deep residual learning for image recognition. In Proceedings of the IEEE Conference on Computer Vision and Pattern Recognition, Las Vegas, NV, USA, 27–30 June 2016; pp. 770–778. [Google Scholar]
  33. Lin, T.Y.; Dollár, P.; Girshick, R.; He, K.; Hariharan, B.; Belongie, S. Feature pyramid networks for object detection. In Proceedings of the IEEE Conference on Computer Vision and Pattern Recognition, Honolulu, HI, USA, 21–26 July 2017; pp. 2117–2125. [Google Scholar]
  34. Vaswani, A.; Shazeer, N.; Parmar, N.; Uszkoreit, J.; Jones, L.; Gomez, A.N.; Kaiser, Ł.; Polosukhin, I. Attention is all you need. Adv. Neural Inf. Process. Syst. 2017, 30. [Google Scholar]
  35. Tian, Z.; Shen, C.; Chen, H.; He, T. FCOS: A Simple and Strong Anchor-Free Object Detector. IEEE Trans. Pattern Anal. Mach. Intell. 2022, 44, 1922–1933. [Google Scholar] [CrossRef]
  36. Neubeck, A.; Van Gool, L. Efficient non-maximum suppression. In Proceedings of the 18th International Conference on Pattern Recognition (ICPR’06), Hong Kong, 20–24 August 2006; Volume 3, pp. 850–855. [Google Scholar]
  37. Yu, J.; Jiang, Y.; Wang, Z.; Cao, Z.; Huang, T. Unitbox: An advanced object detection network. In Proceedings of the 24th ACM International Conference on Multimedia, Amsterdam, The Netherlands, 15–19 October 2016; pp. 516–520. [Google Scholar]
  38. Lin, T.Y.; Goyal, P.; Girshick, R.; He, K.; Dollár, P. Focal loss for dense object detection. In Proceedings of the IEEE International Conference on Computer Vision, Venice, Italy, 22–29 October 2017; pp. 2980–2988. [Google Scholar]
  39. Li, J.; Qu, C.; Shao, J. Ship detection in SAR images based on an improved faster R-CNN. In Proceedings of the 2017 SAR in Big Data Era: Models, Methods and Applications (BIGSARDATA), Beijing, China, 13–14 November 2017; pp. 1–6. [Google Scholar]
  40. Wei, S.; Zeng, X.; Qu, Q.; Wang, M.; Su, H.; Shi, J. HRSID: A high-resolution SAR images dataset for ship detection and instance segmentation. IEEE Access 2020, 8, 120234–120254. [Google Scholar] [CrossRef]
  41. Cui, Z.; Li, Q.; Cao, Z.; Liu, N. Dense attention pyramid networks for multi-scale ship detection in SAR images. IEEE Trans. Geosci. Remote Sens. 2019, 57, 8983–8997. [Google Scholar] [CrossRef]
  42. Hu, Q.; Hu, S.; Liu, S. BANet: A balance attention network for anchor-free ship detection in SAR images. IEEE Trans. Geosci. Remote Sens. 2022, 60, 5222212. [Google Scholar] [CrossRef]
  43. Girshick, R. Fast r-cnn. In Proceedings of the IEEE International Conference on Computer Vision, Santiago, Chile, 7–13 December 2015; pp. 1440–1448. [Google Scholar]
  44. Yang, X.; Yan, J.; Feng, Z.; He, T. R3det: Refined single-stage detector with feature refinement for rotating object. In Proceedings of the AAAI Conference on Artificial Intelligence, Philadelphia, PA, USA, 25 February–4 March 2025; Volume 35, pp. 3163–3171. [Google Scholar]
  45. Zhao, J.; Ding, Z.; Zhou, Y.; Zhu, H.; Du, W.L.; Yao, R.; El Saddik, A. OrientedFormer: An End-to-End Transformer-Based Oriented Object Detector in Remote Sensing Images. IEEE Trans. Geosci. Remote Sens. 2024, 62, 5640816. [Google Scholar] [CrossRef]
  46. Tian, Y.; Zhang, M.; Li, J.; Li, Y.; Yang, H.; Li, W. FPNFormer: Rethink the Method of Processing the Rotation-Invariance and Rotation-Equivariance on Arbitrary-Oriented Object Detection. IEEE Trans. Geosci. Remote Sens. 2024, 62, 5605610. [Google Scholar] [CrossRef]
Figure 1. Distinct bounding boxes annotation: (a) horizontal bounding box annotation, (b) rotated bounding box annotation.
Remotesensing 17 01770 g001
Figure 2. Horizontal bounding box for ground truth: (a) multi-scale ships, (b) dense arrangement of ships, (c) ship in complex sea clutter, (d) ship in inshore land interference.
Remotesensing 17 01770 g002
Figure 3. The proposed arbitrary-oriented SAR ship object detection framework.
Remotesensing 17 01770 g003
Figure 4. The architecture of the proposed CLAFA module.
Remotesensing 17 01770 g004
Figure 5. The multi-task detection head of the proposed CLAFANet. The classification and regression branches are responsible for the predicted class scores and the bounding box parameters ( L , R , T , B ) , respectively. The angle branch predicts the values after encoding and phase shifting.
Remotesensing 17 01770 g005
Figure 6. SAR ships in various scenarios: (a) SAR ship objects from HRSID, (b) SAR ship objects from SSDD.
Remotesensing 17 01770 g006
Figure 7. Visualization results of ablation experiments: (a) multi-scale ship detection, (b) ship orientation prediction (from left to right: ground truth (GT), baseline, the proposed method with different components).
Remotesensing 17 01770 g007
Figure 8. PR curves of each method on SSDD: (a) IoU = 0.5, (b) IoU = 0.75.
Remotesensing 17 01770 g008
Figure 9. PR curves of each method on HRSID: (a) IoU = 0.5, (b) IoU = 0.75.
Remotesensing 17 01770 g009
Figure 10. Visualization results of SSDD: (a) GT, (b) R-FCOS, (c) R-Faster R-CNN, (d) R3Det, (e) CLAFANet.
Remotesensing 17 01770 g010
Figure 11. Visualization results of HRSID: (a) GT, (b) R-FCOS, (c) R-Faster R-CNN, (d) R3Det, (e) CLAFANet.
Remotesensing 17 01770 g011
Table 1. Ablation experimental results on SSDD.
MethodCLAFAFSPSCParams(M)FPSPRF1mAP AP 50 AP 75 AP s AP m AP l
Baseline32.163.192.187.089.539.188.426.637.243.049.1
Model 133.242.692.988.590.240.888.429.439.446.753.5
Model 232.145.094.089.190.941.789.630.239.446.546.4
Proposed33.236.793.190.391.142.391.331.439.548.756.6
Table 2. Ablation experimental results on HRSID.
MethodCLAFAFSPSCParams(M)FPSPRF1mAP AP 50 AP 75 AP s AP m AP l
Baseline32.134.985.774.079.443.280.644.841.054.214.1
Model 133.225.287.477.381.846.081.949.142.055.522.2
Model 232.120.486.778.481.445.081.047.743.253.116.5
Proposed33.219.088.080.183.347.683.851.045.657.119.8
Table 3. Performance comparison of different methods on SSDD.
Params(M)FPSPRF1mAP AP 50 AP 75 AP s AP m AP l
R-FCOS [35]32.163.192.187.089.539.188.426.637.243.049.1
R3Det [44]41.852.888.384.086.137.687.923.036.440.542.5
R-Faster-R-CNN [43]41.414.092.289.090.640.691.323.538.944.744.5
OrientedFormer [45]49.127.492.886.488.638.391.219.236.442.742.9
FPNFormer [46]--------35.1-51.1
CLAFANet33.236.793.190.391.142.391.331.439.548.756.6
Table 4. Performance comparison of different methods on HRSID.
Params(M)FPSPRF1mAP AP 50 AP 75 AP s AP m AP l
R-FCOS [35]32.134.985.774.079.443.280.644.841.054.214.1
R3Det [44]41.828.784.671.077.339.479.135.738.145.99.3
R-Faster-R-CNN [43]41.411.486.376.080.842.580.940.841.449.38.5
OrientedFormer [45]49.114.287.378.481.746.583.548.145.453.911.4
CLAFANet33.219.088.080.183.347.683.851.045.657.119.8
Disclaimer/Publisher’s Note: The statements, opinions and data contained in all publications are solely those of the individual author(s) and contributor(s) and not of MDPI and/or the editor(s). MDPI and/or the editor(s) disclaim responsibility for any injury to people or property resulting from any ideas, methods, instructions or products referred to in the content.

