Article

Enhancing Urban Understanding Through Fine-Grained Segmentation of Very-High-Resolution Aerial Imagery

by
Umamaheswaran Raman Kumar
*,
Toon Goedemé
and
Patrick Vandewalle
Department of Electrical Engineering (ESAT), KU Leuven, 3000 Leuven, Belgium
*
Author to whom correspondence should be addressed.
Remote Sens. 2025, 17(10), 1771; https://doi.org/10.3390/rs17101771
Submission received: 28 February 2025 / Revised: 14 May 2025 / Accepted: 16 May 2025 / Published: 19 May 2025
(This article belongs to the Special Issue Applications of AI and Remote Sensing in Urban Systems II)

Abstract

:
Despite the growing availability of very-high-resolution (VHR) remote sensing imagery, extracting fine-grained urban features and materials remains a complex task. Land use/land cover (LULC) maps generated from satellite imagery often fall short in providing the resolution needed for detailed urban studies. While hyperspectral imagery offers rich spectral information ideal for material classification, its complex acquisition process limits its use on aerial platforms such as manned aircraft and unmanned aerial vehicles (UAVs), reducing its feasibility for large-scale urban mapping. This study explores the potential of using only RGB and LiDAR data from VHR aerial imagery as an alternative for urban material classification. We introduce an end-to-end workflow that leverages a multi-head segmentation network to jointly classify roof and ground materials while also segmenting individual roof components. The workflow includes a multi-offset self-ensemble inference strategy optimized for aerial data and a post-processing step based on digital elevation models (DEMs). In addition, we present a systematic method for extracting roof parts as polygons enriched with material attributes. The study is conducted on six cities in Flanders, Belgium, covering 18 material classes—including rare categories such as green roofs, wood, and glass. The results show a 9.88% improvement in mean intersection over union (mIOU) for building and ground segmentation, and a 3.66% increase in mIOU for material segmentation compared to a baseline pyramid attention network (PAN). These findings demonstrate the potential of RGB and LiDAR data for high-resolution material segmentation in urban analysis.

1. Introduction

In remote sensing, land use/land cover (LULC) classification categorizes landscapes based on human activity and environmental features, including agricultural land, forests, urban areas, wasteland, and water bodies. For decades, LULC maps have been derived using satellite imagery, primarily from platforms like Landsat [1], Sentinel [2], and Worldview [3]. Traditionally, these maps have been utilized for change detection, allowing researchers to track landscape alterations by comparing scenes captured over time. More recently, the integration of deep learning (DL) techniques with high-resolution aerial imagery, captured by manned aircrafts and unmanned aerial vehicles (UAVs) using specialized airborne sensors, has facilitated the creation of more detailed and task-specific LULC maps, particularly suited to the complexities of urban environments.
Urban areas pose distinct challenges and offer unique opportunities in geospatial analysis due to their dense, diverse, and heterogeneous composition, typically comprising residential, commercial, and industrial zones, complex transportation networks, and varied infrastructure types and materials. Uncontrolled urban expansion can worsen critical environmental concerns such as the urban heat island (UHI) effect, inefficient energy use, and the spread of impervious surfaces, which disrupt natural drainage patterns and increase the risk of localized flooding. High-resolution LULC data are essential for addressing these challenges, as they enable actionable insights for environmentally sustainable urban planning, climate adaptation, and efficient resource management. For instance, identifying rooftop materials and surface characteristics supports the strategic deployment of solar panels by pinpointing rooftops with suitable materials and orientations for photovoltaic systems. Similarly, detailed mapping of ground surfaces such as asphalt, grass, or permeable pavement can inform efforts to reduce heat retention and enhance green infrastructure. These applications demand spatially precise, material-specific information that extends beyond traditional LULC categories and the limitations of coarse-resolution satellite imagery.
This study aims to address these needs by applying deep learning methods to very-high-resolution (VHR) aerial imagery for fine-grained classification of roof and ground-surface materials in urban settings. The data for this study were sourced from six municipalities across the Flemish region of Belgium (Figure 1). According to recent reports [4] from the Flemish Statistical Authority, approximately 28.7% of Flanders’ surface area was built-up as of 2021, with a marked increase from 24.4% in 2000. The majority of this built-up land comprises residential areas, roads, and associated spaces for human activity. Nonetheless, cropland and grassland still dominate more than half of the region, making it a unique setting where dense urban cores coexist with expansive natural and agricultural areas. This diversity in land use, building typologies, and material surfaces makes Flanders an ideal testbed for developing and evaluating high-resolution urban classification models.
While prior research on aerial imagery has predominantly focused on building footprint extraction or generic land cover classification, this work expands the scope by enabling fine-grained identification of rooftop types, ground materials, and even distinct roof segments using RGB and LiDAR data. Such detailed semantic segmentation is critical for advancing next-generation urban applications in areas such as energy optimization, infrastructure assessment, and environmental monitoring. Despite the increasing availability of VHR aerial data and significant progress in deep learning-based remote sensing, to the best of our knowledge, no previous study has tackled large-scale semantic segmentation of urban material types from RGB and LiDAR—encompassing both roofing and ground surfaces—across multiple cities. Existing approaches often limit themselves to broader tasks, overlooking the material-level diversity that is essential for real-world applications. The ability to distinguish between materials such as asphalt, concrete, tiles, or green roofs is vital for accurate modeling, yet it remains underexplored. This study, therefore, presents what we believe to be the first large-scale effort to perform material-level semantic segmentation of urban environments using VHR aerial imagery.
Contributions. This work offers the following key contributions: (1) the development of a multi-head segmentation network that simultaneously predicts material classes and delineates roof part boundaries; (2) the introduction of a multi-offset self-ensemble inference strategy specifically adapted for aerial imagery to improve prediction consistency; (3) the integration of a postprocessing filter leveraging digital elevation models (DEMs) to refine segmentation results; and (4) an ablation study that systematically evaluates the contribution of each component within the proposed pipeline.

2. Background and Related Works

Aerial image segmentation has become critical for applications in urban planning, environmental monitoring, and disaster management. Recent advances in deep learning, particularly through convolutional neural networks (CNNs) and transformer-based architectures, have significantly improved segmentation accuracy and efficiency for aerial imagery. Fully convolutional networks (FCNs) [5] were foundational in applying CNNs to segmentation by replacing fully connected layers with convolutional ones, thereby retaining spatial information throughout the process. The U-Net [6] architecture introduced a U-shaped encoder–decoder structure with skip connections, which further enhanced segmentation accuracy, especially in cases requiring fine detail. SegNet [7] refined this approach by leveraging pooling indices from the encoder’s max-pooling steps for non-linear upsampling in the decoder, maintaining spatial resolution and capturing image detail effectively. DeepLab [8] extended CNN capabilities by integrating atrous (dilated) convolutions, allowing the network to capture multi-scale contextual information with an expanded receptive field, essential for accurately segmenting complex structures of varying sizes. This architecture also incorporated conditional random fields (CRFs) [9] as a post-processing step to enhance boundary precision by enforcing spatial coherence and continuity in the segmentation outputs. Vision transformers (ViTs) [10] and their variants, such as the Swin transformer [11], utilize self-attention mechanisms to capture long-range dependencies. However, unlike CNNs, transformer networks lack inherent spatial priors, making them highly data-dependent and necessitating large-scale datasets for effective training.

2.1. Advances with Airborne Platforms

The rapid advances in airborne platforms have dramatically enhanced the quality and resolution of aerial imagery, particularly through improvements in ground sampling distance (GSD), now reaching VHR levels such as 9 cm in the Vaihingen  [12] and 5 cm in the Potsdam [13] datasets. This substantial increase in image resolution has broadened the scope of using airborne platforms across diverse fields. In agriculture, VHR imagery enables precise crop classification [14,15,16], crop health monitoring [17,18,19,20,21,22], and crop row detection [23,24,25,26], promoting data-driven precision farming that optimizes yield and resource efficiency. In environmental monitoring, VHR images play a critical role in forest health monitoring [27,28,29], wetland management [30,31], and coastal area surveillance [32,33]. For urban planning, UAV advancements support applications such as traffic monitoring [34,35], land use classification [36,37], green space analysis [38], and urban tree species identification [39]. These capabilities enable more detailed, data-rich analysis across various disciplines.

2.2. VHR Imagery for Predicting Roof Properties

Airborne platforms equipped with VHR sensors capture detailed aerial imagery, enabling precise analysis of roof characteristics crucial for sustainable urban planning. These high-resolution data aid in optimizing building energy efficiency by facilitating effective thermal regulation, reducing energy consumption for heating and cooling, and mitigating the urban heat island effect [40]. VHR imagery also supports efficient solar panel placement by assessing roof orientation with respect to the sun, the shade of trees, surrounding objects, topography, and the atmospheric conditions, thereby maximizing renewable energy capture [41]. Additionally, VHR data can be used to promote the implementation of green roofs, which enhance air quality and urban biodiversity [42]. In architectural planning, accurate roof data from VHR contribute to cohesive design and historical preservation [43]. By integrating detailed roof characteristics into 3D models, urban planners can perform complex simulations and visualizations [44], facilitating informed decisions that bolster urban resilience and improve environmental quality.

2.3. Roof Type Classification

Recent advances in roof type classification have harnessed high-resolution aerial and satellite imagery through machine learning and deep learning techniques, yielding variable accuracy across diverse datasets and architectural styles. To enhance roof classification and mitigate dependence on low-quality digital surface models (DSMs), Partovi et al. [45] utilized pansharpened imagery combined with a pre-trained CNN and a support vector machine (SVM) classifier, achieving high accuracy and efficiency across seven defined roof types. Similarly, Castagno and Atkins [46] integrated CNN models with SVM and decision tree classifiers, demonstrating that the fusion of satellite and LiDAR data significantly enhances roof type identification. Buyukdemircioglu et al. [47] developed a dataset comprising roof types derived from high-resolution (10 cm) orthophotos in Çeşme, Turkey, to classify six distinct roof types using a shallow CNN model. In another approach, Ölçer et al. [48] employed a one-shot learning framework with a Siamese neural network to classify flat, gable, and hip roofs with minimal training examples.

2.4. Roof Material Segmentation

Material segmentation assigns a material label to each pixel in an image, offering more detailed insights into a scene’s physical composition compared to semantic segmentation, which focuses on object or region type rather than material. Cimpoi et al. [49] introduced the Describable Textures Dataset (DTD), which consists of images of patterns collected “in the wild” and categorized according to forty-seven texture attributes, facilitating the study of texture representation in images. Bell et al. [50] introduced the Materials in Context Database (MINC), a large-scale open dataset of material samples, and integrated it with deep learning to achieve material recognition and segmentation in natural images. Xue et al. [51] developed the GTOS (Ground Terrain in Outdoor Scenes) database, comprising over 30,000 images across 40 classes of ground terrain in outdoor environments. More recently, the KITTI-Materials dataset [52] has provided material annotations for urban driving scenes. Despite these advancements, no dataset has been specifically developed for material segmentation in aerial imagery using RGB and/or LiDAR data. Existing methods primarily focus on close-range or ground-level images, limiting their applicability to aerial and broader geospatial contexts.
Jayasinghe et al. [53] found that while roof orientation has minimal influence on indoor temperatures in passive houses located in warm, humid climates, the selection of roofing materials, insulation, and light-colored surfaces can significantly enhance thermal comfort. Prado and Ferreira [54] investigated the albedo of roofing materials in Brazil by employing a spectrophotometer to measure reflectance and assessing the effects on heat gain and surface temperature under solar radiation, aiming to address urban heat island effects and energy consumption. Mendez et al. [55] evaluated the impact of conventional and alternative roofing materials on the quality of harvested rainwater, concluding that all roofing types necessitate treatment to meet EPA standards, with metal, concrete tile, and cool roofs yielding lower concentrations of contaminants compared to shingle and green roofs, which exhibited higher levels of dissolved organic carbon and potential metal contamination.
Lemp and Weidner [56] integrated hyperspectral and laser scanning data to characterize urban roof surfaces, enhancing material classification by utilizing the detailed spectral resolution of hyperspectral data alongside the geometric information from laser scanning. Ilehag et al. [57] studied energy emissions from building roofs impacted by urban heat islands in Perth, Australia, utilizing multispectral, thermal infrared, RGB, and LiDAR data to classify roofing materials (including cement tiles, Colorbond, and Zincalume) through pixel-wise, superpixel-wise, and building-wise segmentation approaches. Trevisiol et al. [58] introduced a semi-automatic, object-oriented methodology using high-resolution multispectral imagery to map buildings and roofing materials in Bologna, Italy. Kim et al. [59] proposed a 43-layer CNN for detecting buildings and classifying roof materials in satellite images, thereby enhancing disaster resilience by identifying and addressing vulnerabilities in roof structures. These methods for roof material identification primarily rely on hyperspectral imaging, with a clear gap in the literature, as no studies have used RGB imagery, despite its potential for cost-effective solutions.

2.5. Building Delineation

Boonpook et al. [60] present a deep learning framework for UAV-based photogrammetry that integrates RGB, Digital Surface Model (DSM), and Vegetation Difference Index (VDVI) bands, improving building extraction accuracy from 93% to 97% in complex urban areas. Farajzadeh et al. [61] apply a U-Net architecture with ResNet to extract building footprints from UAV orthophotos and normalized Digital Surface Models (nDSMs), enhancing precision from 89% to 97% and recall from 77% to 91% by incorporating height information. Pilinja et al. [62] utilize high-resolution UAV imagery and various machine learning algorithms to extract building rooftops, demonstrating improved accuracy with elevation data, benefiting urban planning. Djenaliev et al. [63] use UAV data over Karakol city, Kyrgyzstan, producing a Digital Terrain Model (DTM) and extracting building footprints with 92.4% completeness and 95.2% correctness. Roof-Former  [64] utilizes a vision Transformer to enhance the vectorization of building roof geometries from raster images, achieving improved edge heat map F1-scores (76.2% to 78.1%) while maintaining topological validity. These methods primarily focus on building delineation but overlook the material properties of roof structures and ground materials, both of which are essential for various urban applications.

3. Materials and Methods
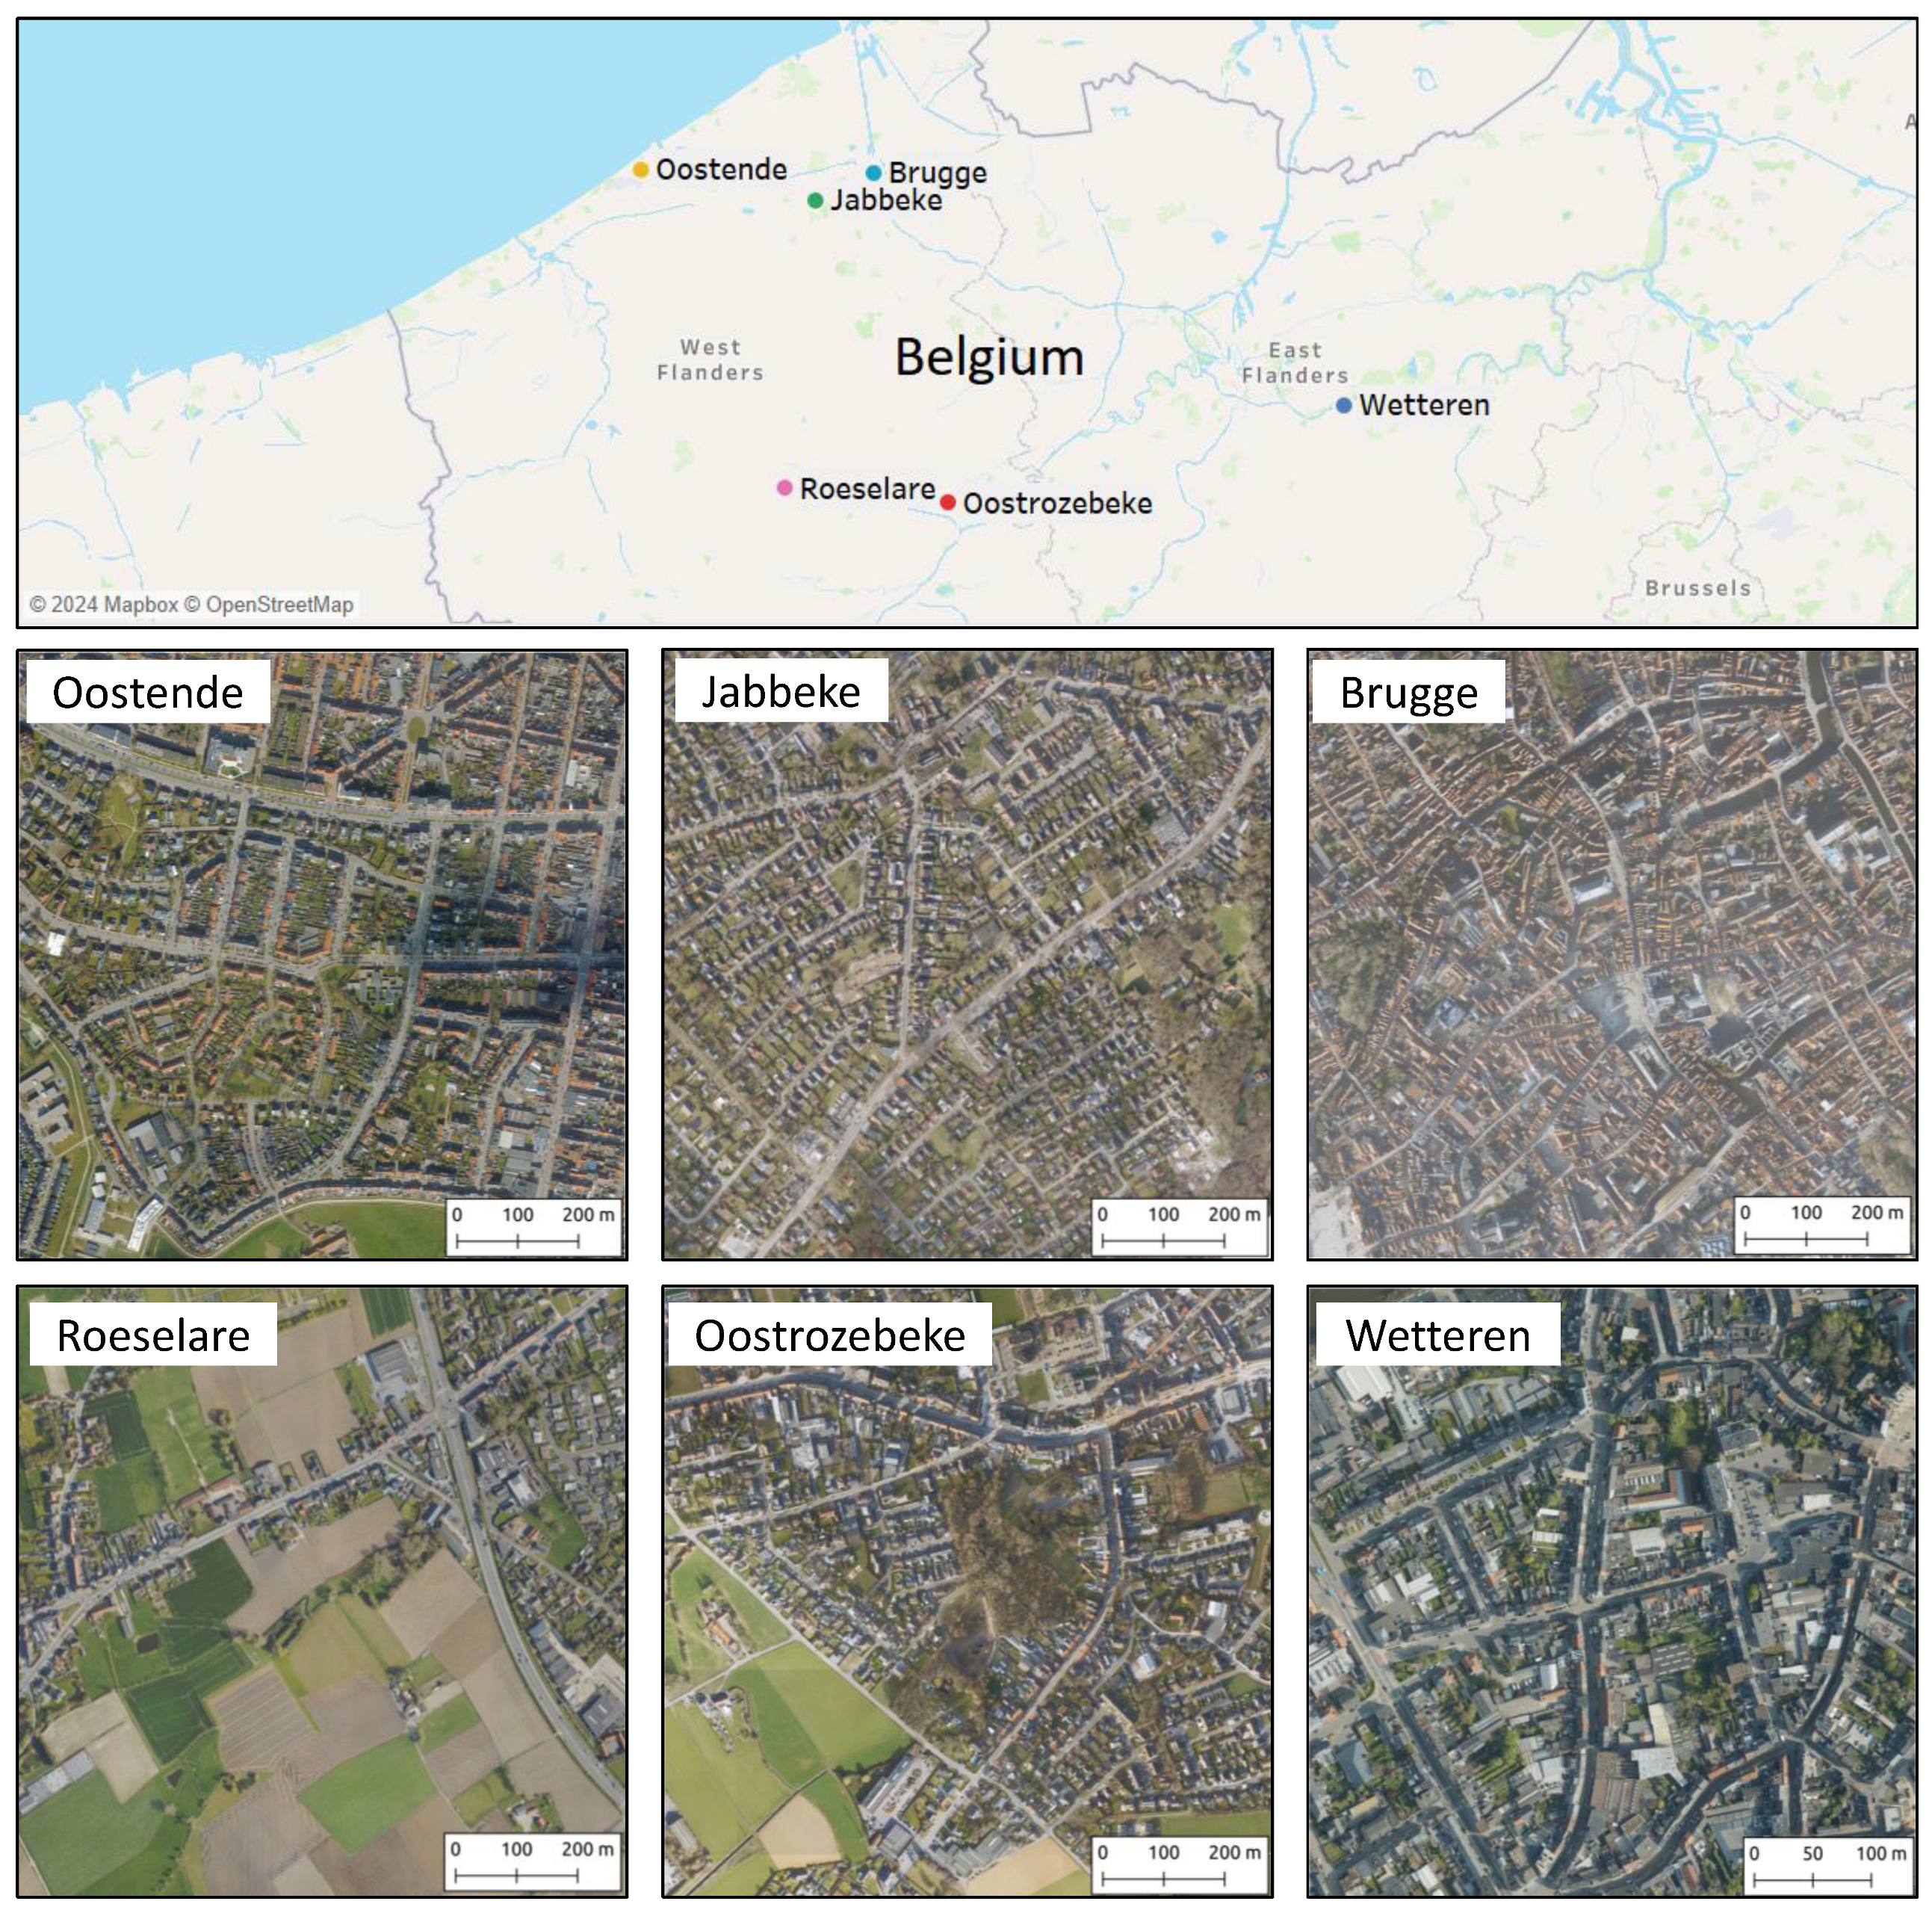
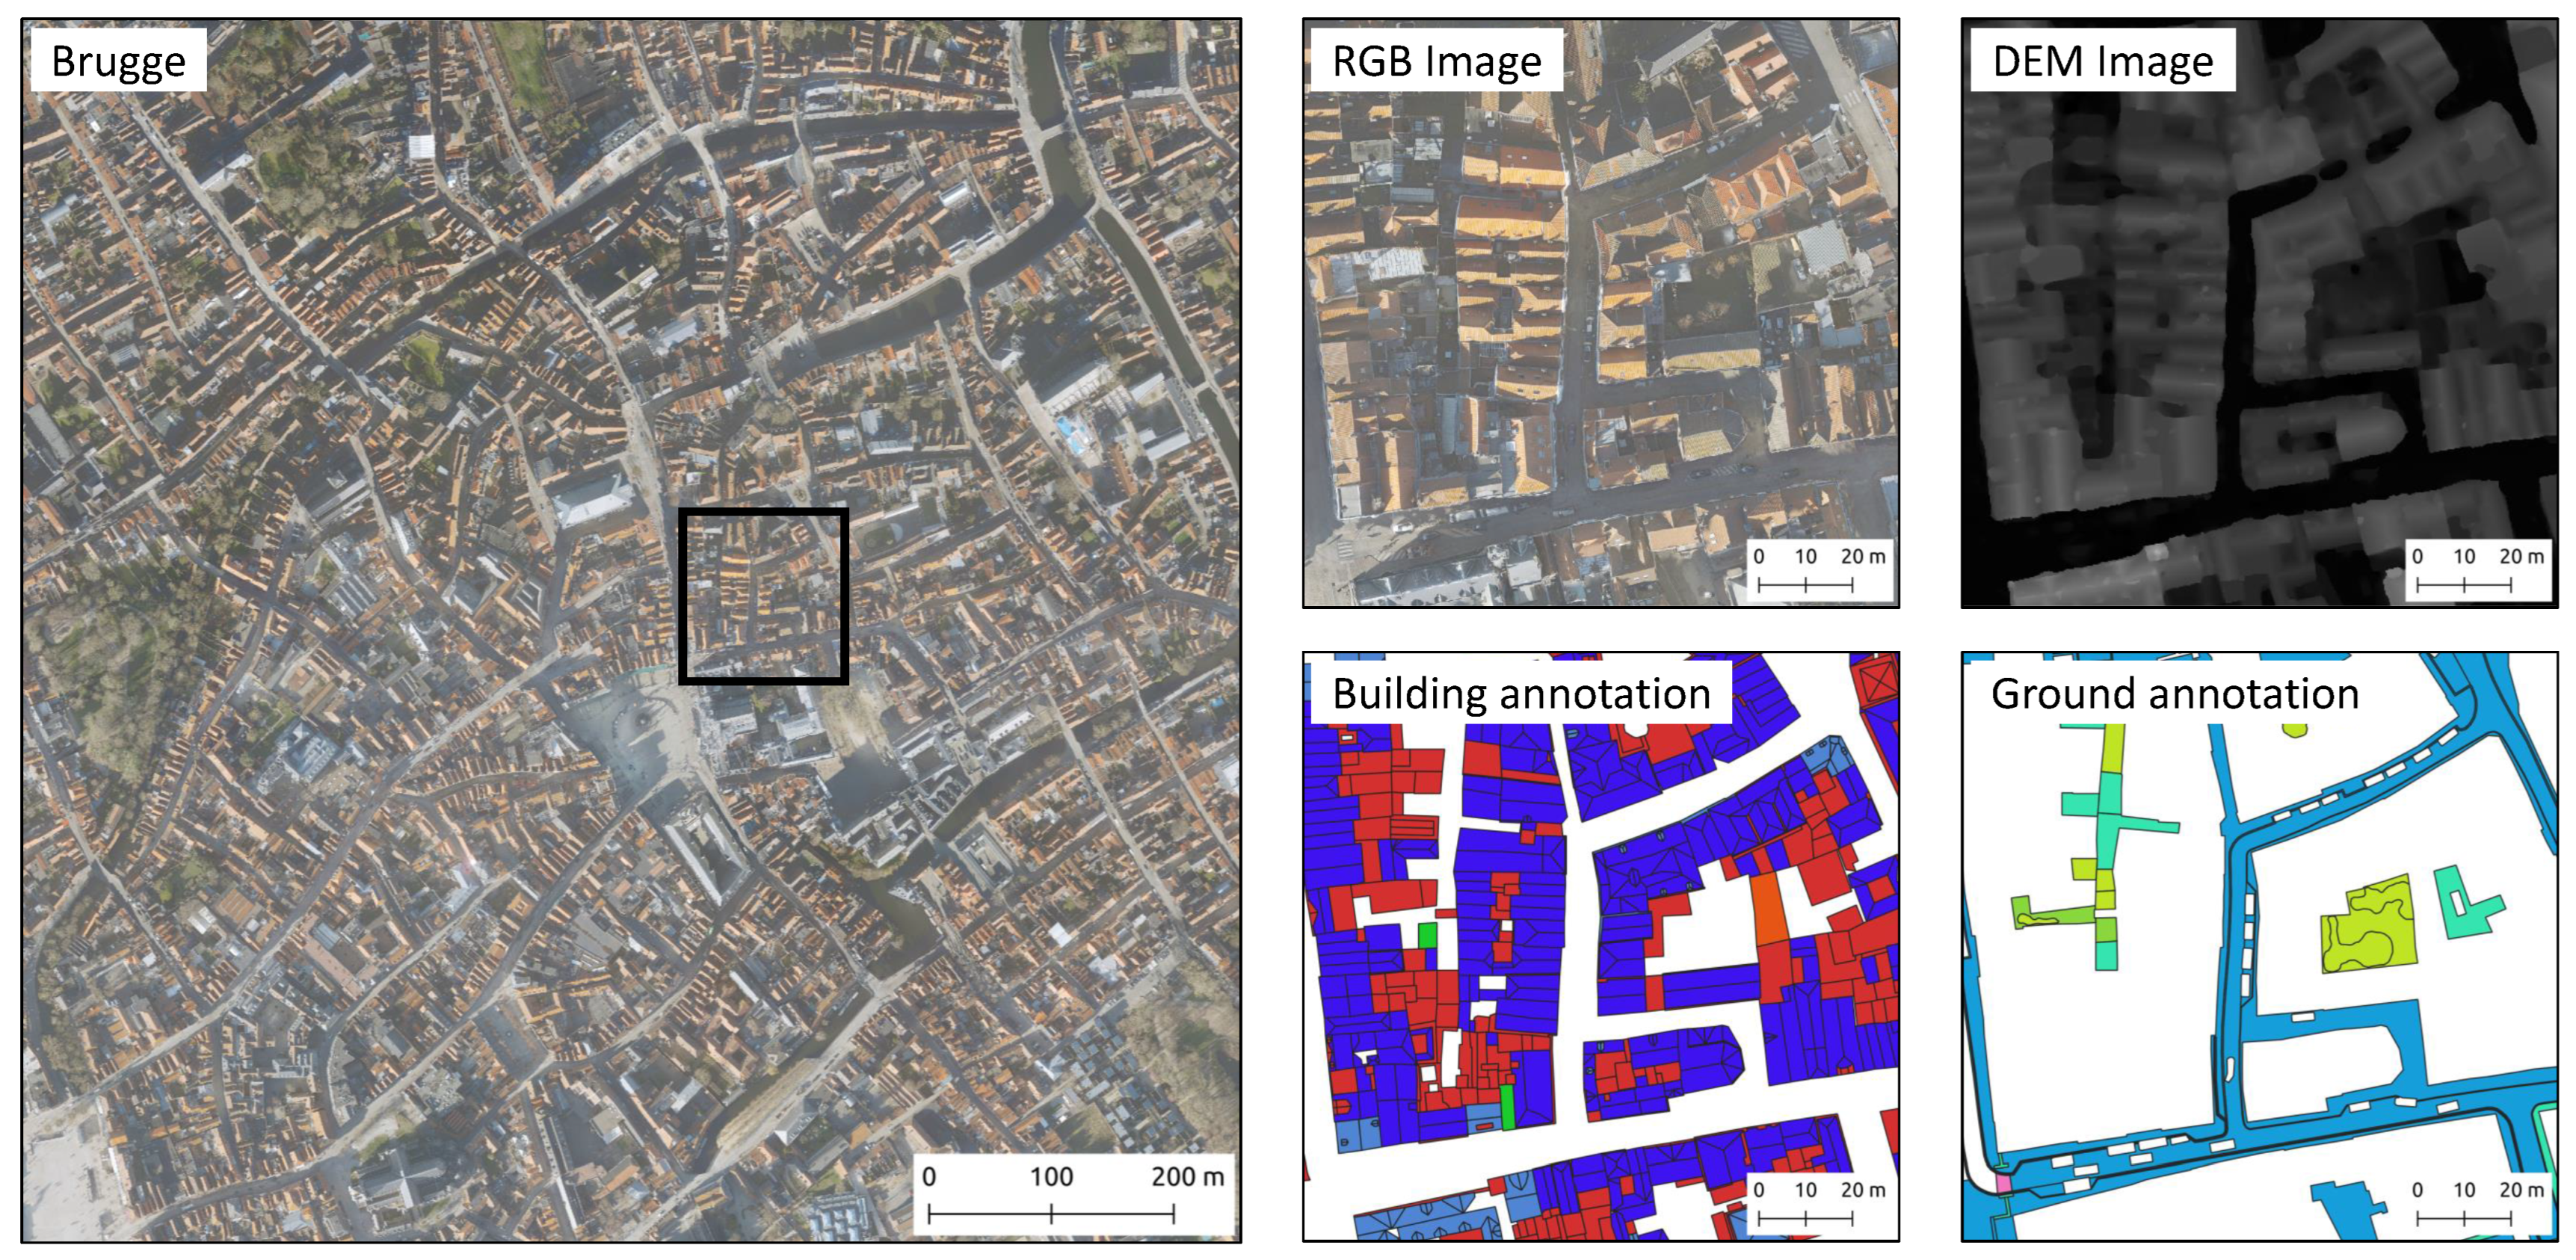
3.1. Dataset

The aerial data used in this study were acquired using the Leica CityMapper-2 airborne hybrid sensor system, which integrates nadir and oblique RGB and LiDAR components for urban mapping. For this analysis, only the nadir RGB imagery and LiDAR-derived elevation data were utilized. The nadir-facing RGB camera has a 150-megapixel resolution, equipped with a low-distortion lens and a backside-illuminated CMOS sensor. Mechanical forward-motion compensation (FMC) was applied to minimize motion blur during acquisition. The LiDAR component operates at a 2 MHz pulse repetition frequency with a Multiple Pulses in the Air (MPiA) configuration and uses an oblique scan pattern to ensure a more uniform point distribution across the surveyed area. The resulting point clouds were processed into rasterized digital elevation models, which were spatially aligned with the orthophotos.
The dataset encompasses six cities within the Flemish region of Belgium, covering in total an approximate area of 4.00 km2. Each city is represented by three primary files that contribute to a comprehensive data structure: (i) a 3-channel RGB orthophoto, stored in JPEG2000 or GeoTIFF format, offering a high-resolution ground sampling distance (GSD) of 3 cm, allowing for fine-grained spatial details in urban and suburban landscapes; (ii) a Digital Elevation Model (DEM) with a GSD of 25 cm, stored as a single-channel GeoTIFF, providing crucial height information that aids in differentiating between various objects and structures within the urban environment; and (iii) ground truth annotations available in GeoJSON format, where each polygon is associated with a specific class label. The DEM and RGB files complement each other by providing a layered understanding of both visual and topographical features.
As illustrated in Figure 2, sample data from Brugge exhibit the unique layering and detailed annotation setup of the dataset. The RGB orthophoto contains integer values ranging from 0 to 255 per channel, providing clear visual differentiation among materials, while the DEM file supplies float values in meters, crucial for determining object heights and contours. Annotation polygons in the GeoJSON files define specific material regions and are categorized into 18 class labels, which are organized into two primary categories: roof materials and ground materials, as shown in Figure 3. Roof materials include seven classes—roof tiles, bitumen/EPDM, slates, corrugated sheets, zinc/metal, glass, and green roofs—capturing the diversity of roofing types commonly found in the region. Ground materials span eleven classes: grass, permeable materials, tiles, KWS/asphalt, cobblestone, clinker bricks, concrete, water, gravel, border stones, and wood. The annotations were generated by non-expert annotators, and visual inspection ensured annotation consistency across annotators, providing reliable ground truth labels for model training and evaluation.
The dataset is characterized by a significant class imbalance, posing a challenge for deep learning methods. As highlighted in Figure 3, the grass class dominates the area, covering approximately 38% of the total, while other classes such as border stone, glass, gravel, green roof, water, and wood collectively account for less than 5% of the annotated area. This imbalance reflects the natural distribution of surface materials in urban and suburban landscapes. The complex urban landscape of Flanders, with its varied material types and architectural elements, provides an ideal testing ground for evaluating the robustness and adaptability of aerial image segmentation models.
The dataset also includes a strategic data split to maximize training efficiency and model generalization across different urban contexts. The three largest cities—Brugge, Oostende, and Roeselare—comprise 60% of the total data and are allocated for training, ensuring an ample representation of each material class in the learning phase. This allows the network to learn distinctive material characteristics across various scales and perspectives, enhancing its ability to generalize. The smaller cities, Jabbeke, Oostrozebeke, and Wetteren, serve as validation and testing, providing a robust basis for evaluating the model’s performance in less prevalent urban layouts and architectural styles. This setup allows the network to be tested on regions that it has not encountered during training, offering a realistic assessment of its segmentation capabilities across the diverse urban landscape of the Flemish region.

3.2. Methodology

An overview of the workflow is illustrated in Figure 4, detailing the key processing components involved. The workflow is structured around five primary elements: (1) a multi-head convolutional neural network (CNN) generates two sets of probability maps from a single RGB image, (2) a DEM-based filter distinguishes between ground and roof pixels using the elevation data, (3) a multi-offset self-ensemble approach mitigates noise at the edges of image patches and produces smooth probability maps, (4) a clustering algorithm identifies roof components based on the edges of the roof parts raster, and (5) a vectorization algorithm transforms the identified building roof components and ground materials into polygon representations.

3.2.1. Multi-Head CNN

The architecture utilized for this segmentation task, illustrated in Figure 5, is based on a Convolutional Neural Network (CNN) with a multi-head extension for enhanced functionality. CNNs form the core structure of segmentation networks by leveraging convolution layers exclusively, which allows them to handle input images of various sizes and produce segmentation maps that maintain alignment with the input dimensions. Each pixel in the resulting segmentation map thus directly corresponds to a pixel in the input image. The typical CNN structure consists of an encoder network responsible for extracting features from the input image, followed by a decoder network that reconstructs these features into a segmentation map. The encoder typically comprises stacked convolution and pooling layers, while the decoder contains transposed convolution layers that upsample the feature maps to create the final segmentation output.
For this task, the network architecture builds on the pyramid attention network (PAN) [65], which enhances the traditional U-Net architecture with advanced attention mechanisms specifically designed to improve feature extraction. PAN introduces two primary attention modules: feature pyramid attention (FPA) and global attention upsample (GAU). FPA facilitates multi-scale feature extraction by aggregating information across varying resolutions, thereby increasing the network’s sensitivity to fine details in the input data. Meanwhile, GAU incorporates global context into the upsampling process, which ensures spatial coherence across the segmentation output, resulting in smoother and more accurate delineations. This combination improves the extraction of precise dense features compared to dilated convolutions and artificially designed decoder networks.
The multi-head CNN architecture extends the PAN framework by incorporating two separate segmentation heads in the final decoder layer. The first head is tailored for predicting material types across both roof and surface areas, thus providing a nuanced classification of urban material types. The second head is specifically designed to detect the edges of roof parts, allowing for detailed boundary delineation within structural elements. The material classification task benefits from edge detection by using the boundaries identified by the edge detection head to refine the classification results, as the presence of an edge often indicates a transition between different materials. In turn, the edge detection head benefits from material classification, as knowing the material type in an area can help pinpoint where edges are likely to appear, such as at the transition between roof sections of different materials. This multi-head approach not only enhances the granularity of the segmentation results but also improves the overall accuracy of the network in classifying complex urban environments.
Data preprocessing. In this study, the input raster images are typically large (e.g., Brugge covers approximately 1000 × 1000 m2), making it impractical to feed entire images to the network due to processing constraints. Consequently, the images are divided into smaller patches, each measuring 1024 × 1024 pixels, corresponding to an area of approximately 37 × 37 m2. Each input patch has dimensions of 1024 × 1024 × 3 , and the network generates two output probability maps per patch: one of size 1024 × 1024 × 18 for material classes and another of size 1024 × 1024 × 2 for roof part edges. To ensure efficient processing, image patches and their corresponding annotations are generated dynamically from JPEG2000/GeoTIFF images and GeoJSON files, respectively.
To expand the training dataset and improve the model’s generalization capabilities, a carefully selected set of data augmentation techniques was employed. Due to the orthophoto nature of the dataset, augmentation was limited to transformations appropriate for aerial imagery. Horizontal and vertical flipping were applied to account for orientation variations. HSV augmentation involved shifting the hue (H) channel within [ 18 , + 18 ] and scaling the saturation (S) and value (V) channels by a factor sampled from [ 1.00 , 1.10 ] or its reciprocal. The resulting values were clipped to ensure they remained within the valid HSV color range, introducing controlled variations in color intensity and brightness. These augmentations were randomly applied in each training epoch, preventing repetitive data exposure and reducing the risk of overfitting, thus enhancing the network’s robustness to variations within the input data. Additionally, to improve the accuracy of roof part segmentation, the ground truth edges were slightly dilated, aiding the network in learning boundary details more effectively.
Network training. The network was trained on an NVIDIA Tesla V100 GPU with 32GB RAM over the course of 300 epochs, utilizing a dataset containing 3156 image patches from three urban areas: Brugge, Oostende, and Roeselare. Each patch measures 1024 × 1024 pixels, capturing a diverse array of architectural and environmental features from these regions. To optimize performance in material and structural segmentation, a multi-head categorical cross-entropy (CCE) loss function was employed. This loss function extends the conventional CCE by incorporating multiple segmentation heads, each addressing distinct segmentation objectives such as material classification and roof edge detection.
The CCE loss function, L C C E , measures the discrepancy between the predicted and actual probability maps for each pixel, as defined as follows:
L C C E = 1 N n = 1 N c = 1 C w c × 1 ( y n , c i g n o r e _ i n d e x ) log y ^ n , c
Here, N is the total number of pixels in each patch, and C represents the number of target classes, such as different roof and ground materials. The ground truth label for pixel n in class c is denoted as y n , c , and y ^ n , c represents the network’s predicted probability that pixel n belongs to class c. The i g n o r e _ i n d e x term provides flexibility, enabling certain classes to be excluded from the loss calculation, thus allowing for finer control over the training process. The weight parameter w c allows for class imbalance handling by assigning higher importance to underrepresented classes. The class weights w c were computed using the following function:
w c = 1 100 · ln ( 1.02 + f c )
where f c [ 0 , 100 ] denotes the frequency (in percentage) of class c. This inverse logarithmic formulation assigns higher weights to less frequent classes during training. The logarithmic scale ensures that the weight decreases smoothly as class frequency increases, while the additive constant 1.02 prevents numerical instability for near-zero frequencies. The scalar factor 100 normalizes the resulting weights for effective use within the loss function.
In extending the CCE function to a multi-head architecture, a combined loss function, L C C E , m h , was formulated by averaging the losses from each segmentation head, weighted to prioritize specific segmentation tasks. This approach enhances the network’s capacity to manage multiple objectives, such as material classification and edge detection, by leveraging contributions from each head. The multi-head CCE loss function is defined as follows:
L C C E , m h = 1 H h = 1 H w h × L C C E , h
Here, H represents the number of output heads, each corresponding to a distinct segmentation task. The weight w h assigned to each head allows for task prioritization based on importance, with L C C E , h denoting the categorical cross-entropy loss for the head h. By averaging the loss functions across all heads, this approach ensures a balanced optimization that accounts for both material segmentation and structural boundary delineation, ultimately enhancing the network’s performance across varied urban scenarios.
This multi-head approach, combined with class-balancing, addresses the class imbalance inherent in real-world urban datasets, where certain materials (e.g., asphalt, vegetation) may dominate over less frequent classes (e.g., roof edges or specific building materials). Adjusting weights for each class and segmentation head enables the network to more effectively identify subtle features in complex urban landscapes, improving material classification and boundary detection precision. The flexibility in class and head weighting strengthens the model’s robustness, allowing it to prioritize the classes and tasks critical to the intended application domain.

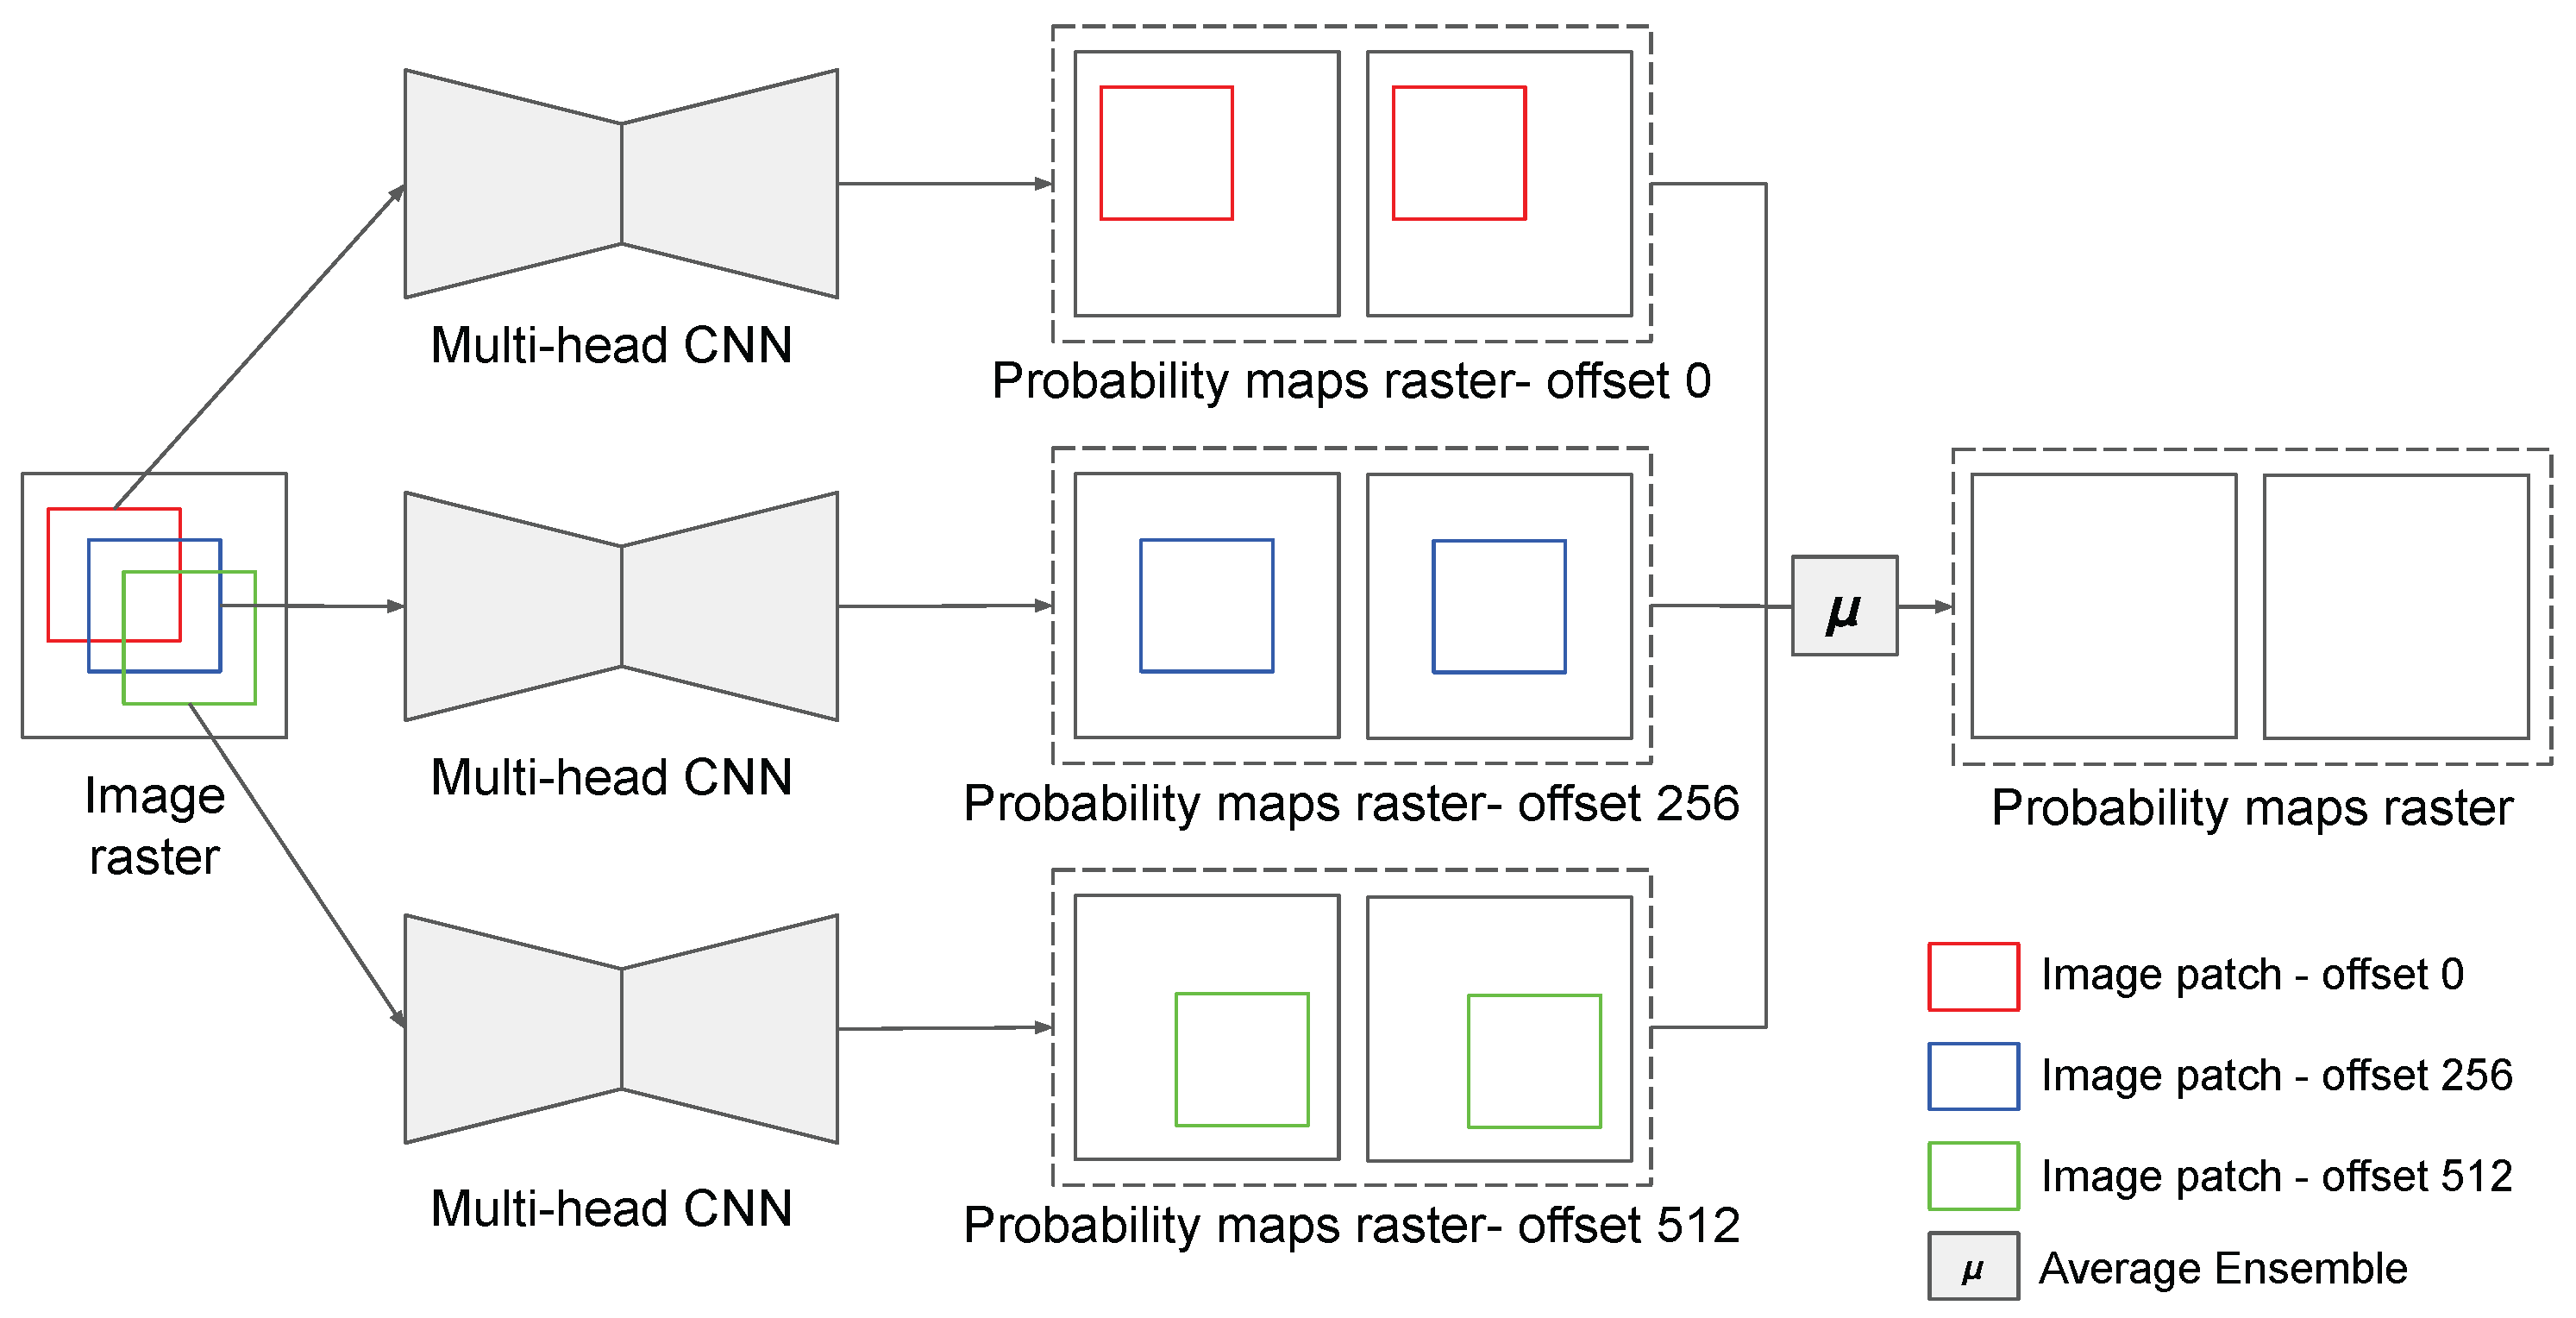
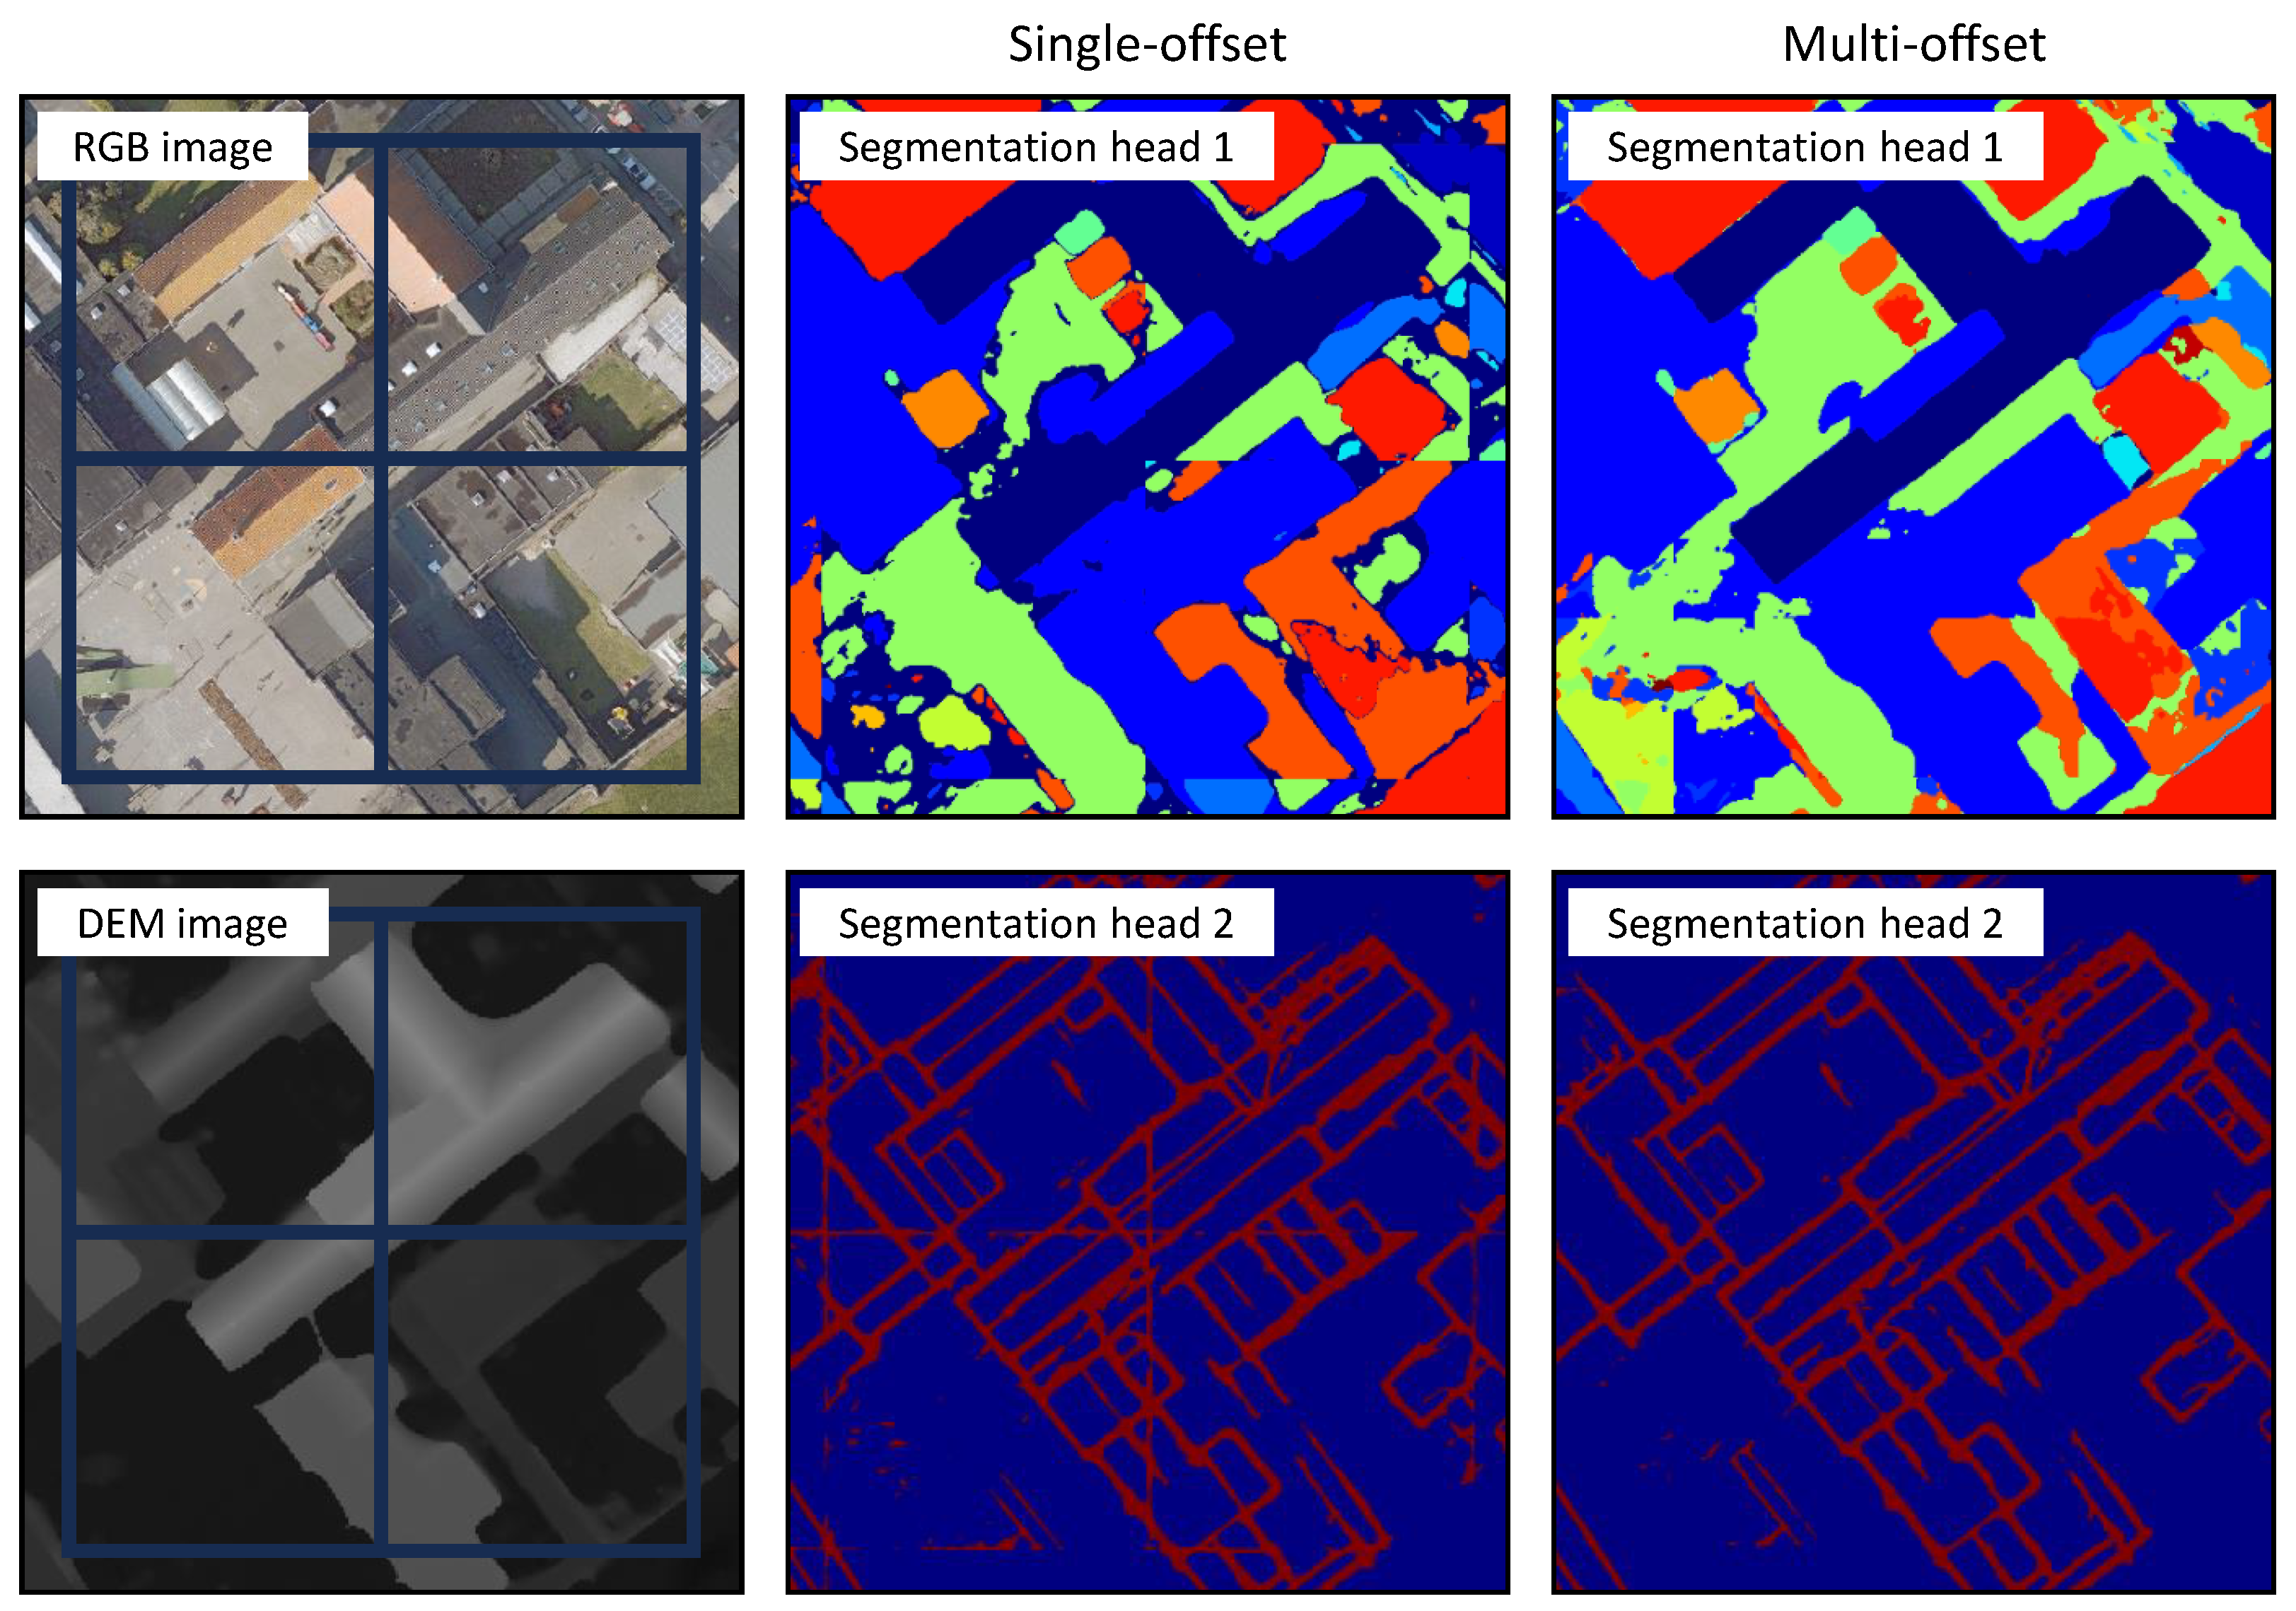
3.2.2. Multi-Offset Self-Ensemble Inference

The inference pipeline generates probability maps for individual image patches, which are then fused to produce a cohesive probability map for the entire image. However, direct fusion of these patches can introduce boundary artifacts along neighboring patches, particularly in high-resolution aerial imagery where seamless continuity is crucial. To address this, a multi-offset self-ensemble inference strategy is employed, as shown in Figure 6. This approach applies the network on each patch after shifting it by a set of predefined offsets (e.g., 0, 256, and 512 pixels) along both the height (h) and width (w) axes. For each offset, the network generates a probability map, and these outputs are subsequently averaged to produce a unified probability map for the entire image. The ensemble of multi-offset predictions not only smooths out boundary inconsistencies but also enhances the overall segmentation quality by preserving spatial continuity across patch borders. By leveraging multi-offset self-ensemble inference, the network achieves more accurate and visually consistent segmentation results—a crucial advantage for aerial image analysis where precision and alignment across patch boundaries are vital.

3.2.3. DEM-Based Filter

The DEM-based filter, F , is designed to address misclassifications of ground pixels that are erroneously identified as building classes. This filter operates as a heuristic approach, applying the following conditional formula:
F ( Y ^ , D ) = 0 , if c B and d h , w T y ^ h , w c , otherwise
In this formulation, Y ^ R C × H × W represents the predicted probability map generated by the network, while D R H × W denotes the corresponding digital elevation model (DEM). Here, 1 c C corresponds to each class channel, and 1 h H and 1 w W represent the spatial coordinates within an image patch.
The filter evaluates each pixel to determine if its probability map value should be retained or set to zero, based on the corresponding DEM value. Specifically, for any pixel with an elevation value ( d h , w ) equal to or below a specified threshold (T), the probabilities assigned to building classes (B) are set to zero, indicating that the pixel likely belongs to the ground rather than a building. This approach enhances segmentation accuracy by preventing low-elevation ground pixels from being misclassified as building structures.

3.2.4. Clustering Roof Parts and Vectorization

In semantic segmentation, each pixel is assigned a class independently, often without accounting for spatial relationships among neighboring pixels. This pixel-wise labeling can complicate downstream processing in geographic information systems (GIS). To mitigate this, adjacent pixels belonging to the same class are grouped and converted into polygons, which are then stored in GeoJSON format for ease of GIS integration. Specifically, ground material pixels are vectorized using the polygonization function from the rasterio library (version 1.3.9), while roof material pixels are combined with roof part segmentation outputs to delineate distinct roof sections, each with its associated materials. Algorithm 1 illustrates roof parts’ clustering and vectorization process.
Algorithm 1 Clustering and Vectorization of Roof Parts for GIS Integration
Require: Binary roof edge segmentation R (0 for non-edges, 1 for roof part edges) and material raster M
Ensure: Polygons representing individual roof parts with associated materials, in GeoJSON format
  1:
Input: Binary raster R for roof part edges and material raster M .
  2:
procedure Roof Part Vectorization( M , R )
  3:
      Step 1: Thinning Roof Edges          ▹ Thin edges to 1-pixel width
  4:
      Apply Zhang-Suen [66] thinning on R to reduce roof part edges to 1-pixel width.
  5:
      Step 2: Inverting Binary Image               ▹ Isolate roof parts
  6:
      Invert R to make roof pixels foreground and edges as background.
  7:
      Step 3: Extracting Contours
  8:
      Extract contours from the inverted image.
  9:
      Step 4: Separating Ground from Roof
10:
      for each contour C i in contours do
11:
            Extract material values from M within contour region C i .
12:
            Apply mode filter to determine dominant material in C i .
13:
            if mode corresponds to roof material then
14:
                Retain contour C i .
15:
            else
16:
                Discard contour C i .
17:
            end if
18:
        end for
19:
        Step 5: Vectorization and Storage
20:
        Convert retained contours into polygons.
21:
        Save polygons in GeoJSON format for GIS integration.
22:
end procedure

4. Results

4.1. Evaluation Metrics

This study utilized a comprehensive set of metrics to assess the performance of the end-to-end workflow. These metrics enable the quantification of various aspects of model performance, ranging from pixel-level accuracy to instance-level recognition. The primary evaluation metrics utilized in this research are the Intersection over Union (IOU) and the Panoptic Quality (PQ) score. These metrics provide valuable insights into the precision of segmentation as well as the model’s capability to identify and distinguish individual instances effectively.

4.1.1. I O U Metric for Segmentation

Mean Intersection over Union ( m I O U ). The m I O U metric quantifies segmentation accuracy by calculating the overlap between predicted and ground truth masks, averaged across all classes. It can be defined using true positive (TP), false positive (FP), and false negative (FN) counts:
mIOU = 1 C c = 1 C TP c TP c + FP c + FN c ,
where C is the number of classes, TP c is the number of true positives for class c, FP c is the number of false positives, and FN c is the number of false negatives. This metric provides an overall assessment of segmentation accuracy but treats all types of misclassifications equally.
Mean Similarity-Weighted Intersection over Union ( m s I O U ) [67]. The m s I O U metric enhances segmentation evaluation in scenarios where classes are visually or semantically similar. It incorporates a similarity score S ( c , c ) to weigh misclassified pixels based on their similarity to the correct class. The metric is defined as follows:
msIOU = 1 C c = 1 C T P c S T P c S + F P c S + F N c S ,
where T P c S , F P c S , and F N c S represent the true positives, false positives, and false negatives adjusted by the similarity score. The similarity score S ( c , c ) ranges from 0 to 1, reducing the penalty for misclassifications between visually or semantically similar classes. This refined approach is particularly beneficial for evaluating complex scenes with visually similar materials.

4.1.2. Panoptic Quality Metric for Roof Part Vectorization

The panoptic quality ( P Q ) metric [68] is used to evaluate panoptic segmentation, which integrates semantic segmentation (assigning a class label to each pixel) and instance segmentation (distinguishing individual object instances). It is defined as follows:
P Q = 1 C c = 1 C ( p , g ) T P c IoU ( p , g ) | T P c | segmentation quality ( SQ ) × | T P c | | T P c | + 1 2 | F P c | + 1 2 | F N c | recognition quality ( RQ ) ,
where T P c , F P c , and F N c represent true positives, false positives, and false negatives for class c. The first term, segmentation quality ( S Q ), quantifies the precision of a model’s segmentation by computing the mean intersection over union ( I O U ) between the predicted segments and ground truth. Higher I O U values indicate better segmentation performance. The second term, recognition quality ( R Q ), assesses the model’s instance-level detection performance by incorporating true positives, false positives, and false negatives, ensuring accurate instance detection and minimizing misidentifications or missed detections.
The P Q metric is especially valuable for evaluating vectorized roof parts with materials. Segmentation quality ( S Q ) ensures the accurate delineation of roof sections, maintaining precise boundaries and distinguishing between different materials, which is crucial for applications such as energy modeling, structural analysis, and urban planning. Recognition quality ( R Q ) ensures that each roof part is detected as a distinct instance, reducing misclassification and enhancing correct identification. By integrating S Q and R Q , the P Q metric provides a thorough evaluation that balances segmentation precision with instance-level accuracy, making it indispensable for complex tasks such as urban modeling and automated building inspections, where both detailed segmentation and accurate material classification are essential.

4.2. Performance Optimization on Validation Data

Model calibration was conducted on the validation dataset to enhance both segmentation and vectorization performance while maintaining computational efficiency. This process involved exploring various network architectures and optimization strategies to balance fine-grained material segmentation, precise boundary delineation, and overall structural consistency. The evaluation focused on segmentation accuracy, class separability, and geometric coherence in vectorization, ensuring the model effectively differentiated buildings from the ground while also capturing roof structures and materials. Systematic adjustments to key parameters improved the model’s robustness in both tasks, leading to better generalization for real-world applications. The final configuration was selected based on the optimal trade-off between segmentation precision, vectorization quality, and computational feasibility.

4.2.1. Single-Head Segmentation Experiments

Table 1 presents the outcomes of the network selection experiments, where the model was trained using data from Brugge and validated on data from Jabbeke. This cross-validation approach was adopted to reduce computational time while ensuring robust model evaluation. By limiting the dataset used for training, the process efficiently balanced performance assessment with computational resource management. The primary metric for evaluation was the m I O U , which measures the model’s ability to accurately segment building and ground materials. Additionally, the m s I O U was calculated to evaluate the model’s capacity to distinguish between buildings and the ground, offering a comprehensive view of both material-specific and structural segmentation performance.
The results indicate that PAN, when combined with EfficientNet-b4 and trained using categorical cross-entropy (CCE) loss, achieved the highest m I O U of 23.00%, demonstrating superior effectiveness in fine-grained material segmentation. In contrast, ResNet34 under the UNet architecture, also utilizing CCE, achieved the highest m s I O U of 78.09%, reflecting strong performance in differentiating buildings from their surroundings. However, EfficientNet-b4 with PAN offered the most balanced performance across both metrics, achieving an m s I O U of 77.70% while maintaining the highest m I O U score. This dual optimization highlights PANet with EfficientNet-b4 as the most robust choice for segmentation tasks, delivering consistent and precise results across both class-specific and similarity-weighted evaluation metrics.

4.2.2. Multi-Head Segmentation Experiments

This section evaluates the impact of various performance optimization techniques and post-processing strategies designed to improve segmentation accuracy. Table 2 presents a comprehensive overview of the results obtained from the multi-head segmentation model. In the absence of an established baseline for material segmentation, we adopt the vanilla P A N model with EfficientNet-b4 as the baseline for both segmentation and vectorization tasks. This model was selected based on its superior performance in single-head segmentation experiments, where it achieved the highest mean m I O U . The model was trained on datasets collected from three distinct regions: Brugge, Roeselare, and Oostende. These cities were specifically chosen for their diverse urban characteristics, which allowed the model to learn a wide range of building and ground materials. To assess the model’s generalization capability, validation was performed using data from Jabbeke, a location not included in the training set. This approach ensures that the model’s performance reflects its ability to handle previously unseen data, thereby enhancing its robustness.
The performance is assessed in terms of m s I O U (%) for building and ground segmentation without material differentiation (Head 1) and m I O U (%) for material-based segmentation (Head 1) and building edge segmentation (Head 2). To optimize performance, the model architecture and training process were progressively refined through targeted improvements. These included adjustments to the loss function, modifications to input parameters, and the introduction of postprocessing techniques, with each step building on the previous one. The subsequent sections detail these strategies and analyze their influence on the model’s segmentation accuracy.
Edge weighting. A key strategy to improve segmentation performance involved incorporating edge weights into the model’s loss function, specifically targeting the sparse roof edges that are often underrepresented in training. These edges, being less prevalent than larger regions like roof surfaces or open ground, can be challenging for the model to capture. By assigning greater importance to roof edges during training, edge weighting encouraged the model to focus on these difficult-to-detect areas, enhancing its ability to capture fine structural details. The results showed that increasing the edge weight from 1 to 25 improved both m s I O U and m I O U scores, indicating a better model focus on intricate edge features. With an edge weight of 25, the model achieved its highest m s I O U of 81.21% for building and ground segmentation. However, the m I O U score at an edge weight of 25 was slightly lower than that at an edge weight of 10, suggesting that further increasing the edge weight beyond 25 negatively impacts material-based segmentation.
Edge dilation. In conjunction with edge weighting, edge dilation was employed to further enhance the model’s ability to segment edges accurately. While edge weighting emphasizes the importance of edges in the loss function, edge dilation focuses on the spatial representation of these edges during training. Narrow edge pixels, often limited to a single pixel, pose a challenge for segmentation models due to their sparse and subtle nature. By widening these edges through dilation, the model is provided with more prominent edge features to learn from, improving its capacity to identify structural boundaries. Increasing the dilation size from 1 to 11 pixels resulted in consistent improvements in both m s I O U and m I O U scores, particularly in building edge segmentation (Head 2). The best performance was observed at an 11-pixel dilation, achieving an m s I O U of 84.60% for building and ground segmentation and an m I O U of 25.54% for material-based segmentation.
Input size. The effect of input size on segmentation performance was thoroughly examined to determine its role in enhancing model accuracy. Although the input resolution remained constant, increasing the input size provided the model with a larger spatial context, allowing it to capture more comprehensive structural information. Expanding the input size from 1024 × 1024 to 2048 × 2048 pixels led to significant improvements in segmentation performance, with the model achieving an m s I O U of 86.30% for building and ground segmentation and an m I O U of 26.38% for material-based segmentation. However, further increasing the input size beyond 2048 × 2048 pixels leads to a slight decrease in performance, suggesting that an optimal input size should be selected for the best results.
Multi-offset self-ensemble. To further improve segmentation consistency, a multi-offset self-ensemble approach was utilized. Single-offset configurations often lead to visible discontinuities along patch borders, which can degrade the overall segmentation quality, as shown in Figure 7. By integrating multiple spatial offsets, these boundary artifacts were significantly reduced, leading to smoother transitions and more coherent segmentation results. Self-ensembling with multiple offsets relies on the idea of overlap averaging, where the same spatial location is predicted multiple times under different patch alignments. When offsets are chosen such that they are evenly spaced and cover the stride range (e.g., 256 pixels), each region in the image is seen by the model from different spatial contexts, reducing bias introduced by fixed receptive field positioning and improving overall robustness. Among the tested configurations, the offset combination of (0, 256, 512, 1024) achieved the highest performance for an input size of 2048 × 2048; however, it required substantially greater computational resources and processing time. Consequently, a more computationally efficient configuration using offsets (0, 256, 512) was adopted, providing an optimal trade-off between segmentation accuracy and resource utilization. This approach achieved an m s I O U of 86.64% for building and ground segmentation and an m I O U of 26.88% for material-based segmentation.
DEM-based filter. The adjustment of the DEM threshold was another post-processing strategy explored to optimize segmentation accuracy. As shown in Figure 8, the DEM threshold plays a crucial role in refining segmentation results. Given that the resolution of the DEM is lower than that of the RGB imagery, a threshold of 1 m was chosen to provide a buffer against misclassifications at building edges. This threshold was determined empirically through experiments across a range of candidate values (e.g., 0.2 m, 0.5 m, 1 m, 2 m), and 1 m yielded the best balance between minimizing false positives from low-lying artifacts and preserving true building detections—particularly for small or low-rise structures. The model achieved its highest m s I O U of 87.97% and m I O U of 27.09% at this threshold. Higher DEM thresholds, such as 2 m, resulted in a slight drop in performance, indicating that a 1-m threshold is optimal for minimizing misclassification while preserving accurate building edge detection.
While the numerical improvements from the multi-offset self-ensemble and DEM-based filtering appear modest, their contributions to overall segmentation quality are substantial. These strategies significantly enhance the consistency and robustness of segmentation outputs, which is critical for subsequent vectorization processes, thereby improving the overall effectiveness of the segmentation pipeline.

4.2.3. Vectorization Experiments

Table 3 summarizes the performance metrics for roof vectorization under different configurations. The results indicate a significant improvement in P Q scores, increasing from 0.32% (without material information) and 0.16% (with material information) to 37.99% and 24.77%, respectively, in the optimized configurations. Figure 9 illustrates the qualitative differences in vectorization performance between the conventional single-head segmentation approach and the proposed multi-head segmentation framework. Vectorization derived from single-head segmentation using QGIS struggles to accurately delineate distinct roof structures. In contrast, the multi-head approach addresses these shortcomings by incorporating dedicated segmentation heads for edges and materials. This architectural separation facilitates the precise identification and extraction of individual roof components, yielding detailed and structurally accurate vector representations of complex roof geometries.

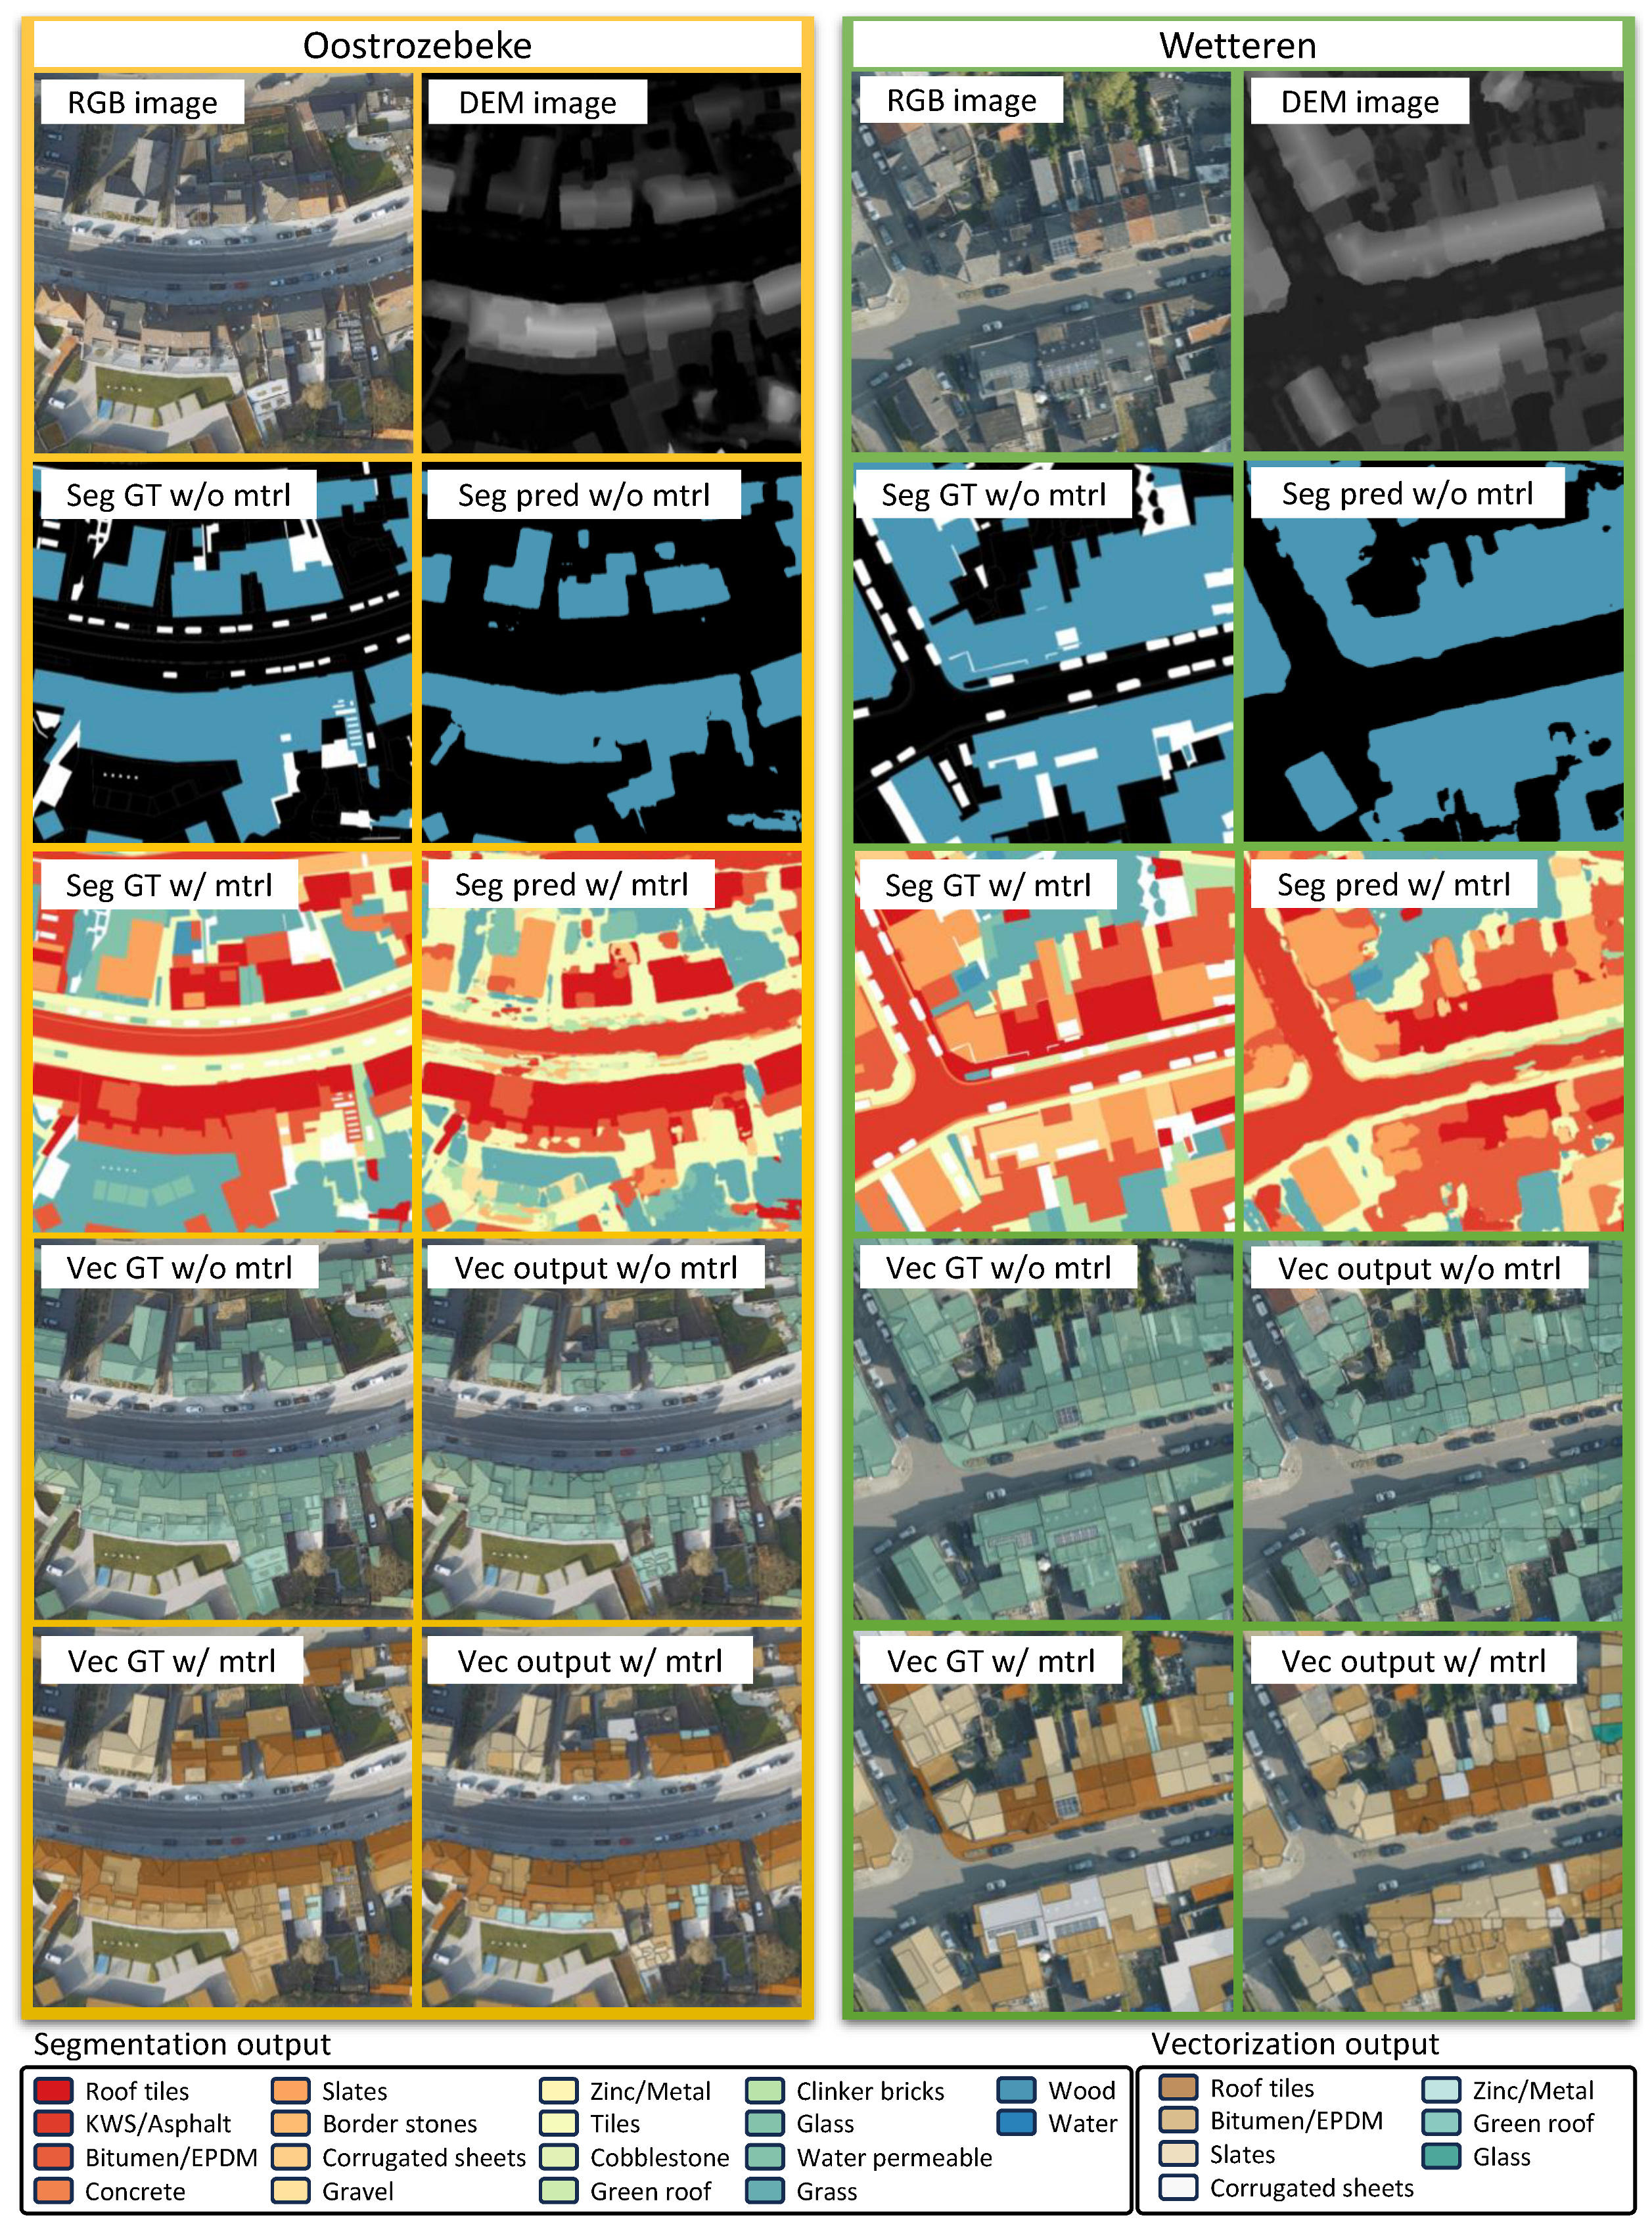
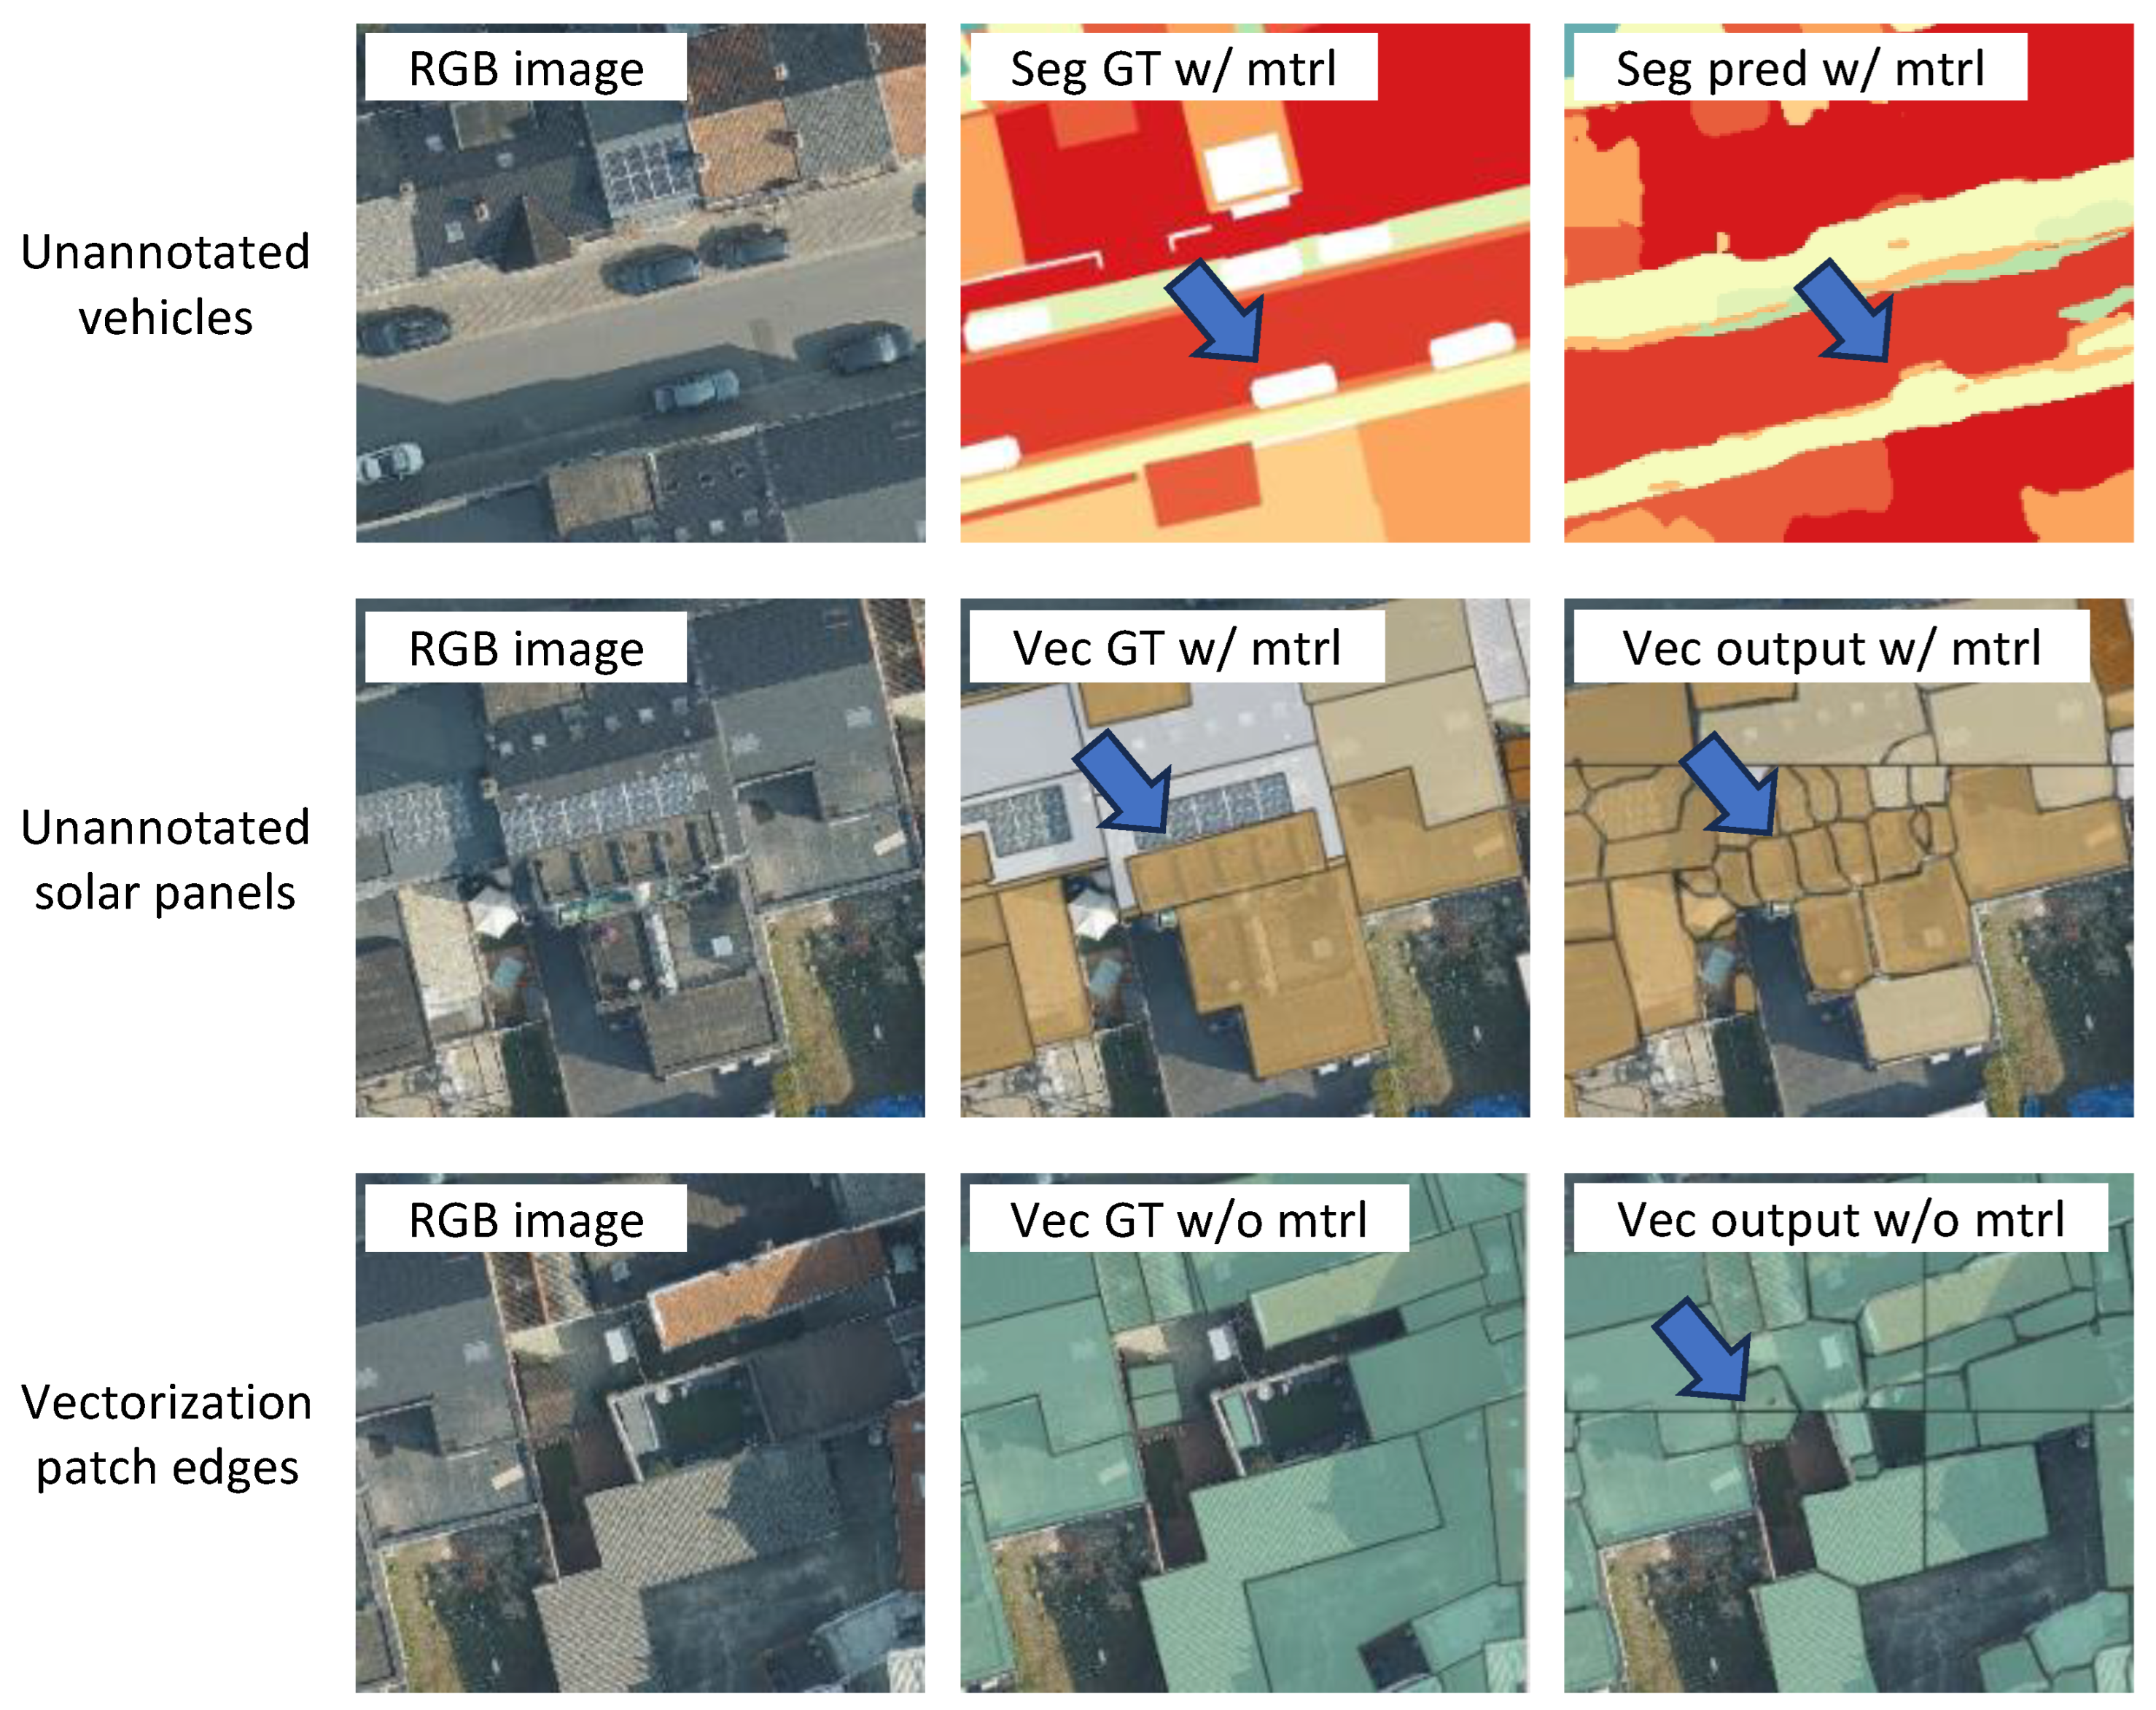
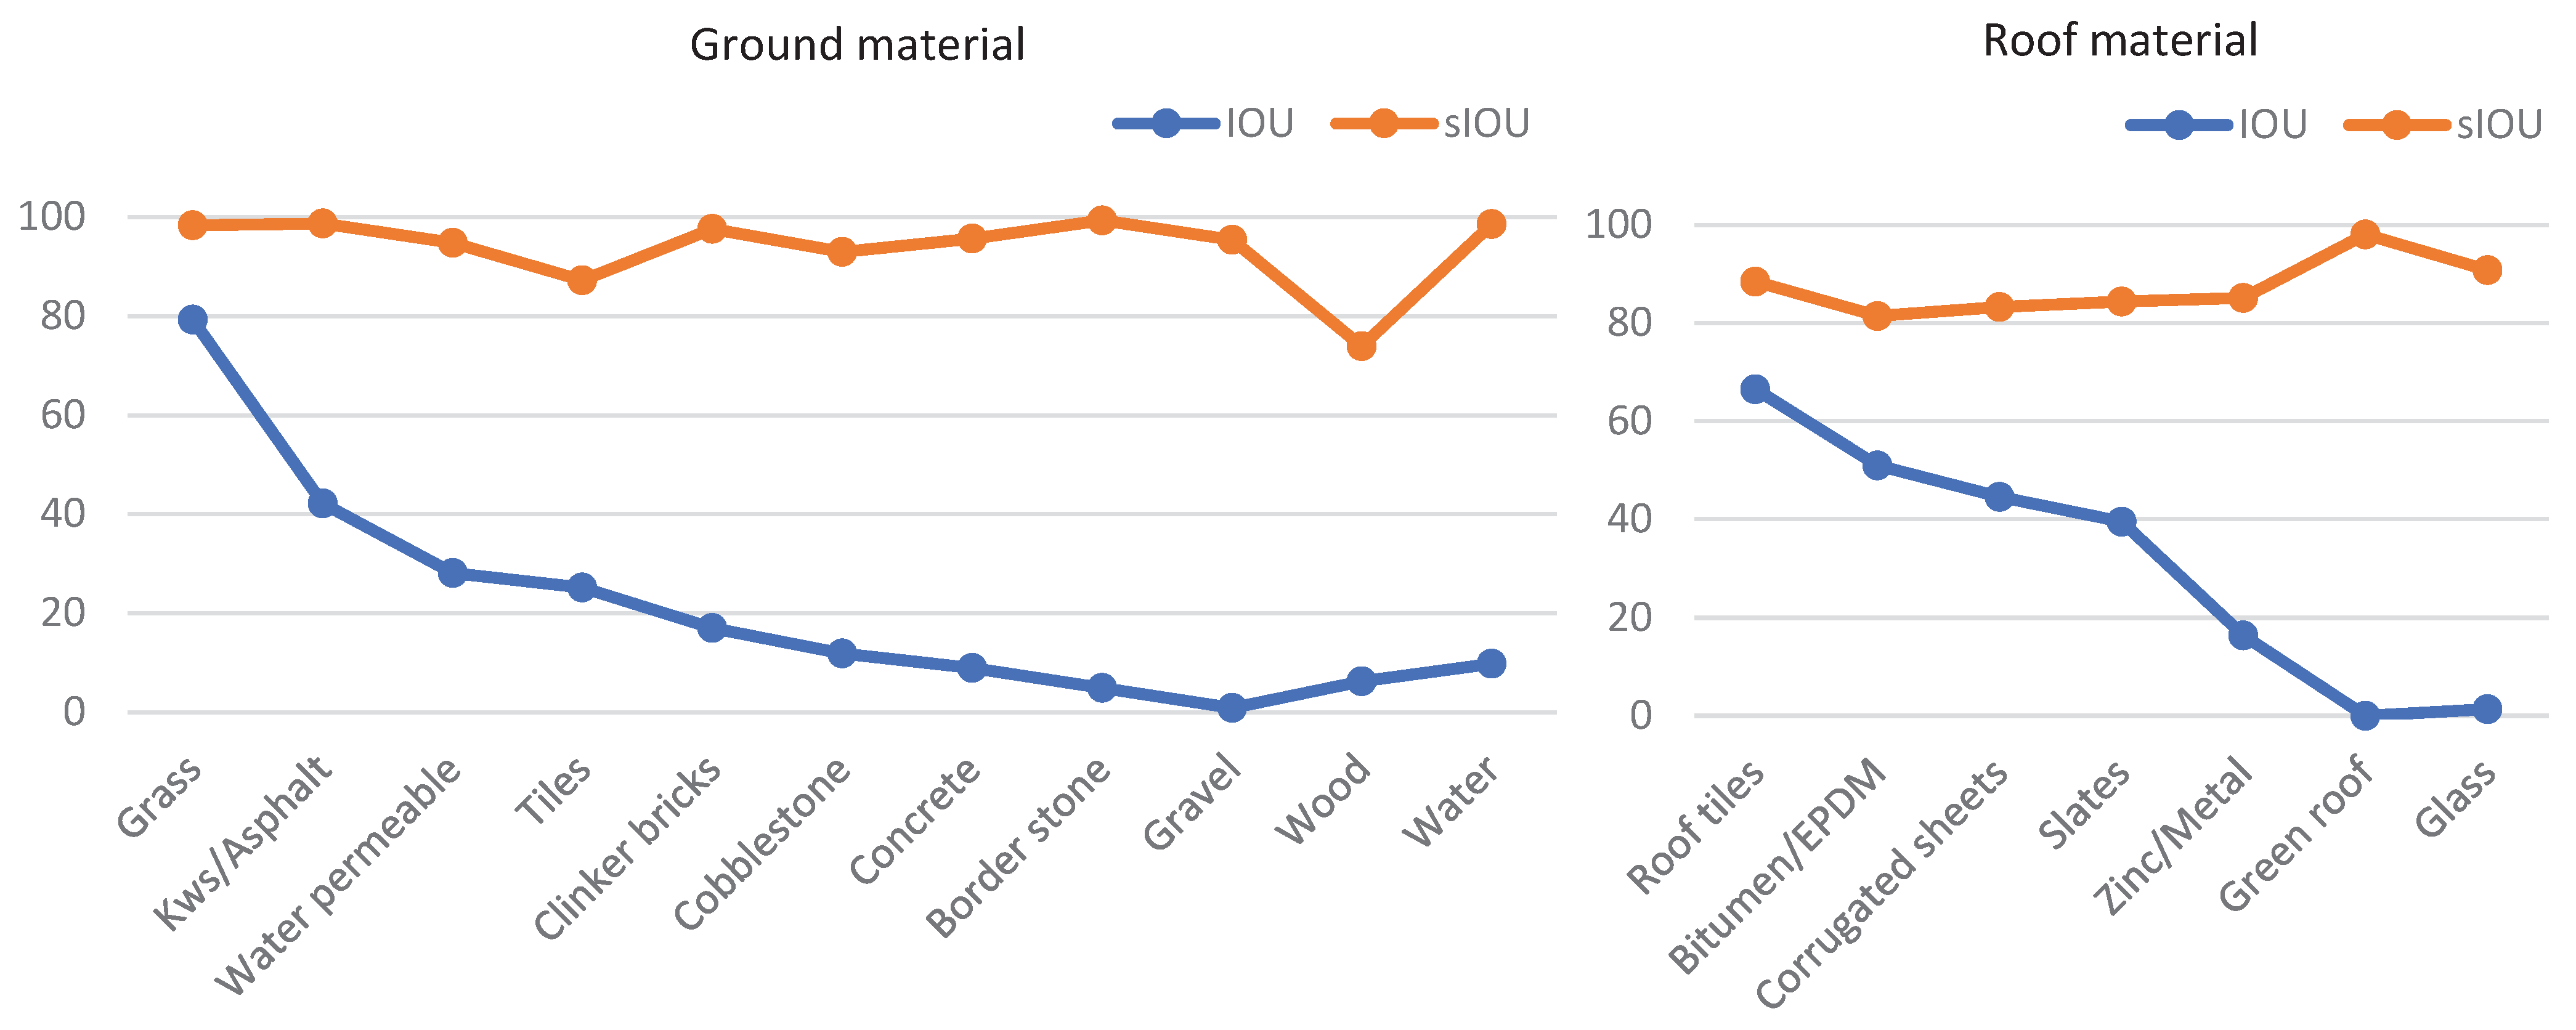
4.3. Performance Evaluation on Test Data

Table 4 provides a comprehensive evaluation of segmentation and vectorization performance on the test datasets from Oostrozebeke and Wetteren. The performance metrics are reported as m s I O U for segmentation without material differentiation, m I O U for segmentation that includes material differentiation, and P Q for building vectorization. Initially, the baseline model demonstrates relatively low accuracy in both segmentation and vectorization tasks. Specifically, it achieves m s I O U and m I O U scores of 69.68% and 22.06%, respectively. The P Q scores for building vectorization are negligible, with values of 0.32% without material differentiation and 0.17% with material differentiation. These results suggest that the baseline model struggles with both the detection of complex segmentation boundaries and the accurate representation of building structures in the vectorized output.
The integration of various performance optimization techniques—including edge weighting, edge dilation, input size augmentation, multi-offset self-ensembling, and DEM-based filtering—leads to significant improvements across all evaluation metrics. The final optimized model achieves m s I O U and m I O U scores of 89.19% and 28.60%, respectively, reflecting notable enhancements in segmentation accuracy. Similarly, building vectorization performance peaks with P Q scores of 38.93% without material differentiation and 28.70% with material differentiation. These findings demonstrate the effectiveness of the combined optimization strategies in improving both segmentation and vectorization performance. The qualitative enhancements are further illustrated in Figure 10, which highlights the multi-head model’s improved capability in accurately segmenting urban environments and delineating building structures.
In addition to these evaluations, it is important to assess the computational efficiency of the proposed method. To this end, inference and post-processing times were measured using standardized input data. All experiments were conducted on an NVIDIA Tesla V100 GPU equipped with 32 GB of RAM. The inference time for multi-head segmentation with a single spatial offset, in combination with the DEM filter, on a 2048 × 2048 image was approximately 0.84 s. When using three spatial offsets (0, 256, and 512 pixels), the inference time increased to approximately 4.79 s. This duration includes sequential execution of the segmentation head three times with the DEM filter, averaging the resulting probability maps, and generating the final output raster. Following segmentation, the polygonization of building footprints for a 2048 × 2048 image required an additional 1.62 s.

5. Discussion

Figure 11 illustrates several key factors that influence the accuracy of segmentation and vectorization in complex urban environments. A primary challenge arises from unannotated objects, such as vehicles on roads and solar panels on rooftops, which frequently lead to misclassifications during both segmentation and vectorization. These objects, not included in the training labels, are often incorrectly identified as part of the structures or materials they resemble. For example, vehicles, whether parked or in motion, create ambiguity by disrupting the continuity of road and ground surfaces. Similarly, solar panels, which share reflectance properties with roofing materials, are difficult to distinguish, especially when their placement varies across different roof types. As the model lacks training data for these elements, it tends to misclassify the roof areas containing solar panels, leading to boundary delineation errors that carry over into the vectorization stage. This highlights the need for improved annotation strategies and preprocessing techniques to better handle unannotated objects in urban datasets.
Another significant limitation stems from the patch-wise nature of the segmentation process. Although the multi-offset self-ensemble approach enhances boundary smoothness within individual patches, the vectorization algorithm still operates on discrete patches, which can result in discontinuities when structural elements span multiple segments. This issue is particularly seen in roof structures, where edges that extend across patch boundaries may become misaligned or fragmented during vectorization, leading to incoherent representations of the underlying architecture. The problem is further intensified in areas with intricate roof geometries, where maintaining consistent edge alignment across patches is critical for accurate delineation. Addressing this issue requires more adaptive vectorization strategies that enforce global continuity constraints across patches. Techniques such as graph-based optimization or topology-aware merging could enable more coherent representations of buildings while preserving fine structural details.
Class imbalance further complicates segmentation performance, particularly in the accurate identification of smaller or less frequent structures. As shown in Figure 12, dominant classes such as grass, asphalt, and roof tiles are segmented with higher accuracy, while smaller elements like gravel, wood, and glass exhibit significantly higher misclassification rates. This disparity arises from the unequal distribution of training samples, where models tend to favor well-represented classes, often neglecting the minority ones. To mitigate this issue, loss function weighting was implemented based on the training data distribution, but this approach did not yield substantial improvements. Consequently, smaller classes still suffer from lower recall, resulting in frequent omissions or incorrect segmentation.
The overall m I O U for material segmentation remains relatively low, primarily due to challenges related to generalization and class imbalance. Since the model was trained on data from specific cities and tested on entirely unseen cities, its ability to generalize across different urban environments was significantly limited, as highlighted in previous studies on out-of-distribution (OOD) generalization, where even the best-trained models, including transformer-based models, struggled with OOD data [69,70]. To address this limitation, one potential solution is to annotate small subsets of data from the newly tested cities and use these annotations either to fine-tune city-specific models or to combine them into a more generalized model, similar to foundation models that have been trained on diverse datasets. Additionally, incorporating techniques such as few-shot learning and uncertainty-aware learning could enhance the model’s ability to detect and correct errors in underrepresented classes, ultimately leading to more robust segmentation performance and improved overall accuracy.
The current DEM, derived from LiDAR data, has a GSD of 25 cm, which still presents challenges in accurately delineating individual roof segments. Although LiDAR offers high vertical accuracy, the spatial resolution at this GSD remains insufficient for capturing fine-grained roof structures, especially in complex urban environments where roof forms vary significantly over short distances. This limitation restricts the DEM’s usefulness in identifying subtle architectural features or distinguishing between different roofing materials, which often require higher spatial detail. Consequently, the DEM is not included as part of the network input. Instead, it is used during postprocessing to differentiate buildings from ground surfaces, where elevation contrasts are more pronounced and reliable. Improving the spatial resolution of the DEM, either through denser LiDAR point clouds or advanced interpolation techniques, could potentially enhance its utility for both structural and material-based segmentation in future work.
Shadows present in aerial imagery are another important factor influencing segmentation performance. As demonstrated in Figure 11, the presence of shadows does not significantly degrade model accuracy, which can be attributed to the use of HSV-based data augmentation during training. This augmentation strategy introduces variations in brightness, hue, and saturation, allowing the model to better handle changes in illumination and maintain robustness across diverse lighting conditions. However, the degree to which shadows impact performance also depends on the characteristics of the imaging sensors. In cases where the sensors produce images with low dynamic range or poor contrast in shadowed areas, the network may struggle to accurately distinguish object boundaries or material transitions. These observations highlight the importance of both robust augmentation strategies and high-quality image acquisition to ensure reliable performance across varying illumination conditions.
Limitations and Future Work. Future research should explore the use of transformer-based architectures, particularly those capable of capturing long-range dependencies and contextual relationships within large-scale spatial data. Training these models on more diverse and extensive datasets could significantly enhance their robustness, generalization capabilities, and resilience to domain shifts across different urban regions. In parallel, few-shot learning techniques offer a promising direction for addressing challenges related to data scarcity. These approaches could not only improve model adaptability to previously unseen urban environments but also enhance the detection and segmentation of less frequent or rare classes, which are often underrepresented in training data yet critical for comprehensive urban analysis.
Another important area for future exploration involves the development of uncertainty-aware models. By quantifying confidence in segmentation outputs, these models could facilitate more targeted post-processing strategies and allow for better-informed decisions in downstream applications. Such capabilities would be especially valuable in safety-critical or resource-constrained scenarios, where reliability and interpretability are essential. Finally, the rapid advancement of vision-language models opens up exciting possibilities for the geospatial domain. These models enable joint reasoning across visual and textual modalities, which could lead to more intuitive and interactive systems for interpreting remote sensing data, querying urban features, and even guiding human-in-the-loop analysis. Leveraging such multimodal frameworks may pave the way for more accessible, explainable, and intelligent tools for urban understanding.

Author Contributions

Conceptualization, methodology, software, validation, formal analysis, investigation, data curation, writing—original draft preparation, U.R.K.; writing—review and editing, U.R.K., T.G., and P.V.; visualization, U.R.K.; supervision, project administration, funding acquisition, T.G. and P.V. All authors have read and agreed to the published version of the manuscript.

Funding

This research was funded by Flanders Innovation and Entrepreneurship grant number HBC.2019.2289.

Data Availability Statement

All produced code and data used within this study are the property of Vansteelandt BV.

Acknowledgments

We thank Vansteelandt BV for preparing and providing the data used in this research.

Conflicts of Interest

The funders had no role in the design of the study; in the collection, analyses, or interpretation of the data; in the writing of the manuscript; or in the decision to publish the results.

Abbreviations

The following abbreviations are used in this manuscript:
CCECategorical Cross Entropy
CNNConvolutional Neural Network
DEMDigital Elevation Model
DTMDigital Terrain Model
EPDMEthylene Propylene Diene Monomer
GISGeographic Information System
FCNFully Convolutional Network
GSDGround Sampling Distance
IOUIntersection Over Union
LODLevel of Detail
LULCLand Use/Land Cover
PANPyramid Attention Network
PQPanoptic Quality
RQRecognition Quality
SQSegmentation Quality
UAVUnmanned Aerial Vehicle
VHRVery High Resolution

References

  1. Landsat Missions. Available online: https://www.usgs.gov/landsat-missions (accessed on 1 November 2024).
  2. Sentinel Online. Available online: https://sentinels.copernicus.eu/web/sentinel/home (accessed on 1 November 2024).
  3. Worldview. Available online: https://www.earthdata.nasa.gov/data/tools/worldview (accessed on 1 November 2024).
  4. Statistics Flanders. Available online: https://www.vlaanderen.be/statistiek-vlaanderen (accessed on 1 November 2024).
  5. Long, J.; Shelhamer, E.; Darrell, T. Fully convolutional networks for semantic segmentation. In Proceedings of the IEEE Conference on Computer Vision and Pattern Recognition, Boston, MA, USA, 7–12 June 2015; pp. 3431–3440. [Google Scholar]
  6. Ronneberger, O.; Fischer, P.; Brox, T. U-net: Convolutional networks for biomedical image segmentation. In Medical Image Computing and Computer-Assisted Intervention–MICCAI 2015, Proceedings of the 18th International Conference, Munich, Germany, 5–9 October 2015; Springer International Publishing: Cham, Switzerland, 2015; pp. 234–241. [Google Scholar]
  7. Badrinarayanan, V.; Kendall, A.; Cipolla, R. Segnet: A deep convolutional encoder-decoder architecture for image segmentation. IEEE Trans. Pattern Anal. Mach. Intell. 2017, 39, 2481–2495. [Google Scholar] [CrossRef] [PubMed]
  8. Chen, L.C.; Papandreou, G.; Kokkinos, I.; Murphy, K.; Yuille, A.L. Deeplab: Semantic image segmentation with deep convolutional nets, atrous convolution, and fully connected crfs. IEEE Trans. Pattern Anal. Mach. Intell. 2017, 40, 834–848. [Google Scholar] [CrossRef]
  9. Krähenbühl, P.; Koltun, V. Efficient inference in fully connected crfs with Gaussian edge potentials. Adv. Neural Inf. Process. Syst. 2011, 24, 109–117. [Google Scholar]
  10. Dosovitskiy, A. An image is worth 16x16 words: Transformers for image recognition at scale. arXiv 2020, arXiv:2010.11929. [Google Scholar]
  11. Liu, Z.; Lin, Y.; Cao, Y.; Hu, H.; Wei, Y.; Zhang, Z.; Lin, S.; Guo, B. Swin transformer: Hierarchical vision transformer using shifted windows. In Proceedings of the IEEE/CVF International Conference on Computer Vision, Montreal, BC, Canada, 11–17 October 2021; pp. 10012–10022. [Google Scholar]
  12. ISPRS. 2D Semantic Labeling-Vaihingen Data. Available online: https://www.isprs.org/resources/datasets/benchmarks/UrbanSemLab/2d-sem-label-vaihingen.aspx (accessed on 15 May 2025).
  13. ISPRS. 2D Semantic Labeling Contest-Potsdam. Available online: https://www.isprs.org/resources/datasets/benchmarks/UrbanSemLab/2d-sem-label-potsdam.aspx (accessed on 15 May 2025).
  14. Pandey, A.; Jain, K. An intelligent system for crop identification and classification from UAV images using conjugated dense convolutional neural network. Comput. Electron. Agric. 2022, 192, 106543. [Google Scholar] [CrossRef]
  15. Reedha, R.; Dericquebourg, E.; Canals, R.; Hafiane, A. Transformer neural network for weed and crop classification of high resolution UAV images. Remote Sens. 2022, 14, 592. [Google Scholar] [CrossRef]
  16. Hu, X.; Wang, X.; Zhong, Y.; Zhang, L. S3ANet: Spectral-spatial-scale attention network for end-to-end precise crop classification based on UAV-borne H2 imagery. ISPRS J. Photogramm. Remote Sens. 2022, 183, 147–163. [Google Scholar] [CrossRef]
  17. Stewart, E.L.; Wiesner-Hanks, T.; Kaczmar, N.; DeChant, C.; Wu, H.; Lipson, H.; Nelson, R.J.; Gore, M.A. Quantitative phenotyping of northern leaf blight in UAV images using deep learning. Remote Sens. 2019, 11, 2209. [Google Scholar] [CrossRef]
  18. Görlich, F.; Marks, E.; Mahlein, A.K.; König, K.; Lottes, P.; Stachniss, C. UAV-based classification of cercospora leaf spot using RGB images. Drones 2021, 5, 34. [Google Scholar] [CrossRef]
  19. Pan, Q.; Gao, M.; Wu, P.; Yan, J.; Li, S. A deep-learning-based approach for wheat yellow rust disease recognition from unmanned aerial vehicle images. Sensors 2021, 21, 6540. [Google Scholar] [CrossRef]
  20. Deng, J.; Zhou, H.; Lv, X.; Yang, L.; Shang, J.; Sun, Q.; Zheng, X.; Zhou, C.; Zhao, B.; Wu, J.; et al. Applying convolutional neural networks for detecting wheat stripe rust transmission centers under complex field conditions using RGB-based high spatial resolution images from UAVs. Comput. Electron. Agric. 2022, 200, 107211. [Google Scholar] [CrossRef]
  21. Sugiura, R.; Tsuda, S.; Tsuji, H.; Murakami, N. Virus-infected plant detection in potato seed production field by UAV imagery. In Proceedings of the 2018 ASABE Annual International Meeting, Detroit, MI, USA, 29 July–1 August 2018; American Society of Agricultural and Biological Engineers: St. Joseph, MI, USA, 2018; p. 1. [Google Scholar]
  22. Tetila, E.C.; Machado, B.B.; Menezes, G.K.; Oliveira, A.D.; Alvarez, M.; Amorim, W.P.; Belete, N.A.; Da Silva, G.G.; Pistori, H. Automatic recognition of soybean leaf diseases using UAV images and deep convolutional neural networks. IEEE Geosci. Remote Sens. Lett. 2019, 17, 903–907. [Google Scholar] [CrossRef]
  23. Bah, M.D.; Hafiane, A.; Canals, R. CRowNet: Deep network for crop row detection in UAV images. IEEE Access 2019, 8, 5189–5200. [Google Scholar] [CrossRef]
  24. Pang, Y.; Shi, Y.; Gao, S.; Jiang, F.; Veeranampalayam-Sivakumar, A.N.; Thompson, L.; Luck, J.; Liu, C. Improved crop row detection with deep neural network for early-season maize stand count in UAV imagery. Comput. Electron. Agric. 2020, 178, 105766. [Google Scholar] [CrossRef]
  25. Ribeiro, J.B.; da Silva, R.R.; Dias, J.D.; Escarpinati, M.C.; Backes, A.R. Automated detection of sugarcane crop lines from UAV images using deep learning. Inf. Process. Agric. 2024, 11, 385–396. [Google Scholar] [CrossRef]
  26. Osco, L.P.; de Arruda, M.D.; Gonçalves, D.N.; Dias, A.; Batistoti, J.; de Souza, M.; Gomes, F.D.; Ramos, A.P.; de Castro Jorge, L.A.; Liesenberg, V.; et al. A CNN approach to simultaneously count plants and detect plantation-rows from UAV imagery. ISPRS J. Photogramm. Remote Sens. 2021, 174, 1–7. [Google Scholar] [CrossRef]
  27. Ecke, S.; Dempewolf, J.; Frey, J.; Schwaller, A.; Endres, E.; Klemmt, H.J.; Tiede, D.; Seifert, T. UAV-based forest health monitoring: A systematic review. Remote Sens. 2022, 14, 3205. [Google Scholar] [CrossRef]
  28. Diez, Y.; Kentsch, S.; Fukuda, M.; Caceres, M.L.; Moritake, K.; Cabezas, M. Deep learning in forestry using UAV-acquired RGB data: A practical review. Remote Sens. 2021, 13, 2837. [Google Scholar] [CrossRef]
  29. Fraser, B.T.; Congalton, R.G. Monitoring fine-scale forest health using unmanned aerial systems (UAS) multispectral models. Remote Sens. 2021, 13, 4873. [Google Scholar] [CrossRef]
  30. Zheng, J.Y.; Hao, Y.Y.; Wang, Y.C.; Zhou, S.Q.; Wu, W.B.; Yuan, Q.; Gao, Y.; Guo, H.Q.; Cai, X.X.; Zhao, B. Coastal wetland vegetation classification using pixel-based, object-based and deep learning methods based on RGB-UAV. Land 2022, 11, 2039. [Google Scholar] [CrossRef]
  31. Kentsch, S.; Cabezas, M.; Tomhave, L.; Groß, J.; Burkhard, B.; Lopez Caceres, M.L.; Waki, K.; Diez, Y. Analysis of UAV-acquired wetland orthomosaics using GIS, computer vision, computational topology and deep learning. Sensors 2021, 21, 471. [Google Scholar] [CrossRef]
  32. Bak, S.H.; Hwang, D.H.; Kim, H.M.; Yoon, H.J. Detection and monitoring of beach litter using UAV image and deep neural network. Int. Arch. Photogramm. Remote Sens. Spatial Inf. Sci. 2019, 42, 55–58. [Google Scholar] [CrossRef]
  33. Wu, J.; Li, R.; Li, J.; Zou, M.; Huang, Z. Cooperative unmanned surface vehicles and unmanned aerial vehicles platform as a tool for coastal monitoring activities. Ocean Coast. Manag. 2023, 232, 106421. [Google Scholar] [CrossRef]
  34. Zhu, J.; Sun, K.; Jia, S.; Li, Q.; Hou, X.; Lin, W.; Liu, B.; Qiu, G. Urban traffic density estimation based on ultrahigh-resolution UAV video and deep neural network. IEEE J. Sel. Top. Appl. Earth Obs. Remote Sens. 2018, 11, 4968–4981. [Google Scholar] [CrossRef]
  35. Gupta, H.; Verma, O.P. Monitoring and surveillance of urban road traffic using low altitude drone images: A deep learning approach. Multimed. Tools Appl. 2022, 81, 19683–19703. [Google Scholar] [CrossRef]
  36. Song, A. Deep Learning-Based Semantic Segmentation of Urban Areas Using Heterogeneous Unmanned Aerial Vehicle Datasets. Aerospace 2023, 10, 880. [Google Scholar] [CrossRef]
  37. Shukla, A.; Jain, K. Automatic extraction of urban land information from unmanned aerial vehicle (UAV) data. Earth Sci. Inform. 2020, 13, 1225–1236. [Google Scholar] [CrossRef]
  38. Moreno-Armendáriz, M.A.; Calvo, H.; Duchanoy, C.A.; López-Juárez, A.P.; Vargas-Monroy, I.A.; Suarez-Castañon, M.S. Deep green diagnostics: Urban green space analysis using deep learning and drone images. Sensors 2019, 19, 5287. [Google Scholar] [CrossRef] [PubMed]
  39. Hartling, S.; Sagan, V.; Maimaitijiang, M. Urban tree species classification using UAV-based multi-sensor data fusion and machine learning. GISci. Remote Sens. 2021, 58, 1250–1275. [Google Scholar] [CrossRef]
  40. Cho, Y.I.; Yoon, D.; Lee, M.J. Comparative Analysis of Urban Heat Island Cooling Strategies According to Spatial and Temporal Conditions Using Unmanned Aerial Vehicles (UAV) Observation. Appl. Sci. 2023, 13, 10052. [Google Scholar] [CrossRef]
  41. Fuentes, J.E.; Moya, F.D.; Montoya, O.D. Method for estimating solar energy potential based on photogrammetry from unmanned aerial vehicles. Electronics 2020, 9, 2144. [Google Scholar] [CrossRef]
  42. Shao, H.; Song, P.; Mu, B.; Tian, G.; Chen, Q.; He, R.; Kim, G. Assessing city-scale green roof development potential using Unmanned Aerial Vehicle (UAV) imagery. Urban For. Urban Green. 2021, 57, 126954. [Google Scholar] [CrossRef]
  43. Solla, M.; Gonçalves, L.M.; Gonçalves, G.; Francisco, C.; Puente, I.; Providência, P.; Gaspar, F.; Rodrigues, H. A building information modeling approach to integrate geomatic data for the documentation and preservation of cultural heritage. Remote Sens. 2020, 12, 4028. [Google Scholar] [CrossRef]
  44. Murtiyoso, A.; Veriandi, M.; Suwardhi, D.; Soeksmantono, B.; Harto, A.B. Automatic workflow for roof extraction and generation of 3D citygml models from low-cost UAV image-derived point clouds. ISPRS Int. J. Geo-Inf. 2020, 9, 743. [Google Scholar] [CrossRef]
  45. Partovi, T.; Fraundorfer, F.; Azimi, S.; Marmanis, D.; Reinartz, P. Roof type selection based on patch-based classification using deep learning for high resolution satellite imagery. Int. Arch. Photogramm. Remote Sens. Spatial Inf. Sci. 2017, 42, 653–657. [Google Scholar] [CrossRef]
  46. Castagno, J.; Atkins, E. Roof shape classification from LiDAR and satellite image data fusion using supervised learning. Sensors 2018, 18, 3960. [Google Scholar] [CrossRef]
  47. Buyukdemircioglu, M.; Can, R.; Kocaman, S. Deep learning based roof type classification using very high resolution aerial imagery. Int. Arch. Photogramm. Remote Sens. Spatial Inf. Sci. 2021, 43, 55–60. [Google Scholar] [CrossRef]
  48. Ölçer, N.; Ölçer, D.; Sümer, E. Roof type classification with innovative machine learning approaches. PeerJ Comput. Sci. 2023, 9, e1217. [Google Scholar] [CrossRef]
  49. Cimpoi, M.; Maji, S.; Kokkinos, I.; Mohamed, S.; Vedaldi, A. Describing textures in the wild. In Proceedings of the IEEE Conference on Computer Vision and Pattern Recognition, Columbus, OH, USA, 23–28 June 2014; pp. 3606–3613. [Google Scholar]
  50. Bell, S.; Upchurch, P.; Snavely, N.; Bala, K. Material recognition in the wild with the materials in context database. In Proceedings of the IEEE Conference on Computer Vision and Pattern Recognition, Boston, MA, USA, 7–12 June 2015; pp. 3479–3487. [Google Scholar]
  51. Xue, J.; Zhang, H.; Dana, K. Deep texture manifold for ground terrain recognition. In Proceedings of the IEEE Conference on Computer Vision and Pattern Recognition, Salt Lake City, UT, USA, 18–23 June 2018; pp. 558–567. [Google Scholar]
  52. Cai, S.; Wakaki, R.; Nobuhara, S.; Nishino, K. RGB road scene material segmentation. In Proceedings of the Asian Conference on Computer Vision, Macao, China, 4–8 December 2022; pp. 3051–3067. [Google Scholar]
  53. Jayasinghe, M.T.; Attalage, R.A.; Jayawardena, A.I. Roof orientation, roofing materials and roof surface colour: Their influence on indoor thermal comfort in warm humid climates. Energy Sustain. Dev. 2003, 7, 16–27. [Google Scholar] [CrossRef]
  54. Prado, R.T.; Ferreira, F.L. Measurement of albedo and analysis of its influence the surface temperature of building roof materials. Energy Build. 2005, 37, 295–300. [Google Scholar] [CrossRef]
  55. Mendez, C.B.; Klenzendorf, J.B.; Afshar, B.R.; Simmons, M.T.; Barrett, M.E.; Kinney, K.A.; Kirisits, M.J. The effect of roofing material on the quality of harvested rainwater. Water Res. 2011, 45, 2049–2059. [Google Scholar] [CrossRef]
  56. Lemp, D.; Weidner, U. Segment-based characterization of roof surfaces using hyperspectral and laser scanning data. In Proceedings of the 2005 IEEE International Geoscience and Remote Sensing Symposium, Seoul, Republic of Korea, 25–29 July 2005; IGARSS’05. IEEE: Piscataway, NJ, USA, 2005; Volume 7, pp. 4942–4945. [Google Scholar]
  57. Ilehag, R.; Bulatov, D.; Helmholz, P.; Belton, D. Classification and representation of commonly used roofing material using multisensorial aerial data. Int. Arch. Photogramm. Remote Sens. Spatial Inf. Sci. 2018, 42, 217–224. [Google Scholar] [CrossRef]
  58. Trevisiol, F.; Lambertini, A.; Franci, F.; Mandanici, E. An object-oriented approach to the classification of roofing materials using very high-resolution satellite stereo-pairs. Remote Sens. 2022, 14, 849. [Google Scholar] [CrossRef]
  59. Kim, J.; Bae, H.; Kang, H.; Lee, S.G. CNN algorithm for roof detection and material classification in satellite images. Electronics 2021, 10, 1592. [Google Scholar] [CrossRef]
  60. Boonpook, W.; Tan, Y.; Xu, B. Deep learning-based multi-feature semantic segmentation in building extraction from images of UAV photogrammetry. Int. J. Remote Sens. 2021, 42, 1–9. [Google Scholar] [CrossRef]
  61. Farajzadeh, Z.; Saadatseresht, M.; Alidoost, F. Automatic building extraction from UAV-based images and DSMs using deep learning. ISPRS Ann. Photogramm. Remote Sens. Spatial Inf. Sci. 2023, 10, 171–177. [Google Scholar] [CrossRef]
  62. Pilinja Subrahmanya, P.; Haridas Aithal, B.; Mitra, S. Automatic extraction of buildings from UAV-based imagery using Artificial Neural Networks. J. Indian Soc. Remote Sens. 2021, 49, 681–687. [Google Scholar] [CrossRef]
  63. Djenaliev, A.; Chymyrov, A.; Kada, M.; Hellwich, O.; Akmatov, T.; Golev, O.; Chymyrova, S. Unmanned Aerial Systems for Building Footprint Extraction in Urban Area. Int. J. Geoinform. 2024, 20, 64–81. [Google Scholar]
  64. Zhao, W.; Persello, C.; Lv, X.; Stein, A.; Vergauwen, M. Vectorizing planar roof structure from very high resolution remote sensing images using transformers. Int. J. Digit. Earth 2024, 17, 1–5. [Google Scholar] [CrossRef]
  65. Li, H.; Xiong, P.; An, J.; Wang, L. Pyramid attention network for semantic segmentation. arXiv 2018, arXiv:1805.10180. [Google Scholar]
  66. Zhang, T.Y.; Suen, C.Y. A fast parallel algorithm for thinning digital patterns. Commun. ACM 1984, 27, 236–239. [Google Scholar] [CrossRef]
  67. Kumar, U.R.; Vandewalle, P. Similarity-Weighted IoU (sIOU): A Comprehensive Metric for Evaluating Model Performance Through Similarity-Weighted Class Overlaps. In Proceedings of the 2024 IEEE International Conference on Image Processing (ICIP), Abu Dhabi, United Arab Emirates, 27–30 October 2024; IEEE: Piscataway, NJ, USA, 2024; pp. 936–942. [Google Scholar]
  68. Kirillov, A.; He, K.; Girshick, R.; Rother, C.; Dollár, P. Panoptic segmentation. In Proceedings of the IEEE/CVF Conference on Computer Vision and Pattern Recognition, Long Beach, CA, USA, 15–20 June 2019; pp. 9404–9413. [Google Scholar]
  69. Zhao, B.; Yu, S.; Ma, W.; Yu, M.; Mei, S.; Wang, A.; He, J.; Yuille, A.; Kortylewski, A. Ood-cv: A benchmark for robustness to out-of-distribution shifts of individual nuisances in natural images. In European Conference on Computer Vision; Springer Nature: Cham, Switzerland, 2022; pp. 163–180. [Google Scholar]
  70. Kumar, U.R.; Fayjie, A.R.; Hannaert, J.; Vandewalle, P. BelHouse3D: A Benchmark Dataset for Assessing Occlusion Robustness in 3D Point Cloud Semantic Segmentation. arXiv 2024, arXiv:2411.13251. [Google Scholar]
Figure 1. Map of the study area in Flanders, Belgium, highlighting the six selected cities for analysis. Each city is marked on the map, accompanied by corresponding orthophotos that illustrate the unique urban landscapes and characteristics of the areas under study.
Remotesensing 17 01771 g001
Figure 2. Study area in Brugge, Belgium. The zoomed-in figures of the highlighted region present the RGB image, the Digital Elevation Model (DEM) depicting topographic features, and annotated layers for building and ground materials, enabling classification and delineation of urban surface types.
Remotesensing 17 01771 g002
Figure 3. Distribution of ground and surface material classes by percentage, with bubble sizes representing the relative surface area (m2) of each class.
Remotesensing 17 01771 g003
Figure 4. Overview of the end-to-end workflow for the segmentation of aerial images and subsequent post-processing steps.
Remotesensing 17 01771 g004
Figure 5. Multi-head CNN architecture with two segmentation heads for predicting material classes and roof part edges.
Remotesensing 17 01771 g005
Figure 6. Illustration of the multi-offset self-ensemble inference approach. The network processes image patches at multiple offsets (0, 256, and 512 pixels) along the height and width axes. The resulting probability maps are averaged to produce a cohesive segmentation map, enhancing consistency across patch boundaries.
Remotesensing 17 01771 g006
Figure 7. Illustration of the impact of multi-offset ensemble on segmentation consistency. The blue squares represent the patch borders for a single-offset approach, where visible discontinuities occur along these borders in the segmentation results. By incorporating multiple offsets, the ensemble approach mitigates these discontinuities, leading to a more seamless and coherent segmentation output.
Remotesensing 17 01771 g007
Figure 8. Effect of DEM thresholding on segmentation. The figure presents three patch examples where erroneously classified building pixels are corrected to ground pixels by applying a height-based threshold.
Remotesensing 17 01771 g008
Figure 9. Comparison of roof vectorization using single-head segmentation in QGIS and the proposed multi-head approach. The single-head method struggles to delineate distinct roof parts, while the multi-head framework, with dedicated edge and material segmentation, enables more precise and accurate vector representations.
Remotesensing 17 01771 g009
Figure 10. Qualitative evaluation of segmentation and vectorization results on test data. The figure showcases the final outputs of segmentation and vectorization with and without material information, illustrating the effectiveness of the proposed model in delineating building structures and materials in complex urban environments.
Remotesensing 17 01771 g010
Figure 11. Factors influencing segmentation and vectorization accuracy, including unannotated objects (e.g., vehicles and solar panels) that lead to misclassification, as well as patch-wise discontinuities that affect the smoothness and continuity of vectorized building structures.
Remotesensing 17 01771 g011
Figure 12. Comparison of I O U and s I O U scores for ground and building materials, highlighting the model’s challenge in accurately identifying and segmenting less frequent materials (as indicated by I O U ) while successfully differentiating between buildings and ground (as indicated by s I O U ).
Remotesensing 17 01771 g012
Table 1. Evaluation of network architectures, backbones, and loss functions for single-head segmentation tasks. Performance is reported as m s I O U (%) for building and ground segmentation without material differentiation and m I O U (%) for material-based segmentation. The highest-performing metrics in each experiment subset are highlighted in green.
Loss FunctionArchitectureBackbonew/o Material
msIOU(%)
w/ Material
mIOU(%)
CCEUNetResNet1875.6619.85
ResNet3478.0919.28
ResNet5070.7315.98
EfficientNet-b477.2922.45
EfficientNet-b576.4221.60
EfficientNet-b676.9220.31
CCEUNetEfficientNet-b477.2922.45
FPN71.4918.54
PAN77.7023.00
PSPNet68.2815.86
CCEPANEfficientNet-b477.7023.00
Soft dice75.4918.42
Combo77.4422.89
Table 2. Evaluation of the multi-head model performance on validation data. Performance is reported as m s I O U (%) for building and ground segmentation without material differentiation (Head 1) and m I O U (%) for material-based segmentation (Head 1) and building edge segmentation (Head 2). The highest-performing metrics in each experiment subset are highlighted in green.
Head 1 (Bldg. & Ground)   Head 2 (Bldg.)
w/o Material
msIOU (%)
w/ Material
mIOU (%)
Bldg. Edge
mIOU (%)
Baseline 76.5522.6550.19
+ Edge Weight176.5522.6550.19
1078.9125.8755.14
2581.2125.5457.47
+ Edge Dilation1 px.81.2125.5457.47
5 px.80.9024.6058.31
11 px.84.6025.5463.83
15 px.82.2222.8966.63
+ Input Size1024 × 102484.6025.5463.83
2048 × 204886.3026.3863.69
4096 × 409686.1226.3563.57
+ Multi-offset(0)86.3026.3863.69
(0, 256)86.8326.8563.61
(0, 256, 512)86.6426.8863.70
(0, 256, 512, 1024)86.9826.9863.85
+ DEM Threshold0.2 m87.2127.0163.70
0.5 m87.6727.0863.70
1 m87.9727.0963.70
2 m87.9226.8063.70
Table 3. Evaluation of roof vectorization performance on validation data. Performance is reported as S Q (%), R Q (%), and P Q (%) for vectorization without and with material information. The highest-performing P Q metrics are highlighted in green.
w/o Materialw/ Material
SQ (%)RQ (%)PQ (%)SQ (%)  RQ (%)PQ (%)
Baseline20.191.590.329.970.710.16
+ Edge Weight & Dilation66.9054.8836.7268.1935.2723.84
+ Input Size69.9553.5737.4771.0135.0624.71
+ Multi-offset69.9253.1537.1671.3134.6324.51
+ DEM Threshold69.6754.5237.9971.2335.0324.77
Table 4. Quantitative evaluation of segmentation and vectorization performance on test data. Metrics are reported as m s I O U (%) for segmentation without material differentiation, m I O U (%) for material-based segmentation, and P Q (%) for building vectorization. The highest-performing metrics are highlighted in green.
Segmentation (Bldg. & Gnd.)Vectorization (Bldg.)
w/o Mtrl
msIOU (%)
w/ Mtrl
mIOU (%)
w/o Mtrl
PQ (%)
w/ Mtrl
PQ (%)
Baseline69.6822.060.320.17
+ Edge Weight & Dilation82.0325.7236.9326.27
+ Input Size82.5828.0437.0528.50
+ Multi-offset83.3428.5338.3728.50
+ DEM Threshold89.1928.6038.9328.70
Disclaimer/Publisher’s Note: The statements, opinions and data contained in all publications are solely those of the individual author(s) and contributor(s) and not of MDPI and/or the editor(s). MDPI and/or the editor(s) disclaim responsibility for any injury to people or property resulting from any ideas, methods, instructions or products referred to in the content.

