

Information-Guided Diffusion Model for Downscaling Land Surface Temperature from SDGSAT-1 Remote Sensing Images


Abstract
1. Introduction
2. Data and Method
2.1. Study Area and LST Data
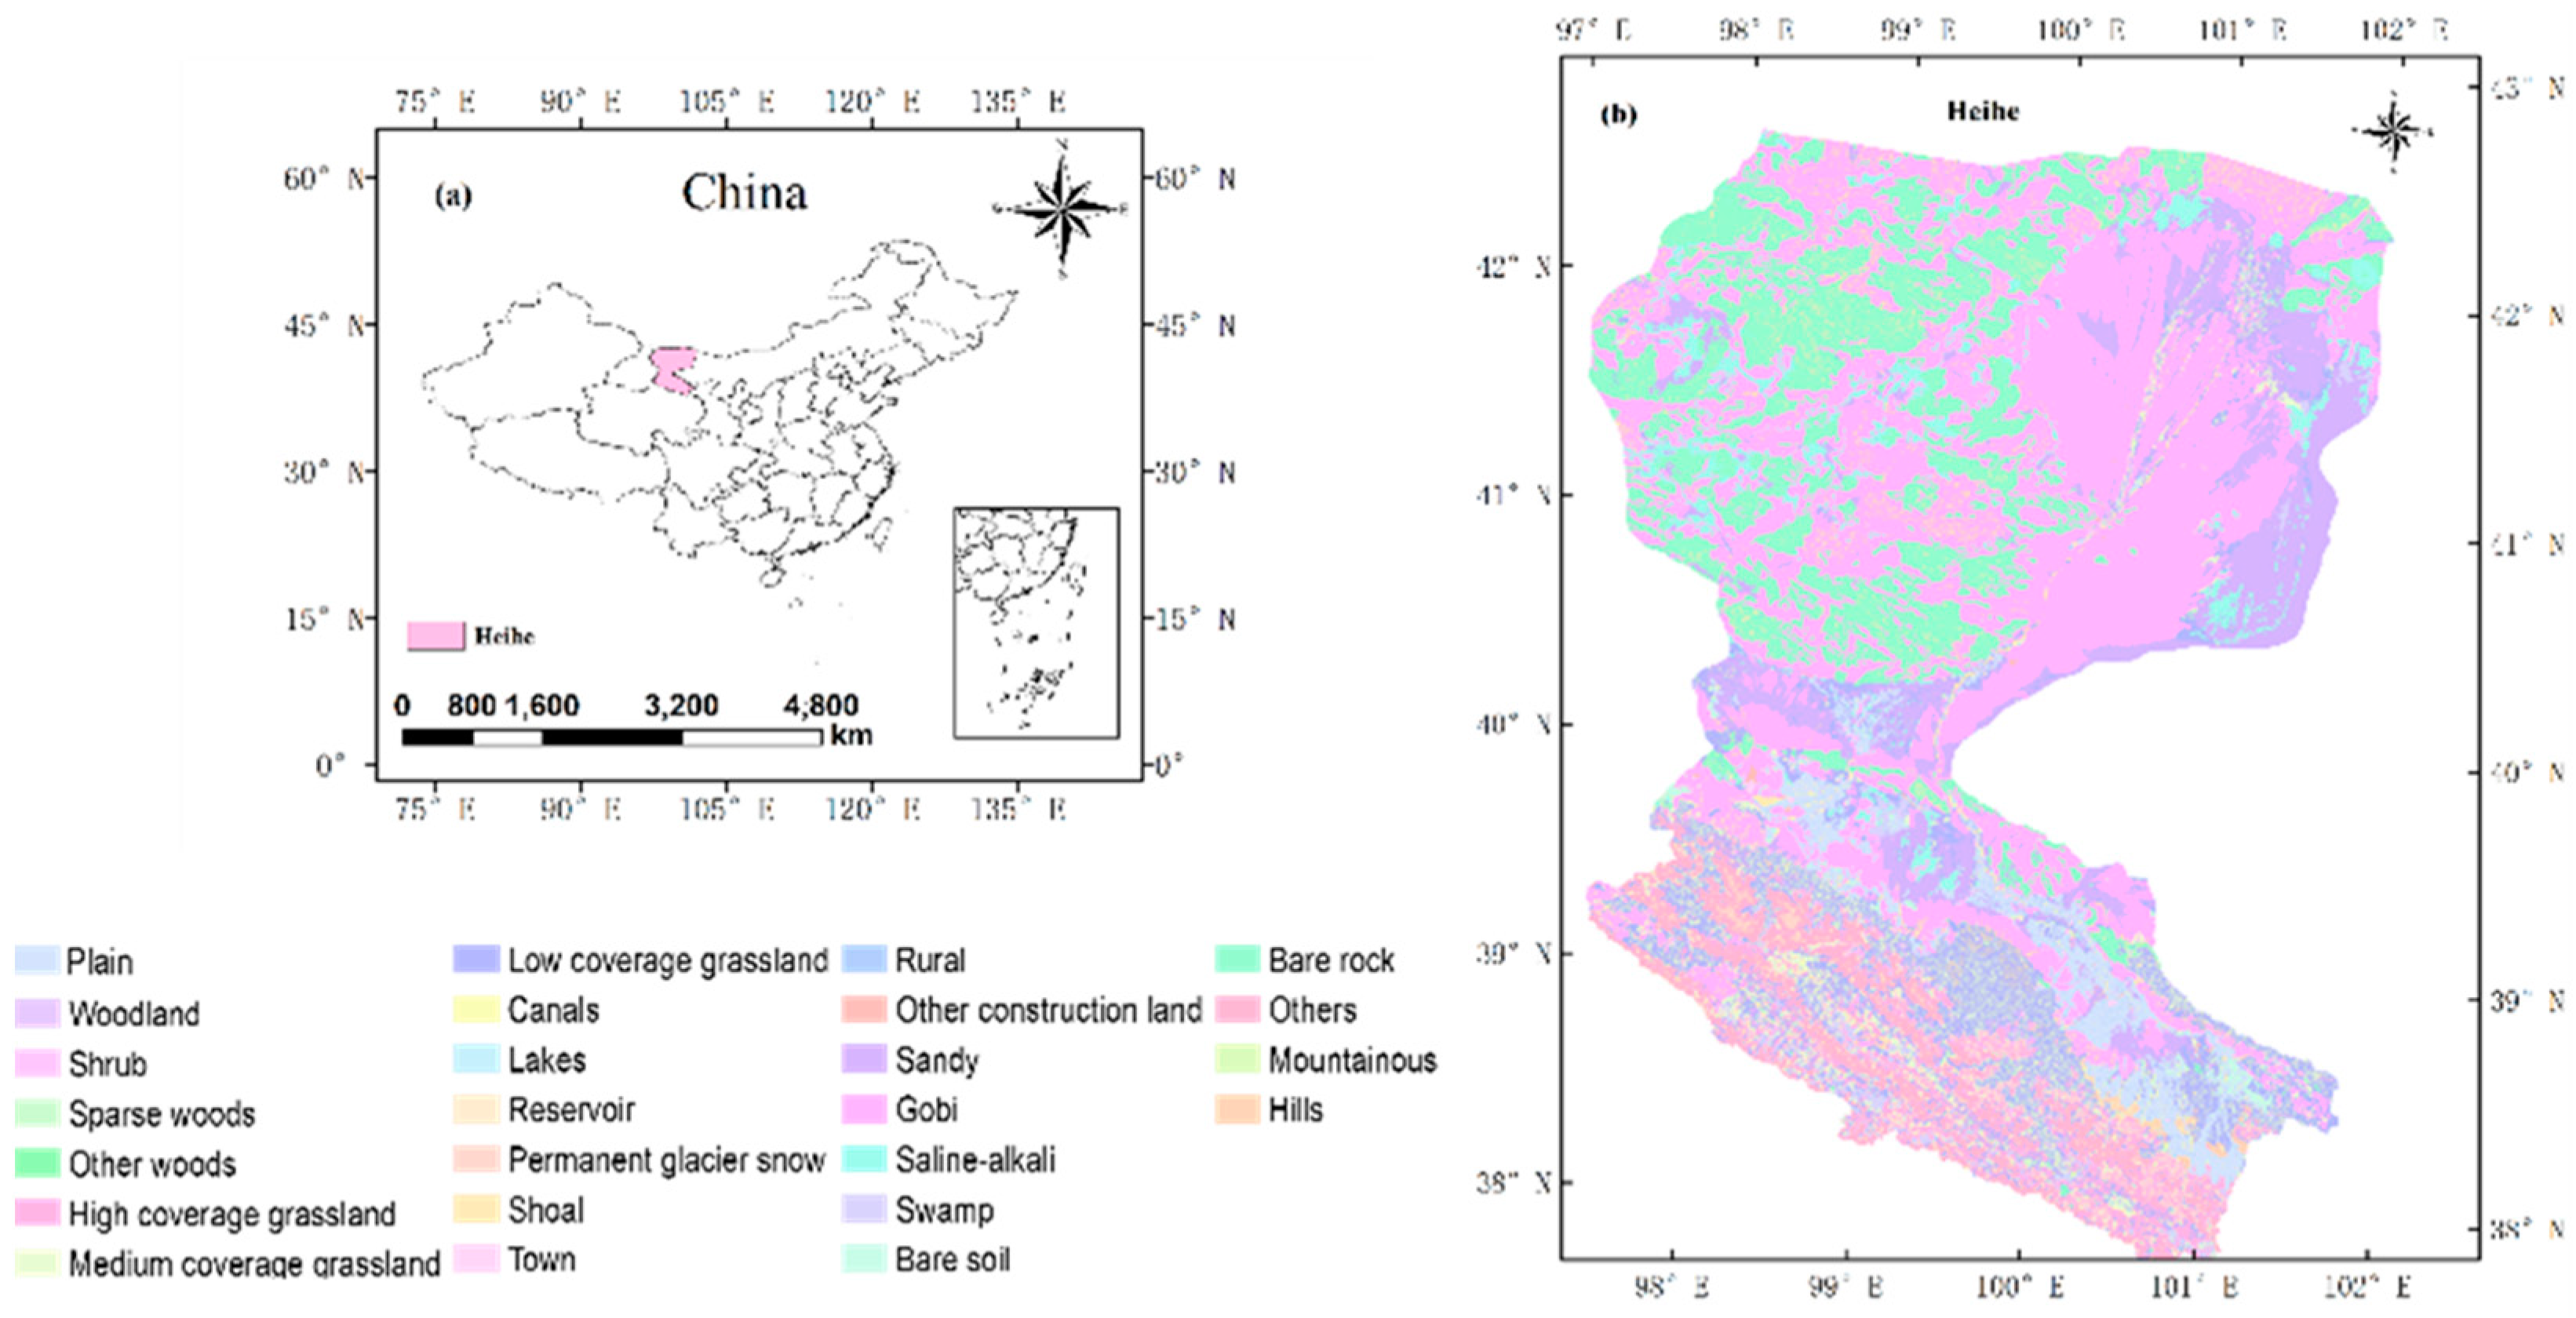
Study Area
2.2. SDGSAT-1 Land Surface Temperature Data
2.3. Method
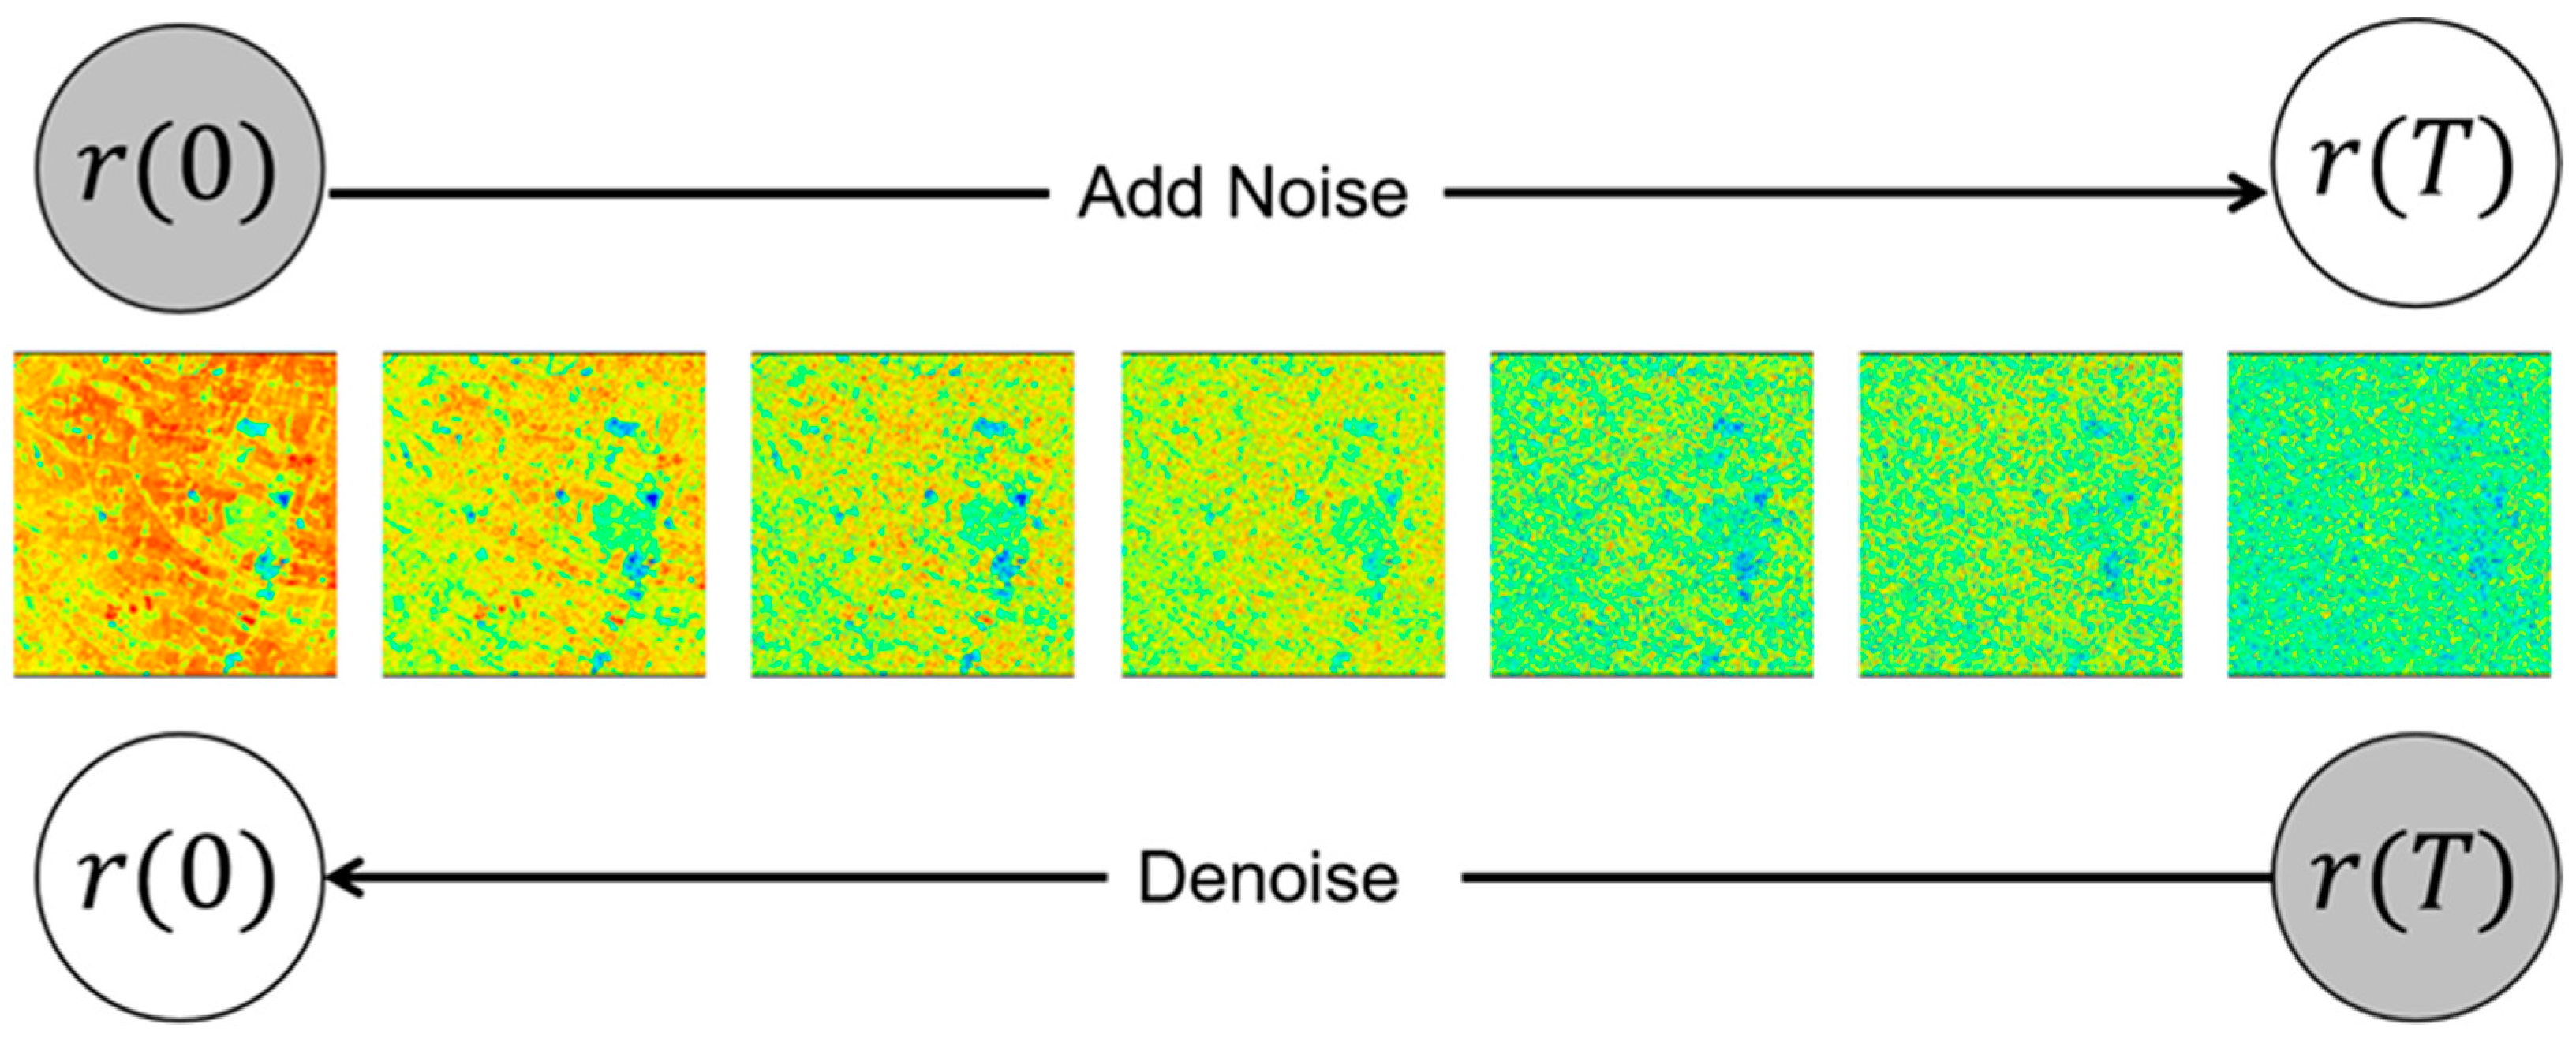
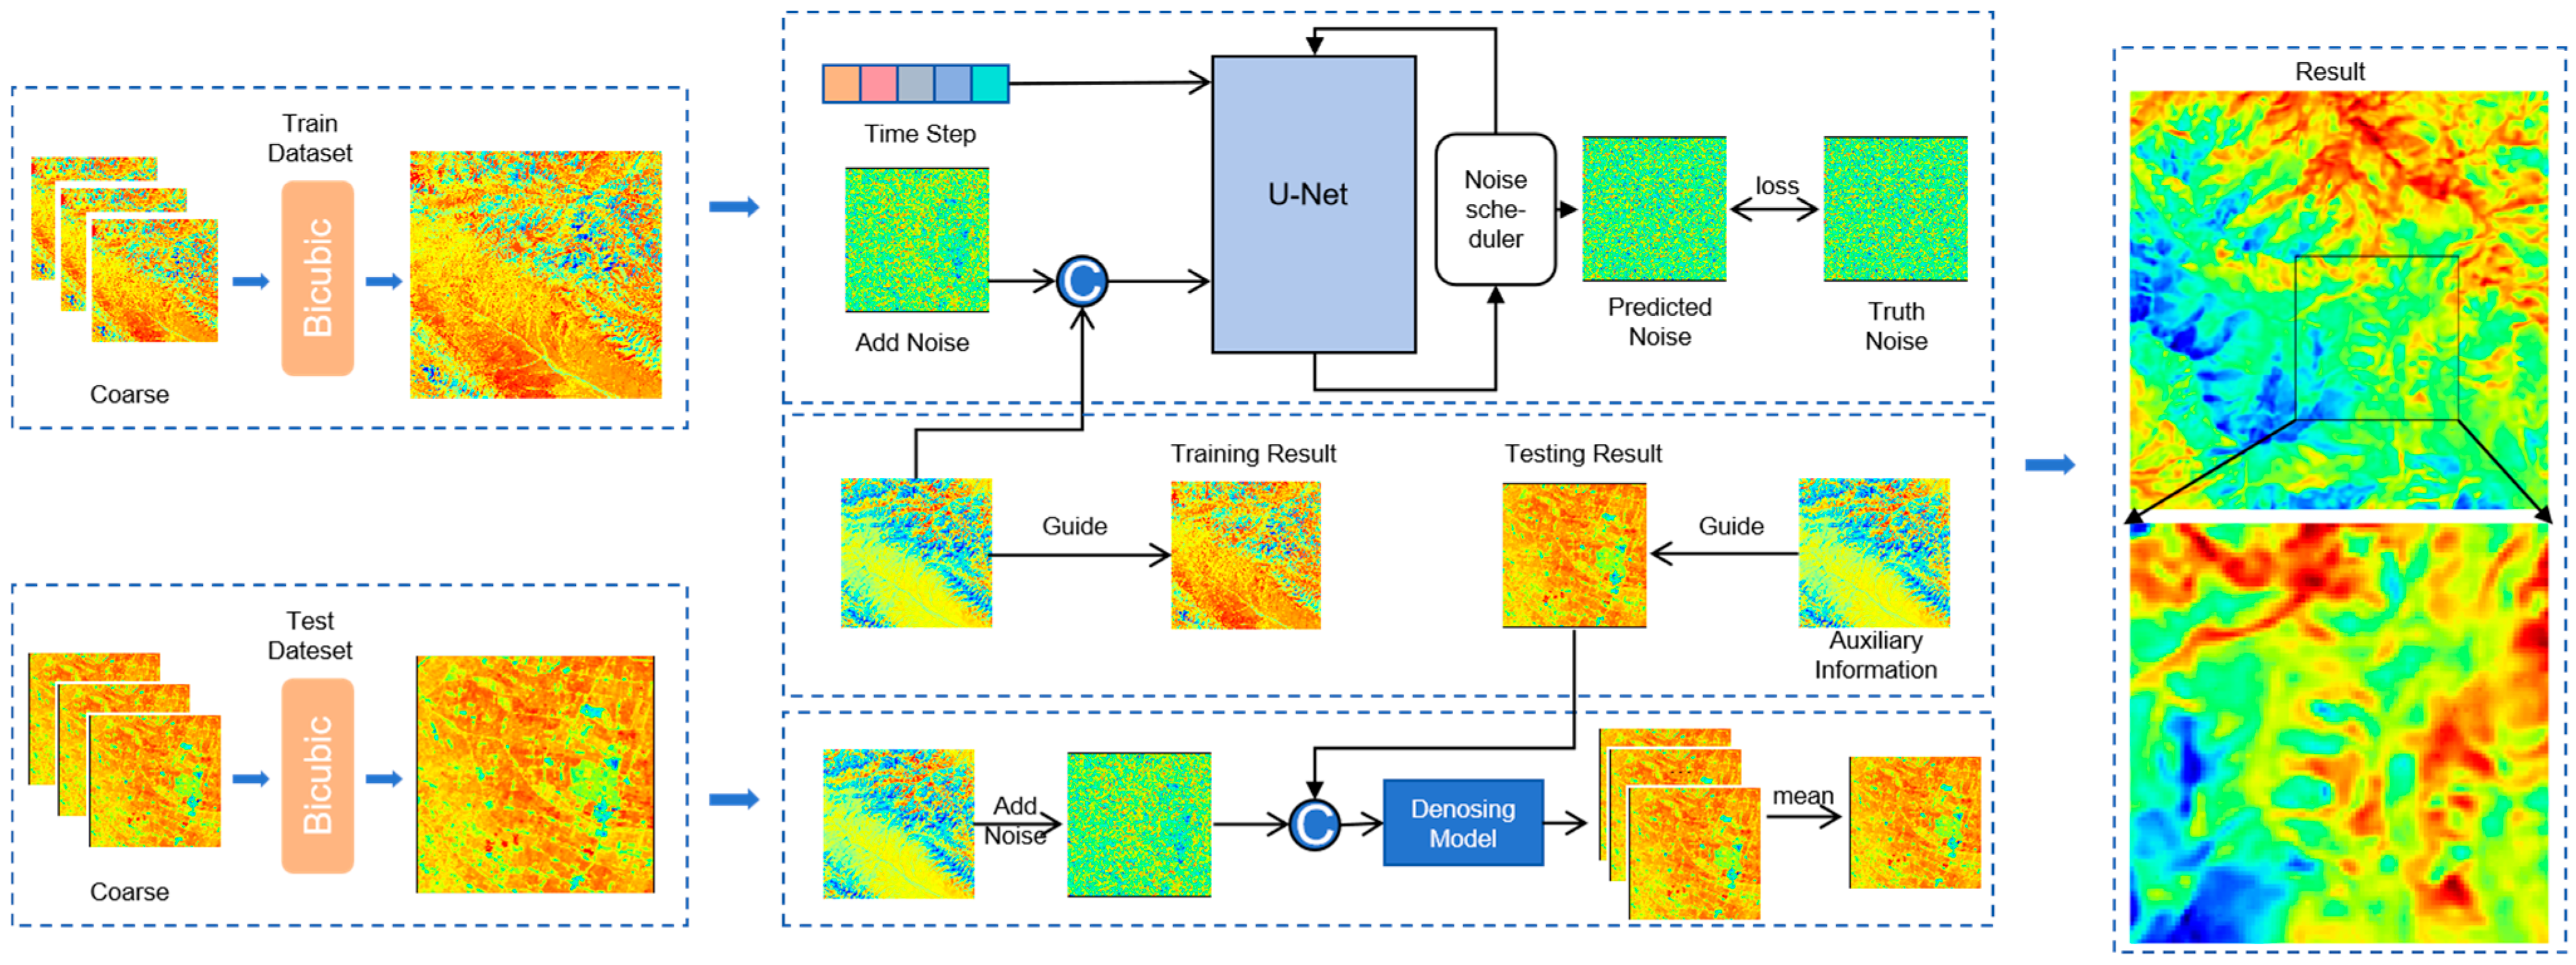
IGDM
2.4. Methods of Comparison
2.5. Metrics
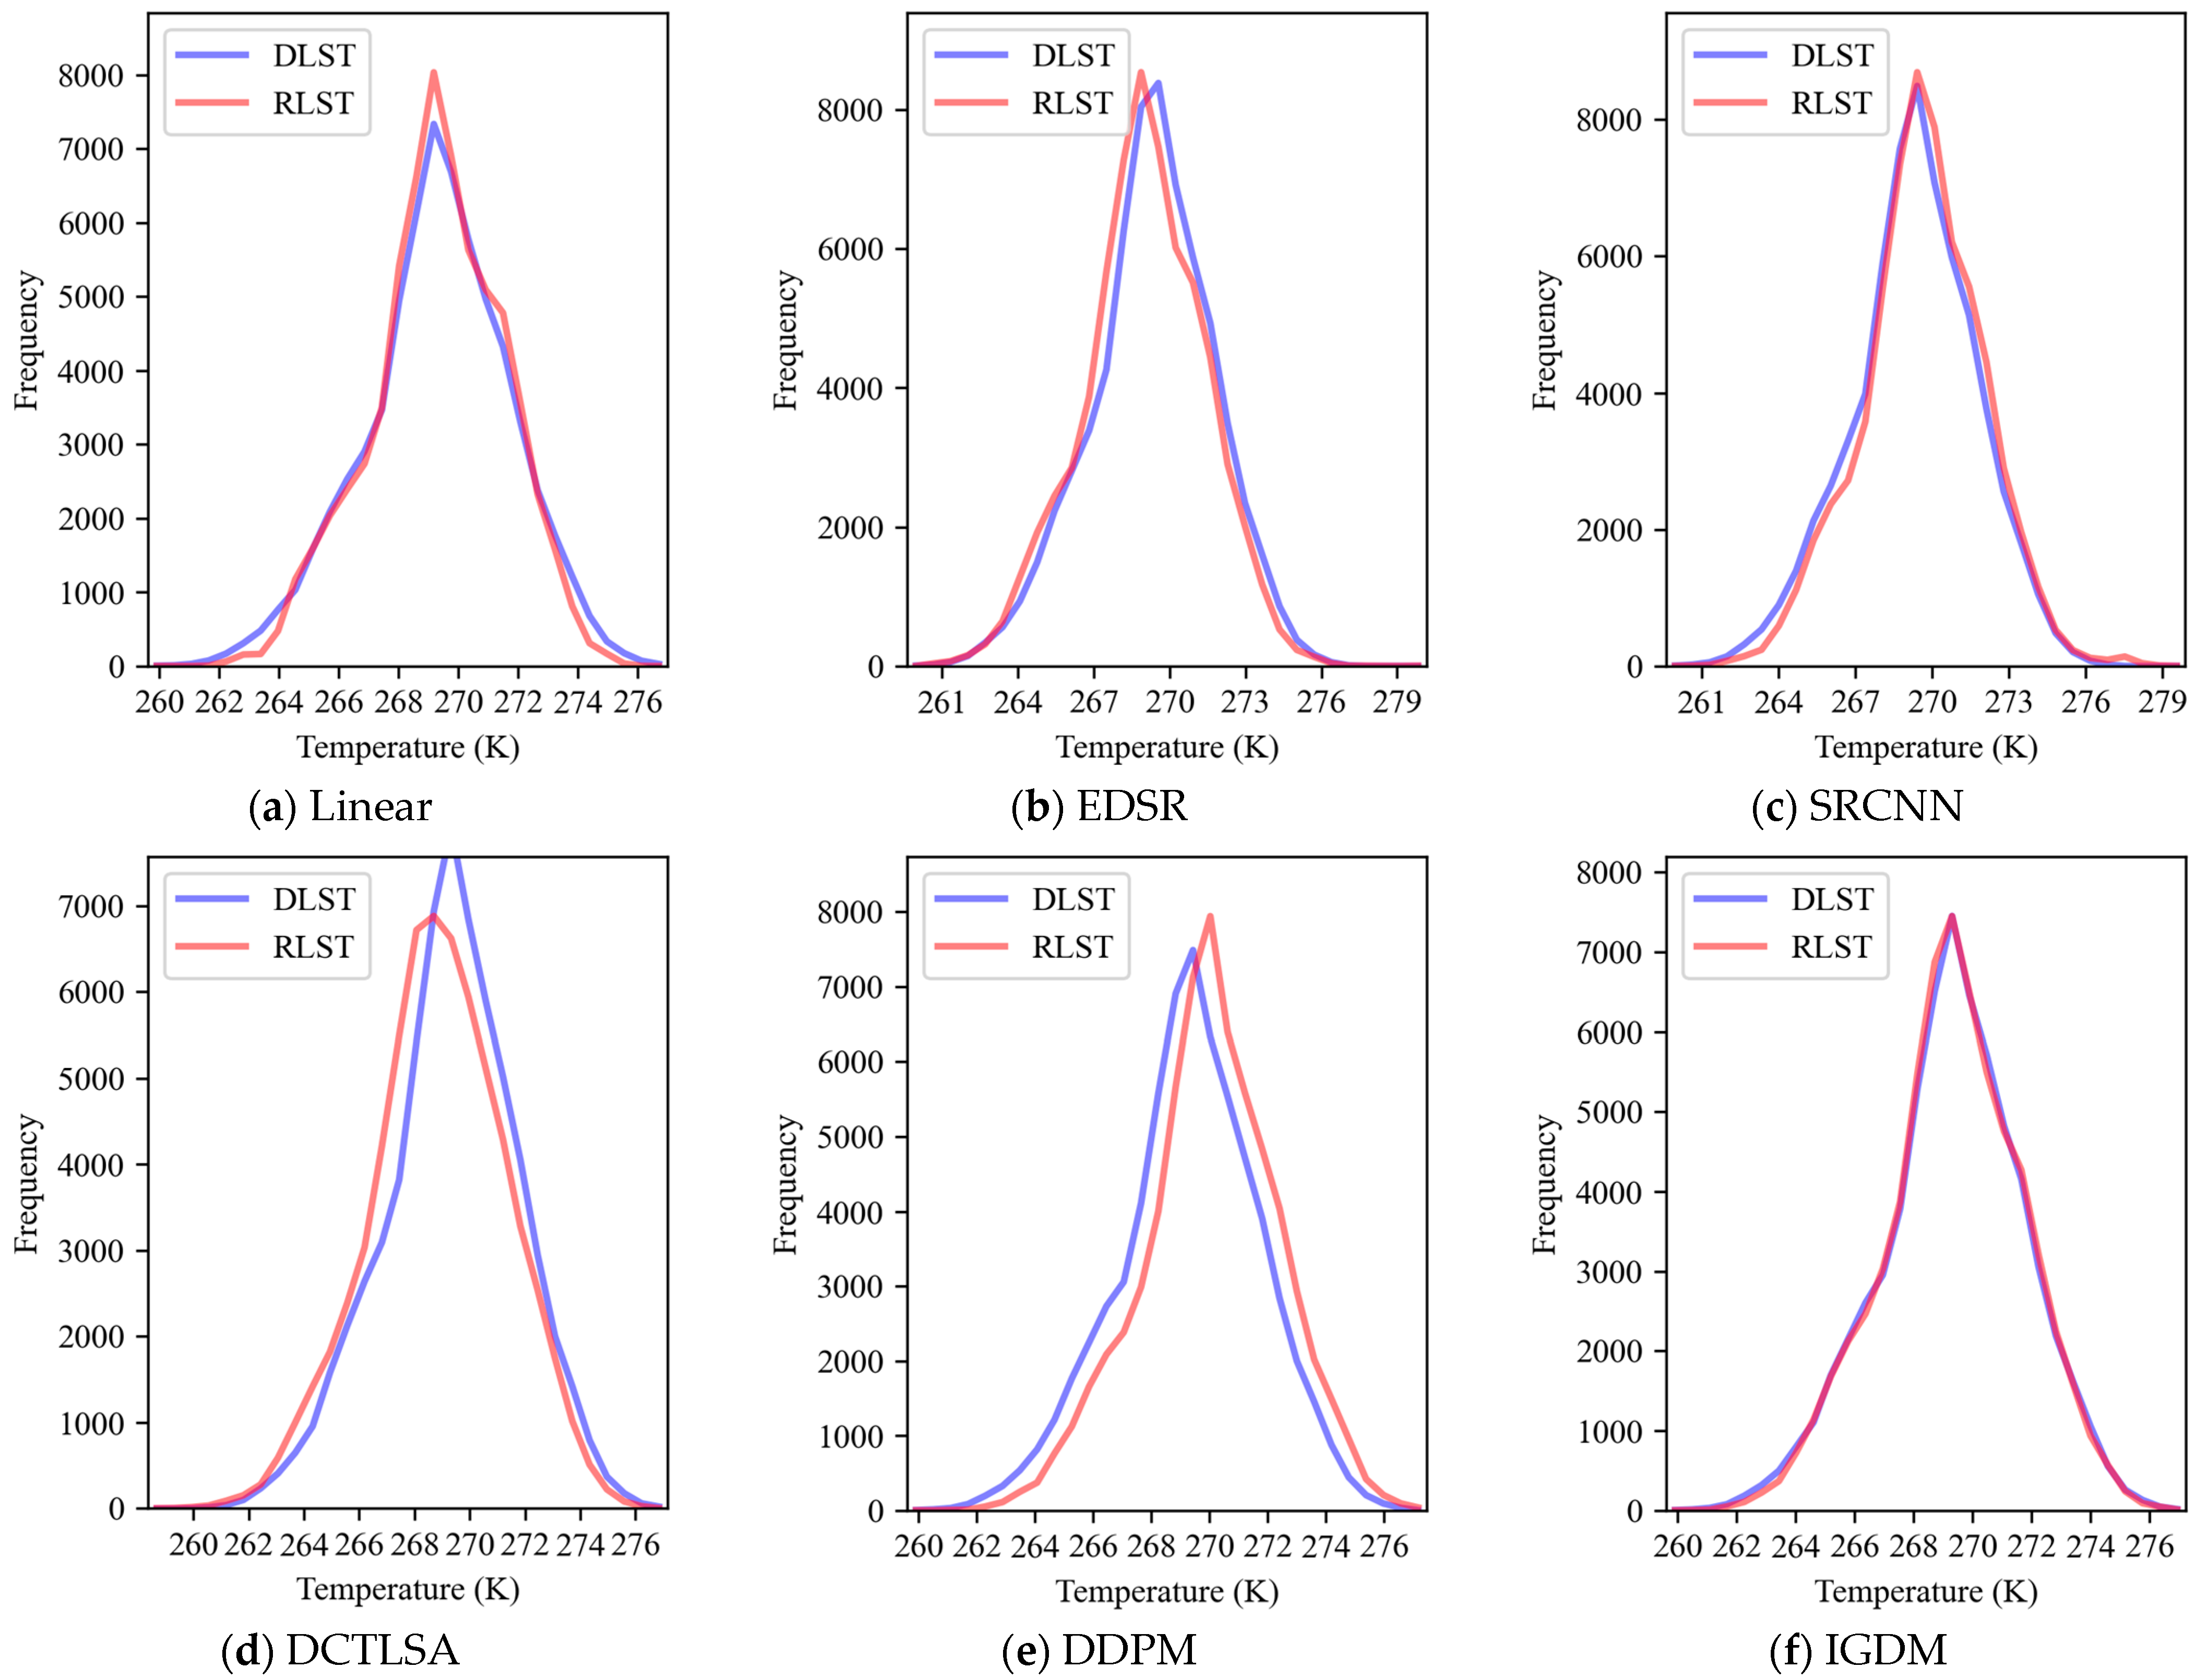
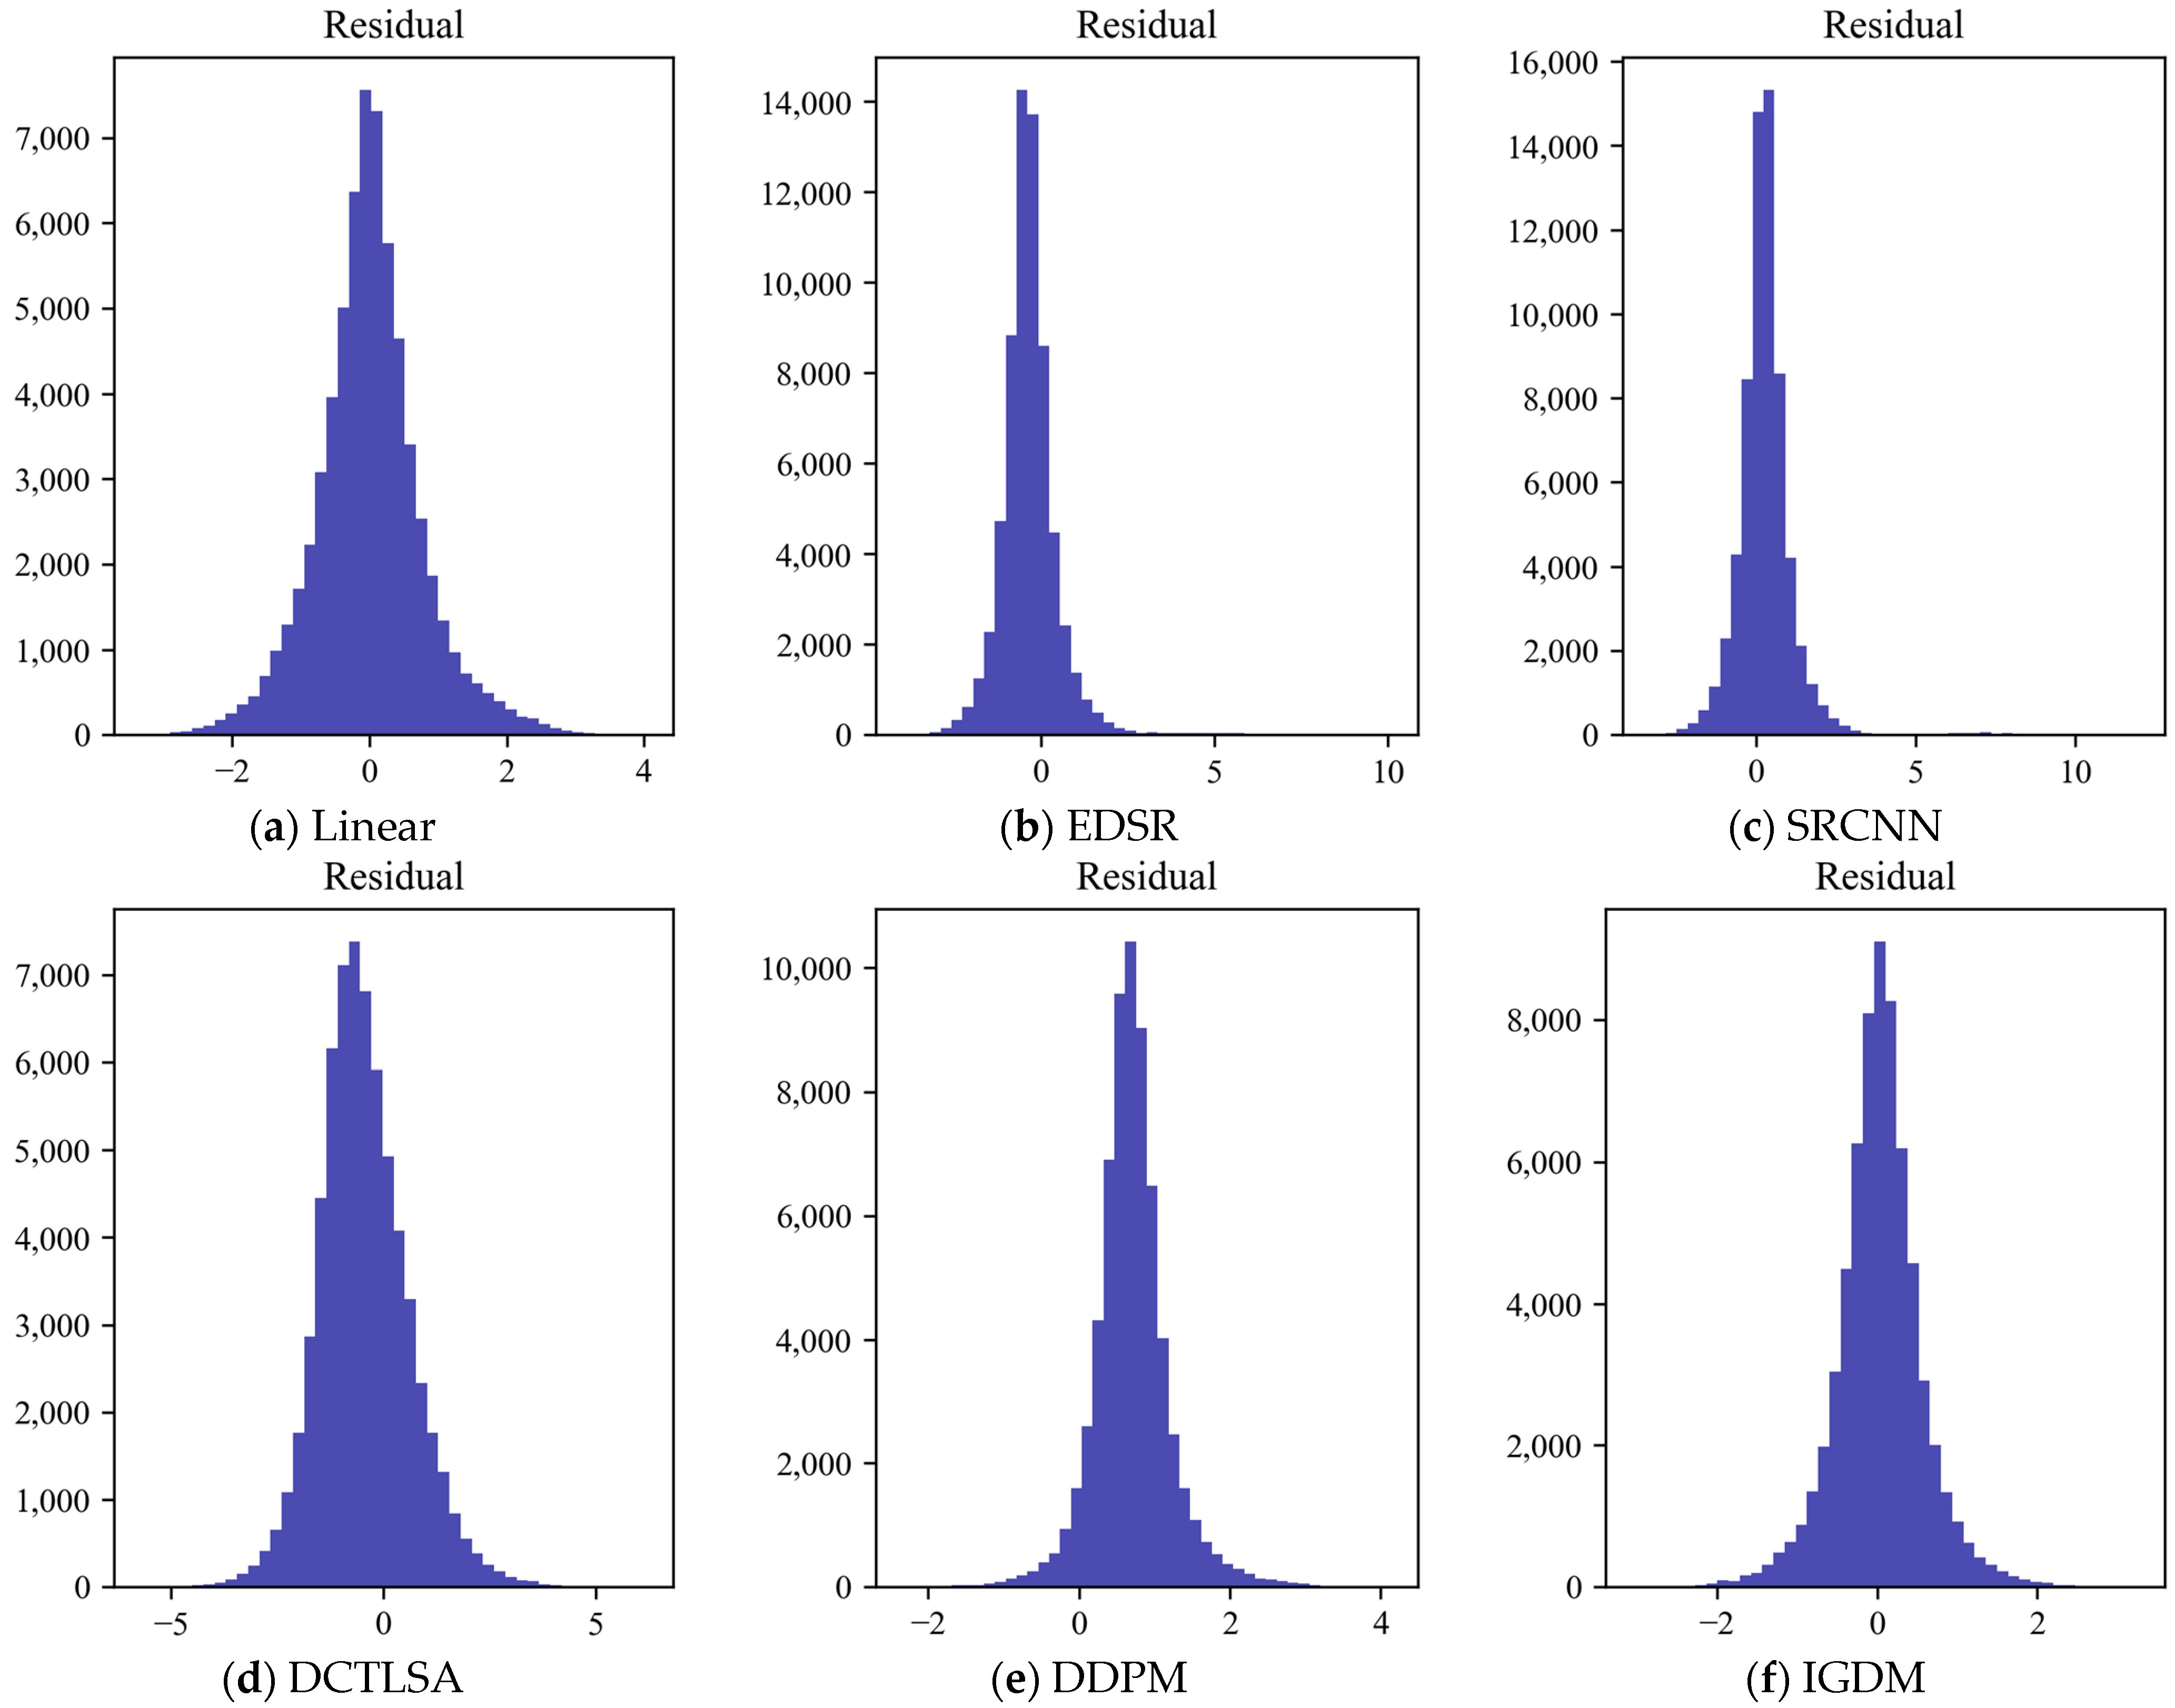
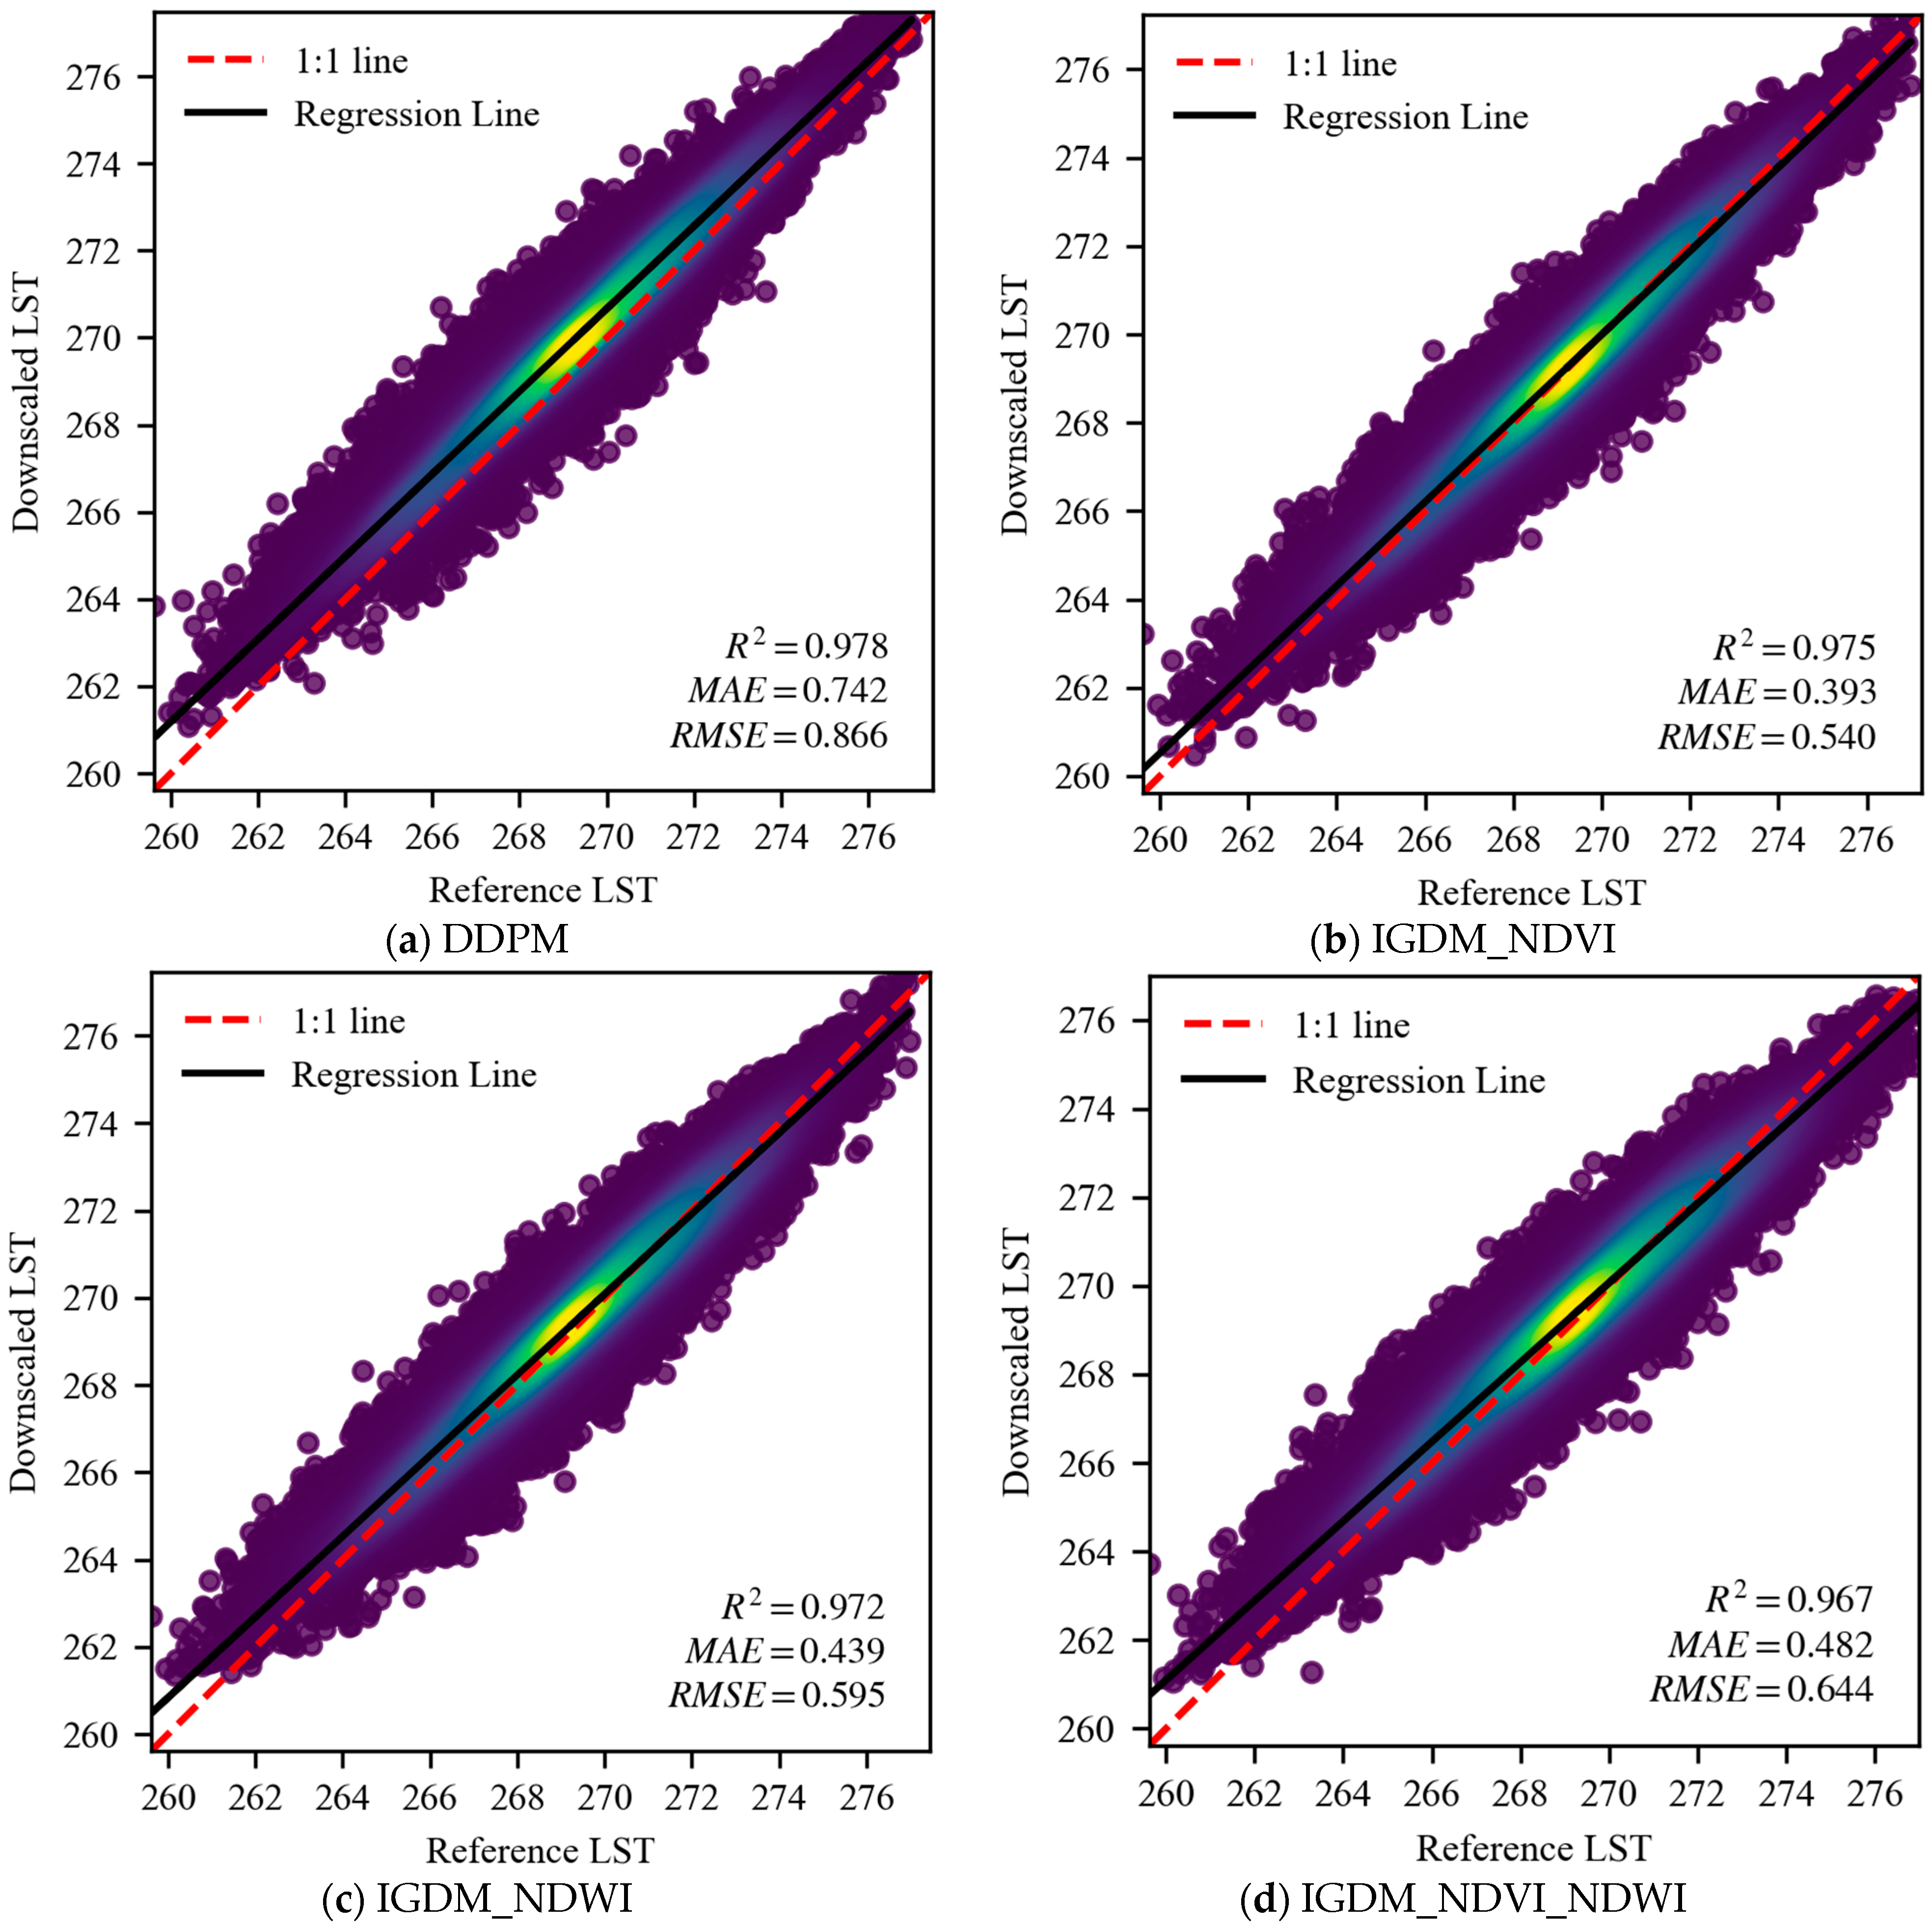
3. Result
4. Discussion
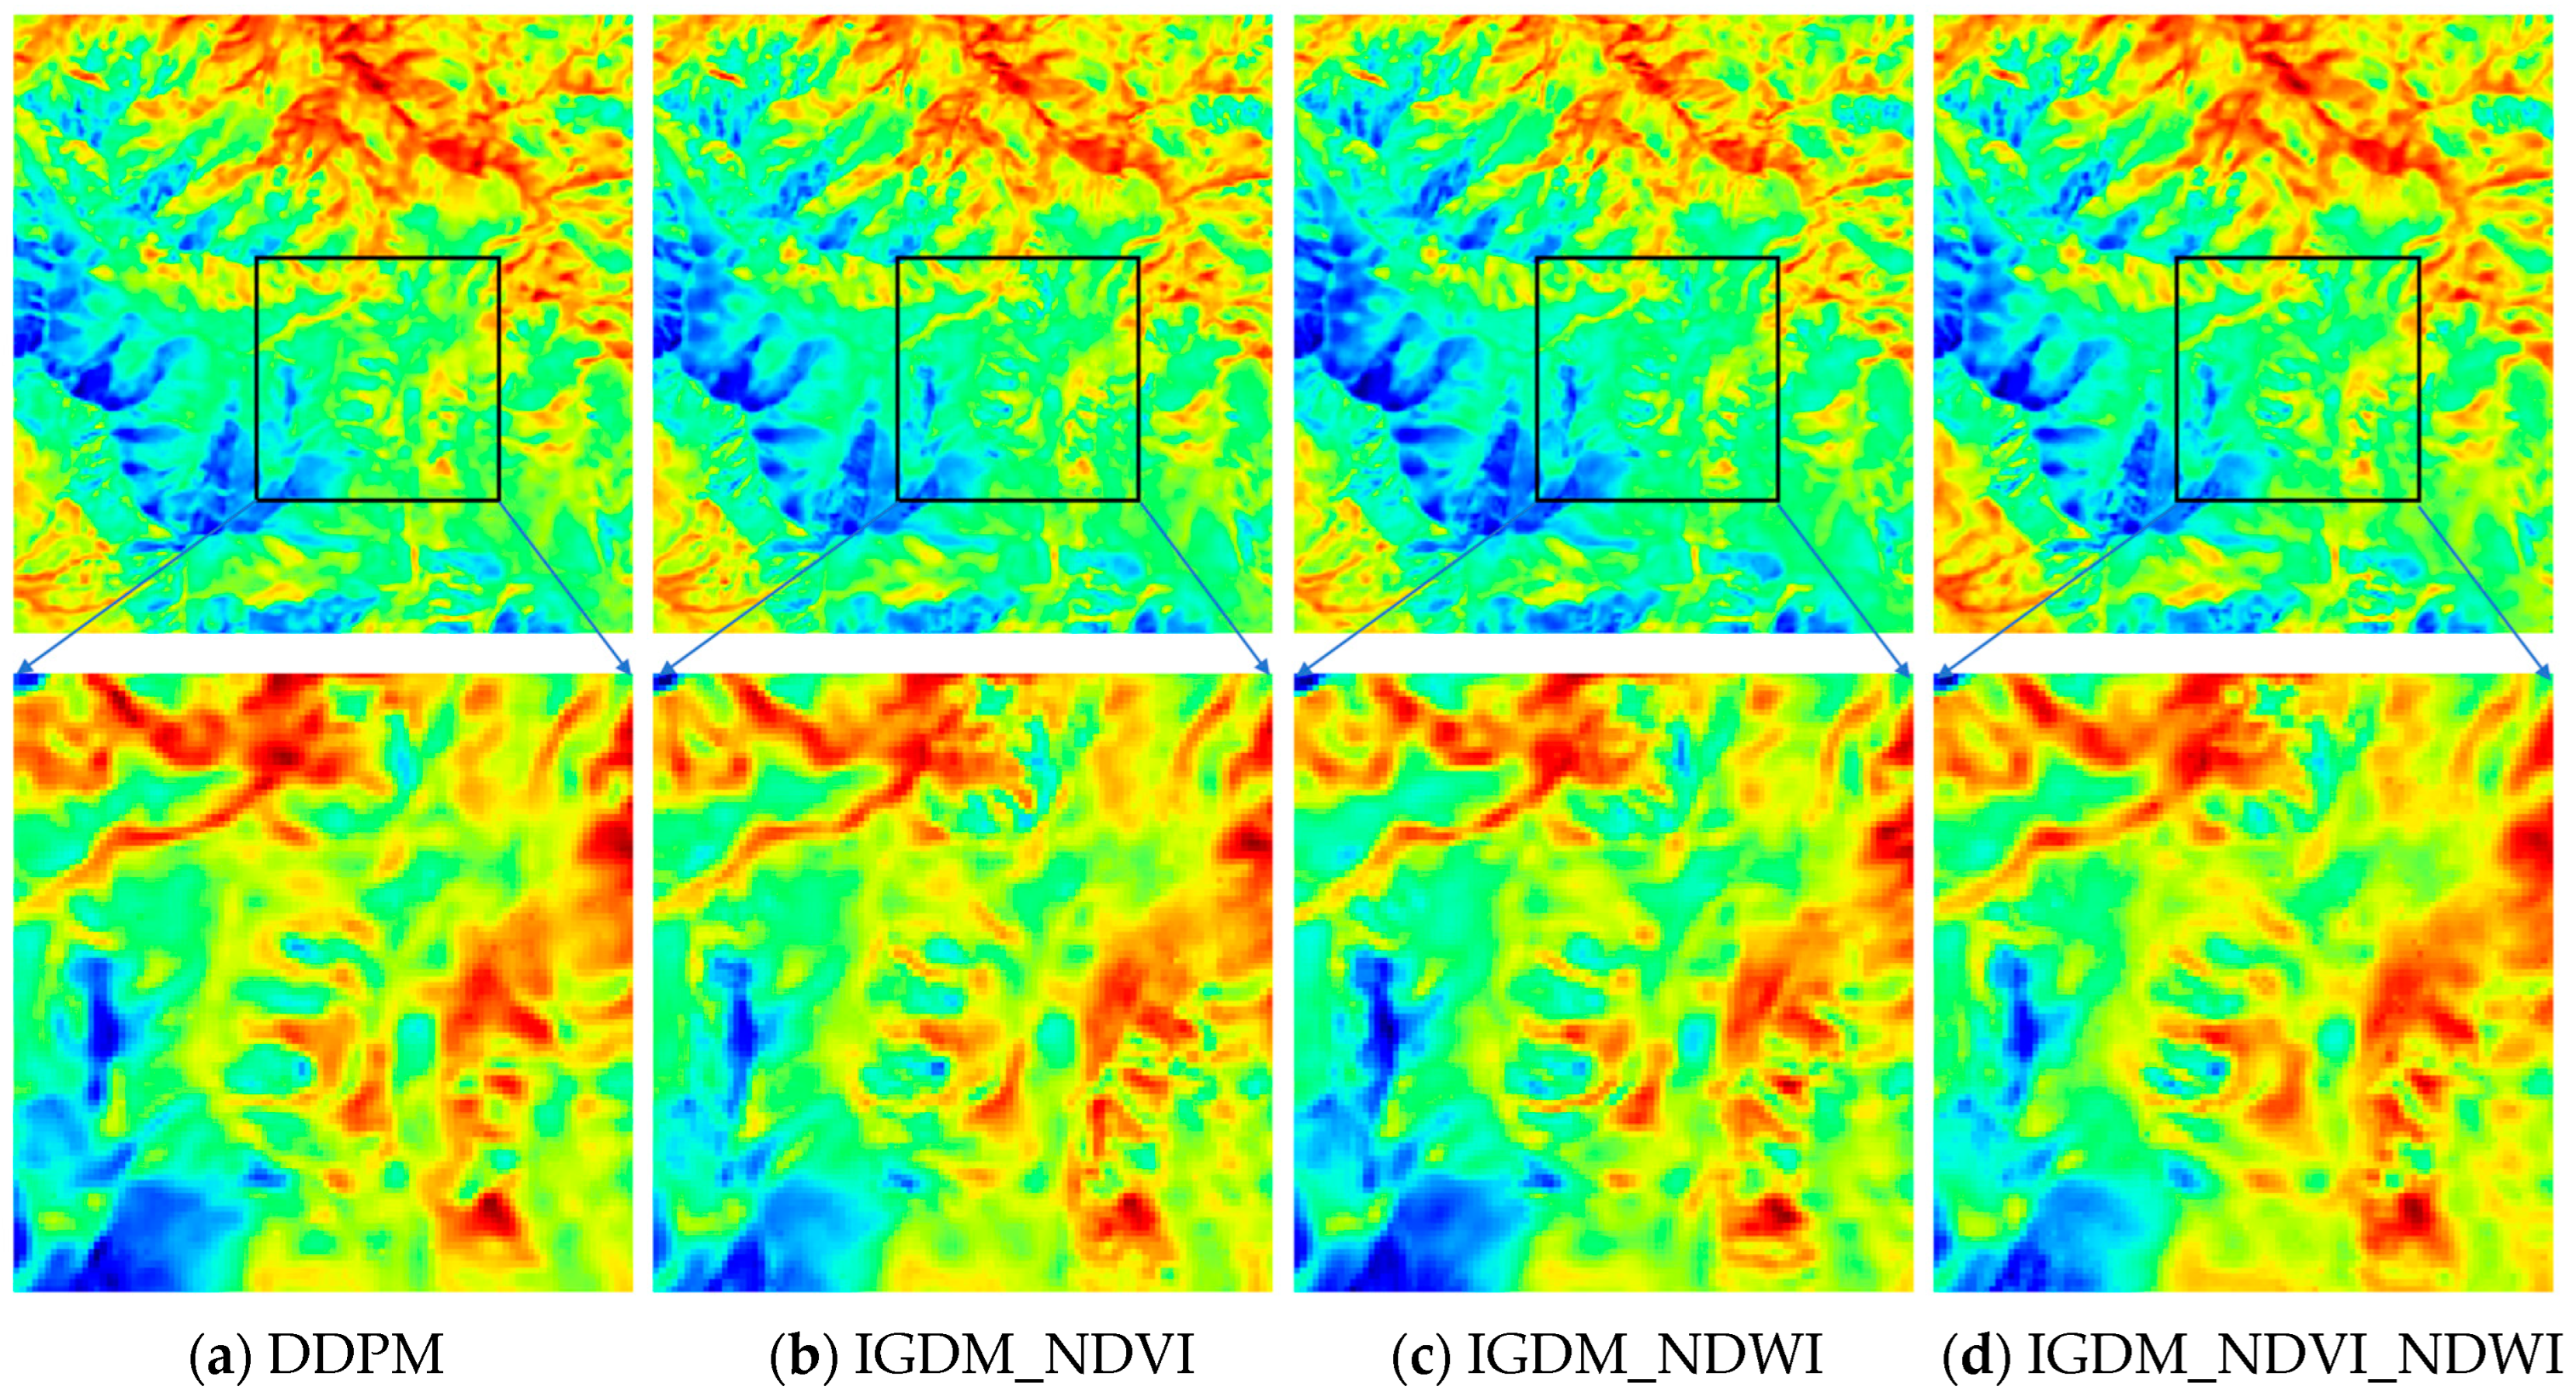
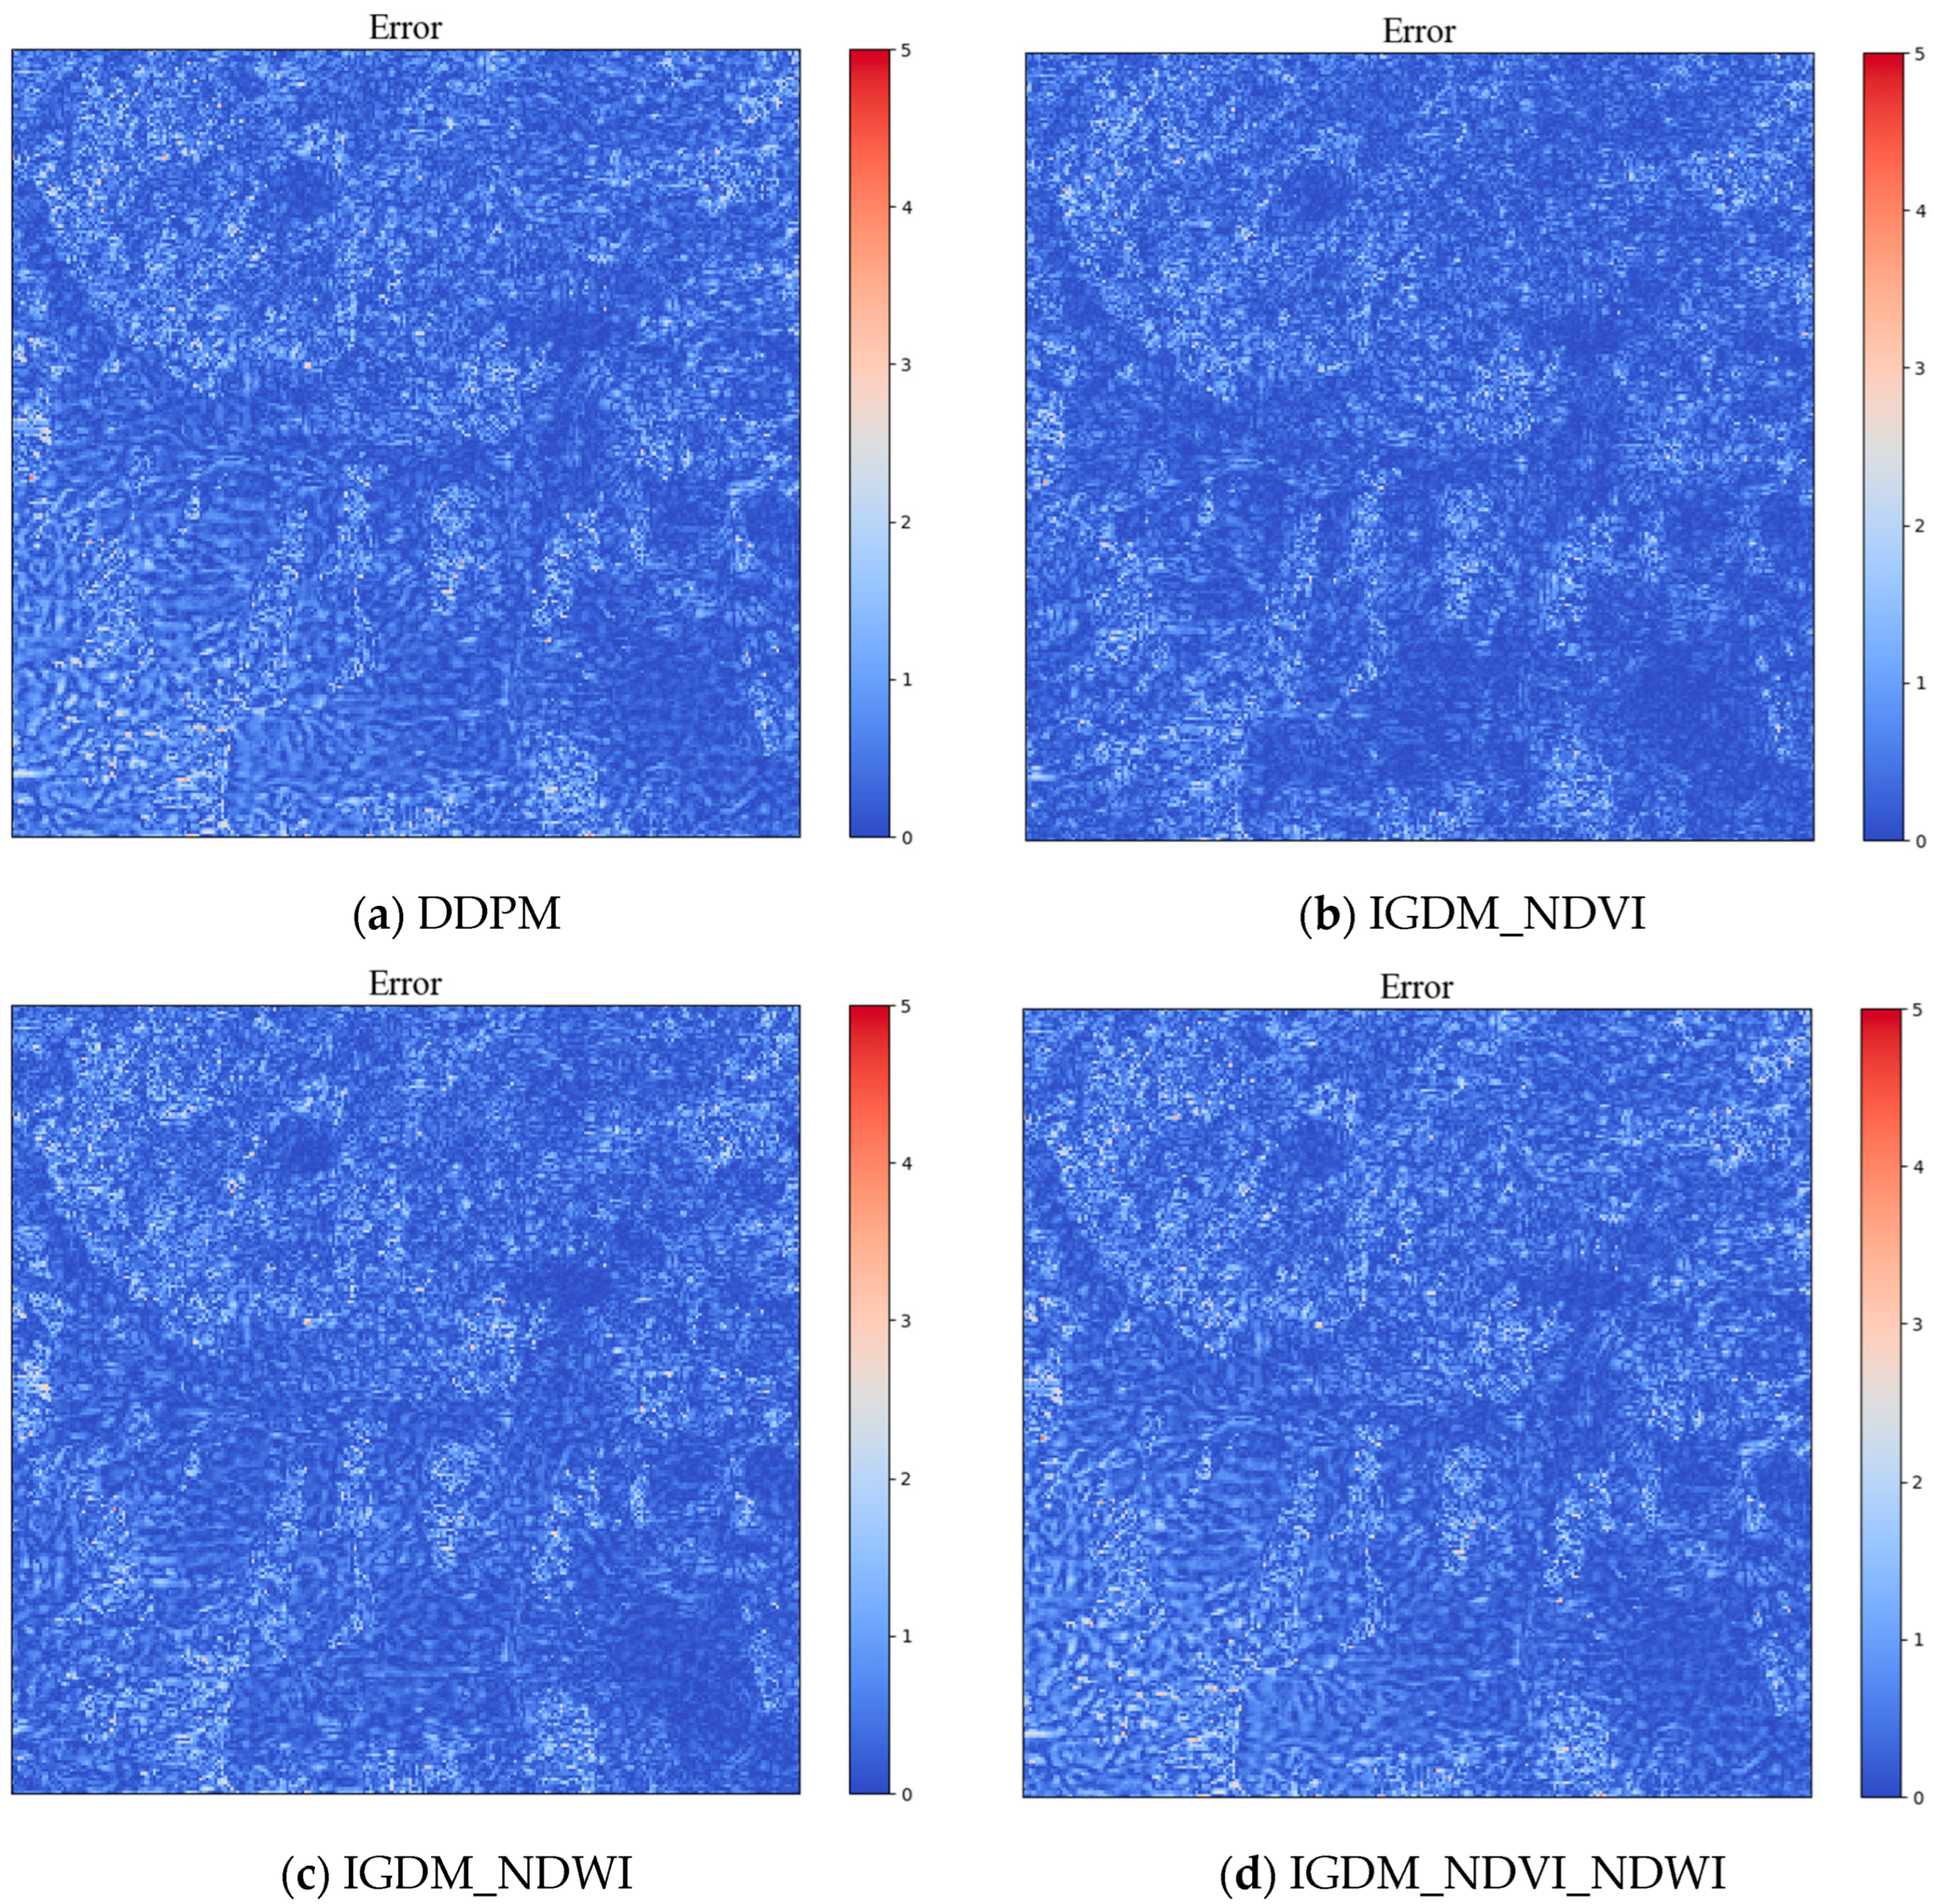
4.1. The Impact of Different Auxiliary Information on Downscaling Results
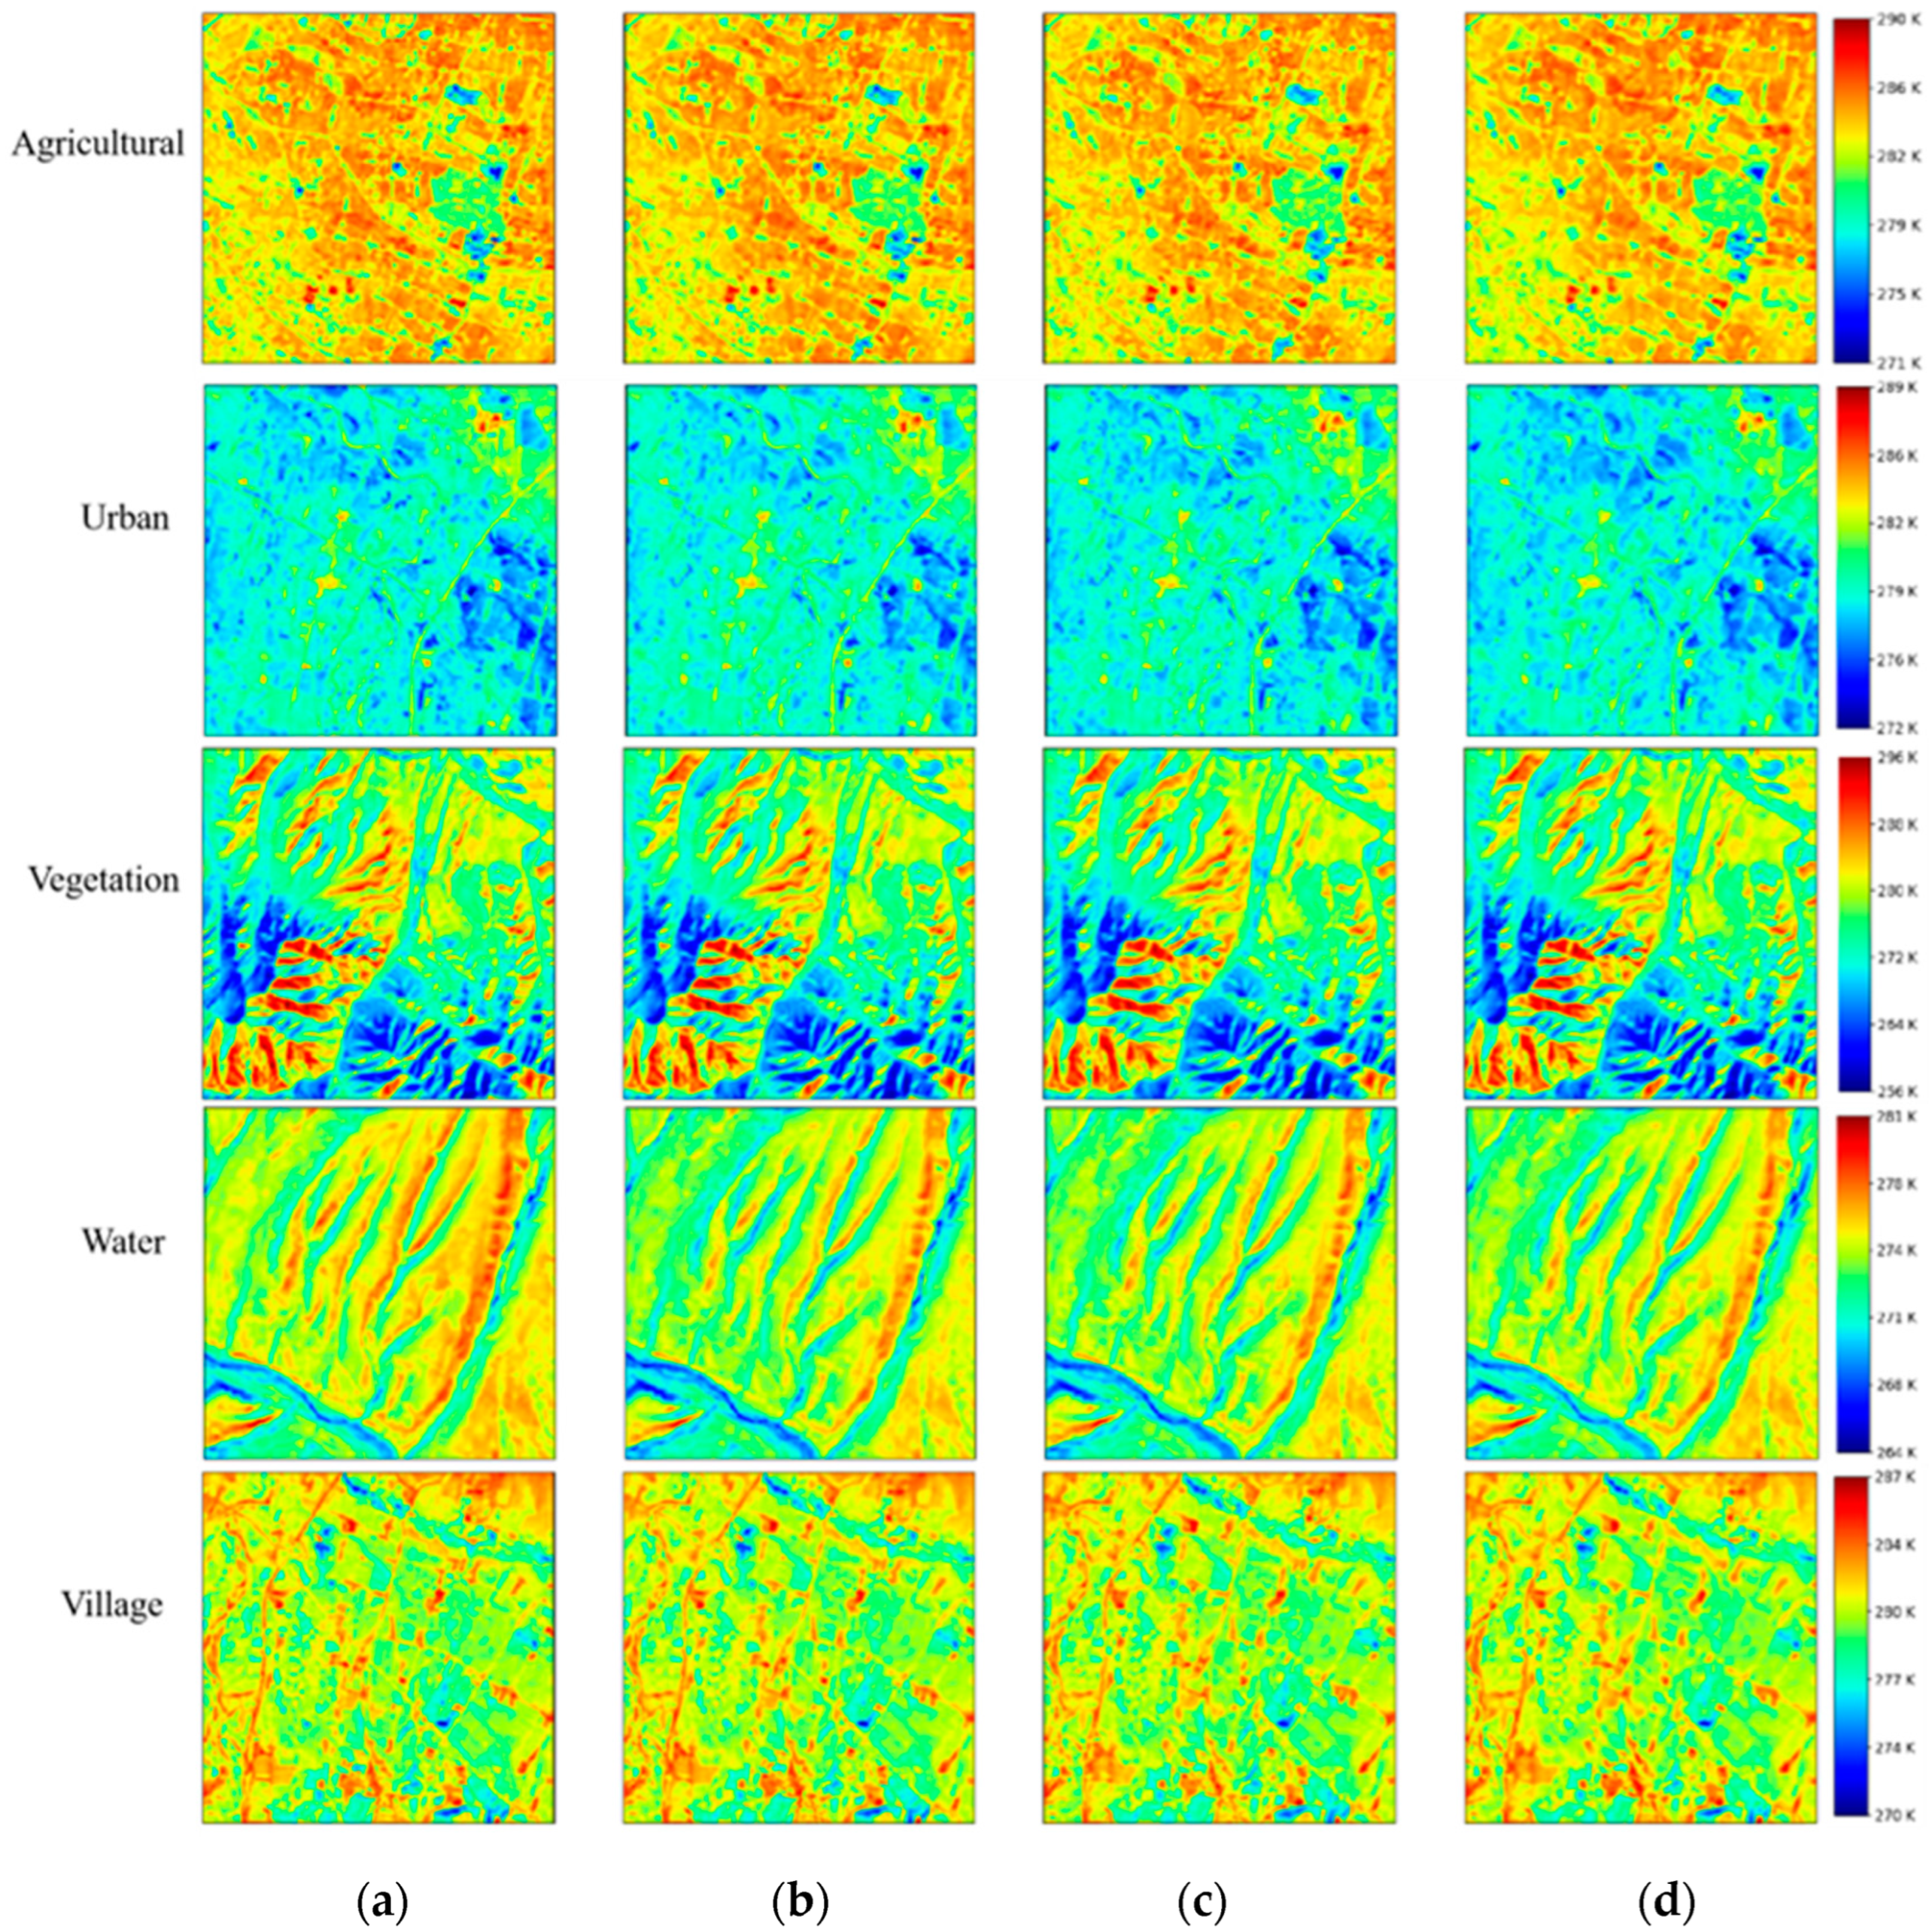
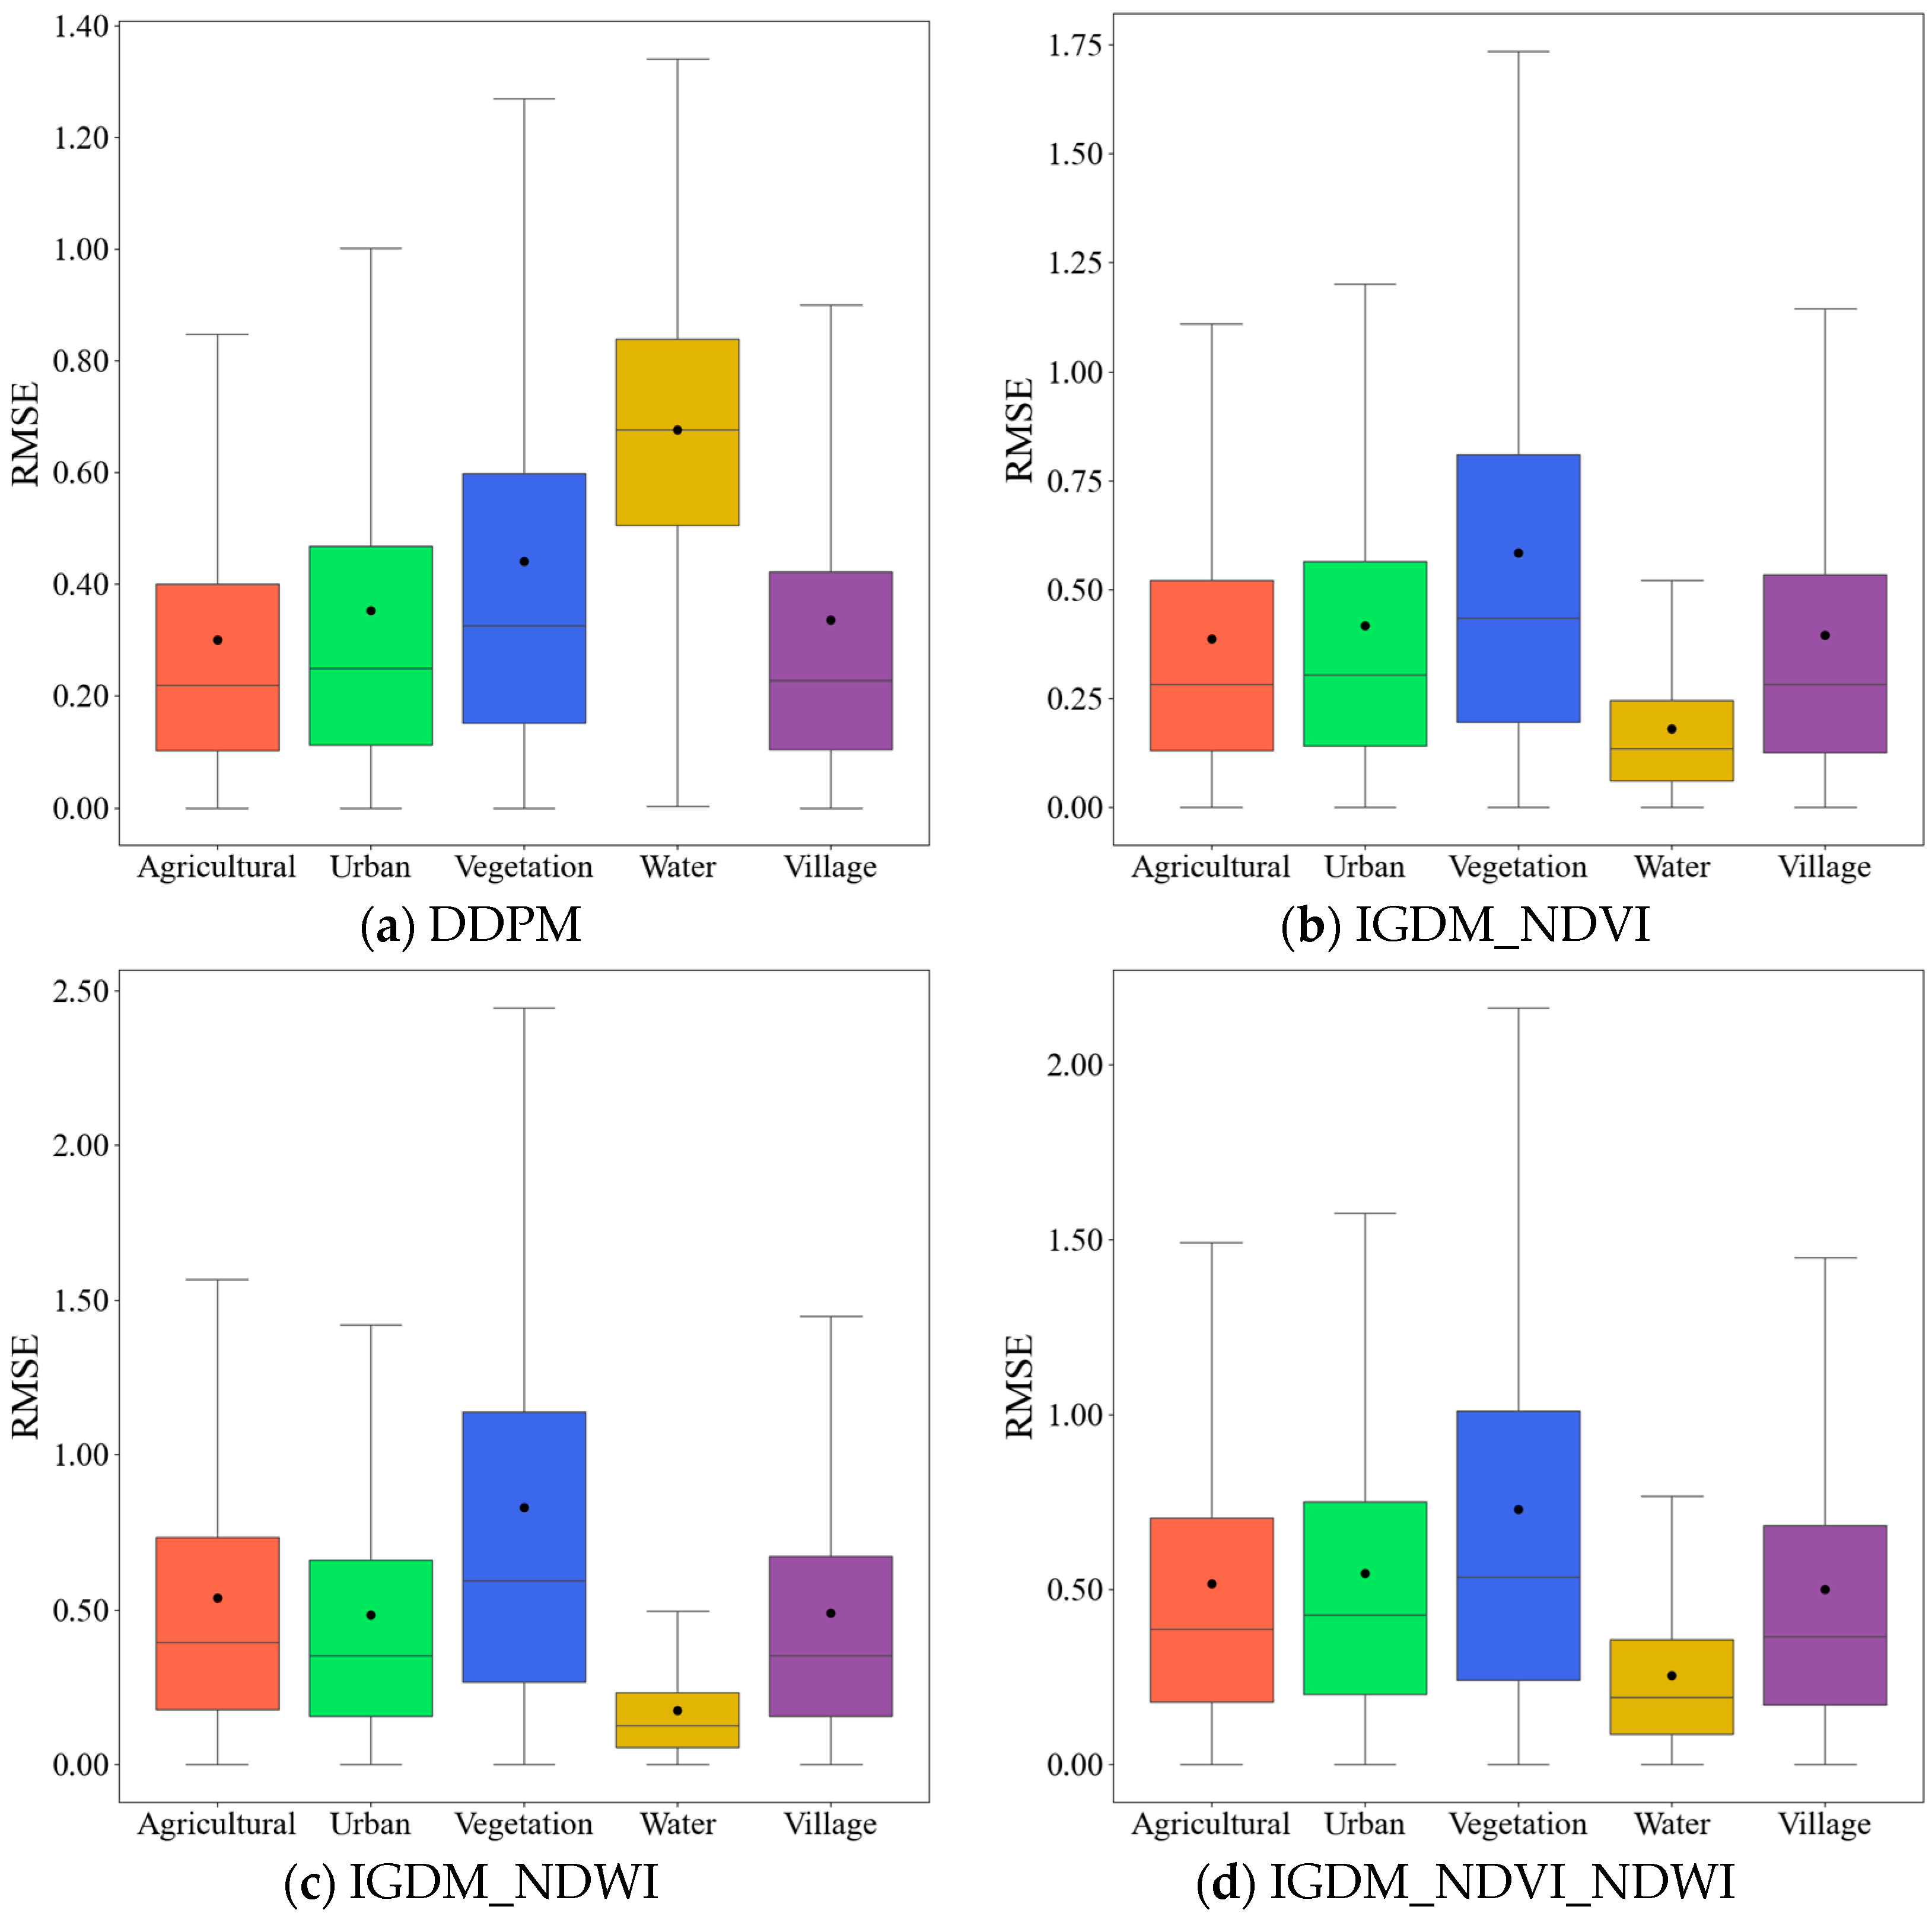
4.2. Analysis of Remote Sensing Surface Temperature Downscaling Results in Different Regions
5. Conclusions
- (1)
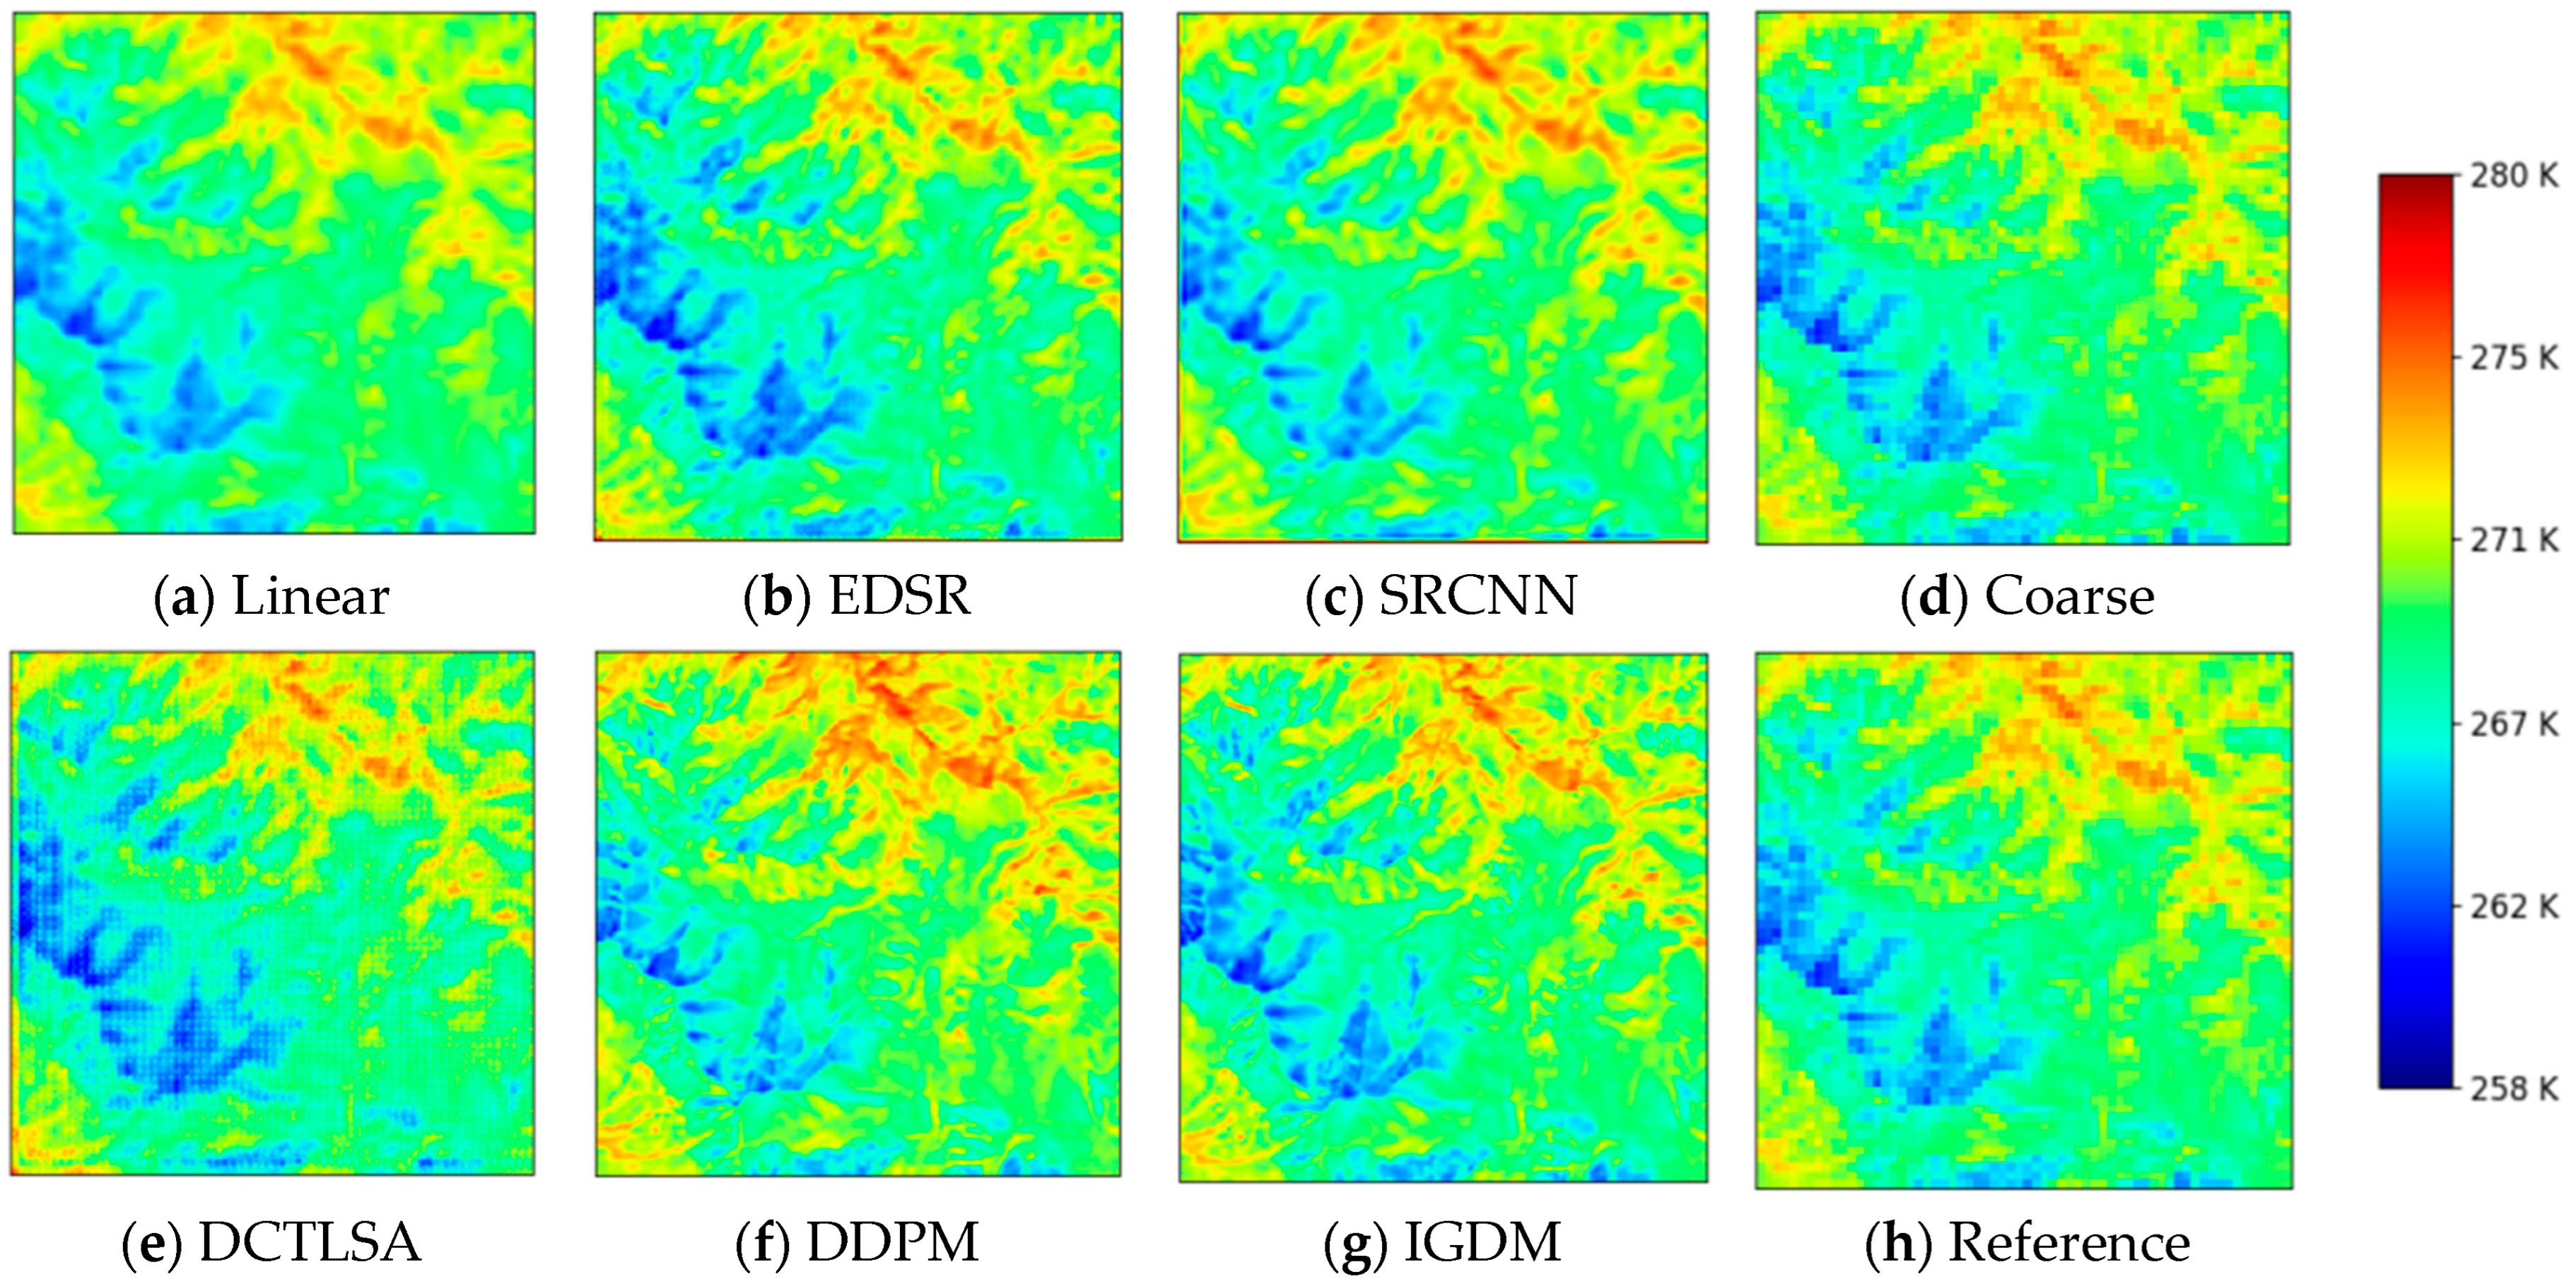
- Effectiveness of IGDM: The IGDM demonstrates significant advantages in LST downscaling tasks, outperforming other deep learning models in terms of accuracy and spatial detail. The incorporation of NDVI as auxiliary information further improves the model’s performance, enhancing accuracy and reliability. The results show that the diffusion model-generated LST is closer to actual values, with improved numerical accuracy and detail.
- (2)
- Role of NDVI and NDWI: Both NDVI and NDWI serve as valuable auxiliary information, enhancing the accuracy of LST predictions. While NDVI primarily captures the influence of vegetation, NDWI helps correct temperature deviations. When used together, they produce more accurate and detailed downscaling results, demonstrating the critical role of these indices in improving prediction precision.
- (3)
- Region-Specific Performance: In areas with distinct features, such as water bodies, the introduction of auxiliary information significantly improves downscaling accuracy. However, in regions with complex textures and large temperature variations, the downscaling performance remains suboptimal, regardless of the auxiliary information used. This highlights the importance of selecting the right auxiliary data, especially in areas with less temperature variation and weaker texture features.
Supplementary Materials
Author Contributions
Funding
Institutional Review Board Statement
Data Availability Statement
Acknowledgments
Conflicts of Interest
References
- Fick, S.E.; Hijmans, R.J. WorldClim 2: New 1-km spatial resolution climate surfaces for global land areas. Int. J. Climatol. 2017, 37, 4302–4315. [Google Scholar] [CrossRef]
- Li, Z.L.; Tang, B.H.; Wu, H.; Ren, H.Z.; Yan, G.J.; Wan, Z.M.; Trigo, I.F.; Sobrino, J.A. Satellite-derived land surface temperature: Current status and perspectives. Remote Sens. Environ. 2013, 131, 14–37. [Google Scholar] [CrossRef]
- Weng, Q.H.; Lu, D.S.; Schubring, J. Estimation of land surface temperature-vegetation abundance relationship for urban heat island studies. Remote Sens. Environ. 2004, 89, 467–483. [Google Scholar] [CrossRef]
- Shen, Y.; Shen, H.F.; Cheng, Q.; Zhang, L.P. Generating Comparable and Fine-Scale Time Series of Summer Land Surface Temperature for Thermal Environment Monitoring. IEEE J. Sel. Top. Appl. Earth Observ. Remote Sens. 2021, 14, 2136–2147. [Google Scholar] [CrossRef]
- Sun, L.; Chen, Z.X.; Gao, F.; Anderson, M.; Song, L.S.; Wang, L.M.; Hu, B.; Yang, Y. Reconstructing daily clear-sky land surface temperature for cloudy regions from MODIS data. Comput. Geosci. 2017, 105, 10–20. [Google Scholar] [CrossRef]
- Peng, Z.X.; Zhou, J.; Liu, S.M.; Li, M.S.; Zhu, L.Q. Influences of ground structure on remotely sensed land surface temperature. In Proceedings of the 36th IEEE International Geoscience and Remote Sensing Symposium (IGARSS), Beijing, China, 10–15 July 2016; pp. 1368–1371. [Google Scholar]
- Liu, H.M.; He, B.J.; Gao, S.H.; Zhan, Q.M.; Yang, C. Influence of non-urban reference delineation on trend estimate of surface urban heat island intensity: A comparison of seven methods. Remote Sens. Environ. 2023, 296, 113735. [Google Scholar] [CrossRef]
- Li, R.B.; Li, H.; Bian, Z.J.; Cao, B.A.; Du, Y.M.; Liu, Q.H. A Temperature-Based Validation Method for Medium and High Spatial Resolution LST Products. In Proceedings of the IEEE International Geoscience and Remote Sensing Symposium (IGARSS), Pasadena, CA, USA, 16–21 July 2023; pp. 6306–6309. [Google Scholar]
- Zhu, X.L.; Duan, S.B.; Li, Z.L.; Wu, P.H.; Wu, H.; Zhao, W.; Qian, Y.G. Reconstruction of land surface temperature under cloudy conditions from Landsat 8 data using annual temperature cycle model. Remote Sens. Environ. 2022, 281, 113261. [Google Scholar] [CrossRef]
- Saraskanroud, S.A.; Ouri, B.F.; Zeinali, B.; Mostafazadeh, R. Estimation of land surface temperature (LST) using single-channel and multi-band methods in Sablan mountainous region. Adv. Space Res. 2024, 74, 2915–2929. [Google Scholar] [CrossRef]
- Zhang, Z.C.; Luan, W.X.; Yang, J.; Guo, A.D.; Su, M.; Tian, C. The influences of 2D/3D urban morphology on land surface temperature at the block scale in Chinese megacities. Urban Clim. 2023, 49, 101553. [Google Scholar] [CrossRef]
- Saleh, S.K.; Sanaei, A.; Amoushahi, S.; Ranjbar, S. Effect of landscape pattern changes and environmental indices on land surface temperature in a fragile ecosystem in southeastern Iran. Environ. Sci. Pollut. Res. 2023, 30, 34037–34053. [Google Scholar] [CrossRef]
- Zhou, D.C.; Li, D.; Sun, G.; Zhang, L.X.; Liu, Y.Q.; Hao, L. Contrasting effects of urbanization and agriculture on surface temperature in eastern China. J. Geophys. Res.-Atmos. 2016, 121, 9597–9606. [Google Scholar] [CrossRef]
- Sun, M.; Qiu, J.; Wang, N.; Ye, J.H.; Li, M.S. Predicting Land Surface Temperature and Land Cover Changes Based on Multisource Remote Sensing Spatio-Temporal Fusion in Hefei, Eastern China. IEEE J. Sel. Top. Appl. Earth Observ. Remote Sens. 2023, 16, 8764–8781. [Google Scholar] [CrossRef]
- Du, J.; Song, K.S.; Yan, B.H. Impact of the Zhalong Wetland on Neighboring Land Surface Temperature Based on Remote Sensing and GIS. Chin. Geogr. Sci. 2019, 29, 798–808. [Google Scholar] [CrossRef]
- Li, Y.; Hou, J.; Huang, C. Spatial Downscaling Land Surface Temperature based on Copula. Remote Sens. Technol. Appl. 2017, 32, 818–824. [Google Scholar]
- Hu, Y.X.; Tang, R.L.; Jiang, X.G.; Li, Z.L.; Jiang, Y.Z.; Liu, M. Spatial downscaling of land surface temperature based on surface energy balance. In Proceedings of the IEEE International Geoscience and Remote Sensing Symposium (IGARSS), Waikoloa, HI, USA, 26 September–2 October 2020; pp. 4926–4929. [Google Scholar]
- Crosson, W.L.; Al-Hamdan, M.Z.; Hemmings, S.N.J.; Wade, G.M. A daily merged MODIS Aqua-Terra land surface temperature data set for the conterminous United States. Remote Sens. Environ. 2012, 119, 315–324. [Google Scholar] [CrossRef]
- Coops, N.C.; Duro, D.C.; Wulder, M.A.; Han, T. Estimating afternoon MODIS land surface temperatures (LST) based on morning MODIS overpass, location and elevation information. Int. J. Remote Sens. 2007, 28, 2391–2396. [Google Scholar] [CrossRef]
- Zhang, Z.M.; He, G.J.; Wang, M.M.; Long, T.F.; Wang, G.Z.; Zhang, X.M.; Jiao, W.L. Towards an operational method for land surface temperature retrieval from Landsat 8 data. Remote Sens. Lett. 2016, 7, 279–288. [Google Scholar] [CrossRef]
- Njuki, S.M.; Mannaerts, C.M.; Su, Z.B. An Improved Approach for Downscaling Coarse-Resolution Thermal Data by Minimizing the Spatial Averaging Biases in Random Forest. Remote Sens. 2020, 12, 3507. [Google Scholar] [CrossRef]
- Yang, Y.B.; Li, X.L.; Pan, X.; Zhang, Y.; Cao, C. Downscaling Land Surface Temperature in Complex Regions by Using Multiple Scale Factors with Adaptive Thresholds. Sensors 2017, 17, 744. [Google Scholar] [CrossRef]
- Quan, J.; Zhan, W.; Chen, Y.; Liu, W. Downscaling remotely sensed land surface temperatures: A comparison of typical methods. J. Remote Sens. 2013, 17, 361–387. [Google Scholar]
- Liu, Y.; Zhu, R.; Qian, J.; Dang, C.; Yue, H. Land Surface Temperature Downscaling Based on Multiple Factors. Remote Sens. Inf. 2020, 35, 6–18. [Google Scholar]
- Kustas, W.P.; Norman, J.M.; Anderson, M.C.; French, A.N. Estimating subpixel surface temperatures and energy fluxes from the vegetation index-radiometric temperature relationship. Remote Sens. Environ. 2003, 85, 429–440. [Google Scholar] [CrossRef]
- Agam, N.; Kustas, W.P.; Anderson, M.C.; Li, F.Q.; Neale, C.M.U. A vegetation index based technique for spatial sharpening of thermal imagery. Remote Sens. Environ. 2007, 107, 545–558. [Google Scholar] [CrossRef]
- Mukherjee, S.; Joshi, P.K.; Garg, R.D. Evaluation of LST downscaling algorithms on seasonal thermal data in humid subtropical regions of India. Int. J. Remote Sens. 2015, 36, 2503–2523. [Google Scholar] [CrossRef]
- Ma, J.; Yang, X.J.; Zhou, X.B.; Zhou, J. A practical method for downscaling land surface temperature with temporal and spatial information: A case study in a desert oasis. In Proceedings of the IEEE International Geoscience and Remote Sensing Symposium (IGARSS), Kuala Lumpur, Malaysia, 17–22 July 2022; pp. 3656–3659. [Google Scholar]
- Jiang, H.T.; Shen, H.F. SMOS soil moisture downscaling based on back propagation neural network with MODIS LST and EVI. In Proceedings of the 36th IEEE International Geoscience and Remote Sensing Symposium (IGARSS), Beijing, China, 10–15 July 2016; pp. 1659–1662. [Google Scholar]
- Wu, J.H.; Zhong, B.; Tian, S.F.; Yang, A.X.; Wu, J.J. Downscaling of Urban Land Surface Temperature Based on Multi-Factor Geographically Weighted Regression. IEEE J. Sel. Top. Appl. Earth Observ. Remote Sens. 2019, 12, 2897–2911. [Google Scholar] [CrossRef]
- Liu, H.M.; Li, M.; Zhan, Q.M.; Ma, Z.Y.; He, B.J. Homogeneity and heterogeneity of diurnal and nocturnal hotspots and the implications for synergetic mitigation in heat-resilient urban planning. Comput. Environ. Urban Syst. 2025, 117, 102241. [Google Scholar] [CrossRef]
- Yang, G.J.; Pu, R.L.; Zhao, C.J.; Huang, W.J.; Wang, J.H. Estimation of subpixel land surface temperature using an endmember index based technique: A case examination on ASTER and MODIS temperature products over a heterogeneous area. Remote Sens. Environ. 2011, 115, 1202–1219. [Google Scholar] [CrossRef]
- Firozjaei, M.K.; Mijani, N.; Kiavarz, M.; Duan, S.B.; Atkinson, P.M.; Alavipanah, S.K. A novel surface energy balance-based approach to land surface temperature downscaling. Remote Sens. Environ. 2024, 305, 114087. [Google Scholar] [CrossRef]
- Yang, C.; Zhan, Q.M.; Lv, Y.Z.; Liu, H.M. Downscaling Land Surface Temperature Using Multiscale Geographically Weighted Regression Over Heterogeneous Landscapes in Wuhan, China. IEEE J. Sel. Top. Appl. Earth Observ. Remote Sens. 2019, 12, 5213–5222. [Google Scholar] [CrossRef]
- Uhrin, A.; Onacillová, K. Spatiotemporal analysis of land surface temperature and land cover changes in Prešov city using downscaling approach and machine learning algorithms. Environ. Monit. Assess. 2025, 197, 126. [Google Scholar] [CrossRef]
- Gao, J.H.; Sun, H.; Xu, Z.H.; Zhang, T.; Xu, H.Y.; Wu, D.; Zhao, X. CPMF: An Integrated Technology for Generating 30-m, All-Weather Land Surface Temperature by Coupling Physical Model, Machine Learning, and Spatiotemporal Fusion Model. IEEE Trans. Geosci. Remote Sens. 2024, 62, 5008216. [Google Scholar] [CrossRef]
- Li, W.; Ni, L.; Li, Z.L.; Duan, S.B.; Wu, H. Evaluation of Machine Learning Algorithms in Spatial Downscaling of MODIS Land Surface Temperature. IEEE J. Sel. Top. Appl. Earth Observ. Remote Sens. 2019, 12, 2299–2307. [Google Scholar] [CrossRef]
- Li, S.Y.; Wan, H.; Yu, Q.; Wang, X.Y. Downscaling of ERA5 reanalysis land surface temperature based on attention mechanism and Google Earth Engine. Sci. Rep. 2025, 15, 675. [Google Scholar] [CrossRef] [PubMed]
- Li, Y.K.; He, Q.; Liu, Y.Q.; Yan, Y.; Zhang, H.L.; Tan, J. A Physically Constrained Downscaling Framework for Hourly, All-Sky Land Surface Temperature in Mountainous Regions. IEEE J. Sel. Top. Appl. Earth Observ. Remote Sens. 2025, 18, 8151–8174. [Google Scholar] [CrossRef]
- Hoang, N.D.; Pham, P.A.H.; Huynh, T.C.; Cao, M.T.; Bui, D.T. Geospatial urban heat mapping with interpretable machine learning and deep learning: A case study in Hue City, Vietnam. Earth Sci. Inform. 2025, 18, 64. [Google Scholar] [CrossRef]
- Li, W.S.; Yang, C.; Peng, Y.D.; Zhang, X.Y. A Multi-Cooperative Deep Convolutional Neural Network for Spatiotemporal Satellite Image Fusion. IEEE J. Sel. Top. Appl. Earth Observ. Remote Sens. 2021, 14, 10174–10188. [Google Scholar] [CrossRef]
- Liu, X.; Deng, C.W.; Chanussot, J.; Hong, D.F.; Zhao, B.J. StfNet: A Two-Stream Convolutional Neural Network for Spatiotemporal Image Fusion. IEEE Trans. Geosci. Remote Sens. 2019, 57, 6552–6564. [Google Scholar] [CrossRef]
- Tan, Z.Y.; Yue, P.; Di, L.P.; Tang, J.M. Deriving High Spatiotemporal Remote Sensing Images Using Deep Convolutional Network. Remote Sens. 2018, 10, 1066. [Google Scholar] [CrossRef]
- Adeyeri, O.E.; Folorunsho, A.H.; Ayegbusi, K.I.; Bobde, V.; Adeliyi, T.E.; Ndehedehe, C.E.; Akinsanola, A.A. Land surface dynamics and meteorological forcings modulate land surface temperature characteristics. Sustain. Cities Soc. 2024, 101, 105072. [Google Scholar] [CrossRef]
- Li, C.R.; Chen, F.; Wang, N.; Yu, B.; Wang, L. SDGSAT-1 nighttime light data improve village-scale built-up delineation. Remote Sens. Environ. 2023, 297, 113764. [Google Scholar] [CrossRef]
- Zhong, B.; Ma, P.; Nie, A.H.; Yang, A.X.; Yao, Y.J.; Lü, W.B.; Zhang, H.; Liu, Q.H. Land cover mapping using time series HJ-1/CCD data. Sci. China-Earth Sci. 2014, 57, 1790–1799. [Google Scholar] [CrossRef]
- Zhong, B.; Yang, A.X.; Nie, A.H.; Yao, Y.J.; Zhang, H.; Wu, S.L.; Liu, Q.H. Finer Resolution Land-Cover Mapping Using Multiple Classifiers and Multisource Remotely Sensed Data in the Heihe River Basin. IEEE J. Sel. Top. Appl. Earth Observ. Remote Sens. 2015, 8, 4973–4992. [Google Scholar] [CrossRef]
- Li, X.; Liu, S.M.; Xiao, Q.; Ma, M.G.; Jin, R.; Che, T.; Wang, W.Z.; Hu, X.L.; Xu, Z.W.; Wen, J.G.; et al. A multiscale dataset for understanding complex eco-hydrological processes in a heterogeneous oasis system. Sci. Data 2017, 4, 170083. [Google Scholar] [CrossRef] [PubMed]
- Li, N.; Xu, J.H.; Li, X.; Qin, B.X.; Wang, Y.P.; Fu, D.J.; Zhong, K.W.; Qin, Z.H. A Novel Land Surface Temperature Retrieval Algorithm for SDGSAT-1 Images. IEEE Trans. Geosci. Remote Sens. 2025, 63, 5000218. [Google Scholar] [CrossRef]
- Carlos, H.; Moctezuma, D.; Nava, J. Super-Resolution of LiDAR Data Using EDSR-CBAM Neural Networks. In Proceedings of the 3rd International Conference on Geospatial Information Sciences (iGISc), Mexico, Mexico, 14–17 November 2023; pp. 135–146. [Google Scholar]
- Ward, C.M.; Harguess, J.; Crabb, B.; Parameswaran, S. Image quality assessment for determining efficacy and limitations of Super-Resolution Convolutional Neural Network (SRCNN). arXiv 2019, arXiv:1905.05373. [Google Scholar]
- Zeng, K.; Lin, H.J.; Yan, Z.Q.; Fang, J.S. Densely Connected Transformer With Linear Self-Attention for Lightweight Image Super-Resolution. IEEE Trans. Instrum. Meas. 2023, 72, 5023112. [Google Scholar] [CrossRef]
- Chen, L.W.; Hu, B.T.; Sun, J.X.; Xu, Y.J.; Zhang, G.X.; Ma, H.B.; Ren, J.Q. Using remote sensing and machine learning to generate 100-cm soil moisture at 30-m resolution for the black soil region of China: Implication for agricultural water management. Agric. Water Manag. 2025, 309, 109353. [Google Scholar] [CrossRef]
- Li, M.Q.; Wang, P.X.; Tansey, K.; Sun, Y.F.; Guo, F.W.; Zhou, J. Improved field-scale drought monitoring using MODIS and Sentinel-2 data for vegetation temperature condition index generation through a fusion framework. Comput. Electron. Agric. 2025, 234, 110256. [Google Scholar] [CrossRef]
- Zhang, T.T.; Zhang, H.Y.; Wang, Y.Q.; Xiong, T.; Wang, M.Y.; Zhang, Z.X.; Guo, X.Y.; Zhao, J.J. A Global Extended MODIS-Compatible NDVI Dataset. IEEE J. Sel. Top. Appl. Earth Observ. Remote Sens. 2025, 18, 8390–8398. [Google Scholar] [CrossRef]


| w (g·cm−2) | B0 | B1 | B2 | B3 | B4 | B5 | B6 |
|---|---|---|---|---|---|---|---|
| 0–1.5 | −8.85 | 0.03 | 1.85 | −0.78 | 0.00 | 0.31 | −0.14 |
| 1–2.5 | 17.33 | −0.02 | 2.33 | −1.25 | 0.00 | 0.34 | −0.16 |
| 2–3.5 | −17.10 | 0.22 | 2.76 | −1.91 | 0.02 | 0.30 | −0.17 |
| 3–4.5 | −17.05 | 0.35 | 3.17 | −2.46 | 0.02 | 0.24 | −0.13 |
| 4–5.5 | −25.05 | 0.45 | 3.42 | −2.79 | 0.03 | 0.19 | −0.09 |
| 5–6.5 | −38.74 | 0.31 | 4.25 | −3.43 | 0.01 | 0.16 | −0.06 |
| Method | MAE (K) | RMSE (K) | PNSR (K) |
|---|---|---|---|
| LINEAR | 0.640 | 1.123 | 34.01 |
| EDSR | 0.665 | 1.060 | 34.52 |
| SRCNN | 0.656 | 1.161 | 33.73 |
| DCTLSA | 0.850 | 1.220 | 33.29 |
| DDPM | 0.517 | 0.666 | 38.55 |
| IGDM | 0.376 | 0.547 | 40.27 |
| Method | MAE (K) | RMSE (K) | PNSR (K) |
|---|---|---|---|
| DDPM | 0.517 | 0.666 | 38.55 |
| IGDM_NDVI | 0.376 | 0.547 | 40.27 |
| IGDM_NDWI | 0.435 | 0.613 | 38.81 |
| IGDM_NDVI_NDWI | 0.590 | 0.796 | 37.01 |
Disclaimer/Publisher’s Note: The statements, opinions and data contained in all publications are solely those of the individual author(s) and contributor(s) and not of MDPI and/or the editor(s). MDPI and/or the editor(s) disclaim responsibility for any injury to people or property resulting from any ideas, methods, instructions or products referred to in the content. |
© 2025 by the authors. Licensee MDPI, Basel, Switzerland. This article is an open access article distributed under the terms and conditions of the Creative Commons Attribution (CC BY) license (https://creativecommons.org/licenses/by/4.0/).
Share and Cite
Wang, J.; Fu, Z.; Tang, B.; Xu, J. Information-Guided Diffusion Model for Downscaling Land Surface Temperature from SDGSAT-1 Remote Sensing Images. Remote Sens. 2025, 17, 1669. https://doi.org/10.3390/rs17101669
Wang J, Fu Z, Tang B, Xu J. Information-Guided Diffusion Model for Downscaling Land Surface Temperature from SDGSAT-1 Remote Sensing Images. Remote Sensing. 2025; 17(10):1669. https://doi.org/10.3390/rs17101669
Chicago/Turabian StyleWang, Jianxin, Zhitao Fu, Bohui Tang, and Jianhui Xu. 2025. "Information-Guided Diffusion Model for Downscaling Land Surface Temperature from SDGSAT-1 Remote Sensing Images" Remote Sensing 17, no. 10: 1669. https://doi.org/10.3390/rs17101669
APA StyleWang, J., Fu, Z., Tang, B., & Xu, J. (2025). Information-Guided Diffusion Model for Downscaling Land Surface Temperature from SDGSAT-1 Remote Sensing Images. Remote Sensing, 17(10), 1669. https://doi.org/10.3390/rs17101669