Article

Assessing the Combined Impact of Land Surface Temperature and Droughts to Heatwaves over Europe Between 2003 and 2023

by
Foteini Karinou
,
Ilias Agathangelidis
and
Constantinos Cartalis
*
Department of Physics, National and Kapodistrian University of Athens, 15784 Athens, Greece
*
Author to whom correspondence should be addressed.
Remote Sens. 2025, 17(9), 1655; https://doi.org/10.3390/rs17091655
Submission received: 15 March 2025 / Revised: 2 May 2025 / Accepted: 6 May 2025 / Published: 7 May 2025

Abstract

:
The increasing frequency, intensity, and duration of heatwaves and droughts pose significant societal and environmental challenges across Europe. This study analyzes land surface temperature (LST) observations from the Moderate Resolution Imaging Spectroradiometer (MODIS) between 2003 and 2023 to identify thermal anomalies associated with heatwaves. Additionally, this study examines the role of different land cover types in modulating heatwave impacts, employing turbulent flux observations from micrometeorological towers. The interaction between heatwaves and droughts is further explored using the Standardized Precipitation Evapotranspiration Index (SPEI) and soil moisture data, highlighting the amplifying role of water stress through land–atmosphere feedbacks. The results reveal a statistically significant upward trend in LST-derived thermal anomalies, with the 2022 heatwave identified as the most extreme event, when approximately 75% of Europe experienced strong positive anomalies. On average, 91% of heatwave episodes identified in reanalysis-based air temperature records coincided with LST-defined anomaly events, confirming LST as a robust proxy for heatwave detection. Flux tower observations show that, during heatwaves, evergreen coniferous and mixed forests predominantly enhance sensible heat fluxes (mean anomalies during midday of 74 W/m2 and 62 W/m2, respectively), while grasslands exhibit increased latent heat flux (89 W/m2). Notably, under extreme compound heat–drought conditions, this pattern reverses for grassed sites due to rapid soil moisture depletion. Overall, the findings underscore the combined influence of surface temperature and drought in driving extreme heat events and introduce a novel, multi-source approach that integrates satellite, reanalysis, and ground-based data to assess heatwave dynamics across scales.

Graphical Abstract

1. Introduction

In a rapidly warming climate, heatwaves are projected to become more frequent, longer-lasting, and more intense [1]. Already, recent decades have witnessed an exceptional rise in the number and severity of heatwave events worldwide [2]. At the same time, rising temperatures and increasing atmospheric evaporative demand—exacerbated by anthropogenic factors such as land and water management—have contributed to a marked intensification of droughts [3,4,5]. These climate extremes have far-reaching consequences, severely impacting human health, economic activity, societies, and natural ecosystems [6,7]. Over the past decade, heatwaves and droughts have increasingly been studied as compound events [8], given their frequent co-occurrence and the interplay of their drivers across multiple spatial and temporal scales [9].
Heatwaves are typically detected using near-surface air temperature (Tair) observations from ground-based weather stations, recorded at a standard height of 2 m. These in situ measurements provide long-term continuity and form the basis of most threshold-based heatwave definitions [10]. However, their uneven spatial distribution—especially across remote or under-monitored regions—poses significant limitations for large-scale analyses. To address these spatial gaps, gridded global datasets and reanalysis products are often employed to characterize heatwave patterns and trends over broader areas [11].
A complementary and increasingly employed data source is satellite-derived land surface temperature (LST), recognized recently as an Essential Climate Variable [12]. LST represents the skin temperature of the Earth’s surface and plays a central role in land–atmosphere interactions by influencing the surface energy exchange, water balance, and longwave radiation [13,14]. Compared to in situ or reanalysis data, LST offers key advantages, such as extensive spatial coverage, finer resolution, and consistent temporal availability. These attributes make it particularly well-suited for detecting localized heat extremes and understanding their spatial dynamics. Several recent studies have demonstrated the value of LST in identifying and characterizing heat extremes [15]. Mildrexler et al. [16] showed that annual LST anomalies robustly capture major global heatwave events. Agathangelidis et al. [17] found strong spatial and temporal alignment between LST anomalies and heatwaves identified from Tair records in the Mediterranean, while Martins et al. [18] utilized LST data from Land Surface Analysis Satellite Applications Facility (LSA SAF) to examine the unprecedented heatwave of summer 2022 over Europe.
While large-scale synoptic conditions are the primary drivers of heatwaves, air–surface interactions influence them through diabatic effects, upper level divergence, or the intensification of thermal lows [9]. In particular, land–atmosphere feedbacks play a crucial role in amplifying heat extremes. For instance, antecedent springtime droughts can precondition the land surface for more intense summer heatwaves by reducing soil moisture availability [18]. During heatwave episodes, the associated synoptic conditions often produce clear skies and elevated vapor pressure deficits, which in turn enhance soil evaporation and vegetation transpiration. These processes lead to a depletion of surface moisture and an increase in sensible heat flux, thereby reinforcing surface warming in a self-amplifying feedback loop [19,20]. This positive feedback mechanism—typically referred to as land–atmosphere coupling—operates most strongly under dry conditions, where reduced evapotranspiration leads to higher near-surface temperatures, further intensifying evaporative demand and depleting remaining soil moisture reserves [21].
Given the amplifying role of soil moisture deficits and evapotranspiration constraints during heatwaves, monitoring drought conditions is essential for understanding compound heat–drought extremes [22]. Multiple drought indices have been developed and are employed to describe and monitor drought conditions [23]. Among them, the Standardized Precipitation Index (SPI) is widely used to assess precipitation anomalies across various timescales, although it does not account for atmospheric evaporative demand. The Standardized Precipitation-Evapotranspiration Index (SPEI) addresses this limitation by integrating temperature-driven evaporative processes, making it more suitable under changing climatic conditions [24]. Additionally, direct soil moisture assessments are critical for agricultural drought monitoring, offering insights often unavailable from meteorological drought indices alone [25].
Several gridded datasets have been developed recently to support long-term drought assessments. While early products such as SPEIbase [26] and the GPCC Drought Index [27] offer global-scale coverage at relatively coarse resolution, more recent datasets, such as global 5 km SPEI product [24] and drought indices derived from ERA5 reanalysis [28], provide enhanced spatial detail and reliability. Long-term drought reconstructions using the Standardized Deficit Index have also revealed the magnitude and recurrence of extreme drought events in Europe, such as those in 2003 and 2015 [29]. Finally, satellite-derived LST and related indices, including the Temperature Condition Index (TCI) [30] and the Vegetation Temperature Condition Index (VTCI) [31], offer valuable proxies for monitoring surface water stress at high resolution, especially in regions with sparse ground-based observations [15].
While heat and drought extremes have received substantial attention in recent years, several critical research gaps remain. Notably, there is a lack of integrated frameworks that combine satellite-derived LST, drought indices, and flux tower observations for the comprehensive assessment of compound heat–drought events.
Despite the advantages of LST, such as high spatial resolution and continuity, it remains relatively underexplored in climatological studies of extreme heat [15]. Previous research has predominantly focused on isolated case studies, such as individual exceptionally warm summers [18,32], specific weather stations [17], or flux tower sites [33], limiting broader generalization [16]. Moreover, the detection of heatwaves based on multi-day composite LST data has tended to emphasize longer-duration events, potentially missing short-lived but intense episodes. Additionally, short temporal coverage in earlier studies has restricted the ability to evaluate long-term trends robustly [16]. Regarding drought-related processes, integration with thermal and eddy covariance observations remains limited. While previous research has shown that evapotranspiration becomes constrained primarily at low moisture levels [33], uncertainties persist due to the limited availability of long-term eddy covariance records [34] and the insufficient investigation of surface energy partitioning during compound extremes. It remains also an open question whether these land–atmosphere feedback mechanisms behave similarly under the increasingly severe heat extremes observed across Europe in recent years. Finally, few studies provide long-term, Europe-wide analyses that also explore localized surface–atmosphere interactions in detail.
In this study, we introduce a novel framework that integrates satellite-derived LST, reanalysis data, drought indices, and eddy covariance flux observations to investigate the spatiotemporal dynamics of heat extremes across Europe. Leveraging a 21-year daily record of MODIS LST observations, we first assess its capability to detect the occurrence, intensity, and spatial patterns of large-scale heatwave events. By systematically integrating LST anomalies with reanalysis-based air temperature and drought indicators, we provide a pan-European perspective on compound heat–drought conditions. Next, we perform a focused assessment at selected flux tower locations from the Integrated Carbon Observation System (ICOS) network and the Urban-PLUMBER project, evaluating how LST reflects low- and high-intensity heat extremes. Finally, we examine thermal anomalies in conjunction with shifts in energy partitioning during extreme events, using long-term eddy covariance data. A novel aspect of our approach is the multi-scale integration of satellite, reanalysis, and ground-based data, enabling both continental-scale mapping and site-specific analyses. This combined, cross-scale methodology offers a new perspective for characterizing compound climate extremes and demonstrates the underutilized potential of LST in climate diagnostics.

2. Materials and Methods

2.1. Study Area

This study focuses on the European continent, with particular attention on its major geographical zones as defined by the PRUDENCE (Prediction of Regional scenarios and Uncertainties for Defining EuropeaN Climate change risk and Effects) project (Figure 1). In recent decades, Europe has been increasingly affected by prolonged and severe heatwaves [35], with stronger positive trends in frequency and intensity compared to other mid-latitude regions [36]. The dominant meteorological drivers in western, central, and northern Europe include persistent quasi-stationary high-pressure systems and atmospheric blocking events [20]. In contrast, heatwaves in the central and eastern Mediterranean are less frequently associated with such omega-like blocking patterns and are more strongly influenced by warm air advection from northern Africa [19]. Local land surface processes also play a critical role in modulating the intensity and duration of heatwaves in Europe [37]. More broadly, drought has emerged as one of the most impactful hazards in Europe over the past two decades and is projected to intensify further in the 21st century [38].

2.2. Data

This study employed a diverse set of datasets to investigate the dynamics of heatwaves and droughts dynamics across Europe. These include satellite-derived LST observations, air temperature reanalysis products, drought indices, and flux tower measurements. A summary of the datasets used is provided in Table 1, while detailed descriptions of each data source are presented below.
For the satellite-based part of the study, we used the MODIS Aqua Land Surface Temperature/Emissivity Daily dataset (MYD11A1, Version 6.1) for the period 2003–2023. This dataset provides daily daytime and nighttime LST observations, at a spatial resolution of 1 km, derived using a Generalized Split-Window (GSW) algorithm applied to thermal bands 31 and 32 [39]. This operational algorithm compensates for atmospheric radiative attenuation by incorporating parameters such as the sensor’s zenith viewing angle and the vertical water vapor profile. Surface emissivity is assumed to be known a priori based on a land cover classification [40] (Figure 2). As auxiliary data, we incorporated the MODIS Thermal Anomalies/Fire product (MYD14A1, Version 6.1), which provides daily fire mask composites based on the MODIS 4 and 11 µm channels. To analyze prolonged heat waves, we also utilized the 8-day products of LST and Thermal Anomalies/Fire composites (MYD11A2 and MYD14A2, respectively). All MODIS products were accessed via the Google Earth Engine platform [41].
To complement the satellite-derived LST data, we included near-surface air temperature from the ERA5-Land reanalysis product. Specifically, we used daily maximum 2 m air temperature data at 9 km spatial resolution, produced by the European Centre for Medium-Range Weather Forecasts (ECMWF) based on ERA5 atmospheric forcing.
Drought conditions were assessed using the global high-resolution Standardized Precipitation Evaporation Index (SPEI) dataset (SPEI-HR), which offers a monthly temporal resolution and a 5 km spatial resolution [24]. This product is derived from the Multi-Source Weighted-Ensemble Precipitation (MSWEP) dataset and the Bristol Potential Evapotranspiration (hPET), which is based on the FAO Penman–Monteith equation. MSWEP is a global high-resolution (0.1°) precipitation product that integrates data from over 75,000 rain gauges, satellite-based estimates, and reanalysis datasets [42]. hPET is a recently developed global dataset (0.1° spatial resolution), available for the period 1981–2022, developed based on reanalysis products [43].
To further investigate land–atmosphere interactions, we incorporated surface moisture data from the Global Land Evaporation Amsterdam Model (GLEAM) product, version 3.7b. This global dataset, available at 25 km spatial resolution and daily temporal resolution, covers the 20-year period from 2003 to 2022, and is developed using remotely sensed measurements (Martens et al., 2017 [44]). GLEAM consists of a set of algorithms that are based on observations that estimate the individual components of terrestrial evaporation, such as transpiration, interception loss, bare-soil evaporation, and open-water evaporation. Additionally, the model provides outputs such as potential evaporation, evaporative stress, and surface moisture that was used in the current study.
Finally, in situ observations of surface fluxes were included through eddy covariance flux tower measurements. A total of 79 flux tower sites were analyzed, selected based on data availability and representing diverse land cover types (Figure 1, Table 2). For natural environments, we used the “Warm Winter 2020” Level 2 data product from the Integrated Carbon Observation System (ICOS) network (https://www.icos-cp.eu/data-products/2G60-ZHAK; accessed on 10 September 2024), selected for its high data availability and rigorous quality testing. Additionally, turbulent fluxes observations from urban sites were obtained from the Urban-PLUMBER (Protocol for the Analysis of Land Surface Models Benchmarking Evaluation) project, namely using the “Harmonized gap-filled dataset from 20 urban flux tower sites” product [45]. For both datasets, sensible (QH) and latent (QE) data were extracted and preprocessed using the provided quality assurance metadata.

2.3. Methodology

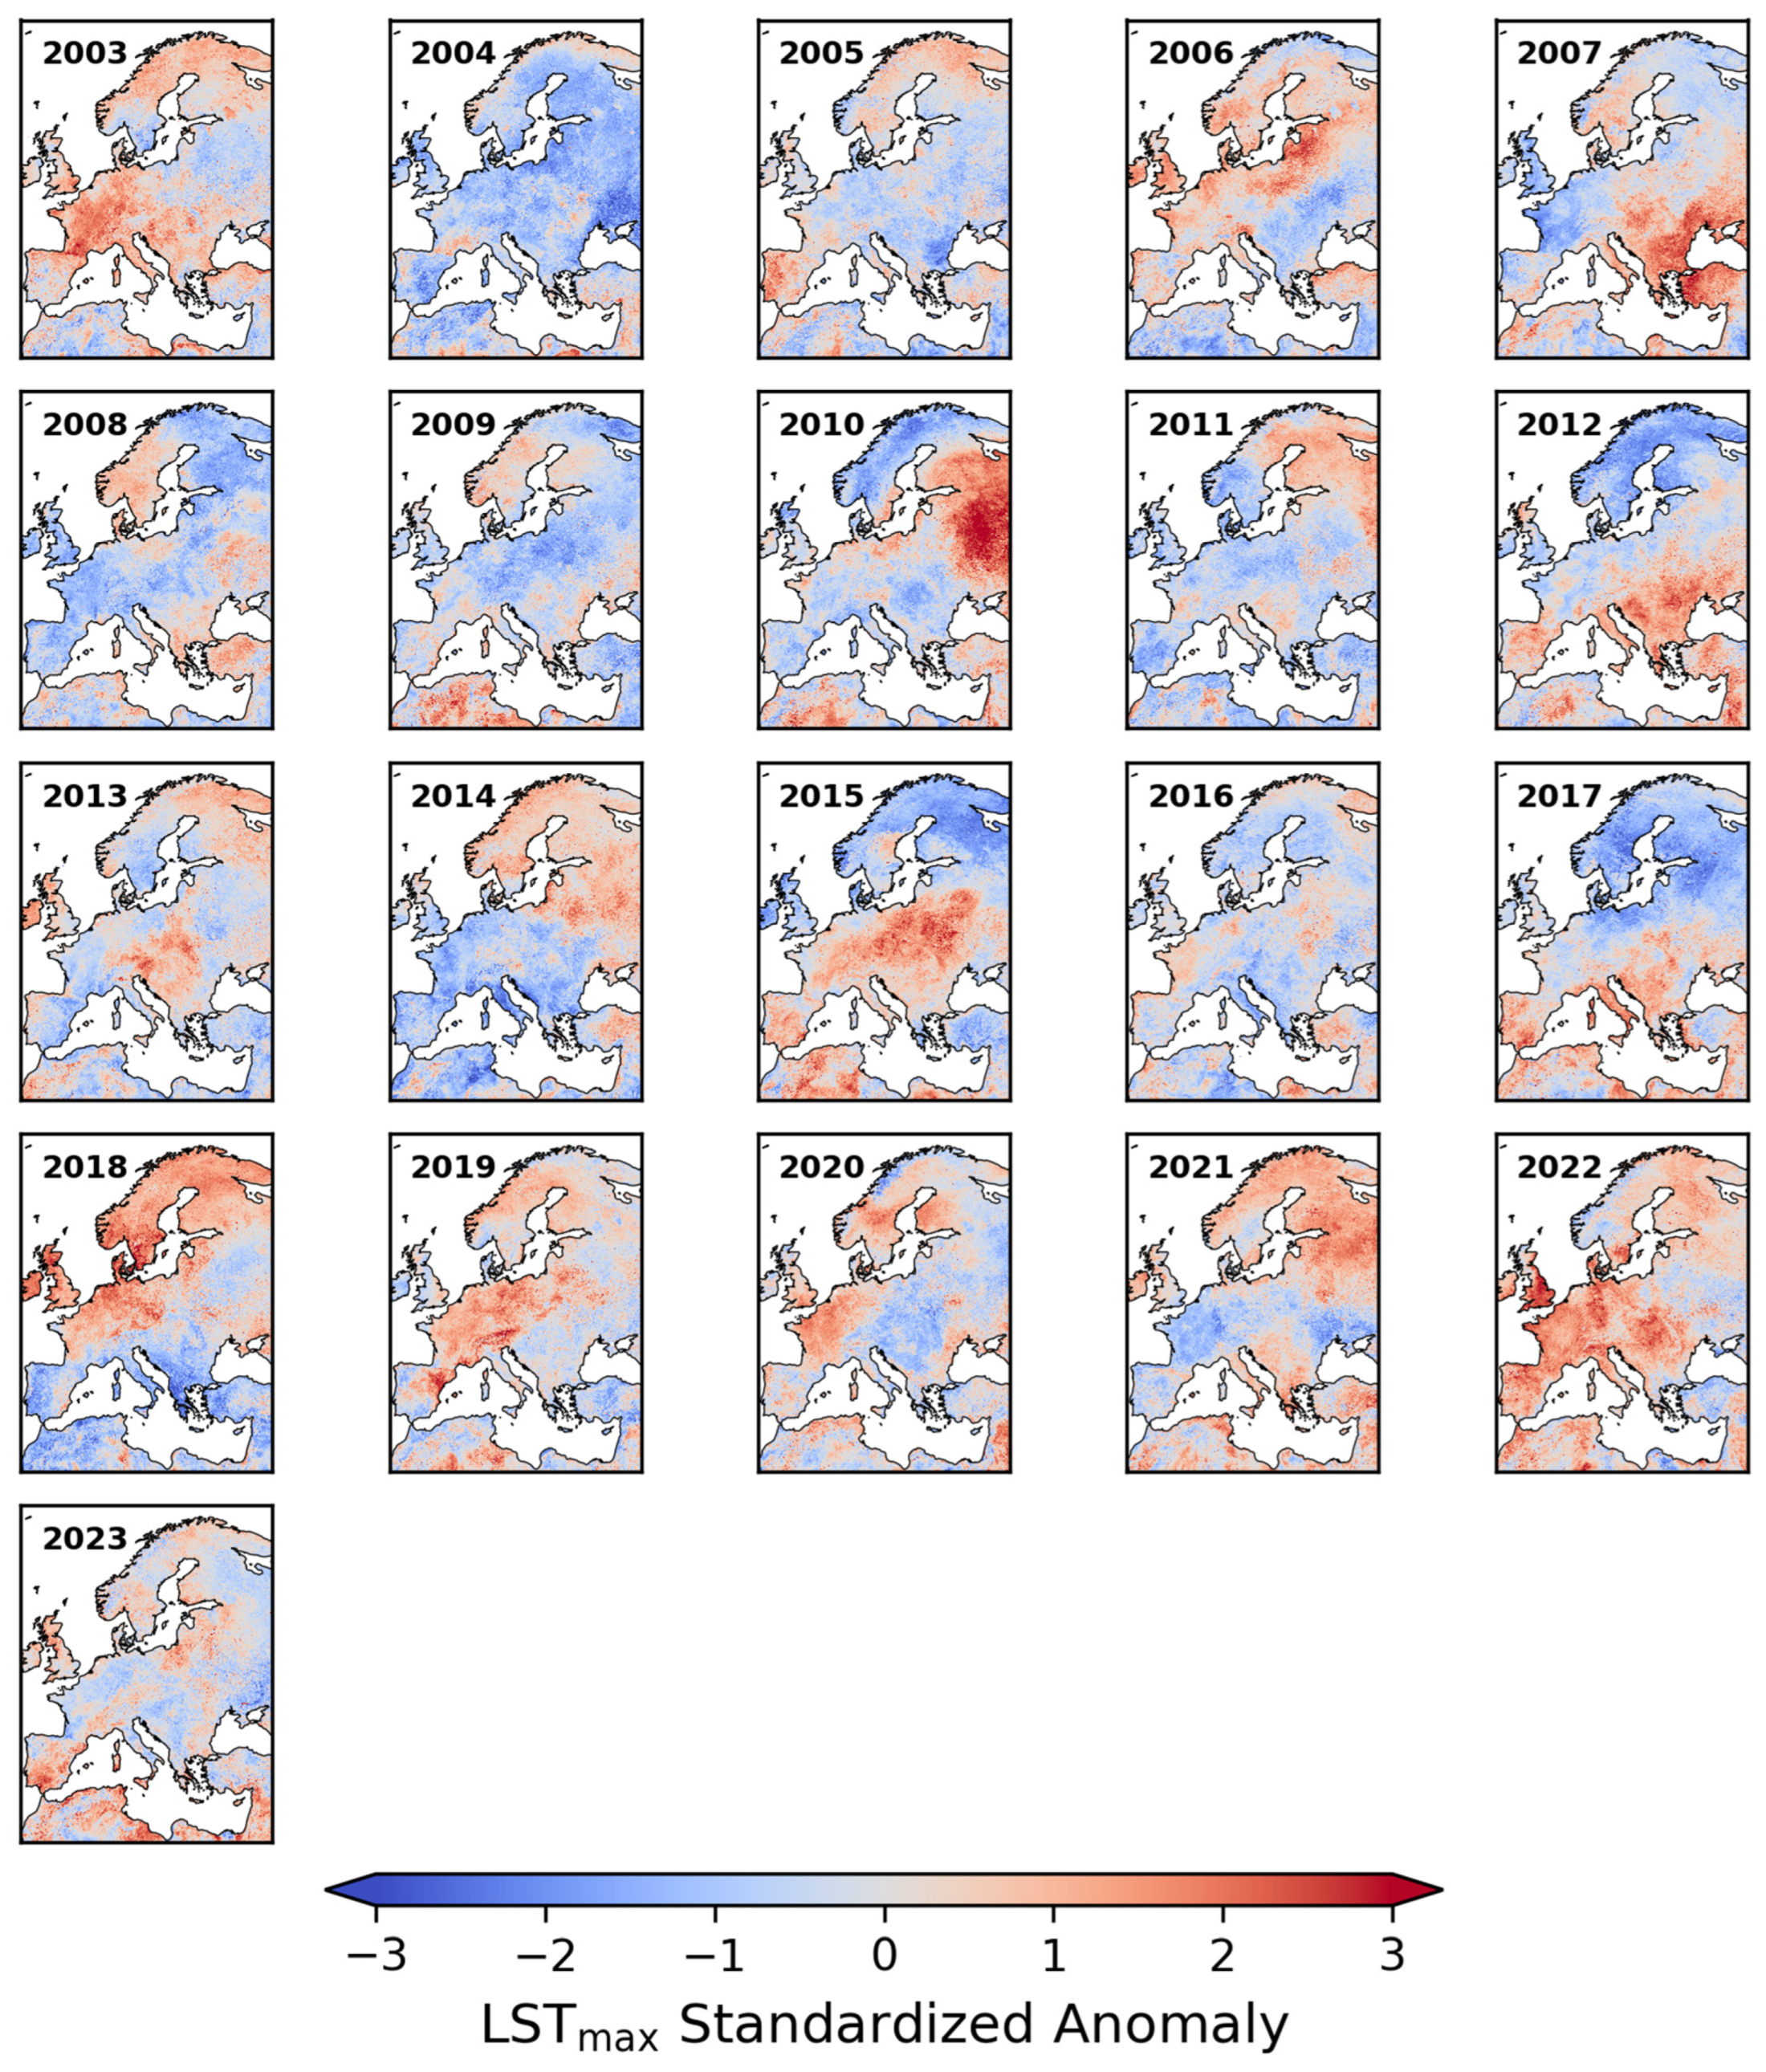
2.3.1. Calculation of Maximum Surface Temperature (LSTmax) Anomaly Indices

For the initial part of this study, we employed the Aqua/MODIS MYD11A1 LST dataset for the period 2003–2023. To ensure data quality, we implemented filtering criteria using the MODIS quality assurance band, excluding pixels affected by (a) clouds or shadows, (b) emissivity error values exceeding 0.04, and (c) LST retrieval errors greater than 2 K. To eliminate anomalously high LST values caused by active fires, we incorporate the MYD14A1 fire mask product. Building on the methodology proposed in [16], we adapted the approach to daily LST observations in order to calculate LST anomaly indices as follows:
  • Annual Maximum LST: For each pixel, the maximum LST values (LSTmax) were determined for each year using daily LST values.
  • Climatological Statistics: The mean (LSTmax,mean) and standard deviation (LSTmax,std) of all annual LSTmax values were computed for each pixel.
  • Standardized Anomaly: the standardized LSTmax anomaly was computed by subtracting the long-term (2003–2022) annual mean of LSTmax (LSTmax,mean) from the daily LSTmax values, and then dividing by the corresponding annual standard deviation (LSTmax,std):
L S T m a x , S t a n d a r d   A n o m a l y = L S T m a x L S T m a x , m e a n L S T m a x , s t d
This z-score transformation allows for inter-annual comparability and better identification of extreme events across different regions and seasons.
The same procedure was applied on a monthly basis (only for the summer season) to assess intra-seasonal variability. For the main geographical zones of Europe (Figure 1), annual and monthly statistical metrics were calculated, along with long-term trends. Additionally, both annual and monthly anomalies were derived using the 8-day composite values of Aqua MODIS to evaluate the robustness across different temporal resolutions.

2.3.2. Analysis of Heatwaves and Energy Fluxes at Specific Locations

In the second part of the study, a detailed analysis was conducted to investigate the relationship between heatwave events, LST, and surface energy fluxes from the eddy covariance flux tower sites. In contrast to the standardized LSTmax methodology described above, this analysis focuses on assessing the alignment between positive anomalies in air temperature and LST during both moderate and severe heat extremes. This approach enables a more focused understanding of land–atmosphere interactions under varying levels of thermal stress.
First, the CTX90pct heatwave index [10] was computed to detect heatwave events in the European region from 2003 to 2023 using daily maximum 2 m air temperature data from the ERA5-Land reanalysis product. According to this index, a heatwave is defined as a period of at least three consecutive days during which daily maximum temperature (Tmax) exceeds the climatological 90th percentile. These 90th percentile thresholds are computed independently for each calendar day, based on a 15-day moving window of daily Tmax values over the 1991–2020 reference period [46]. Each heatwave event is characterized by its onset date, duration and average daily Tmax. The normalized heatwave magnitude is calculated as the anomaly of the mean Tmax for a given heatwave relative to the climatological summer mean Tmax [10]. Additionally, the following annual heatwave metrics were calculated: (i) the number of heatwave events per year (heatwave number, HWN), (ii) the total sum of heatwave days per year (heatwave frequency, HWF), and (iii) the duration of the longest heatwave per year (heatwave duration, HWD). Only heatwave events occurring during the summer period (June–August) were considered in the analysis.
A similar percentile-based approach was then applied for satellite LST data, where heat extremes were identified as periods with positive anomalies. This was based on various percentile thresholds (80th, 85th, 90th, and 95th) and minimum duration criteria (1, 2, and 3 days), as developed in Agathangelidis et al. (2022) [17]. Given the frequent data gaps in the LST timeseries caused by cloud coverage, particularly in central and northern Europe, a joint analysis of Aqua and Terra (MOD11A1 product, Version 6.1) was also assessed here to increase daily data availability. Subsequently, the correlation between LST anomalies and heat events was quantified. Specifically, the percentage of agreement between the two datasets (Tmax and LST) was calculated, defined as the percentage of heatwaves (both discrete events and individual days) that were also identified as LST extreme heat anomalies.
From both datasets, half-hourly sensible heat (QH) and latent heat (QE) fluxes were extracted and filtered based on the provided quality control metadata. For each flux tower site coordinates, the corresponding LST and air temperature data were obtained from MODIS and ERA5-Land, respectively. To capture the period most susceptible to soil moisture depletion, aggregated daily mean flux values were computed for specific local time windows. Additionally, mean QH and QE flux values were calculated under both typical conditions and heatwave events, along with their corresponding anomaly values.

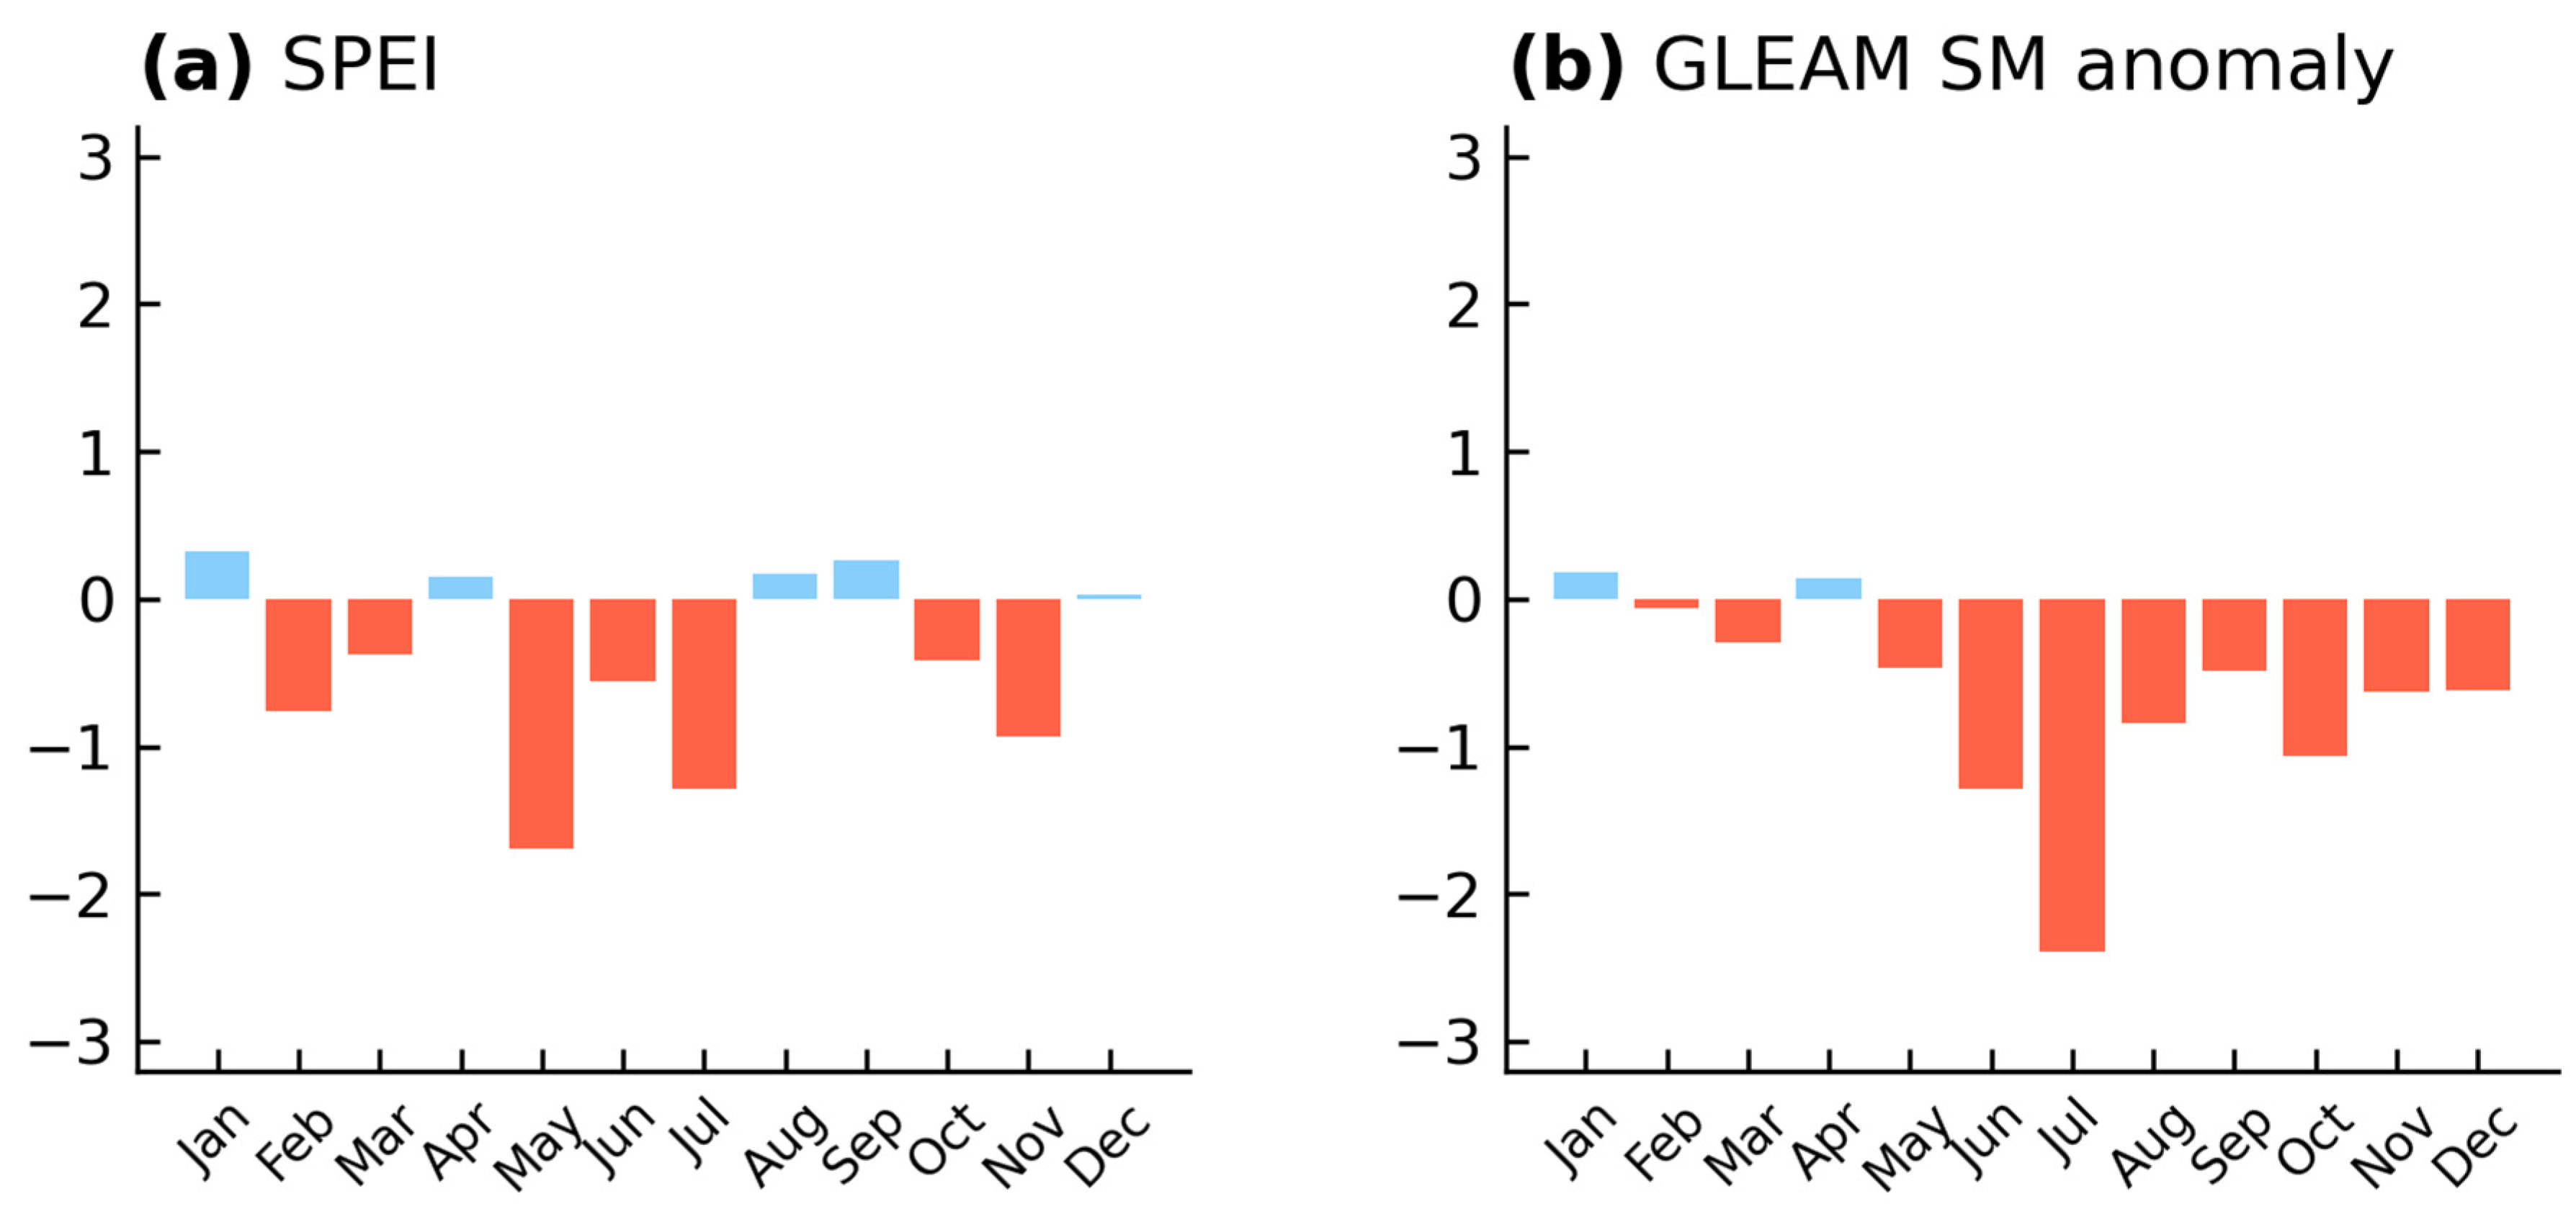
2.3.3. Drought Detection

Negative (positive) values of SPEI indicate dry (wet) conditions. As SPEI is expressed in z scores, a value of −3.0 corresponds to a drought event three standard deviations below the mean. In this study, we define three levels of drought severity, ranging from moderate to severe and extreme, using the following thresholds: [−1.0, −1.42), [−1.43, −1.82), and <−1.83 [24]. Soil moisture (SM) data from the GLEAM model are standardized by subtracting the long-term mean and dividing by the standard deviation. This normalization facilitates direct comparison across datasets and supports a consistent assessment framework. Compound drought and heatwave events (CDHWs) are defined as heatwaves that occur under drought conditions, identified by the concurrent exceedance of both variables [47]. The CDHWs can therefore be treated as a binary outcome [48]:
Z = 1 ,   X x 0   a n d   Y > y 0 0 ,   o t h e r s
where X and Y represent indicators of droughts and heatwaves, respectively, while x0 and y0 represent the corresponding threshold values.
In cases where a single drought period overlaps with multiple heatwave occurrences, each instance is considered a separate CDHW. To characterize CDHWs, we derive the following drought-related indicators: (i) the number of drought events per year (ii) the total number of drought days per year, and (iii) the duration of the longest drought per year.

3. Results

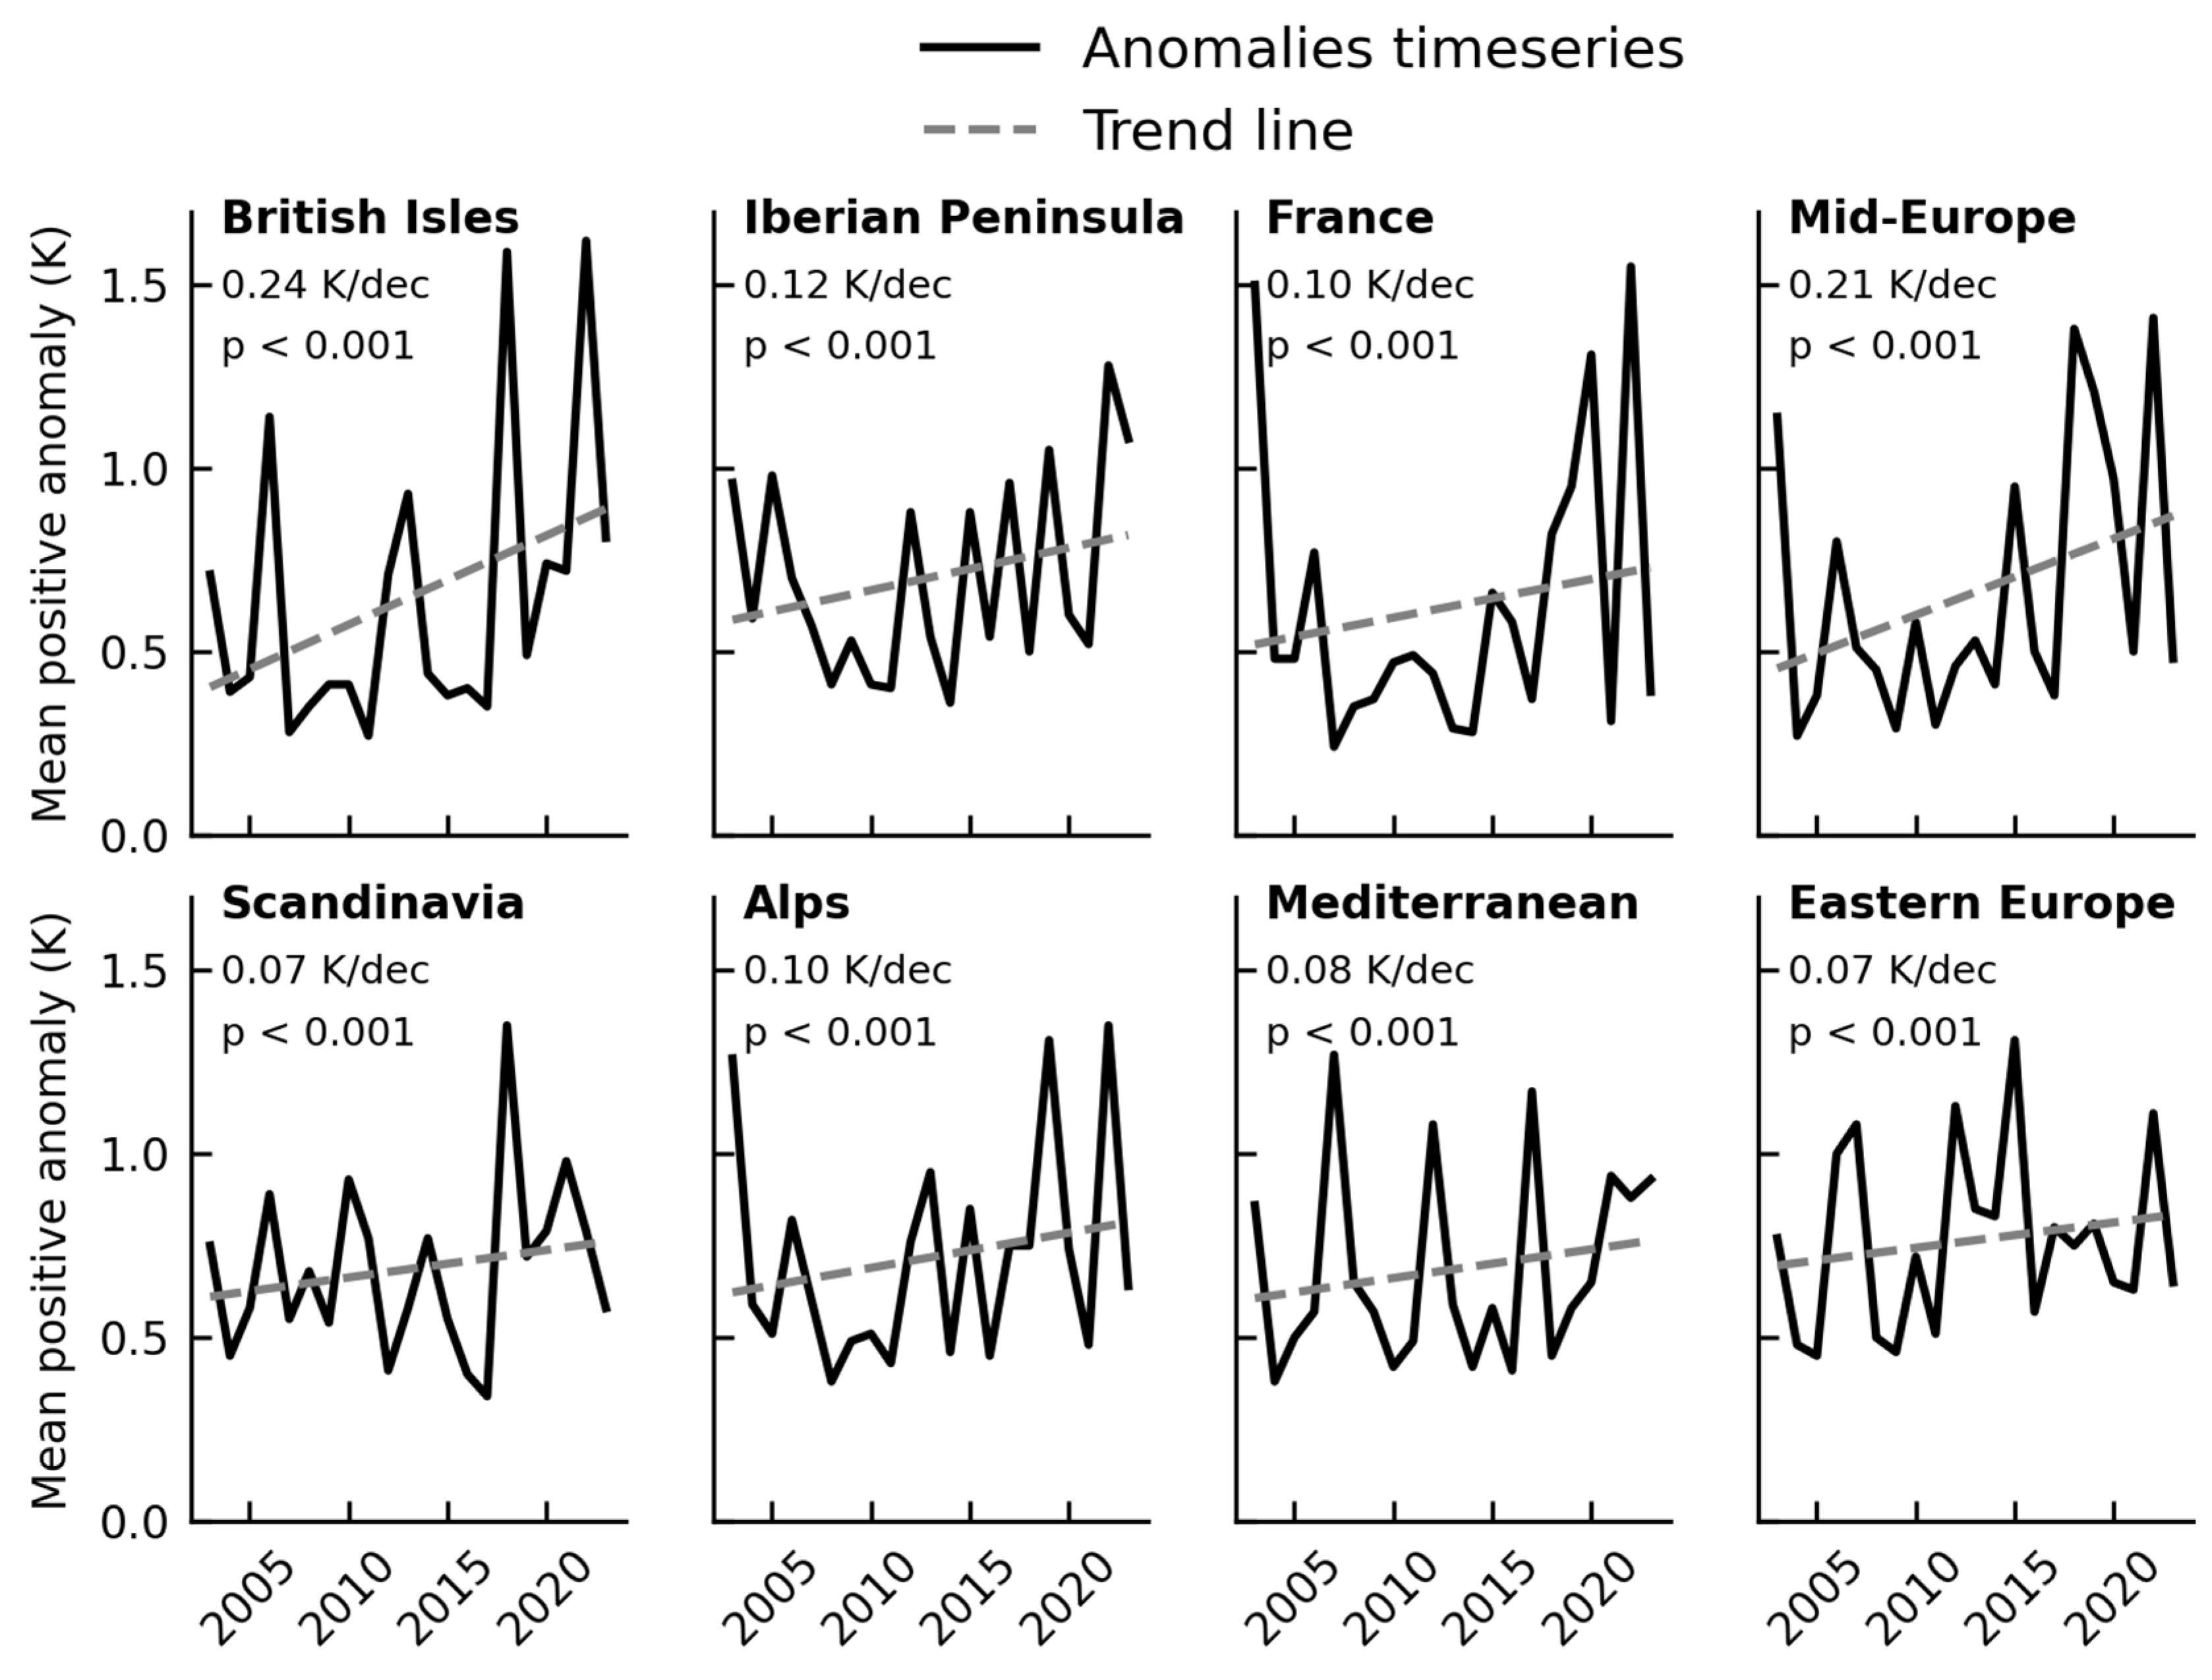
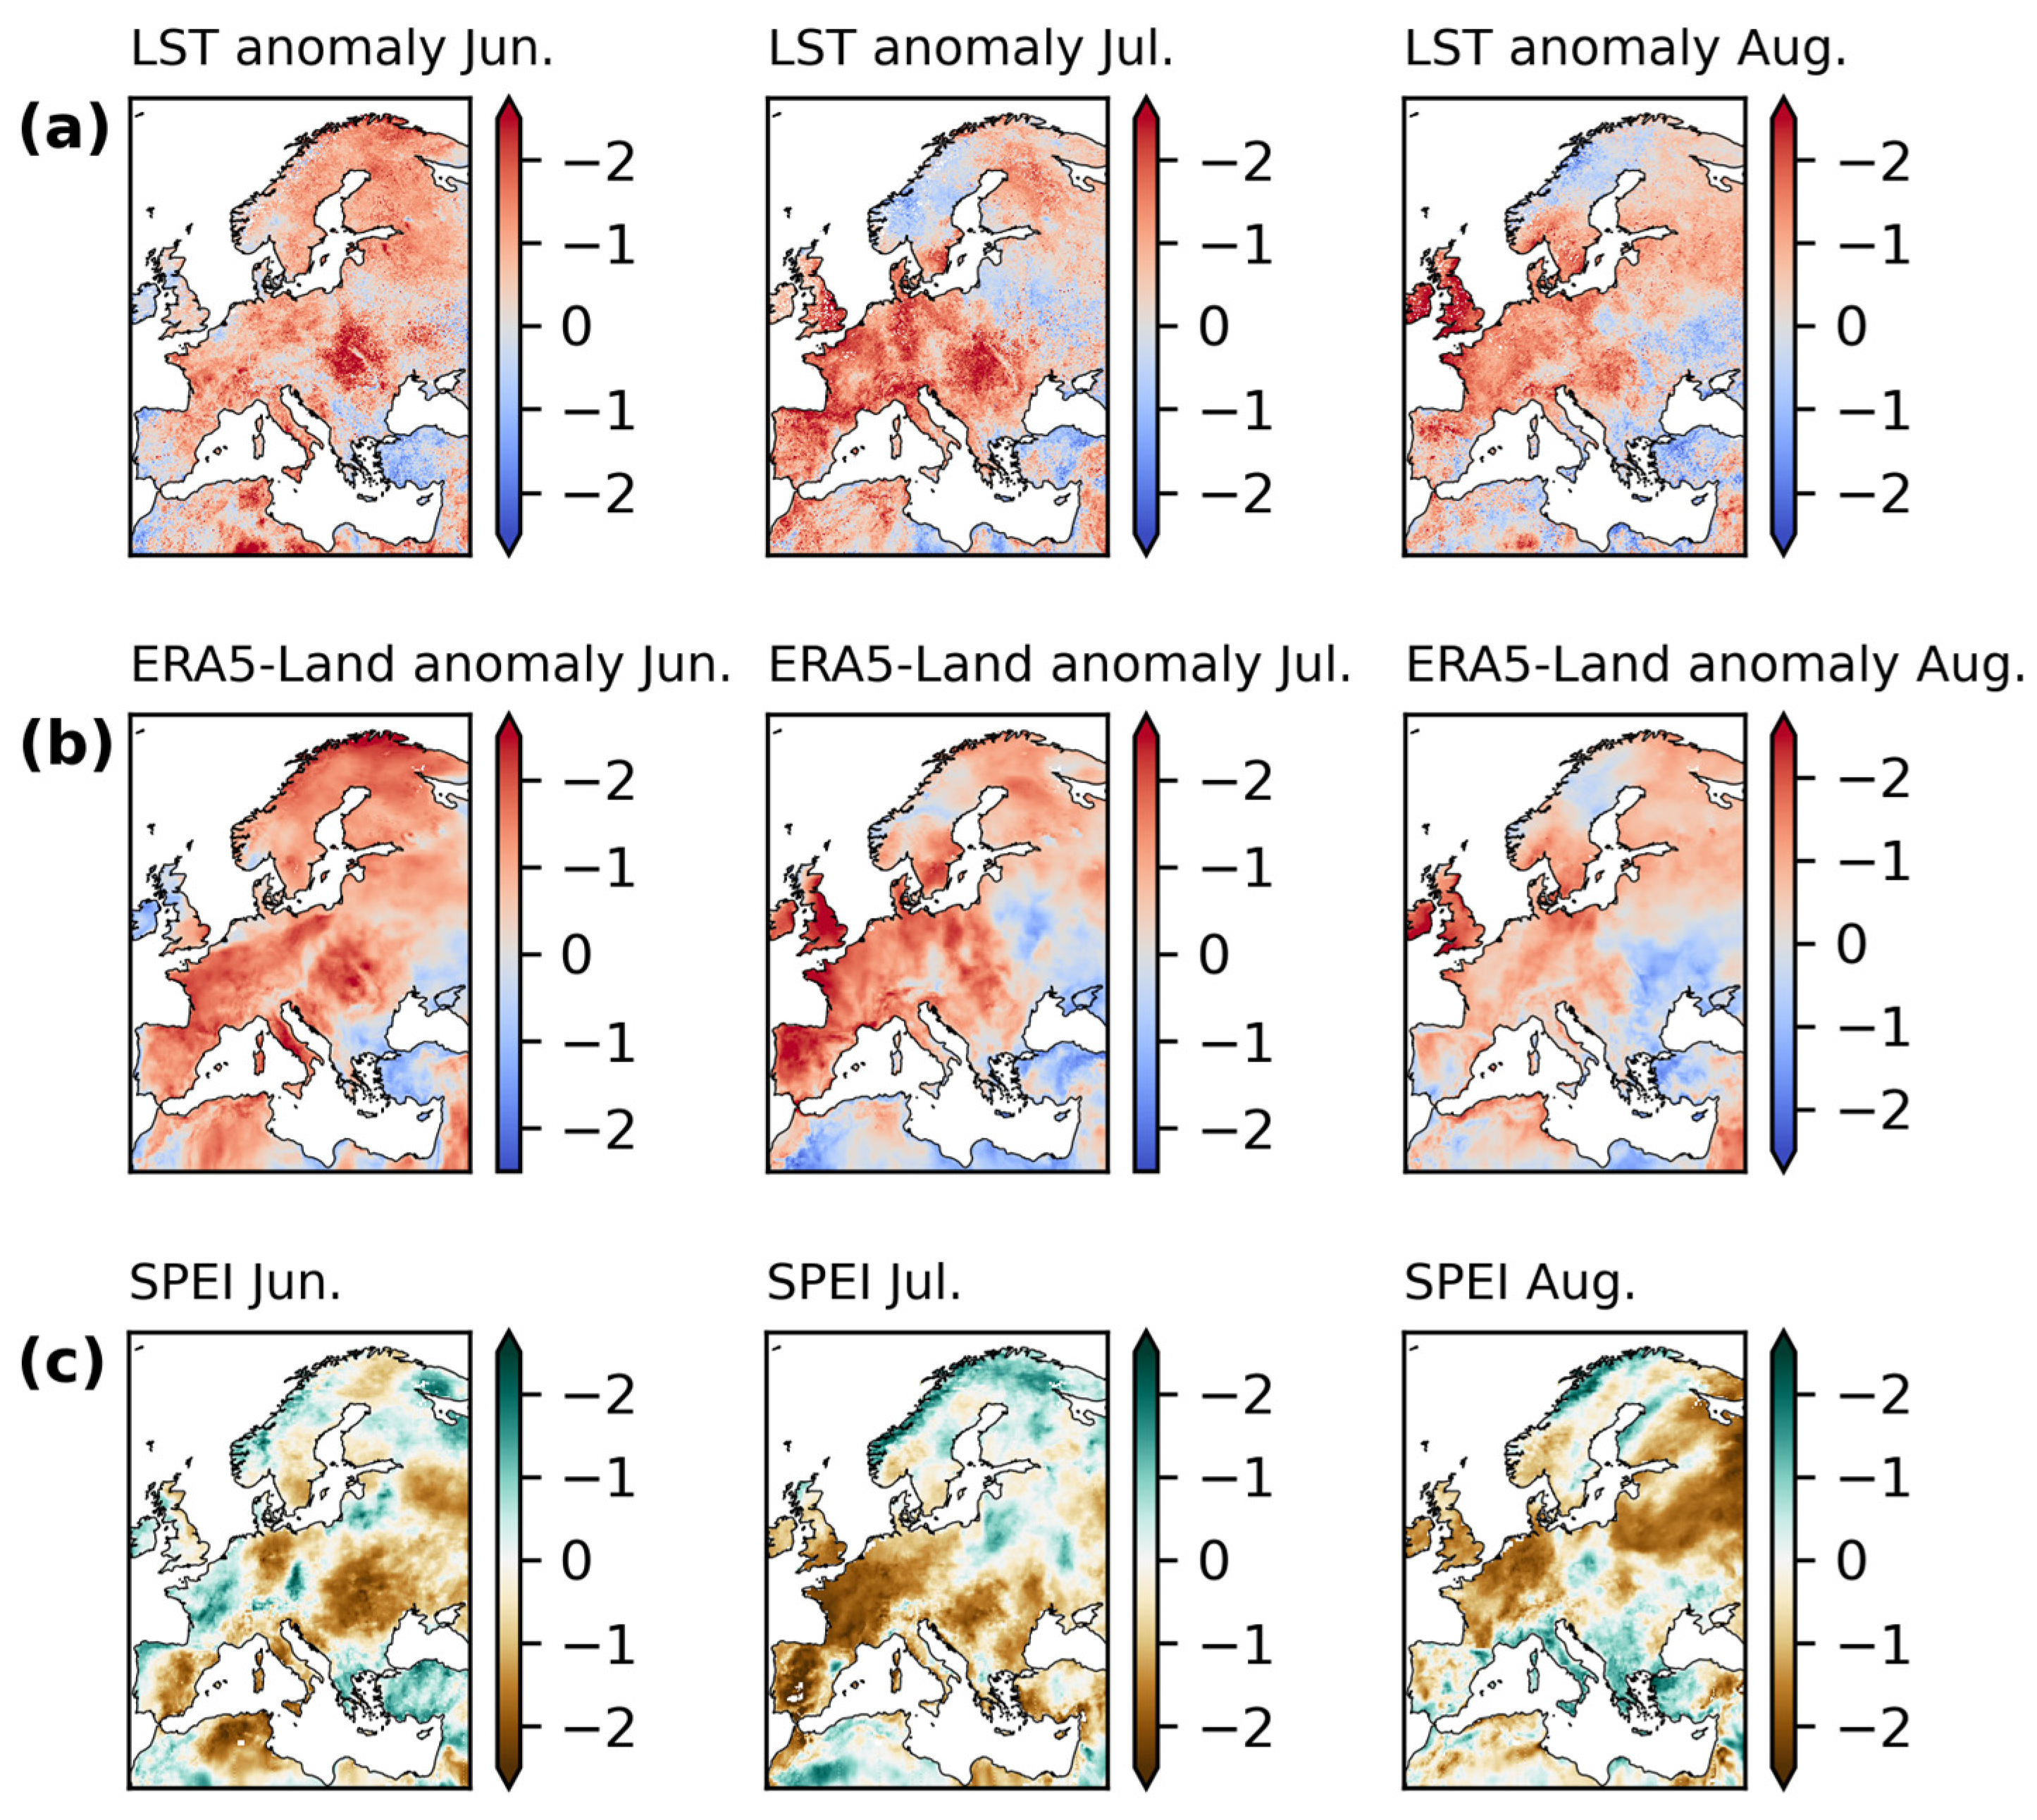
3.1. Maximum Surface Temperature (LSTmax) Anomaly Indices

Throughout the study period, a strong correspondence is observed between summer-season standardized LSTmax anomalies and major heatwave events in Europe (Figure 3). This includes record-breaking extremes such as the 2003 heatwave in France [49], the 2010 Russian heatwave [50], and the 2022 European compound drought and heatwave event [51]. Across Europe and in all PRUDENCE sub-regions, a statistically significant (p < 0.001) trend of increasing intensity in mean positive LST anomalies was detected (Figure 4), with an estimated average anomaly increase of approximately 0.17 per decade. While different sub-regions exhibit fluctuations between cooler and warmer summers, driven by varying synoptic circulation patterns, a persistent trend of higher surface temperature anomalies has been evident in recent years.
The 2022 heatwave stands out as an exceptionally warm summer, with 75.1% of Europe experiencing positive LSTmax anomalies. The mean anomaly value during this period was found the highest recorded across all years, reaching 0.61, highlighting the extreme conditions observed across the region. The most affected sub-regions were France and Mid-Europe, where 88.5% and 72.3% of the total land area, respectively, experienced LSTmax anomalies exceeding one standard deviation. Notably, in both sub-regions, anomalies surpassing two standard deviations of maximum summer temperature were observed in over 17% of the total area. These findings are consistent with ERA5-Land anomalies, as shown in Figure 5. The combination of higher-than-normal spring and summer temperatures and below-average precipitation, particularly during spring, intensified the widespread drought that began in early spring and persisted throughout the summer. This pattern is clearly reflected in the SPEI drought index, which remained consistently below −2 in many parts of Europe (Figure 5). A notable example for the 2022 event is the France sub-region, where a moderate drought in May (SPEI = −1.4) preceded the onset of high summer temperatures. This evolved into an extreme drought by July (SPEI = −2.0) during a compound heat event and continued into August (SPEI = −1.2), even as temperatures began to decline, reflecting the residual effects of heat extremes. Interestingly, for the same event, the GLEAM standardized soil moisture anomaly showed its highest values before (−1.1 in May) and after the heatwave period (−1.0 in August).
Within the Mediterranean sub-region, the most intense LST anomalies occurred in 2007, with the mean positive anomaly reaching high values for all summer months (1.1, 1.4, and 0.8 for June, July and August, respectively). This aligns with the widespread and recurrent heatwave events during 2007 in the area. The thermal anomaly was particularly intense and prolonged, with severe drought conditions in July (SPEI = −1.5) further amplifying the heatwaves in the latter half of the month. Furthermore, Figure 6 highlights that regions with strong land–atmosphere coupling can become hot spots even in relatively cold and wet climates. A notable example is the 2018 heatwave in northern Europe, where exceptionally high temperatures peaked in July. As indicated by the low SPEI value for May (−1.7) in Figure 7, severe spring drought conditions significantly reduced evaporative cooling, thereby intensifying the heatwave’s impact. Drought patterns become even more pronounced when considering the standardized GLEAM soil moisture anomalies, which reflect a positive feedback mechanism: reduced evapotranspiration leads to higher temperatures, which in turn elevate evaporative demand, further depleting soil moisture. This is evident in the progressive decline from −0.5 in early summer to −2.4 in July, with persistently negative anomalies continuing into August (−0.8) and the subsequent autumn months.

3.2. Analysis of Heatwaves and Energy Fluxes at Specific Locations

Using daily LST data from both Aqua and Terra, heatwaves were identified as days with positive anomalies, based on various minimum percentile (ranging from the 80th to the 95th) and duration (ranging from one to at least three days) thresholds. To determine which LST index definitions best correspond to heatwave episodes, an initial comparison was conducted based on their systematic deviations from the region’s climatological heatwave patterns. The LST indices follow the naming convention “MxD_Pxx_Dx” where MxD refers to the satellite (MOD: Terra; MYD: Aqua; MXD: combination of both), Pxx to the percentile used, and Dx to the minimum duration in days.
It was found that indices incorporating a combined Aqua-Terra approach (specifically the MXD_P85_D3, MXD_P90_D3, and MXD_P95_D3 indices) reproduce the climatology of the region’s hot days with small errors and high consistency. Notably, 91% of heatwave episodes coincided with warm events according to the MOD_P95_D3 index, while the corresponding percentage for MXD_P95_D3 was approximately 88%. Additionally, around 84% of heatwave days were matched with a warm LST day based on the MXD_P95_D3 index.
The degree of alignment between observed events and climatology is illustrated in Figure 8, which presents annual aggregated statistics for heatwaves estimated through air temperature (ERA5-Land) and LST indices (MXD_P85_D3), indicatively for the Mediterranean and Scandinavia regions. The LST index closely follows the general climatology of the region, demonstrating strong agreement in year-to-year variations and consistency between LST and air temperature. Additionally, the mean duration of heatwaves shows agreement between LST and Tair. A statistically significant (p < 0.05) increasing trend was observed for both air temperature-derived heatwaves and LST anomalies, indicating that extreme temperature events have become more frequent across Europe in recent years.
The temporal distribution of CDHWs across European subregions (Table 3) reveals a clear intensification over the past decade, with a noticeable increase in the number of affected days, particularly after 2015. The year 2022 stands out as the most extreme, with exceptionally high values recorded in the Iberian Peninsula (15.8 days), the Mediterranean (9.0 days), and France (7.8 days), reflecting the widespread and prolonged nature of this event. Similarly, northern regions such as the British Isles and Scandinavia, which traditionally experience fewer CDHWs, also showed elevated values in 2018 (5.0 and 5.9 days, respectively). Notably, Central Europe (ME) recorded frequent CDHWs in both 2015 (1.4 days) and 2018 (4.8 days), while the Alps consistently appear among the most affected regions, with increased CDHW activity in 2003, 2006, 2011, 2015, and 2019. These patterns underscore the growing prevalence and geographical spread of compound extremes across Europe in recent years.
Figure 9 and Figure 10 illustrate the diurnal evolution of flux anomalies, highlighting how incoming solar radiation is partitioned into sensible and latent heat fluxes during heatwave episodes (defined using the CTX90pct index), categorized by vegetation type. Across most land cover types, the strongest anomalies occur around midday (10:00–14:00), though the full diurnal cycle reveals differences in timing and magnitude of peak responses.
Evergreen coniferous (ENF) and mixed forests (MF) show a clear prevalence of sensible heat anomalies, peaking around midday at 74.0 W/m2 and 61.8 W/m2 (mean values for 10:00–14:00), respectively, with relatively small latent heat anomalies (14.9 W/m2 for ENF and 28.6 W/m2 for MF). In contrast, grassland sites (GRA) exhibit a pronounced increase in latent heat flux, peaking at 88.7 W/m2 around midday, and only minor sensible heat anomalies (4.9 W/m2), consistent with their high evaporative potential. These findings align with the results of Teuling et al. (2010) [33], while extending them to longer time periods and a larger study area. Deciduous broadleaf forests (DBF) display a more balanced energy partitioning, with both flux components increasing moderately and peaking closer to noon. Wetlands (WET) stand out for their strong latent heat flux anomalies (66.7 W/m2), accompanied by near-zero sensible heat changes throughout the day, highlighting their high evaporative efficiency driven by saturated soils. Croplands (CRO) show a slight dominance of latent over sensible heat flux anomalies, suggesting that agricultural management practices, particularly irrigation, contribute to sustaining evapotranspiration during hot days. The urban sites (URB) exhibit higher sensible heat anomalies (39.9 W/m2), especially during the early afternoon, reflecting the low evapotranspirative capacity due to scarce vegetation and the high heat retention of built surfaces.
The above findings describe heat flux partitioning during all available heatwave events during the study period. However, under conditions of extreme water stress, distinct shifts occur, driven by prolonged soil moisture depletion. Such conditions, as observed during the 2018 heatwave, highlight the critical role of soil moisture availability in regulating energy fluxes and the transition from latent to sensible heat dominance. For example, Table 4 presents the anomalies of sensible and latent heat flux at the CH-Fru (Früebüel) flux tower station in Switzerland (a grassland-covered site), from late July to early August 2018.
The results indicate that, as long as the soil retained sufficient water reserves, latent heat flux anomalies were substantially higher than those of sensible heat, primarily due to enhanced evapotranspiration. However, from the fourth day of the heatwave (3 August 2018), this pattern gradually reversed, driven by the depletion of soil moisture reserves, which became more pronounced toward the end of the event. Of particular interest is the variation in heat flux partitioning in grasslands under different heatwave intensities, as illustrated in Figure 11. Under typical heatwave conditions, grassland ecosystems primarily directed heat into latent heat flux. However, during more intense heatwaves, accelerated evapotranspiration led to a progressive decline in soil moisture, resulting in a shift toward higher sensible heat flux. A similar pattern was observed at other stations with comparable vegetation cover. During this period, extremely high LST values were recorded for CH-Fru, as well across many European stations, particularly at the DE-Gri (Grillenburg) site in Germany.

4. Discussion

4.1. Heat Wave and Drought Monitoring

The growing availability of long-term satellite observations provides new opportunities for monitoring climate extremes, including heatwaves and droughts [15,52]. Despite the advantages of satellite-derived LST data, such as extensive spatial coverage and continuous monitoring, their potential for studying compound heat and drought events remains relatively underutilized in the literature [18]. This study addresses this gap by introducing a methodological framework to examine heat extremes across Europe, based on a multi-year dataset of daily LST observations from the MODIS sensor. To enhance the interpretation of surface–atmosphere interactions, we complemented the satellite data with reanalysis products, drought indices, and turbulent energy flux measurements from micrometeorological tower networks.

4.2. Spatiotemporal Dynamics of Heatwaves and Droughts in Europe

The findings from this study demonstrate that LST data effectively capture land–atmosphere interactions, notably the spatial patterns associated with heatwaves and droughts in Europe. This study’s results indicate a significant trend toward more intense heatwaves, with notable increases in warm anomalies across Europe. Notably, a large portion of the continent, approximately 75%, experienced significantly elevated land surface temperatures during the 2022 heatwave. This heatwave can be largely attributed to a persistent atmospheric blocking pattern over central Europe, which emerged in late spring and intensified during the summer, with its center shifting toward central Europe [18]. However, the intensity of heatwave episodes can be influenced by both synoptic conditions and local-scale factors [9]. In the current study, it was observed that drought may precede a heatwave or act as a mechanism to intensify the event. Reduced soil moisture leads to diminished evaporation, weakening a natural cooling mechanism. For example, this pattern was displayed in the severe heatwave of 2022, as identified using the SPEI drought index (Figure 5). Specifically in France, moderate drought conditions in May 2022 (SPEI = −1.4) evolved into extreme drought by July (SPEI = −2.0), amplifying heat stress. Conversely, heatwaves can also drive drought conditions, as the increased solar radiation during hot days leads to higher soil and air temperatures, as was evident in the 2007 southeast European heatwave. The thermal anomaly was particularly intense and prolonged for Greece, marked in the literature as one of the most severe and deadly for the region [53]. Similarly, the 2018 northern European heatwave was intensified by early season drought and progressive surface moisture depletion, as indicated by the negative values of GLEAM standardized soil moisture anomalies (Figure 6 and Figure 7). These findings underscore the bidirectional link between heatwaves and droughts and highlight that regions with strong land–atmosphere coupling can become hot spots even in relatively cold and wet climates [21,37]. Reduced soil moisture limits evaporative cooling, increasing surface temperatures, while extreme heat accelerates soil drying. The combined use of LST anomalies and drought indices provides a robust tool for monitoring compound climate extremes, supporting efforts in early warning and climate adaptation planning.

4.3. Vegetation Controls on Surface Energy Fluxes Under Heat and Drought

The partitioning of available energy into sensible and latent heat fluxes play a central role in the development and persistence of both heatwave and drought events [20,49]. Observations from micrometeorological towers highlight the pivotal role of vegetation type and land surface characteristics in modulating these energy fluxes. Ecosystems such as grasslands and forests exhibit distinct thermohydrological responses to extreme heat. Grasslands, characterized by relatively shallow root systems and high surface-area-to-volume ratios, were found to exhibit elevated evapotranspiration rates under moderate thermal stress (Figure 9 and Figure 10). This leads to enhanced latent heat flux, which serves as an effective surface cooling mechanism [33], up to a 70 W/m2 anomaly during midday compared to typical conditions. However, during prolonged or severe heatwaves, the limited soil moisture reserves in grasslands are quickly depleted [21,34], resulting in a collapse of evaporative cooling and a subsequent rise in sensible heat flux and surface temperatures (Table 4, Figure 11).
In contrast, we found that forests tend to adopt a more conservative water-use strategy, facilitated by deeper root systems and stomatal regulation (Figure 9 and Figure 10). This, on average, results in an initial increase in sensible heat flux anomalies, peaking above 70 W/m2 during midday, but subsequently enables forested landscapes to maintain cooler surface conditions over longer periods, even under drought stress, by optimizing water retention and sustaining transpiration rates. However, this resilience is not absolute; under extreme or recurrent heat events, the accumulated stress can lead to hydraulic failure or canopy degradation, diminishing long-term thermal regulation capacity [54]. Processed-based numerical modelling [49] or more complex coupling indices such as the π diagnostic [55] would further support a better understanding of the interactions between droughts and heatwaves, and is a promising direction for future research aiming to establish causality and process-level attribution. In addition, extending the study to a global scale would enable better sampling of land cover types, particularly those that were under-sampled (e.g., urban areas) or not included (e.g., arid and semi-arid sites) in the current study, thereby enhancing the robustness of energy partitioning assessment.

4.4. Planning for Heat Resilience

Translating these insights into the context of heat resilience, the implications for climate-sensitive planning are significant. Urban areas, already exhibiting elevated thermal loads due to the urban heat island (UHI) effect, face amplified risks during compound hot–dry events [56]. Vegetation-based cooling strategies have emerged as critical tools for mitigating urban heat, but their effectiveness depends on local climatic regimes and vegetation physiology. Based on our findings, tree-based strategies, particularly involving drought-tolerant, deep-rooted species, are generally more effective in regions prone to high-intensity and duration but less frequent heatwaves. Trees provide sustained shading and transpiration-driven cooling, which can mitigate peak temperatures and enhance urban thermal comfort [57]. In contrast, in areas where heatwaves are more frequent but less intense, grass-dominated green infrastructure may be adequate, particularly when combined with irrigation strategies or water-sensitive urban design. In urban environments, three-dimensional building morphology must also be considered when developing heat-resilience strategies. In this context, the Local Climate Zones (LCZ) classification system [58] offers a useful framework for integrating urban form into climate-adaptive planning [59]. In addition, when assessing the impacts of extreme heatwaves on human populations, it is essential to employ more advanced human–biometeorological indices. Such indices; for instance, the modified physiologically equivalent temperature (mPET), allow for a more accurate representation of heat stress by accounting for a range of physiological and environmental variables, thereby improving our understanding of how extreme heat affects diverse population groups [60].

4.5. Spatial Scale Effects and Datasets Uncertainty

While this study provides robust observational insights into the dynamics of compound drought–heatwave events across Europe, certain limitations should be acknowledged. First, the spatial resolution of the employed datasets varies substantially, ranging from point-based flux tower observations to much coarser-resolution reanalysis and soil moisture products. These scale discrepancies may introduce biases in the spatial representation of surface–atmosphere processes, particularly in heterogeneous landscapes such as urban areas. To mitigate these effects, a twofold methodological approach was adopted. In the first component (Section 3.1), results derived from datasets with varying resolutions were aggregated at the scale of European subregions, enabling a broader, regional-level analysis. The second component of the study (Section 3.2) on site-specific investigations using flux tower and MODIS-derived observations, both of which generally represent processes at a comparable local-scale footprint of approximately 1 km. A promising direction for future work would be the application of statistical downscaling techniques to fuse data from different satellite platforms onto a common high-resolution grid, thereby further minimizing scale effects. Such approaches have already demonstrated value in drought monitoring [61] and could similarly improve spatial and temporal accuracy in the analysis of drought–heatwave interactions.
A related limitation of the current work arises from the integration of diverse data sources, each subject to inherent uncertainties associated with retrieval algorithms, temporal coverage, and input parameters. While this multi-source approach enhances the overall scope and robustness of the analysis, it also introduces compounded uncertainties that are challenging to fully quantify. To address these challenges, future research could pursue two complementary directions. First, the growing availability of high-quality satellite data records can support long-term climate monitoring efforts that rely primarily on space-based instruments [18]. For instance, Climate Data Record (CDR) products from instruments such as SEVIRI (Spinning Enhanced Visible and InfraRed Imager) onboard geostationary satellites offer continuous, high-frequency spatial coverage with reduced dependence on reanalysis inputs, thereby minimizing uncertainty related to model assumption [32]. Second, a systematic intercomparison of available datasets used for assessing heat extremes could enhance analytical robustness and provide insights into their relative performance across different spatial and temporal scales [62]. Moreover, the emergence of new satellite missions presents valuable opportunities to advance the monitoring of heat and drought stress [63]. These include high-resolution thermal missions such as the Land Surface Temperature Monitoring (LSTM) mission and the Thermal infraRed Imaging Satellite for High-resolution Natural resource Assessment (TRISHNA), as well as hyperspectral missions like the Environmental Mapping and Analysis Program (EnMAP). Despite these remote sensing advances, in situ observations, although limited in spatial and temporal coverage, represent ground truth and are essential for evaluating the accuracy of satellite-based techniques and model simulations, which can in turn be used to extend analyses across broader spatial and temporal domains [21].

4.6. Land Surface Emissivity Influence

Finally, it is important to acknowledge the influence of the land cover-based emissivity assignment employed in the Aqua/MODIS MYD11A1 product used in this study. The impact of potential uncertainties in absolute LST values is mitigated by the use of standardized maximum LST anomalies in the first part of the analysis and by threshold-based approaches derived from LST climatology in the second part, rather than relying directly on raw LST values. Moreover, long-term LST trends are not expected to be significantly affected by emissivity assumptions, as the MCD12Q1 land cover product used for emissivity estimation is updated annually. Nevertheless, land cover-based emissivity can influence thermal anomalies, particularly in the short-term variability of surface conditions.
Emissivity classification errors can arise from three main sources [12]: (i) misclassification of the original cover type, (ii) inaccuracies in the assigned emissivity values within each cover type, and (iii) dynamic changes in surface conditions. Misclassification occurs when the land cover algorithm fails to correctly identify the true cover type. Within-class emissivity errors result from a single class (e.g., barren land) not adequately representing the range of emissivity values present within that category [12]. These two types of error are especially relevant at the coarse 1 km resolution of the product, where mixed pixels are common [64]. Finally, dynamic emissivity errors can arise from rapid surface changes, such as vegetation shifts during droughts or phenological transitions, that alter surface emissivity within a given land cover class [13].
An alternative approach could involve the use of MODIS LST products that apply nondeterministic retrieval algorithms, such as the Day/Night method or the Temperature Emissivity Separation (TES) algorithm. These techniques retrieve LST and spectral emissivity by introducing additional constraints or degrees of freedom that are independent of the input data. For example, the MYD11B1 product that leverages the assumption of minimal emissivity variation between day and night observations. However, in the current study, we opted to use the MYD11A1 product due to its finer spatial resolution (1 km) compared to MYD11B1 (5 km), which allowed for improved detection of fine-scale thermal patterns and better alignment with the spatial footprint of flux towers used in the second part of our analysis. Additionally, the coarser resolution of MYD11B1 may lead to spatial averaging effects, potentially smoothing out cloud/fire and quality masks. Similarly, while the TES-based dynamic retrieval in the MYD21A1 product is expected to better capture short-term emissivity variations relevant to heat and drought extremes, our preliminary analysis revealed a substantially higher rate of missing observations. These gaps were primarily due to TES algorithm non-convergence and/or low-quality assurance values. This limited the suitability of the product for our study’s objectives, particularly the need for consistent spatiotemporal coverage to detect consecutive-day thermal anomalies. Nonetheless, non-deterministic LST/emissivity retrieval approaches offer significant potential for advancing the remotely sensed monitoring of heat and drought extremes and warrant further exploration in future research.

5. Conclusions

This study offers important insights into the dynamics of heat extremes across Europe over the past two decades, utilizing satellite-derived LST data. The results reveal a significant increase in both the frequency and intensity of heatwaves, of which particularly notable were events like the 2022 heatwave that affected large portions of Europe. The analysis indicates that positive LST anomalies have become more persistent, with clear spatial and temporal patterns emerging.
By integrating LST data with long-term reanalysis air temperature datasets and energy flux measurements from micrometeorological towers, this study enhances the understanding of heatwave dynamics. A key finding is the varying partitioning of sensible and latent heat fluxes across different land cover types, emphasizing the important role vegetation plays in moderating or exacerbating heatwave impacts. Grasslands and forests exhibit distinct thermal responses, with grasslands being more vulnerable to extreme heat due to soil moisture depletion, while forests retain moisture and maintain higher sensible heat fluxes.
This study further underscores the critical role of land–atmosphere interactions, particularly the influence of soil moisture feedbacks in the amplification of heatwaves. Drought conditions frequently act as both precursors to and enhancers of extreme heat events, establishing a feedback mechanism that intensifies surface heating while simultaneously diminishing soil moisture availability.
Overall, the use of long-term satellite data for monitoring heat extremes presents a powerful tool for climate change research, particularly in areas with limited in situ weather station data. As heatwaves are expected to become more intense and frequent under future climate scenarios, the findings from this study can help inform more effective adaptation and resilience strategies and contribute to policy development aimed at minimizing the adverse impacts of extreme heat on ecosystems, human health, and economies across Europe. Further research should focus on exploring local climatic variations and improving predictive models for extreme heat events.

Author Contributions

All authors designed the methodology. F.K. implemented the methodology and performed the statistical analysis; all authors contributed to the analysis of the data, interpretation of the results, and the writing of the paper. All authors have read and agreed to the published version of the manuscript.

Funding

This research received no external funding.

Data Availability Statement

All datasets and code used in this study are available upon request.

Conflicts of Interest

The authors declare no conflicts of interest.

References

  1. Dosio, A.; Mentaschi, L.; Fischer, E.M.; Wyser, K. Extreme Heat Waves under 1.5 °C and 2 °C Global Warming. Environ. Res. Lett. 2018, 13, 054006. [Google Scholar] [CrossRef]
  2. Coumou, D.; Rahmstorf, S. A Decade of Weather Extremes. Nat. Clim. Change 2012, 2, 491–496. [Google Scholar] [CrossRef]
  3. Van Loon, A.F.; Rangecroft, S.; Coxon, G.; Werner, M.; Wanders, N.; Di Baldassarre, G.; Tijdeman, E.; Bosman, M.; Gleeson, T.; Nauditt, A.; et al. Streamflow Droughts Aggravated by Human Activities despite Management. Environ. Res. Lett. 2022, 17, 044059. [Google Scholar] [CrossRef]
  4. Vicente-Serrano, S.M.; McVicar, T.R.; Miralles, D.G.; Yang, Y.; Tomas-Burguera, M. Unraveling the Influence of Atmospheric Evaporative Demand on Drought and Its Response to Climate Change. Wiley Interdiscip. Rev. Clim. Change 2020, 11, e632. [Google Scholar] [CrossRef]
  5. Grillakis, M.G. Increase in Severe and Extreme Soil Moisture Droughts for Europe under Climate Change. Sci. Total Environ. 2019, 660, 1245–1255. [Google Scholar] [CrossRef]
  6. García-León, D.; Casanueva, A.; Standardi, G.; Burgstall, A.; Flouris, A.D.; Nybo, L. Current and Projected Regional Economic Impacts of Heatwaves in Europe. Nat. Commun. 2021, 12, 5807. [Google Scholar] [CrossRef]
  7. Amengual, A.; Homar, V.; Romero, R.; Brooks, H.E.; Ramis, C.; Gordaliza, M.; Alonso, S. Projections of Heat Waves with High Impact on Human Health in Europe. Glob. Planet. Change 2014, 119, 71–84. [Google Scholar] [CrossRef]
  8. Zscheischler, J.; Martius, O.; Westra, S.; Bevacqua, E.; Raymond, C.; Horton, R.M.; van den Hurk, B.; AghaKouchak, A.; Jézéquel, A.; Mahecha, M.D.; et al. A Typology of Compound Weather and Climate Events. Nat. Rev. Earth Environ. 2020, 1, 333–347. [Google Scholar] [CrossRef]
  9. Barriopedro, D.; García-Herrera, R.; Ordóñez, C.; Miralles, D.G.; Salcedo-Sanz, S. Heat Waves: Physical Understanding and Scientific Challenges. Rev. Geophys. 2023, 61, e2022RG000780. [Google Scholar] [CrossRef]
  10. Perkins, S.E.; Alexander, L.V. On the Measurement of Heat Waves. J. Clim. 2013, 26, 4500–4517. [Google Scholar] [CrossRef]
  11. Engdaw, M.M.; Ballinger, A.P.; Hegerl, G.C.; Steiner, A.K. Changes in Temperature and Heat Waves over Africa Using Observational and Reanalysis Data Sets. Int. J. Climatol. 2022, 42, 1165–1180. [Google Scholar] [CrossRef]
  12. Hulley, G.; Ghent, D. Taking the Temperature of the Earth: Steps towards Integrated Understanding of Variability and Change; Elsevier: Amsterdam, The Netherlands, 2019. [Google Scholar]
  13. Li, Z.-L.; Tang, B.-H.; Wu, H.; Ren, H.; Yan, G.; Wan, Z.; Trigo, I.F.; Sobrino, J.A. Satellite-Derived Land Surface Temperature: Current Status and Perspectives. Remote Sens. Environ. 2013, 131, 14–37. [Google Scholar] [CrossRef]
  14. Philippopoulos, K.; Pantavou, K.; Cartalis, C.; Agathangelidis, I.; Mavrakou, T.; Polydoros, A.; Nikolopoulos, G. A Novel Artificial Neural Network Methodology to Produce High-Resolution Bioclimatic Maps Using Earth Observation Data: A Case Study for Cyprus. Sci. Total Environ. 2023, 893, 164734. [Google Scholar] [CrossRef]
  15. Reiners, P.; Sobrino, J.; Kuenzer, C. Satellite-Derived Land Surface Temperature Dynamics in the Context of Global Change—A Review. Remote Sens. 2023, 15, 1857. [Google Scholar] [CrossRef]
  16. Mildrexler, D.J.; Zhao, M.; Cohen, W.B.; Running, S.W.; Song, X.P.; Jones, M.O. Thermal Anomalies Detect Critical Global Land Surface Changes. J. Appl. Meteorol. Climatol. 2018, 57, 391–411. [Google Scholar] [CrossRef]
  17. Agathangelidis, I.; Cartalis, C.; Polydoros, A.; Mavrakou, T.; Philippopoulos, K. Can Satellite-Based Thermal Anomalies Be Indicative of Heatwaves? An Investigation for MODIS Land Surface Temperatures in the Mediterranean Region. Remote Sens. 2022, 14, 3139. [Google Scholar] [CrossRef]
  18. Martins, J.P.A.; Caetano, S.; Pereira, C.; Dutra, E.; Cardoso, R.M. A Satellite View of the Exceptionally Warm Summer of 2022 over Europe. Nat. Hazards Earth Syst. Sci. 2024, 24, 1501–1520. [Google Scholar] [CrossRef]
  19. Miralles, D.G.; Gentine, P.; Seneviratne, S.I.; Teuling, A.J. Land–Atmospheric Feedbacks during Droughts and Heatwaves: State of the Science and Current Challenges. Ann. N. Y. Acad. Sci. 2019, 1436, 19–35. [Google Scholar] [CrossRef]
  20. Benson, D.O.; Dirmeyer, P.A. Characterizing the Relationship between Temperature and Soil Moisture Extremes and Their Role in the Exacerbation of Heat Waves over the Contiguous United States. J. Clim. 2021, 34, 2175–2187. [Google Scholar] [CrossRef]
  21. Orth, R. When the Land Surface Shifts Gears. AGU Adv. 2021, 2, e2021AV000414. [Google Scholar] [CrossRef]
  22. Schumacher, D.L.; Keune, J.; Dirmeyer, P.; Miralles, D.G. Drought Self-Propagation in Drylands Due to Land–Atmosphere Feedbacks. Nat. Geosci. 2022, 15, 262–268. [Google Scholar] [CrossRef]
  23. Zargar, A.; Sadiq, R.; Naser, B.; Khan, F.I. A Review of Drought Indices. Environ. Rev. 2011, 19, 333–349. [Google Scholar] [CrossRef]
  24. Gebrechorkos, S.H.; Peng, J.; Dyer, E.; Miralles, D.G.; Vicente-Serrano, S.M.; Funk, C.; Beck, H.E.; Asfaw, D.T.; Singer, M.B.; Dadson, S.J. Global High-Resolution Drought Indices for 1981–2022. Earth Syst. Sci. Data 2023, 15, 5449–5466. [Google Scholar] [CrossRef]
  25. Afshar, M.H.; Bulut, B.; Duzenli, E.; Amjad, M.; Yilmaz, M.T. Global Spatiotemporal Consistency between Meteorological and Soil Moisture Drought Indices. Agric. For. Meteorol. 2022, 316, 108848. [Google Scholar] [CrossRef]
  26. Vicente-Serrano, S.M.; Beguería, S.; López-Moreno, J.I.; Angulo, M.; El Kenawy, A. A New Global 0.5 Gridded Dataset (1901–2006) of a Multiscalar Drought Index: Comparison with Current Drought Index Datasets Based on the Palmer Drought Severity Index. J. Hydrometeorol. 2010, 11, 1033–1043. [Google Scholar] [CrossRef]
  27. Ziese, M.; Schneider, U.; Meyer-Christoffer, A.; Schamm, K.; Vido, J.; Finger, P.; Bissolli, P.; Pietzsch, S.; Becker, A. The GPCC Drought Index–a New, Combined and Gridded Global Drought Index. Earth Syst. Sci. Data 2014, 6, 285–295. [Google Scholar] [CrossRef]
  28. Keune, J.; Di Giuseppe, F.; Barnard, C.; Damasio da Costa, E.; Wetterhall, F. ERA5–Drought: Global Drought Indices Based on ECMWF Reanalysis. Sci. Data 2025, 12, 616. [Google Scholar] [CrossRef]
  29. Hanel, M.; Rakovec, O.; Markonis, Y.; Máca, P.; Samaniego, L.; Kyselý, J.; Kumar, R. Revisiting the Recent European Droughts from a Long-Term Perspective. Sci. Rep. 2018, 8, 9499. [Google Scholar] [CrossRef]
  30. Kogan, F.N. Application of Vegetation Index and Brightness Temperature for Drought Detection. Adv. Space Res. 1995, 15, 91–100. [Google Scholar] [CrossRef]
  31. Wan, Z.; Wang, P.; Li, X. Using MODIS Land Surface Temperature and Normalized Difference Vegetation Index Products for Monitoring Drought in the Southern Great Plains, USA. Int. J. Remote Sens. 2004, 25, 61–72. [Google Scholar] [CrossRef]
  32. Gouveia, C.M.; Martins, J.P.A.; Russo, A.; Durão, R.; Trigo, I.F. Monitoring Heat Extremes across Central Europe Using Land Surface Temperature Data Records from SEVIRI/MSG. Remote Sens. 2022, 14, 3470. [Google Scholar] [CrossRef]
  33. Teuling, A.J.; Seneviratne, S.I.; Stöckli, R.; Reichstein, M.; Moors, E.; Ciais, P.; Luyssaert, S.; van den Hurk, B.; Ammann, C.; Bernhofer, C.; et al. Contrasting Response of European Forest and Grassland Energy Exchange to Heatwaves. Nat. Geosci. 2010, 3, 722–727. [Google Scholar] [CrossRef]
  34. Teuling, A.J.; Van Loon, A.F.; Seneviratne, S.I.; Lehner, I.; Aubinet, M.; Heinesch, B.; Bernhofer, C.; Grünwald, T.; Prasse, H.; Spank, U. Evapotranspiration Amplifies European Summer Drought. Geophys. Res. Lett. 2013, 40, 2071–2075. [Google Scholar] [CrossRef]
  35. Russo, S.; Sillmann, J.; Fischer, E.M. Top Ten European Heatwaves since 1950 and Their Occurrence in the Coming Decades. Environ. Res. Lett. 2015, 10, 124003. [Google Scholar] [CrossRef]
  36. Rousi, E.; Kornhuber, K.; Beobide-Arsuaga, G.; Luo, F.; Coumou, D. Accelerated Western European Heatwave Trends Linked to More-Persistent Double Jets over Eurasia. Nat. Commun. 2022, 13, 3851. [Google Scholar] [CrossRef]
  37. Dirmeyer, P.A.; Balsamo, G.; Blyth, E.M.; Morrison, R.; Cooper, H.M. Land-Atmosphere Interactions Exacerbated the Drought and Heatwave Over Northern Europe During Summer 2018. AGU Adv. 2021, 2, e2020AV000283. [Google Scholar] [CrossRef]
  38. Mohammed, S.; Arshad, S.; Alsilibe, F.; Moazzam, M.F.U.; Bashir, B.; Prodhan, F.A.; Alsalman, A.; Vad, A.; Ratonyi, T.; Harsányi, E. Utilizing Machine Learning and CMIP6 Projections for Short-Term Agricultural Drought Monitoring in Central Europe (1900–2100). J. Hydrol. 2024, 633, 130968. [Google Scholar] [CrossRef]
  39. Wan, Z.; Dozier, J. A Generalized Split-Window Algorithm for Retrieving Land-Surface Temperature from Space. IEEE Trans. Geosci. Remote Sens. 1996, 34, 892–905. [Google Scholar] [CrossRef]
  40. Snyder, W.C.; Wan, Z.; Zhang, Y.; Feng, Y.-Z. Classification-Based Emissivity for Land Surface Temperature Measurement from Space. Int. J. Remote Sens. 1998, 19, 2753–2774. [Google Scholar] [CrossRef]
  41. Gorelick, N.; Hancher, M.; Dixon, M.; Ilyushchenko, S.; Thau, D.; Moore, R. Google Earth Engine: Planetary-Scale Geospatial Analysis for Everyone. Remote Sens. Environ. 2017, 202, 18–27. [Google Scholar] [CrossRef]
  42. Beck, H.E.; Wood, E.F.; Pan, M.; Fisher, C.K.; Miralles, D.G.; van Dijk, A.I.J.M.; McVicar, T.R.; Adler, R.F. MSWEP V2 Global 3-Hourly 0.1° Precipitation: Methodology and Quantitative Assessment. Bull. Am. Meteorol. Soc. 2019, 100, 473–500. [Google Scholar] [CrossRef]
  43. Singer, M.B.; Asfaw, D.T.; Rosolem, R.; Cuthbert, M.O.; Miralles, D.G.; MacLeod, D.; Quichimbo, E.A.; Michaelides, K. Hourly Potential Evapotranspiration at 0.1° Resolution for the Global Land Surface from 1981-Present. Sci. Data 2021, 8, 224. [Google Scholar] [CrossRef] [PubMed]
  44. Martens, B.; Miralles, D.G.; Lievens, H.; Van Der Schalie, R.; De Jeu, R.A.; Fernández-Prieto, D.; Beck, H.E.; Dorigo, W.A.; Verhoest, N.E. GLEAM v3: Satellite-Based Land Evaporation and Root-Zone Soil Moisture. Geosci. Model Dev. 2017, 10, 1903–1925. [Google Scholar] [CrossRef]
  45. Lipson, M.; Grimmond, S.; Best, M.; Chow, W.T.L.; Christen, A.; Chrysoulakis, N.; Coutts, A.; Crawford, B.; Earl, S.; Evans, J.; et al. Harmonized Gap-Filled Datasets from 20 Urban Flux Tower Sites. Earth Syst. Sci. Data 2022, 14, 5157–5178. [Google Scholar] [CrossRef]
  46. Perkins-Kirkpatrick, S.E.; Lewis, S.C. Increasing Trends in Regional Heatwaves. Nat. Commun. 2020, 11, 3357. [Google Scholar] [CrossRef]
  47. Wang, C.; Li, Z.; Chen, Y.; Ouyang, L.; Zhao, H.; Zhu, J.; Wang, J.; Zhao, Y. Characteristic Changes in Compound Drought and Heatwave Events under Climate Change. Atmos. Res. 2024, 305, 107440. [Google Scholar] [CrossRef]
  48. Hao, Z.; Hao, F.; Xia, Y.; Feng, S.; Sun, C.; Zhang, X.; Fu, Y.; Hao, Y.; Zhang, Y.; Meng, Y. Compound Droughts and Hot Extremes: Characteristics, Drivers, Changes, and Impacts. Earth-Sci. Rev. 2022, 235, 104241. [Google Scholar] [CrossRef]
  49. Fischer, E.M.; Seneviratne, S.I.; Vidale, P.L.; Lüthi, D.; Schär, C. Soil Moisture–Atmosphere Interactions during the 2003 European Summer Heat Wave. J. Clim. 2007, 20, 5081–5099. [Google Scholar] [CrossRef]
  50. Dole, R.; Hoerling, M.; Perlwitz, J.; Eischeid, J.; Pegion, P.; Zhang, T.; Quan, X.-W.; Xu, T.; Murray, D. Was There a Basis for Anticipating the 2010 Russian Heat Wave? Geophys. Res. Lett. 2011, 38, L06702. [Google Scholar] [CrossRef]
  51. Tripathy, K.P.; Mishra, A.K. How Unusual Is the 2022 European Compound Drought and Heatwave Event? Geophys. Res. Lett. 2023, 50, e2023GL105453. [Google Scholar] [CrossRef]
  52. Lenton, T.M.; Abrams, J.F.; Bartsch, A.; Bathiany, S.; Boulton, C.A.; Buxton, J.E.; Conversi, A.; Cunliffe, A.M.; Hebden, S.; Lavergne, T.; et al. Remotely Sensing Potential Climate Change Tipping Points across Scales. Nat. Commun. 2024, 15, 343. [Google Scholar] [CrossRef] [PubMed]
  53. Founda, D.; Giannakopoulos, C. The Exceptionally Hot Summer of 2007 in Athens, Greece—A Typical Summer in the Future Climate? Glob. Planet. Change 2009, 67, 227–236. [Google Scholar] [CrossRef]
  54. Bennett, A.C.; McDowell, N.G.; Allen, C.D.; Anderson-Teixeira, K.J. Larger Trees Suffer Most during Drought in Forests Worldwide. Nat. Plants 2015, 1, 15139. [Google Scholar] [CrossRef]
  55. Miralles, D.G.; Teuling, A.J.; van Heerwaarden, C.C.; Vilà-Guerau de Arellano, J. Mega-Heatwave Temperatures Due to Combined Soil Desiccation and Atmospheric Heat Accumulation. Nat. Geosci. 2014, 7, 345–349. [Google Scholar] [CrossRef]
  56. Guerreiro, S.B.; Dawson, R.J.; Kilsby, C.; Lewis, E.; Ford, A. Future Heat-Waves, Droughts and Floods in 571 European Cities. Environ. Res. Lett. 2018, 13, 034009. [Google Scholar] [CrossRef]
  57. Agathangelidis, I.; Blougouras, G.; Cartalis, C.; Polydoros, A.; Tzanis, C.G.; Philippopoulos, K. Global Climatology of the Daytime Surface Cooling of Urban Parks Using Satellite Observations. Geophys. Res. Lett. 2025, 52, e2024GL112887. [Google Scholar] [CrossRef]
  58. Stewart, I.D.; Oke, T.R. Local Climate Zones for Urban Temperature Studies. Bull. Amer. Meteor. Soc. 2012, 93, 1879–1900. [Google Scholar] [CrossRef]
  59. He, B.-J.; Fu, X.; Zhao, Z.; Chen, P.; Sharifi, A.; Li, H. Capability of LCZ Scheme to Differentiate Urban Thermal Environments in Five Megacities of China: Implications for Integrating LCZ System Into Heat-Resilient Planning and Design. IEEE J. Sel. Top. Appl. Earth Obs. Remote Sens. 2024, 17, 18800–18817. [Google Scholar] [CrossRef]
  60. Giannaros, C.; Agathangelidis, I.; Galanaki, E.; Cartalis, C.; Kotroni, V.; Lagouvardos, K.; Giannaros, T.M.; Matzarakis, A. Hourly Values of an Advanced Human-Biometeorological Index for Diverse Populations from 1991 to 2020 in Greece. Sci. Data 2024, 11, 76. [Google Scholar] [CrossRef]
  61. Yang, Y.; Anderson, M.C.; Gao, F.; Wood, J.D.; Gu, L.; Hain, C. Studying Drought-Induced Forest Mortality Using High Spatiotemporal Resolution Evapotranspiration Data from Thermal Satellite Imaging. Remote Sens. Environ. 2021, 265, 112640. [Google Scholar] [CrossRef]
  62. Liu, H.; Xin, X.; Su, Z.; Zeng, Y.; Lian, T.; Li, L.; Yu, S.; Zhang, H. Intercomparison and Evaluation of Ten Global ET Products at Site and Basin Scales. J. Hydrol. 2023, 617, 128887. [Google Scholar] [CrossRef]
  63. van Dijke, A.J.H.; Orth, R.; Teuling, A.J.; Herold, M.; Schlerf, M.; Migliavacca, M.; Machwitz, M.; van Hateren, T.C.; Yu, X.; Mallick, K. Comparing Forest and Grassland Drought Responses Inferred from Eddy Covariance and Earth Observation. Agric. For. Meteorol. 2023, 341, 109635. [Google Scholar] [CrossRef]
  64. Li, Z.-L.; Wu, H.; Wang, N.; Qiu, S.; Sobrino, J.A.; Wan, Z.; Tang, B.-H.; Yan, G. Land Surface Emissivity Retrieval from Satellite Data. Int. J. Remote Sens. 2013, 34, 3084–3127. [Google Scholar] [CrossRef]
Figure 1. Study area of Europe, the red boundary indicates the domain for the LSTmax anomaly indices; black dashed boundaries represent the geographical sub-regions defined by the Prediction of Regional scenarios and Uncertainties for Defining EuropeaN Climate change risk and Effects (PRUDENCE) modelling project; orange points indicate the locations of the micrometeorological towers, part of the Integrated Carbon Observation System (ICOS) network and the Urban-PLUMBER project.
Remotesensing 17 01655 g001
Figure 2. Emissivity map for of the MYD11A1 product for (a) band 31 (10.78–11.280 μm) and (b) band 32 (11.77 μm–12.27 μm).
Remotesensing 17 01655 g002
Figure 3. LSTmax standardized anomalies in Europe for 2003–2023 from Aqua MODIS daily daytime observations.
Remotesensing 17 01655 g003
Figure 4. Timeseries of mean positive LSTmax anomalies; dashed lines represent the trend.
Remotesensing 17 01655 g004
Figure 5. Monthly anomalies for summer 2022: (a) Aqua MODIS LSTmax standardized anomalies, (b) the standardized anomalies for ERA5-Land maximum air temperature, and (c) the SPEI values.
Remotesensing 17 01655 g005
Figure 6. The 2018 Northern European heatwave: (a) the monthly SPEI value for May 2018, (b) the monthly SPEI value for July 2018, (c) the standardized GLEAM soil moisture anomaly value for May 2018, (d) the standardized GLEAM soil moisture anomaly value for July 2018, (e) the LSTmax standardized anomaly for July 2018, and (f) the standardized anomaly for ERA5-Land maximum air temperature.
Remotesensing 17 01655 g006
Figure 7. (a) Monthly SPEI values and (b) monthly standardized GLEAM soil moisture anomaly value aggregated over the Scandinavia PRUDENCE subregion for 2018.
Remotesensing 17 01655 g007
Figure 8. Time series of (a) heatwave events per year (heatwave number, HWN), and (b) the total sum of heatwave days per year (heatwave frequency, HWF), (c) the duration of the longest heatwave per year (heatwave duration, HWD), for air temperature-based heatwaves (CTX90pct) and warm LST days (MXD_P85_D3) in the PRUDENCE Mediterranean and Scandinavia regions (2003–2023). The dotted lines correspond to the trends.
Remotesensing 17 01655 g008
Figure 9. Mean diurnal cycle of sensible and latent heat flux anomalies across land cover types during heatwaves, compared to typical conditions, based on observations from flux tower sites.
Remotesensing 17 01655 g009
Figure 10. Mean sensible and latent heat flux anomalies across land cover types during heatwaves, compared to typical conditions, based on observations from flux tower sites, for the hours 10:00–14:00.
Remotesensing 17 01655 g010
Figure 11. (a) Sensible and (b) latent heat flux for strong heatwave and drought heatwave day (4 August 2018), typical heatwave day (21 July 2019), and typical summer day (average values for all summer days) for the ICOS flux tower site CH-Fru (GRA land cover).
Remotesensing 17 01655 g011
Table 1. Summary of the datasets used to analyze heatwave and drought dynamics across Europe.
Short NameFull Name and DetailsVariableSpatial ResolutionTemporal ResolutionType
MYD11A1Aqua MODIS LST/Emissivity Daily Version 6.1LST~1 kmDailySatellite
MYD14A1Aqua MODIS Thermal Anomalies and Fire Daily Level 3 Version 6.1Fire mask~1 kmDailySatellite
MYD11A2Aqua MODIS LST/Emissivity 8-day composites Version 6.1LST~1 km8-day compositeSatellite
MYD14A2Aqua MODIS Thermal Anomalies and Fire 8-day composites Level 3 Version 6.1Fire mask~1 km8-day compositeSatellite
ERA5-LandERA5-Land post-processed daily statistics from 1950 to presentTmax~9 kmDailyReanalysis
SPEI-HRHydro-JULES: Global high-resolution drought datasets from 1981–2022SPEI~5 kmMonthlyReanalysis/Satellite
GLEAM SMGLEAM v3.7b: global dataset of different components of terrestrial evaporation spanning the 20-year period 2003–2022. Soil moisture~25 kmDailySatellite/Model
ICOSWarm Winter 2020 ecosystem eddy covariance flux product for 73 stations in FLUXNET-Archive format—release 2022-1QH, QEPoint-based30 minFlux tower
Urban-PLUMBERHarmonized, gap-filled dataset from 20 urban flux tower sites for the Urban-PLUMBER (Protocol for the Analysis of Land Surface Models Benchmarking Evaluation) projectQH, QEPoint-based30 minFlux tower
Table 2. Distribution of flux tower sites across different land cover types.
LandcoverNumber of Sites
Croplands (CRO)33
Closed Shrublands (CSH)3
Deciduous Broadleaf Forests (DBF)26
Evergreen Broadleaf Forests (EBF)2
Evergreen Needleleaf Forests (ENF)62
Grasslands (GRA)26
Mixed Forests (MF)15
Open Shrublands (OSH)9
Savannas (SAV)9
Permanent Wetlands (WET)16
Urban (URB)8
Woody Savannas (WSA)3
Table 3. Annual average number of days under CDHWs across all flux tower sites included in this study, categorized by geographical subregion. Heatwaves are identified using the MXD_P85_D3 LST anomaly index, while droughts correspond to severe and extreme events (SPEI < 1.42). Geographic codes are as follows: AL—Alps, BI—British Isles, EA—Eastern Europe, Fr—France, IP—Iberian Peninsula, MD—Mediterranean, ME—Mid-Europe, SC—Scandinavia (Figure 1).
YearALBIEAFRIPMDMESC
20035.50.00.00.07.50.03.40.4
20040.00.00.00.80.00.00.00.0
20050.00.00.00.03.60.00.10.0
20062.40.02.50.80.10.02.92.4
20070.80.00.00.00.04.00.00.0
20080.00.00.00.00.00.00.00.0
20090.20.00.00.02.60.00.00.0
20100.30.00.00.00.00.00.10.6
20112.10.00.00.00.00.00.00.0
20120.50.00.00.80.60.00.00.0
20130.40.01.80.00.00.00.10.0
20140.00.02.50.00.00.01.20.0
20154.10.05.80.53.20.01.42.6
20160.60.00.03.00.40.00.00.0
20170.00.00.80.01.40.00.30.0
20180.45.05.50.00.40.04.85.9
20192.90.01.84.00.00.02.30.0
20200.20.00.00.00.00.00.00.0
20210.30.00.00.00.40.00.01.4
20221.96.00.07.815.89.02.50.0
Table 4. Sensible and latent heat flux anomalies, compared to typical conditions, during a heat event at CH-Fru station (GRA land cover).
DateSensible Heat (W/m2)Latent Heat (W/m2)
30 July 20181395.1
31 July 2018−451.2
1 August 2018−6.111.9
3 August 201863.650.8
4 August 201894.4−68.6
5 August 2018119.9−43.2
6 August 201881.2−17.7
7 August 201881.7−34.9
Disclaimer/Publisher’s Note: The statements, opinions and data contained in all publications are solely those of the individual author(s) and contributor(s) and not of MDPI and/or the editor(s). MDPI and/or the editor(s) disclaim responsibility for any injury to people or property resulting from any ideas, methods, instructions or products referred to in the content.

