Abstract
Maintaining or improving habitat quality is essential for conserving biodiversity and ensuring the long-term survival of species. Nevertheless, increasing global warming and intensifying human activities have led to varying degrees of habitat degradation and biodiversity loss, especially in semi-arid regions. Focusing on China’s West Songnen Plain—the nation’s largest saline-alkali region confronting acute environmental challenges—this study introduced the soil salinization level and mean NDVI of farmland during the growing season as dynamic threat factors and systematically explored the spatiotemporal dynamic characteristics of habitat quality in the semiarid area of the West Songnen Plain from 1990 to 2020. The results showed the following: (1) Habitat quality exhibited a continuous decline during the study period, following a “degradation–recovery” trajectory with deterioration peaking in 2010; the low- and poor-quality habitats predominantly distributed in the central areas characterized by severe salinization, interspersed with patches of good-quality habitat. (2) The degradation of habitat quality was mainly concentrated in natural land cover types, whereas improvements were observed locally in farmland and bare land. However, slight opposite trends were detected between the mean habitat quality values and the habitat change areas in forests, waters, and bare land. As the elevation continuously increased, the habitat quality grade shifted towards better conditions. (3) A spatial autocorrelation analysis revealed a significant clustering of habitat quality, but the extent of hot spots and cold spots gradually shrank as grassland degradation and saline land management progressed. By incorporating dynamic threat factors and integrating multi-source data, this study improved the habitat quality assessment framework for semi-arid regions and provided scientific support for spatially stratified conservation strategies.
1. Introduction
A habitat represents the specific locale where an organism resides, embodying all environmental conditions vital for its survival and reproduction [1]. Habitat quality plays a crucial role in maintaining biodiversity and ecosystem resilience [2,3]. However, in recent decades, excessive human activities have led to the over-exploitation of natural ecological lands such as grasslands, rivers, and lakes, resulting in ecological issues like soil erosion, habitat destruction, and biodiversity loss [4]. The protection and restoration of habitats has become a key focus of the United Nations Sustainable Development Goals (SDGs) and the Convention on Biological Diversity (CBD) [5,6]. Natural habitats in semi-arid areas are particularly fragile and vulnerable to the impacts of urbanization and human activities, posing significant threats to the achievement of the United Nations Sustainable Development Goal 15, “Life on Land” [7]. Assessing habitat quality across spatial and temporal dimensions is crucial for monitoring ecosystem dynamics, predicting future ecological conditions, and evaluating the combined effects of human disturbances and natural changes [8,9].
The West Songnen Plain, located in a semi-arid region, possesses a limited environmental carrying capacity and an especially delicate ecosystem [10]. Natural factors such as low-lying topography and poor drainage have rendered the area highly prone to salinization [11,12]. Combined with intensive cultivation, overgrazing, and unsustainable resource use, these conditions have accelerated habitat degradation and biodiversity loss [13,14], manifesting in grassland degradation, desertification, and wetland shrinkage [15]. Due to the inherent vulnerability of the West Songnen Plain, small-scale environmental or human disturbances may result in disproportionately large impacts on ecosystem stability. Consequently, there is an urgent need for dynamic monitoring and precise evaluation of habitat quality to support effective ecological management.
Early assessments of habitat quality predominantly relied on indicator-based approaches. These methods typically depended on field surveys or the collection of species or population distribution data within the study area, providing critical support for habitat quality evaluation [16]. The MaxEnt model has been widely applied to assess species distributions [17,18]. MaxEnt combines statistical modeling with machine learning techniques, offering advantages in simulating species occurrence, particularly when distributions are sparse, irregular, or spatially limited. However, due to its high demands on human and material resources and relatively low operational efficiency, it is more suitable for studies focused on small or specific regions [19,20]. In contrast, ecological models facilitate large-scale, long-term assessments of habitat quality [21]. Examples of these models include the Multiscale Integrated Earth Systems (MIMES) model [22], the Social Values for Ecosystem Services (SolVES) model [23], and the Integrated Valuation of Ecosystem Services and Trade-offs (InVEST) model [24]. The InVEST model, in particular, leverages remote sensing and GIS to evaluate the impacts of land use changes and associated threats on habitat quality [25]. It is known for its quantitative accuracy, minimal data requirements, and robust visualization capabilities, making it well-suited for data-scarce or unsampled areas [26,27]. Benefiting from these attributes, the InVEST model has been widely applied for habitat quality assessment and spatiotemporal change monitoring.
Previous studies have aimed to improve habitat assessment results by optimizing parameter collection and correcting habitat quality using the Normalized Difference Vegetation Index (NDVI) [28,29,30,31,32]. When considering soil salinization as a threat factor in habitat quality assessment, prior studies [33] predominantly conducted evaluations solely based on salinization in permanent bare soil areas. This focus led to a significant limitation, as these studies failed to account for the impact of soil salinization on the habitat quality of vegetated regions, overlooking the ecological dynamics and vulnerabilities unique to plant—covered landscapes. Moreover, the majority of advancements have predominantly focused on the negative impacts of threats. This is largely due to the scarcity of comprehensive field research on ecosystems, which may undermine the accuracy and practical implementation of the assessments [34,35]. Relying solely on land cover classification data is often insufficient for accurately detecting changes in habitat quality, particularly when areas exhibit identical land cover types.
To address these limitations, this study integrated two crucial environmental threat factors into the evaluation framework: (a) the soil salinization data across the vegetated and bare region and (b) the mean Normalized Difference Vegetation Index (NDVI) grade data in farmland throughout the vegetation growing seasons. Concerning the weights of threat factors, we substituted the original fixed-weight approach with a dynamic-weight method. The soil salinization factor was classified into three grades, slight, moderate, and intensive, with distinct weight values assigned to each grade. Meanwhile, the mean NDVI in farmland areas was divided into four grades using the natural break method, and different weight values were assigned to each of these grades. This study incorporated the salinization levels of both vegetated and bare areas to enable a more comprehensive evaluation of habitat quality. This approach provides a new perspective for revealing the spatial dynamics of habitat quality.
2. Materials and Methods
2.1. Overview of the Study Area
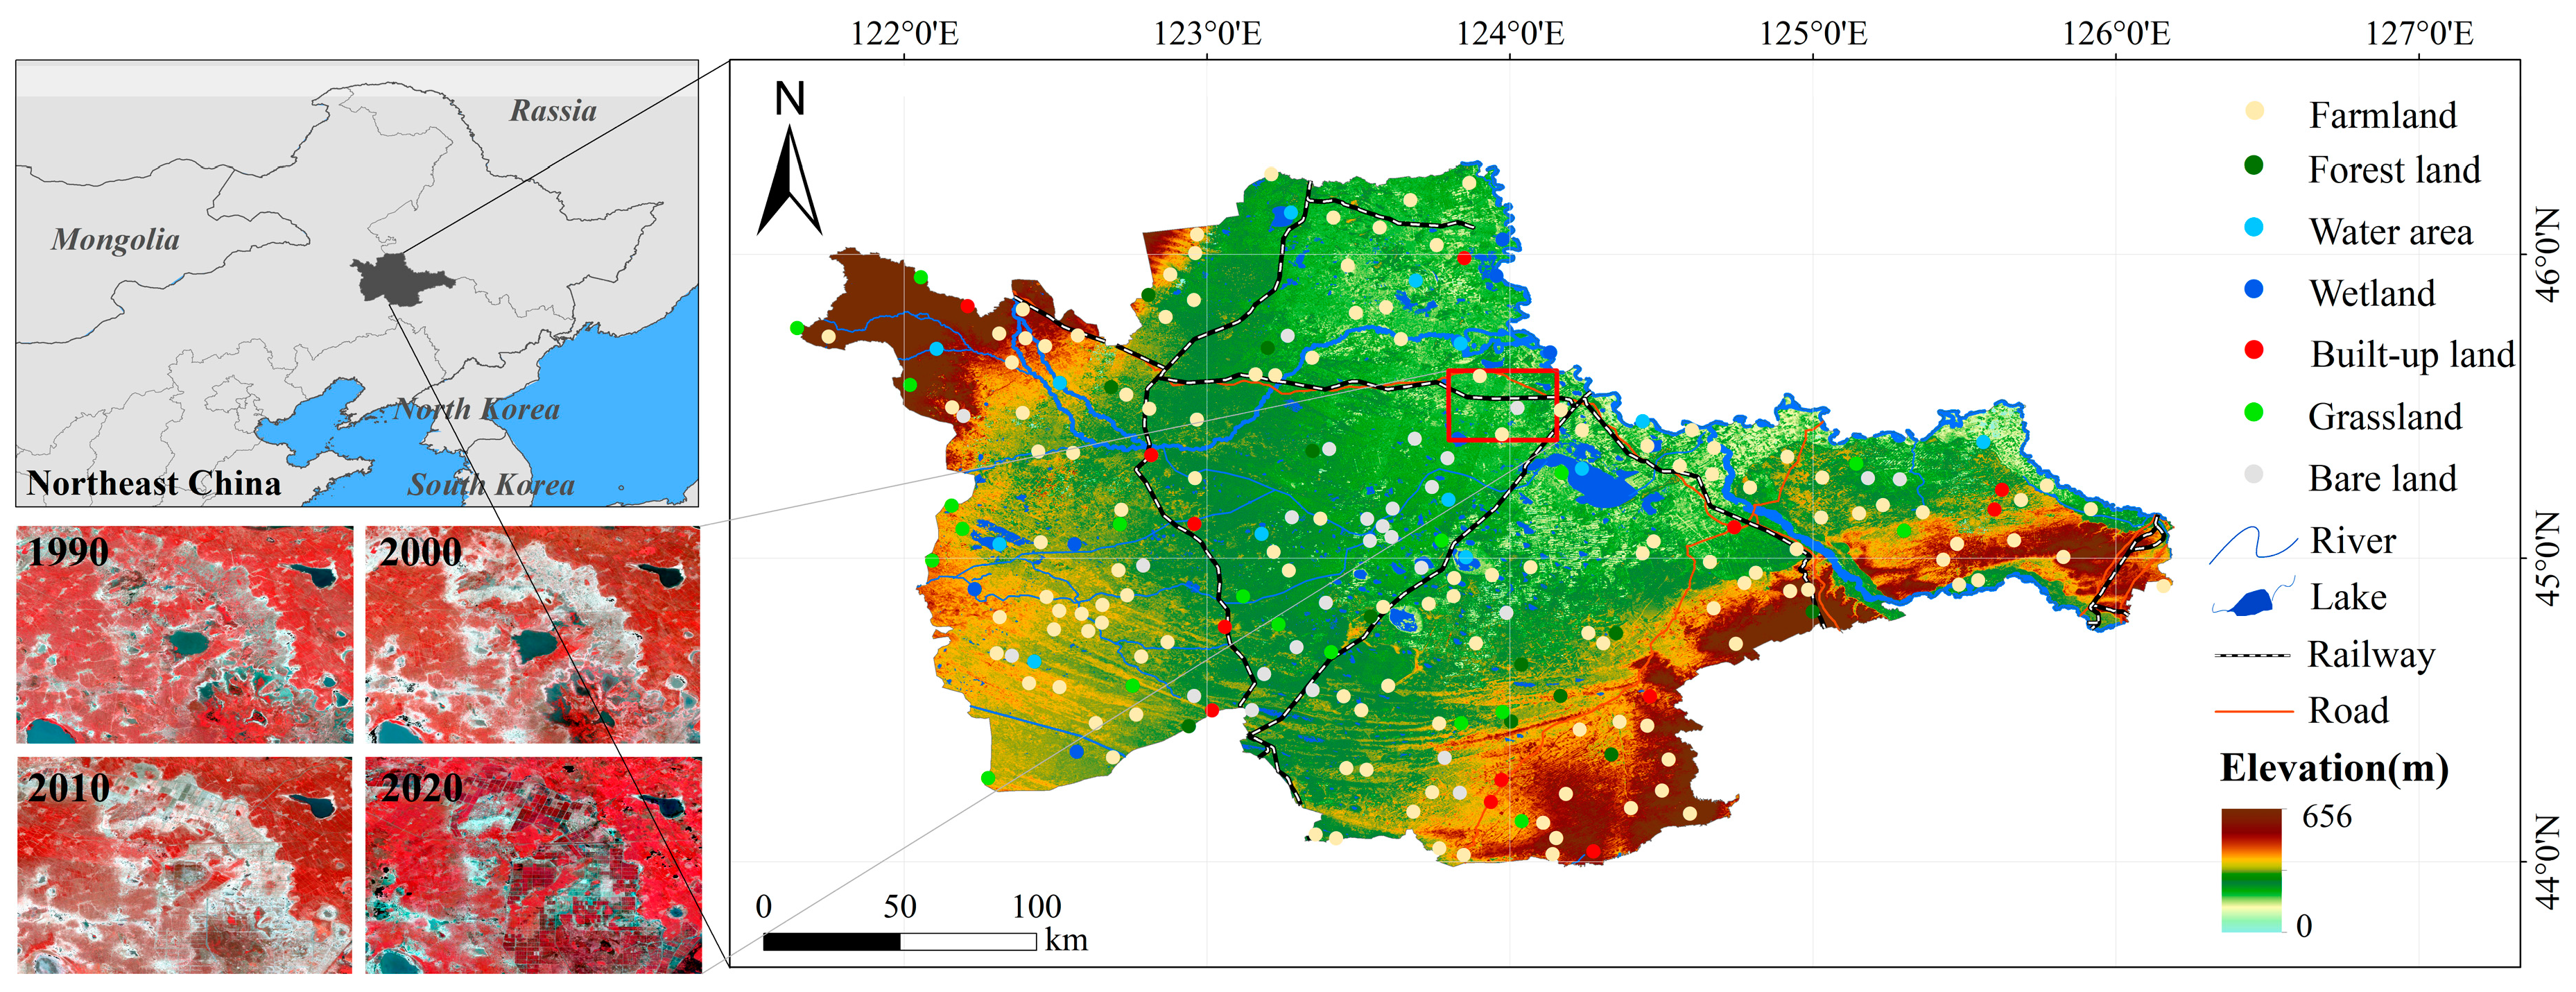
The West Songnen Plain is an important grain production base and ecological security barrier in Northeast China [36]. It is also a crucial ecological function area for biodiversity conservation and flood regulation and storage within the ecological security strategic framework of “Two Ecological Shelters and Three Belts” in China [37]. The West Songnen Plain, located in the northeastern part of China, is one of the world’s three largest saline-alkali regions. The region’s low-lying topography and inadequate drainage further worsen salt concentration in soil depressions, resulting in severe soil salinization that threatens ecosystem health and ecological stability. It covers an area of approximately 4.69 × 10⁶ hm2 and is situated between 43°59′N and 46°18′N, and 121°38′E and 126°11′E (Figure 1). The West Songnen Plain is an agro-pastoral, ecologically fragile zone with an abundance of natural resources that transform the region into a breeding ground and habitat for numerous waterfowl species, including the red-crowned crane, oriental white stork, and wild duck [38,39]. This region experiences a temperate, continental, semi-arid and semi-humid monsoon climate [40], with annual evaporation between 1500 and 1900 mm, increasing from east to west, while annual precipitation ranges from 360 to 500 mm, roughly a quarter of the evaporation.
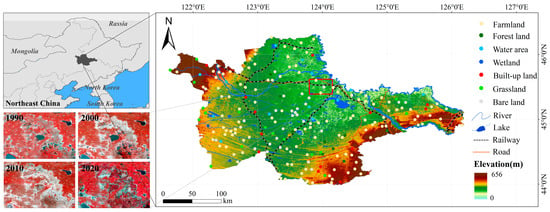
Figure 1.
Geographical location and degree of soil salinization in the study area.
2.2. Data Sources and Preprocessing
In this study, Landsat-5 TM and Landsat-8 OLI imagery with cloud cover of less than 5% were used, sourced from the GEE platform, covering the period from 1990 to 2020. The data were gathered during the vegetation growing season (May to September), when distinct vegetation characteristics aid in identifying land use types. Preprocessing steps, including atmospheric, topographic, and geometric corrections, were conducted on the GEE platform to ensure data quality and consistency. After using ArcGIS 10.6 to mosaic and crop the Landsat imagery, we used the World Geodetic System (WGS) 1984 datum to georeference it to the Universal Transverse Mercator (UTM) coordinate system. Additionally, we calculated the mean NDVI values during the growing season for assessing habitat quality. The temporal information of all the images used in this study is listed in Table 1.

Table 1.
Acquisition periods and path/row numbers of Landsat images.
In 1990, 2000, and 2010, ArcGIS 10.6 was used to generate 600 random points, with land categories verified using Google Earth historical images. For 2020, 400 random points were generated, and high-resolution Jilin-1 satellite images were employed for accuracy verification. Additionally, we collected 246 sampling points in 2020; after filtering out adjacent points (closer than 100 m), a total of 614 verification points were obtained.
In this study, we also utilized basic geographic datasets, including DEM and slope data; natural environment datasets, such as precipitation (PRE) and evaporation (EVP) data; socioeconomic datasets, including population distribution (POP) and gross domestic product (GDP) data; and road datasets. Due to data availability limitations, road data (including railways, highways, and national roads) for the years 1990 and 2000 were substituted with data from 1995, while data for 2010 were replaced with those from 2012. Given the geographical location and ecological conditions of the study area, salinization data were incorporated as an initial dataset for habitat quality evaluation. The dataset was obtained from previously published research results [41]. Detailed information is shown in Table 2.

Table 2.
Data sources and resolution.
2.3. Research Methods
2.3.1. Object-Based Image Analysis
Object-based image analysis (OBIA) is an advanced method in remote sensing that combines image processing with GIS functions [42]. OBIA leverages not only spectral information but also features such as shape, texture, and context to minimize misclassification from spectral variability, thereby enhancing classification accuracy [43]. For medium (10–30 m pixels) to high (2–10 m pixels) spatial resolution satellite images, OBIA offers distinct classification advantages: (1) it fully utilizes object-level comprehensive information, effectively reducing the “salt and pepper” effect [44]; (2) it can accurately define land cover boundaries and attributes, capturing the true details of the landscape [45].
In the study area, significant grassland degradation and uneven vegetation coverage create strong internal spectral heterogeneity, often producing a “salt and pepper” effect and indistinct boundaries. To address this, the OBIA method was employed for classifying land cover types in the West Songnen Plain. Based on the region’s land cover characteristics, land cover was divided into 7 primary and 12 secondary categories (Table 3).

Table 3.
Land cover classification system for the West Songnen Plain.
2.3.2. Random Forest
Random Forest (RF) is a widely used non-parametric machine learning classifier, particularly prominent in land use/land cover (LULC) classification [46]. As one of the most effective supervised classification algorithms, RF has become dominant in the classification of medium-resolution satellite imagery due to its robustness to outliers and noise, as well as its ability to substantially reduce the risk of overfitting [47,48].
Based on the segmented objects, the Random Forest (RF) algorithm was employed to classify the Landsat imagery using selected spectral bands and spectral indices as input features, resulting in the generation of the primary land cover classes. During sample selection, less representative points were chosen for land cover classes with better separability, whereas more representative points were prioritized for classes with poorer separability to improve classification performance [49].
After the Random Forest classification, construction land was categorized into urban and rural areas based on its area size and geographical location. For differentiating paddy fields from dryland, we took advantage of the water-filled characteristics of paddy fields during the irrigation period in May after the Random Forest classification. Grasslands with different vegetation cover levels were classified based primarily on threshold values of Fraction Vegetation Coverage.
For each period, the sampling points were split into two groups with a 7:3 proportion. The 70% subset was utilized to create the class labels essential for training the Random Forest classification algorithm. Meanwhile, the remaining 30% of sampling points functioned as a validation set, rigorously assessing the precision of the classification outcomes to guarantee the integrity and validity of the study’s findings.
2.3.3. InVEST Model
The InVEST model is designed to conduct a quantitative assessment of habitat quality from a biodiversity perspective [50]. This study used the habitat quality module to generate a spatial distribution map of habitat quality by accurately evaluating the suitability of different land use types and the impact of various threatening factors in the study area [51]. The model produces ratings for habitat quality that range from 0 to 1, where higher values denote more favorable habitat conditions. The calculation formula is as follows:
where Qxj represents the habitat quality index; Hj represents the habitat suitability of land type j; Dxj represents the level of threat experienced by land cover type j in grid cell x; z represents a normalizing constant (typically 2.5); and K represents the half-saturation constant, generally taken as half of the maximum habitat degradation value.
Several crucial parameters come into play when assessing habitats with the InVEST model: LULC data, a raster layer depicting threat factors, threat factor weights, their respective maximum influence distances, habitat type sensitivity scores to threats, and habitat suitability scores. Accurately defining habitat threat factor parameters is a critical aspect of the InVEST model [52]. Threat factors encompass a diverse range, including biotic elements like alien species invasion, abiotic components such as temperature and precipitation, as well as anthropogenic disturbances like land use change, road construction, and rural settlements [53]. Prior research has extensively explored the ecological and environmental implications of anthropogenic disturbances, with many studies centering on the impacts of land use change or examining the combined threats of land use change and roads. Building on the work of Sun et al. [54] and considering the unique context of the West Songnen Plain, our study carefully selected relevant anthropogenic disturbance and soil degradation factors as key threats to habitats. By classifying mean NDVI values during farmland growing seasons, we refined the threat factor weighting. These selected factors formed the foundation for our subsequent parameterization and analysis, ensuring the model’s relevance and applicability to the study area.
Drawing upon previous research [31,33,55,56,57] conducted in comparable environments, local conditions within the West Songnen Plain, and guidance from the InVEST model user manual, we meticulously calibrated these parameters. The specific values assigned to the parameters are summarized in Table 4 and Table 5, providing a comprehensive overview of the methodological framework underpinning our analysis.

Table 4.
The threat sources and related coefficients.

Table 5.
Habitat suitability and sensitivity of land cover types.
2.3.4. Variation in Habitat Quality Analysis
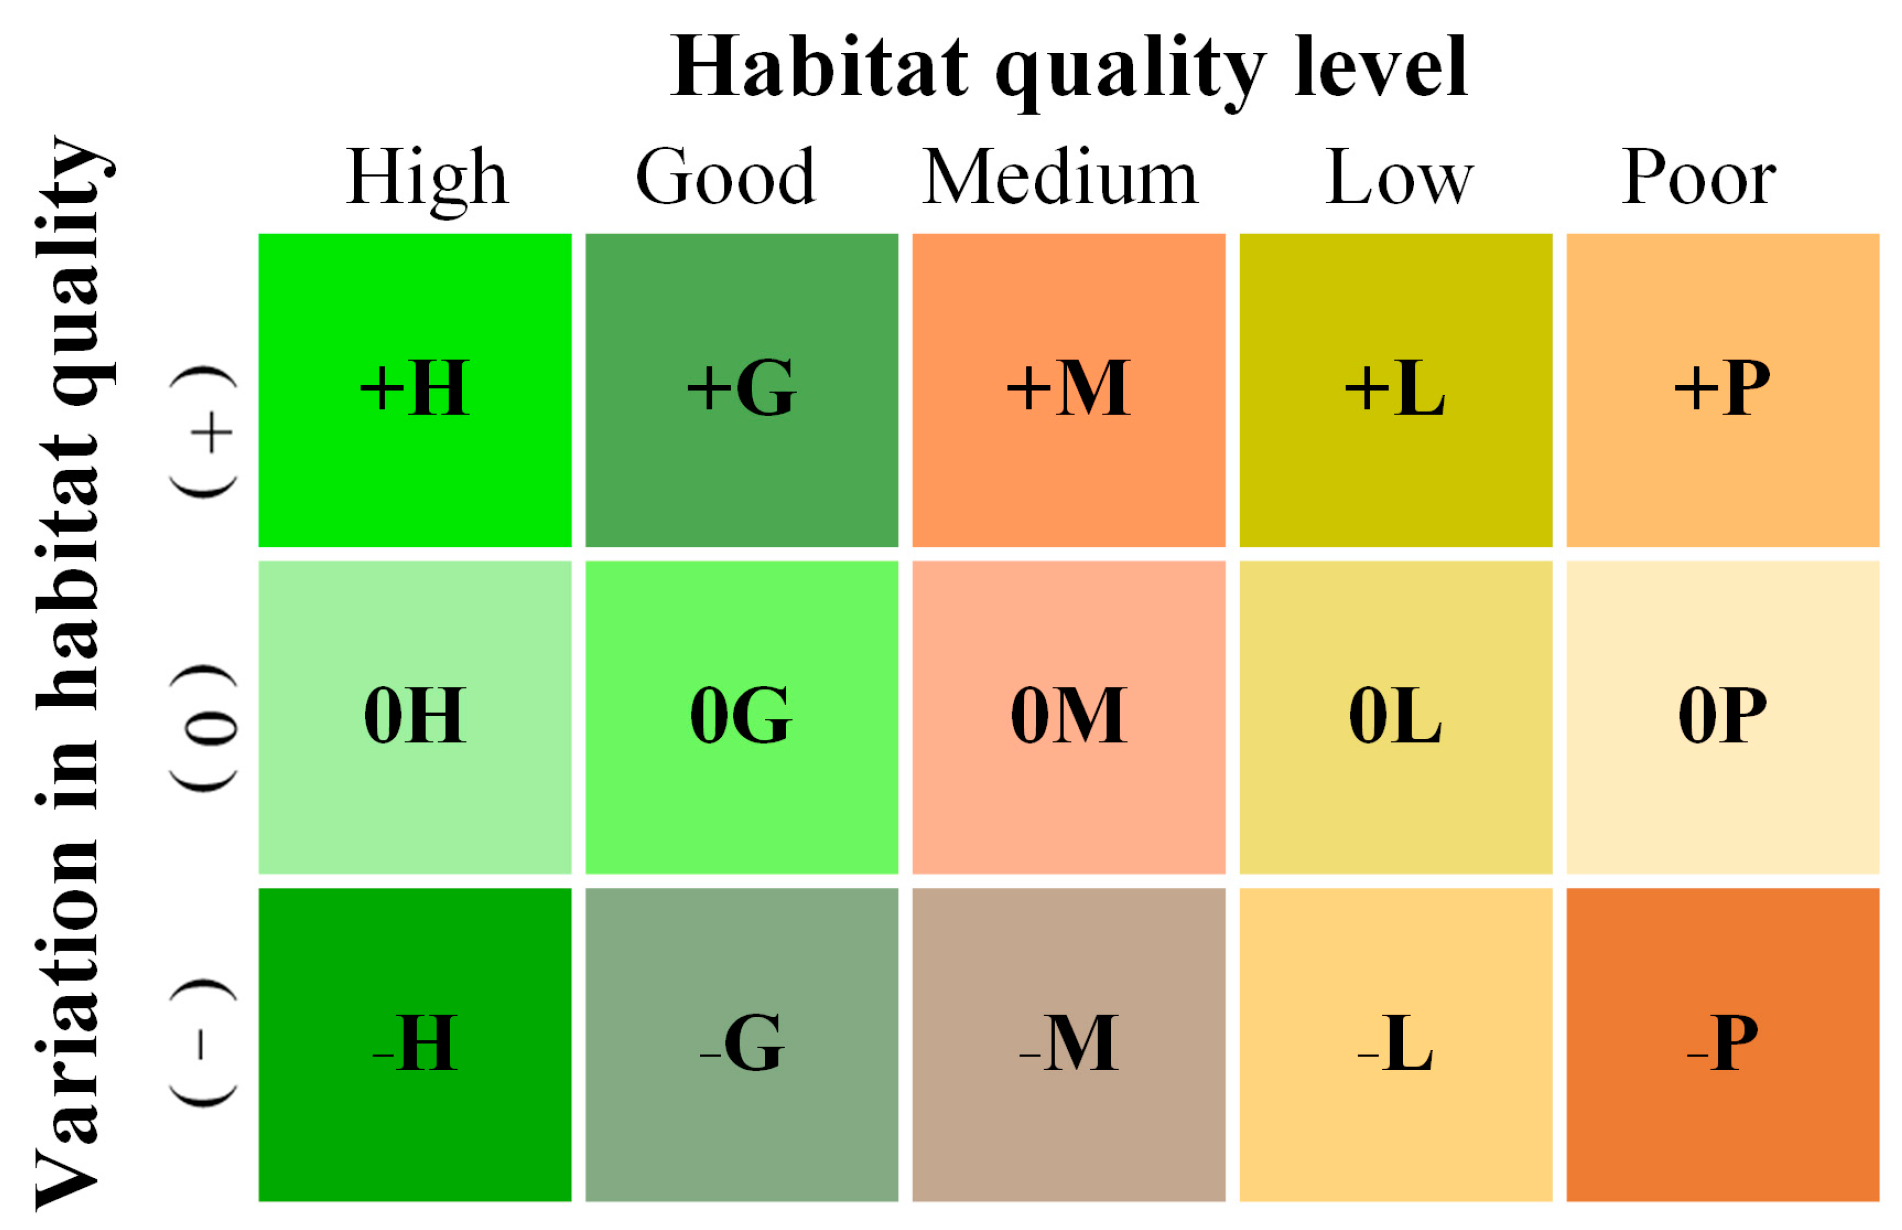
To accurately capture habitat quality dynamics, this study utilized a classification approach adapted from greening score evaluations [58], integrating current habitat quality conditions with historical trends to analyze habitat quality changes in the West Songnen Plain. The habitat quality score was determined on a pixel-by-pixel basis, factoring in the quality grade for future years and the trend in quality change over the study period. This method provided a more comprehensive view of spatial habitat distribution and its dynamic shifts. For instance, areas where habitat quality increased to a high level were classified as [+H], regions with consistently high habitat quality were marked as [0 H], and areas experiencing a decline in quality to a lower grade were classified as [-H].
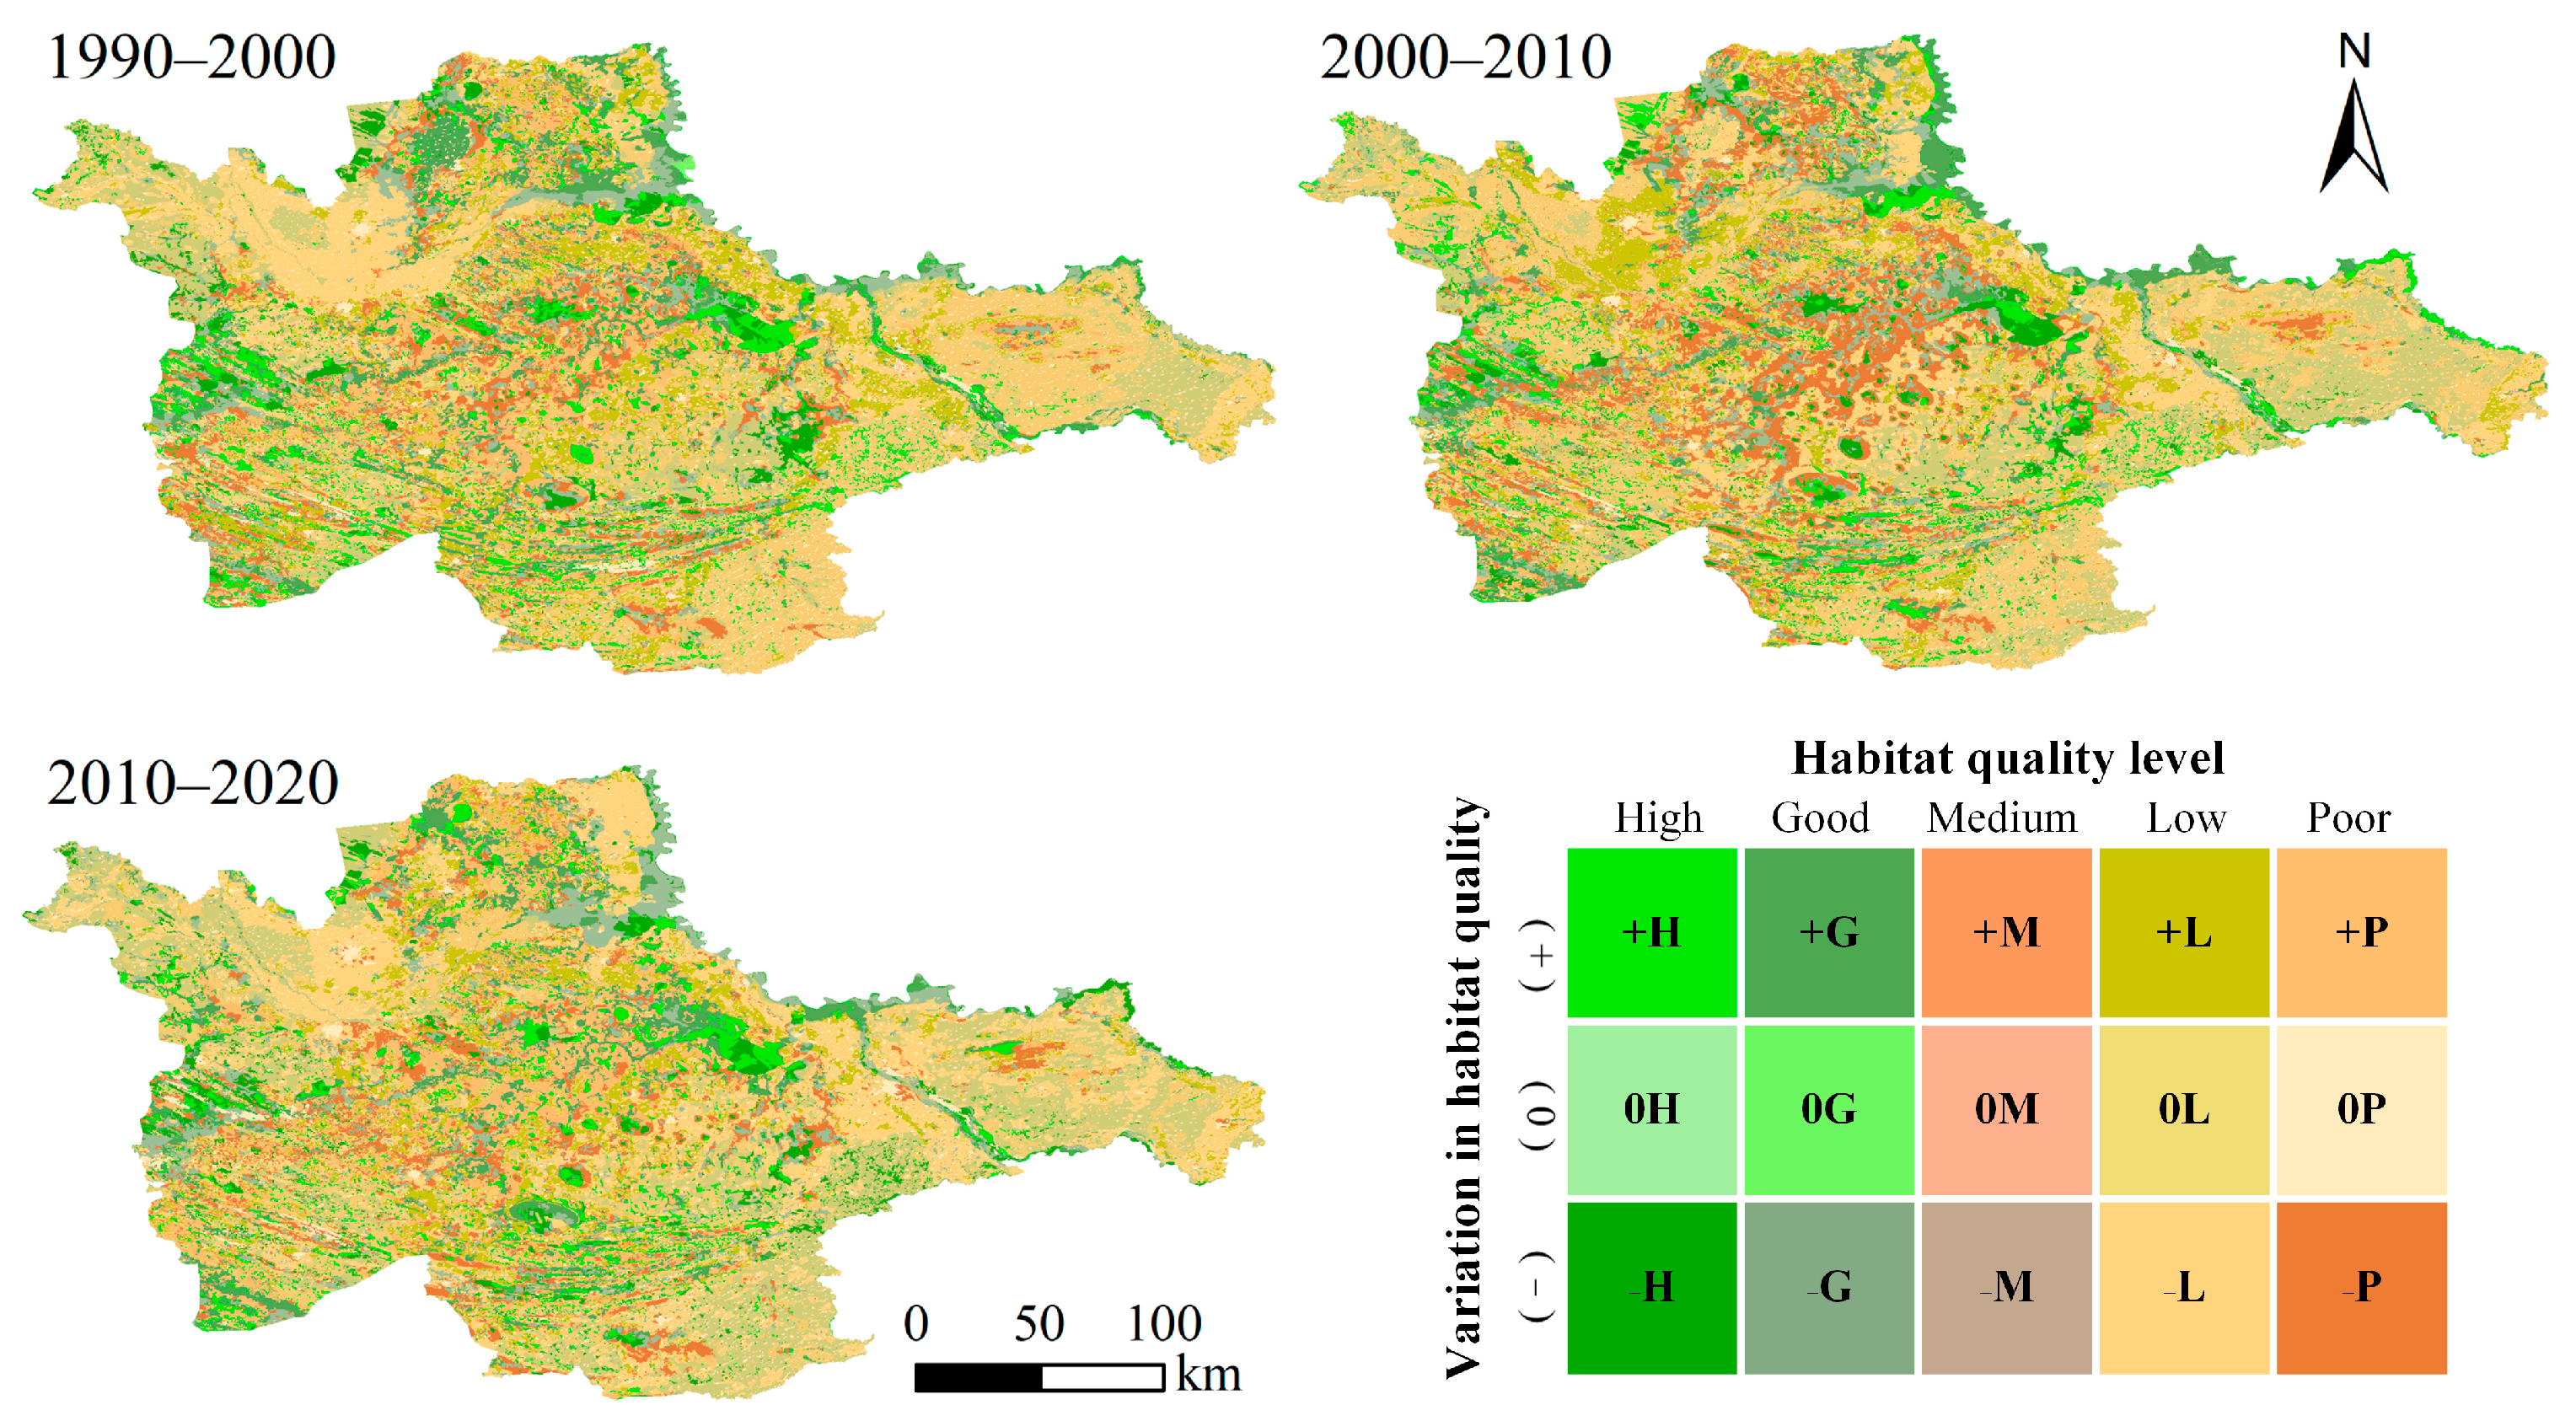
This study uses the equal interval method to categorize the habitat quality index into five levels: poor (0–0.2), low (0.2–0.4), medium (0.4–0.6), good (0.6–0.8), and high (0.8–1). Additionally, it classified habitat quality trends into three levels: increasing [+], unchanged [0], and decreasing [−]. This combination resulted in 15 distinct categories of change, as shown in Figure 2.
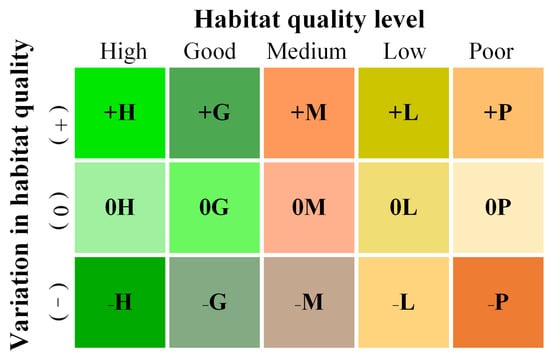
Figure 2.
Habitat quality change matrix (rows: high habitat quality [H], good habitat quality [G], medium habitat quality [M], low habitat quality [L], poor habitat quality [P]; columns: increasing [+], unchanged [0], decreasing [−]).
2.3.5. Spatial Autocorrelation and Hot-Spot Analysis
The global Moran’s I index was used to analyze the spatial autocorrelation of habitat quality changes, providing insights into overall spatial correlations of habitat quality across regions. To further examine spatial clustering and variability in habitat quality, the study applied the Getis–Ord Gi* statistic, allowing for the identification of “hot spots” and “cold spots” within the distribution. Together, these methods effectively assess aggregation and differentiation of habitat quality within spatial units, uncovering the degree of spatial connectivity across different regions [59]. The magnitude of these indicators reflects the intensity of hot- or cold-spot clustering, facilitating an understanding of spatial heterogeneity and evolving habitat quality trends in the study area. The calculation formula is shown in Equation (2):
where Gi* is the G* value of pixel i in the habitat quality change raster data, and xj is the habitat quality change value; wij is the spatial weight matrix of pixel i and pixel j defined according to the distance rule; xavg is the mean of the habitat quality change value; S is the standard deviation of the habitat quality change values; and n is the total number of pixels.
To capture regional detail effectively, the study area was divided into 2 km × 2 km grid cells. Spatial statistical tools were applied to grid maps of habitat quality across stages. A significantly positive Getis–Ord Gi* value indicates a high habitat quality hot spot with strong spatial clustering, whereas a significantly negative value denotes a low habitat quality cold spot with clear spatial clustering. Regions with confidence intervals exceeding 90% were classified as hot or cold spots, reflecting statistically significant habitat quality patterns.
3. Results
3.1. Spatiotemporal Characteristics of Land Cover Change from 1990 to 2020
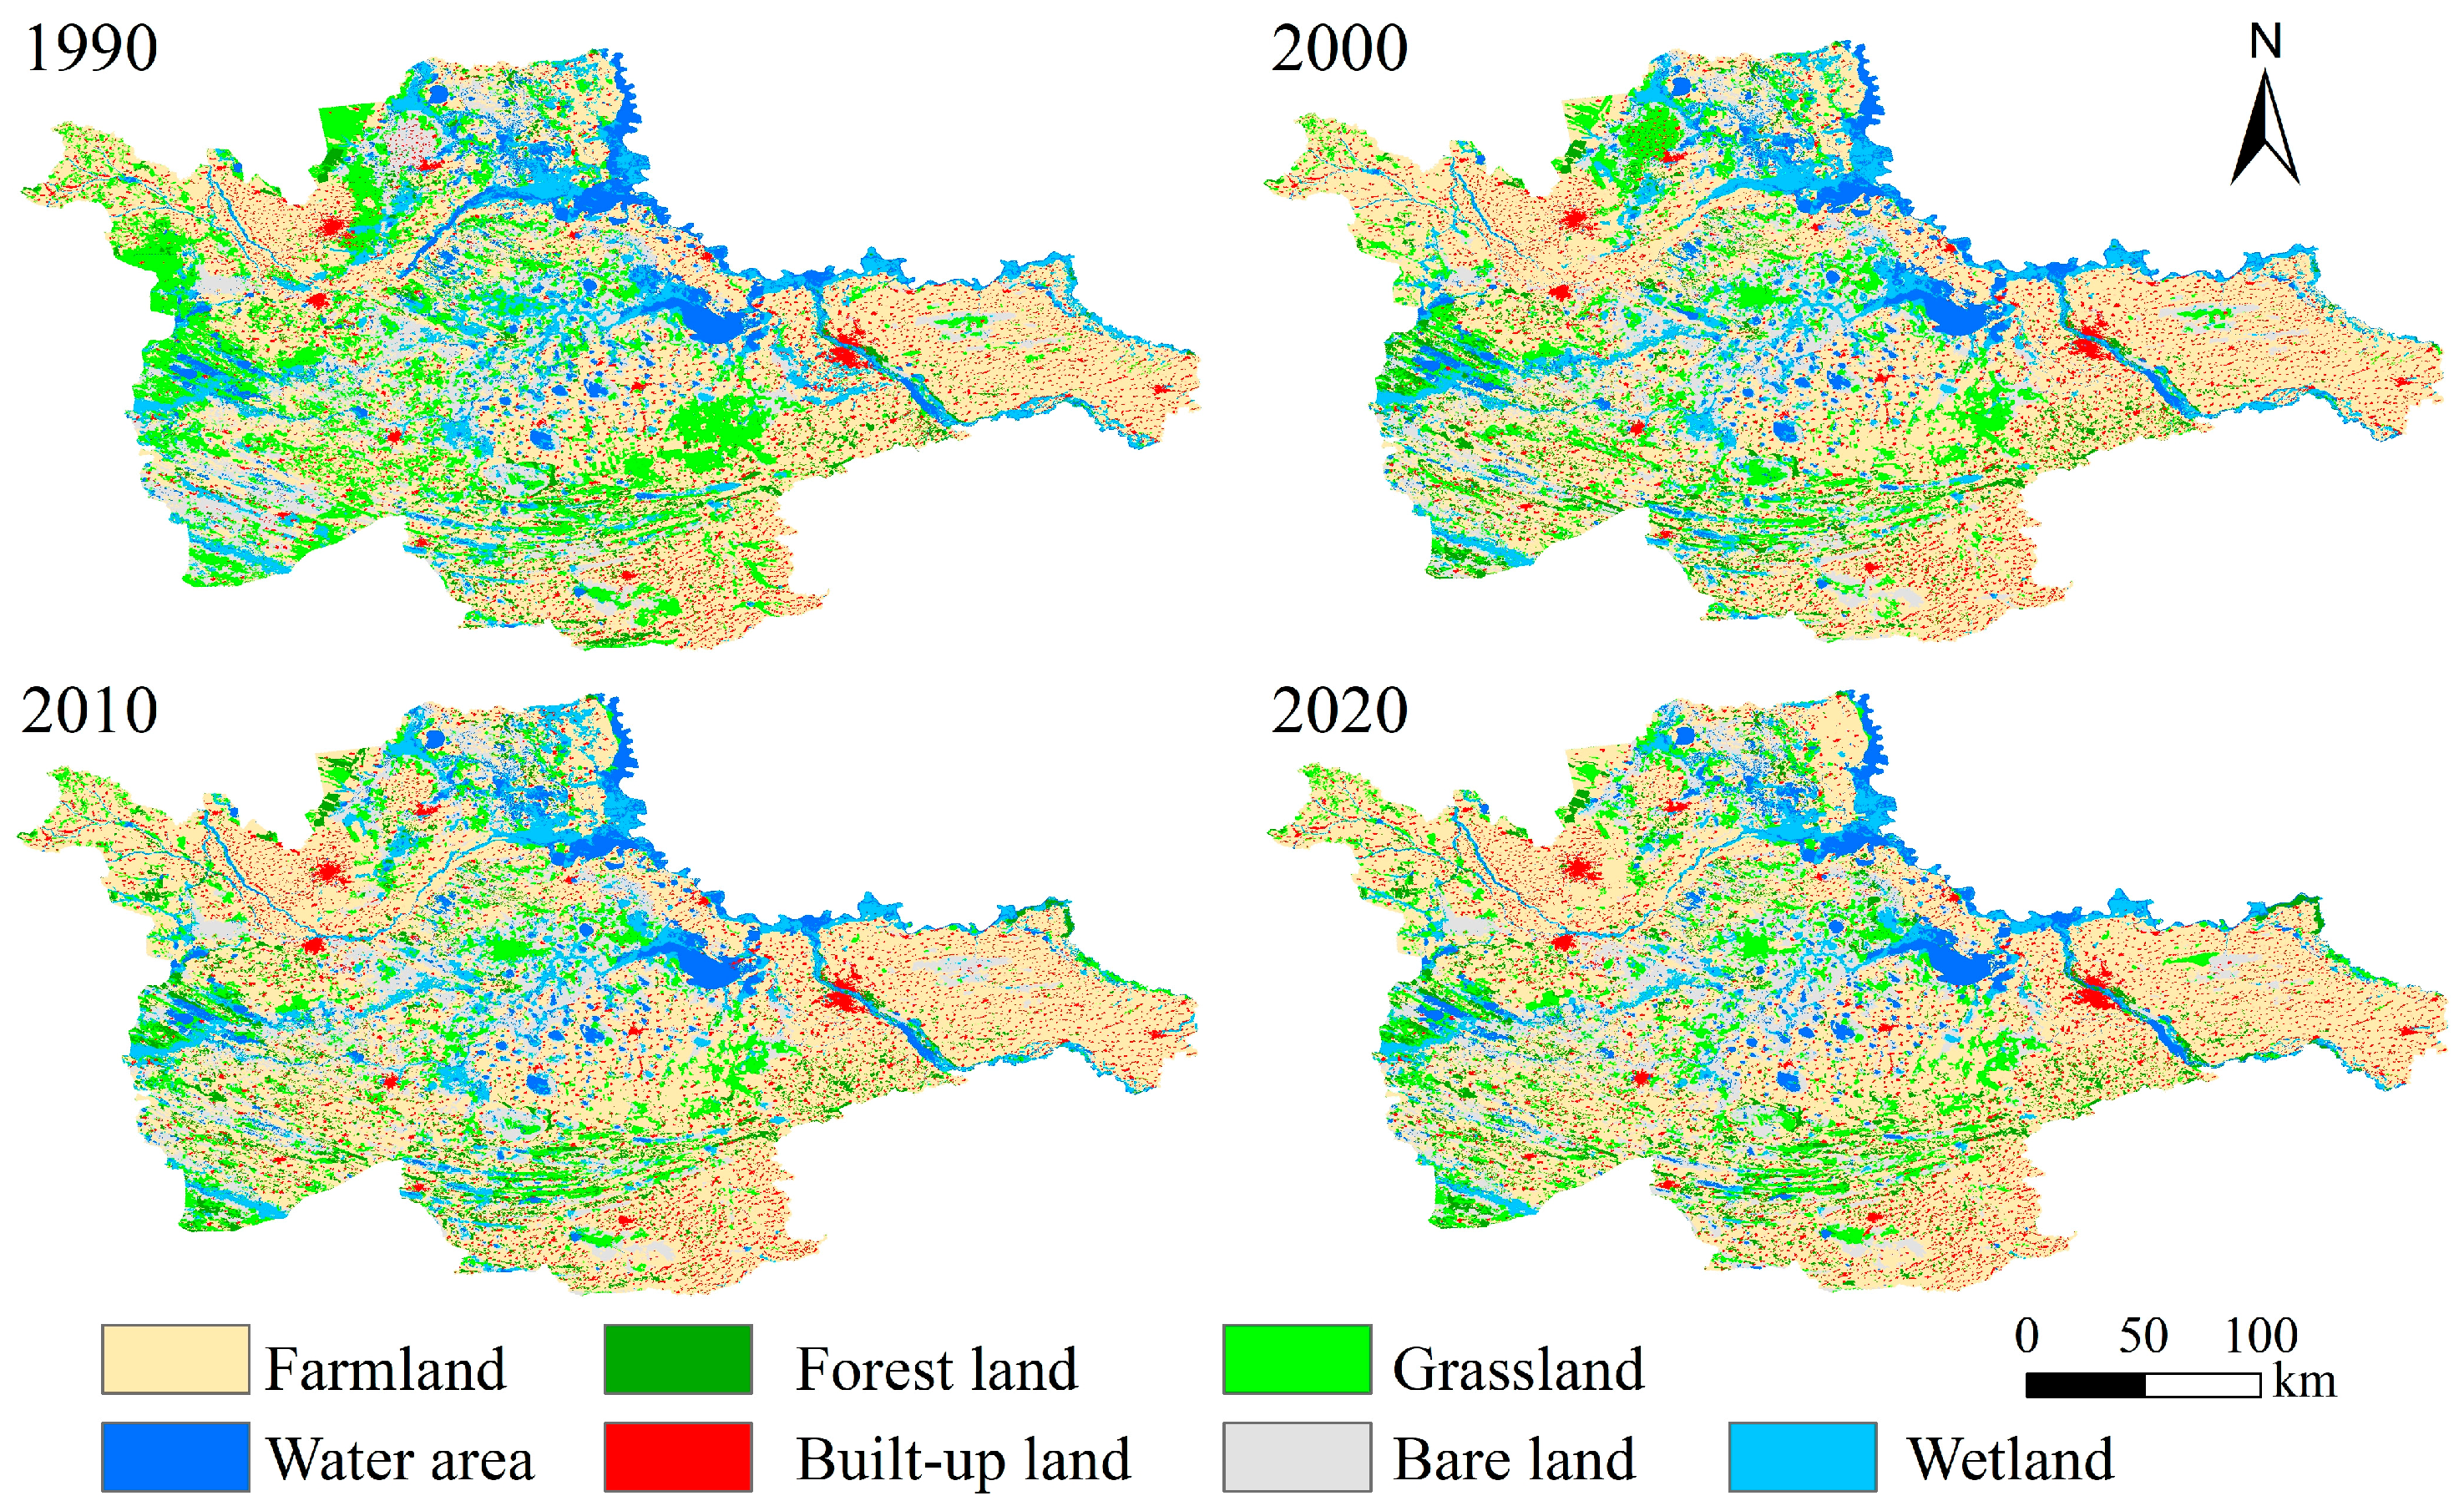
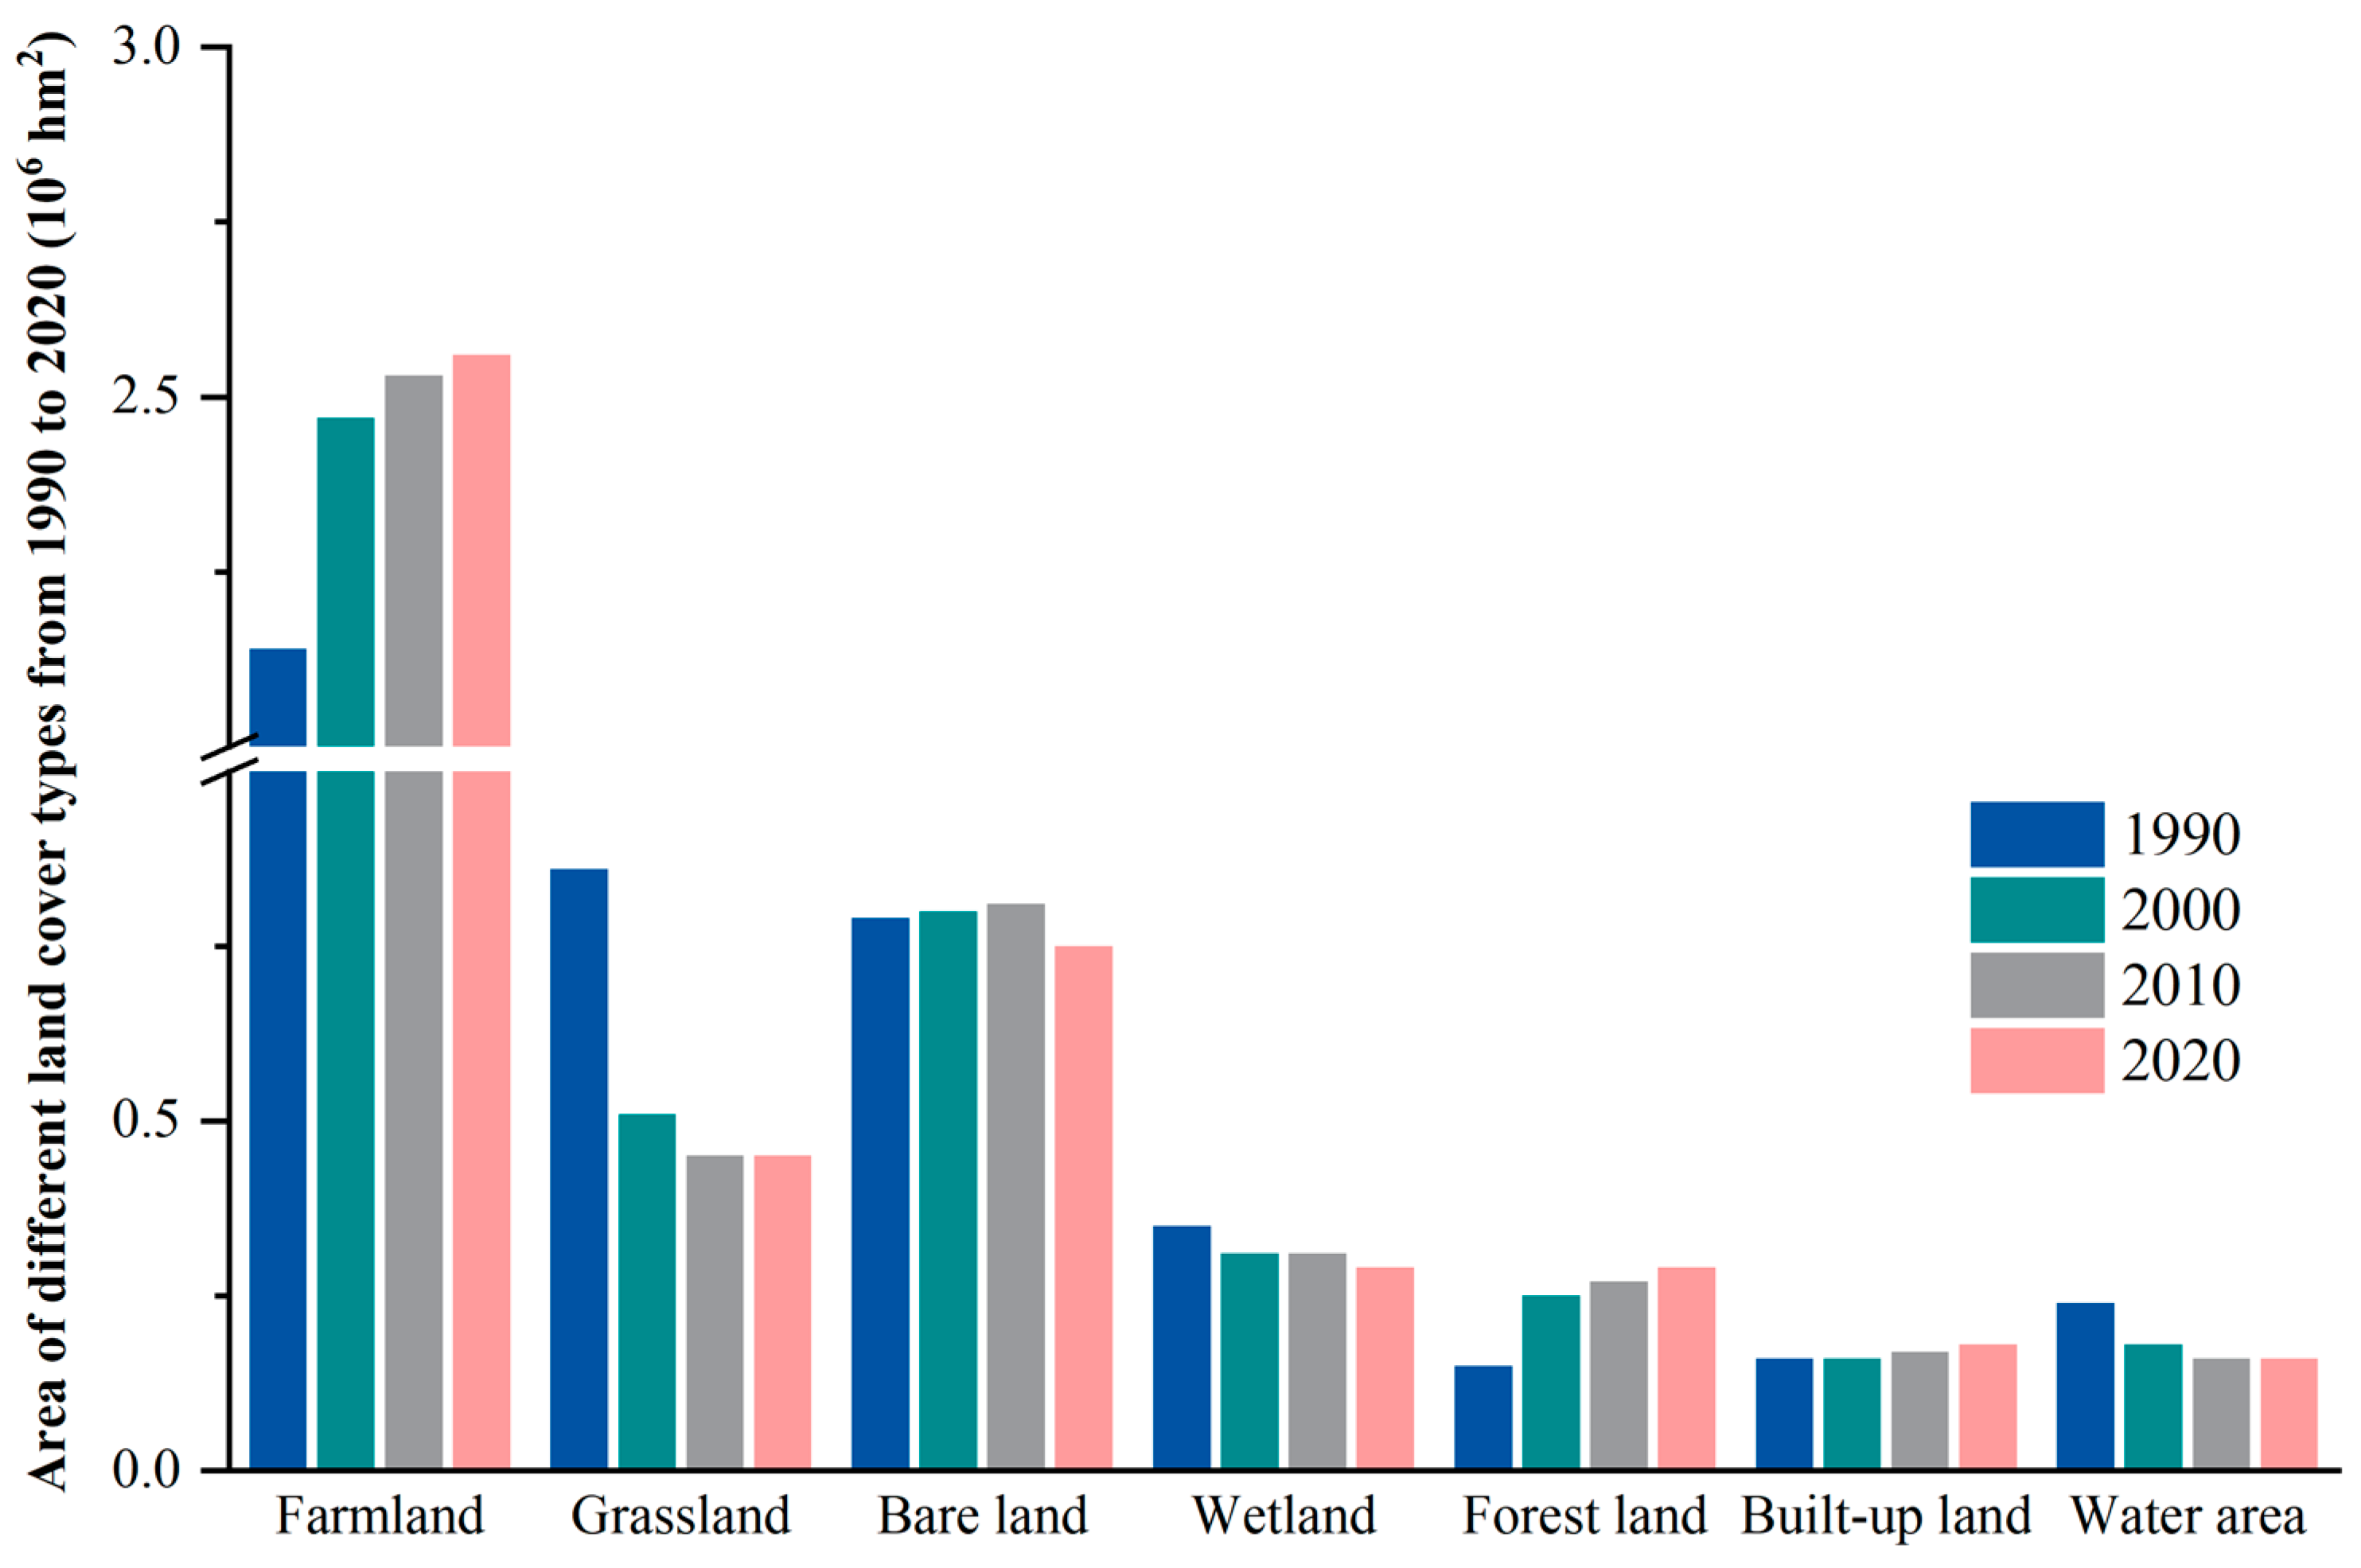
The accuracy of land cover data interpretation across four periods was validated using a confusion matrix, with each period’s classification accuracy exceeding 90% (Table 6). In the West Songnen Plain, land cover is predominantly farmland, followed by grassland and bare land. As of 2020, farmland and grassland occupied 2.56 × 10⁶ hm2 and 0.45 × 10⁶ hm2, accounting for 54.66% and 9.63% of the total area, respectively. Bare land covered 0.75 × 10⁶ hm2, representing 16.02% of the total area (Figure 3).

Table 6.
Accuracy verification table.
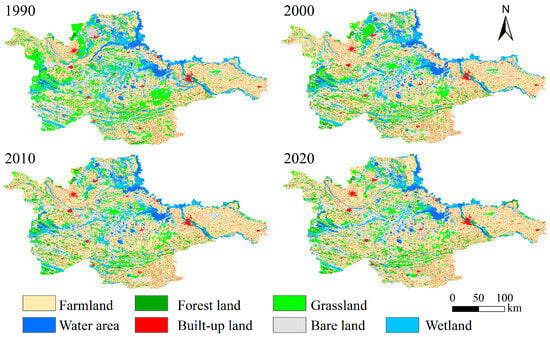
Figure 3.
Spatial distribution of land cover types in the West Songnen Plain.
Land cover changes in the West Songnen Plain from 1990 to 2020 revealed an overall trend of “increasing non-natural vegetation area and decreasing natural vegetation area” (Figure 4). During that period, farmland and built-up land areas grew steadily, increasing by 0.43 × 10⁶ hm2 and 0.03 × 10⁶ hm2, with growth rates of 20.03% and 17.20%, respectively. The expansion of forested land, the only natural vegetation type that increased, was influenced by policies like the “Three-North Shelterbelt Program” and the “Natural Forest Protection Program”. In contrast, other natural cover types declined, with grassland showing the steepest reduction, dropping by 0.41 × 10⁶ hm2 (47.55%). Water bodies, wetlands, and bare land also decreased by 0.08 × 10⁶ hm2 (34.85%), 0.06 × 10⁶ hm2 (17.52%), and 0.04 × 10⁶ hm2 (5.00%), respectively. The most significant land cover changes occurred between 1990 and 2000, totaling 0.84 × 10⁶ hm2, largely due to shifts in farmland and grassland. After 2000, the rate of change stabilized.
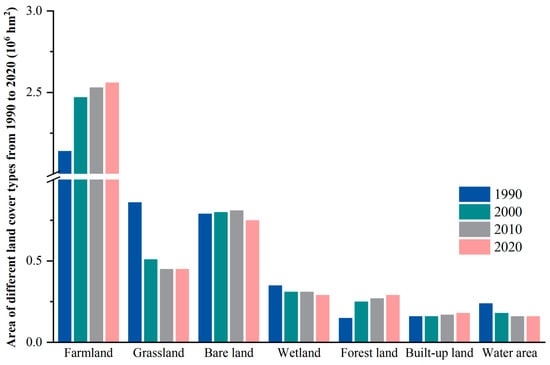
Figure 4.
Land cover area in the West Songnen Plain from 1990 to 2020.
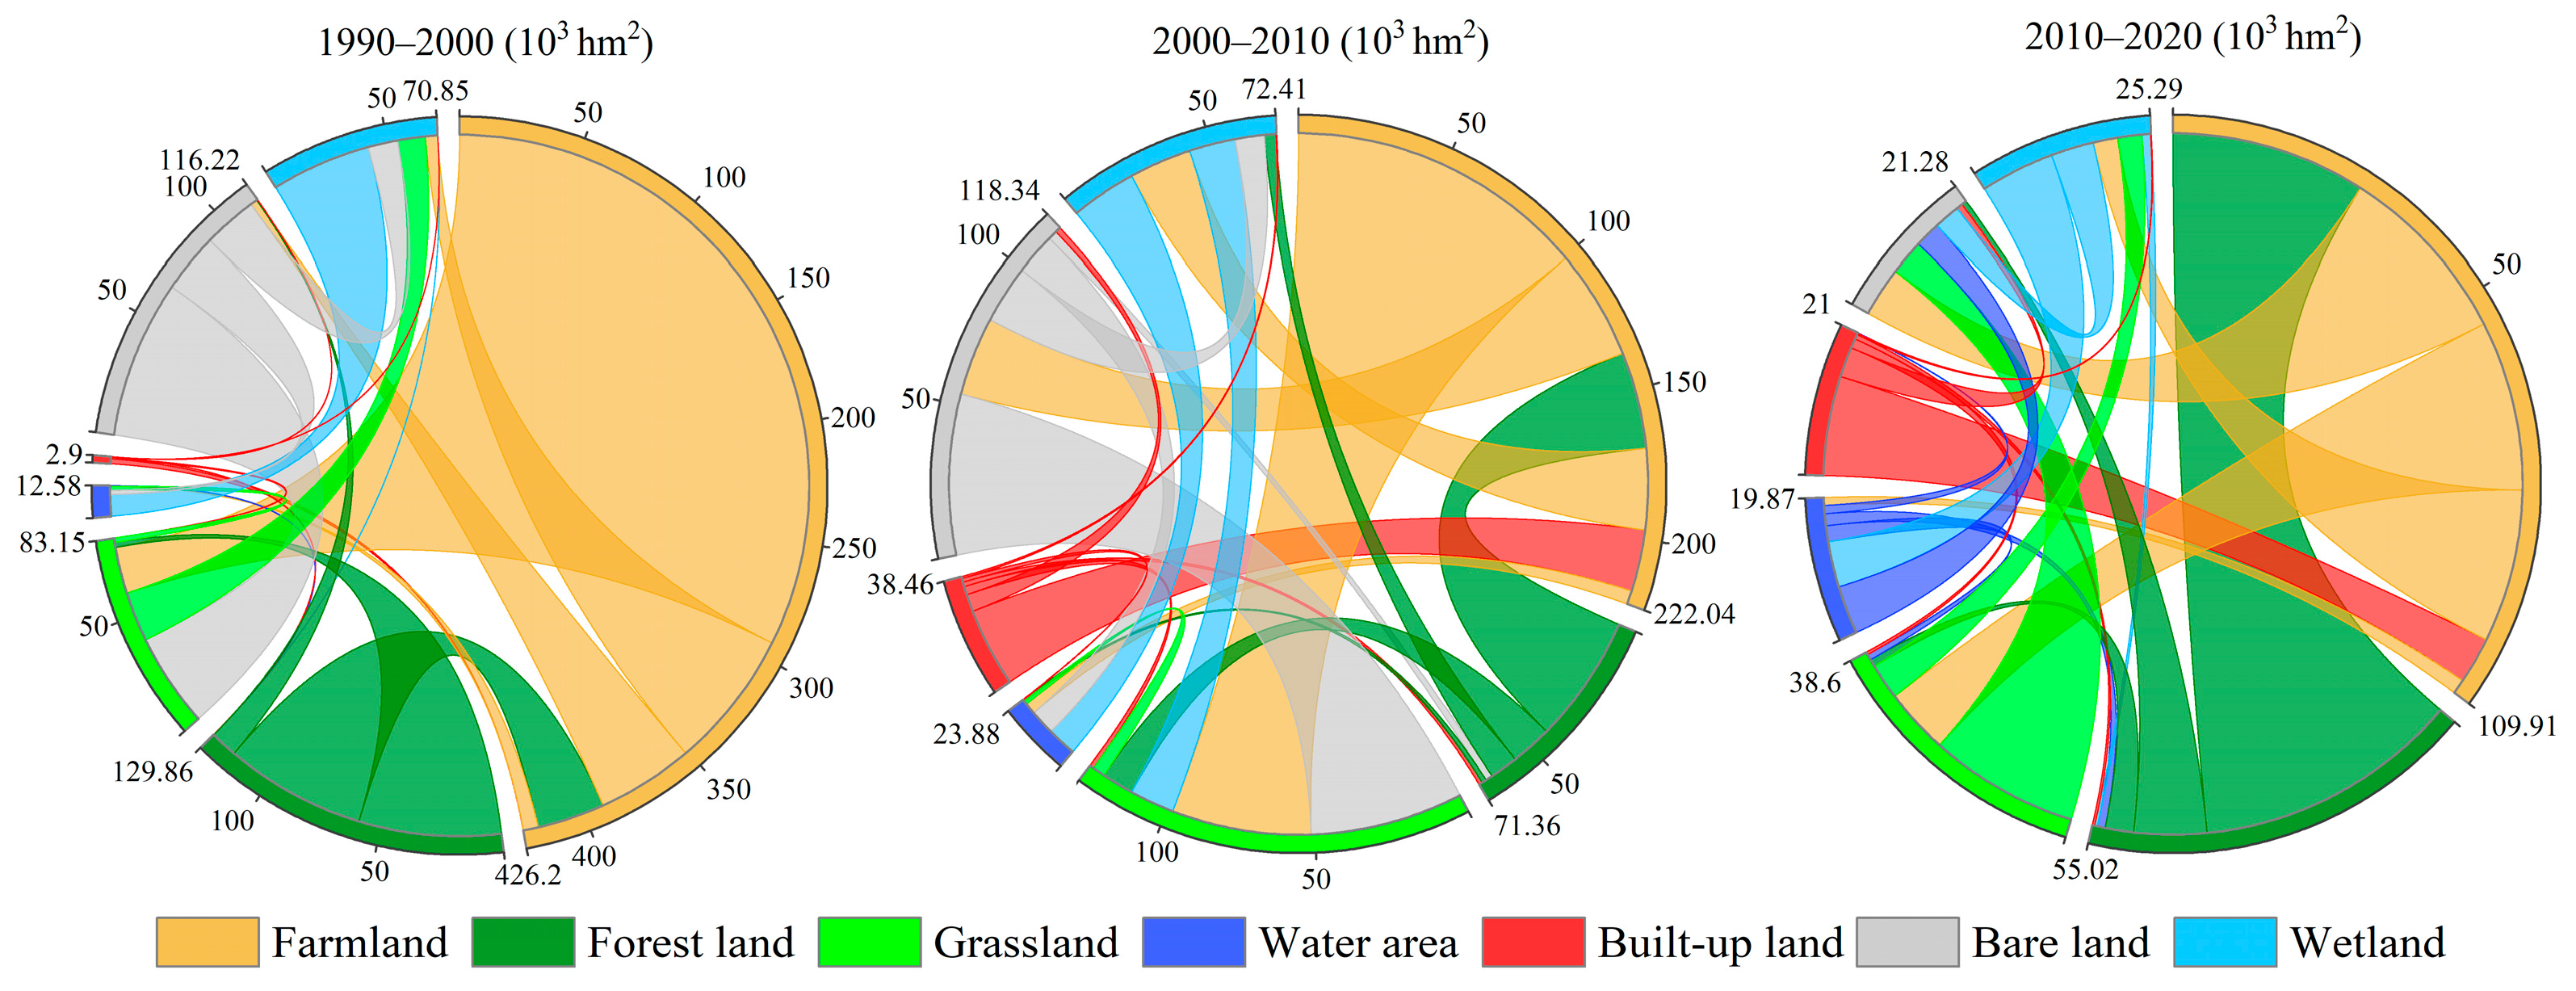
A Sankey diagram shows the inflow and outflow of areas of various land types during a specific time period. Segmented arcs each represent a distinct land cover type, with their angular spans proportional to the type’s share in overall land cover change. Figure 5 illustrates the conversion situations among different land cover types in the West Songnen Plain during various time periods. Connecting bands denote transitions between land cover types: when a band’s color matches an arc’s, it indicates the inflow of that land cover type (other types converting to it), and when the band’s color differs from the arc’s, it represents the outflow of that land cover type (the type converting to other categories).
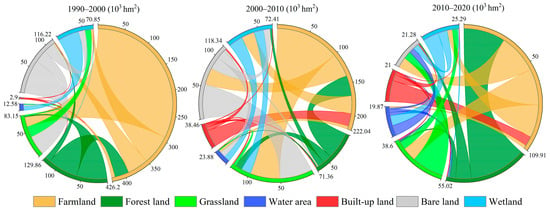
Figure 5.
Land cover type conversion in the West Songnen Plain from 1990 to 2020.
From 1990 to 2000, farmland expanded by 426.20 × 10³ hm2, with the largest portion of 293.24 × 10³ hm2 (68.8%) occurring on grassland, and 58.00 × 10³ hm2 and 40.28 × 10³ hm2 expanding into wetland and bare land, respectively. Meanwhile, 88.68 × 10³ hm2 of farmland was converted, mainly into forest land, followed by grassland, with transformations of 58.99 × 10³ hm2 and 19.39 × 10³ hm2, respectively. Between 2000 and 2010, the area of farmland expanded by 222.02 × 10³ hm2, primarily into grassland (100.67 × 10³ hm2) and bare land (36.68 × 10³ hm2). At the same time, the built-up land experienced a dramatic increase, with 26.43 × 10³ hm2 and 0.63 × 10³ hm2 expanding into farmland and bare land, respectively. In that period, 187.65 × 10³ hm2 of the grassland was converted, mainly into farmland, followed by built-up land, with transformations of 100.68 × 10³ hm2 and 53.76 × 10³ hm2, respectively. Between 2010 and 2020, the farmland expanded by 109.90 × 10³ hm2, mainly occurring on bare land (26.34 × 10³ hm2), grassland (24.50 × 10³ hm2), and wetland (22.05 × 10³ hm2). The built-up land continuously expanded by 21.00 × 10³ hm2, primarily into farmland and bare land. Meanwhile, 74.18 × 10³ hm2 farmland was converted, mainly into forest land (38.54 × 10³ hm2), followed by built-up land (14.33 × 10³ hm2).
3.2. Spatial and Temporal Patterns of Habitat Quality
3.2.1. Spatial Distribution of Habitat Quality
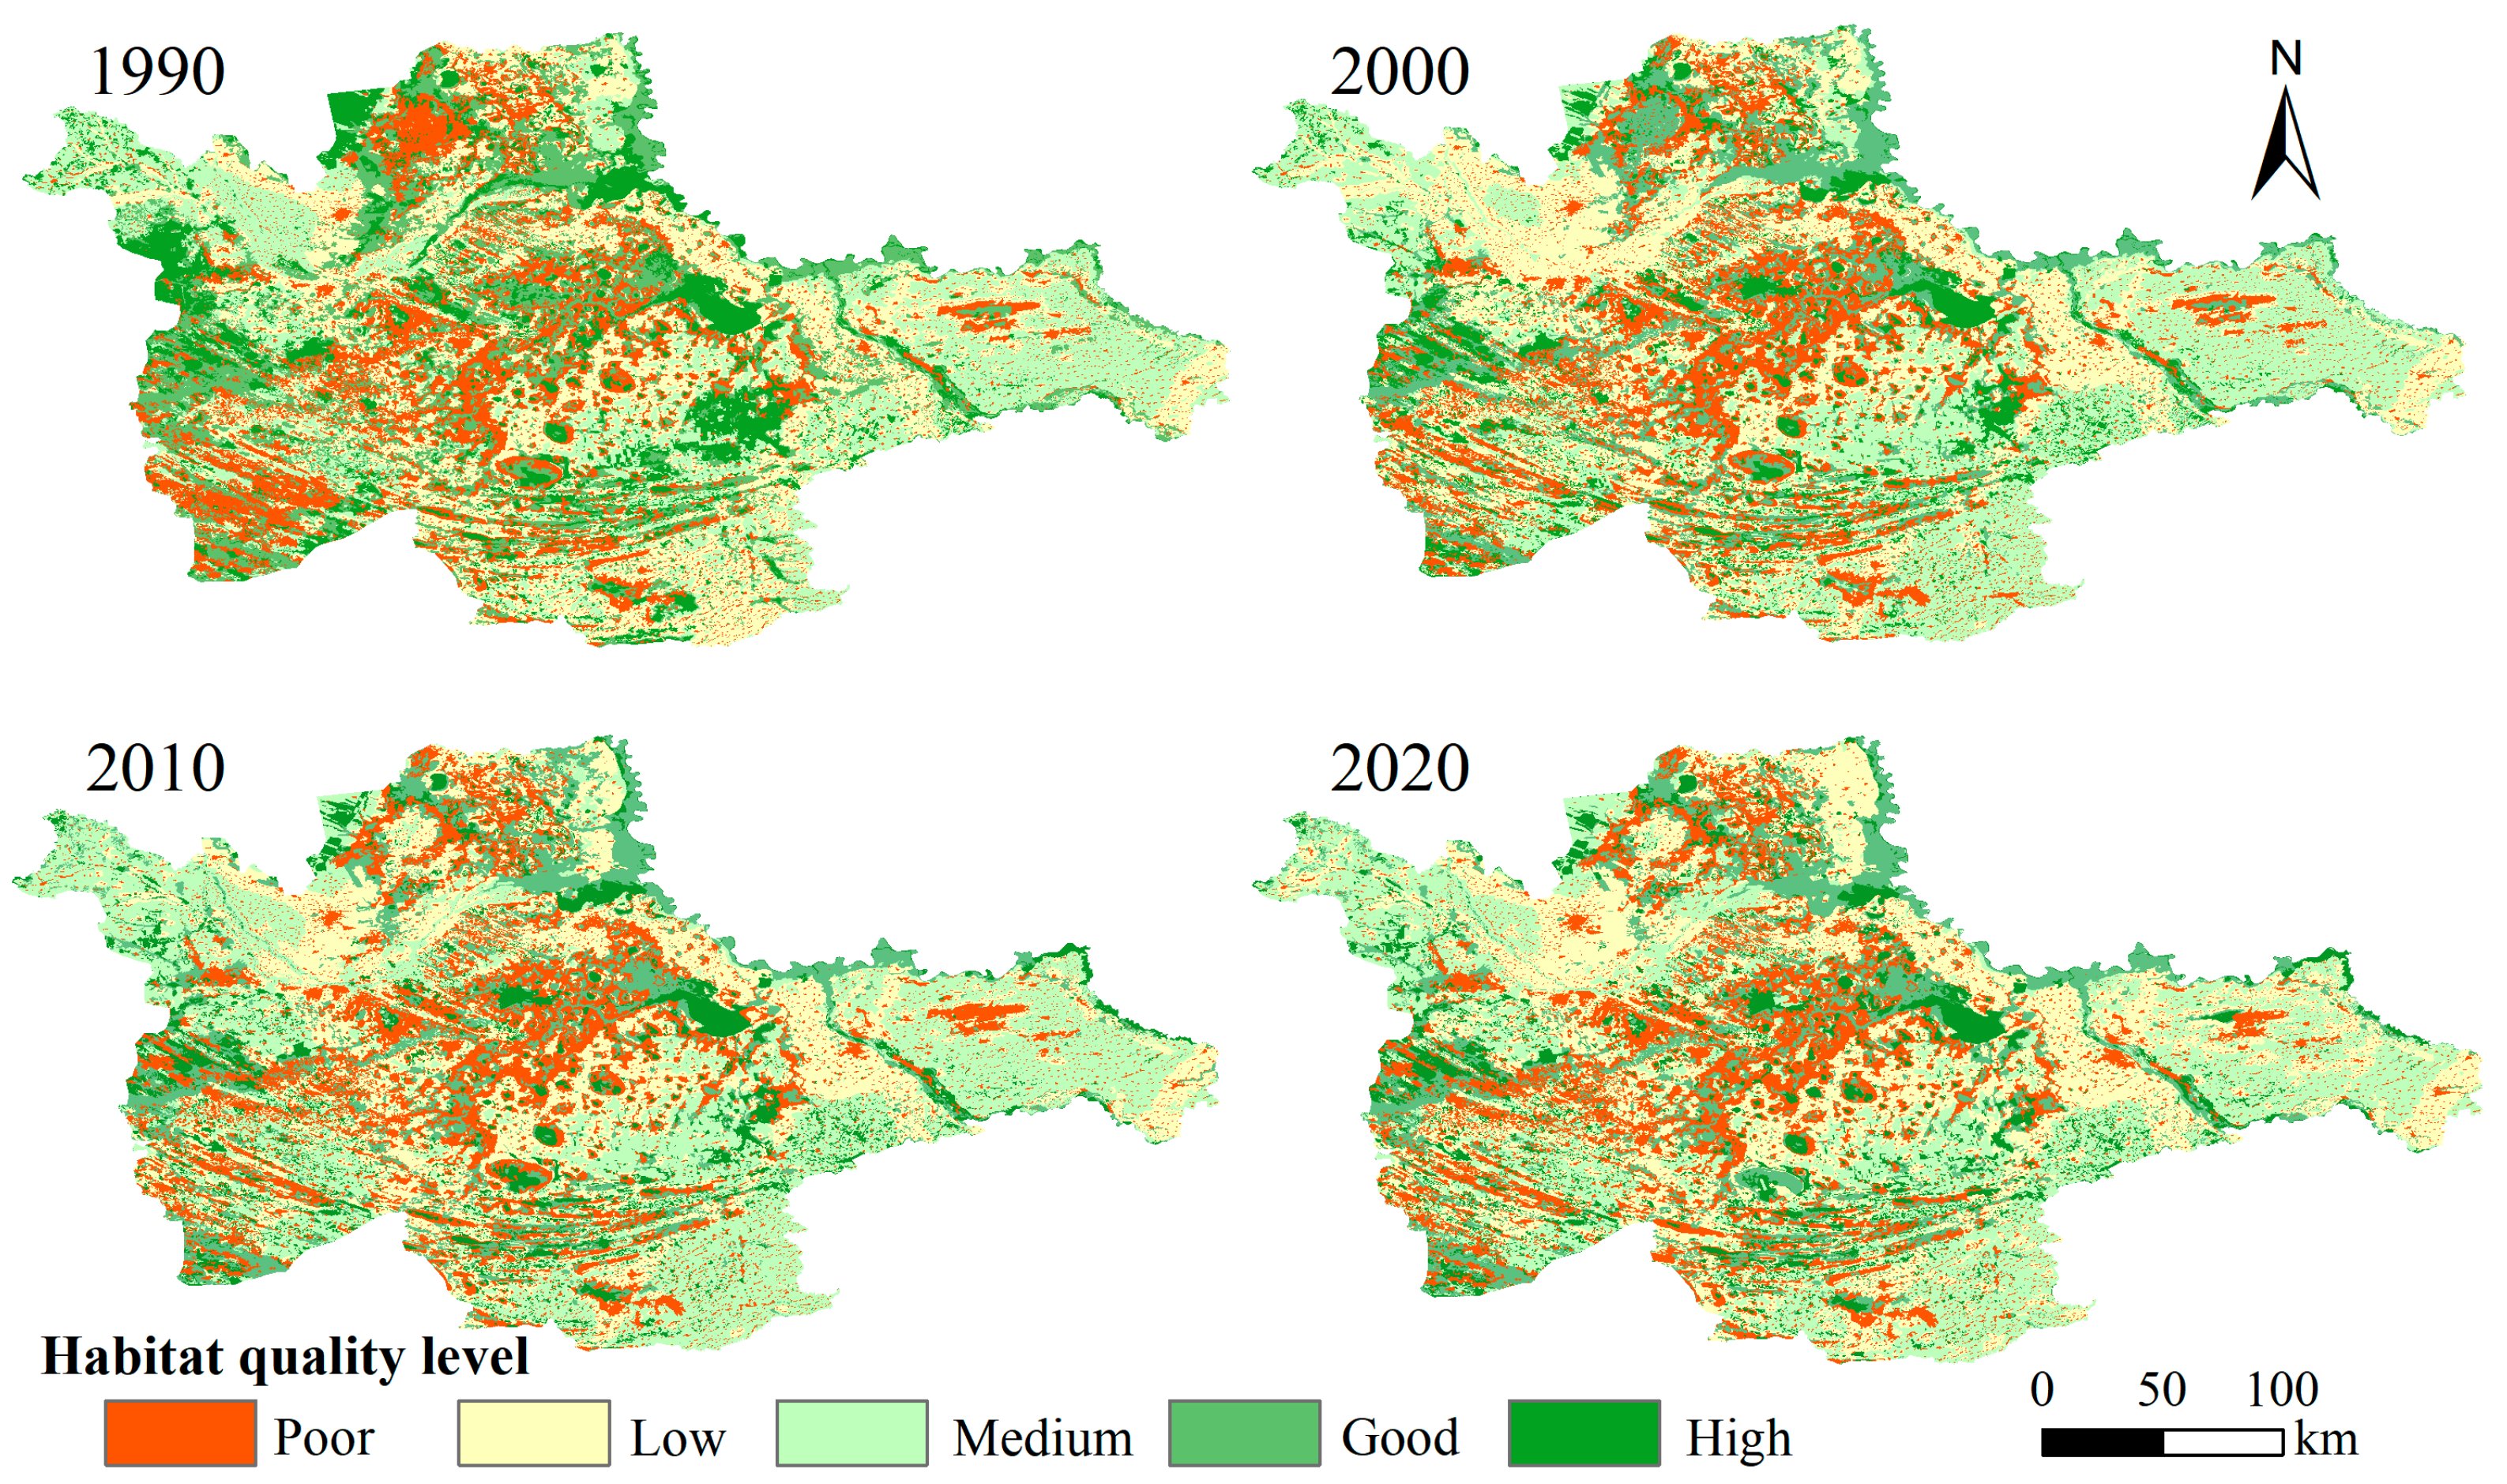
The mean habitat quality values for the years 1990, 2000, 2010, and 2020 were 0.4703, 0.4415, 0.4356, and 0.4363, respectively. Spatially, areas of poor and low habitat quality were primarily concentrated in the central region of the study area (Figure 6), while medium-quality habitats were mainly distributed in the eastern and western regions. High- and good-quality habitats were scattered and often interspersed with poor-quality habitats. From 1990 to 2000, the areas with habitat quality changes were mainly in the northwestern and central regions, characterized by the degradation of habitat quality grades. During 2000–2010, the area of low-quality habitats in the west and high-quality habitats in the north both decreased, accompanied by an expansion of medium-quality habitats. From 2010 to 2020, the spatial distribution of habitat quality remained relatively stable, and the areas where habitats improved were concentrated in the northern region. Overall, from 1990 to 2020, there was a downward trend in habitat quality.
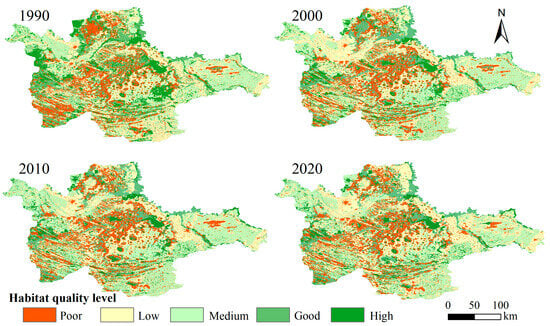
Figure 6.
Spatial distribution of habitat quality in the West Songnen Plain.
3.2.2. Temporal Changes in Habitat Quality
The habitat quality in the West Songnen Plain exhibited notable trends across different periods, generally showing a decline, as illustrated in Figure 7. From 1990 to 2000, habitat degradation was pronounced, with degraded areas ([−H] + [−G] + [−M] + [−L] + [−P]) spanning 2.15 × 10⁶ hm2, or 45.70% of the study area. Within these degraded zones, regions where habitat quality dropped to a “low” level ([−L]) accounted for 16.40% of the study area, underscoring the considerable impact of urbanization, agricultural expansion, and infrastructure development on habitat quality. In comparison, areas showing improvement in habitat quality ([+H] + [+G] + [+M] + [+L] + [+P]) covered 50.53% of the total area. Between 2000 and 2010, habitat degradation became more pronounced, with 50.82% of the study area showing declines. Most degraded areas shifted toward low- ([−L], 14.97%) and poor-quality habitats ([−P], 12.51%), while declines in high-quality habitats ([−H], 4.16%) remained minimal. Meanwhile, 46.14% of the area experienced improvements, predominantly transitions to medium-quality habitats ([+M], 17.13%). This improvement reflects the positive effects of ecological restoration efforts, such as the “Conversion of Farmland to Grassland Program”, in enhancing habitat conditions during that period. From 2010 to 2020, habitat degradation further intensified, affecting 56.01% of the study area. A large proportion of these declines were toward low-quality habitats ([−L], 20.78%). Habitat quality improvements were more evenly distributed across different quality levels, with areas increasing to medium ([+M], 9.22%), low ([+L], 9.21%), poor ([+P], 8.69%), good ([+G], 7.44%), and high habitat quality ([+H], 5.48%).
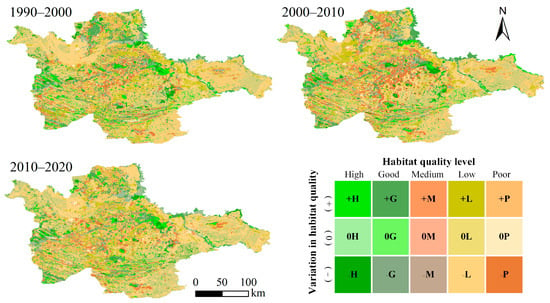
Figure 7.
Habitat quality changes in the West Songnen Plain.
Over the past three decades, habitat quality degradation has progressively expanded, punctuated by localized improvements primarily shifting toward medium- and low-quality states. These trends underscore the necessity of implementing differentiated conservation measures to arrest habitat degradation and foster regional ecological resilience.
3.3. Analysis of Habitat Quality Changes from Different Perspectives
3.3.1. Analysis of Habitat Quality Changes Across Different Land Cover Types
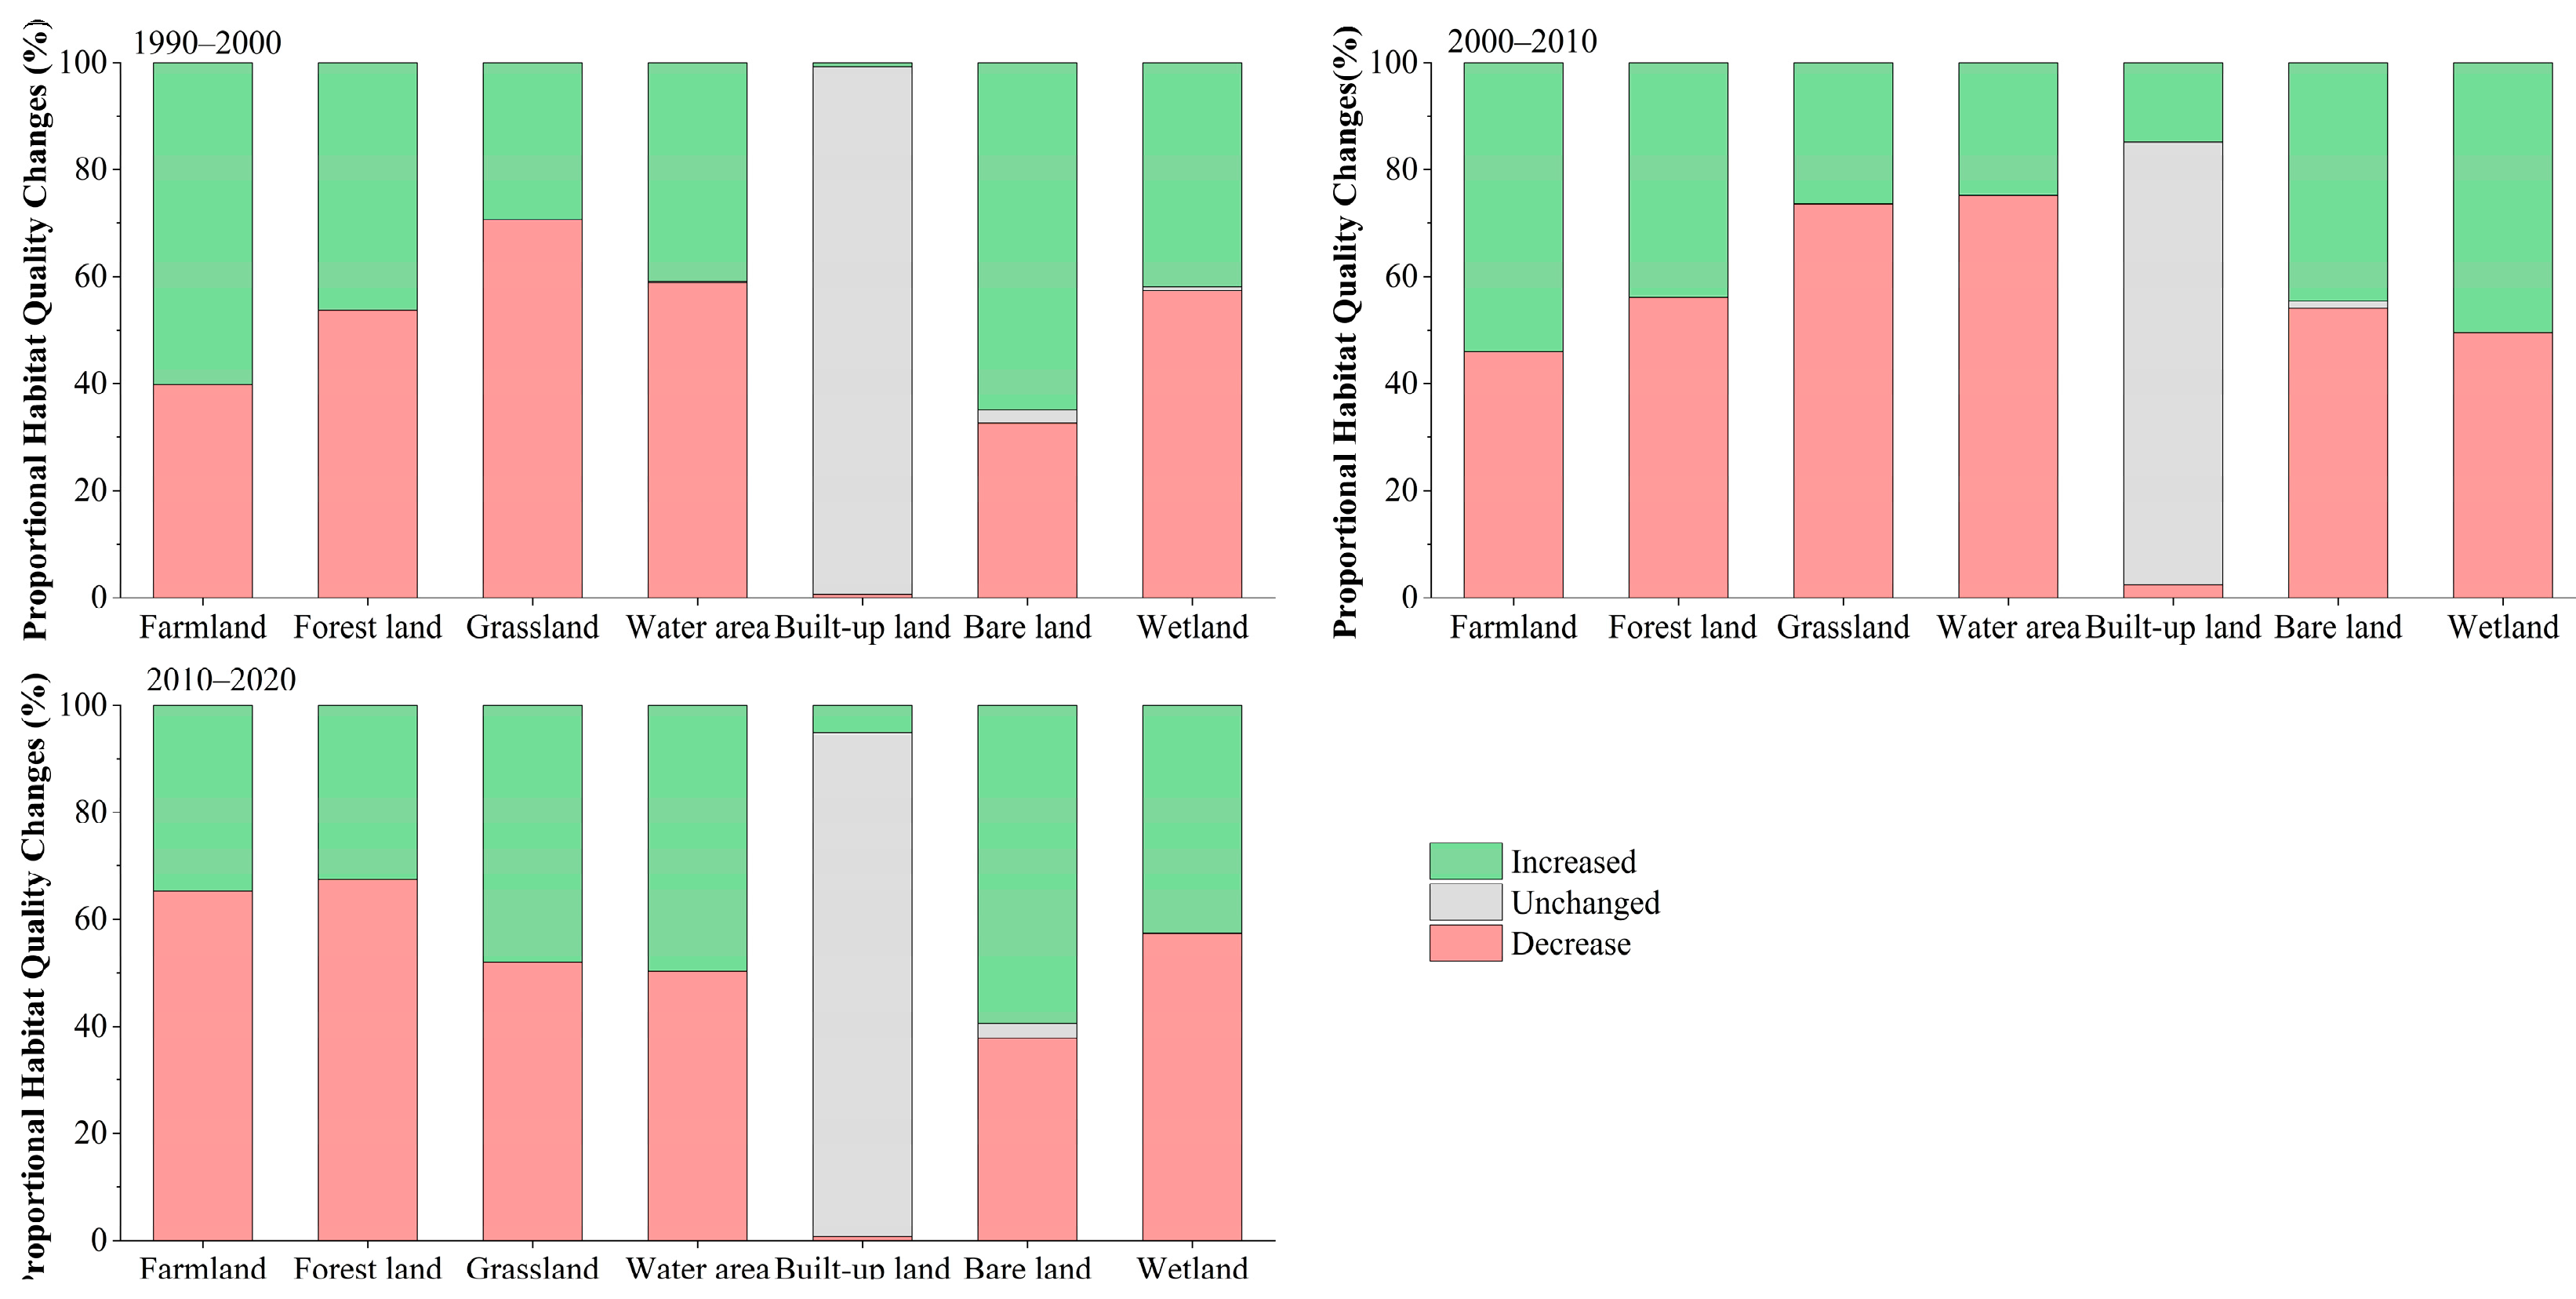
To clarify the trends in habitat quality changes across different land cover types, this study analyzed the pixel-level changes and mean values of habitat quality for each category, as well as the extent and magnitude of their change areas. As illustrated in Figure 8, the habitat quality of built-up land was relatively stable, with minor spatial changes observed, except for a notable fluctuation during 2000–2010. In contrast, other land cover types experienced distinct trends over different periods. During 1990–2000, natural habitats such as forests, grasslands, waters, and wetlands exhibited a net loss, with degradation areas exceeding those showing improvement. In the same period, semi-natural land covers, including farmland and bare land, showed a net improvement in habitat quality, primarily due to the encroachment into natural habitats. From 2000 to 2010, the degradation areas of bare land and waters expanded, while wetlands exhibited slight improvements. Between 2010 and 2020, habitat quality across all land cover types generally continued to decline, although the habitat quality of bare land improved, largely attributed to successful salinization control efforts.
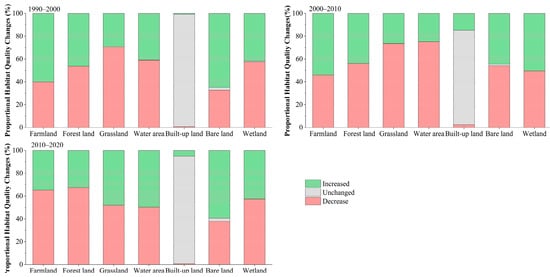
Figure 8.
Proportional area changes in habitat quality across different land cover types.
It is noteworthy that the extent of habitat change was not always proportional to changes in the mean habitat quality (Table 7). For instance, forests predominantly experienced degradation between 1990 and 2020; however, the mean habitat quality slightly increased between 1990 and 2010. Similarly, inconsistencies between the extent of habitat changes and variations in mean quality were also observed for waters (1990–2000) and bare land (2010–2020).

Table 7.
Mean values and changing trends of habitat quality in each land cover type.
3.3.2. Analysis of Habitat Quality Changes at Different Elevations
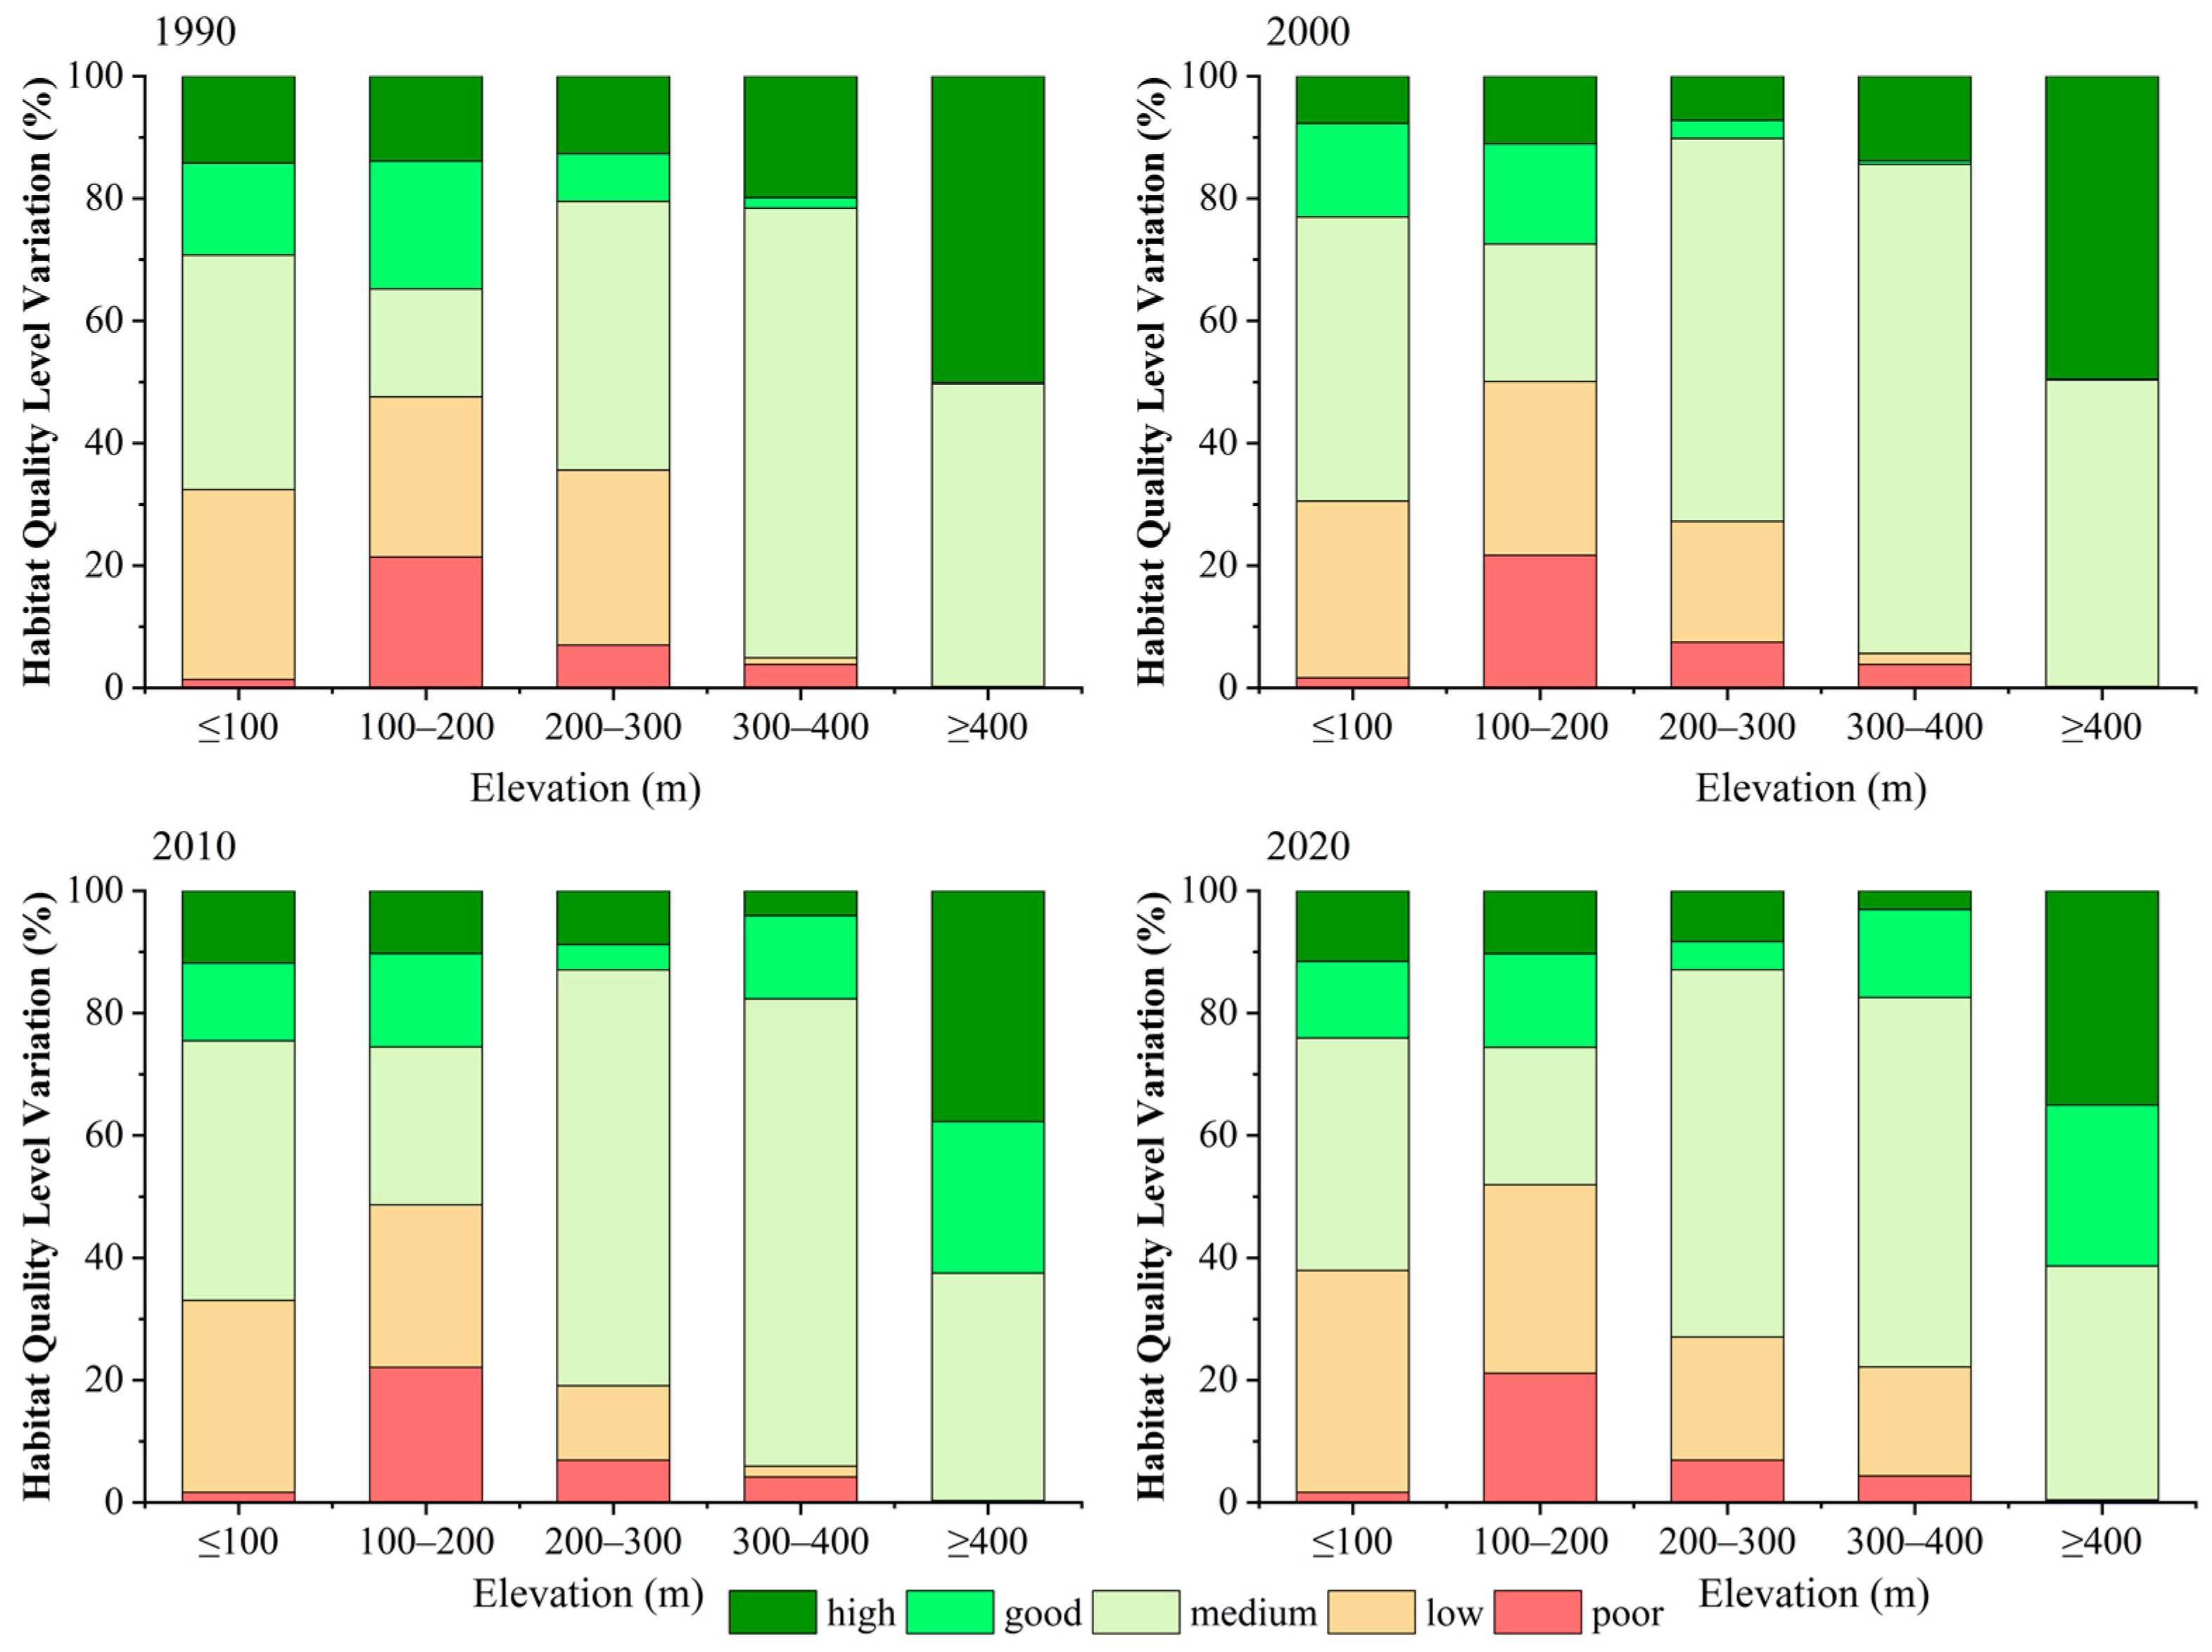
Results demonstrated that in terms of spatial distribution, as the elevation continuously increased, the habitat quality grade shifted towards better conditions (Figure 9). Regarding the temporal and spatial changes, from 1990 to 2020, the habitat quality grade underwent varying degrees of changes within different elevation ranges. From 1990 to 2000, the most noticeable changes in the habitat quality grade occurred between 200 and 300 m. It was characterized by a significant reduction in the proportions of both the high- and low-quality habitat areas, while the changes in other elevations were relatively minor. From 2000 to 2010, the changes in the habitat quality grade at an elevation of 300 to 400 m were prominent, manifesting as a relative decrease in high-quality areas and an increase in good-quality areas. From 2010 to 2020, the changes were mainly concentrated at elevations between 200 and 400 m, showing an increase in the low-quality habitat areas and a decrease in the medium-quality areas, with relatively small changes in the grades of other regions.
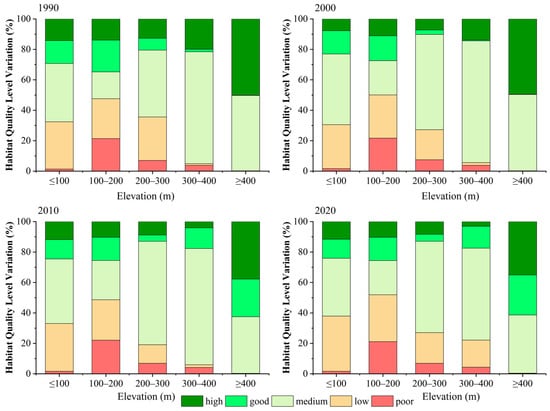
Figure 9.
Variation in habitat quality level at different elevations.
3.4. Spatial Statistical Analysis of Habitat Quality Changes
Before conducting the hot-spot analysis, the spatial autocorrelation tool was used to determine whether habitat quality in the West Songnen Plain exhibited spatial correlation. The Moran’s I index consistently exceeded zero between 1990 to 2020, indicating spatial correlation (Table 8). Furthermore, all Z-score exceeded 2.58 and p values were below 0.05, demonstrating the statistical significance and non-randomness of the habitat quality’s geographical distribution in the West Songnen Plain.

Table 8.
Global autocorrelation analysis of habitat quality in the West Songnen Plain.
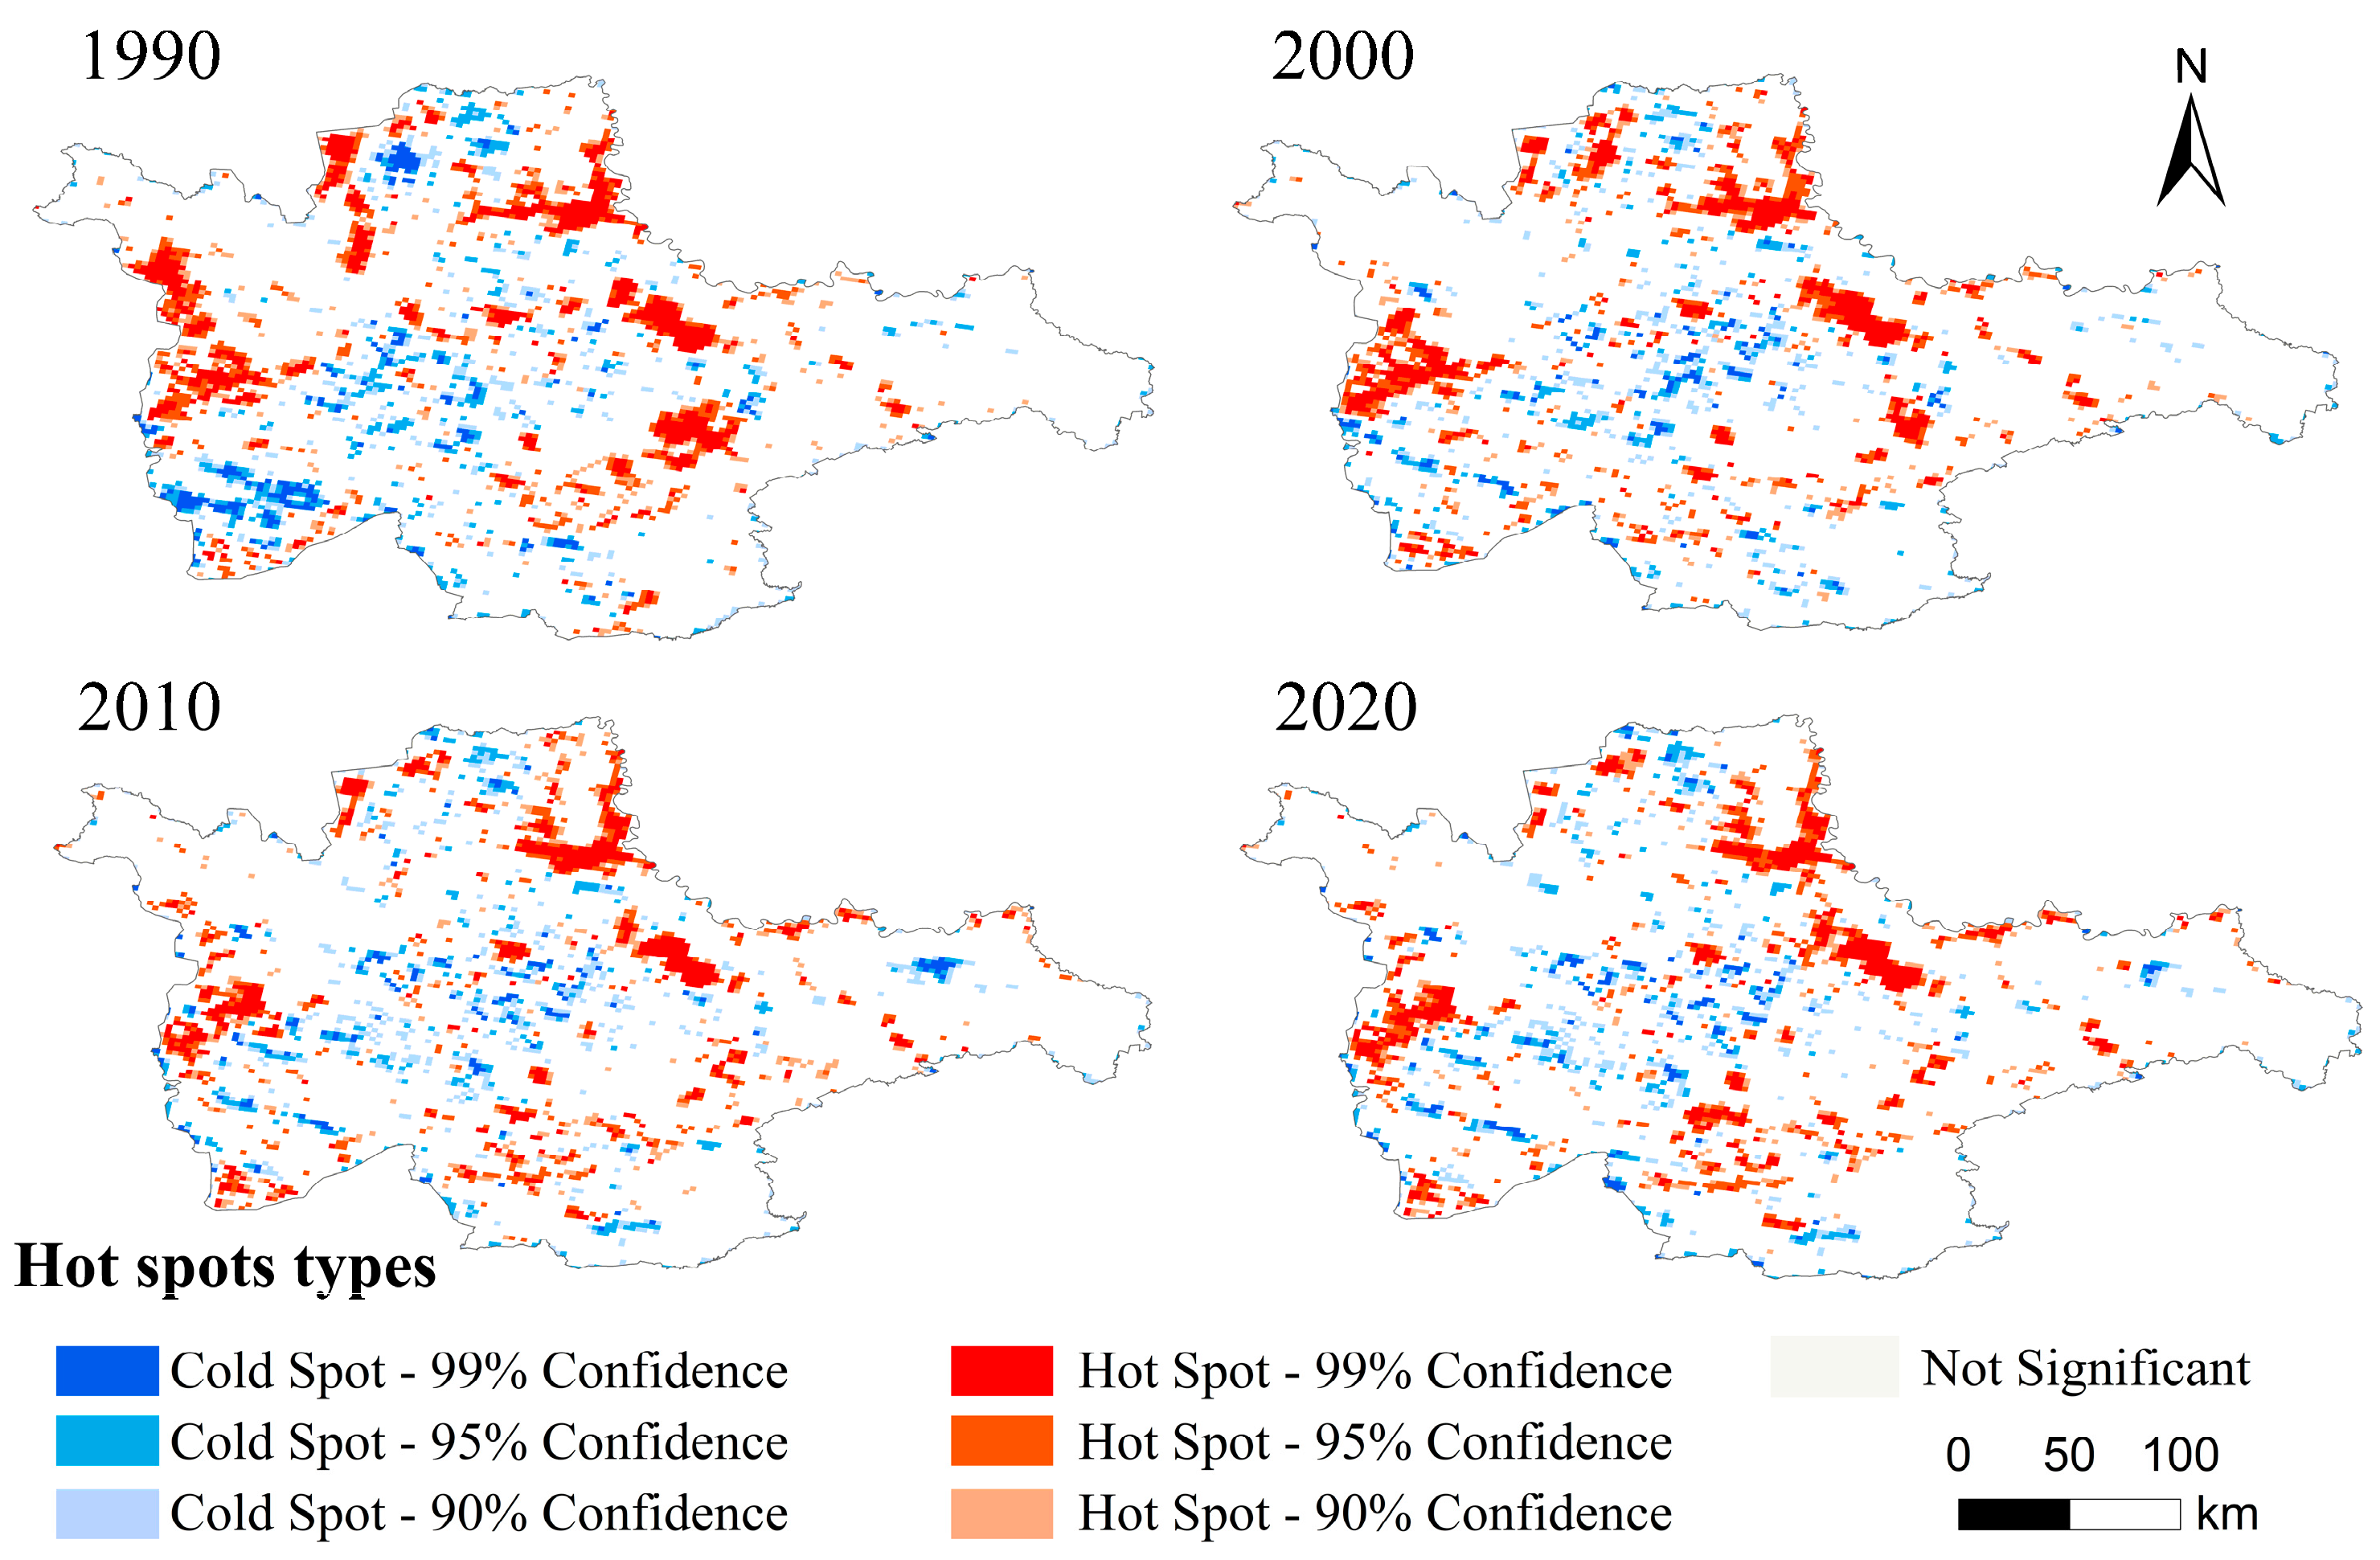
The study revealed distinct hot- and cold-spot characteristics in the habitat quality of the West Songnen Plain (Figure 10). The majority of hot spots were located in the northern part of the study area, with some also present in the west. These regions were largely covered by forests, grasslands, and waters which experienced minimal human disturbance, contributing to high habitat quality, with average values exceeding 0.8. In contrast, cold spots were primarily located in the central part of the study area, where low-lying terrain and widespread saline-alkali land are. This region exhibited relatively low habitat quality, with average values below 0.1, resulting in the clustering of low-quality habitats into cold spots.
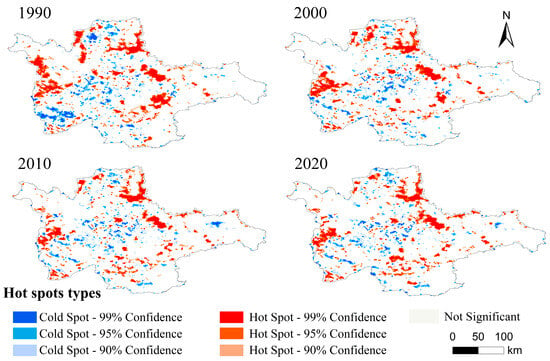
Figure 10.
Spatial distribution of habitat quality hot spots and cold spots.
Over time, Moran’s I index dropped from 0.2701 to 0.2159, indicating a reduction in the spatial clustering of habitat quality. This reduction in hot spots occurred primarily in the western part of the study area, where significant degradation of grasslands led to a decline in high-value area aggregation. In contrast, the reduction in cold spots was focused in the southwestern part of the study area. According to habitat suitability and sensitivity parameters in the InVEST model, saline-alkali land typically has lower habitat quality values. With a decrease in saline-alkali land area, there was a direct reduction in low-habitat-quality regions, explaining the observed decline in cold-spot clustering.
4. Discussion
4.1. Comparison with Existing Land Cover Datasets
To validate the accuracy of the land cover product developed in this study and ensure its reliability for practical applications, two existing datasets, GLC_FCS30D, available at https://data.casearth.cn/thematic/glc_fcs30/ (accessed on 20 September 2024) [60], and the China Land Cover Dataset (CLCD), available at https://zenodo.org/records/12779975 (accessed on 20 September 2024) [61], were selected for comparison. These datasets were chosen due to their high degree of consistency with the study’s product in terms of satellite platform, sensor, and spatial resolution, which enhanced the scientific rigor and comparability of the analysis.
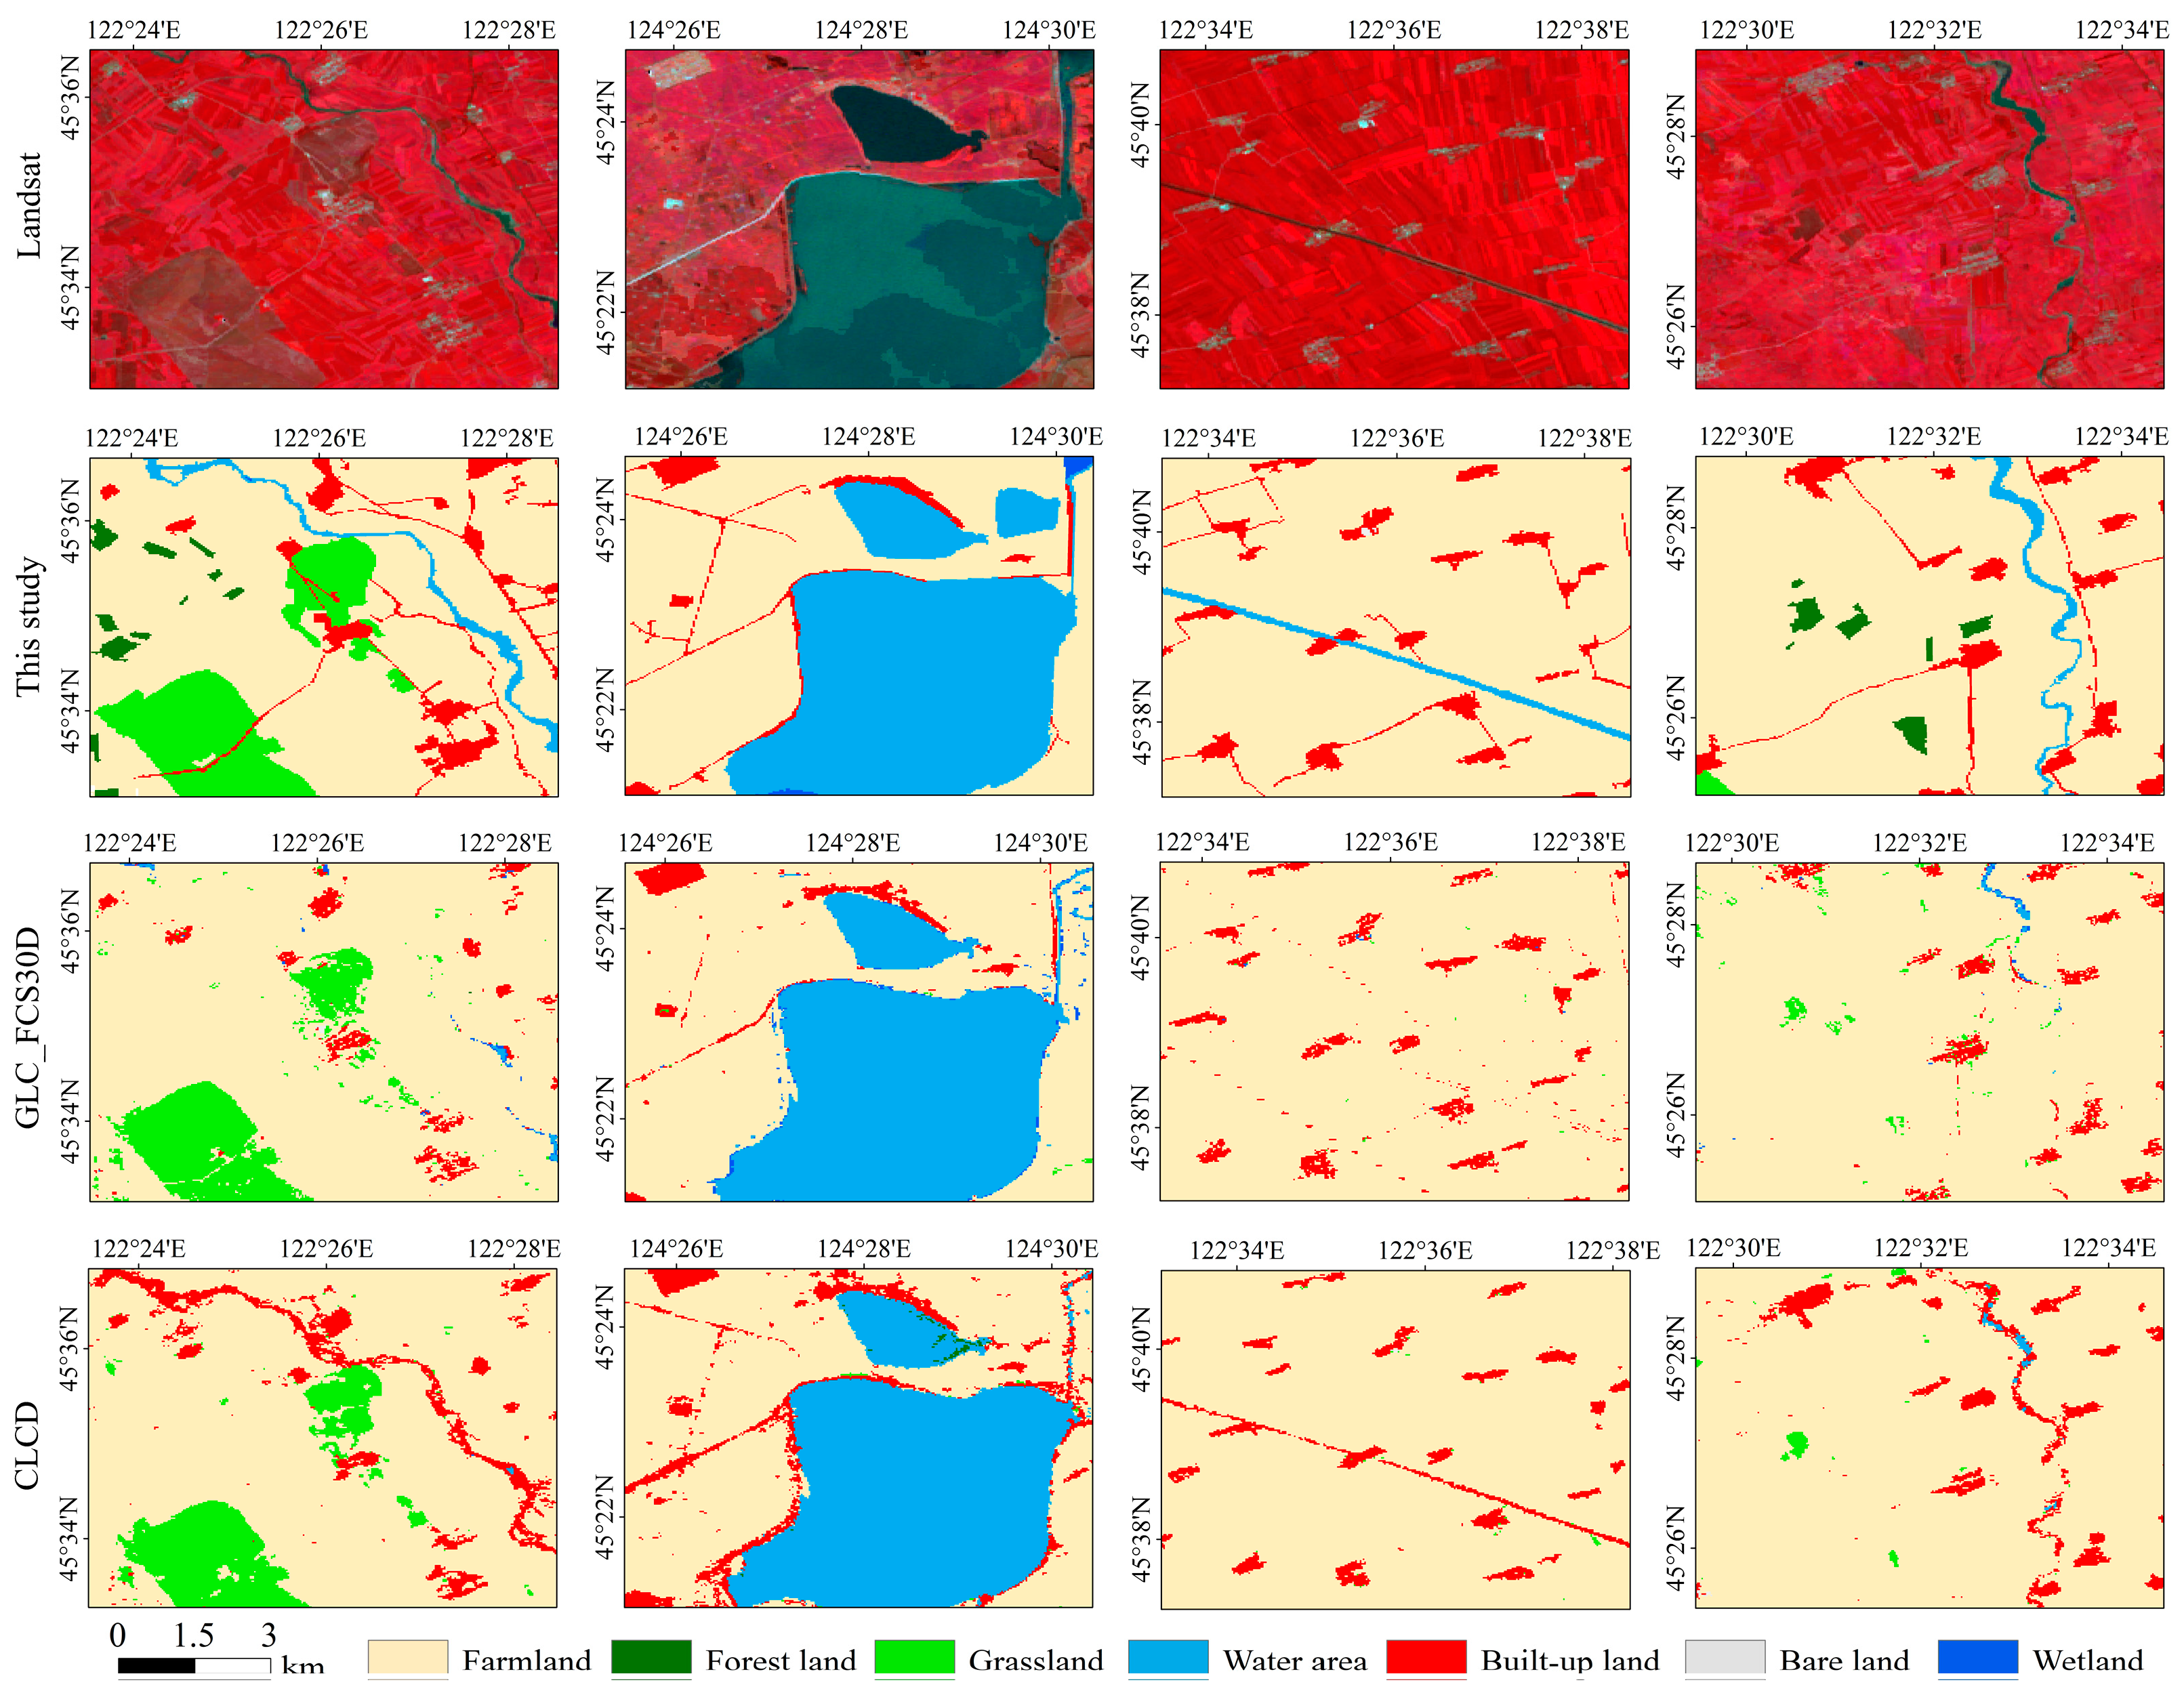
This study used 2020 as a benchmark to verify the accuracy of three datasets within the study area, based on 614 verification points (400 random points and 214 sampling points). High-resolution images from the Jilin-1 satellite were used as reference data for evaluating the random points. The confusion matrix calculation of land cover results indicated that the study’s product achieved the highest overall accuracy in the West Songnen Plain (90.72%), compared to CLCD (69%) and GLC_FCS30D (65%). Figure 11 presents a comparison of the classification results for the study’s product, GLC_FCS30D, and CLCD across various regions. The findings revealed that in terms of detail, this product outperformed GLC_FCS30D and CLCD, particularly in the extraction of wetland, grassland, and forest areas. Additionally, this product demonstrated superior boundary consistency, effectively capturing and reflecting actual land cover, and offered higher accuracy in delineating landscape boundaries.
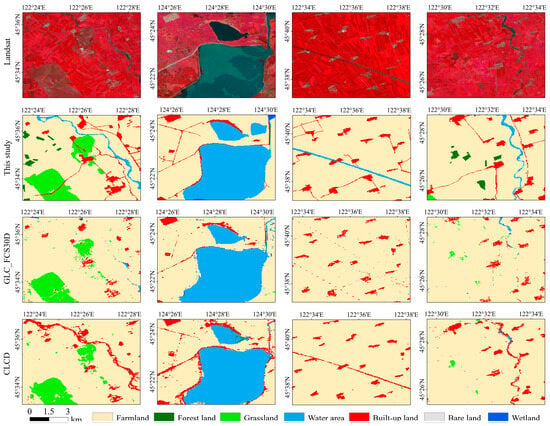
Figure 11.
Comparison of different dataset products (R:5, G:4, B:3).
This study’s classification system subdivided grassland into high-, medium-, and low-coverage categories based on the severity of grassland degradation, accurately capturing the variations in degradation levels. In contrast, the GLC_FCS30D dataset categorized grassland as a single type, limiting its ability to represent the complexity of grassland degradation. Additionally, while saline-alkali land was prevalent in the study area, the CLCD dataset does not include this essential land type, which restricted its accuracy in reflecting actual surface conditions. By adopting a classification system tailored to local conditions, this study minimized the appearance of irrelevant land cover types, significantly enhanced classification accuracy, and demonstrated clear advantages over existing datasets.
4.2. Correlation Analysis
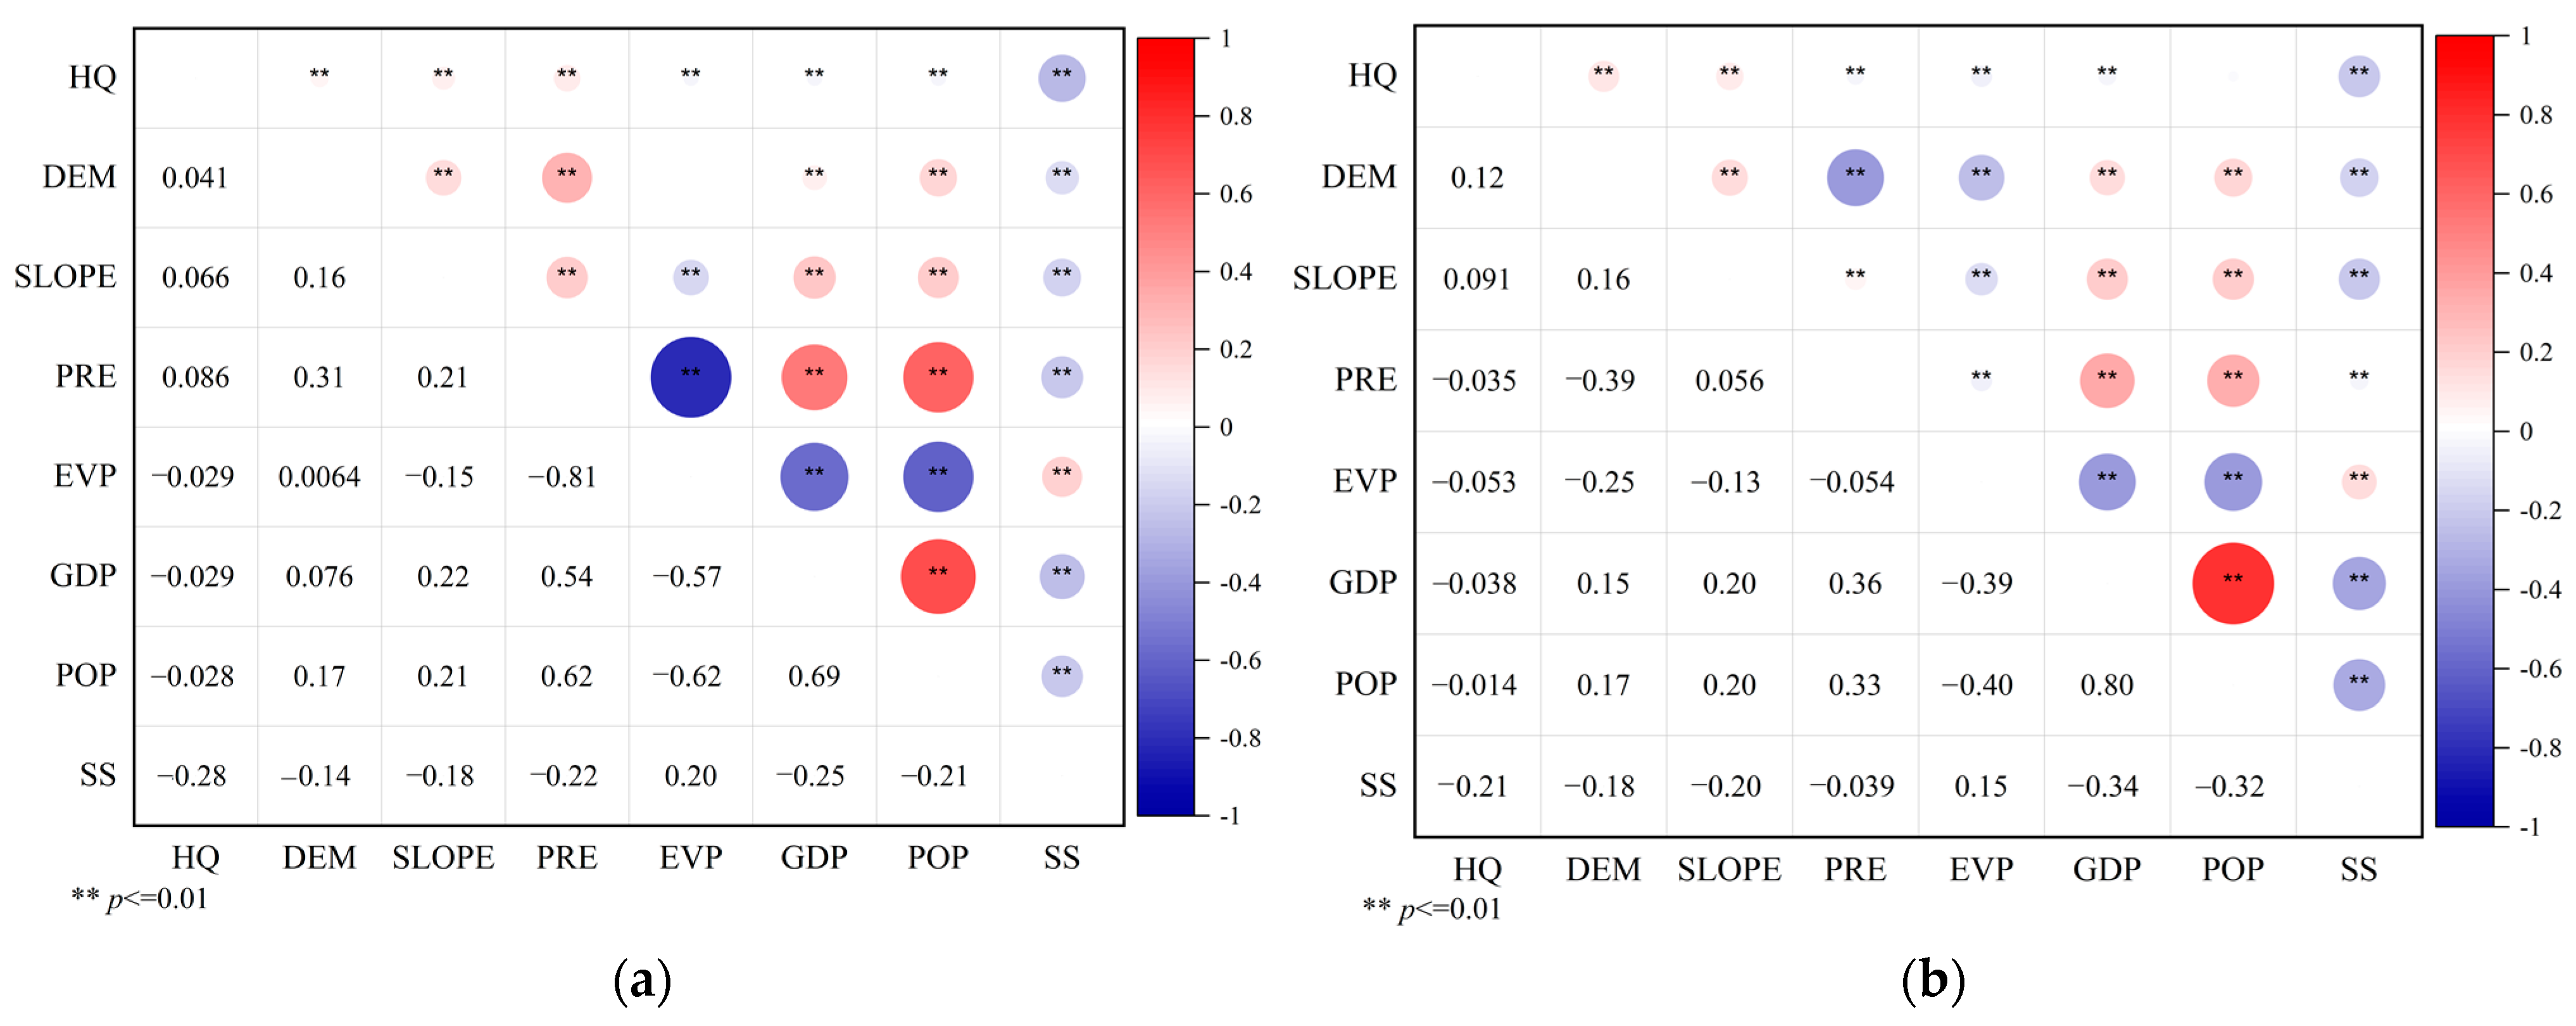
Habitat quality is shaped by both physio-geographical and socioeconomic factors. While natural geographical factors establish the baseline characteristics and distribution of habitats, socioeconomic factors exert a longer-term, albeit more indirect, influence [62]. Figure 12 show the Pearson correlation coefficients between HQ and various factors. The results demonstrated that all influencing factors exhibited significant correlations with habitat quality.
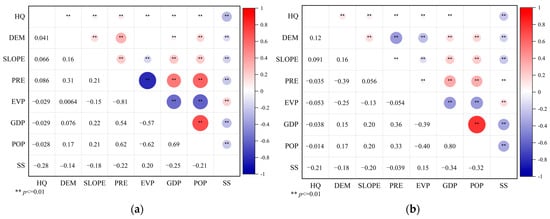
Figure 12.
Correlation analysis between influencing factors and habitat quality: (a) 1990; (b) 2020.
Among the physio-geographic variables, soil salinization (SS) was identified as a dominant driver of habitat quality variation. Although its correlation with habitat degradation declined over time, it remained statistically significant, indicating that despite recent progress, SS continues to pose a substantial threat—particularly in semi-arid regions such as the West Songnen Plain. Terrain variables (DEM and SLOPE) and evapotranspiration (EVP) showed progressively stronger positive correlations with habitat quality over time [63], while the correlations between soil salinization (SS), precipitation (PRE), and habitat quality weakened.
Specifically, precipitation in 1990 was positively correlated with habitat quality, which is consistent with the findings of most previous studies. However, by 2020, the relationship had shifted to a negative correlation. This shift was primarily attributed to the spatial distribution of precipitation, which was concentrated in the central part of the study area. Due to the low-lying terrain and poor drainage capacity of the West Songnen Plain, surface runoff and precipitation accumulated in the central region, leading to seasonal waterlogging and localized salt accumulation. Consequently, soil salinization intensified in these areas, resulting in a decline in habitat quality.
Socioeconomic factors, including GDP and POP, generally exhibited negative correlations with habitat quality, reflecting the inhibitory effects of socioeconomic development and anthropogenic disturbances on ecosystem conditions [64]. Notably, in 2020, the correlation between population and habitat quality was not significant, suggesting that despite continued population pressure, policy interventions or land use adjustments may have partially mitigated the negative ecological impacts.
4.3. The Influence of Policy Factors
Alongside natural and economic factors, policy influences also significantly impact changes in land cover types. Figure 13 shows the relevant policies and statutes in the West Songnen Plain from 1990 to 2020.

Figure 13.
Key policies and statutes related to the West Songnen Plain from 1990 to 2020.
Between 1990 and 2000, the agricultural tax imposed a heavy burden on farmers, and the rapid population growth led to increased demand for food. However, this expansion came at a significant ecological cost, resulting in habitat loss and severe environmental degradation. Concurrently, forest policies such as the “Three-North Shelter Forest Program” [65] and the “Natural Forest Protection Program” [66] contributed to an increase in forested areas, enhancing carbon sequestration and soil protection. However, the rapid farmland expansion outpaced forest growth, causing great ecological damage.
From 2000 to 2010, the government prioritized ecological construction, focusing on preserving ecological areas such as forests, grasslands, and wetlands, and addressing saline-alkali lands. Long-term policies like the “Three-North Shelter Forest Program” (until 2050) and the “Natural Forest Protection Program” (until 2020) supported a steady increase in forest cover, improving habitat quality and enhancing biodiversity. The “Conversion of Farmland to Grassland Program” [67] converted extensive farmland back into grassland, curbing grassland degradation. Numerous water conservancy projects, including the “Songhua River Diversion Project” [68] in Jilin and the “Nenjiang-to-Baicheng Water Supply Project” [69], contributed to wetland conservation and restoration. The “Western Jilin Province Alkali Control Project” [11] further improved the region’s ecology by lowering soil salinity and mitigating salinization, promoting soil and plant community health. That period marked an ecological transition phase, with active ecosystem management aimed at fostering sustainable development.
From 2010 to 2020, the “River-Lake Connection Project” [70] was initiated in the study area to expand water coverage, enhancing hydrological connectivity and supporting aquatic ecosystems. The “National Major Function Oriented Zone Plan” [71] supported the identification and strengthening of ecological protection areas, while the “Management Measures for Jilin Province’s Ecological Protection Red Line Area (Trial)” [72] imposed stricter land use limitations within protected zones, intensifying environmental monitoring to safeguard ecosystem integrity. In 2012, China introduced the “Three-life spaces” [73] concept, further integrating ecology into land use planning, focusing on the balanced development of production, living, and ecological spaces to encourage sustainable land use. With population growth and rising living standards, food demand surged, underscoring the need for food self-sufficiency. To address this, the State Council approved the “100 Billion Catties Production Capacity Project (2009–2020)” [74], ensuring the expansion of farmland to support production space requirements.
In summary, these policies have substantially influenced land use structure and improved the ecological environment, but the dual pressures of agricultural production demands and ecological protection still require continued attention and balance to ensure the sustainable development of the ecosystem.
4.4. Limitations and Prospective
Compared with the habitat quality results previously conducted in this study, the spatial distribution pattern is basically consistent [33]. Similarly, the selection of major threat sources—namely, farmland and saline-alkali land—aligns with existing research, confirming their critical roles in driving habitat degradation. However, a review of habitat quality studies conducted in semi-arid regions reveals that most previous efforts largely relied on static single-value classifications for threat parameterization, without adequately considering the spatial heterogeneity within land cover types [75,76]. This poses a significant challenge for habitat quality assessment, as relying solely on single-land-cover categories is insufficient to accurately capture habitat quality variations, particularly when substantial ecological differences exist within the same land cover class. Although some studies have attempted to incorporate NDVI to adjust habitat quality outputs, these approaches primarily focused on modifying the final habitat quality scores, rather than refining threat characteristics at the source [77]. Recent research highlights that the inclusion of environmental variables can significantly enhance the accuracy of habitat quality assessments. Building upon this understanding, we used the growth characteristics of farmland assessed by the mean NDVI during the growing season and optimized its threat intensity to improve the model’s responsiveness to habitat degradation. In addition, we included the salinization of vegetation cover as one of the important considerations for habitat threats, solving the limitation of previous studies that only considered bare soil areas affected by salinization, especially in semi-arid ecosystems [78].
However, this study has certain limitations. The assignment of threat factor weights still relied on empirical values derived from previous studies, which introduces a considerable degree of subjectivity into the habitat quality assessment. Although recent studies have attempted to calibrate threat parameters using field surveys or expert knowledge, fully objective parameterization remains challenging, particularly in heterogeneous landscapes. Future efforts should focus on integrating multi-source datasets, such as climatic variables, species distribution monitoring, and the lag effects of policy interventions, to dynamically adjust threat intensities and weights.
5. Conclusions
This study provided a comprehensive evaluation of habitat quality in the West Songnen Plain, a semi-arid region facing significant ecological challenges due to both natural and anthropogenic factors. Building on this context, we revealed the spatiotemporal differentiation of habitat quality in the Western Songnen Plain by integrating high-precision land use classification data with dynamic threat factors.
The results indicated that farmland, bare land, and grassland were the dominant land cover types in the study area from 1990 to 2020. The most significant change was the expansion of farmland at the expense of grassland. In the study area, habitat quality was predominantly characterized by medium and low levels, with patches of high-quality habitats interspersed, resulting in pronounced spatial heterogeneity. Although slight improvements have been observed in recent years, the overall habitat condition remains relatively low. Natural land cover types were mainly subjected to habitat degradation, while localized improvements were detected in farmland and bare land areas. Habitat quality exhibited an increasing trend with elevation. Spatial autocorrelation analysis uncovered a clustering pattern in habitat quality, with a decrease in spatial clustering and a reduction in both high-quality (hot spots) and low-quality (cold spots) areas, suggesting both positive ongoing degradation and ecological effects.
Author Contributions
Conceptualization, H.Y. and R.Z.; methodology, Z.L. and X.L.; software, H.L.; formal analysis, Z.L.; investigation, S.L.; resources, H.Y. and H.L; writing—original draft preparation, H.Y. and Z.L.; writing—review and editing, R.Z.; supervision, M.J.; Validation, X.L.; funding acquisition, H.Y. All authors have read and agreed to the published version of the manuscript.
Funding
This work was supported by Science and Technology Development Plan Project of Jilin Province, China (YDZJ202401508ZYTS), Jilin Provincial Natural Science Foundation (20240101016JJ), the National Natural Science Foundation of China (42101399, 42171328, and 42001383), and the “Young Support Talents Program” from the Science and Technology Association of Jilin Province (2021–2024) to Hao Yu (QT202101).
Data Availability Statement
The data presented in this study are available on request from the corresponding author.
Conflicts of Interest
The authors declare no conflicts of interest.
References
- Hall, L.S.; Krausman, P.R.; Morrison, M.L. The Habitat Concept and a Plea for Standard Terminology. Wildl. Soc. B 1997, 25, 173–182. [Google Scholar]
- Wang, J.; Wu, Y.; Gou, A. Habitat Quality Evolution Characteristics and Multi-Scenario Prediction in Shenzhen Based on PLUS and InVEST Models. Front. Environ. Sci. 2023, 11, 1146347. [Google Scholar] [CrossRef]
- Turner, W.; Rondinini, C.; Pettorelli, N.; Mora, B.; Leidner, A.K.; Szantoi, Z.; Buchanan, G.; Dech, S.; Dwyer, J.; Herold, M.; et al. Free and Open-Access Satellite Data Are Key to Biodiversity Conservation. Biol. Conserv. 2015, 182, 173–176. [Google Scholar] [CrossRef]
- Bai, L.; Xiu, C.; Feng, X.; Liu, D. Influence of Urbanization on Regional Habitat Quality:A Case Study of Changchun City. Habitat Int. 2019, 93, 102042. [Google Scholar] [CrossRef]
- Pradhan, P.; Costa, L.; Rybski, D.; Lucht, W.; Kropp, J.P. A Systematic Study of Sustainable Development Goal (SDG) Interactions. Earth’s Future 2017, 5, 1169–1179. [Google Scholar] [CrossRef]
- Chen, S.; Liu, X. Spatio-Temporal Variations of Habitat Quality and Its Driving Factors in the Yangtze River Delta Region of China. Glob. Ecol. Conserv. 2024, 52, e02978. [Google Scholar] [CrossRef]
- Ren, Q.; He, C.; Huang, Q.; Shi, P.; Zhang, D.; Güneralp, B. Impacts of Urban Expansion on Natural Habitats in Global Drylands. Nat. Sustain. 2022, 5, 869–878. [Google Scholar] [CrossRef]
- Yohannes, H.; Soromessa, T.; Argaw, M.; Dewan, A. Spatio-Temporal Changes in Habitat Quality and Linkage with Landscape Characteristics in the Beressa Watershed, Blue Nile Basin of Ethiopian Highlands. J. Environ. Manag. 2021, 281, 111885. [Google Scholar] [CrossRef]
- Wei, L.; Zhou, L.; Sun, D.; Yuan, B.; Hu, F. Evaluating the Impact of Urban Expansion on the Habitat Quality and Constructing Ecological Security Patterns: A Case Study of Jiziwan in the Yellow River Basin, China. Ecol. Indic. 2022, 145, 109544. [Google Scholar] [CrossRef]
- Wen, S.; Wang, Y.; Tang, T.; Su, C.; Li, B.; Bilal, M.A.; Meng, Y. The Spatial-Temporal Patterns and Driving Mechanisms of the Ecological Barrier Transition Zone in the Western Jilin, China. Land 2024, 13, 856. [Google Scholar] [CrossRef]
- Li, X.; Li, Y.; Wang, B.; Sun, Y.; Cui, G.; Liang, Z. Analysis of Spatial-Temporal Variation of the Saline-Sodic Soil in the West of Jilin Province from 1989 to 2019 and Influencing Factors. Catena 2022, 217, 106492. [Google Scholar] [CrossRef]
- Hong, H.-J.; Kim, C.-K.; Lee, H.-W.; Lee, W.-K. Conservation, Restoration, and Sustainable Use of Biodiversity Based on Habitat Quality Monitoring: A Case Study on Jeju Island, South Korea (1989–2019). Land 2021, 10, 774. [Google Scholar] [CrossRef]
- Fei, L.; Shuwen, Z.; Jiuchun, Y.; Liping, C.; Haijuan, Y.; Kun, B. Effects of Land Use Change on Ecosystem Services Value in West Jilin since the Reform and Opening of China. Ecosyst. Serv. 2018, 31, 12–20. [Google Scholar] [CrossRef]
- Wen, S.; Wang, Y.; Song, H.; Liu, H.; Sun, Z.; Bilal, M.A. Integrated Predictive Modeling and Policy Factor Analysis for the Land Use Dynamics of the Western Jilin. Atmosphere 2024, 15, 288. [Google Scholar] [CrossRef]
- Wang, Z.; Song, K.; Zhang, B.; Liu, D.; Ren, C.; Luo, L.; Yang, T.; Huang, N.; Hu, L.; Yang, H.; et al. Shrinkage and Fragmentation of Grasslands in the West Songnen Plain, China. Agric. Ecosyst. Environ. 2009, 129, 315–324. [Google Scholar] [CrossRef]
- Yan, S.; Wang, X.; Cai, Y.; Li, C.; Yan, R.; Cui, G.; Yang, Z. An Integrated Investigation of Spatiotemporal Habitat Quality Dynamics and Driving Forces in the Upper Basin of Miyun Reservoir, North China. Sustainability 2018, 10, 4625. [Google Scholar] [CrossRef]
- Tian, Z.; Huo, D.; Yi, K.; Que, J.; Lu, Z.; Hou, J. Evaluation of Suitable Habitats for Birds Based on MaxEnt and Google Earth Engine—A Case Study of Baer’s Pochard (Aythya Baeri) in Baiyangdian, China. Remote Sens. 2023, 16, 64. [Google Scholar] [CrossRef]
- Muposhi, V.K.; Gandiwa, E.; Chemura, A.; Bartels, P.; Makuza, S.M.; Madiri, T.H. Habitat Heterogeneity Variably Influences Habitat Selection by Wild Herbivores in a Semi-Arid Tropical Savanna Ecosystem. PLoS ONE 2016, 11, e0163084. [Google Scholar] [CrossRef]
- Wang, H.; Tang, L.; Qiu, Q.; Chen, H. Assessing the Impacts of Urban Expansion on Habitat Quality by Combining the Concepts of Land Use, Landscape, and Habitat in Two Urban Agglomerations in China. Sustainability 2020, 12, 4346. [Google Scholar] [CrossRef]
- Zlinszky, A.; Heilmeier, H.; Balzter, H.; Czúcz, B.; Pfeifer, N. Remote Sensing and GIS for Habitat Quality Monitoring: New Approaches and Future Research. Remote Sens. 2015, 7, 7987–7994. [Google Scholar] [CrossRef]
- Nelson, E.; Mendoza, G.; Regetz, J.; Polasky, S.; Tallis, H.; Cameron, D.; Chan, K.M.; Daily, G.C.; Goldstein, J.; Kareiva, P.M.; et al. Modeling Multiple Ecosystem Services, Biodiversity Conservation, Commodity Production, and Tradeoffs at Landscape Scales. Front. Ecol. Environ. 2009, 7, 4–11. [Google Scholar] [CrossRef]
- Boumans, R.; Roman, J.; Altman, I.; Kaufman, L. The Multiscale Integrated Model of Ecosystem Services (MIMES): Simulating the Interactions of Coupled Human and Natural Systems. Ecosyst. Serv. 2015, 12, 30–41. [Google Scholar] [CrossRef]
- Xie, B.; Zhang, M. Spatio-Temporal Evolution and Driving Forces of Habitat Quality in Guizhou Province. Sci. Rep. 2023, 13, 6908. [Google Scholar] [CrossRef]
- Li, S.; Hong, Z.; Xue, X.; Zheng, X.; Du, S.; Liu, X. Evolution Characteristics and Multi-Scenario Prediction of Habitat Quality in Yulin City Based on PLUS and InVEST Models. Sci. Rep. 2024, 14, 11852. [Google Scholar] [CrossRef] [PubMed]
- Iglseder, A.; Immitzer, M.; Dostálová, A.; Kasper, A.; Pfeifer, N.; Bauerhansl, C.; Schöttl, S.; Hollaus, M. The Potential of Combining Satellite and Airborne Remote Sensing Data for Habitat Classification and Monitoring in Forest Landscapes. Int. J. Appl. Earth Obs. Geoinf. 2023, 117, 103131. [Google Scholar] [CrossRef]
- Chen, X.; Yu, L.; Du, Z.; Xu, Y.; Zhao, J.; Zhao, H.; Zhang, G.; Peng, D.; Gong, P. Distribution of Ecological Restoration Projects Associated with Land Use and Land Cover Change in China and Their Ecological Impacts. Sci. Total Environ. 2022, 825, 153938. [Google Scholar] [CrossRef] [PubMed]
- Terrado, M.; Sabater, S.; Chaplin-Kramer, B.; Mandle, L.; Ziv, G.; Acuña, V. Model Development for the Assessment of Terrestrial and Aquatic Habitat Quality in Conservation Planning. Sci. Total Environ. 2016, 540, 63–70. [Google Scholar] [CrossRef]
- Zhang, J.; Deng, M.; Yang, T.; Pang, M.; Wang, Z. Spatiotemporal Pattern of Reference Crop Evapotranspiration and Its Response to Meteorological Factors in Northwest China over Years 2000–2019. Environ. Sci. Pollut. Res. 2022, 29, 69831–69848. [Google Scholar] [CrossRef]
- Fernández de Bobadilla, M.; Vitiello, A.; Erb, M.; Poelman, E.H. Plant Defense Strategies against Attack by Multiple Herbivores. Trends Plant Sci. 2022, 27, 528–535. [Google Scholar] [CrossRef]
- Tian, Y.; Wang, Z.; Mao, D.; Li, L.; Liu, M.; Jia, M.; Man, W.; Lu, C. Remote Observation in Habitat Suitability Changes for Waterbirds in the West Songnen Plain, China. Sustainability 2019, 11, 1552. [Google Scholar] [CrossRef]
- Raji, S.A.; Odunuga, S.; Fasona, M. Spatially Explicit Scenario Analysis of Habitat Quality in a Tropical Semi-Arid Zone: Case Study of the Sokoto–Rima Basin. J. Geovisualization Spat. Anal. 2022, 6, 11. [Google Scholar] [CrossRef]
- Li, H.; Cao, Y.; Xiao, J.; Yuan, Z.; Hao, Z.; Bai, X.; Wu, Y.; Liu, Y. A Daily Gap-Free Normalized Difference Vegetation Index Dataset from 1981 to 2023 in China. Sci. Data 2024, 11, 527. [Google Scholar] [CrossRef]
- Sun, X.; Li, Y.; Hu, Y.; Li, Y. Human and Natural Factors Affect Habitat Quality in Ecologically Fragile Areas: Evidence from Songnen Plain, China. Front. Plant Sci. 2024, 15, 1444163. [Google Scholar] [CrossRef]
- Wu, J.; Li, X.; Luo, Y.; Zhang, D. Spatiotemporal Effects of Urban Sprawl on Habitat Quality in the Pearl River Delta from 1990 to 2018. Sci. Rep. 2021, 11, 13981. [Google Scholar] [CrossRef]
- Chen, X.; Yu, L.; Cao, Y.; Xu, Y.; Zhao, Z.; Zhuang, Y.; Liu, X.; Du, Z.; Liu, T.; Yang, B.; et al. Habitat Quality Dynamics in China’s First Group of National Parks in Recent Four Decades: Evidence from Land Use and Land Cover Changes. J. Environ. Manag. 2023, 325, 116505. [Google Scholar] [CrossRef]
- Wang, Z.; Huang, N.; Luo, L.; Li, X.; Ren, C.; Song, K.; Chen, J.M. Shrinkage and Fragmentation of Marshes in the West Songnen Plain, China, from 1954 to 2008 and Its Possible Causes. Int. J. Appl. Earth Obs. Geoinf. 2011, 13, 477–486. [Google Scholar] [CrossRef]
- Wang, L.-J.; Ma, S.; Qiao, Y.-P.; Zhang, J.-C. Simulating the Impact of Future Climate Change and Ecological Restoration on Trade-Offs and Synergies of Ecosystem Services in Two Ecological Shelters and Three Belts in China. Int. J. Environ. Res. Public Health 2020, 17, 7849. [Google Scholar] [CrossRef] [PubMed]
- Yang, Y.; Song, G. Human Disturbance Changes Based on Spatiotemporal Heterogeneity of Regional Ecological Vulnerability: A Case Study of Qiqihaer City, Northwestern Songnen Plain, China. J. Clean. Prod. 2021, 291, 125262. [Google Scholar] [CrossRef]
- Zhou, L.; Xue, W.; Zhu, S.; Shan, K.; Chen, J. Foraging Habitat Use of Oriental White Stork (Ciconia Boyciana) Recently Breeding in China. Zool. Sci. 2013, 30, 559–564. [Google Scholar] [CrossRef]
- Zhong, L.U.; Dan, W.E.I.; Guo-ping, L.E.I. Effects of Land Use/Cover Change (LUCC) on the Spatiotemporal Variability of Precipitation and Temperature in the Songnen Plain, China. J. Integr. Agric. 2022, 21, 235–248. [Google Scholar]
- Yu, H.; Wang, Z.; Mao, D.; Jia, M.; Chang, S.; Li, X. Spatiotemporal Variations of Soil Salinization in China’s West Songnen Plain. Land Degrad. Dev. 2023, 34, 2366–2378. [Google Scholar] [CrossRef]
- Duveiller, G.; Defourny, P.; Desclée, B.; Mayaux, P. Deforestation in Central Africa: Estimates at Regional, National and Landscape Levels by Advanced Processing of Systematically-Distributed Landsat Extracts. Remote Sens. Environ. 2008, 112, 1969–1981. [Google Scholar] [CrossRef]
- Jin, B.; Ye, P.; Zhang, X.; Song, W.; Li, S. Object-Oriented Method Combined with Deep Convolutional Neural Networks for Land-Use-Type Classification of Remote Sensing Images. J. Indian Soc. Remote Sens. 2019, 47, 951–965. [Google Scholar] [CrossRef]
- Blaschke, T.; Lang, S.; Lorup, E.; Strobl, J.; Zeil, P. Object-Oriented Image Processing in an Integrated GIS/Remote Sensing Environment and Perspectives for Environmental Applications. Environ. Inf. Plan. Polit. Public 2000, 2, 555–570. [Google Scholar]
- Myint, S.W.; Gober, P.; Brazel, A.; Grossman-Clarke, S.; Weng, Q. Per-Pixel vs. Object-Based Classification of Urban Land Cover Extraction Using High Spatial Resolution Imagery. Remote Sens. Environ. 2011, 115, 1145–1161. [Google Scholar] [CrossRef]
- Purwanto, A.D.; Wikantika, K.; Deliar, A.; Darmawan, S. Decision Tree and Random Forest Classification Algorithms for Mangrove Forest Mapping in Sembilang National Park, Indonesia. Remote Sens. 2022, 15, 16. [Google Scholar] [CrossRef]
- Li, M.; Im, J.; Beier, C. Machine Learning Approaches for Forest Classification and Change Analysis Using Multi-Temporal Landsat TM Images over Huntington Wildlife Forest. GIScience Remote Sens. 2013, 50, 361–384. [Google Scholar] [CrossRef]
- Tikuye, B.G.; Rusnak, M.; Manjunatha, B.R.; Jose, J. Land Use and Land Cover Change Detection Using the Random Forest Approach: The Case of The Upper Blue Nile River Basin, Ethiopia. Glob. Chall. 2023, 7, 2300155. [Google Scholar] [CrossRef]
- Tokar, O.; Vovk, O.; Kolyasa, L.; Havryliuk, S.; Korol, M. Using the Random Forest Classification for Land Cover Interpretation of Landsat Images in the Prykarpattya Region of Ukraine. In Proceedings of the 2018 IEEE 13th International Scientific and Technical Conference on Computer Sciences and Information Technologies (CSIT), Lviv, Ukraine, 11–14 September 2018; Volume 1, pp. 241–244. [Google Scholar] [CrossRef]
- Yang, Y. Evolution of Habitat Quality and Association with Land-Use Changes in Mountainous Areas: A Case Study of the Taihang Mountains in Hebei Province, China. Ecol. Indic. 2021, 129, 107967. [Google Scholar] [CrossRef]
- Li, Y.; Duo, L.; Zhang, M.; Yang, J.; Guo, X. Habitat Quality Assessment of Mining Cities Based on InVEST Model—A Case Study of Yanshan County, Jiangxi Province. Int. J. Coal Sci. Technol. 2022, 9, 28. [Google Scholar] [CrossRef]
- Wang, B.; Cheng, W. Effects of Land Use/Cover on Regional Habitat Quality under Different Geomorphic Types Based on InVEST Model. Remote Sens. 2022, 14, 1279. [Google Scholar] [CrossRef]
- Nematollahi, S.; Fakheran, S.; Kienast, F.; Jafari, A. Application of InVEST Habitat Quality Module in Spatially Vulnerability Assessment of Natural Habitats (Case Study: Chaharmahal and Bakhtiari Province, Iran). Environ. Monit. Assess. 2020, 192, 487. [Google Scholar] [CrossRef]
- Sun, Q.; Yu, J.; Zeng, Y.; Gai, Y.; Wang, J.; Zhang, Y. Mapping biodiversity conservation priorities for protected areas for spatial optimization: A case study in the Songnen Plain, China. Ecol. Evol. 2021, 11, 5620–5632. [Google Scholar] [CrossRef]
- Chang, Z.; Liu, L.; Ma, J.; Cao, W.; Cui, Y.; Shi, K. Hillside Urban Expansion Exacerbates Nature and Semi-Nature Habitat Landscape Fragmentation in China. Int. J. Digit. Earth 2024, 17, 2368095. [Google Scholar] [CrossRef]
- Wu, L.; Sun, C.; Fan, F. Estimating the Characteristic Spatiotemporal Variation in Habitat Quality Using the InVEST Model—A Case Study from Guangdong–Hong Kong–Macao Greater Bay Area. Remote Sens. 2021, 13, 1008. [Google Scholar] [CrossRef]
- Cui, G.; Zhang, Y.; Shi, F.; Jia, W.; Pan, B.; Han, C.; Liu, Z.; Li, M.; Zhou, H. Study of Spatiotemporal Changes and Driving Factors of Habitat Quality: A Case Study of the Agro-Pastoral Ecotone in Northern Shaanxi, China. Sustainability 2022, 14, 5141. [Google Scholar] [CrossRef]
- Czekajlo, A.; Coops, N.C.; Wulder, M.A.; Hermosilla, T.; Lu, Y.; White, J.C.; Van Den Bosch, M. The Urban Greenness Score: A Satellite-Based Metric for Multi-Decadal Characterization of Urban Land Dynamics. Int. J. Appl. Earth Obs. Geoinf. 2020, 93, 102210. [Google Scholar] [CrossRef]
- Li, Y.; Zhang, L.; Yan, J.; Wang, P.; Hu, N.; Cheng, W.; Fu, B. Mapping the Hotspots and Coldspots of Ecosystem Services in Conservation Priority Setting. J. Geogr. Sci. 2017, 27, 681–696. [Google Scholar] [CrossRef]
- Zhang, X.; Zhao, T.; Xu, H.; Liu, W.; Wang, J.; Chen, X.; Liu, L. GLC_FCS30D: The First Global 30 m Land-Cover Dynamics Monitoring Product with a Fine Classification System for the Period from 1985 to 2022 Generated Using Dense-Time-Series Landsat Imagery and the Continuous Change-Detection Method. Earth Syst. Sci. Data 2024, 16, 1353–1381. [Google Scholar] [CrossRef]
- Yang, J.; Huang, X. The 30 m Annual Land Cover Datasets and Its Dynamics in China from 1985 to 2023. Earth Syst. Sci. Data 2024, 13, 3907–3925. [Google Scholar] [CrossRef]
- Zhang, H.; Lang, Y. Quantifying and Analyzing the Responses of Habitat Quality to Land Use Change in Guangdong Province, China over the Past 40 Years. Land 2022, 11, 817. [Google Scholar] [CrossRef]
- Zhang, M.; Zhou, A.; Cao, S.; Yuan, Y. A Spatial Study on the Impact of Habitat Quality on Geological Disaster Susceptibility: A Case Study in Pingshan County, China. Appl. Sci. 2024, 14, 5151. [Google Scholar] [CrossRef]
- Jia, C.; Li, Z.; Yang, X.; Liu, H.; Yang, X. The Spatiotemporal Evolution Characteristics and Influencing Factors of Habitat Quality in the Typical Region of the Lunan Economic Belt: A Case Study of Donggang District, Rizhao. Environ. Monit. Assess. 2024, 196, 1–20. [Google Scholar] [CrossRef] [PubMed]
- Zhai, J.; Wang, L.; Liu, Y.; Wang, C.; Mao, X. Assessing the Effects of China’s Three-North Shelter Forest Program over 40 Years. Sci. Total Environ. 2023, 857, 159354. [Google Scholar] [CrossRef]
- Yang, H. China’s Natural Forest Protection Program: Progress and Impacts. For. Chron. 2017, 93, 113–117. [Google Scholar] [CrossRef][Green Version]
- Wang, X.; Bennett, J. Policy Analysis of the Conversion of Cropland to Forest and Grassland Program in China. Environ. Econ. Policy Stud. 2008, 9, 119–143. [Google Scholar] [CrossRef]
- Wen-Biao, Q.I.; Yang-, L.I.U. Summary of Key Technical Issues of the Water Supply Project from Songhua River to the Central Cities of Jilin Province. J. Yangtze River Sci. Res. Inst. 2012, 29, 1. [Google Scholar] [CrossRef]
- Chen, H.; Wenger, R.B. Water Diversion Projects in China. In Securing Water and Wastewater Systems: Global Experiences; Clark, R.M., Hakim, S., Eds.; Springer International Publishing: Cham, Switzerland, 2014; pp. 213–232. ISBN 978-3-319-01092-2. [Google Scholar]
- Qi, Q.Q. Application of a Groundwater Modelling System in Groundwater Environmental Impact Assessment of River and Lake Connection in Western Jilin Region. Appl. Ecol. Environ. Res. 2019, 17, 5059–5066. [Google Scholar] [CrossRef]
- Fan, J.; Li, P. The Scientific Foundation of Major Function Oriented Zoning in China. J. Geogr. Sci. 2009, 19, 515–531. [Google Scholar] [CrossRef]
- Li, Y.; Duan, H. How to Design “Three Lines and One List” System in Local Regulations—Taking Regulations of Jilin Province on Ecological and Environmental Protection as an Example. IOP Conf. Ser. Earth Environ. Sci. 2021, 632, 052055. [Google Scholar] [CrossRef]
- Cheng, Z.; Zhang, Y.; Wang, L.; Wei, L.; Wu, X. An Analysis of Land-Use Conflict Potential Based on the Perspective of Production–Living–Ecological Function. Sustainability 2022, 14, 5936. [Google Scholar] [CrossRef]
- Liu, D.; Song, C.; Fang, C.; Xin, Z.; Xi, J.; Lu, Y. A Recommended Nitrogen Application Strategy for High Crop Yield and Low Environmental Pollution at a Basin Scale. Sci. Total Environ. 2021, 792, 148464. [Google Scholar] [CrossRef] [PubMed]
- Miao, J.; Xia, H.; Li, F.; Yang, J. Analysis of the Spatio-Temporal Evolution Characteristics and Influencing Factors of Habitat Quality in Hubei Province over the Past Three Decades. ISPRS Int. J. Geo-Inf. 2025, 14, 98. [Google Scholar] [CrossRef]
- Liu, S.; Sun, T.; Ciais, P.; Zhang, H.; Fang, J.; Fang, J.; Gemechu, T.M.; Chen, B. Assessing Habitat Quality on Synergetic Land-Cover Dataset Across the Greater Mekong Subregion over the Last Four Decades. Remote Sens. 2025, 17, 1467. [Google Scholar] [CrossRef]
- Zhang, M.; Zhang, H.; Deng, W.; Yuan, Q. Assessment of Habitat Quality in Arid Regions Incorporating Remote Sensing Data and Field Experiments. Remote Sens. 2024, 16, 3648. [Google Scholar] [CrossRef]
- Wang, K.; Li, J.; Zhou, Z.; Zhang, X.J. Editorial: Soil Degradation and Restoration in Arid and Semi-Arid Regions. Front. Environ. Sci. 2023, 11, 1307500. [Google Scholar] [CrossRef]
Disclaimer/Publisher’s Note: The statements, opinions and data contained in all publications are solely those of the individual author(s) and contributor(s) and not of MDPI and/or the editor(s). MDPI and/or the editor(s) disclaim responsibility for any injury to people or property resulting from any ideas, methods, instructions or products referred to in the content. |
© 2025 by the authors. Licensee MDPI, Basel, Switzerland. This article is an open access article distributed under the terms and conditions of the Creative Commons Attribution (CC BY) license (https://creativecommons.org/licenses/by/4.0/).

