Article

Visual Prompt Learning of Foundation Models for Post-Disaster Damage Evaluation

1
Department of Computer Science, The University of Alabama at Birmingham, Birmingham, AL 35294, USA
2
David R. Cheriton School of Computer Science, University of Waterloo, Waterloo, ON N2L 3G1, Canada
*
Author to whom correspondence should be addressed.
Remote Sens. 2025, 17(10), 1664; https://doi.org/10.3390/rs17101664
Submission received: 17 March 2025 / Revised: 22 April 2025 / Accepted: 6 May 2025 / Published: 8 May 2025
(This article belongs to the Special Issue Advanced Satellite Remote Sensing for Geohazards)

Abstract

:
In response to the urgent need for rapid and precise post-disaster damage evaluation, this study introduces the Visual Prompt Damage Evaluation (ViPDE) framework, a novel contrastive learning-based approach that leverages the embedded knowledge within the Segment Anything Model (SAM) and pairs of remote sensing images to enhance building damage assessment. In this framework, we propose a learnable cascaded Visual Prompt Generator (VPG) that provides semantic visual prompts, guiding SAM to effectively analyze pre- and post-disaster image pairs and construct a nuanced representation of the affected areas at different stages. By keeping the foundation model’s parameters frozen, ViPDE significantly enhances training efficiency compared with traditional full-model fine-tuning methods. This parameter-efficient approach reduces computational costs and accelerates deployment in emergency scenarios. Moreover, our model demonstrates robustness across diverse disaster types and geographic locations. Beyond mere binary assessments, our model distinguishes damage levels with a finer granularity, categorizing them on a scale from 1 (no damage) to 4 (destroyed). Extensive experiments validate the effectiveness of ViPDE, showcasing its superior performance over existing methods. Comparative evaluations demonstrate that ViPDE achieves an F1 score of 0.7014. This foundation model-based approach sets a new benchmark in disaster management. It also pioneers a new practical architectural paradigm for foundation model-based contrastive learning focused on specific objects of interest.

1. Introduction

Throughout history, natural disasters have persistently challenged the resilience of our societies, often leading to tragic losses of life and widespread destruction. From 1998 to 2017, over 35,000 such events have resulted in more than one million deaths and 4.4 billion injuries [
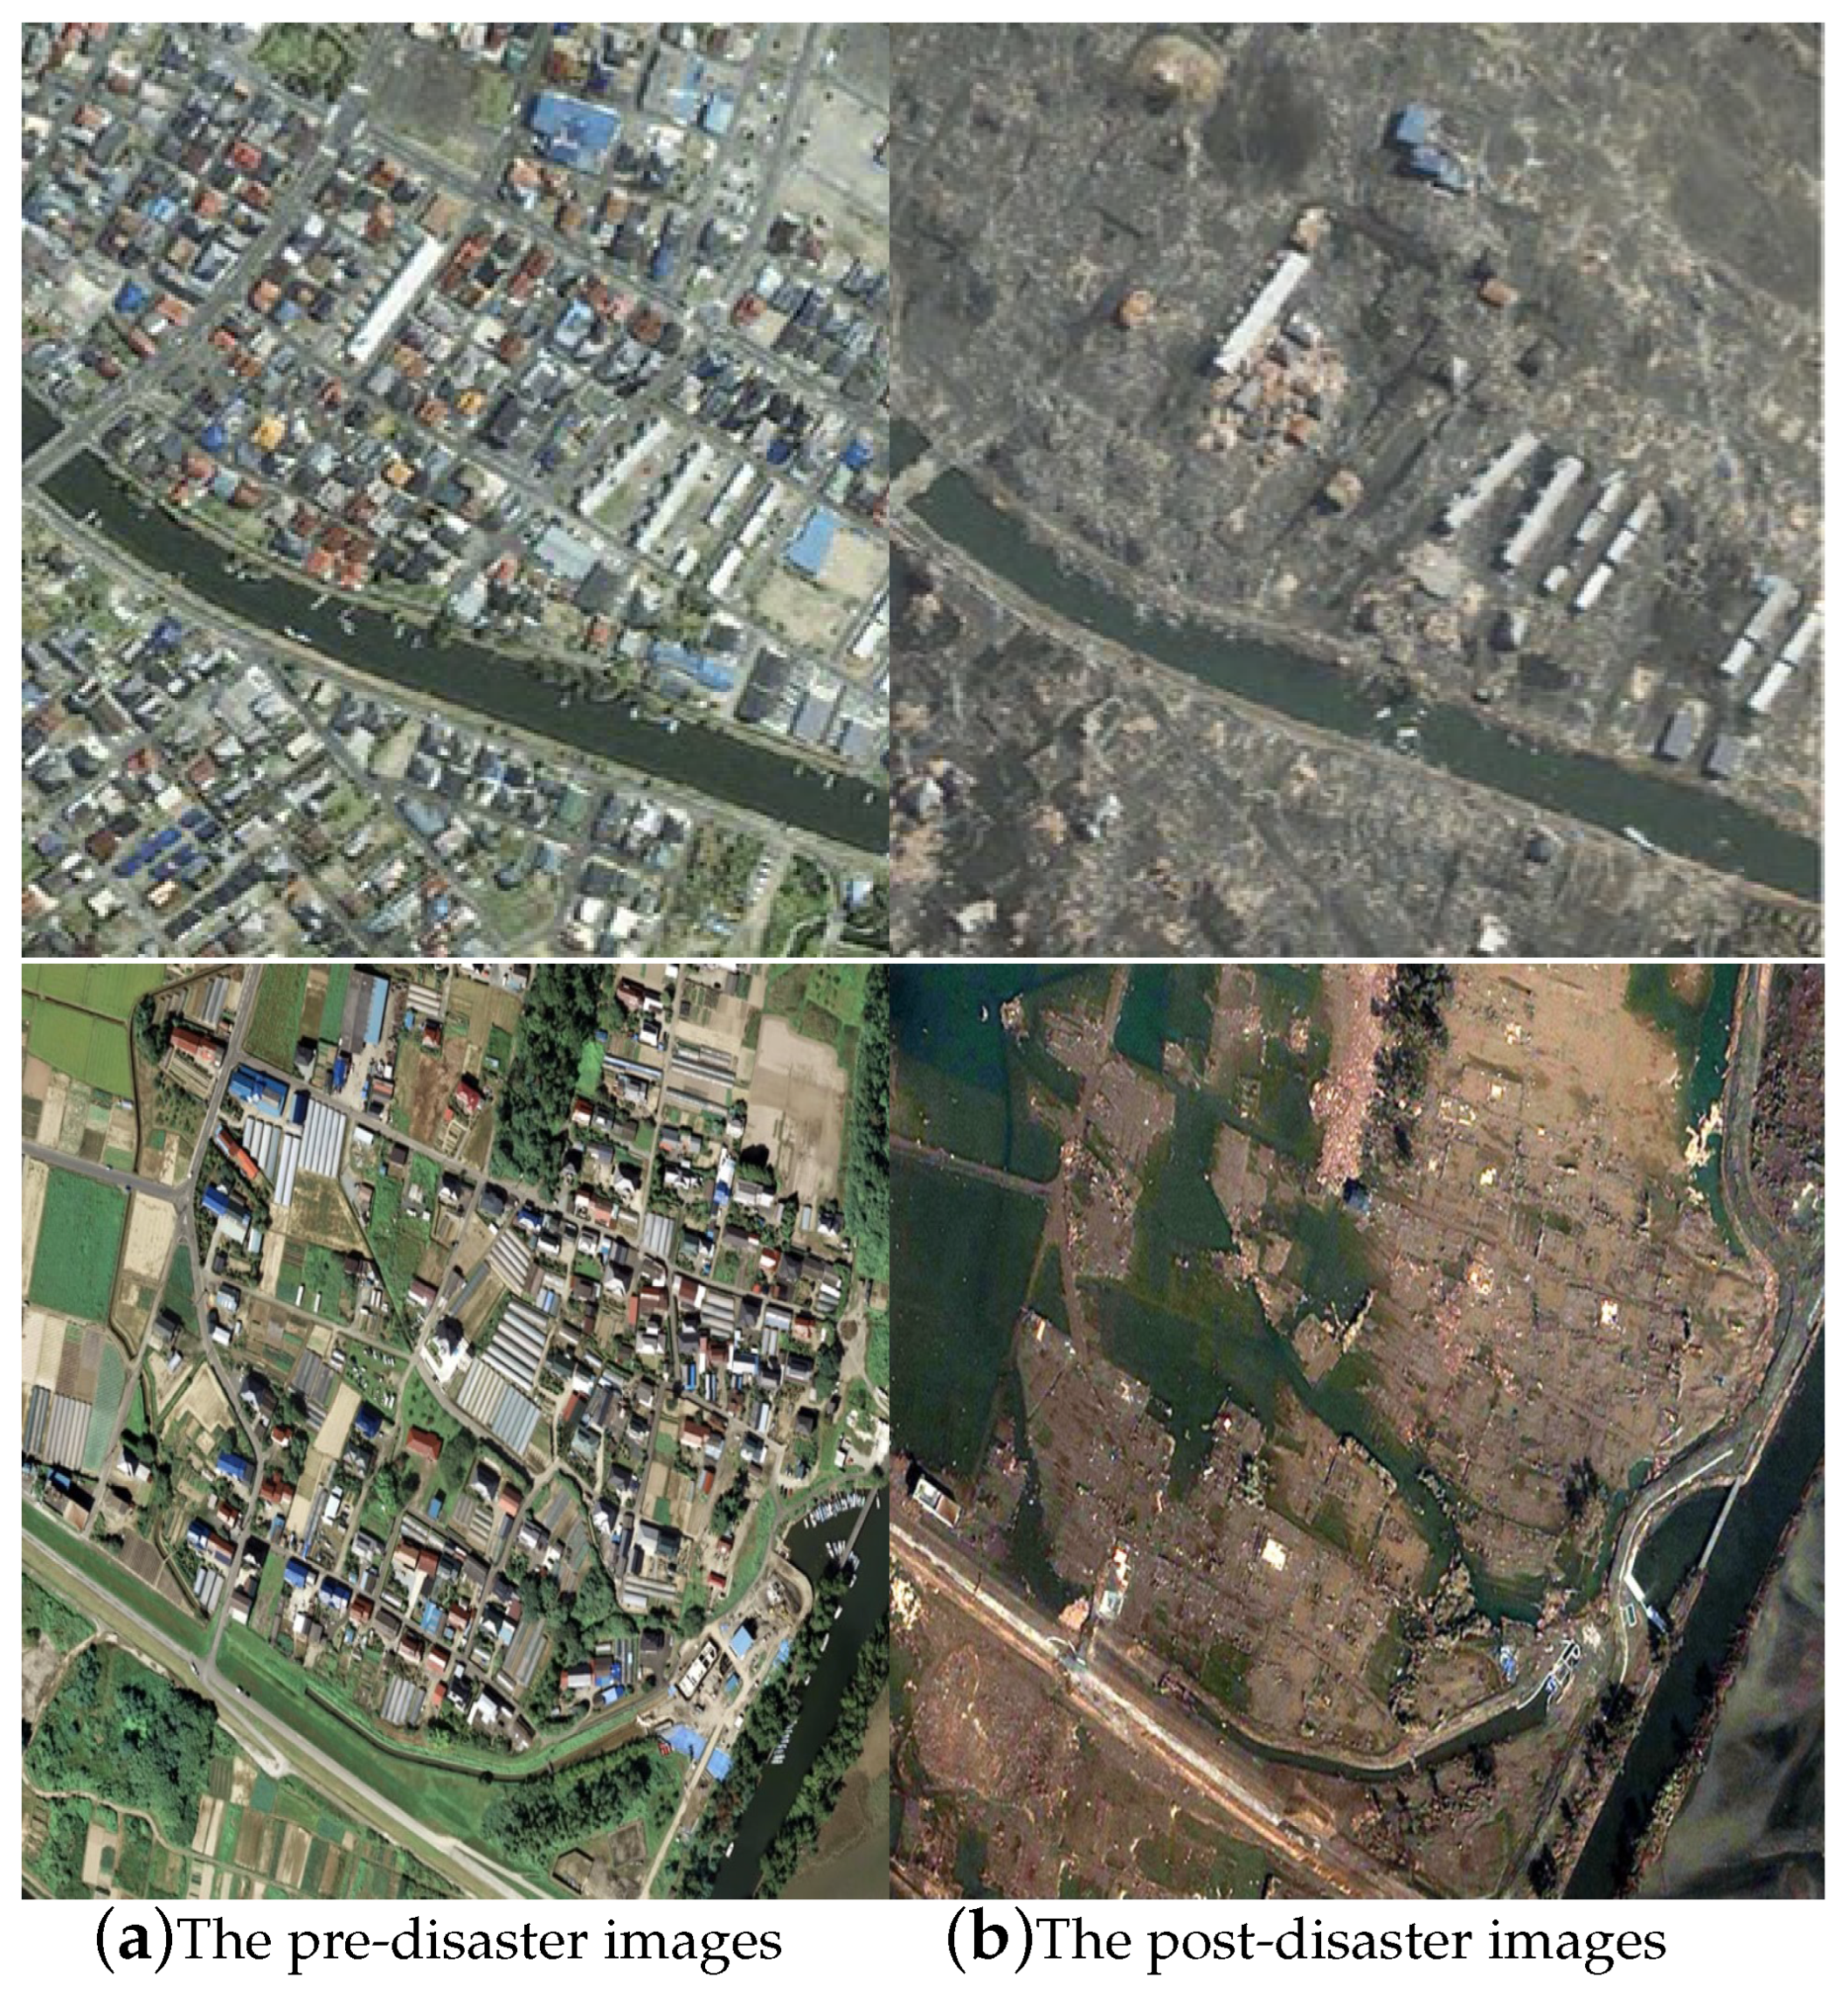
1]. For instance, the 2011 Fukushima tsunami resulted in significant human and structural losses [2], shown in Figure 1. In recent years, technological advancements in forecasting natural hazards have contributed to reducing fatalities from disasters. However, forecasting systems show varied reliability across different disaster types and are insufficient as standalone solutions for comprehensive emergency management. Critically, the majority of disaster-related casualties occur within the initial hours following a disaster event, often due to delayed rescue operations. This reality positions effective disaster response as a crucial complement to forecasting efforts. Therefore, the ability to rapidly and accurately assess building damage is important to effective disaster response, guiding the deployment of rescue and aid efforts where they are needed the most. Meanwhile, beyond binary evaluation of damage, e.g., no damage or damaged building, a nuanced determination of damage severity from minor to complete destruction is needed and instrumental in optimizing rescue team deployment and enhancing the overall response efficacy.
As the need for accurate damage evaluation becomes increasingly recognized, experts across diverse fields such as geology, meteorology, and oceanography are enlisted to provide real-time data analysis and expert guidance during rescue missions. However, the sheer scale of devastation a single disaster can inflict, impacting an entire city or country, renders manual assessment methods impractical and unsustainable. While expert input is invaluable, the extensive scope of major disasters can compromise the effectiveness of such evaluations, introducing a high likelihood of error due to fatigue and the overwhelming volume of assessments required. Additionally, these assessments are subject to biases and subjectivity inherent to individual evaluators, which could skew the critical objectivity needed in these urgent situations. Therefore, there is a pressing need for a reliable and objective system capable of assessing damage across extensive areas, enhancing the efficiency and effectiveness of emergency response efforts by accurately determining the need and urgency of the situation.
As technology advances in remote sensing, satellites are capable of capturing high-resolution imagery for an area before and after a disaster event. As referenced in Figure 1 and Figure 2, the discrepancy between pre- and post-disaster images illustrates the transformative impact caused by natural disasters on the built environment. Those completely destroyed buildings are evident and easily recognizable from images. High-quality satellite images provide emergency management teams with a complementary approach to rapidly evaluate the extent of building damage in a disaster-affected area. However, accurately assessing the extent of damage with fine granularity, such as damage level 2 (minor damage) or 3 (major damage), of the buildings is hard but much needed. Such detailed and precise damage assessment can be crucial for directing emergency response efforts and allocating resources effectively to the areas in the greatest need.
Machine learning techniques have drastically transformed the analysis of satellite imagery, automating processes and enhancing prediction accuracy. However, a critical limitation of these state-of-the-art models is their specialized design, which is often tailored for a specific type of disaster or distinct geographical region. This specialization significantly restricts their generalizability and applicability across varying scenarios. When confronted with disasters beyond their training scope, these models often exhibit diminished performance, underscoring their limited versatility across different disaster types and regions. Furthermore, these approaches typically necessitate training the entire model from scratch, which demands significant computational resources, extensive datasets, and substantial training time. This requirement not only increases the training burden but also limits the models’ ability to be promptly applied to new or unforeseen disaster scenarios. This specialization and inefficiency highlight a critical research gap: the absence of a unified model that can seamlessly handle various disaster types and geo-locations while circumventing the computational and data-intensive demand of traditional deep learning’s full-model training process.
As the field of damage evaluation evolves, it has produced a range of sophisticated models and algorithms capable of assessing damage severity from satellite imagery. However, despite these technological advances, the field still faces significant challenges that hinder further progress: (1) Image Classification and Damage Detection: Earlier approaches utilized image classification models to distinguish between damaged and undamaged buildings within satellite imagery of disaster-affected areas. The authors of [3] propose such a model specifically for hurricane damage detection, although its application was confined to hurricanes, highlighting a gap in generalizability across different disaster types. Similarly, the authors from [4] develop three image classification models for damage prediction that lack building localization capabilities, suggesting the necessity of integrating these models with localization techniques for practical use. (2) Utilization of Pre- and Post-Disaster Imagery: The difference between pre- and post-disaster imagery has been leveraged for assessing building damage. The authors of [5] utilize this contrast but face challenges with varying building types. In contrast, ref. [6] employs a method that identifies building locations in pre-disaster images, using those same locations to extract features from the corresponding post-disaster images. However, this approach is limited by its reliance on spatial consistency across the image pairs. Any misalignment between pre- and post-disaster images can compromise their reliability. Similar to the adaptation method proposed in [7], our unified model addresses this limitation by processing the pre- and post-disaster image pair simultaneously, allowing the model to learn to manage misalignments within the data. With sufficient training data, the deep learning model can automatically adapt to spatial inconsistencies, enhancing robustness in damage detection. (3) Ensemble Methods: The adoption of two-stage methods for damage detection, as proposed in [8,9,10], increases computational cost because it utilizes separate models for building detection and damage level classification. The common challenges faced by all of these approaches are the specificity of models to particular disasters, the binary approach to damage assessment, the reliance on two-stage processing pipelines, the underutilization of valuable pre-disaster imagery, and the dependency on hard-coded distance calculations for feature comparison. These gaps highlight the need for a more adaptable, universally applicable model that can handle various disaster types and geographical locations efficiently. (4) 3D Data-driven Methods: Several recent studies have demonstrated the potential of 3D data, such as LiDAR point clouds and UAV-based photogrammetry, for building damage assessment (e.g., [10,11,12]). These methods can capture structural deformations with high spatial precision; however, they face significant limitations in practice. The collection and processing of 3D data are often resource-intensive, require specialized equipment and/or flight path planning (and approval), and are not always feasible in post-disaster scenarios due to logistical and operational constraints. Additionally, airborne LiDAR data often lack sufficient spatial resolution and temporal availability to detect subtle structural damage, particularly for smaller residential buildings or roof-level changes. In contrast, 2D satellite imagery is more readily available and easier to deploy at scale. Therefore, our work focuses on developing a scalable and generalizable 2D image-based framework that leverages contrastive learning and prompt-based adaptation for damage assessment across diverse disaster types.
The advent of foundation models such as Chat-GPT [13] and GPT-4 [14] has markedly advanced AI, showcasing their broad applicability, particularly in natural language processing (NLP). This success has spurred adaptations in computer vision with models such as BEiT [15], ViT [16], and the Segment Anything Model (SAM) [17], which apply transformer-based processing to visual tasks. However, these models are not inherently suited for tasks requiring contrastive image analysis, such as damage assessment in remote sensing. The evolution from “pre-training and fine-tuning” to “pre-training and prompting” represents a significant trend in the deployment of foundation models [18,19]. Innovations such as VPT [19], which appends a set of learnable parameters to transformer encoders, significantly outperform full fine-tuning across multiple downstream recognition tasks. AdaptFormer [20] incorporates lightweight modules into ViT, achieving superior performance over fully fine-tuned models on action recognition benchmarks.
Overall, addressing this gap, our work introduces a unified model capable of handling diverse disasters and locations with greater efficiency. By leveraging a pre-trained vision foundation model with frozen backbone parameters, we significantly reduce computational costs and expedite the training process. Central to our approach is the innovative use of a learnable visual prompt generator that requires training on only a minimal number of parameters. This methodology not only enhances training efficiency but also extends the model’s applicability, offering a scalable and comprehensive solution to disaster damage assessment across various environments.
Therefore, our research proposes the Visual Prompt Damage Evaluation (ViPDE) framework, a novel contrastive learning-based approach that leverages the embedded knowledge within foundation models and the discrepancy within pairs of remote sensing images to enhance building damage assessment. Our contribution can be summarized as follows:
  • Visual Prompt Damage Evaluation Framework (ViPDE): We propose a contrastive learning-based dual-branch architecture that enables the Segment Anything Model (SAM) to dynamically utilize high-level features from paired pre- and post-disaster satellite images to enhance building damage evaluation. ViPDE integrates cascaded lightweight learnable Visual Prompt Generators while keeping the foundation model’s pre-trained weights frozen. This approach effectively utilizes the contrasts between the image pair to enhance accuracy and efficiently fine-tunes the model’s performance for damage evaluation while avoiding the extensive retraining that traditional methods typically require.
  • Visual Prompt Generator (VPG): We introduce a learnable, lightweight, cascaded Visual Prompt Generator that provides tailored visual prompts, enriched with semantic information from pre- and post-disaster images. These prompts act as navigational cues, focusing the pre-trained vision foundation models on essential damage indicators. The generator’s design, with its minimal trainable parameters, strategically amplifies the model’s pre-trained knowledge, enabling a more precise and expedient evaluation of disaster damage.
  • Prompt-Driven Contrastive Learning: Our framework introduces a novel visual prompting mechanism that enables a frozen vision foundation model (SAM) to perform contrastive analysis between pre- and post-disaster image pairs without modifying its internal representations. By leveraging contrastive learning at the prompt level, the model is guided to attend to semantic discrepancies indicative of damage, enhancing its ability to segment buildings into detailed categories: “no damage”, “minor damage”, “major damage”, and “destroyed”. This disaster-agnostic design allows for direct deployment across a wide range of natural disasters and geographic regions without the need for retraining or full-model fine-tuning. The resulting fine-grained assessments are crucial for the timely and targeted deployment of emergency resources, improving the overall effectiveness of disaster response efforts.
The remainder of this paper is structured as follows: Section 1 provides a review of the relevant literature. Section 2 elaborates on our methodology, detailing the innovative techniques utilized in our approach. Section 3 describes the dataset used in this study. Section 4 outlines the experimental setup and metrics. Section 5 analyzes the results, discussing the implications and significance of our findings. Finally, Section 6 summarizes the key outcomes of our research and proposes directions for future work, highlighting potential advancements of our work.

2. Methodology

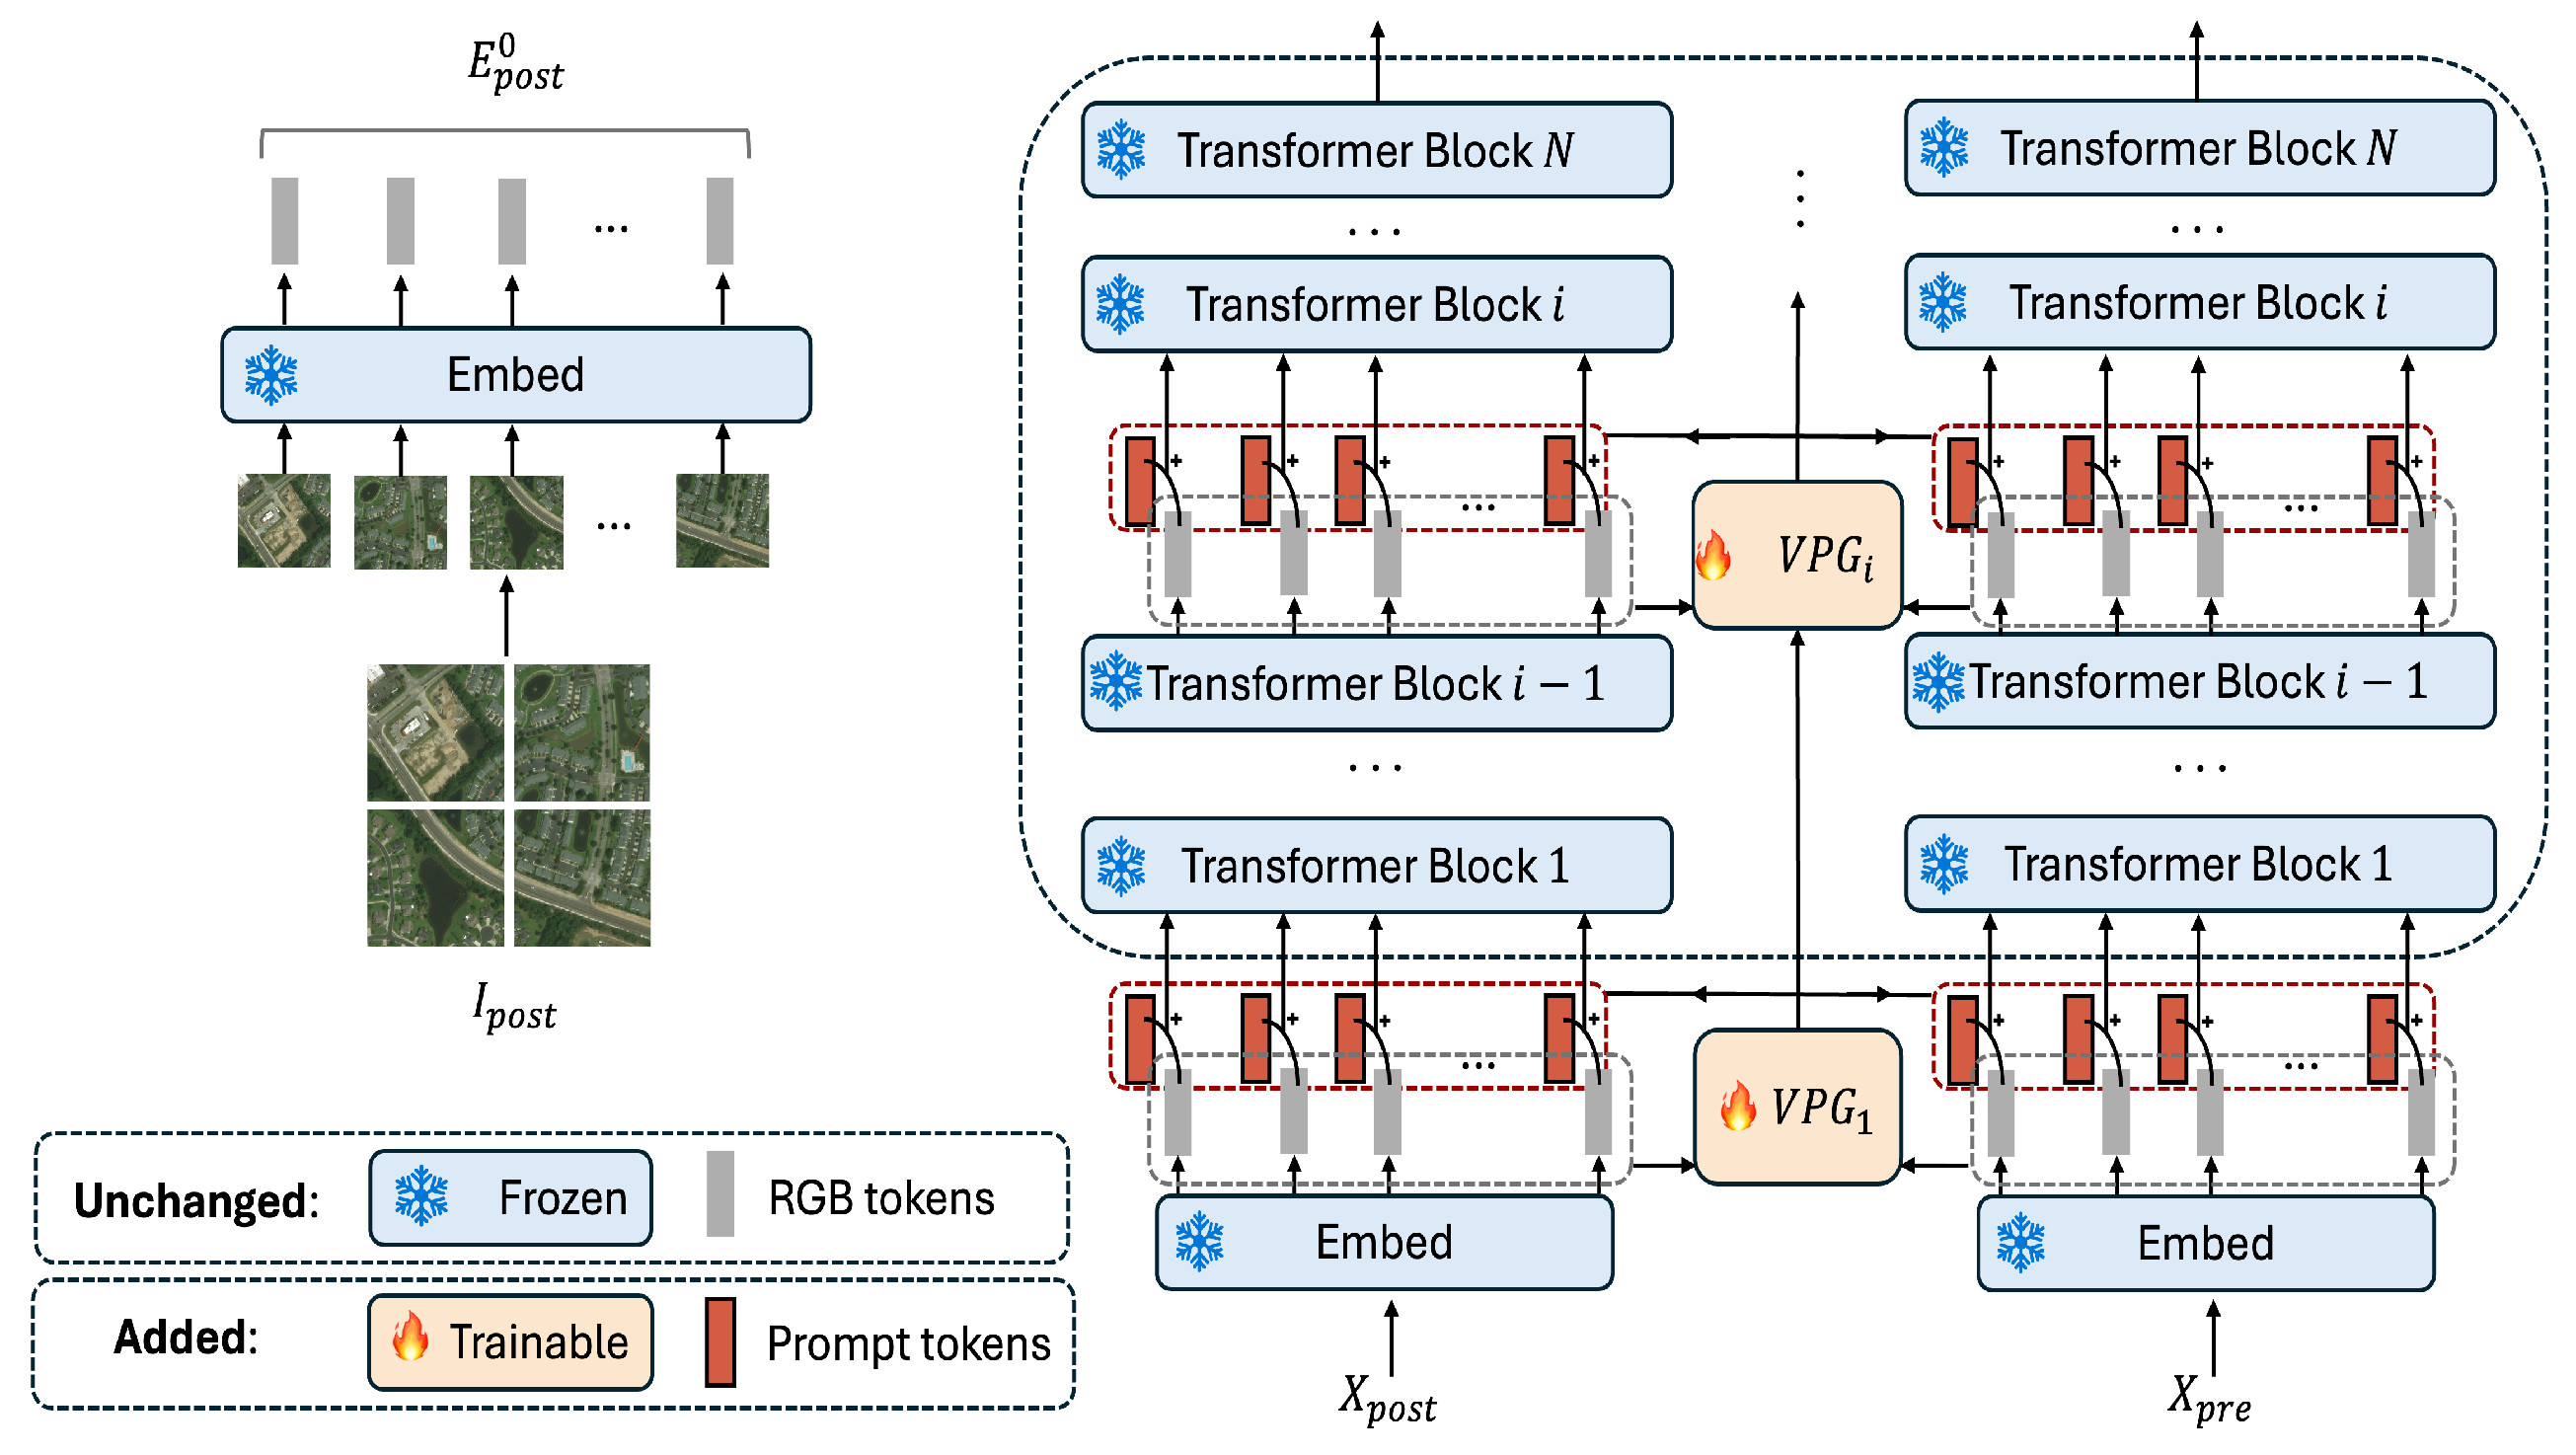
In this section, we introduce the Visual Prompt Damage Evaluation (ViPDE), a novel contrastive learning-based approach that utilizes a pre-trained vision foundation model, specifically SAM, for the semantic damage segmentation of satellite imagery. The cornerstone of ViPDE is the learnable Visual Prompt Generator (VPG) module, which can provide visual prompts guiding SAM to effectively analyze pre- and post-disaster image pairs and form a nuanced representation of the affected. As illustrated in Figure 3, VPG is meticulously designed to generate multi-stage visual prompts enriched with semantic information extracted from both pre- and post-disaster imagery. These prompts serve as navigational semantic cues, steering the foundation model’s focus toward critical features indicative of damage. The VPG automates contrastive learning, enabling the model to effectively differentiate between damaged and undamaged areas, thereby significantly boosting accuracy in damage assessment.

2.1. The Overall Architecture of ViPDE

Our proposed approach treats the building damage evaluation task as a semantic segmentation task. It utilizes a pair of pre-disaster ( X p r e ) and post-disaster ( X p o s t ) RGB images as the input to enhance building damage evaluation accuracy. The frozen SAM’s image encoder, structured in a sequence of Transformer blocks, is adopted to extract nuanced features from those images. For each image pair, X p r e and X p o s t , the process begins by projecting them into initial token embeddings E p r e 0 = E m b e d ( X p r e ) and E p o s t 0 = E m b e d ( X p o s t ) , respectively. These embeddings are then combined with the visual prompt P 1 (Figure 3) to create new merged embeddings, E m e r g e d , p r e 0 and E m e r g e d , p o s t 0 . Subsequently, these refined embeddings are processed through N encoder Transformer blocks B l o c k i ( · ) , where i = 1 , , N :
E p r e i = B l o c k i ( E m e r g e d , p r e i 1 )
E p o s t i = B l o c k i ( E m e r g e d , p o s t i 1 )
Here, E p r e i and E p o s t i ( 1 i N ) are outputs from the i-th encoder block for pre- and post-disaster images, respectively. Our Visual Prompt Generator (VPG) module augments the original RGB data flow with context-specific semantic visual prompts tailored to damage assessment:
E m e r g e d , p r e i 1 = E p r e i 1 + P i
E m e r g e d , p o s t i 1 = E p o s t i 1 + P i
E m e r g e d , p r e i 1 and E m e r g e d , p o s t i 1 ( 1 i N ) denote the input token sequences for pre- and post-disaster images, respectively, at the i-th stage, each enhanced by the addition of prompt P i provided by the VPG module. This inclusion of disaster-specific prompts at multiple stages effectively enriches SAM’s semantic analysis across different levels of feature abstraction.
These processed features are combined to generate the final segmentation output Y s e g through a specialized decoder D e c o d e r ( · ) that accounts for the nuances of disaster impact:
Y s e g = D e c o d e r ( E p r e N , E p o s t N )
ViPDE maintains all SAM parameters in a frozen state, including those for patch embedding and feature extraction, except for the learnable VPG module. The VPG only introduces a minimal number of trainable parameters for generating and integrating visual prompts into the pre-disaster and post-disaster input sequences. By doing so, ViPDE ensures the pre-trained model’s architecture is preserved while enabling efficient, task-specific adaptations through prompt insertion. This approach allows for precise post-disaster damage assessment without necessitating extensive retraining or requiring an explicit distance function for alignment between pre- and post-disaster features.

2.2. Visual Prompt Generator (VPG)

As depicted in Figure 3, our learnable VPG module is innovatively integrated at multiple stages within the foundational network to inject task-specific enhancements. The architecture of VPG is visualized in Figure 4.
As shown in Equation (6), visual prompt P i is generated by V P G i ( · ) module based on the prompt P i 1 and embedding sequences E p r e i 1 and E p o s t i 1 generated in the previous stage. The VPG module is designed to learn and apply visual prompts that effectively capture the difference between the pre- and post-disaster states. The process proceeds as follows:
P i = V P G i ( E p r e i 1 , E p o s t i 1 ) , if i = 1 V P G i ( E p r e i 1 , E p o s t i 1 , P i 1 ) , if 1 < i N
where P i denotes the input visual prompts at the i-th stage of the Transformer blocks, seeded by three flows: E p r e i 1 , E p o s t i 1 , and P i 1 . This strategy enables stage-wise refinement, enhancing the model’s sensitivity to visual changes induced by disasters. The VPG module undergoes three key phases: (i) projecting each flow to a lower-dimensional space for streamlined processing, (ii) enriching feature representations to highlight areas of change or damage, and (iii) merging these enhanced embeddings to form comprehensive visual prompts:
M p r e i = g 1 ( E p r e i 1 )
M p o s t i = g 2 ( E p o s t i 1 )
M p r o m p t i = g 3 ( P i 1 )
The channel size is reduced to a lower-dimensional space (from 768 to 192 channels) using 1 × 1 convolutional networks, denoted as g 1 ( · ) , g 2 ( · ) , and g 3 ( · ) , for the pre-disaster, post-disaster, and previously generated prompt flows, respectively.
Following this, Channel Attention [21] is applied to both M p r e i and M p o s t i , focusing the model’s attention on areas of interest within the images. This module dynamically recalibrates channel-wise features using global spatial information from two pipelines: average and max pooling. Specifically, each pipeline’s importance is computed by processing the pooled features through a shared Multi-Layer Perceptron (MLP), followed by a sigmoid activation to obtain attention weights:
M a t t , p r e i = M p r e i · σ ( M L P ( A v g P o o l ( M p r e i ) ) + M L P ( M a x P o o l ( M p r e i ) ) )
M a t t , p o s t i = M p o s t i · σ ( M L P ( A v g P o o l ( M p o s t i ) ) + M L P ( M a x P o o l ( M p o s t i ) ) )
where σ denotes the sigmoid function, ensuring the resulting attention weights range between 0 and 1; AvgPool and MaxPool represent the global average and max pooling operations; and MLP is the shared Multi-Layer Perceptron that models channel-wise dependencies. This attention mechanism significantly enhances the model’s ability to focus on regions undergoing changes between the pre- and post-disaster states, effectively highlighting areas of damage while suppressing irrelevant background noise. The feature maps, M a t t , p r e i and M a t t , p o s t i , are thus refined representations that emphasize critical damage indicators for subsequent processing steps.
The subsequent phase merges the processed embeddings: M a t t , p r e i , M a t t , p o s t i , and M p r o m p t i to construct the final prompt for the next stage:
P i = g 4 ( M a t t , p r e i + M a t t , p o s t i ) , if i = 1 g 4 ( M a t t , p r e i + M a t t , p o s t i + M p r o m p t i ) , if 1 < i N
Here, g 4 ( · ) is 1 × 1 ConvNet to project the features back to the original dimension.
Our decoder, as outlined in Equation (5), processes only the final features, E p r e N and E p o s t N , derived from the last set of Transformer blocks. Those features are merged and subsequently upsampled through two 2 × 2 transpose convolution layers ( U p s a m p l e ( · ) ) to match the resolution of the input image. Following the upsampling, a multi-scale convolutional strategy ( M S C o n v ( · ) ), as proposed in [22], effectively integrates these features across different scales. The resulting segmentation map is generated by a linear layer ( L i n e a r ( · ) ), which classifies the level of damage for each pixel, ranging from “no damage” to “destroyed”.
Y s e g = L i n e a r ( M S C o n v ( U p s a m p l e ( E p r e N + E p o s t N ) ) )
Through the integration of multi-scale convolution and resolution reconstruction, the ViPDE decoder effectively synthesizes the processed features into a precise segmentation of building damage levels. This approach ensures that ViPDE not only leverages the power of pre-trained foundation models through the VPG but also applies advanced decoding techniques to achieve unparalleled accuracy in post-disaster image analysis.

3. Dataset and Loss Functions

In this study, we utilize the xBD satellite image dataset [
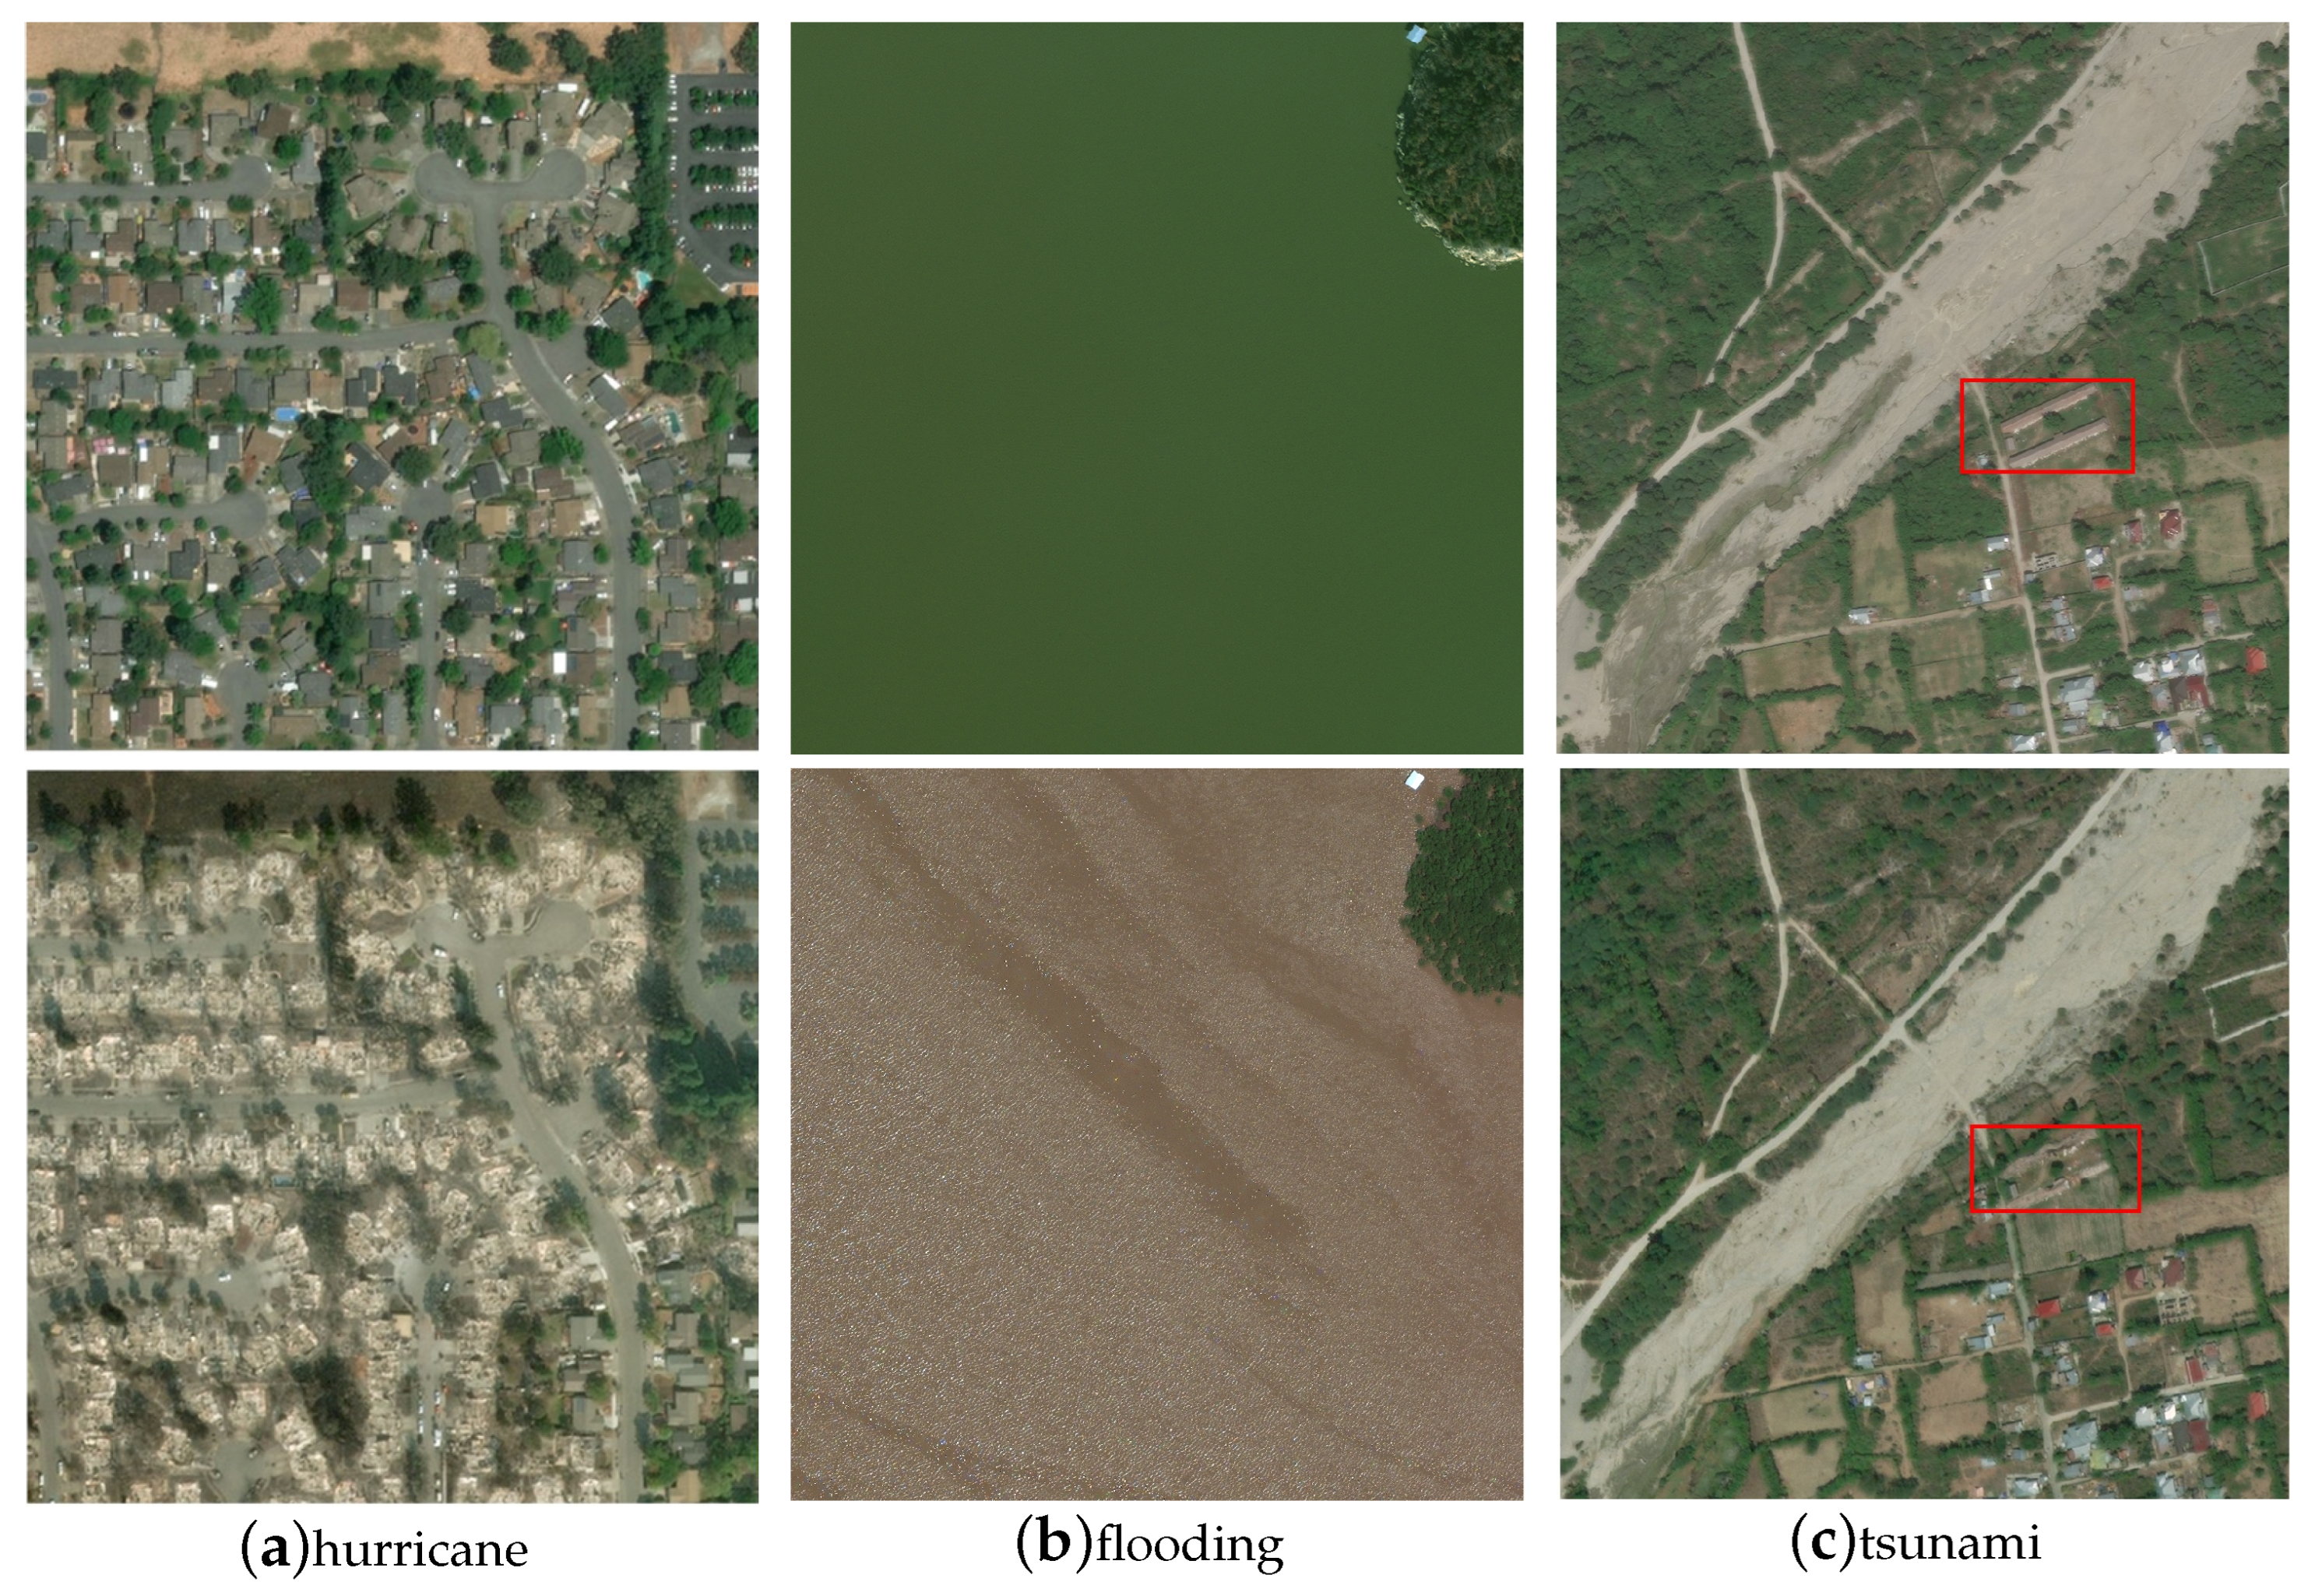
9], consisting of 22,068 high-resolution images (1024 × 1024 × 3) that cover a comprehensive range of pre- and post-disaster scenarios. Several samples are displayed in Figure 2, with the top row showing pre-disaster images and the bottom row presenting the corresponding post-disaster images. These three pairs of images are sampled from three different types of disasters, i.e., tornado, flooding, and tsunami. In (a), most buildings are destroyed by the hurricane except the buildings at the bottom right corner. In (b), the building suffered major damage because it is completely surrounded by water. In (c), the two commercial buildings within the red rectangle are destroyed by the tsunami. Even though the xBD dataset has lots of merits mentioned above, there are two main issues with this dataset, which are an imbalanced class issue and a misalignment issue between pre- and post-disaster images.
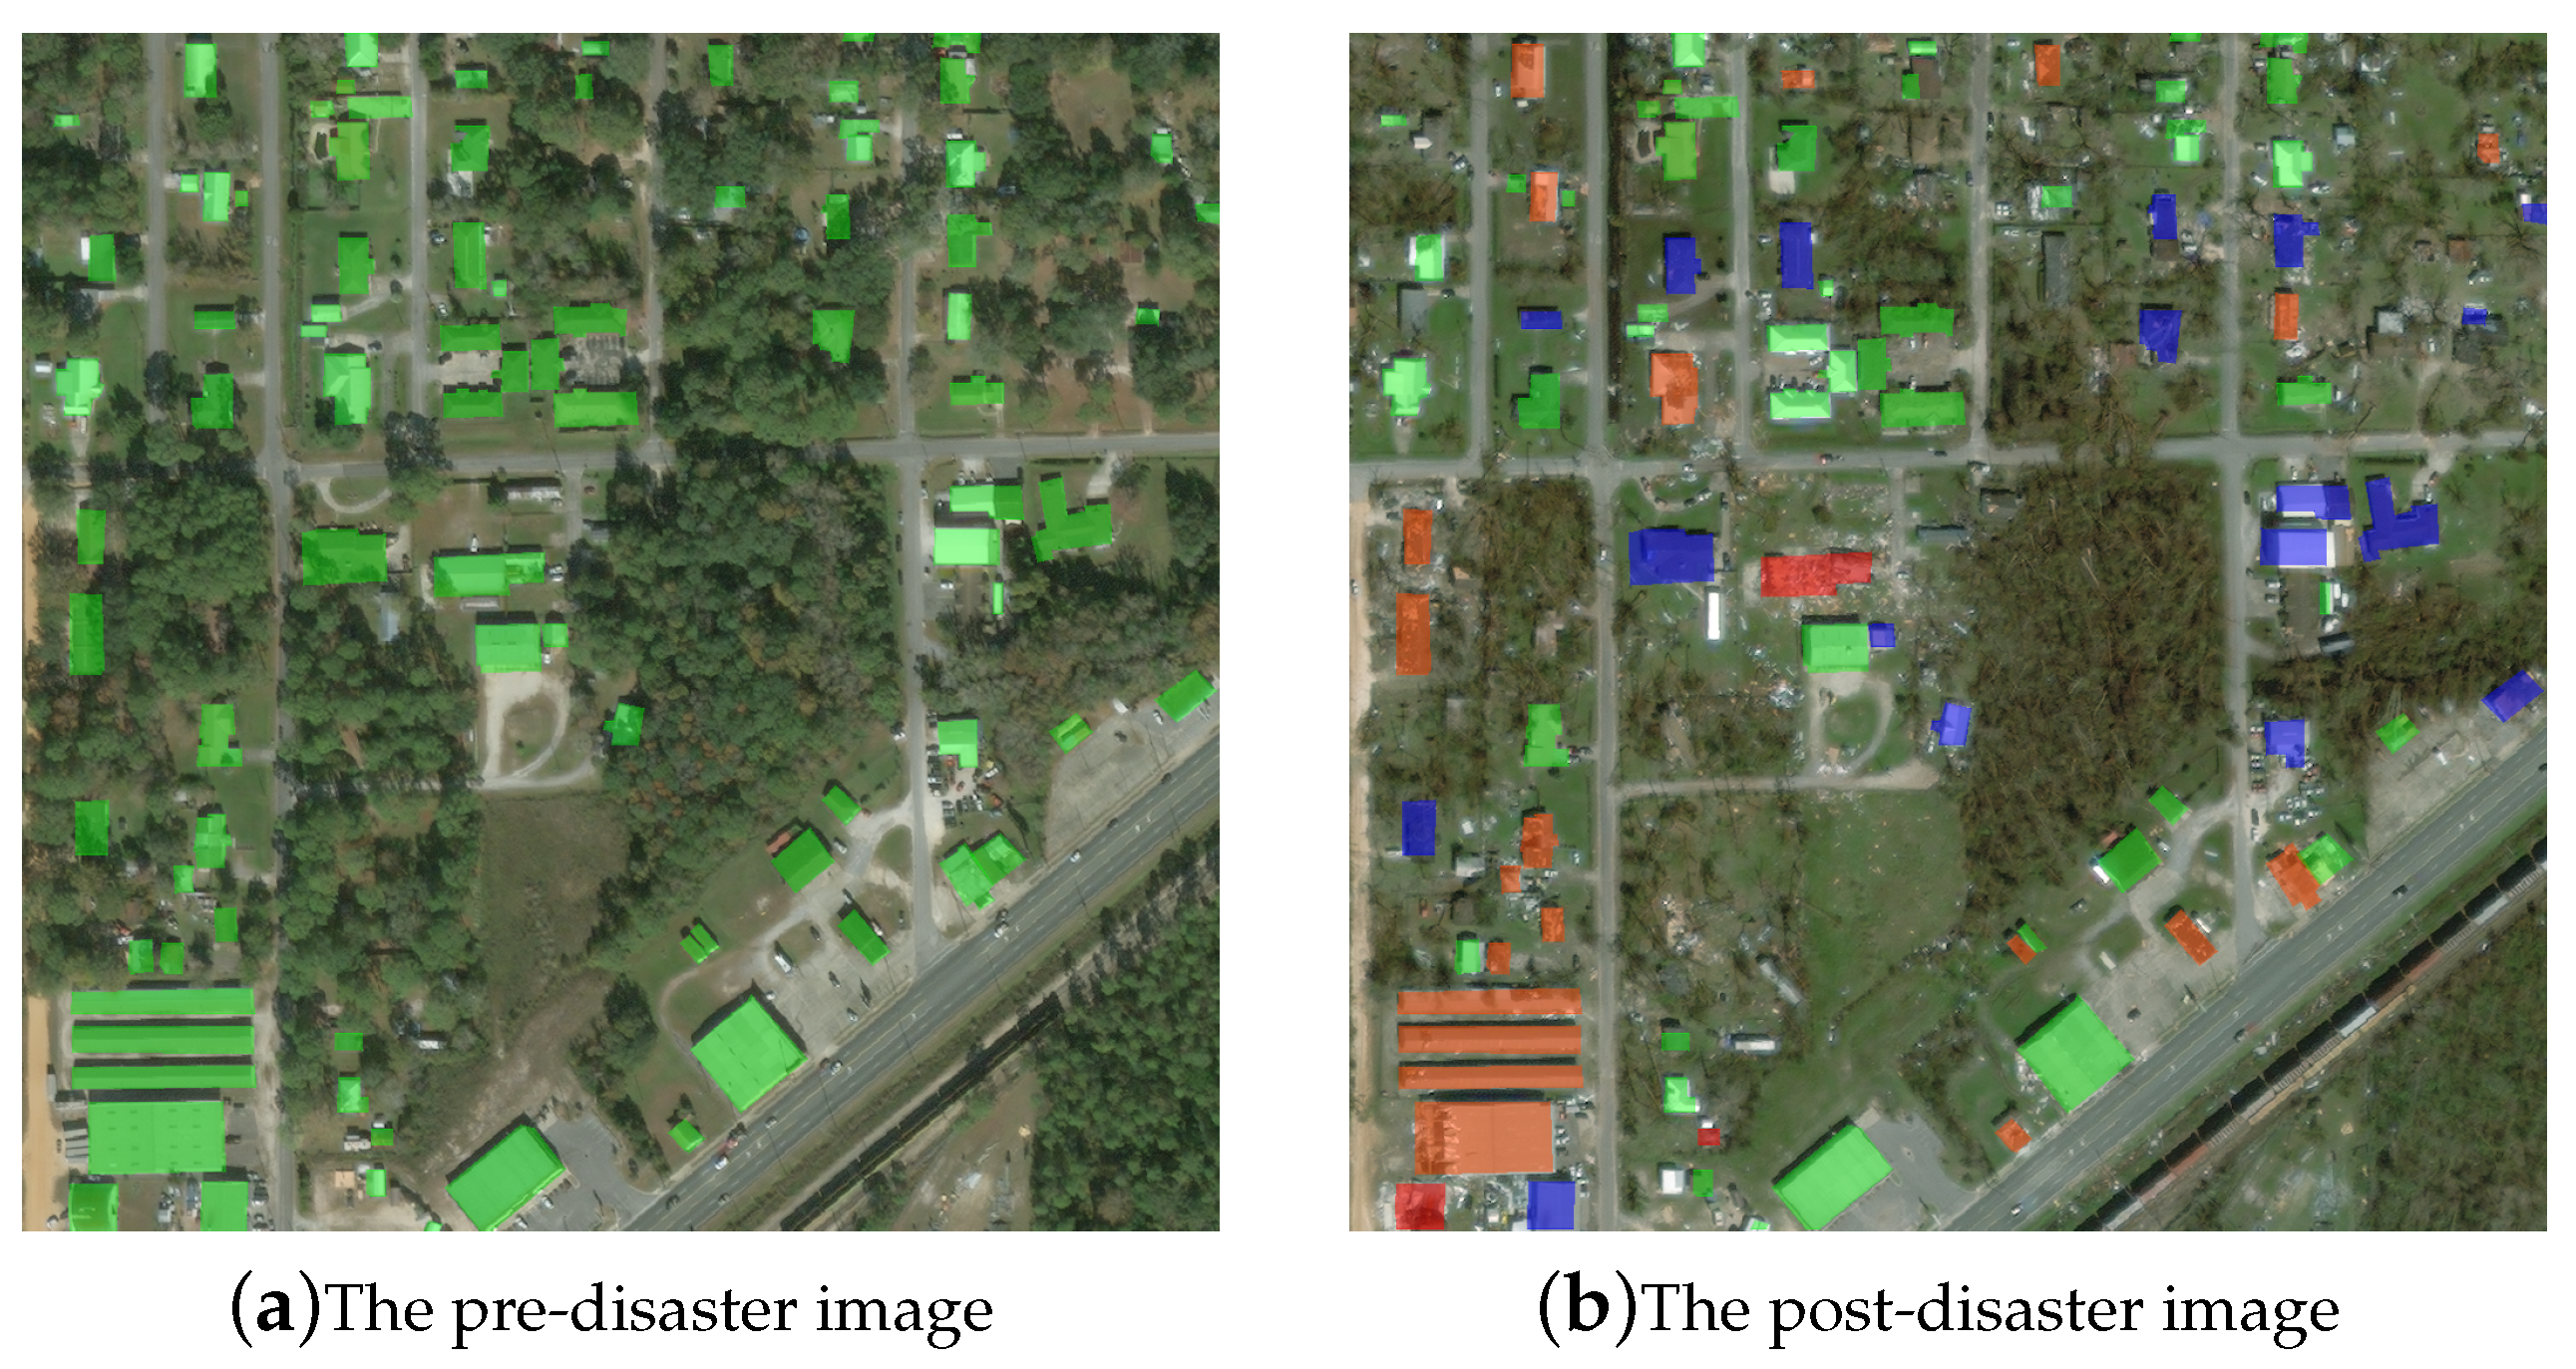
The xBD dataset offers a unique advantage by providing paired pre- and post-disaster satellite images for each affected location, making it well-suited for building damage assessment tasks. As visualized in Figure 5, the xBD dataset includes fine-grained ground truth annotations, where each building is labeled with one of four damage levels: “no damage”, “minor damage”, “major damage”, or “destroyed”. These labels are determined through expert visual analysis of image pairs, supported by metadata. The dataset covers 11 types of natural disasters—including floods, hurricanes, and earthquakes—across 19 countries and cities, with a diverse mix of residential and commercial building structures. Its scale, diversity, and detailed labeling make xBD a comprehensive benchmark for training models to generalize across varied disaster scenarios and architectural contexts.

3.1. Imbalanced Classes

In the xBD dataset, there are five classes, including “no damage”, “minor damage”, “major damage”, “destroyed”, and “unclassified”. A building labeled with “no damage” class means that there is no sign of water, structural or shingle damage, or burn marks. Buildings with “minor damage” means that these buildings are partially burnt or in water surrounding structures, etc. A building annotated as “major damage” means that there exists partial wall or roof collapse, or the building is surrounded by water or mud, etc. The “destroyed” class is for the building that is completely collapsed, covered by water or mud, etc. The “unclassified” class is the data without ground truth, which are removed from our study. Several samples are shown in Figure 6.
The xBD dataset exhibits a significant class imbalance, where the “no damage” category dominates the label distribution. In particular, the number of “no damage” instances exceeds that of “minor damage”, “major damage”, and “destroyed” by at least an order of magnitude. As a result, models trained on this dataset tend to show low predictive accuracy for the minority classes, especially “minor” and “major” damage, which are not only underrepresented but also more difficult to distinguish due to similar visual characteristics.
Additionally, each image pair in the dataset presents a pixel-level imbalance between the background and building classes. The vast majority of pixels belong to the background, while only a small fraction corresponds to damaged or undamaged buildings. This imbalance can lead to biased training dynamics, where the model quickly minimizes loss for the dominant background class while under-optimizing for the more critical yet sparse damage-related categories. To address both types of imbalance, we integrate class-balancing strategies through a composite loss function, as discussed in Section 3.4.

3.2. Misalignment Issues

In addition to class imbalance, another challenge in the xBD dataset is the spatial misalignment between pre- and post-disaster images. This misalignment is often caused by shifts or tilting in satellite imaging, which occur when images are captured at different times under varying conditions. For example, in some cases, the post-disaster image shows a building that is no longer aligned with the corresponding pre-disaster building footprint, sometimes appearing entirely outside the expected region. In other cases, slight angular differences introduce geometric distortions. These inconsistencies make hard-coded pixel-wise distance calculations, such as L1 or L2 distances, unreliable for assessing damage, since they assume perfect alignment between corresponding image pairs. Our method addresses this issue by leveraging a contrastive learning framework that is robust to such spatial variations.

3.3. Data Cleaning and Augmentation

In order to deal with the imbalanced data mentioned above, we applied data cleaning and augmentation to the original xBD dataset in three steps: in the first step, we eliminated the samples containing the “unclassified” class and the samples that did not contain any foreground classes. In the second step, we split the dataset obtained by step one into a 9:1 ratio to form the basic training dataset and the validation dataset. In the last step, from the basic training dataset, we find the set of images containing at least one minor or major damaged building (minor–major group) and the set in which each image is dominated by major damaged or destroyed buildings (major-destroyed group). We then add one copy of each image in the minor–major group and the major-destroyed group into the training dataset. For example, if an image contains minor, major, and destroyed buildings and is “destroyed” dominated, there will be three copies of this image, including the original one, in the training dataset. However, if it is minor-damage dominated, then only two copies, including the original image, will be in the training set. The testing set remains unaugmented, consisting of 1866 images provided by the xBD team [9]. The size of the refined dataset is shown in Table 1.

3.4. The Loss

As we explained above, there exist two main issues in the dataset: first, an imbalance problem between classes “no damage”, “minor damage”, “major damage”, and “destroyed”. Second, there is an imbalance issue between the negative class, “background”, and the four non-background classes. To address these two issues, we apply two strategies in constructing the loss functions. In the first strategy, the classes in the model are assigned different weights based on our empirical observations. The “no damage” class is the majority among the four non-background classes. The size of the “no damage” class is at least one order of magnitude larger than any other four “foreground” classes. Moreover, the “background” class is the majority compared with the “foreground” classes. Therefore, we assign different weights to these classes, which intends to place more emphasis on these minority classes and the classes that are harder to distinguish, including the “minor damage” class and the “major damage” class. We reduce the weights for the majority classes, including the “background” class and the “no damage” class. This operation can alleviate the negative impact caused by these two imbalanced issues. The weights used in our paper are shown in Table 2. In practice, there exist a lot of ensemble method-based applications that train the models with different weights and sample their outputs as one output. Because of the computational cost, that line of method is not discussed in our paper.
In addition to assigning a different weight to each class, we further choose a combined loss, which consists of Cross-Entropy Loss, Dice Loss, and Focal Loss. We expect the Dice Loss to alleviate the problem caused by the imbalance between a “background” class and the “foreground” classes. Moreover, because it is hard for models to distinguish between the “minor damage” class and the “major damage” class, we expect to use Focal Loss to better address this issue.
The Cross-Entropy Loss is commonly used in segmentation tasks, which can be formulated as Equation (14), where n, m, y i , j , and p i , j represent the number of samples, the number of classes, the ground truth label, and the predicted probability for the sample i being class j, respectively.
L c e = i n j m y i , j l o g ( p i , j )
The focal loss can be formulated as Equation (15), where γ 0 , and α is a weight hyper-parameter. When an example is misclassified and the corresponding p i , j is small, the loss is large. However, when an example is well classified and the corresponding p i , j is close to 1, the loss for this well-classified example is down-weighted [23]. This is helpful for models to distinguish the “minor damage” class from the “major damage” class.
L f o c a l = i n j m α j ( 1 p i , j ) γ j y i , j l o g ( p i , j )
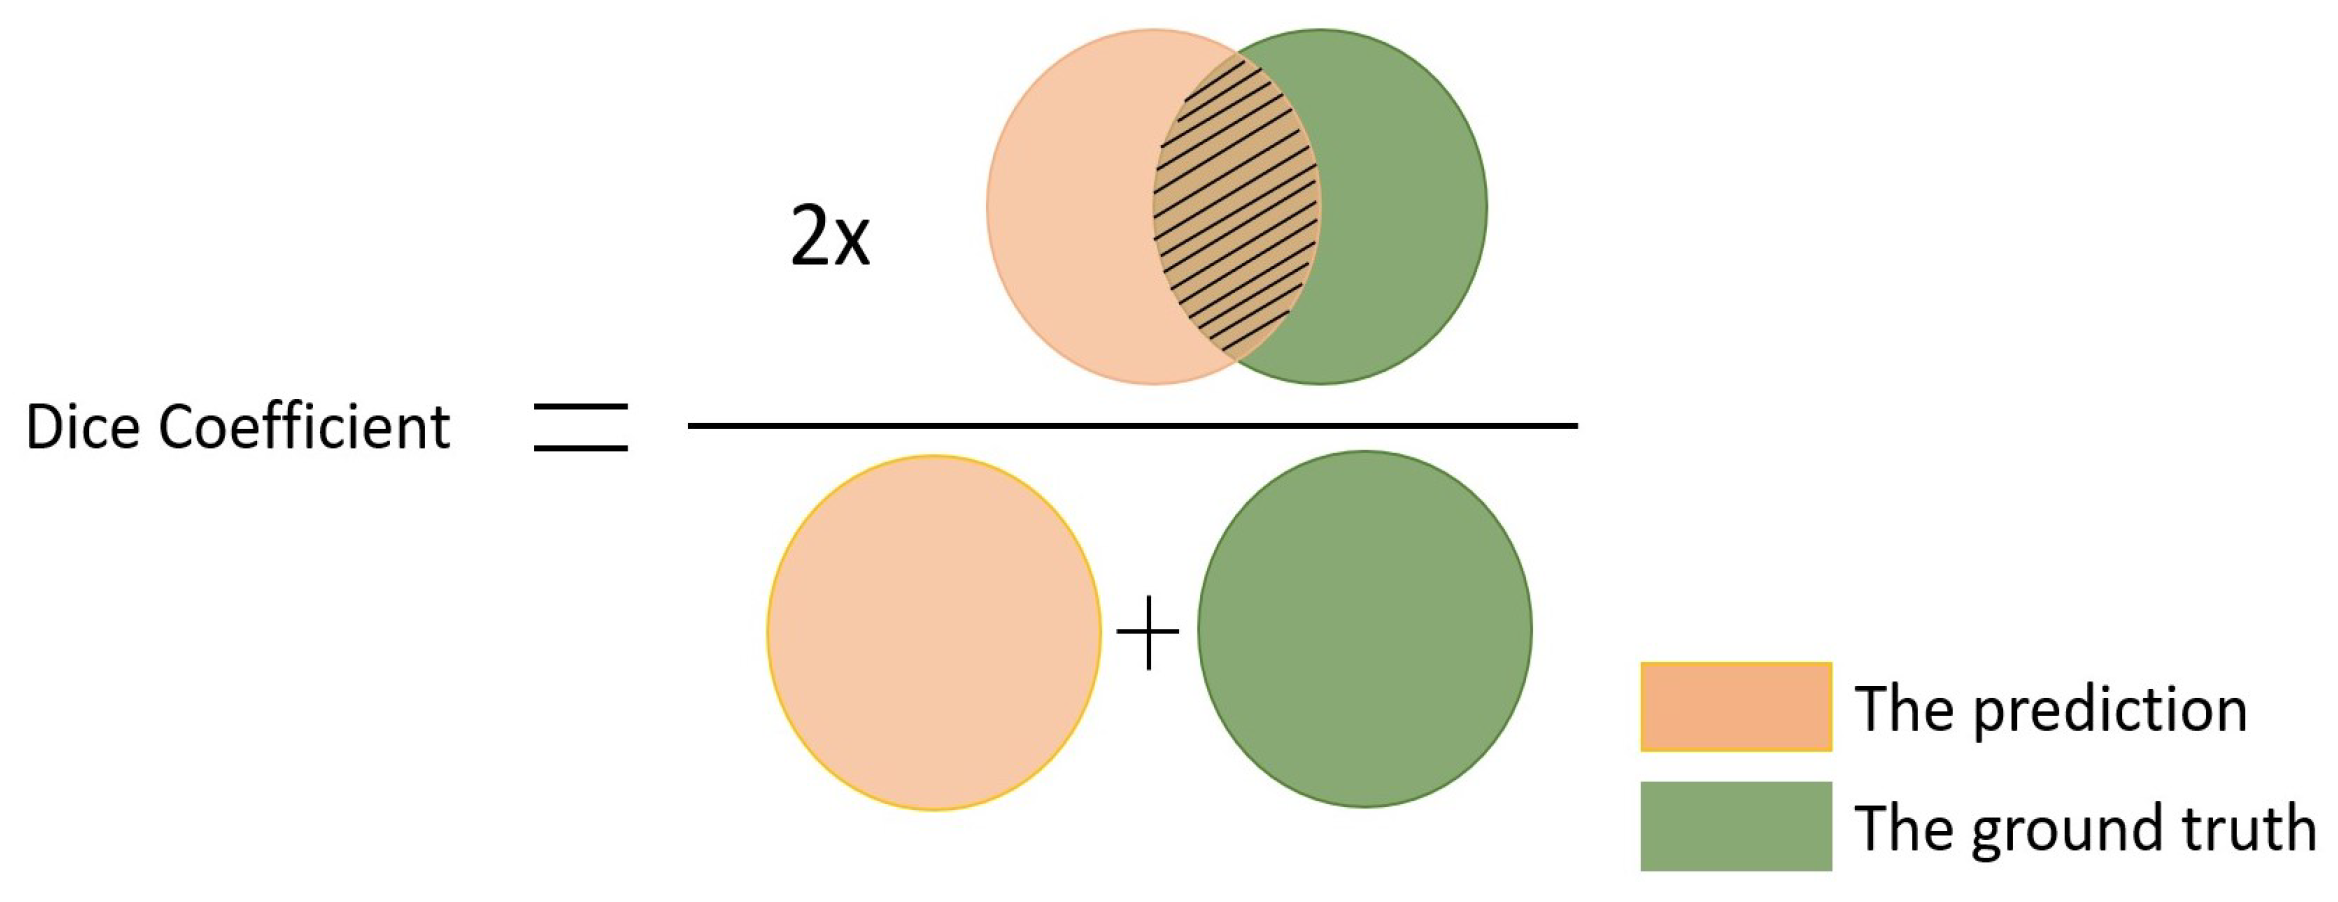
Dice Loss is one of the losses that can be used to directly optimize the segmentation metric (F1 score). It aims to minimize the mismatched regions and maximize the overlap regions between the ground truth and predicted segmentation [24]. It evolves from the Dice coefficient which is shown in Figure 7. In this figure, the shaded area is the overlap of the ground truth and the prediction. The numerator consists of twice the overlap, and the denominator is the sum of the ground truth and the prediction. Dice Loss can be defined as Equation (16), where ϵ is a small positive infinitesimal quantity.
L d i c e = j m ( 1 2 i n p i , j y i , j + ϵ i n ( p i , j + y i , j ) + ϵ )
The definition of the total loss for the proposed Siamese-based model is shown in Equation (17), where w c e , w f , and w d represents the weights for the Cross-Entropy Loss, the Focal Loss, and the Dice Loss, respectively. Based on empirical tuning and following a widely adopted strategy in segmentation tasks, we assign a larger weight to the Cross-Entropy Loss, as it provides stable convergence across all classes. The Focal Loss and Dice Loss are incorporated as auxiliary components to improve performance on imbalanced data and hard-to-classify samples. Specifically, Dice Loss addresses pixel-level foreground–background imbalance, while Focal Loss emphasizes learning on underrepresented and ambiguous damage categories, such as “minor” and “major” damage. Based on this rationale, the weights for the Cross-Entropy Loss, the Focal Loss, and the Dice Loss are set and tuned to be 0.8, 0.1, and 0.1, respectively.
L o s s t o t a l = w c e L c e + w f L f o c a l + w d L d i c e

4. Experiments and Results

4.1. Model Performance Comparison Experiment

Our comprehensive evaluation was conducted on the curated dataset shown in Table 1, featuring a comparative analysis among five distinct models: the xBD baseline model [9], the Siamese-based model [25], the Siamese-Attention-based model, the single-branch prompt-based model, and our novel dual-branch prompt-based model.
  • Baseline model: Provided by the xBD team [9], the baseline employs a two-stage approach. The first stage uses a U-Net-based model for semantic segmentation to identify building locations in pre-disaster images. The second stage applies a dual-stream classification model for determining buildings’ damage levels, with performance metrics reported as F1 scores.
  • Siamese-based model: Our previous two-stage method [25]. The first stage uses a MaskRCNN [26] model for object detection to identify building locations in pre-disaster images. The second stage reuses MaskRCNN’s backbone with a Siamese network architecture for the building damage evaluation task.
  • Siamese-Attention-based model: An improvement of the previous Siamese-based model [25]. We applied an attention mechanism to enhance feature extraction. Training occurred across four NVIDIA Tesla P100 GPUs for 100 epochs, beginning with a learning rate of 0.001.
  • SOTA SAM-RS model: Proposed in [7], this model presents a parameter-efficient adaptation framework that integrates lightweight adapters into a frozen vision foundation model for post-disaster building damage assessment. It injects adapters into the backbone to directly modify intermediate representations and enhance the model’s ability to capture disaster-specific features.
  • Single-branch prompt-based model: In this configuration, only post-disaster images are utilized for the building damage evaluation task. The pre-disaster flow in VPG is removed, and the other parts remain untouched. This model serves as a comparative baseline, illustrating the benefits of our fully prompt-based approach. It was trained under the same conditions as the Siamese-Attention-based model, with an initial learning rate of 0.0001.
  • Dual-branch prompt-based model: Our proposed model utilizes a dual-branch architecture to process both pre- and post-disaster images through the SAM encoder, guided by VPG’s visual prompts. The model was trained under the same setup as the single-branch prompt-based model.
Each model underwent training with a learning rate decay strategy applied to optimize performance. We further adopt the data augmentation operation during the training process. This technique increases the diversity and the amount of data available for the training process without actually collecting any new data. In each step of the training process, we obtain variations of samples by using up–down flips, left–right flips, the rotations of 90 degrees, 180 degrees, and 270 degrees, Gaussian noise, etc.

4.2. Misalignment Assessment Experiment

To explicitly assess how image misalignment might affect performance, we devised an experiment utilizing a basic alignment strategy. This strategy involves creating variations of each post-disaster image by shifting it n pixels in four directions: upwards, downwards, left, and right. The newly exposed borders resulting from these shifts are filled with black pixels to ensure no additional noise is introduced into the analysis area.
By pairing each of the four shifted post-disaster image variations with the unchanged pre-disaster image, we generate four “well-aligned” sample pairs. Alongside the original unaltered pair, these five samples undergo evaluation by the model. The highest F1 score (defined in Section 3.4) from these evaluations can be used to identify the most suitable alignment for the given area, with the best-performing alignment hinting at the optimal strategy for mitigating misalignment impacts.
These strategically aligned samples are compiled into an “aligned dataset”, which is then used to benchmark the performance of our dual-branch prompt-based model. This experiment aims to quantify the detrimental effects of misalignment on building damage evaluation, potentially offering insights into corrective measures that enhance model accuracy. We tested three different values for n, including three pixels, ten pixels, and fifteen pixels. The experimental result is presented in Section 5.3.

4.3. Metrics

The F1 score is chosen as the basic component of the evaluation metric. We calculate the F1 score for each of the four damage classes. To deal with the class imbalance problem explained in Section 1, we use the Harmonic Mean of these 4 F1 Scores as the final Score.
The four damage levels, i.e., no damage, minor damage, major damage, and destroyed, are each assigned a value of 1, 2, 3, and 4, respectively. The harmonic F1 score is defined in Equation (18), in which F 1 i , where i [ 1 , 4 ] , represents the F1 score of the ith damage level. ϵ is a small positive infinitesimal quantity.
F 1 d a m a g e = 4 i = 1 4 ( F 1 i + ϵ ) 1

4.4. Results

The final harmonic F1 scores are presented in Table 3. Our proposed dual-branch prompt-based model achieves a harmonic F1 score of 0.7014, significantly outperforming the xBD baseline (0.0342), the Siamese-based model (0.5732), and the SOTA adaptation-based SAM-RS model (0.6800). Across all damage categories, our model consistently yields the highest F1 scores, demonstrating superior classification performance for both frequent and infrequent classes. Notably, the baseline model’s harmonic F1 score is close to zero, reflecting its difficulty in handling class imbalance. In contrast, our model leverages contrastive prompt learning and visual guidance to produce robust and generalizable predictions across all damage levels.

5. Ablation Study and Discussions

5.1. Ablation Study on Visual Prompt Generator

In order to quantitatively evaluate the impact of the Visual Prompt Generator (VPG) on the performance of the ViDE model, we conducted an ablation study, comparing two configurations of the model: (1). ViDE with VPG: This configuration represents our complete proposed framework. Both VPG and the task head are trainable, allowing the model to fully utilize the capabilities of VPG in enhancing the processing of satellite imagery. (2). ViDE without VPG: the model relies solely on the pre-trained SAM image encoder for processing pre- and post-disaster images. Only the task head is trainable, omitting the visual prompts provided by VPG.
The results in Table 4 elucidate the critical role of VPG in the ViPDE framework. The model without VPG performs well only in detecting “no damage” scenarios, suggesting that while the pre-trained SAM image encoder can effectively identify undamaged buildings, it struggles to utilize contrastive pre- and post-disaster information essential for assessing actual damage. In contrast, the inclusion of VPG allows the model to effectively discern and classify varying damage levels, as evidenced by substantial gains in F1 scores for “minor damage”, “major damage”, and “destroyed” categories. This demonstrates that the full ViPDE model outperforms the ablation baseline “w/o VPG”. The results in the ablation baseline are not reflective of our proposed method but rather emphasize the necessity of VPG in enabling the contrastive capability.
These findings underscore the effectiveness of generated visual prompts in bridging the gap between foundation model capabilities and the specific needs of damage assessment tasks. By facilitating better integration and contextualization of satellite image data, VPG significantly enhances the model’s predictive performance and robustness, making it a valuable component for deploying foundation models in complex, real-world disaster response applications.

5.2. Ablation Study on the Utilization of Pre-Disaster Imagery

To assess the impact of integrating pre-disaster imagery into our contrastive learning framework, we conducted an ablation study comparing two models: the single-branch prompt-based model and the dual-branch prompt-based model. These models are described in detail in Section 4.
The results of this study in Table 5 underscore the significant benefits of employing a dual-branch contrastive learning-based architecture, which utilizes both pre- and post-disaster imagery to perform detailed semantic analysis. The dual-branch prompt-based model, by leveraging high-level features extracted from pre-disaster data alongside post-disaster assessments, demonstrates superior performance in accurately classifying damage levels. This model not only outperforms the single-branch counterpart but also highlights the robustness of our contrastive learning approach in enhancing disaster damage evaluation. These findings suggest that incorporating comprehensive pre-event data into the model significantly improves its predictive accuracy and sets a new benchmark in disaster response strategies.

5.3. Misalignment Assessment

As mentioned in Section 4.2, this experiment investigates the influence of image misalignment on the performance of damage assessment models. The alignment adjustments applied to the post-disaster images were set at shifts of three pixels, ten pixels, and fifteen pixels to address misalignment issues. The results, as depicted in Table 6, revealed a direct correlation between alignment precision and model performance. A shift of three pixels yielded a positive improvement in model accuracy, while a 10-pixel shift resulted in the most significant performance boost. This enhancement indicates that a modest realignment can correct enough misalignment to positively affect model output. However, an overshoot to 15 pixels demonstrated a decline in performance, suggesting an overcompensation that reintroduced misalignment. This pattern indicates the model’s sensitivity to alignment nuances, underscoring the necessity for a balanced and precise alignment methodology to optimize damage evaluation in remote sensing imagery. These findings underscore the importance of image alignment, setting a direction for future work to focus on refining pre- and post-disaster image alignment techniques.

5.4. Discussion on the Ground Truth of the Dataset

In the ground truth of the dataset, each building polygon can belong to only one class, which means each building can only have one damage level. In our proposed models, the predictions are semantic segmentation maps, which are pixel-wise predictions, i.e., for a building, there might be different damage levels in the different parts of this building, which actually matches real-world scenarios better but does not necessarily have one single damage class label throughout the building polygon area, leading to discrepancy at the pixel level (and “errors”) between the segmentation map and the ground truth. To further examine the performance of our model on the polygon area level (instead of the pixel level), we implement a projection test to transfer the pixel-wise segmentation map to a polygon-wise map. We project the boundary of polygons from the corresponding ground truth to the prediction segmentation map. We assign each polygon to a class, which is the majority class of the pixels in the polygon. One example is shown in Figure 8. The left image is the prediction from our models. There are three classes in this building, including “no damage”, “minor damage”, and “major damage”. Because the “no damage” class, which is green, is the majority, the whole polygon is classified as “no damage” in the end. We use our best model, dual-branch prompt-based model, for this experiment. The result is shown in Table 7. In this table, we can see that the F1 scores for “no damage”, “major damage”, and “destroyed” classes are increased by at least 3.74%. The F1 score of “no damage” is improved to 0.9293 from 0.8839, which is impressive. However, the F1 score for “minor damage” slightly declined, a reflection of the inherent challenge in assessing buildings with minor yet significant enough damage. In many cases, the affected portions of a building classified as “minor damage” represent only a small fraction of the structure’s total area, which can be more accurately measured by pixel-level measures as shown before. However, the majority rule applied during the projection test may override these findings, resulting in a classification of “no damage” for buildings predominantly unaffected but with noticeable minor damage areas.
The current practice of assigning a single damage level to an entire building fails to capture the nuanced reality of disaster impact, where parts of a building may exhibit different levels of damage. This limitation not only challenges the precision of our model but also suggests a pressing need for refining ground truth datasets. A more granular approach to labeling, which acknowledges the varying degrees of damage a single structure can sustain, would not only enhance the accuracy of models like ours but also provide a more realistic assessment of disaster effects. Adopting such detailed labeling practices would significantly improve the correspondence between model predictions and real-world conditions, ultimately leading to more effective and targeted disaster response efforts.

5.5. Limitations

While the proposed ViPDE framework demonstrates strong performance on the xBD dataset, it does have certain limitations. The model has been trained and evaluated on high-resolution satellite imagery with a spatial resolution of 0.5 meters, which provides sufficient spatial resolution for identifying structural damage at the building level. However, its performance may degrade when applied to significantly lower-resolution imagery, where fine-grained visual cues are lost. Although the framework is designed to be compatible with both satellite and drone imagery, its effectiveness relies on the availability of spatial details necessary for contrastive damage analysis. In future work, we aim to explore resolution-adaptive techniques and validate the model’s robustness across datasets with varying resolutions and sensor types.

6. Conclusions

This work introduces the Visual Prompt Damage Evaluation (ViPDE), a pioneering approach that integrates prompt learning and contrastive learning with building damage evaluation to enhance post-disaster analysis through satellite imagery. By employing the Segment Anything Model (SAM) and innovatively utilizing pre- and post-disaster imagery, our approach demonstrates a significant advancement in the field of disaster management technology.
Our learnable Visual Prompt Generator (VPG) module, a cornerstone of ViPDE, showcases the utility of semantic visual prompts in directing pre-trained vision foundation models for detailed damage evaluation. This method not only streamlines the adaptation process of these models to the task of disaster damage assessment but also circumvents the limitations posed by conventional, computationally intensive data fusion techniques.
Extensive experiments validate the effectiveness of ViPDE, with our model outperforming state-of-the-art methods. The ablation study further underscores the significance of incorporating pre-disaster imagery, affirming the dual-branch model’s superior performance.
ViPDE establishes a new standard in disaster management, providing a scalable, precise, and versatile tool for post-disaster damage assessment. Looking forward, we aim to expand this approach to encompass a broader range of disaster types, enhancing the model’s applicability and effectiveness. Future work will also focus on developing sophisticated alignment techniques to address the misalignment issues prevalent in the dataset and on testing the adaptability of our VPG within other contrastive learning-based tasks in diverse domains.

Author Contributions

Conceptualization, F.Z. and C.Z.; methodology, C.Z. and T.W.; software, F.Z.; validation, F.Z. and R.Z.; formal analysis, F.Z. and C.Z.; investigation, F.Z. and C.Z.; resources, C.Z.; data curation, F.Z. and R.Z.; writing—original draft preparation, F.Z.; writing—review and editing, C.Z. and T.W.; visualization, F.Z. and R.Z.; supervision, C.Z.; project administration, C.Z. All authors have read and agreed to the published version of the manuscript.

Funding

This research received no external funding.

Data Availability Statement

The xBD dataset analyzed in this study is available upon request from the dataset owners in [9]. Interested researchers should contact the dataset owners directly as referenced in [9] to request access and complete any necessary agreements.

Acknowledgments

The authors thank the team responsible for the xBD dataset described in [9], which was utilized in this study.

Conflicts of Interest

The authors declare no conflicts of interest.

References

  1. Wallemacq, P. Economic Losses, Poverty & Disasters: 1998–2017; Centre for Research on the Epidemiology of Disasters, CRED: Brussels, Belgium, 2018. [Google Scholar]
  2. Mimura, N.; Yasuhara, K.; Kawagoe, S.; Yokoki, H.; Kazama, S. Damage from the Great East Japan Earthquake and Tsunami—A quick report. Mitig. Adapt. Strateg. Glob. Change 2011, 16, 803–818. [Google Scholar] [CrossRef]
  3. Cao, Q.D.; Choe, Y. Deep learning based damage detection on post-hurricane satellite imagery. arXiv 2018, arXiv:1807.01688. [Google Scholar]
  4. Duarte, D.; Nex, F.; Kerle, N.; Vosselman, G. Satellite image classification of building damages using airborne and satellite image samples in a deep learning approach. ISPRS Ann. Photogramm. Remote Sens. Spat. Inf. Sci. 2018, 4, 89–96. [Google Scholar] [CrossRef]
  5. Brunner, D.; Lemoine, G.; Bruzzone, L. Earthquake damage assessment of buildings using VHR optical and SAR imagery. IEEE Trans. Geosci. Remote Sens. 2010, 48, 2403–2420. [Google Scholar] [CrossRef]
  6. Wei, D.; Yang, W. Detecting damaged buildings using a texture feature contribution index from post-earthquake remote sensing images. Remote Sens. Lett. 2020, 11, 127–136. [Google Scholar] [CrossRef]
  7. Zhao, F.; Zhang, C. Parameter-Efficient Adaptation of Foundation Models for Damaged Building Assessment. In Proceedings of the 2024 IEEE 7th International Conference on Multimedia Information Processing and Retrieval (MIPR), San Jose, CA, USA, 7–9 August 2024; IEEE: Piscataway, NJ, USA, 2024; pp. 417–422. [Google Scholar]
  8. Xu, J.Z.; Lu, W.; Li, Z.; Khaitan, P.; Zaytseva, V. Building damage detection in satellite imagery using convolutional neural networks. arXiv 2019, arXiv:1910.06444. [Google Scholar]
  9. Gupta, R.; Hosfelt, R.; Sajeev, S.; Patel, N.; Goodman, B.; Doshi, J.; Heim, E.; Choset, H.; Gaston, M. xbd: A dataset for assessing building damage from satellite imagery. arXiv 2019, arXiv:1911.09296. [Google Scholar]
  10. Liao, Y.; Mohammadi, M.E.; Wood, R.L. Deep learning classification of 2D orthomosaic images and 3D point clouds for post-event structural damage assessment. Drones 2020, 4, 24. [Google Scholar] [CrossRef]
  11. Yamazaki, F.; Kubo, K.; Tanabe, R.; Liu, W. Damage assessment and 3d modeling by UAV flights after the 2016 Kumamoto, Japan earthquake. In Proceedings of the 2017 IEEE International Geoscience and Remote Sensing Symposium (IGARSS), Fort Worth, TX, USA, 23–28 July 2017; IEEE: Piscataway, NJ, USA, 2017; pp. 3182–3185. [Google Scholar]
  12. Vetrivel, A.; Gerke, M.; Kerle, N.; Nex, F.; Vosselman, G. Disaster damage detection through synergistic use of deep learning and 3D point cloud features derived from very high resolution oblique aerial images, and multiple-kernel-learning. ISPRS J. Photogramm. Remote Sens. 2018, 140, 45–59. [Google Scholar] [CrossRef]
  13. Ouyang, L.; Wu, J.; Jiang, X.; Almeida, D.; Wainwright, C.; Mishkin, P.; Zhang, C.; Agarwal, S.; Slama, K.; Ray, A.; et al. Training language models to follow instructions with human feedback. Adv. Neural Inf. Process. Syst. 2022, 35, 27730–27744. [Google Scholar]
  14. Achiam, J.; Adler, S.; Agarwal, S.; Ahmad, L.; Akkaya, I.; Aleman, F.L.; Almeida, D.; Altenschmidt, J.; Altman, S.; Anadkat, S.; et al. Gpt-4 technical report. arXiv 2023, arXiv:2303.08774. [Google Scholar]
  15. Bao, H.; Dong, L.; Piao, S.; Wei, F. Beit: Bert pre-training of image transformers. arXiv 2021, arXiv:2106.08254. [Google Scholar]
  16. Dosovitskiy, A.; Beyer, L.; Kolesnikov, A.; Weissenborn, D.; Zhai, X.; Unterthiner, T.; Dehghani, M.; Minderer, M.; Heigold, G.; Gelly, S.; et al. An image is worth 16x16 words: Transformers for image recognition at scale. arXiv 2020, arXiv:2010.11929. [Google Scholar]
  17. Kirillov, A.; Mintun, E.; Ravi, N.; Mao, H.; Rolland, C.; Gustafson, L.; Xiao, T.; Whitehead, S.; Berg, A.C.; Lo, W.Y.; et al. Segment anything. In Proceedings of the IEEE/CVF International Conference on Computer Vision, Paris, France, 1–6 October 2023; pp. 4015–4026. [Google Scholar]
  18. Lester, B.; Al-Rfou, R.; Constant, N. The power of scale for parameter-efficient prompt tuning. arXiv 2021, arXiv:2104.08691. [Google Scholar]
  19. Jia, M.; Tang, L.; Chen, B.C.; Cardie, C.; Belongie, S.; Hariharan, B.; Lim, S.N. Visual prompt tuning. In Proceedings of the European Conference on Computer Vision, Tel Aviv, Israel, 23–27 October 2022; Springer: Cham, Swizerland, 2022; pp. 709–727. [Google Scholar]
  20. Chen, S.; Ge, C.; Tong, Z.; Wang, J.; Song, Y.; Wang, J.; Luo, P. AdaptFormer: Adapting Vision Transformers for Scalable Visual Recognition. arXiv 2022, arXiv:2205.13535. [Google Scholar]
  21. Woo, S.; Park, J.; Lee, J.Y.; Kweon, I.S. Cbam: Convolutional block attention module. In Proceedings of the European Conference on Computer Vision (ECCV), Munich, Germany, 8–14 September 2018; pp. 3–19. [Google Scholar]
  22. Zhang, Z.; Wang, X.; Chen, S.; Liu, X.; Chen, Q.; Zhang, Y.; Cao, Y.; Liu, B. MLMSA: Multi-Level and Multi-Scale Attention for Lesion Detection in Endoscopy. In Proceedings of the 2023 IEEE International Conference on E-health Networking, Application & Services (Healthcom), Chongqing, China, 15–17 December 2023; IEEE: Piscataway, NJ, USA, 2023; pp. 144–150. [Google Scholar]
  23. Lin, T.Y.; Goyal, P.; Girshick, R.; He, K.; Dollár, P. Focal loss for dense object detection. In Proceedings of the IEEE International Conference on Computer Vision, Venice, Italy, 22–29 October 2017; pp. 2980–2988. [Google Scholar]
  24. Ma, J. Segmentation Loss Odyssey. arXiv 2020, arXiv:2005.13449. [Google Scholar]
  25. Zhao, F.; Zhang, C. Building damage evaluation from satellite imagery using deep learning. In Proceedings of the 2020 IEEE 21st International Conference on Information Reuse and Integration for Data Science (IRI), Las Vegas, NV, USA, 11–13 August 2020; IEEE: Piscataway, NJ, USA, 2020; pp. 82–89. [Google Scholar]
  26. He, K.; Gkioxari, G.; Dollár, P.; Girshick, R. Mask r-cnn. In Proceedings of the IEEE International Conference on Computer Vision, Venice, Italy, 22–29 October 2017; pp. 2961–2969. [Google Scholar]
Figure 1. The pre- and post-disaster images of Fukushima. In the first row of images, by visual inspection, we can tell that lots of residential buildings are destroyed by the disaster. In the bottom row of images, most buildings, including residential houses and commercial buildings, are destroyed by the disaster.
Remotesensing 17 01664 g001
Figure 2. Sample images for hurricane, flooding, and tsunami. The images in the top row are satellite images captured before the disasters. The images in the bottom row are obtained after the disaster strikes these areas. In (a), most of the buildings are destroyed by the hurricane except the buildings in the right corner. In (b), the building is majorly damaged. It is surrounded by water. In (c), the two commercial buildings within the red rectangle are destroyed by the tsunami.
Remotesensing 17 01664 g002
Figure 3. The overall architecture of ViPDE, illustrating the dual-branch input of pre- and post-disaster images processed through the Segment Anything Model (SAM) encoder. The Visual Prompt Generator (VPG) introduces stage-wise visual prompts that guide the encoder’s focus on disaster-relevant features, enhancing damage segmentation precision. Outputs are decoded to a damage-level segmentation map, categorizing buildings into varying damage levels. Frozen components from the original SAM encoder are shown in blue, while the newly added trainable modules, including VPG and inserted prompts, are highlighted in red to clearly distinguish the introduced components from the original architecture.
Remotesensing 17 01664 g003
Figure 4. The architecture of the Visual Prompt Generator (VPGi) module. This module generates the stage-wise visual prompt M p r o m p t by processing pre-disaster and post-disaster features M p r e i and M p o s t i from its previous transformer stage. Each input is first passed through a 1 × 1 convolutional layer, followed by a channel attention block to compute feature-aware attention maps M a t t , p r e i and M a t t , p o s t i . These are then fused through a 1 × 1 convolution to produce the final prompt P i , which guides the encoder to focus on disaster-relevant changes.
Remotesensing 17 01664 g004
Figure 5. The ground truth of pre- and post-disaster images. In (a), each polygon represents a location for a building. In (b), the green, blue, orange, and red colors represent the four different damage levels: “no damage”, “minor damage”, “major damage”, and “destroyed”, respectively.
Remotesensing 17 01664 g005
Figure 6. Examples of fine-grained building damage levels. Subfigures (a), (b), (c), and (d) correspond to “no damage”, “minor damage”, “major damage”, and “destroyed”, respectively. The “no damage” example shows a building that remains fully intact with no visible structural issues. The “minor damage” example exhibits localized damage, such as slight roof deterioration. The “major damage” example shows extensive damage affecting most of the building structure, while the “destroyed” building is either completely collapsed or severely fragmented. These samples highlight the visual distinctions used in the annotation process and demonstrate the challenges in classifying intermediate damage levels.
Remotesensing 17 01664 g006
Figure 7. The Dice coefficient. In this figure, the orange color represents the prediction. The green color represents the ground truth of that prediction.
Remotesensing 17 01664 g007
Figure 8. A sample of the generated new segmentation map. In (a), the “no damage” class is the majority, which is green. The black, dark green, and blue represent the pixels belonging to “background”, “minor damage”, and “major damage”, respectively.
Remotesensing 17 01664 g008
Table 1. The dataset used for model training and testing.
The Dataset After Data Cleaning and Augmentation
Training Dataset12,030
Validation Dataset640
Test Dataset1866
Table 2. The weights for classes. In this table, the “no”, “minor”, and “major” labels represent the classes “no damage”, “minor damage”, and “major damage”, respectively.
ClassesNoMinorMajorDestroyedBackground
Weights0.10.30.30.20.1
Table 3. The F1 score of each model. In the table, the “Baseline” is the baseline model provided by xBD team. “Siamese” and “Attention” are proposed in [25], while “SAM-RS” is a recent adaptation-based SOTA model proposed in [7]. We can see that our dual-branch prompt-based model obtains the highest scores in each row.
LevelBaseline [9]Siamese [25]Attention [25]SAM-RS [7]Prompt (Dual-Branch)
No0.66310.71400.86230.86200.8839
Minor0.14350.39550.41150.48400.5082
Major0.00940.60370.67020.71290.7241
Destroyed0.46570.71810.77660.79810.8180
Mean0.32040.60780.68020.71420.7335
Harmonic0.03420.57320.62800.68000.7014
Table 4. F1 scores comparison highlighting VPG’s impact.
Damage Levelw/o VPGVPG
No0.42160.8839
Minor0.06070.5082
Major0.07420.7241
Destroyed0.01230.8180
Mean0.14220.7335
Harmonic Mean0.03520.7014
Table 5. F1 scores comparison underscoring the dual-branch model’s effectiveness.
Damage LevelBaselinePrompt (Single-Branch)Prompt (Dual-Branch)
No0.66310.85940.8839
Minor0.14350.42990.5082
Major0.00940.65830.7241
Destroyed0.46570.79430.8180
Mean0.32040.68550.7335
Harmonic Mean0.03420.63820.7014
Table 6. Misalignment assessment results (“improve” indicates the percentage increase from the original scores).
3 pixels10 pixels15 pixels
F1 ScoreScoreImproveScoreImproveScoreImprove
Harmonic Mean0.70640.7129%0.70911.0921%0.6968−0.6601%
Mean0.74080.9918%0.74301.2914%0.73560.2808%
Table 7. F1 score comparison with and without applying a projection test, where the majority-vote approach assigns a single damage class per building polygon in the projection test. Percentage improvements over the original F1 scores are shown.
F1 Score
OriginalMajority VoteImprove
No0.88390.92935.1363%
Minor0.50820.5053−0.5706%
Major0.72410.75123.7426%
Destroyed0.81800.84863.7408%
Harmonic Mean0.70140.71882.4808%
Mean0.73350.75863.4219%
Disclaimer/Publisher’s Note: The statements, opinions and data contained in all publications are solely those of the individual author(s) and contributor(s) and not of MDPI and/or the editor(s). MDPI and/or the editor(s) disclaim responsibility for any injury to people or property resulting from any ideas, methods, instructions or products referred to in the content.

