Figure 5.
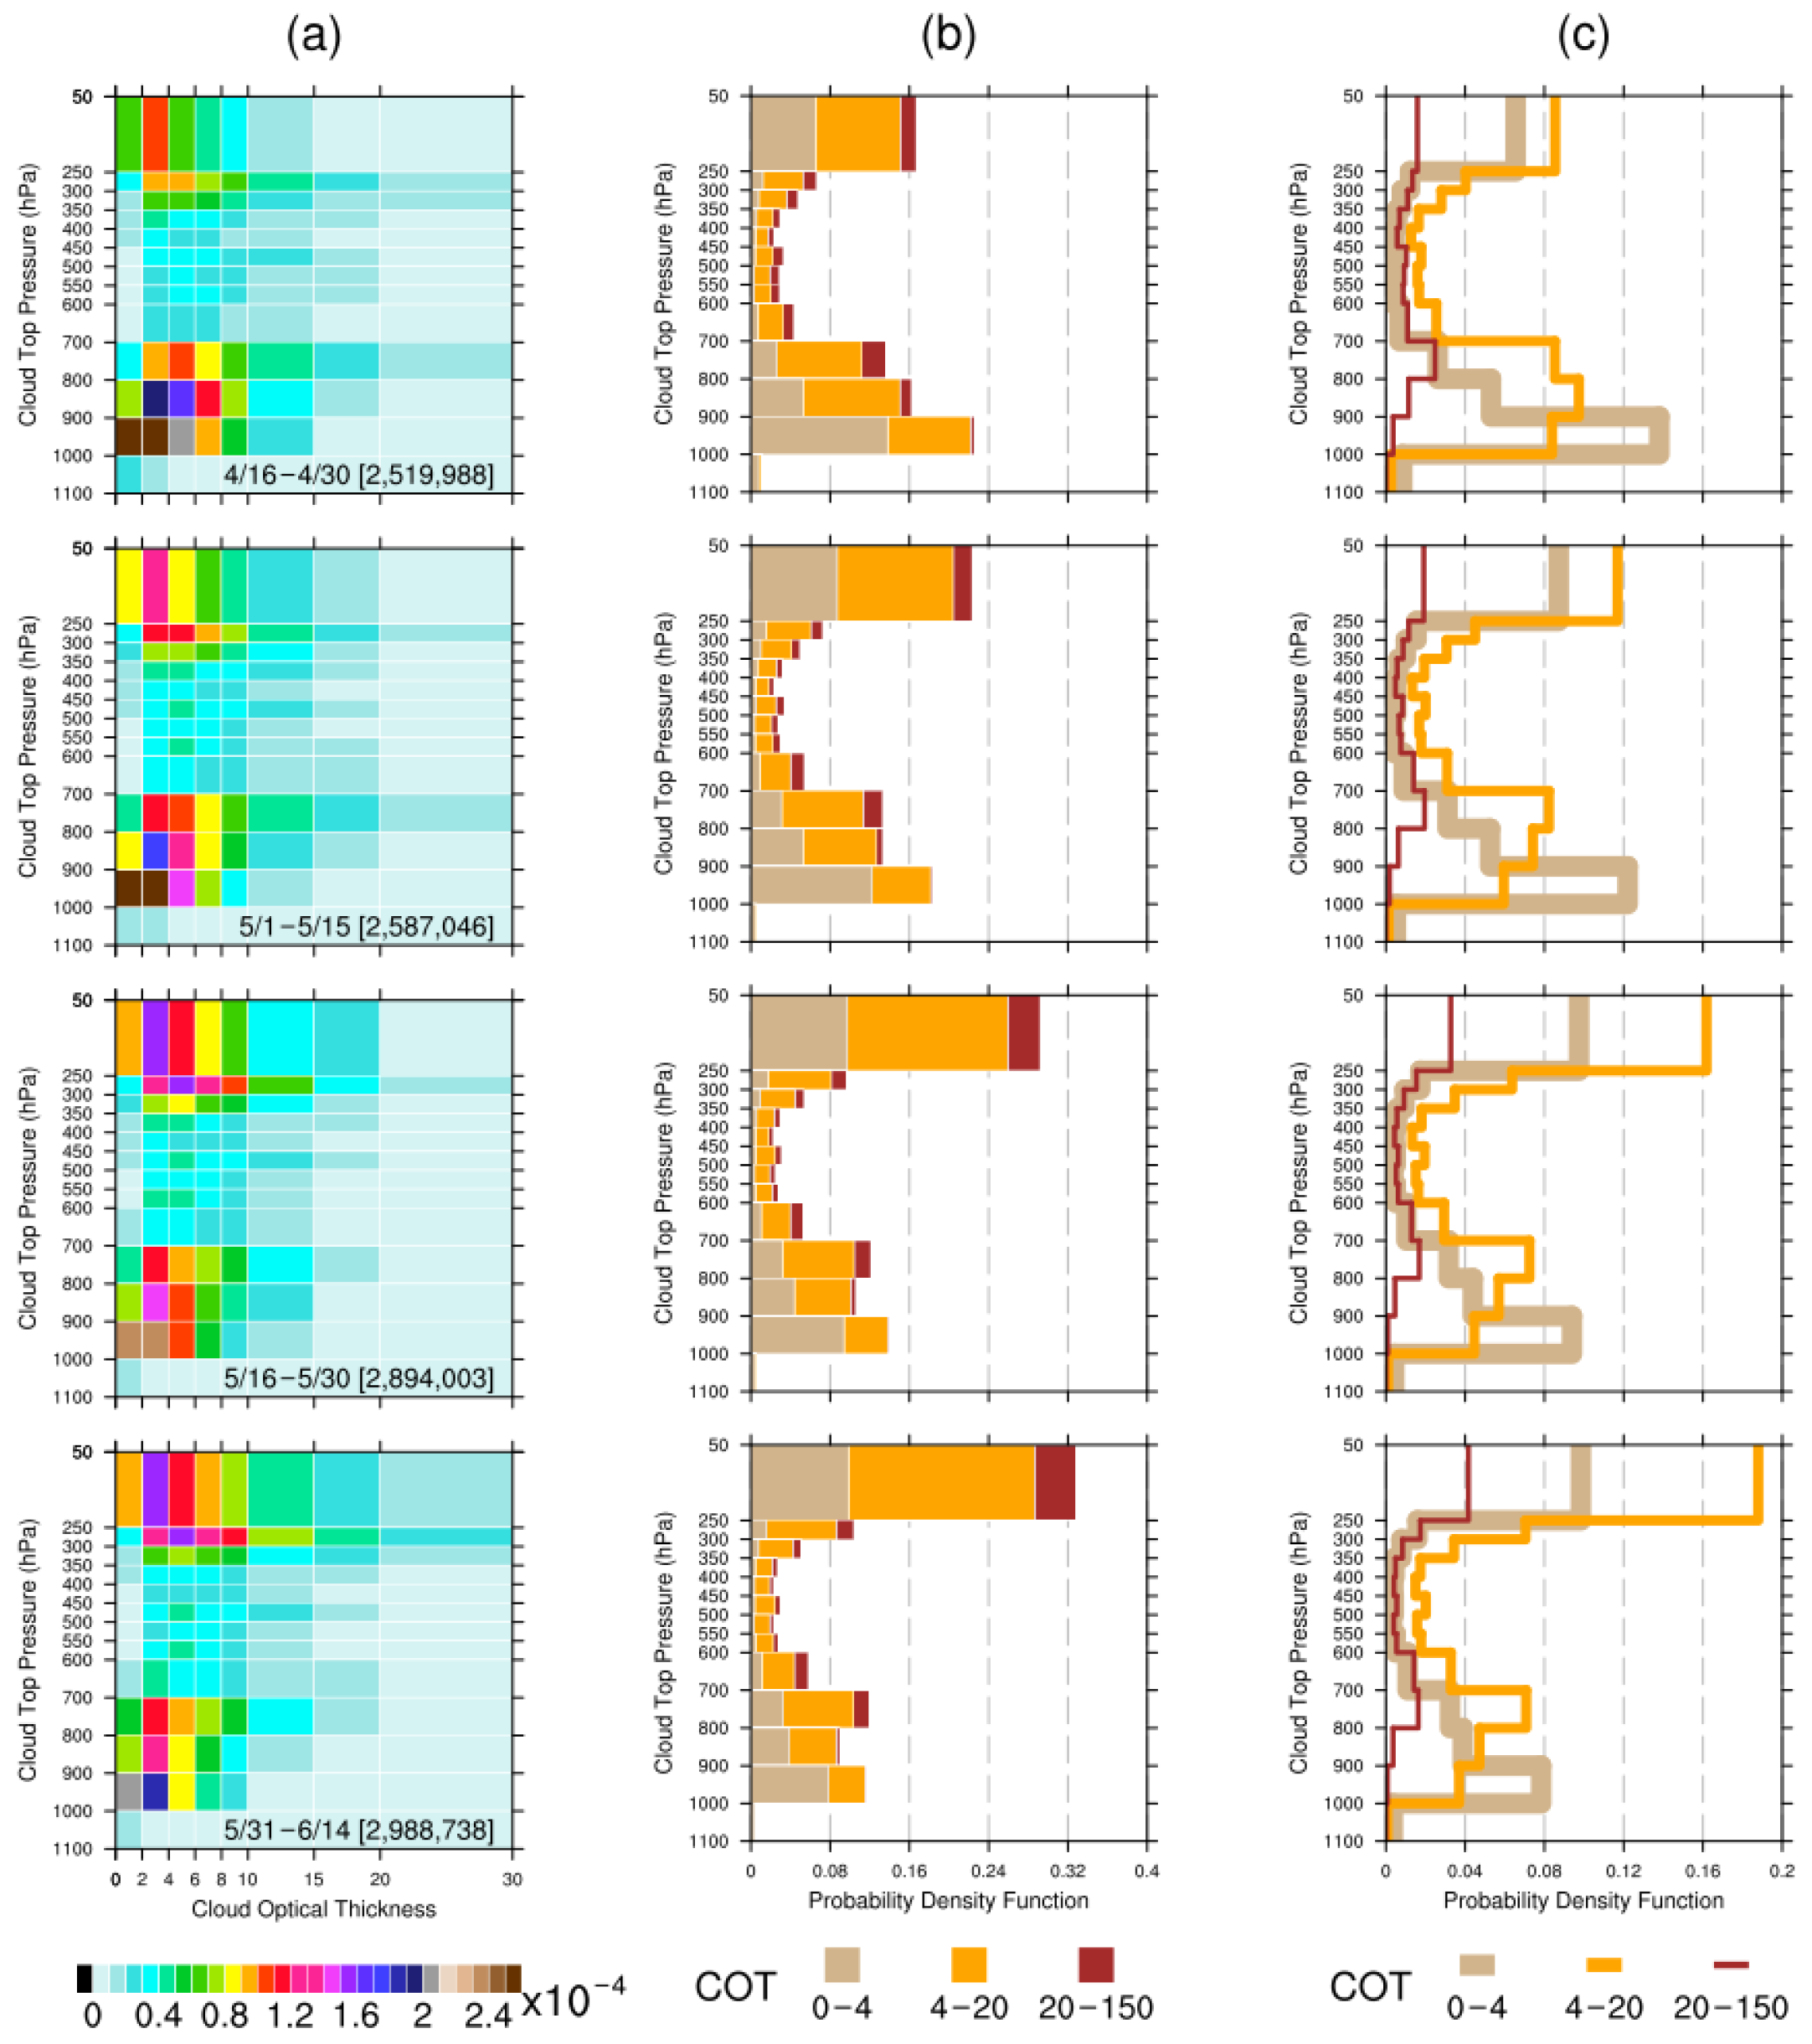
The seasonal variation of the joint probability distribution of the COT binned against CTP for liquid water clouds over the ICP. The seasonal variation is revealed by the statistics of four 15-day periods from 16 April to 14 June in the years from 2003 to 2021. From top to bottom panels, the 15-day periods are 16 April to 30 April, 1 May to 15 May, 15 May to 30 May, and 31 May to 14 June, respectively. (a) The normalized joint probability is displayed as two-dimensional histograms, with COT as the x-axis and CTP as the y-axis. The number in square brackets is the total count for each statistical period. For every bin box, the joint probability value is equal to the bin count divided by the total count (relative frequency). The normalized joint probability in each bin box is computed by dividing the corresponding joint probability value by the bin size (the area of that particular bin box), thereby obtaining the probability density value of the bin box. This normalization is intended to take into account the bin sizes so as to eliminate any visual distortions when comparing bins of different sizes in the two-dimensional histogram plot. The probability of any pixel that falls in a joint histogram bin box can be retrieved after multiplying the corresponding probability density value by that bin size. The bin colors represent the probability density values in each bin. The COT histogram bins ranging from 30 to 150 were chopped off for plotting purposes, owing to the large bin range and very low probability density. The marginal probabilities of CTP with respect to three COT categories are displayed as (b) stacked and (c) overlapping histograms, with probability as the x-axis and CTP as the y-axis. The marginal probabilities of CTP are derived from the joint histograms of COT binned against CTP. The COT is grouped into three categories of newly aggregated bins from the original COT histogram bins: 0–4, 4–20, 20–150. Three sets of the marginal probability of CTP are obtained by integrating (summing) the joint probability over the specific ranges of the aggregated bins from the three COT categories, respectively.
Figure 5.
The seasonal variation of the joint probability distribution of the COT binned against CTP for liquid water clouds over the ICP. The seasonal variation is revealed by the statistics of four 15-day periods from 16 April to 14 June in the years from 2003 to 2021. From top to bottom panels, the 15-day periods are 16 April to 30 April, 1 May to 15 May, 15 May to 30 May, and 31 May to 14 June, respectively. (a) The normalized joint probability is displayed as two-dimensional histograms, with COT as the x-axis and CTP as the y-axis. The number in square brackets is the total count for each statistical period. For every bin box, the joint probability value is equal to the bin count divided by the total count (relative frequency). The normalized joint probability in each bin box is computed by dividing the corresponding joint probability value by the bin size (the area of that particular bin box), thereby obtaining the probability density value of the bin box. This normalization is intended to take into account the bin sizes so as to eliminate any visual distortions when comparing bins of different sizes in the two-dimensional histogram plot. The probability of any pixel that falls in a joint histogram bin box can be retrieved after multiplying the corresponding probability density value by that bin size. The bin colors represent the probability density values in each bin. The COT histogram bins ranging from 30 to 150 were chopped off for plotting purposes, owing to the large bin range and very low probability density. The marginal probabilities of CTP with respect to three COT categories are displayed as (b) stacked and (c) overlapping histograms, with probability as the x-axis and CTP as the y-axis. The marginal probabilities of CTP are derived from the joint histograms of COT binned against CTP. The COT is grouped into three categories of newly aggregated bins from the original COT histogram bins: 0–4, 4–20, 20–150. Three sets of the marginal probability of CTP are obtained by integrating (summing) the joint probability over the specific ranges of the aggregated bins from the three COT categories, respectively.
![Remotesensing 16 01257 g005]()

