Article

Decadal Stability and Trends in the Global Cloud Amount and Cloud Top Temperature in the Satellite-Based Climate Data Records

by
Abhay Devasthale
* and
Karl-Göran Karlsson
Meteorological Research Unit, Research and Development, Swedish Meteorological and Hydrological Institute (SMHI), Folkborgvägen 17, 60176 Norrköping, Sweden
*
Author to whom correspondence should be addressed.
Remote Sens. 2023, 15(15), 3819; https://doi.org/10.3390/rs15153819
Submission received: 22 June 2023 / Revised: 21 July 2023 / Accepted: 23 July 2023 / Published: 31 July 2023
(This article belongs to the Special Issue Satellite-Based Cloud Climatologies)

Abstract

:
Forty years of cloud observations are available globally from satellites, allowing derivation of climate data records (CDRs) for climate change studies. The aim of this study is to investigate how stable these cloud CDRs are and whether they qualify stability requirements recommended by the WMO’s Global Climate Observing System (GCOS). We also investigate robust trends in global total cloud amount (CA) and cloud top temperature (CTT) that are significant and common across all CDRs. The latest versions of four global cloud CDRs, namely CLARA-A3, ESA Cloud CCI, PATMOS-x, and ISCCP-HGM are analysed. This assessment finds that all three AVHRR-based cloud CDRs (i.e., CLARA-A3, ESA Cloud CCI and PATMOS-x) satisfy even the strictest GCOS stability requirements for CA and CTT when averaged globally. While CLARA-A3 is most stable in global averages when tested against MODIS-Aqua, PATMOS-x offers the most stable CDR spatially. While we find these results highly encouraging, there remain, however, large spatial differences in the stability of and across the CDRs. All four CDRs continue to agree on the statistically significant decrease in global cloud amount over the last four decades, although this decrease is now weaker compared to the previous assessments. This decreasing trend has been stabilizing or even reversing in the last two decades; the latter is seen also in MODIS-Aqua and CALIPSO GEWEX datasets. Statistically significant trends in CTT are observed in global averages in the AVHRR-based CDRs, but the spatial agreement in the sign and the magnitude of the trends is weaker compared to those in CA. We also present maps of Common Stability Coverage and Common Trend Coverage that could provide a valuable metric to carry out an ensemble-based analysis of the CDRs.

1. Introduction

At the planetary scale, clouds provide a much-needed cooling umbrella to make our planet bearable and habitable. Without the roughly 20 W/m2 of radiation that clouds cool off at the surface globally [1,2], and without their cohesive role in regulating the other atmospheric components, not least the precipitation, our Earth System would enter into an entirely new paradigm that is best left to our imagination. It is, therefore, unsurprising that the role of clouds often takes centre stage when discussing current and future climate change and feedbacks [3,4,5,6,7,8,9,10,11,12,13]. Clouds are, however, notoriously difficult to represent in climate models due to their multifaceted radiative and dynamical effects, and they are often pointed out as the reason behind uncertainties in climate models and the estimated spread in the Earth’s equilibrium climate sensitivity [14,15,16,17,18,19,20,21,22,23,24,25,26,27,28,29]. It is, therefore, only justifiable that one of the Grand Challenges listed by the World Climate Research Programme deals with improving our holistic understanding of clouds, circulation, and climate sensitivity (https://www.wcrp-climate.org/gc-clouds, accessed on 30 June 2023).
Cloud observations from meteorological satellites have been available since the late 1970s. Due to their multidecadal and near uniform data records, now spanning 40 years, these satellite-based observations of cloud properties provide important insights and constraints on our understanding of clouds. From the pioneering and ground-breaking work done in the framework of the International Satellite Cloud Climatology Project (ISCCP) since the early 1980s [30,31], the enormous progress made by the NOAA’s flagship Pathfinder Program through their PATMOS-x data records [32], to the dedicated and continuous developments in the frameworks of EUMETSAT’s Satellite Application Facility on Climate Monitoring (CM-SAF) [33,34] as well as the European Space Agency’s (ESA) recent Climate Change Initiative [35], the cloud climate data records (CDRs) from these various efforts have unraveled many new insights into the role of clouds in climate. As pointed out by many studies, the recent improvements and maturity of these CDRs are mainly attributed to the novelties and capabilities of NASA’s Afternoon-Train (A-Train) sensors such as Moderate Resolution Imaging Spectroradiometer (MODIS) onboard Aqua satellite [36], Cloud-Aerosol Lidar with Orthogonal Polarization (CALIOP) onboard Cloud-Aerosol Lidar and Infrared Pathfinder Satellite Observations (CALIPSO), and Cloud Profiling Radar (CPR) onboard CloudSat [37].
The cloud CDRs are requested to follow certain accuracy and stability standards [38]. This is especially important if a cloud CDR is to be used to detect a physical climate trend or a climate change signal that is free from potential technical and sampling artifacts. Each cloud CDR usually undergoes robust evaluation and scientific validation iteratively [39,40,41,42]. While the uncertainties and biases in the cloud CDRs are documented regularly, very little is known about their decadal stability and robust trends that are common across all CDRs. The aim of this study is to assess those two aspects. The work presented here on the stability assessment is unprecedented and has never been attempted before in such detail. Furthermore, this study provides an update to the last assessment of cloud CDRs performed five years ago by Karlsson and Devasthale (2018) in the framework of CM-SAF [43], and about a decade ago by Stubenrauch et al. (2013) in the framework of GEWEX Cloud Assessment [44]. The evaluation of common and robust trends in global cloud amounts and cloud top temperatures in the latest versions of CDRs is also novel.

2. Satellite Based Cloud Data Records

In this study we evaluated four cloud climate data records that span over more than 35 years.
CLARA-A3: The first CDR used here is the third edition of the CM SAF cLoud, Albedo and surface RAdiation dataset from AVHRR data, CLARA-A3 [40]. CLARA-A3 offers substantial improvements to previous CLARA-A2 data records. Its cloud probabilistic detection is based on the Naïve Bayesian theory and its cloud top property algorithms employ artificial neural networks. The Level 3 monthly mean cloud products available at 0.25 degree grids are used. The AVPOS flavour of this dataset is analysed here. AVPOS refers to the fact that the Level 3 data are prepared using quality-controlled Level 2 retrievals from AVHRR sensors flying onboard all available NOAA and MetOp satellites for a given month, instead of using only one prime morning or afternoon NOAA and MetOp satellite at a time. The CLARA-A3 CDR currently covers the period from 1979 to 2020 with an Interim CDR thereafter.
ESA Cloud CCI V3: The second CDR used here is derived in the framework of ESA’s Climate Change Initiative. It provides Level 3 monthly mean cloud properties from AVHRRs based on afternoon prime NOAA satellites at 0.5 degree grids and covers the period from 1982 to 2018. The latest Version 3 CDR is used, and it offers significant improvements to its previous Version 2 CDR [39]. Its Community Cloud retrieval for the CLimate (CC4CL) retrieval system uses an artificial neural network for cloud detection, which is further complemented by a thin cirrus test [40].
PATMOS-x V6: The third CDR used here, PATMOS-x V06r00, is provided by NOAA with its heritage in the flagship Pathfinder Atmosphere program [41]. It provides cloud properties at 0.1 deg grids and covers the period from 1982 to 2020. We used daily mean Level 2b PATMOS-x data and computed Level 3 monthly means in the same way as is done in CLARA-A3. Compared to its previous Version 5.3, it offers more stable and consistent cloud property retrievals. PATMOS-x V6 employs the NESDIS Enterprise Cloud Mask (ECM), which is an improvement to the previously used naïve Bayesian cloud detection algorithm. ECM uses up to three dimensional classifiers and a selective decision optimization. Cloud height is retrieved by using an optical estimation method that employs the NOAA Algorithm Working Group (AWG) Cloud Height Algorithm (ACHA).
ISCCP-HGM: The fourth CDR used here is available in the framework of ISCCP. The ISCCP-H series uses high resolution (10 km) input from the polar and geostationary imagers compared to its predecessor ISCCP-D series (30 km). The ISCCP-HGM CDR (v01r00) is available from July 1983 through June 2017 and a corresponding interim CDR thereafter through December 2018 [42]. The ISCCP cloud masking algorithm uses a set of hierarchical, decision tree-based threshold tests that are rooted in the decades of developmental legacy. The HGM series provides high resolution global monthly means. It is to be noted that ISCCP-HGM is the only CDR here that can fully represent diurnal variability.
Stability reference: In addition to the CDRs, we used monthly mean cloud products from MODIS-Aqua (MYD08 Collection 6 product) [36]. MODIS-Aqua provides nearly 20 years of uniform global cloud property retrievals starting from 2002, and due to its orbital and calibration stability (see an overview in [45]), can be considered the most suitable independent reference to test the stability of the four CDRs mentioned above. For example, compared to the NOAA satellite platforms, the equator crossing times of the Aqua satellite are extremely stable during the evaluation time period (2003–2020). At the radiance level (Level 1), both the MODIS solar and thermal calibration assembly on the Aqua platform have also been stable [45,46]. The degradation of MODIS solar diffuser on Aqua is considerably smaller than on Terra. The long-term orbit drift in the blackbody temperatures (a crucial component of thermal channel calibration system) of MODIS-Aqua has been less than 5 mK for over the last 18 years [47]. The MODIS-Aqua also offers better stability at the Level 2 and Level 3 product levels compared to MODIS-Terra [47,48].

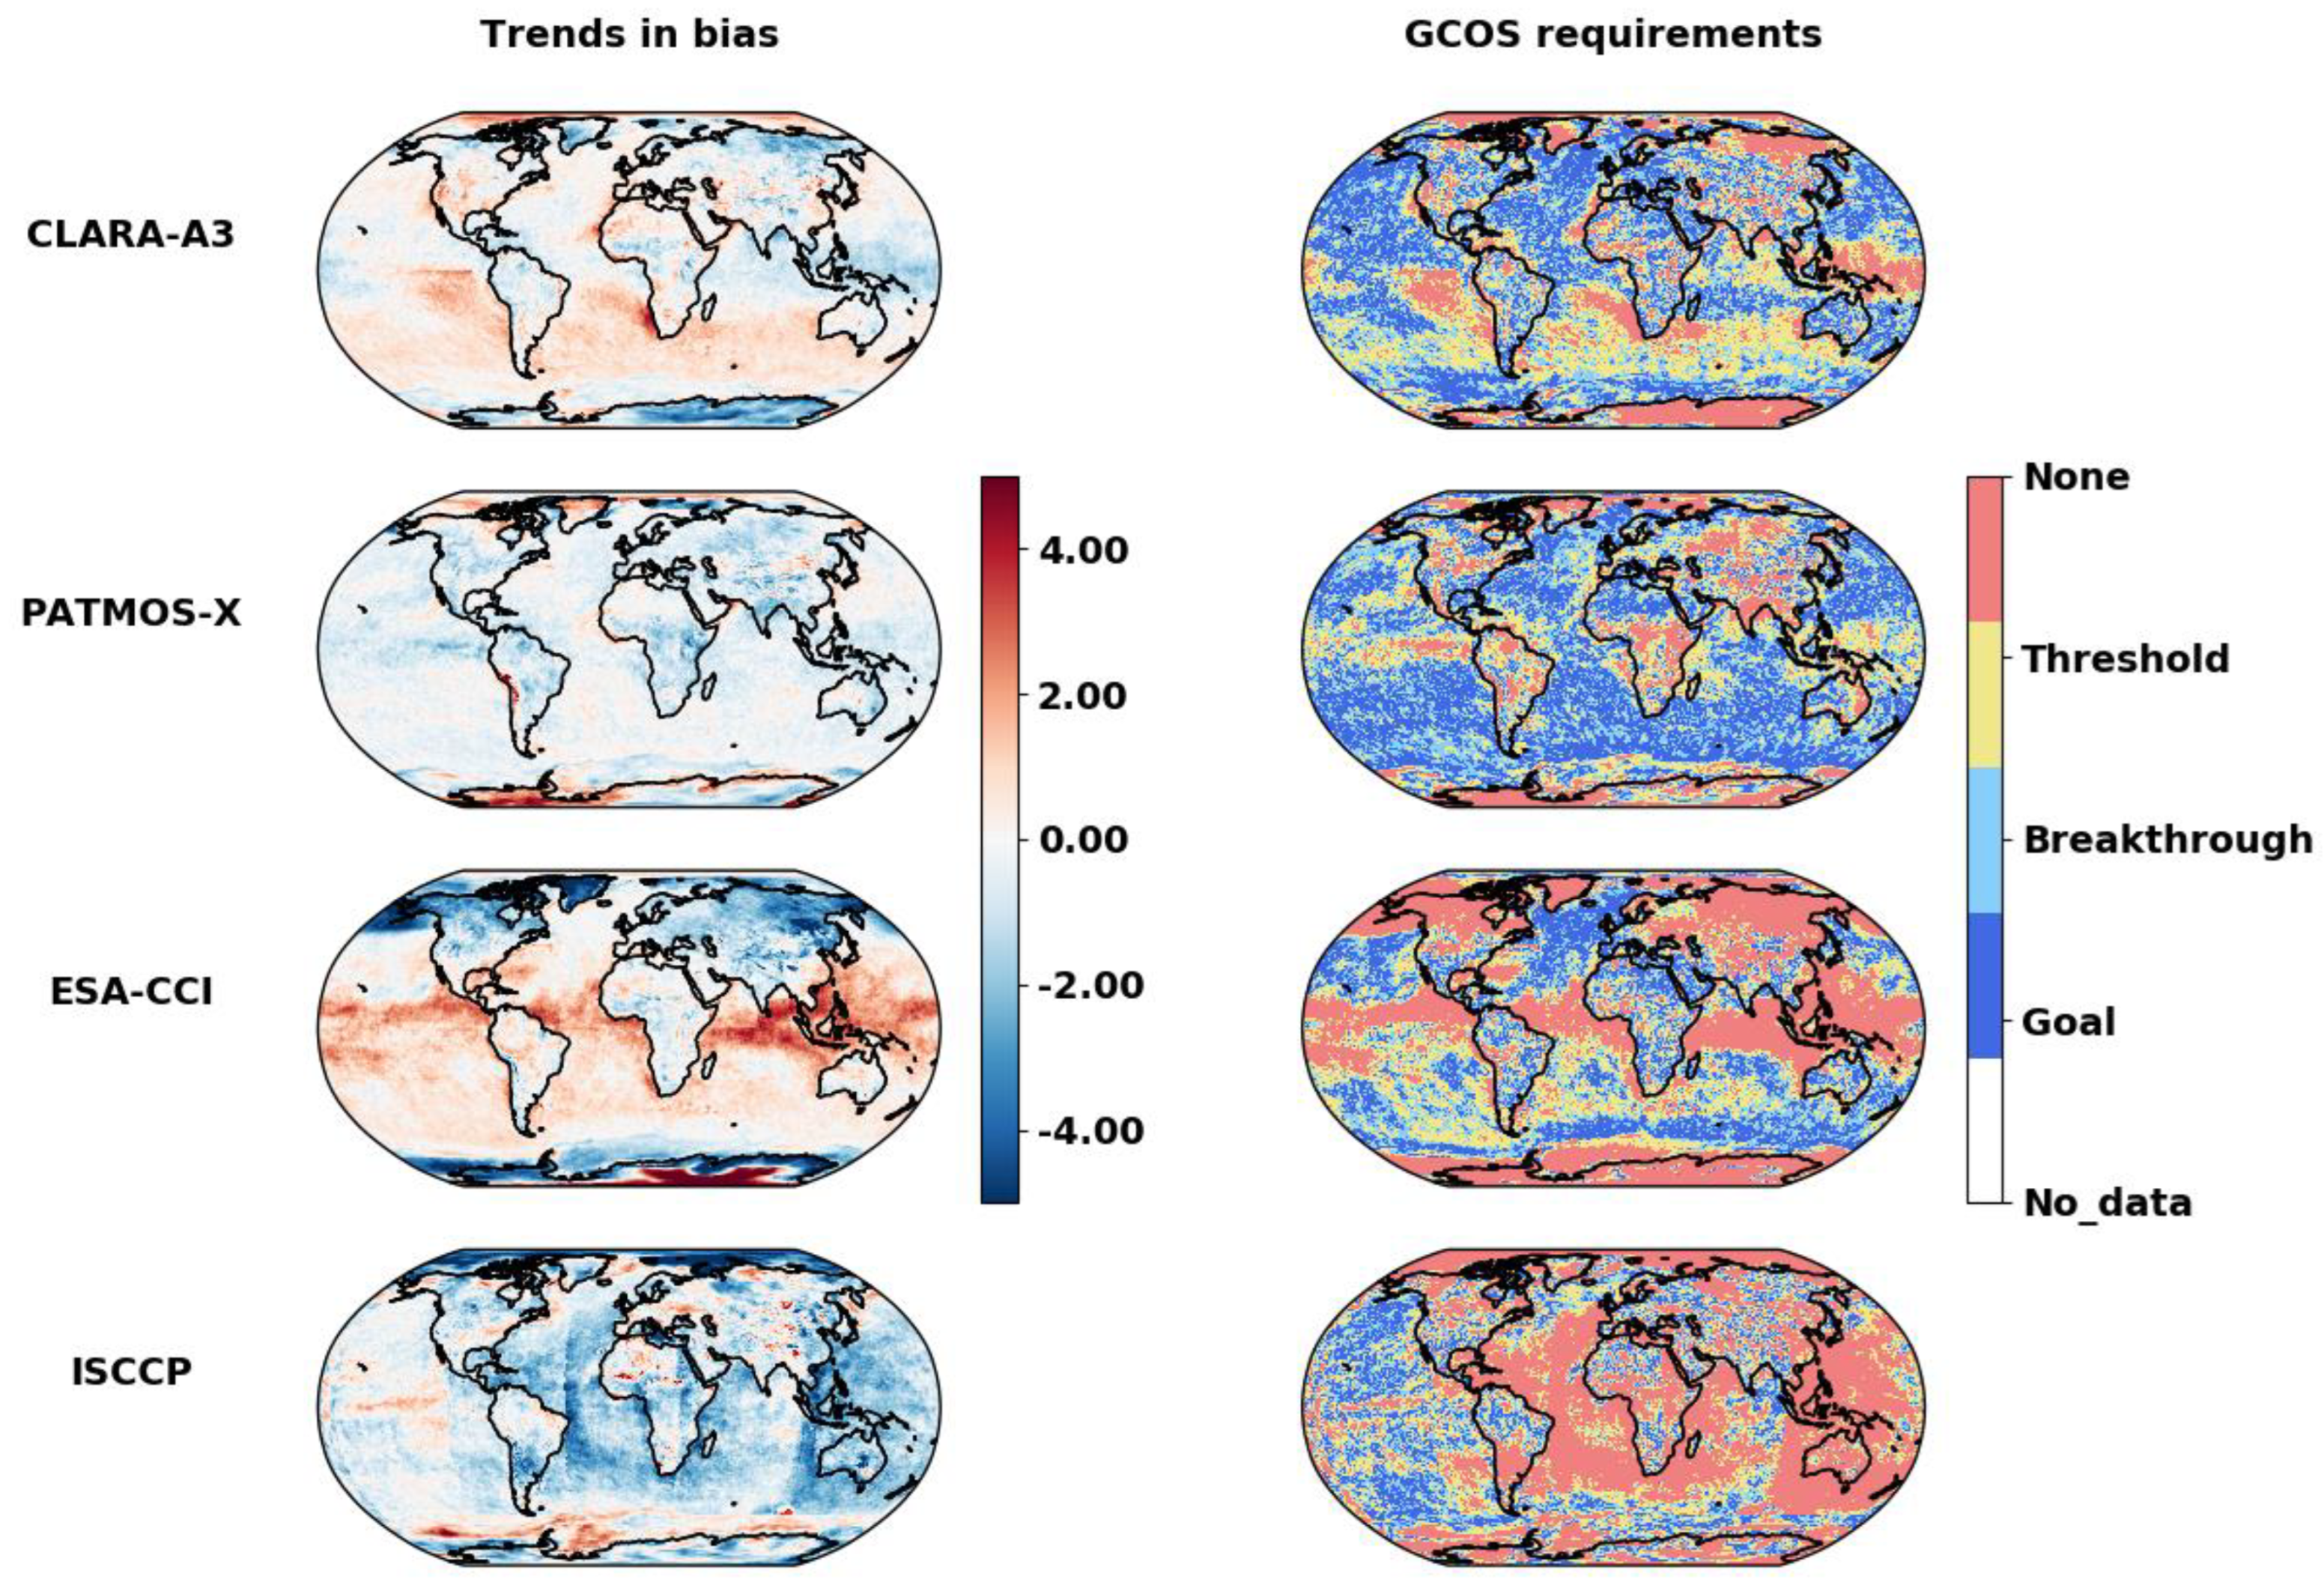
3. Stability Assessment of Global Cloud CDRs

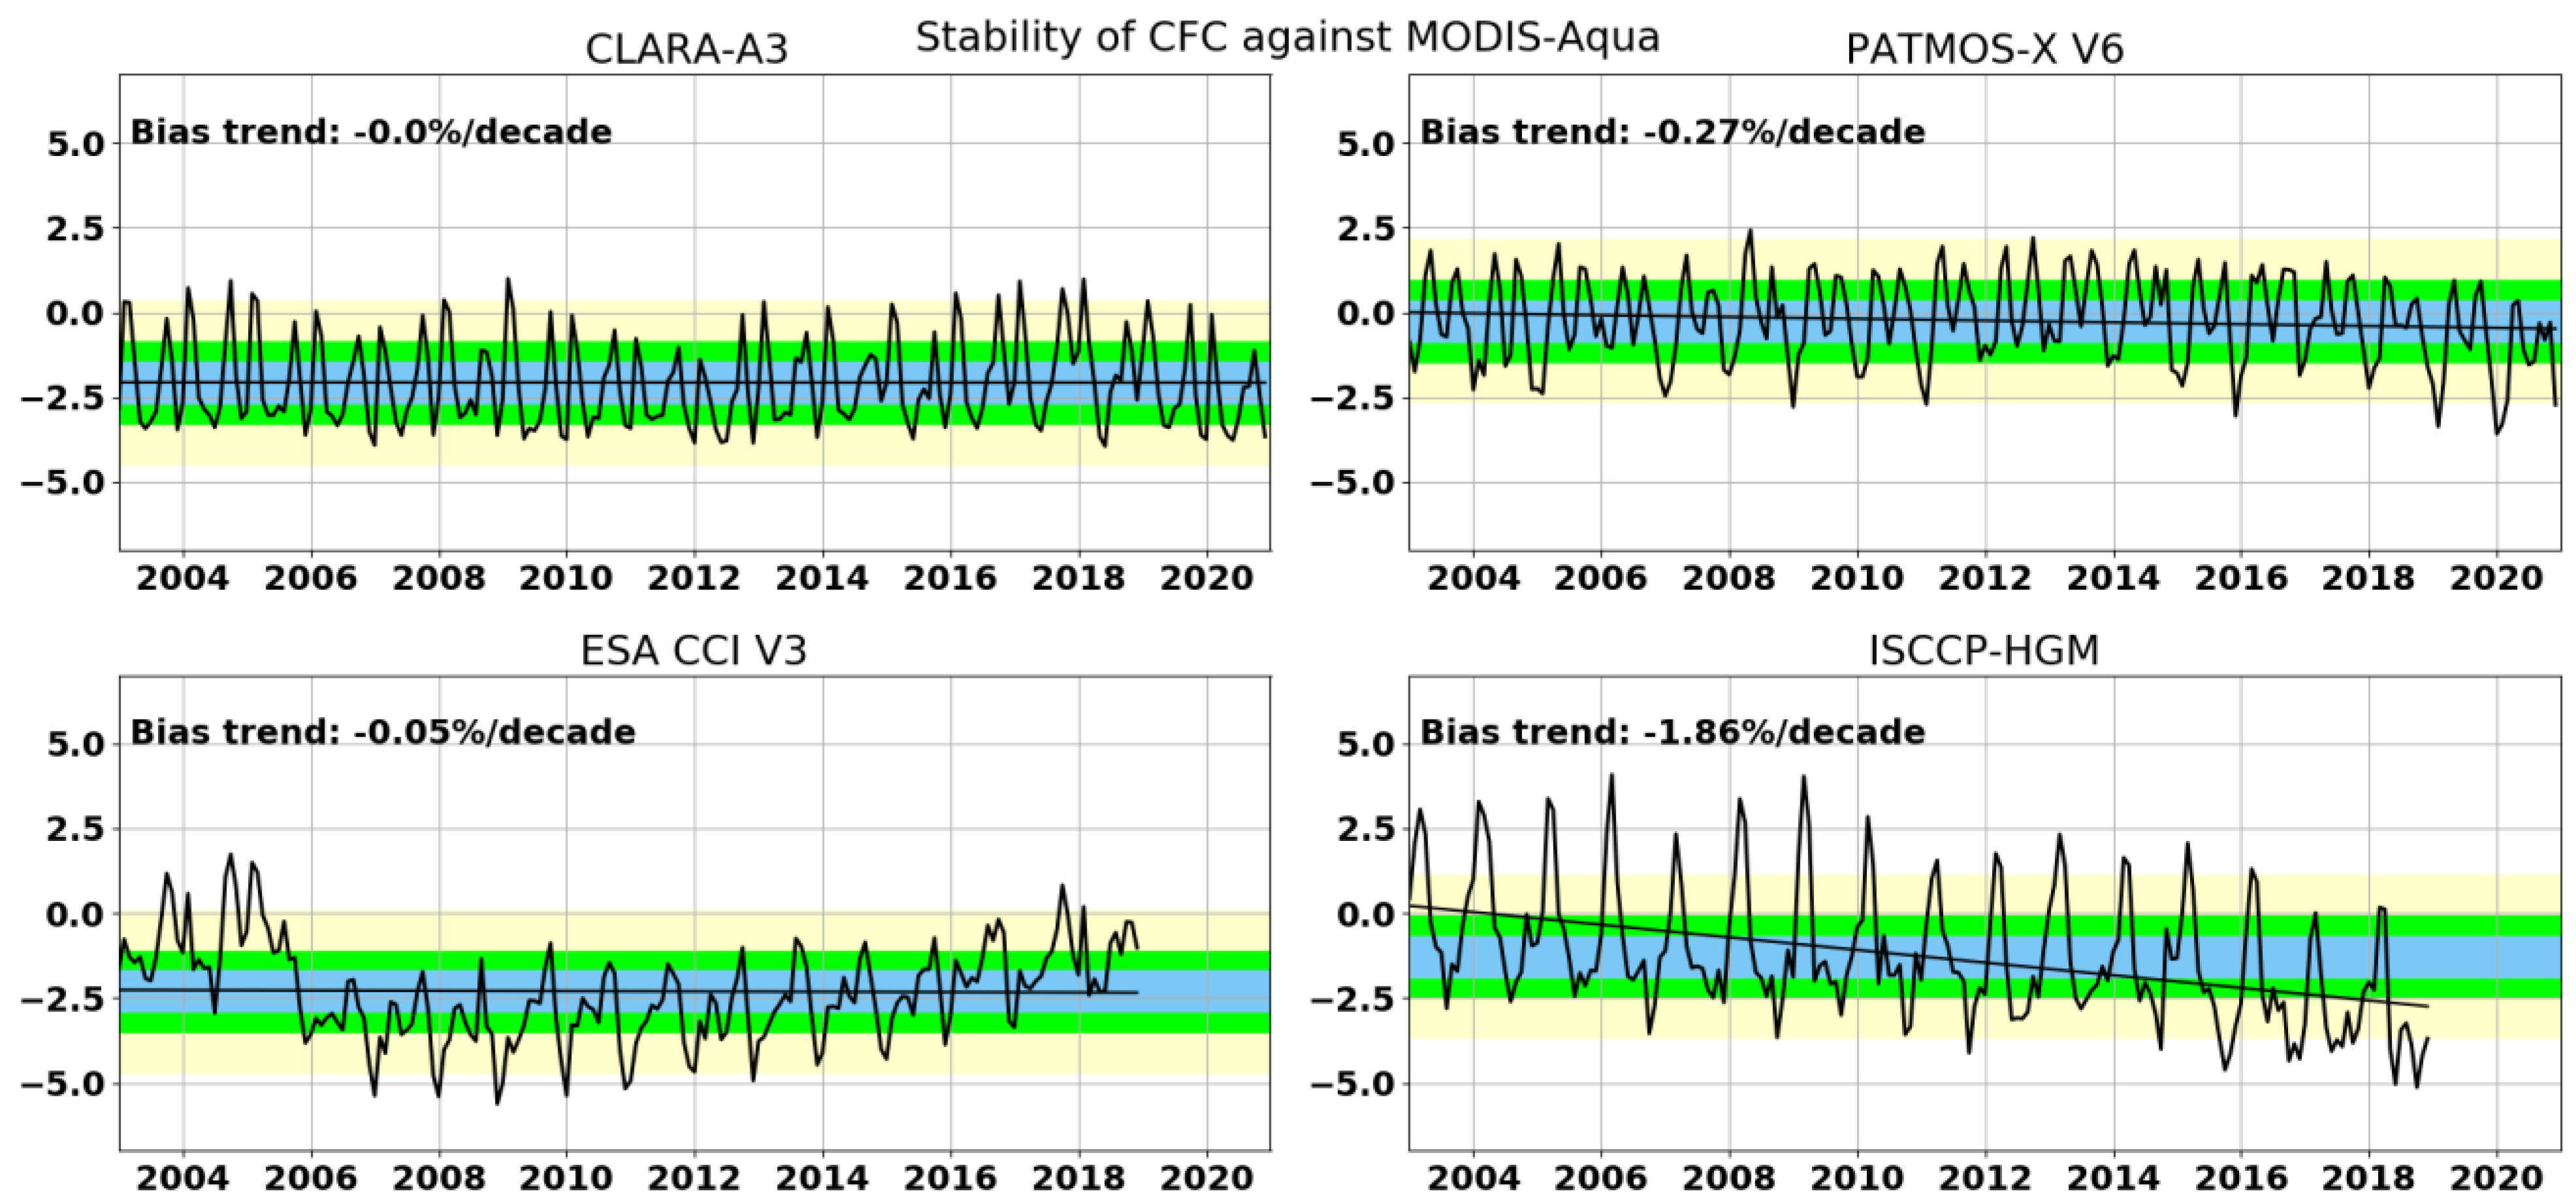
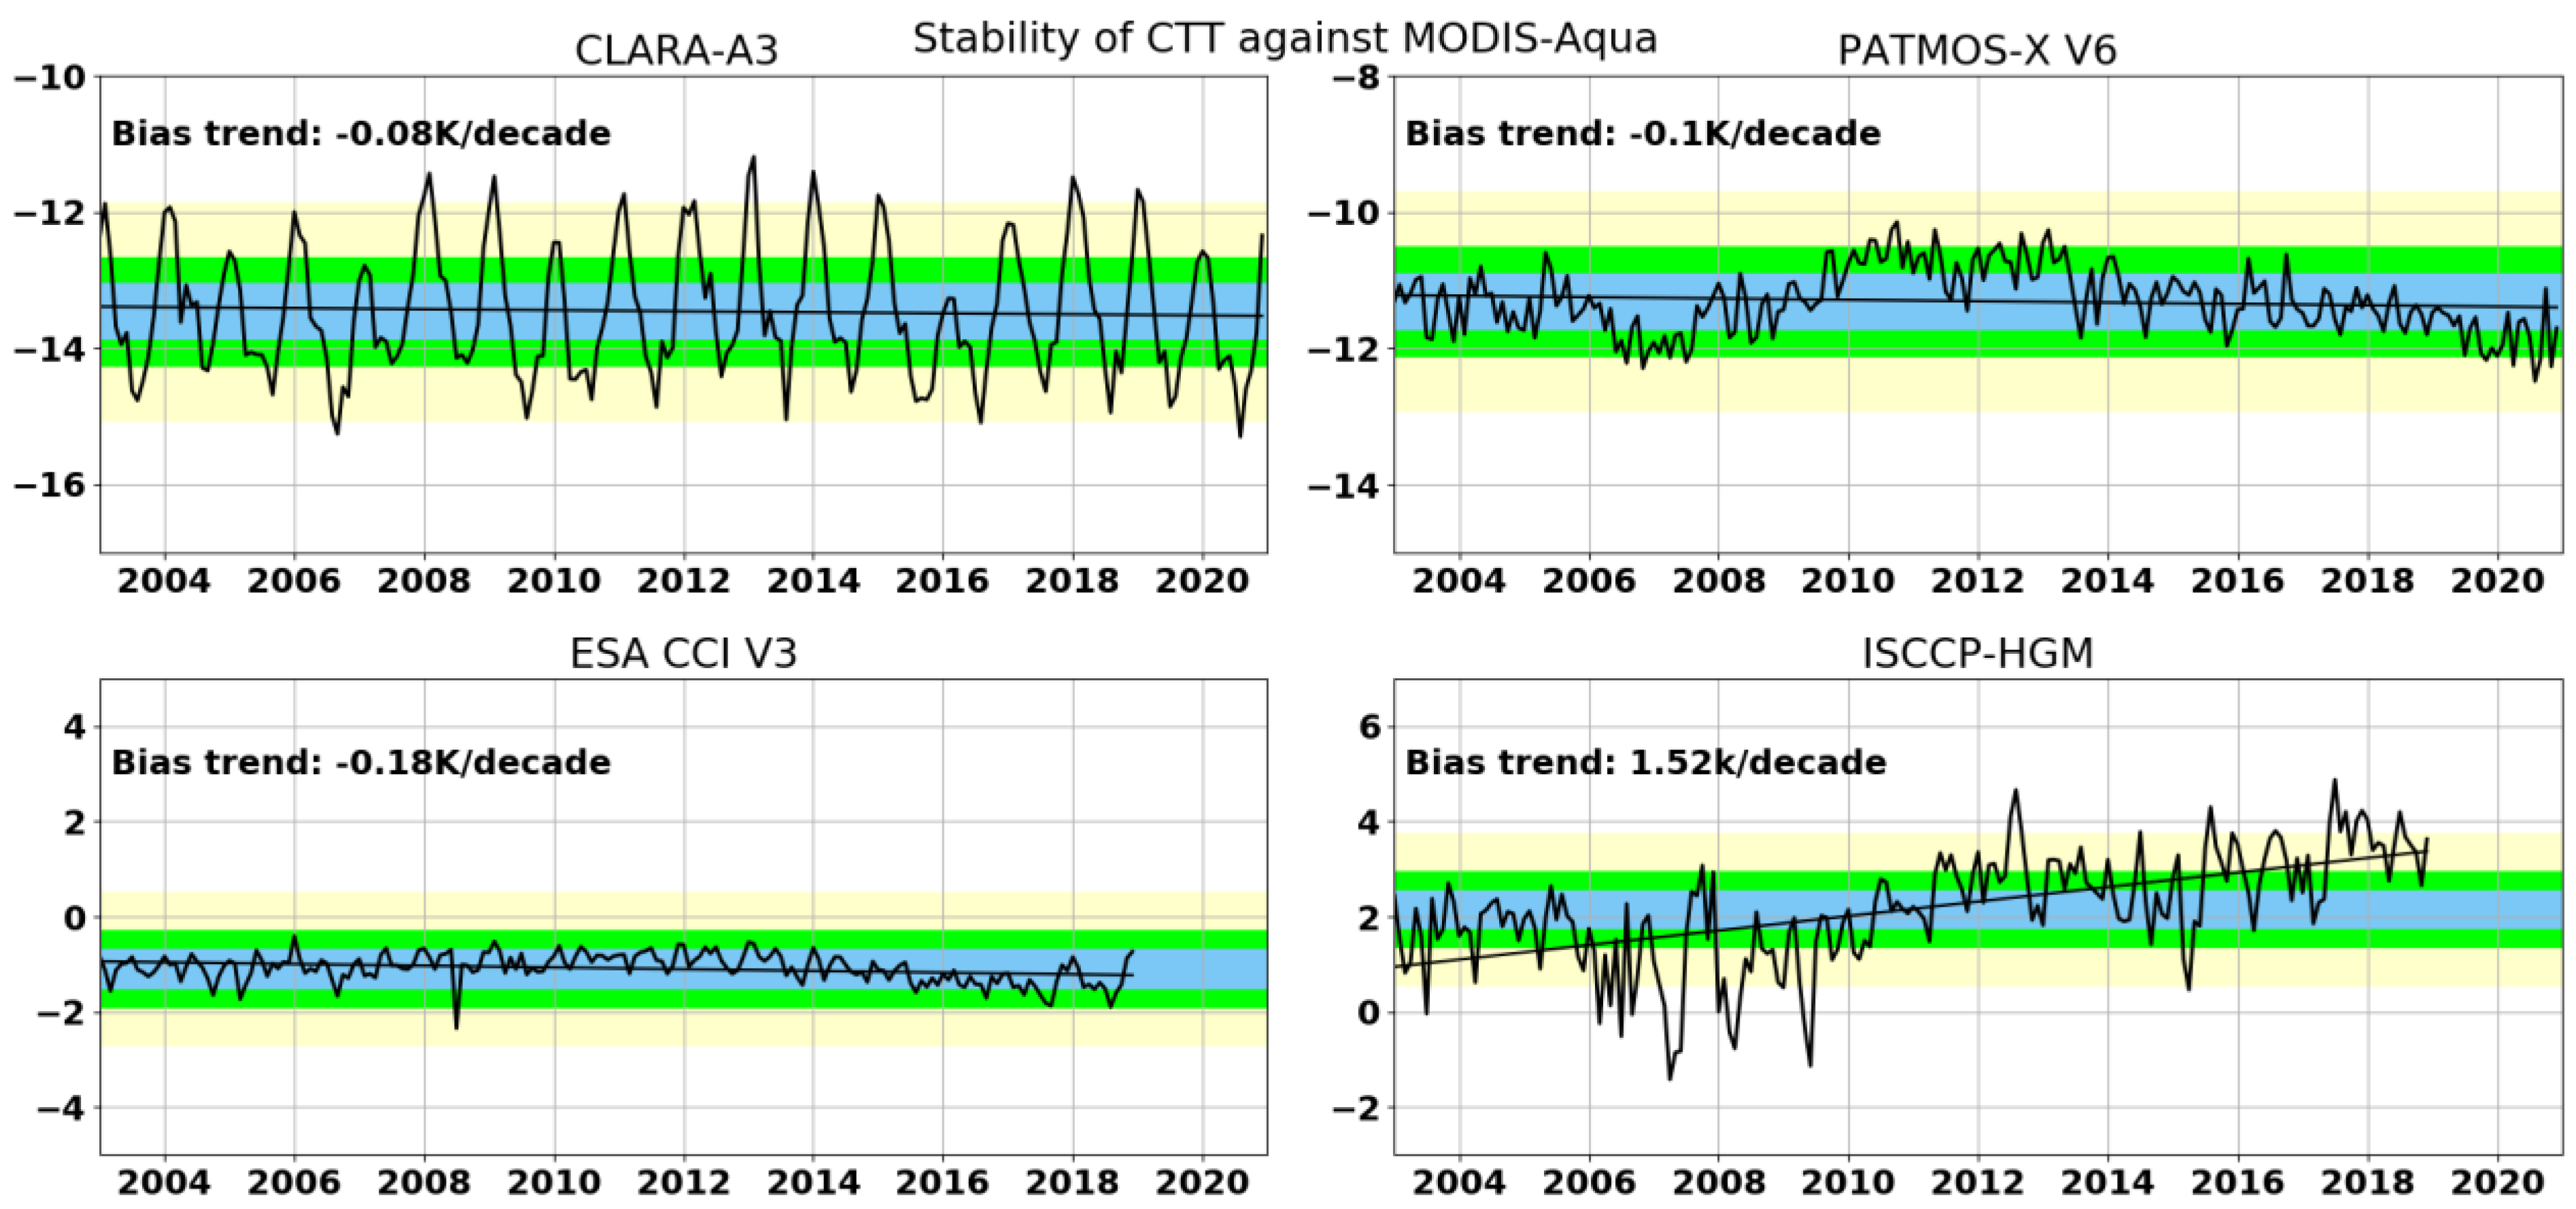
3.1. A Global Overview of Stability

Here, the stability of global cloud amount and cloud top temperature is evaluated against the requirements set by the WMO Global Climate Observing System (GCOS) [38]. These requirements are given in Table 1. The stability of a climate variable is defined here as the change in bias over time, as stipulated in GCOS-245 [38]. The biases are computed against an independent stable reference, which is MODIS-Aqua in our case. It is to be noted that the requirements set by GCOS are even stricter than those set by CM-SAF. In their most recent implementation plan [38], GCOS provides three levels of requirements termed as Threshold, Breakthrough, and Goal; the last one being the strictest. Different regions on the globe can satisfy different levels of stability requirements. In the most ideal case, it is recommended that the Goal requirements are satisfied by a climate variable, but the Breakthrough requirements are also acceptable for climate studies, depending on the application. The regions where even the Threshold requirements are not satisfied, detecting a climate change signal that is free from potential satellite artifacts is very difficult.
We first present an overview of stability at a global scale in Figure 1 and Figure 2 for the cloud amount and cloud top temperature, respectively. The subplots in these figures show biases against MODIS-Aqua and the fitted trends therein. All four CDRs show seasonality in the cloud amount biases against MODIS (Figure 1), which can be explained by the different detection sensitivity of these CDRs. The differences in detecting clouds over the monsoon regions, the inter-tropical convergence zone, and over the polar regions during respective polar winters can explain the observed seasonality in the biases (see [49,50] for further details). It is to be noted that all AVHRR-based CDRs (i.e., CLARA-A3, ESA Cloud CCI and PATMOS-x) satisfy even the strictest GCOS Goal requirements on the stability of derived cloud amounts. The best stability is observed in the CLARA-A3 dataset when averaged globally. The ESA Cloud CCI CDR shows a slight drop in the bias associated with the change of platform from NOAA-16 to NOAA-18. NOAA-16 was already drifting noticeably before NOAA-18 came into the operation. The increasing bias towards the end in the ESA Cloud CCI CDR is most likely due to the orbital drift of NOAA-19. These results show the orbital drift of NOAA satellites can even impact the global averages and thus need to be taken into consideration. The ISCCP-HGM series does not satisfy the GCOS requirements in the global averages. The ISCCP-HGM retrieval algorithms are being unfairly punished by the fact that they have to use the least common denominator set of channels while harmonizing the data from the polar and geostationary satellites, and that they have varying sampling throughout the observational period. These aspects seem to be affecting the cloud detection sensitivity varyingly over time, resulting in stronger trends in the biases.
Figure 2 shows the stability of global mean cloud top temperatures in the four CDRs. In this case as well, all three AVHRR-based CDRs satisfy even the strictest GCOS requirements, while the ISCCP-HGM series fails to do so for the same reasons mentioned above. It is to be noted as well that, as expected, the absolute CTT biases in the CLARA-A3 and PATMOS-x CDRs are high. This is mainly due to a) the different selection of Level 2 to Level 3 clouds (e.g., MODIS team does not include broken cloudiness in L3 cloud top products); and b) the improved and rigorous training of optimal estimation and artificial neural network algorithms using CALIPSO to improve the detection and placement of clouds in PATMOS-x and CLARA-A3 in recent years [39,41,51].

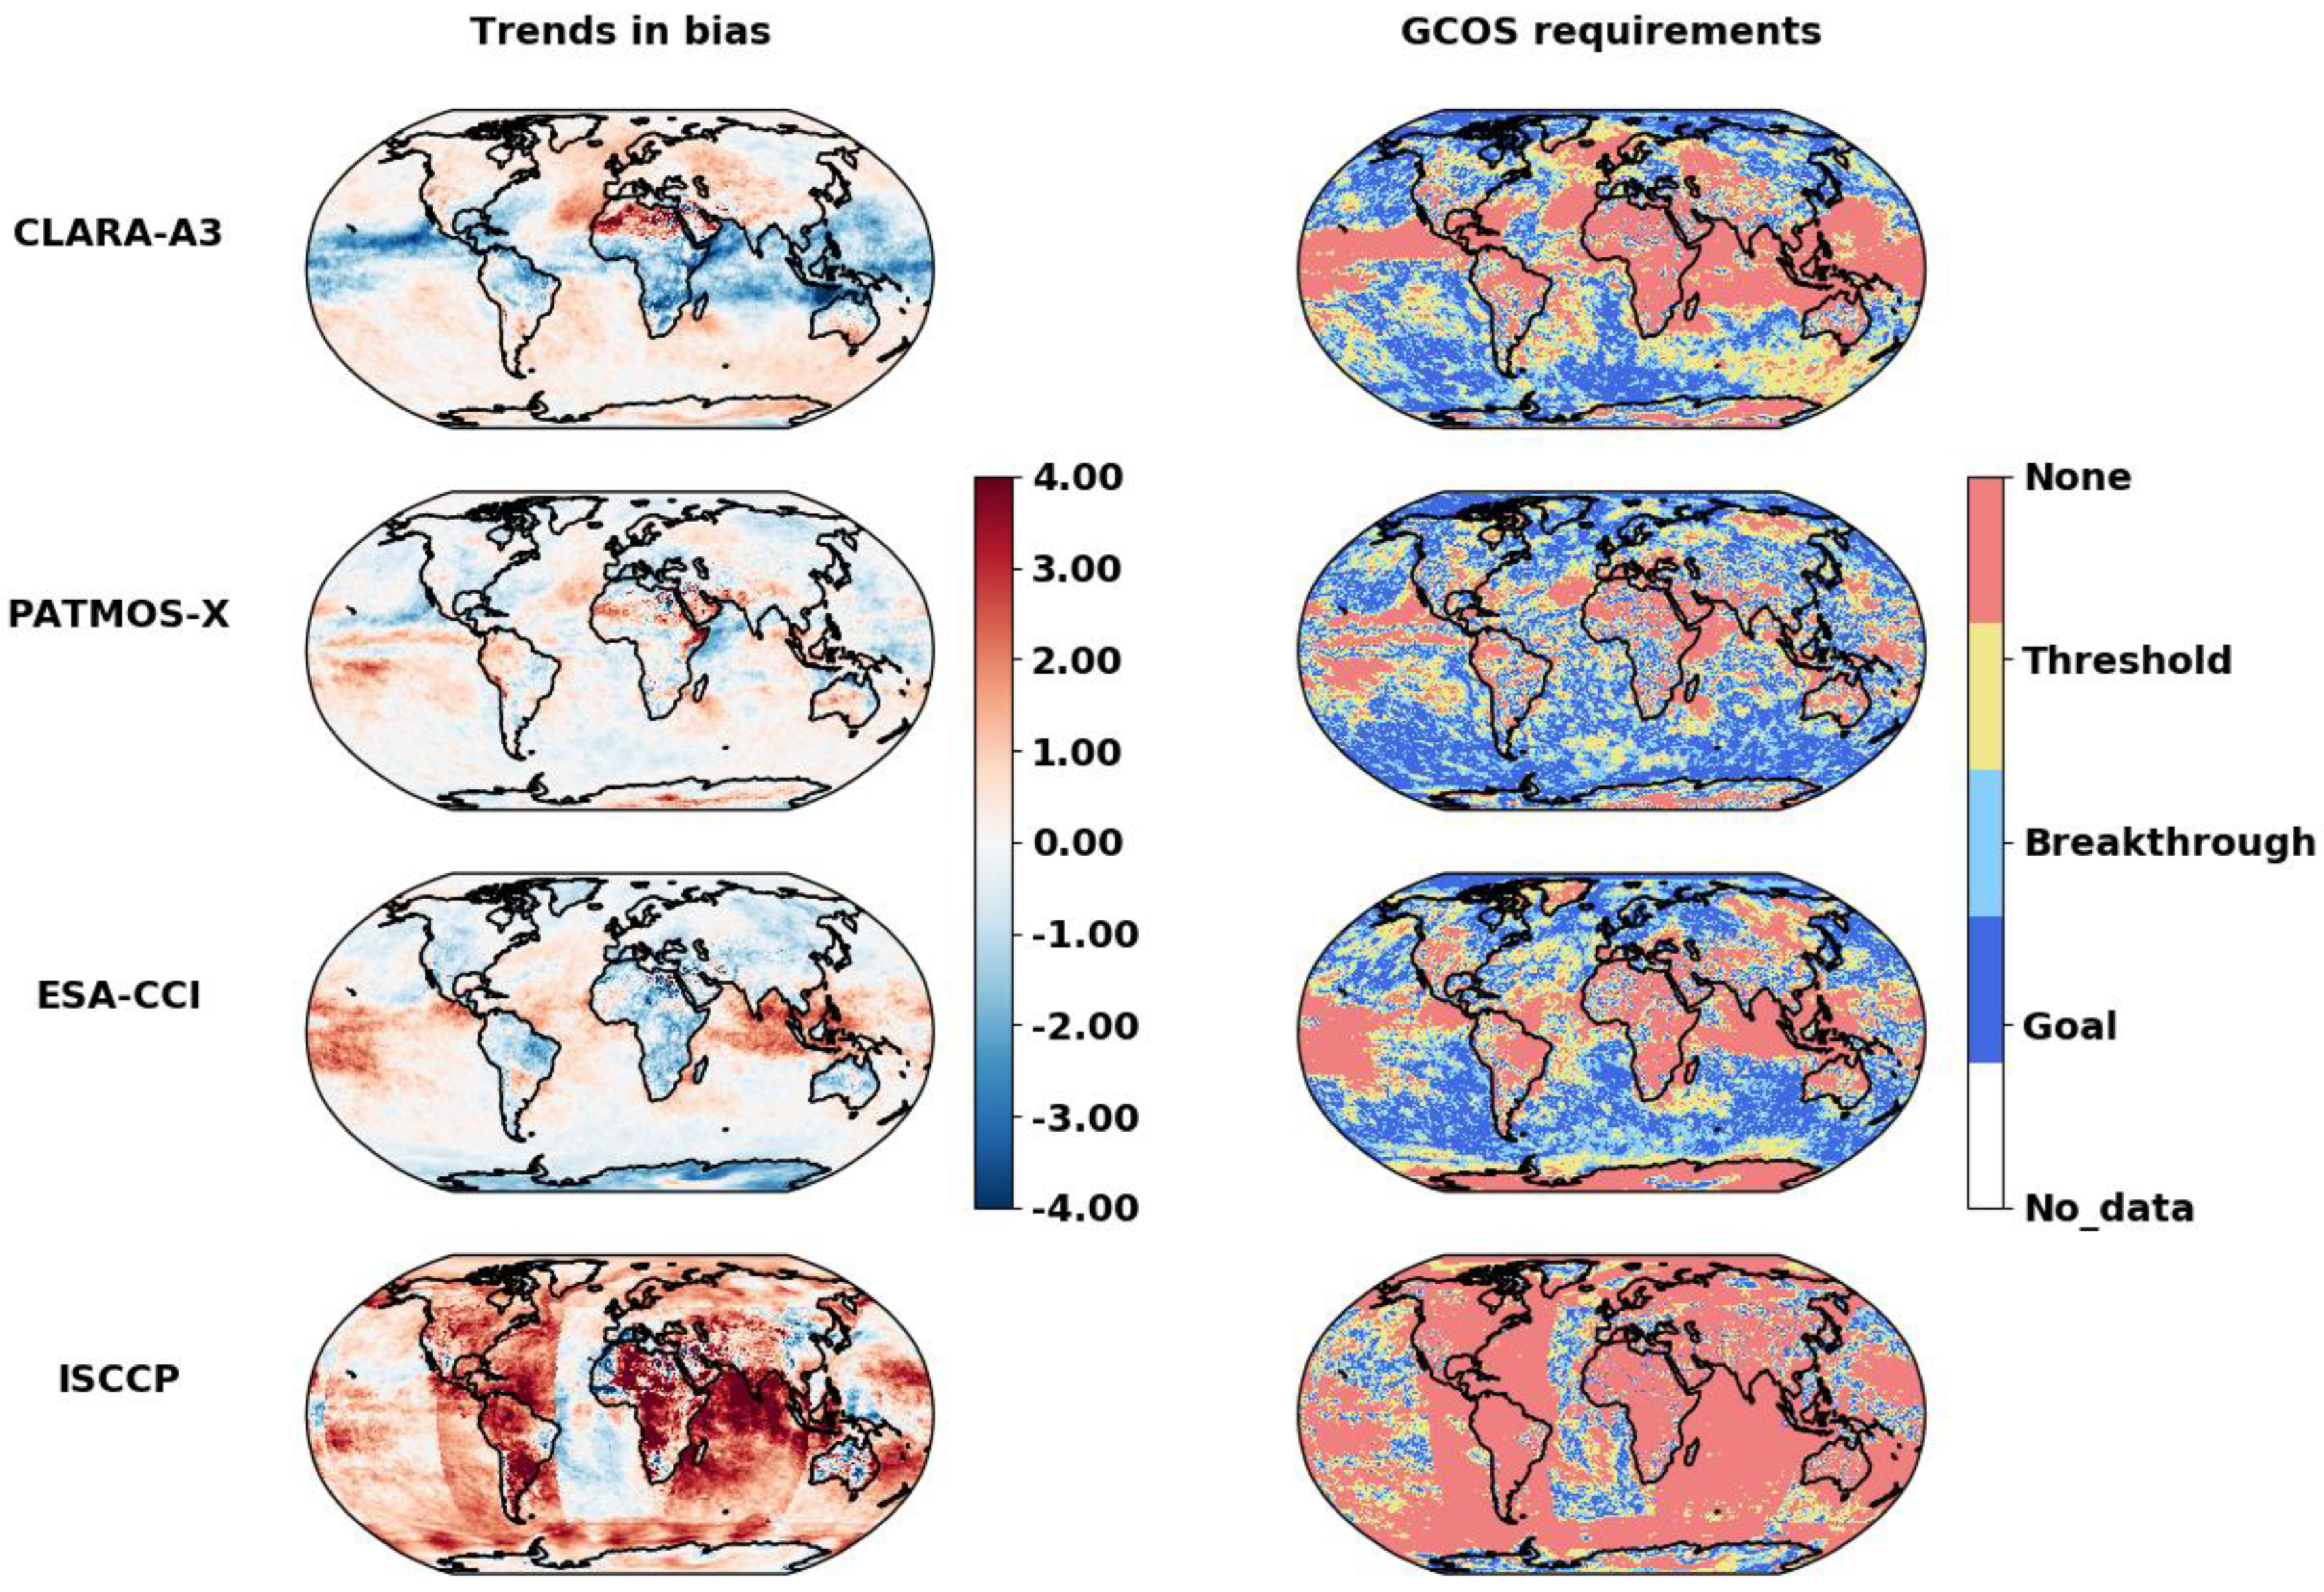
3.2. Reginal Features of Stability

The cloud detection sensitivity and the accuracy of retrieval algorithms varies regionally, and they could also be cloud regime-dependent. We therefore investigated the spatial patterns of stability as shown in Figure 3 and Figure 4 for the cloud amount and cloud top temperature, respectively. Figure 3 and Figure 4 indeed show strong regional features in the stability of cloud amount and CTTs.
Over the majority of the Earth’s surface, CLARA-A3 and PATMOS-x satisfy the Breakthrough and Goal requirements for cloud amount (Figure 3). The strongest trends in the CA biases are observed over the polar regions, Pacific warm pool, and the southern hemispheric sub-tropical and mid-latitude regions in CLARA-A3. In the PATMOS-x CDR, the strongest trends in biases are also observed over the polar regions and over the parts of the ITCZ. Compared to the AVHRR-based CLARA-A3 and PATMOS-x versions of CDRs used here, the ESA Cloud CCI CDR has more pronounced trends in the biases and there is a clear zonal gradient evident. These features and differences in the bias trends can be explained by the fact that ESA Cloud CCI uses data from only prime NOAA satellites, thus making it more vulnerable to the impacts of orbital drift of NOAA satellites [52], as mentioned in Section 3.1 above. During its later observation period, NOAA-19 has also drifted significantly from its original orbit, thus introducing gradual change in the observation time. This affects strongly the detection of tropical cloud regimes that have strong diurnal cycles. Notice that the amplitudes and peaks of diurnal cycles of tropical clouds are quite different than those of mid- and high-latitude clouds (and also different over land and ocean surfaces), especially during the winter seasons, leading to such zonal gradients in the biases. On the other hand, the CLARA-A3 and PATMOS-x versions used here are based on all available quality-controlled data from different NOAA and MetOp platforms, making them less sensitive to such impacts. The ISCCP-HGM CDR satisfies the GCOS requirements over the Pacific Ocean and parts of the Southern Ocean, Eurasia, and the Indian Ocean. It does, however, show spatial artifacts associated with the edges of the geostationary discs and the non-uniform sampling [53]. Overall, the cloud amounts from the PATMOS-x CDR perform best regionally while satisfying the Goal, Breakthrough, and Threshold requirements. These results suggest that the programmatic differences can have a profound impact on the stability of CDRs.
Figure 4 further reveals interesting spatial features in the stability of CTTs. The negative trends in the CTTs biases in the CLARA-A3 CDR are high in the ITCZ regions and, as a result, it does not satisfy the GCOS requirements over those regions. In the mid-latitude regions, the trends in the biases are positive and weaker and satisfy the requirements. The ESA Cloud CCI CDR also shows the similar features. The artifacts in the ISCCP-HGM CDR are even more visible in the CTT bias trends than in the cloud amounts. All three AVHRR-based CDRs satisfy the strictest stability requirements over the Southern Oceans, and the northern and southern parts of the Pacific Ocean. The PATMOS-x CTT CDR shows the best agreement with the GCOS requirements regionally.
A user-friendly synthesis of all stability results together is presented in Figure 5. It shows the common stability coverage (CSC), i.e., the geographical areas that are common across different combinations of CDRs where they satisfy at least the Threshold GCOS stability requirements for cloud amount and CTT. Programmatically and algorithmically, the CLARA-A3 and PATMOS-x CDRs are closest to one another among all four CDRs considered here, and they also show similar trends in absolute CA and CTT, as shown later. Therefore, their CSC together is also the largest globally. With each subsequent addition of another CDR, first ESA Cloud CCI and then ISCCP-HGM, the CSC decreases as the programmatic, algorithmic, and cloud detection sensitivity differences among the CDRs also increase. The areas where all four CDRs have CSC include the parts of the northern and southern Pacific Ocean, parts of the Southern Oceans, and the northern North Atlantic Ocean. They also have CSC over some of the land regions, such as central Europe, parts of continental USA, parts of Amazonia, and the African continent. The spatial features in the CSC of CTTs are similar to those features observed for cloud amounts over the oceanic areas. However, over the land regions, the CSC of CTTs is very small among all CDRs.

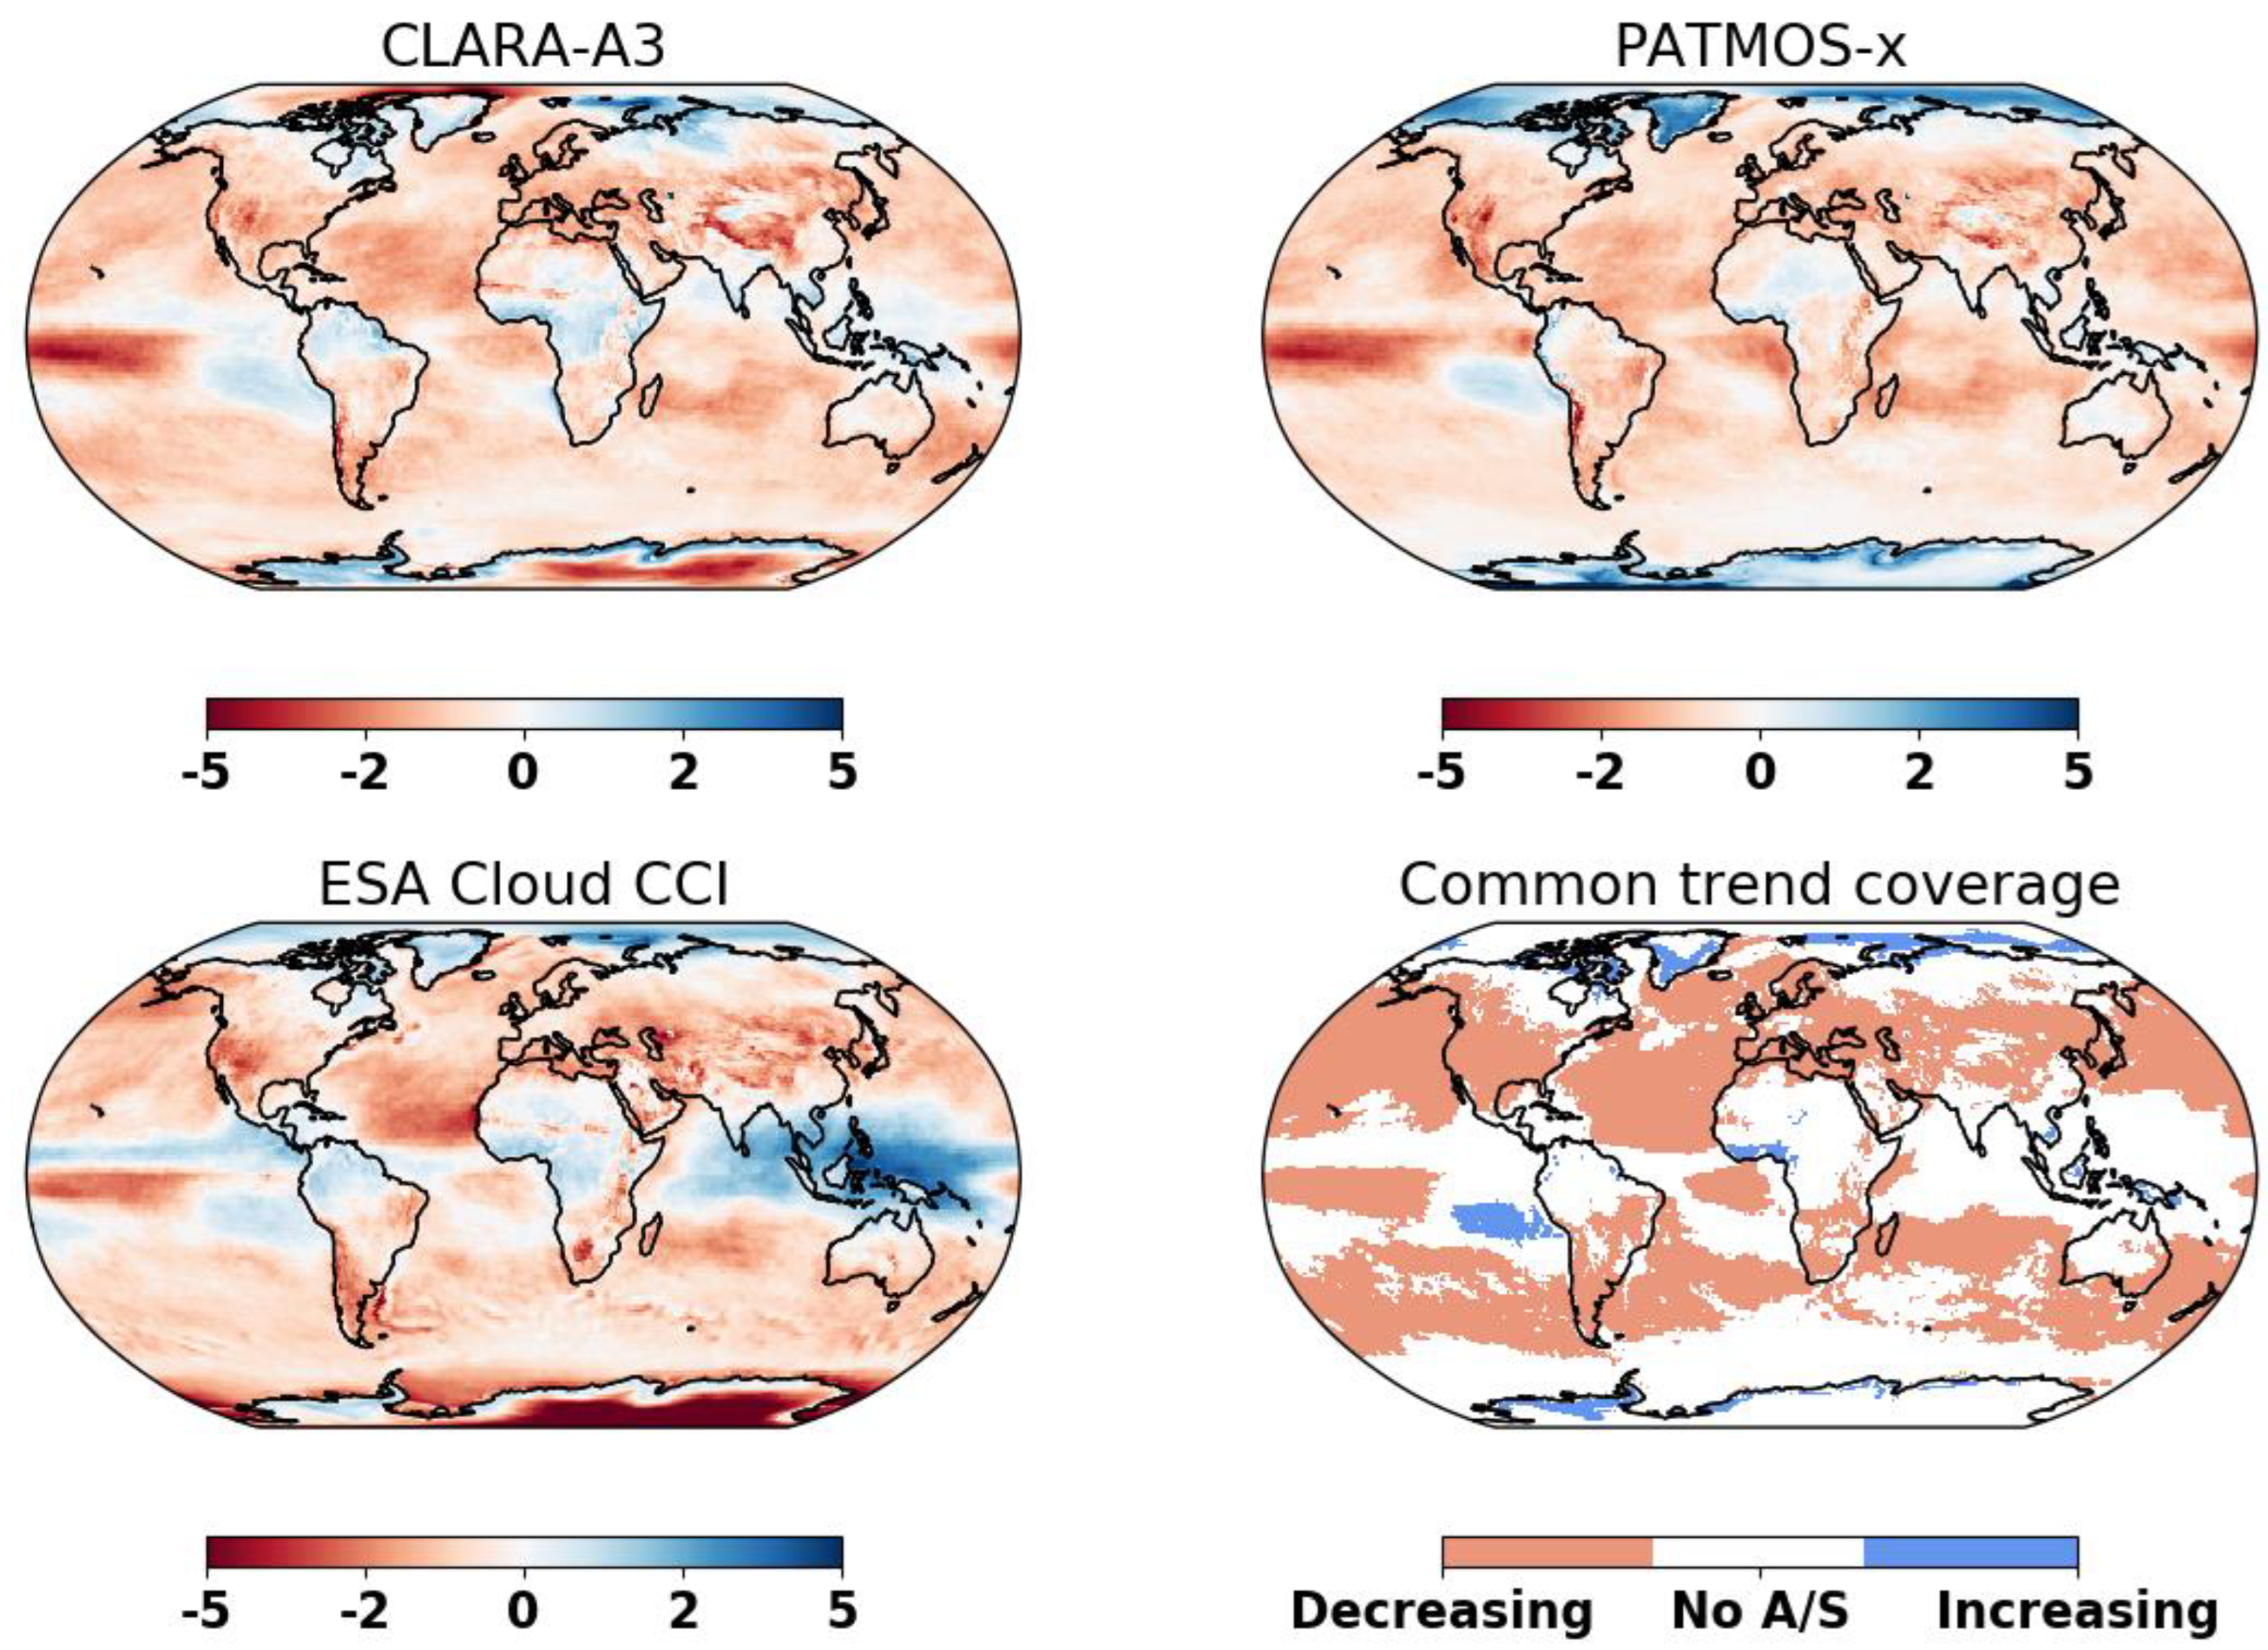
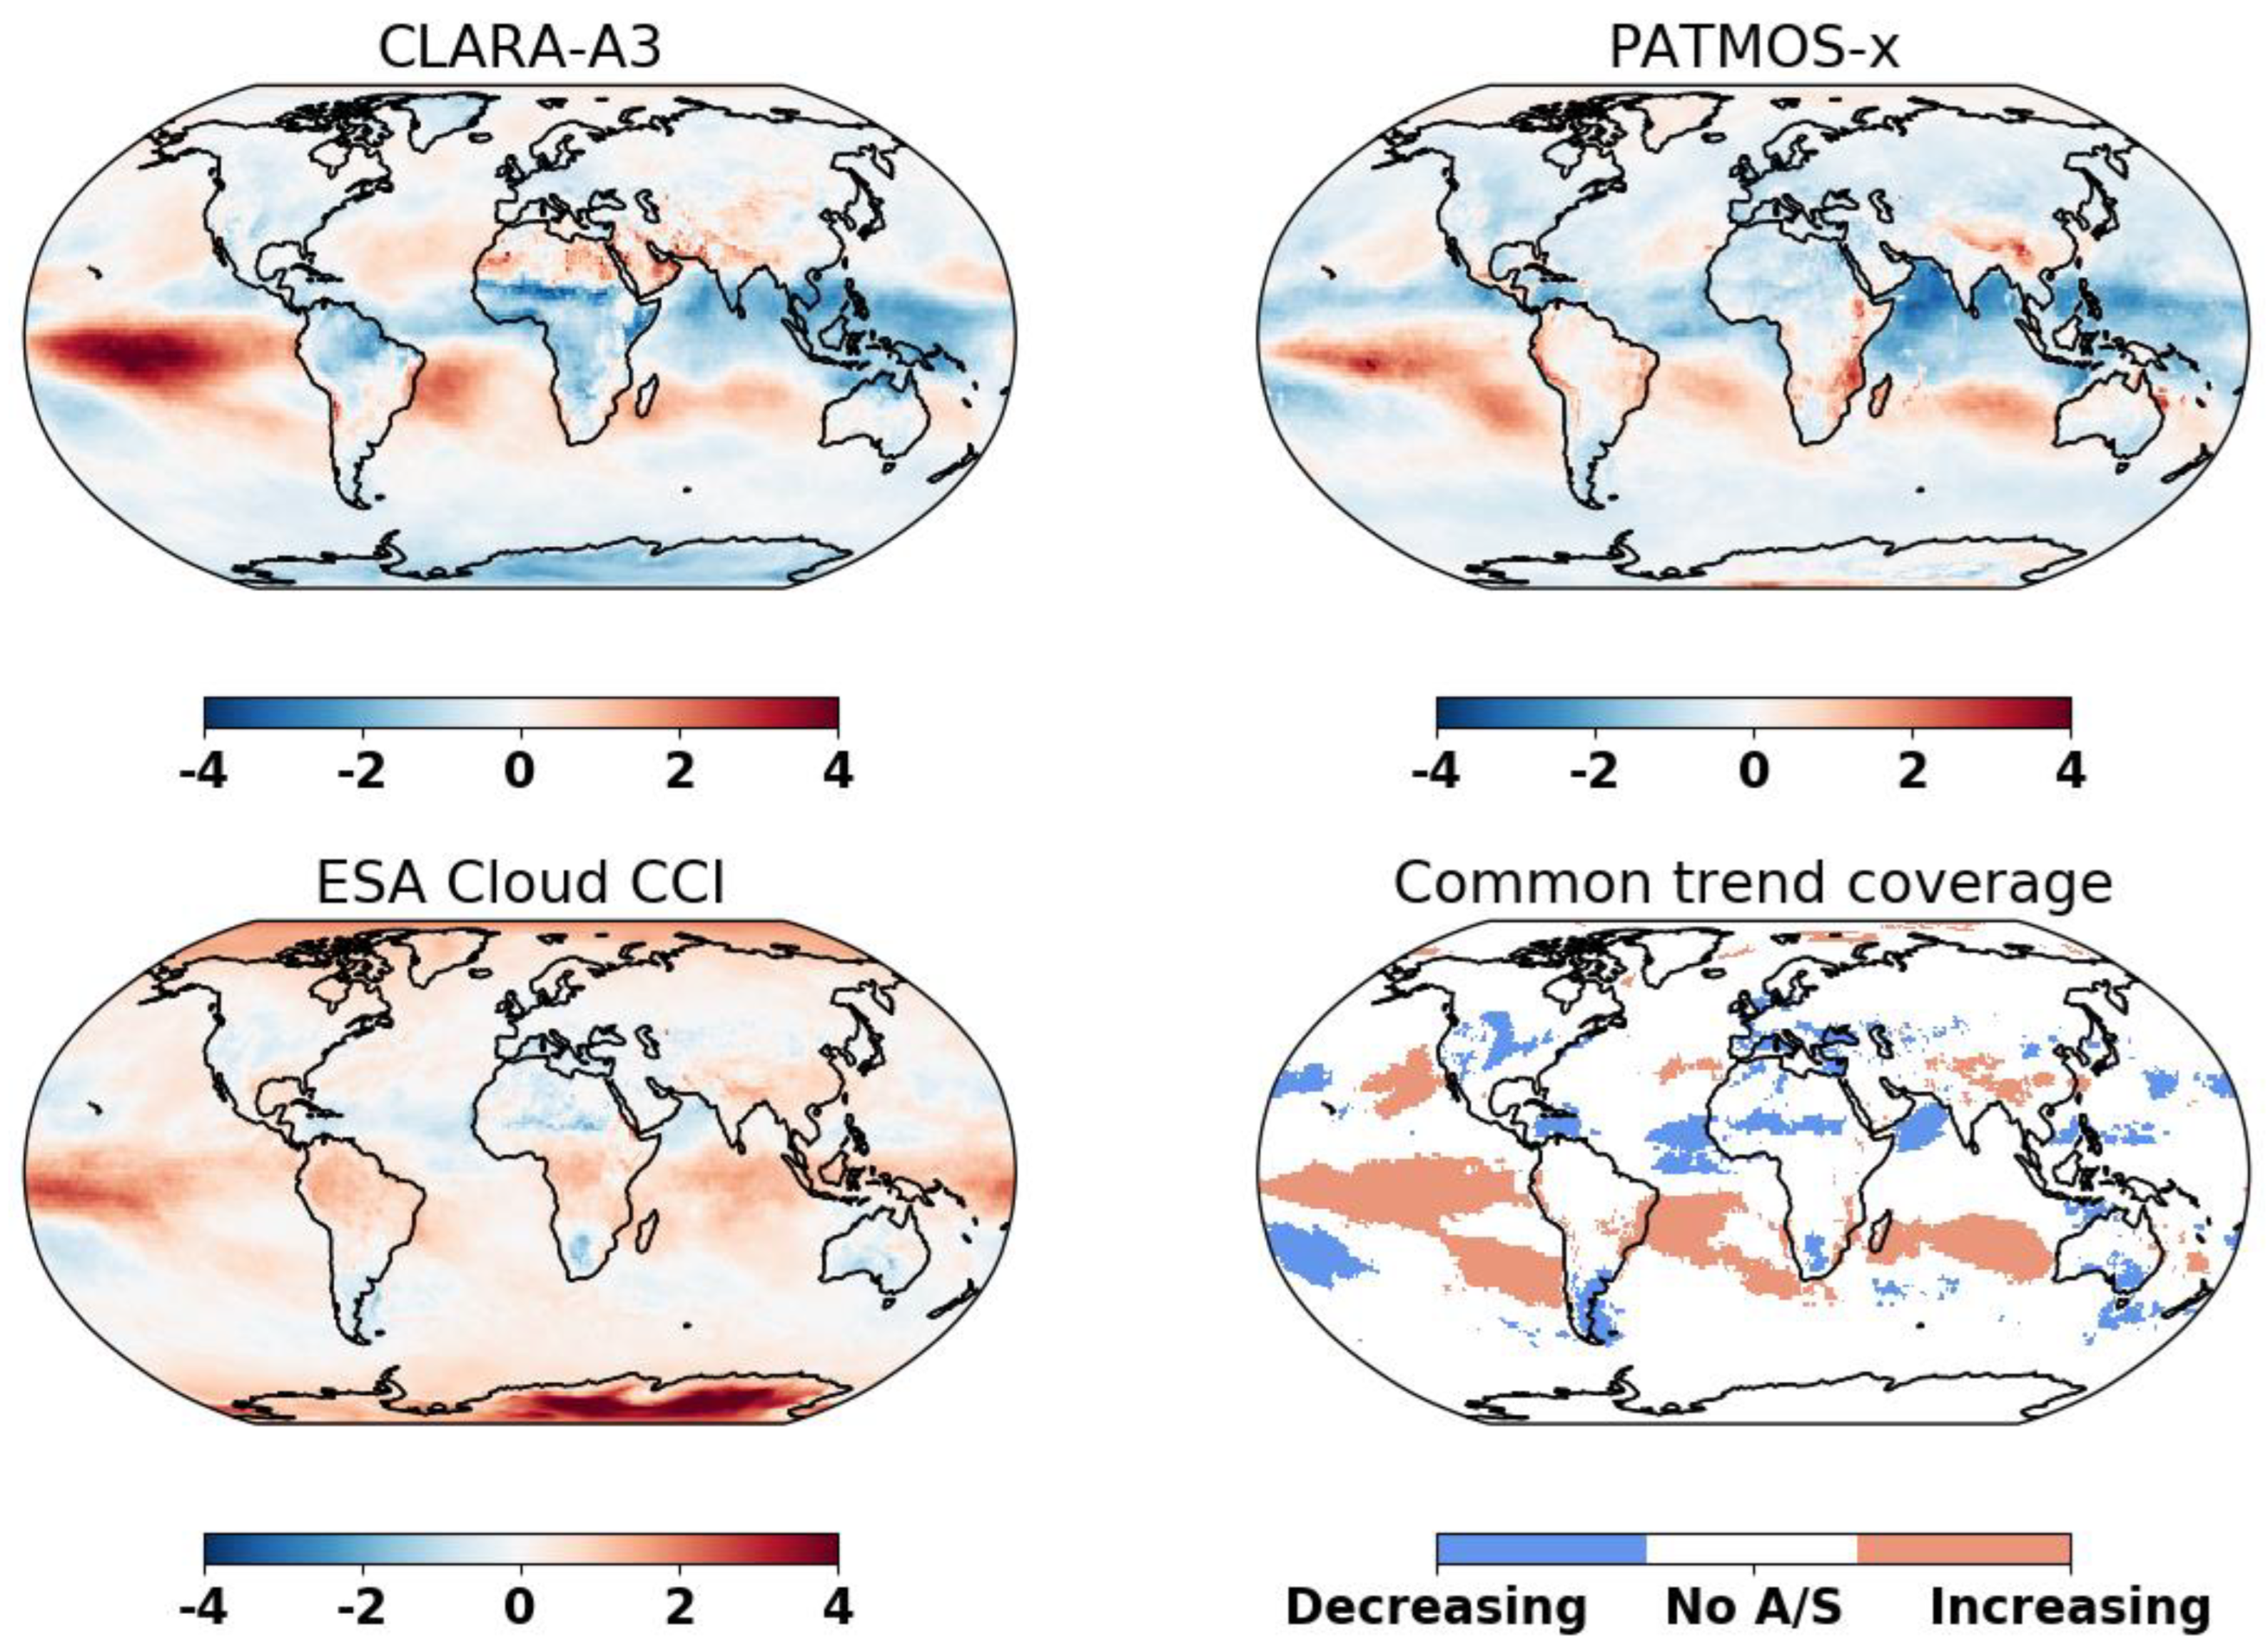
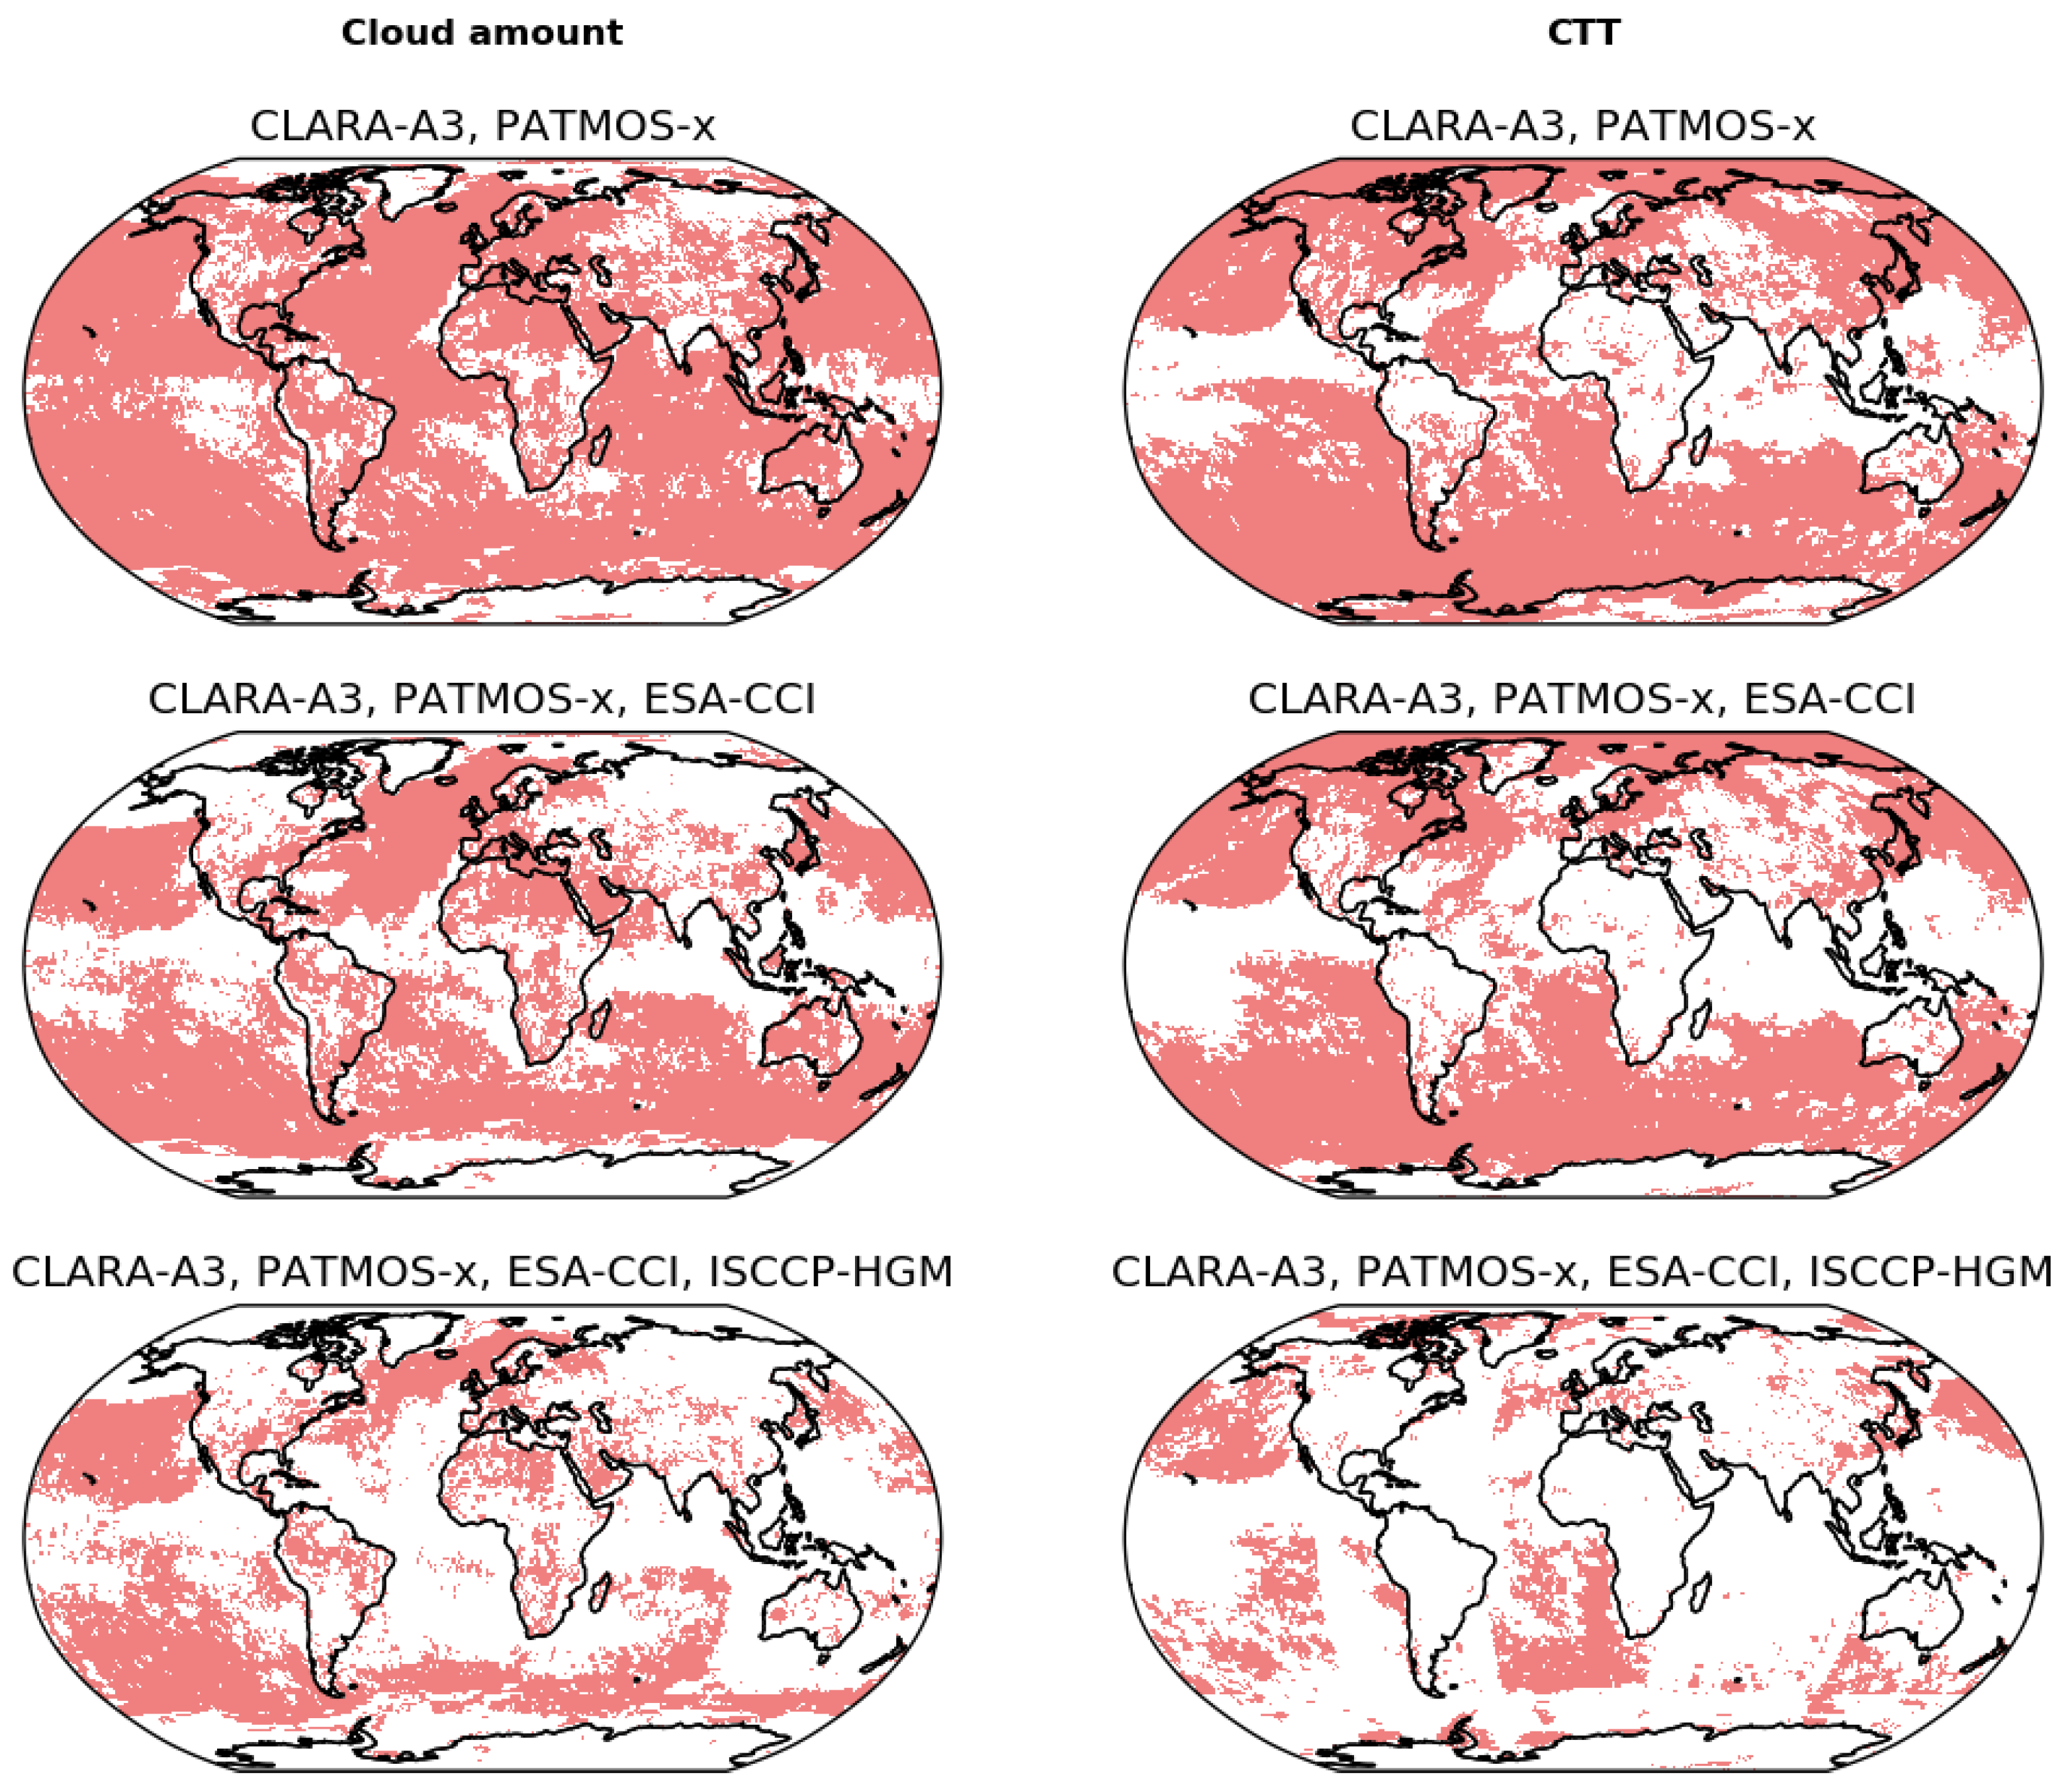
4. Robust Trends in Global CA and CTT

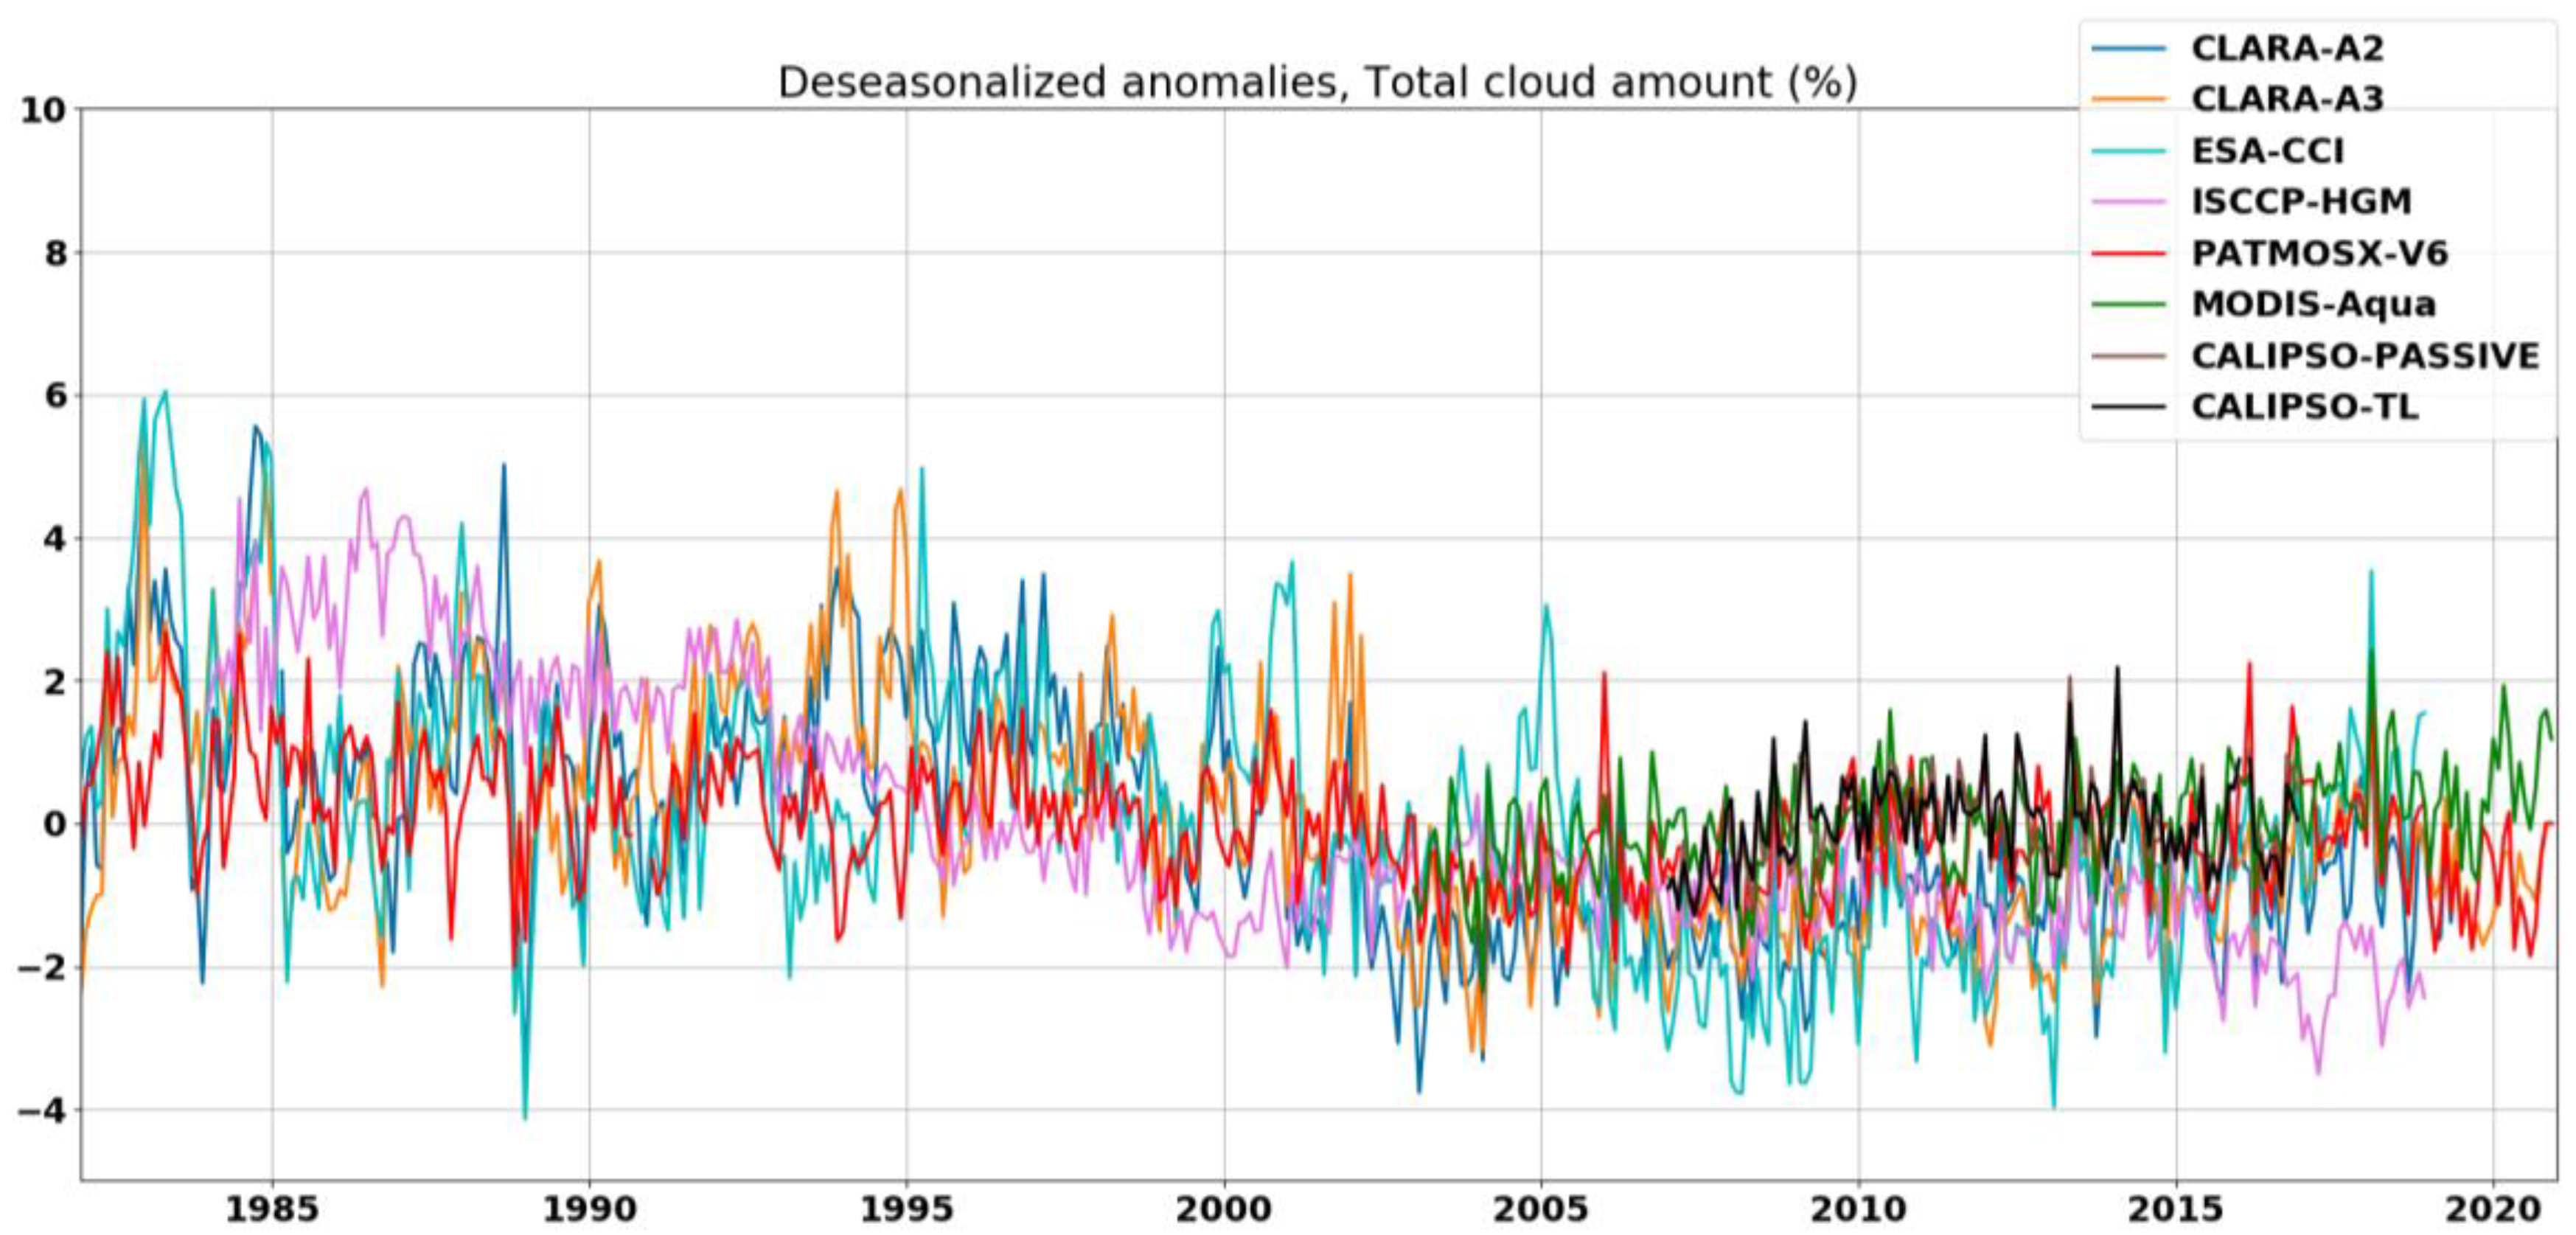
4.1. A Global Overview of Trends

Having assessed the stability of cloud CDRs, we investigate next the global trends in these CDRs and the robustness of these trends across them. Figure 6 and Figure 7 show the de-seasonalized anomalies of CA and CTT, respectively, based on the four CDRs in question. The shorter time-series from MODIS-Aqua and two flavours of GEWEX-like cloud products from CALIOP-CALIPSO (Top Layer and Passive) are also shown for comparison. All four cloud CDRs show a statistically significant decreasing trend in CA over the last 40 years (Figure 6), although the magnitude of this trend is different among the CDRs. A stabilization of this trend or even a reversal is seen in the last two decades, which is also seen in MODIS-Aqua and CALIPSO. The interannual variability in the total CA remains within a few percentage points in all CDRs.
There are many potential reasons why different CDRs have different magnitudes of trends, and why the interannual variability in them is also different. It is to be noted that we have learned many lessons since the comprehensive assessment of cloud property datasets derived from satellite sensors was first done in the framework of GEWEX Cloud Assessment [44]. For example, we have a better understanding of the cloud detection sensitivity (CDS), which is different among different CDRs. The CDS itself depends on the retrieval algorithm used (e.g., probabilistic naïve Bayesian versus hierarchical threshold-based), the number of detection features and threshold used, the training datasets, handling of multilayer clouds, re-analysis, and surface data used, etc. The different programmatic nature of these CDRs is also to be noted. For example, while ISCCP-HGM is based on the amalgamation of data from sensors onboard various geostationary and polar orbiting satellites, the other three CDRs are primarily based on AVHRR sensors onboard polar orbiting NOAA and MetOp satellites (except PATMOS-x, the newest version of which also ingests information from the HIRS sensors onboard the same polar orbiting satellites). While all three AVHRR-based CDRs have nearly identical calibration, ISCCP-HGM has a different approach. Furthermore, ESA CCI Cloud CDR used here is based only on prime afternoon satellites, while CLARA-A3 and PATMOS-x versions used here are based on quality-controlled AVHRR data from all available NOAA and MetOp satellites. Different approaches to convert Level 2 swath-based products into Level 3 monthly means also contribute to the observed differences. Given these large programmatic, algorithmic, and configurational differences among the cloud CDRs, we find it highly encouraging that these CDRs are converging towards one another over the years and that all of them agree on a robust decreasing trend in the CA in global averages.
Figure 7 shows de-seasonalized global mean cloud top temperatures. CLARA-A3 and PATMOS-x show statistically significant cloud top cooling, while ESA Cloud CCI shows significant warming of the cloud tops. The trend in ISCCP-HGM is very weak and not statistically significant. The interannual variability in the CDRs is strong in the first 20 years. It is difficult to understand if this is a physical feature or an artifact. It is to be noted that these years are marked by strong volcanic eruptions (El Chichon in 1983, Pinatubo in 1991) as well as many strong El Nino/La Nina events. In the last 20 years, the interannual variability in CTTs is weaker and the majority of the data records, including MODIS and CALIPSO, show cloud top warming.

4.2. Regional Trends in CA and CTT

Over which regions of the Earth do the CDRs agree in trends? Figure 8 and Figure 9 provide information to answer this question by showing not only the decadal trends in the individual CDRs, but also by showing the common trend coverage (CTC). The CTC shows the common regions where the CDRs agree on either increasing or decreasing trends, as well as the regions where they either do not agree or the trends are not statistically significant. While interpreting these spatial trends in the CDRs, it is important to keep in mind the programmatic, algorithmic, and configurational differences in the CDRs mentioned before. Here, we focus only on the CDRs that are predominantly AVHRR-based. The ISCCP-HGM does not satisfy the GCOS stability requirements and shows artifacts associated with the geostationary discs and is, therefore, likely not suitable for studying spatial trends (see Figure 3, Figure 4 and Figure 5).
The CTCs for cloud amount reveal interesting features regionally (Figure 8). For example, there is a good agreement in the CA trends among the three AVHRR-based CDRs in the sub-tropical and mid-latitude regions in both hemispheres, where they show a large-scale decrease in the total cloudiness. The CA decrease is stronger over the oceanic regions over these latitudes compared to the land regions. Another interesting feature is the increasing trend in CA in the Arctic, which is driven mainly by the increasing cloudiness over the regions where the sea-ice is decreasing rapidly during and just after the annual melt season in the autumn. This cloudiness increase is seen in all AVHRR-based CDRs [54]. A third interesting feature is the increasing cloudiness off the northwestern coast of South America. All three CDRs agree on the statistically significant increasing trend in this region. Interpreting this trend is, however, very difficult. This region is strongly affected by the interannual variability associated with El Nino Southern Oscillation, and the sea-surface temperatures also have net cooling trends (espcially in the first 20 years of observations). At the same time, it is important to note that the NOAA-19 satellite has suffered considerable orbital drift during its later observational period affecting not only varying diurnal sampling, but also affecting the relative partitioning of the daytime and twilight conditions that have different cloud detection sensitivity [39,49,50]. These aspects make it challening to interpret the trends over this region where the diurnal cycle of cloudiness can be strong.
The cloud amount trends in the tropical convective regions are also difficult to interpret. While CLARA-A3 and PATMOS-x agree on decreasing cloudiness over the tropical Indian and Atlantic Oceans, ESA Cloud CCI, however, shows increasing trends in the tropical Indian Ocean and also to some extent in the Atlantic. Over the tropical warm pool region in the Pacific, ESA CCI has the strongest increasing trend. While CLARA-A3 and PATMOS-x also show a slight (statistically insignificant) increase over and around Indonesia, further away from the islands, these two CDRs show a large-scale decrease, albeit very small in magnitude. It is to be noted here that while ESA CCI Cloud CDRs use data from only prime satellites, the CLARA-A3 and PATMOS-x flavours of CDRs used here are based on data from all available satellites. This makes the ESA CCI Cloud CDR more sensitive to the effects of orbital drift, especially in the tropics where the diurnal cycle of convection and associated clouds is stronger compared to mid- and high-latitude clouds. Furthermore, the thin cirrus detection sensitivity of CLARA-A3 and PATMOS-x is expected to be better compared to the ESA Cloud CCI retrieval algorithm due to rigorous training and constraints based on CALIPSO data in these two CDRs in the recent data processing rounds. These aspects can partly explain the observed differences in trends in these three CDRs over the tropical regions. In the tropical central Pacific, just below the equator, all three CDRs show a strong decrease in cloudiness. In fact, this decrease is strongest among all oceanic regions. A similar agreement in decreasing cloudiness is also observed in the central Atlantic, just off the western coast of Africa (Cape Verde Basin) and in the Gulf of Guinea (Guinea Basin).
The trends in CA over the Southern Oceans, especially over the open waters near the Antarctica, are very weak in CLARA-A3 and PATMOS-x. In a cautionary note, the users are strongly advised to use the clouds CDRs carefully in the Antarctic and surrounding regions as the uncertainties in the CDRs remain very high, especially during the polar winters.
Figure 9 shows that the CTC for cloud top temperature is considerably limited spatially compared to the CTC for cloud amount. In general, all three CDRs show increasing cloud top temperatures over the regions where these CDRs agree with regard to large-scale decreases in cloudiness (Figure 8). Over the majority of the regions, however, the CDRs either do not agree or the trends are very weak and statistically insignificant. A closer inspection of the CDRs shows that CLARA-A3 and PATMOS-x agree the most with one another, especially in the tropics. For example, both of these CDRs show a significant increase in cloud top temperatures in the central-eastern Pacific, southern Atlantic Ocean, and southern Indian Ocean. They also show statistically significant increases in cloud top temperatures over the tropical warm pool and northern Indian Ocean, including the Arabian Sea and the Bay of Bengal. Over the land regions, the trends in CTTs are quite weak, especially in the northern hemisphere.

5. Conclusions

A detailed stability assessment of the satellite-based cloud climate data records was carried out for the first time. Such an assessment was overdue, given that the CDRs are now covering the last 40 years, enabling climate change studies. The stability is defined as the trend in bias against a reference, which in our case is MODIS-Aqua. We evaluated two climate variables, namely total cloud amount and cloud top temperature.
We report that, when averaged globally, the predominantly AVHRR-based cloud CDRs (i.e., CLARA-A3, ESA Cloud CCI V3 and PATMOS-x V6) satisfy even the strictest requirements recommended by the WMO’s Global Climate Observing System. CLARA-A3 offers the most stable CDRs in global averages. A closer inspection of the spatial patterns of stability, however, reveals that PATMOS-x offers the most stable CDRs spatially. We find it very encouraging that the AVHRR-based CDRs are converging towards one another and are extremely stable in global averages. This is particularly noteworthy given their algorithmic and programmatic differences. The results suggest that the programmatic differences are more important than the algorithmic differences when evaluating the stability. For example, even though all AVHRR-based CDRs use exactly the same calibration, similar ancillary data, and rely primarily on CALIPSO to train their cloud detection algorithms, the stability of PATMOS-x and CLARA-A3 is better when the retrievals from all AVHRR sensors are used to compute Level 3 monthly means instead of relying only on prime morning or afternoon NOAA satellites. The effects of orbital drift of these satellites are minimized in this case and the resulting stability of CDR is, therefore, better.
We also, however, note that all CDRs show strong spatial variability in the stability, and there are still many regions on Earth where the CDRs do not satisfy even the most relaxed GCOS requirements. These conclusions apply to both cloud amount and cloud top temperature, suggesting that both the effects of orbital drift and cloud detection sensitivity can be of considerable importance for stability regionally where a particular cloud regime can be dominant (e.g., convection in the tropics).
Compared to the previous assessments, the global decrease in cloud amount in the recent versions of the CDRs is weaker, but still statistically significant. This decrease has been stabilizing or even reversing in the last two decades. The CDRs show strong spatial trends in CA. Statistically significant trends in CTT are observed in global averages in the AVHRR-based CDRs, but the spatial agreement in the sign and the magnitude of the trends is weaker compared to those in CA.
We also present maps of Common Stability Coverage (CSC) and Common Trend Coverage (CTC) that could provide valuable metrics to carry out an ensemble-based analysis of the CDRs. The maps of CSC show that the total coverage of areas where all CDRs are stable decreases with each subsequent addition of CDR. Only mid-latitude cloud regimes over oceans show stability across all CDRs. This applied to both CA and CTT. The maps of CTC for CA also show a good agreement among trends in the CDRs over the mid-latitude and sub-tropical regions, but the disagreements are larger over the tropical and polar regions. The common trend coverage for cloud top temperatures is smaller than for cloud amounts.

Author Contributions

Conceptualization, A.D.; formal analysis, A.D.; investigation, A.D.; writing—original draft preparation, A.D.; writing—review and editing, A.D. and K.-G.K.; visualization, A.D.; project administration, K.-G.K.; funding acquisition, A.D. and K.-G.K. All authors have read and agreed to the published version of the manuscript.

Funding

This research was funded by CM-SAF/EUMETSAT and Swedish Research Council grant number 2021-05143.

Data Availability Statement

All datasets used here are publicly available through their respective data centres. CLARA-A3 is available through: https://doi.org/10.5676/EUM_SAF_CM/CLARA_AVHRR/V003, accessed on 7 June 2023. PATMOS-x: https://www.ncei.noaa.gov/metadata/geoportal/rest/metadata/item/gov.noaa.ncdc:C00926/html, accessed on 30 July 2022. ESA Cloud CCI: https://public.satproj.klima.dwd.de/data/ESA_Cloud_CCI/CLD_PRODUCTS/v3.0/L3C/, accessed on 18 July 2022. ISCCP-HGM: https://www.ncei.noaa.gov/products/climate-data-records/cloud-properties-isccp, accessed on 21 July 2022. MODIS-Aqua: https://ladsweb.modaps.eosdis.nasa.gov/missions-and-measurements/products/MYD08_M3, accessed on 18 July 2022. CALIPSO: https://doi.org/10.5067/CALIOP/CALIPSO/LID_L3_GEWEX_Cloud-Standard-V1-00.

Acknowledgments

The authors acknowledge the EUMETSAT member states for supporting CM-SAF/EUMETSAT and the science team members of all datasets used in this study.

Conflicts of Interest

The authors declare no conflict of interest. The funders had no role in the design of the study; in the collection, analyses, or interpretation of data; in the writing of the manuscript; or in the decision to publish the results.

References

  1. Ramanathan, V.; Cess, R.D.; Harrison, E.F.; Minnis, P.; Barkstrom, B.R.; Ahmad, E.; Hartmann, D. Cloud-Radiative Forcing and Climate: Results from the Earth Radiation Budget Experiment. Science 1989, 243, 57–63. [Google Scholar] [CrossRef] [PubMed] [Green Version]
  2. Loeb, N.G.; Doelling, D.R.; Wang, H.; Su, W.; Nguyen, C.; Corbett, J.G.; Liang, L.; Mitrescu, C.; Rose, F.G.; Kato, S. Clouds and the Earth’s Radiant Energy System (CERES) Energy Balanced and Filled (EBAF) Top-of-Atmosphere (TOA) Edition-4.0 Data Product. J. Clim. 2018, 31, 895–918. [Google Scholar] [CrossRef]
  3. Tselioudis, G.; Lacis, A.A.; Rind, D.; Rossow, W.B. Potential effects of cloud optical thickness on climate warming. Nature 1993, 366, 670–672. [Google Scholar] [CrossRef]
  4. Bony, S.; Dufresne, J.-L. Marine boundary layer clouds at the heart of tropical cloud feedback uncertainties in climate models. Geophys. Res. Lett. 2005, 32. [Google Scholar] [CrossRef] [Green Version]
  5. Stephens, G.L. Cloud Feedbacks in the Climate System: A Critical Review. J. Clim. 2005, 18, 237–273. [Google Scholar] [CrossRef] [Green Version]
  6. Norris, J.R.; Allen, R.J.; Evan, A.T.; Zelinka, M.D.; O’dell, C.W.; Klein, S.A. Evidence for climate change in the satellite cloud record. Nature 2016, 536, 72–75. [Google Scholar] [CrossRef] [Green Version]
  7. Zelinka, M.D.; Zhou, C.; Klein, S.A. Insights from a refined decomposition of cloud feedbacks. Geophys. Res. Lett. 2016, 43, 9259–9269. [Google Scholar] [CrossRef]
  8. Cesana, G.V.; Del Genio, A.D. Observational constraint on cloud feedbacks suggests moderate climate sensitivity. Nat. Clim. Change 2021, 11, 213–218. [Google Scholar] [CrossRef]
  9. Ceppi, P.; Nowack, P. Observational evidence that cloud feedback amplifies global warming. Proc. Natl. Acad. Sci. USA 2021, 118, e2026290118. [Google Scholar] [CrossRef]
  10. Mülmenstädt, J.; Salzmann, M.; Kay, J.E.; Zelinka, M.D.; Ma, P.-L.; Nam, C.; Kretzschmar, J.; Hörnig, S.; Quaas, J. An underestimated negative cloud feedback from cloud lifetime changes. Nat. Clim. Change 2021, 11, 508–513. [Google Scholar] [CrossRef]
  11. Myers, T.A.; Scott, R.C.; Zelinka, M.D.; Klein, S.A.; Norris, J.R.; Caldwell, P.M. Observational constraints on low cloud feedback reduce uncertainty of climate sensitivity. Nat. Clim. Change 2021, 11, 501–507. [Google Scholar] [CrossRef]
  12. Schiro, K.A.; Su, H.; Ahmed, F.; Dai, N.; Singer, C.E.; Gentine, P.; Elsaesser, G.S.; Jiang, J.H.; Choi, Y.-S.; Neelin, J.D. Model spread in tropical low cloud feedback tied to overturning circulation response to warming. Nat. Commun. 2022, 13, 7119. [Google Scholar] [CrossRef]
  13. Zelinka, M.D.; Klein, S.A.; Qin, Y.; Myers, T.A. Evaluating Climate Models’ Cloud Feedbacks Against Expert Judgment. J. Geophys. Res. Atmos. 2022, 127, e2021JD035198. [Google Scholar] [CrossRef]
  14. Del Genio, A.D.; Kovari, W.; Yao, W.S.; Jonas, J. Cumulus microphysics and climate sensitivity. J. Clim. 2005, 18, 2376–2387. [Google Scholar] [CrossRef] [Green Version]
  15. Langen, P.L.; Caballero, R. Cloud variability, radiative forcing and meridional temperature gradients in a general circulation model. Tellus A 2007, 59, 641–649. [Google Scholar] [CrossRef]
  16. Klein, S.A.; Zhang, Y.; Zelinka, M.D.; Pincus, R.; Boyle, J.; Gleckler, P.J. Are climate model simulations of clouds improving? J. Geophys. Res. Atmos. 2013, 118, 1329–1342. [Google Scholar] [CrossRef]
  17. Eastman, R.; Warren, S.G. A 39-Yr Survey of Cloud Changes from Land Stations Worldwide 1971–2009: Long-Term Trends, Relation to Aerosols, and Expansion of the Tropical Belt. J. Clim. 2013, 26, 1286–1303. [Google Scholar] [CrossRef]
  18. Rossow, W.B.; Schiffer, R.A. Advances in understanding clouds from ISCCP. Bull. Am. Meteorol. Soc. 1999, 80, 2261–2287. [Google Scholar] [CrossRef]
  19. Li, W.; Schumacher, C.; McFarlane, S.A. Radiative heating of the ISCCP upper level cloud regimes and its impact on the large-scale tropical circulation. J. Geophys. Res. Atmos. 2013, 118, 592–604. [Google Scholar] [CrossRef]
  20. Shepherd, T.G. Atmospheric circulation as a source of uncertainty in climate change projections. Nat. Geosci. 2014, 7, 703–708. [Google Scholar] [CrossRef]
  21. Sherwood, S.C.; Bony, S.; Dufresne, J.-L. Spread in model climate sensitivity traced to atmospheric convective mixing. Nature 2014, 505, 37–42. [Google Scholar] [CrossRef] [PubMed]
  22. Bony, S.; Stevens, B.; Frierson, D.M.W.; Jakob, C.; Kageyama, M.; Pincus, R.; Shepherd, T.G.; Sherwood, S.C.; Siebesma, A.P.; Sobel, A.H.; et al. Clouds, circulation and climate sensitivity. Nat. Geosci. 2015, 8, 261–268. [Google Scholar] [CrossRef] [Green Version]
  23. Brient, F.; Schneider, T. Constraints on climate sensitivity from space-based measurements of low-cloud reflection. J. Clim. 2016, 29, 5821–5835. [Google Scholar] [CrossRef]
  24. Cronin, T.W.; Wing, A.A. Clouds, circulation, and climate sensitivity in a radiative-convective equilibrium channel model. J. Adv. Model. Earth Syst. 2017, 9, 2883–2905. [Google Scholar] [CrossRef] [Green Version]
  25. Ham, S.-H.; Kato, S.; Rose, F.G.; Winker, D.; L’Ecuyer, T.; Mace, G.G.; Painemal, D.; Sun-Mack, S.; Chen, Y.; Miller, W.F. Cloud occurrences and cloud radiative effects (CREs) from CERES-CALIPSO-CloudSat-MODIS (CCCM) and CloudSat radar-lidar (RL) products. J. Geophys. Res. Atmos. 2017, 122, 8852–8884. [Google Scholar] [CrossRef]
  26. Daloz, A.S.; Nelson, E.; L’ecuyer, T.; Rapp, A.D.; Sun, L. Assessing the Coupled Influences of Clouds on the Atmospheric Energy and Water Cycles in Reanalyses with A-Train Observations. J. Clim. 2018, 31, 8241–8264. [Google Scholar] [CrossRef]
  27. Thomas, M.A.; Devasthale, A.; Koenigk, T.; Wyser, K.; Roberts, M.; Roberts, C.; Lohmann, K. A statistical and process-oriented evaluation of cloud radiative effects in high-resolution global models. Geosci. Model Dev. 2019, 12, 1679–1702. [Google Scholar] [CrossRef] [Green Version]
  28. Fueglistaler, S. Observational evidence for two modes of coupling between sea surface temperatures, tropospheric temperature profile, and shortwave cloud radiative effect in the tropics. Geophys. Res. Lett. 2019, 46, 9890–9898. [Google Scholar] [CrossRef]
  29. Zelinka, M.D.; Myers, T.A.; McCoy, D.T.; Po-Chedley, S.; Caldwell, P.M.; Ceppi, P.; Klein, S.A.; Taylor, K.E. Causes of higher climate sensitivity in CMIP6 models. Geophys. Res. Lett. 2020, 47, e2019GL085782. [Google Scholar] [CrossRef] [Green Version]
  30. Rossow, W.B. 2022: History of the International Satellite Cloud Climatology Project; WCRP Report 6/2022; World Climate Research Programme (WCRP): Geneva, Switzerland, 2022; p. 87. [Google Scholar] [CrossRef]
  31. Schiffer, R.A.; Rossow, W.B. The International Satellite Cloud Climatology Project (ISCCP): The first project of the World Climate Research Programme. Bull. Am. Meteorol. Soc. 1983, 64, 779–784. [Google Scholar] [CrossRef] [Green Version]
  32. Heidinger, A.K.; Foster, M.J.; Walther, A.; Zhao, X. The Pathfinder Atmospheres–Extended AVHRR Climate Dataset. Bull. Am. Meteorol. Soc. 2013, 95, 909–922. [Google Scholar] [CrossRef]
  33. Schulz, J.; Albert, P.; Behr, H.-D.; Caprion, D.; Deneke, H.; Dewitte, S.; Dürr, B.; Fuchs, P.; Gratzki, A.; Hechler, P.; et al. Operational climate monitoring from space: The EUMETSAT Satellite Application Facility on Climate Monitoring (CM-SAF). Atmos. Chem. Phys. 2009, 9, 1687–1709. [Google Scholar] [CrossRef] [Green Version]
  34. Karlsson, K.-G.; Anttila, K.; Trentmann, J.; Stengel, M.; Meirink, J.F.; Devasthale, A.; Hanschmann, T.; Kothe, S.; Jääskeläinen, E.; Sedlar, J.; et al. CLARA-A2: The second edition of the CM SAF cloud and radiation data record from 34 years of global AVHRR data. Atmos. Chem. Phys. 2017, 17, 5809–5828. [Google Scholar] [CrossRef] [Green Version]
  35. Stengel, M.; Stapelberg, S.; Sus, O.; Schlundt, C.; Poulsen, C.; Thomas, G.; Christensen, M.; Henken, C.C.; Preusker, R.; Fischer, J.; et al. Cloud property datasets retrieved from AVHRR, MODIS, AATSR and MERIS in the framework of the Cloud_cci project. Earth Syst. Sci. Data 2017, 9, 881–904. [Google Scholar] [CrossRef] [Green Version]
  36. Platnick, S.; Meyer, K.G.; King, M.D.; Wind, G.; Amarasinghe, N.; Marchant, B.; Arnold, G.T.; Zhang, Z.; Hubanks, P.A.; Holz, R.E.; et al. The MODIS Cloud Optical and Microphysical Products: Collection 6 Updates and Examples from Terra and Aqua. IEEE Trans. Geosci. Remote Sens. 2017, 55, 502–525. [Google Scholar] [CrossRef] [PubMed] [Green Version]
  37. Stephens, G.; Winker, D.; Pelon, J.; Trepte, C.; Vane, D.; Yuhas, C.; L’ecuyer, T.; Lebsock, M. CloudSat and CALIPSO within the A-Train: Ten years of actively observing the earth system. Bull. Am. Meteorol. Soc. 2018, 99, 569–581. [Google Scholar] [CrossRef] [Green Version]
  38. The 2022 GCOS ECV Requirements: GCOS-245. 2022, pp. 1–244. Available online: https://library.wmo.int/index.php?lvl=notice_display&id=22135 (accessed on 7 November 2022).
  39. Karlsson, K.-G.; Stengel, M.; Meirink, J.F.; Riihelä, A.; Trentmann, J.; Akkermans, T.; Stein, D.; Devasthale, A.; Eliasson, S.; Johansson, E.; et al. CLARA-A3: The third edition of the AVHRR-based CM SAF climate data record on clouds, radiation and surface albedo covering the period 1979 to 2023. Earth Syst. Sci. Data Discuss. 2023; in review. [Google Scholar] [CrossRef]
  40. Stengel, M.; Stapelberg, S.; Sus, O.; Finkensieper, S.; Würzler, B.; Philipp, D.; Hollmann, R.; Poulsen, C.; Christensen, M.; McGarragh, G. Cloud_cci Advanced Very High Resolution Radiometer post meridiem (AVHRR-PM) dataset version 3: 35-year climatology of global cloud and radiation properties. Earth Syst. Sci. Data 2020, 12, 41–60. [Google Scholar] [CrossRef] [Green Version]
  41. Foster, M.J.; Phillips, C.; Heidinger, A.K.; Borbas, E.E.; Li, Y.; Menzel, W.P.; Walther, A.; Weisz, E. PATMOS-x Version 6.0: 40 Years of Merged AVHRR and HIRS Global Cloud Data. J. Clim. 2022, 36, 1143–1160. [Google Scholar] [CrossRef]
  42. Young, A.H.; Knapp, K.R.; Inamdar, A.; Hankins, W.; Rossow, W.B. The International Satellite Cloud Climatology Project H-Series climate data record product. Earth Syst. Sci. Data 2018, 10, 583–593. [Google Scholar] [CrossRef] [Green Version]
  43. Karlsson, K.-G.; Devasthale, A. Inter-Comparison and Evaluation of the Four Longest Satellite-Derived Cloud Climate Data Records: CLARA-A2, ESA Cloud CCI V3, ISCCP-HGM, and PATMOS-x. Remote Sens. 2018, 10, 1567. [Google Scholar] [CrossRef] [Green Version]
  44. Stubenrauch, C.J.; Rossow, W.B.; Kinne, S.; Ackerman, S.; Cesana, G.; Chepfer, H.; Di Girolamo, L.; Getzewich, B.; Guignard, A.; Heidinger, A.; et al. Assessment of global cloud datasets from satellites: Project and Database initiated by the GEWEX Radiation Panel. Bull. Am. Meteorol. Soc. 2013, 94, 1031–1049. [Google Scholar] [CrossRef]
  45. Xiong, X.; Butler, J.J. MODIS and VIIRS Calibration History and Future Outlook. Remote Sens. 2020, 12, 2523. [Google Scholar] [CrossRef]
  46. Sun, J.; Angal, A.; Xiong, X.; Chen, H.; Geng, X.; Wu, A.; Choi, T.; Chu, M. MODIS reflective solar bands calibration improvements in Collection 6. In Proceedings of the SPIE Asia-Pacific Remote Sensing, Kyoto, Japan, 29 October–11 January 2012; p. 85280N. [Google Scholar] [CrossRef]
  47. Frey, R.A.; Ackerman, S.A.; Holz, R.E.; Dutcher, S.; Griffith, Z. The Continuity MODIS-VIIRS Cloud Mask. Remote Sens. 2020, 12, 3334. [Google Scholar] [CrossRef]
  48. Yue, Q.; Kahn, B.H.; Fetzer, E.J.; Wong, S.; Frey, R.; Meyer, K.G. On the response of MODIS cloud coverage to global mean surface air temperature. J. Geophys. Res. Atmos. 2017, 122, 966–979. [Google Scholar] [CrossRef]
  49. Karlsson, K.-G.; Håkansson, N. Characterization of AVHRR global cloud detection sensitivity based on CALIPSO-CALIOP cloud optical thickness information: Demonstration of results based on the CM SAF CLARA-A2 climate data record. Atmos. Meas. Tech. 2018, 11, 633–649. [Google Scholar] [CrossRef] [Green Version]
  50. Karlsson, K.-G.; Devasthale, A.; Eliasson, S. Global Cloudiness and Cloud Top Information from AVHRR in the 42-Year CLARA-A3 Climate Data Record Covering the Period 1979–2020. Remote Sens. 2023, 15, 3044. [Google Scholar] [CrossRef]
  51. Håkansson, N.; Adok, C.; Thoss, A.; Scheirer, R.; Hörnquist, S. Neural network cloud top pressure and height for MODIS. Atmos. Meas. Tech. 2018, 11, 3177–3196. [Google Scholar] [CrossRef] [Green Version]
  52. Devasthale, A.; Karlsson, K.-G.; Quaas, J.; Grassl, H. Correcting orbital drift signal in the time series of AVHRR derived convective cloud fraction using rotated empirical orthogonal function. Atmos. Meas. Tech. 2012, 5, 267–273. [Google Scholar] [CrossRef] [Green Version]
  53. Evan, A.T.; Heidinger, A.K.; Vimont, D.J. Arguments against a physical long-term trend in global ISCCP cloud amounts. Geophys. Res. Lett. 2007, 34. [Google Scholar] [CrossRef]
  54. Devasthale, A.; Sedlar, J.; Tjernström, M.; Kokhanovsky, A. A Climatological Overview of Arctic Clouds. In Physics and Chemistry of the Arctic Atmosphere; Springer Polar Sciences; Kokhanovsky, A., Tomasi, C., Eds.; Springer: Cham, Switzerland, 2020. [Google Scholar] [CrossRef]
Figure 1. Stability of global mean total cloud amount. The monthly mean biases against MODIS-Aqua are shown together with trends in the bias. The blue, green, and yellow envelopes show the goal, breakthrough, and threshold stability requirements recommended by the WMO’s GCOS.
Remotesensing 15 03819 g001
Figure 2. Same as in Figure 1, but for cloud top temperature. The monthly mean biases against MODIS-Aqua are shown together with trends in the bias. The blue, green, and yellow envelopes show the goal, breakthrough, and threshold stability requirements recommended by the WMO’s GCOS.
Remotesensing 15 03819 g002
Figure 3. Spatial patterns of the stability of cloud amount (% per decade, left column), and the right column shows which regions satisfy the GCOS stability requirements in question.
Remotesensing 15 03819 g003
Figure 4. Spatial patterns of the stability of cloud top temperature (K per decade, left column), and the right column shows which regions satisfy the GCOS stability requirements in question.
Remotesensing 15 03819 g004
Figure 5. Common Stability Coverage (CSC) for cloud amount (left column) and cloud top temperature (right column) showing the regions where different combinations of the cloud CDRs simultaneously satisfy at least the threshold requirements recommended by the GCOS.
Remotesensing 15 03819 g005
Figure 6. De-seasonalized anomalies of global mean total cloud amount (%) derived from four cloud CDRs as well as from MODIS-Aqua and CALIPSO. The trends in CLARA-A3, PATMOS-x, ESA-CCI, ISCCP-HGM are −0.76%, −0.28%, −0.82% and −1.47% per decade, respectively. All trends are statistically significant based on Mann Kendall test.
Remotesensing 15 03819 g006
Figure 7. De-seasonalized anomalies of global mean cloud top temperature (K) derived from four cloud CDRs as well as from MODIS-Aqua and CALIPSO. The trends in CLARA-A3, PATMOS-x, ESA-CCI, ISCCP-HGM are −0.17, −0.32, 0.56 and 0.055 Kelvin per decade, respectively. All trends are statistically significant except in the case of ISCCP-HGM.
Remotesensing 15 03819 g007
Figure 8. Trends in total cloud amount (%/decade) in the three predominantly AVHRR-based CDRs. The Common Trend Coverage (CTC) shows the regions where all three CDRs simultaneously show either increasing or decreasing trends that are statistically significant. The white areas in CTC show the regions where the CDRs either do not agree on the sign of the trend or the trend is insignificant.
Remotesensing 15 03819 g008
Figure 9. Same as in Figure 8, but for cloud top temperature. The trends are in Kelvin per decade.
Remotesensing 15 03819 g009
Table 1. Stability requirements recommended by the WMO’s GCOS (GCOS-245, 2022).
Requirement LevelCA (% Per Decade)CTT (K Per Decade)
Goal0.30.2
Breakthrough0.60.4
Threshold1.20.8
Disclaimer/Publisher’s Note: The statements, opinions and data contained in all publications are solely those of the individual author(s) and contributor(s) and not of MDPI and/or the editor(s). MDPI and/or the editor(s) disclaim responsibility for any injury to people or property resulting from any ideas, methods, instructions or products referred to in the content.

