Article

An Updated Estimate of Geocenter Variation from Analysis of SLR Data

Center for Space Research, University of Texas at Austin, Austin, TX 78759-5321, USA
Remote Sens. 2024, 16(7), 1189; https://doi.org/10.3390/rs16071189
Submission received: 18 February 2024 / Revised: 15 March 2024 / Accepted: 16 March 2024 / Published: 28 March 2024
(This article belongs to the Special Issue Space-Geodetic Techniques II)

Abstract

:
The Earth’s center of mass (CM) is defined in satellite orbit dynamics as the center of mass of the entire Earth system, including the solid Earth, oceans, cryosphere, and atmosphere. The CM can be realized using the vector from the origin of the International Terrestrial Reference Frame (ITRF) to the CM, and directly estimated from satellite laser ranging (SLR) data. In previous studies and ITRF translations, SLR observations were assumed to contain only a constant, systematic, station-dependent bias. This treatment leads to a difference of a few mm between the SLR results and other estimates, such as GPS-based global inversions. We show that the difference cannot be attributed to the deficiency of the distribution of SLR tracking stations but is due to the impact of a significant surface-loading-induced seasonal signal captured in the laser range measurement (appearing in station range bias) during the traveling of the laser light pulse. The errors in the modeling of the troposphere zenith delay considerably impact the determination of geocenter motion from SLR data. The SLR-data-derived geocenter motion becomes comparable to the global inversion results when the range biases and thermosphere delay for SLR tracking stations in the SLR network are adjusted as part of the monthly solution.

1. Introduction

The origin of the Terrestrial Reference System (TRS) is a fundamental concept for all studies of the geosciences, and it is of critical importance for satellite navigation and the realization of the Terrestrial Reference System, as well as for the application of the GRACE-derived time-varying gravity field for Earth system dynamics and the global climate-change-induced mass redistribution on the Earth’s surface. Since Trupin et al. [1], the subject of geocenter motion has received significant attention. Numerous papers have been published and presented on ‘geocenter variations’ estimated from SLR data, and GPS-based global inversion or from combination of the ocean-bottom pressure measurements with GRACE’s monthly gravity solution [2,3,4,5,6]. The SLR technique produces estimates of the geocenter motion at monthly or weekly time scales [7,8,9,10]. The geocenter motion was also estimated from GRACE precise orbit determination (POD) using GPS tracking data [11,12,13]. The estimates of the annual variations are consistent with those of various SLR analyses. However, there is a significant difference between the SLR technique and the GPS-based global inversion with the ocean bottom pressure data combined with GRACE gravity solutions. Since only ~30 stations tracked five geodetic satellites at monthly intervals from 1992 to 2023, the difference was incorrectly attributed to a deficiency in the distribution of SLR tracking stations. Although the difference was reduced by adjusting the station range bias or station height, there are still questions about the actual cause of the difference, and what is the nature of the removed signal (appearing in estimated station range biases and corrections to station height) that allows to separate the geocenter variation (or degree one loading signal) from the SLR measurements based on the distribution of the ~30 tracking stations. Is there a seasonal signal captured in the SLR measurements during laser pulse traveling? To address these questions, a review is required for the principle of the SLR technique, as well as measurement models for measuring the gravity and surface deformations of the Earth. The goal of this paper was to theoretically understand the difference that is important for geodynamic and geodetic applications.
This paper reviews a basic theory of geocenter motion (for the entire Earth, comprising the solid earth and thin fluid layers) determined from SLR data and the surface-loading-induced displacements of the tracking stations for GPS-based global inversions. SLR measurement models (laser range bias and the tropospheric zenith delay) and the round-trip tracking are reviewed in Section 3. The time series of monthly solutions will be derived through estimating geocenter parameters along with adjusting the range bias, station height, or tropospheric zenith delay. Section 3.2 analyzes the seasonal signals for the estimated range bias (or station height), atmospheric troposphere delay, and gradients appearing in the time series of the monthly solutions. Section 3.3 evaluates the effects of a higher-degree loading-induced station displacement. Section 3.4 presents the seasonal variation in the estimated geocenter obtained from the same monthly solution. Section 4 compares the new estimates of the geocenter variations from multi-satellite SLR data with the results from the International Laser Ranging Service (ILRS) SLR network translation solutions [8,14], the global inversion from a three-dimensional displacement of GPS stations [4,5], and an operational model (TN13) based on the monthly GRACE gravity solutions combined with an ocean model output [15] or geophysical models [16,17]. A summary is presented in Section 5.

2. Theory

2.1. Definition of Geocenter Motion

The coordinates of the Center of Mass of Earth (CM) in the adopted reference system are equivalent to the degree one (unnormalized) spherical harmonic coefficients C10, C11, and S11. The geocenter vector from the origin of the reference system to the true center of mass (CM) is calculated as follows:
r c m = 1 M E ( x e x + y e y + z e z ) d m = a e ( C 11 , S 11 , C 10 )
where M is the mass of the Earth; ae is the Earth’s radius; ( e x , e y , e z ) are the unit vectors along the three axes of the reference system; x, y, z are the direction cosine of the position vector of a point mass dm within the Earth from the origin of the reference system. The degree one spherical harmonic coefficients C10, C11, and S11 represent the global mass distribution determined by a volume integral enveloping the entire Earth system [18,19].
The degree one harmonics will be exactly zero when a reference frame is precisely located at the center of mass. The origin of the geocentric inertial reference frame used for high-accuracy satellite orbit determination is typically chosen to coincide with the CM. As a classical definition, the geocenter vector represents the offset between the origin of the International Terrestrial Reference Frame (ITRF) and the instantaneous CM and is denoted as CM-CN [19]. Several centers of mass definitions were introduced by Blewitt [20]; however, only CM and the ITRF origin (CN) are accessible. In the literature studying the geocenter variations, the CN is denoted as the center or origin of the selected reference frame. With improvements in the determination of the ITRF, like the ITRF2014 and ITRF2020, the term CM-CN is used to represent the seasonal variation in the origin of the ITRF’s long-term frame regarding the quasi-instantaneous Earth CM, a point around which an artificial satellite is naturally orbiting [8].
According to its mass density, the Earth is composed of a solid core and a thin fluid layer. The volume integral over the entire Earth for the degree one spherical harmonic coefficients (i.e., Equation (1)) can be mathematically expressed as the sum of a volume integral for the solid Earth with a total mass of M, and a surface integral for the fluid thin layer (with a thickness of h << ae, within which the mass is free to be redistributed) with a total mass of Mf. Correspondingly, the geocenter vector can be defined using the mass balance equation: ( M e + M f ) r m = M e r c m s + M f r c m f . Vector r c m s represents the coordinate of the center of mass of the deformed solid Earth without the fluid load and surface deformation from the tides [1]. Vector r c m f from the surface integral represents the coordinate of the center of mass of the fluid thin layer over a deformed Earth surface in response to the tidal and non-tidal mass redistribution. This is also referred to as the loading center of mass, r c m f , in the literature, which can be expressed by the degree one, dimensionless, normalized spherical harmonic coefficients: σ 1 m c and σ 1 m s (Equation (9) of the surface density changes; Wahr et al. [21]). Furthermore, the thickness of the atmosphere is of the order of ~0.002 compared to the mean radius of the Earth, and the effects of the origin difference are negligible for the vector r c m l as the center of mass of the load. Both vectors r c m s and r c m f are presented with respect to the origin of the selected reference frame, such as ITRF2014 [14]. The mass-redistribution-induced changes in r c m are referred as geocenter motions and denoted as ∆ r c m . Several approaches were reported to determine the variations in ∆ r c m , such as the GPS station-displacement-related global inversions.

2.2. Surface Loading and GPS Global Inversion

Based on the loading theory, the changes in the surface mass loading deform the Earth’s surface, cause a modulation of the mass loading center, and also produce an additional potential defined by the product of the loading potential and the load Love number [19].
The response of the elastic sphere solid Earth to the surface mass redistribution (load) results in the displacement of the local astronomical system (vertical and horizontal). Based on Farrell’s loading theory [22], the displacement vector(s) for a tracking site is determined as follows:
s ( φ , λ ) = 4 π a e 3 M e l = 0 m = 0 l q = c s σ l m q 2 l + 1 [ h l Y ¯ l m q e r + l l ( Y ¯ l m q φ e φ + 1 c o s φ Y ¯ l m q λ e λ ) ]
where ae is the mean Earth’s radius; Me is the Earth’s mass; h l   and l l are the vertical and horizontal surface displacement load Love numbers. σ l m c and σ l m s are the dimensionless, normalized, spherical harmonic coefficients of surface density. Y ¯ l m c = P ¯ l m ( s i n φ ) c o s m λ   and   Y ¯ l m s = P ¯ l m ( s i n φ ) s i n m λ .   The   P ¯ l m ( s i n φ ) are the fully normalized Legendre polynomial functions. e r , e φ and e λ are the unit spherical coordinate vectors along the vertical and horizontal directions (east–west and north–south).
The loading-induced center of the surface mass on the deformed solid Earth surface can be represented by the globally averaged displacement denoted as r c m d (obtained by the global integration of Equation (2) over the entire Earth’s surface).
Trupin et al. [1] placed the CM at the center of the solid Earth (no matter where this is) by setting the vector r c m s to be zero, which makes, ( M e + M l ) r c m = M l r c m l   ,   such that the r c m can be completely determined by the mass loading center r c m l or r c m = r c m l . Thus, the r c m l   and r c m d   are with respect to the center of the solid Earth. The shift in the Earth’s center of mass for the fluid thin layer due to changes in the loading-induced displacement on the Earth’s surface can be expressed in terms of degree one coefficients. These are presented in Equation (10) of Trupin et al. [1], as follows:
Δ r c m = r c m l r c m d = 1 4 π s s ( ϕ , λ ) d S = a e ρ w 3 ρ e ( h 1 + 2 l 1 ) ( σ 11 c e x + σ 11 s e y + σ 10 c e z )
where ρw is the density of water; ρe is the average mean density of the solid Earth; r c m d is only ~2% of r c m l with the factor of ( h l + 2 l l ) / 2 using the value of the Loading Love number [22]. r c m   is used instead of r c m l in the Equation (10) of Trupin et al. [1].
Trupin et al. [1] used their observation of melting glaciers to infer the surface density changes represented by the normalized spherical harmonic coefficients, σ l m c and σ l m s . Blewitt [20] proposed using observations of the loading-induced surface displacement vector, s , such as the GPS-determined three-dimensional displacements for a dense network. The global inversion technique was developed [4,5,23] based on the site displacements of the GPS network and the ocean-bottom pressure (OBP) model (describing the density changes over the ocean or the displacements of the ocean floor) combined with the GRACE-data-derived geoid changes for two degrees and above. In brief, the degree-one, higher-degree and higher-order spherical harmonic coefficients of the density as the unknown parameter in state x can be estimated using the observation equation [23], as follows:
yGPS = Hx + e
where yGPS is the observation vector consisting of the displacements of GPS sites s k ( φ , λ ) and GRACE-determined gravity coefficient. Vector e refers to an error vector; H is the matrix determined from the spherical harmonic functions Y ¯ l m c ,   Y ¯ l m s   and their partial derivatives with respect to the latitude and longitude expressed in Equation (2). This technique is commonly called global inversion in the literature. Essentially, the geocenter signal (represented by the degree one loading coefficient used in Equation (3)) derived from this technique is extracted or isolated from the loading-induced surface displacement of the station network using the weighting function as the product of the degree one loading love number ( h 1 and l 1 ), with Y ¯ 1 m c   and Y ¯ 1 m s   and their partial derivatives. It is clear that the geographic distribution of tracking sites is critical when forming the observation vector yGPS and H matrix to estimate the degree one coefficients. The center of the global inversion is called the center of the figure (CF), even though the current global GPS network (most stations are located in Western Europe and North America) represents only a small portion of the surface of the solid Earth, with little information about displacements of the ocean floor.
There is no information for the degree one loading from the GRACE data. The surface density changes in continental areas are inferred from the variations in the high-degree field from the monthly GRACE solutions. Swenson et al. [2] proposed a global inversion for the geocenter variations based on a combination of the monthly GRACE fields and the ocean model output or geophysical models [3]. This solution is operationally produced (from the available GRACE solutions) and provided as the product of GRACE Technical Note 13 [15] located at https://podaac.jpl.nasa.gov/gravity/gracefo-documentation.

3. Determination of the Geocenter Variations Obtained Using SLR

3.1. Method

SLR is currently the best means of obtaining precise and unambiguous range measurements for various passive geodetic satellites, and this accurate range information allows the for determination of even very small gravitational forces acting on the satellites. Geocenter motion is usually not modeled in the precise orbit determination of SLR data analysis, and this signal will remain in the residuals of laser ranging observations, though the orbit can, to a lesser or greater extent, accommodate the unmolded geocenter motion [24].
The approach used by Cheng et al. [9] is to directly estimate the geocenter vector in the linearized observation equation, y = Hx + e, which is similar to Equation (4). The observation vector is denoted as ySLR. The state vector x consists of three components of the geocenter r c m , the satellite position and velocity vectors at the epoch of the orbit arcs, and the measurement and force parameters, including a set of low-degree geopotential coefficients. The matrix H contains the partial derivatives of the range measurement with respect to the r c m (see Equation (5)) and the dynamic parameters. Thus, this technique is referred to as the dynamic approach. The observation vector ySLR consists of the laser ranging residual, ∆ρ = ρ o ρ c , denoting the difference between the computed and measured ranges, which link a satellite (which orbits around the center of mass of the Earth system) and the tracking sites (which obtain the origin of the crust-fixed International Terrestrial Reference Frame (ITRF)). ∆ρ contains information regarding the climate-related surface mass loading-induced station displacements and geocenter variations, as shown in Equation (5). Here, observation vector ySLR depends on the ground track of the satellites, which are well distributed on the Earth surface, as discussed in Section 3.3.
The computed slant ranging vector, ρ c ( t ) , is based on the following geometric relation:
ρ c ( t ) = r ( t ) R s ( t ) + r c m ( t )
R s ( t ) = R s ( t 0 ) + ( t t 0 ) · V s ( t 0 ) + δ R s ( t )
where r is the position vector of the satellite related to the Earth’s mass center and determined by integrating Newton’s equations into a non-rotating geocentric reference frame. Vector r c m is the geocenter vector from the origin of the ITRF to the CM (identical to the vector described in the IERS conventions [25]). Vectors r and ρ c ( t ) are expressed in the Earth-body-fixed system. R s ( t ) is the position vector of a tracking site with respect to the ITRF, as defined in Equation (6), where t0 is the epoch defined in the ITRF solution for the station position R s ( t 0 ) and velocity V s ( t 0 ) , and δ R s   represents the corrections, including the effects of the solid Earth tide, solid Earth pole tides, and ocean loading. Additionally, the climate-related surface-mass-induced displacements of a tracking site are determined, which are unmodeled in the current SLR analysis for precise orbit determination (POD). The errors in the station coordinates and tide-related models in the orbit determination will result in an error in ρ c . The full spectrum of surface-mass-loading-induced Earth surface deformations resulting in station displacements and changes in r c m is presented, based on Equation (2). Thus, the estimate of r c m derived from the SLR residual Δ ρ = ρ o ρ c will contain not only degree one loading effects but will also contain higher degree effects. This is the primary cause of the difference in the estimates of the geocenter motion from SLR- and GPS displacement-based global inversion, where only degree one loading is extracted based on Equations (3) and (4).
The computed range measurements are obtained using ρ c ( t ) = | r ( t ) R s ( t ) | for a tracking site (station) after applying any known station-dependent range and/or time bias. If the partial derivatives of the range measurement with respect to r c m are computed for the k-th tracking station (denoted as, ρ / r c m k ), vector r c m k reflects the displacement ( Δ R k ) that is to be estimated. Accumulating the partials from all the tracking stations, the estimated r c m (in this study) represents the vector from the origin of the ITRF to the CM (CN-CM).
The geocenter motion was also reported simultaneously, estimating the geocenter vector and the correction of the station’s height. In this case, the partial of the range measurement with respect to station height ( ρ / h k ) was obtained from the transformation of ρ / r c m k from a Cartesian (X-Y-Z) coordinate system to a spherical coordinate system (ENU). Thus, the surface-loading-induced signal is divided into a change in the geocenter vector and the station height with an additional constraint applied as will be shown in the next section.

3.2. SLR Range Bias, Atmospheric Troposphere Delay, and Gradients

The SLR system measures the two-way Time-of-Flight (TOF) between a pulse emitted from the laser transmitter at the ground station (denoted as the uplink) and the reception of the pulse returned from the on-board Laser Retro-reflector Array (LRA) on the orbiting satellite (denoted as the down link). The TOF can be multiplied by the speed of light to determine the round-trip distance in meters. The time-interval counter records the two-way distance with cm-level precision, and by combining multiple returns into a Normal Point (NP), sub-cm precision can be obtained. The ranging observations are obtained from the two-way range, after several corrections are applied as follows:
ρ o ( t ) = ρ 2 w a y 2 + Δ a Δ C o M + R b + Δ G R + Δ ε
where ∆ε is the unknown random error. This ranging algorithm forming the NP based on the ρ 2 w a y / 2 assumes that the TOF for the up path (link) and down path is the same. However, the satellite continues to move, and displacement of the tracking station also occurs when the laser pulse is in flight. Furthermore, the TOFs for point-ahead (up path) and point-behind (down path) can show differences ranging from a few milliseconds for Low-Earth-Orbit (LEO) satellites to a sizeable fraction of a second for GPS satellites and Global Navigation Satellite System (GLONASS) satellites [26]. The difference between the TOFs could appear as bias due to the surface-loading-induced station displacement and perturbations to the satellite orbit and will be retained in the ranging measurement through the treatment of ρ 2 w a y / 2 . A detailed analysis is out of the scope of this paper, as it would require accurate timing information from an onboard device (clock or oscillation), such as GPS-35 and 36, or GRACE and GRACE-FO. The corrections (in current SLR data processing) include (1) atmosphere correction ∆a (including the tropospheric wet/dry delay) (more detail will be provided in Section 3.2.2), (2) the center of mass offset (∆CoM) between the LRA and the satellite’s center of mass, (3) the relativistic light–time correction (GR), and (4) a station-dependent systematic range bias (Rb) that may be known or pre-estimated. A time bias may also be applied to the observation time tag. Among these corrections, only the range bias and tropospheric zenith wet/dry delay could be climate (or meteorological)-related phenomena and are a particular concern in this study.

3.2.1. Seasonal Variations in SLR Range Bias

The range bias Rb is considered to represent the uncorrected systematic errors in calibration and/or synchronization procedures, hardware malfunctioning, nonlinearities in the time-of-flight measurement devices, as well as other modeling deficiencies, such as the ability to accurately refer the range measurements to the center of mass of the spacecraft [26,27]. The nonlinearities of the range measurement could be the effects of signal propagation through the troposphere and surface-mass-loading-induced displacements of the tracking site. The averaged station pass range bias Rb was found to range from a few mm to 1 cm or more in the analysis of the residual time series for Lageos-1 over the period from January 2002 to December 2022. A significant fluctuation appears in the estimated range bias from LAGEOS-1 and LAGEOS-2 obtained by the official ILRS ACs and their combination (ILRSA) [27]. Figure 1 shows the monthly estimates of the range bias (Rb) for station 7090 from five satellites (Starlette, Ajisai, Stella, LAGEOS-1, and LAGEOS-2), where the Rb with superscript * denote the range bias is obtained without estimating the geocenter variation. A significant seasonal signature is observed for most of stations; for example, the annual amplitude is 4.5 mm for station 7090 and 4.6 mm for station 7941, and the largest amplitude of 9.7 mm was obtained for station 7249 from the least square fit to the monthly series of range bias estimates. This indicates that the seasonal loading signals were captured in the SLR measurements. Consequently, the ranging measurements cannot be considered as constant, as in previous studies using SLR analysis. At present, adjusting the station-dependent range bias is standard in SLR data analysis for various applications.

3.2.2. Tropospheric Zenith Delay and Gradients

The unpredictable occurrence of meteorological readings at SLR sites may lead to biased records or a deterioration in their quality over time and can result in the wrong troposphere corrections being applied to SLR observations [28]. Part of the estimated station range bias or station height may absorb the effects caused by deficiencies in the model regarding the atmospheric delay that occurs in response to the seasonal variations in temperature and the pressure of the tracking stations. The tropospheric zenith delay is modeled based on the 2010 IERS Conventions [25] as follows:
D L = ( z d + Δ z ) M m p f ( z ) + m g ( e ) ( G N cos ( A ) + G E sin ( A ) )
where the zd is the tropospheric zenith delay (with a correction ∆z) from the model of Mendes [29] based on the model of Saastamoinen [30] and Marini and Murray [31]. Mmpf (z) is the mapping function of Mendes and Pavlis [32,33]. Similar to the model for VLBI, the GN and GE are the north and east components of the first-order horizontal gradients in the atmosphere for azimuth A; mg(e) is the mapping function given by Chen and Herring [34]. The model for the horizontal gradients is not available for SLR analysis. In addition, the Mendes–Pavlis’s mapping function was developed assuming full symmetry of the atmosphere above the station. Recent studies show that the best results are obtained by including the atmospheric azimuthal asymmetry of atmospheric refractivity [35] with higher-order horizontal gradients [36]. Drozdzewski et al. [37] showed that the modeling of the azimuthal asymmetry for the first-order horizontal gradient (Equation (4)); Drozdzewski et al. [37]) has a systematic effect on SLR-derived products, such the geocenter coordinates (up to 0.2 mm of annual amplitude), as well as the station and pole coordinates. Drozdzewski and Sosnica [28] showed that the troposphere delay correction (of the Mendes/Pavlis model) can be retrieved from SLR observations.
The time series of solutions were determined directly from the SLR data over a time interval of one calendar month from five geodetic satellites, including Starlette, Ajisai, Stella, and LAGEOS 1 and 2. Three components of the geocenter’s motion, Δ r c m , were estimated with the laser range bias, the zenith delay (∆z), and the horizontal gradients (hg: GN and GE) for all stations in the monthly solution. The amplitude and phase were obtained from the least square fit to monthly time series over the period from January 1993 to December 2023. Table 1 compares the annual amplitude and phase for the 7090 from the solutions of the following cases: (1) estimate Rb only; (2) simultaneously estimate Rb, ∆z, and hg (horizontal gradients, GN and GE); (3) estimate Rb and hg; (4) estimate Rb and ∆z; (5) estimate only ∆z and hg; (6) estimate the station height (Up), ∆z, and hg when a 1.0 cm constraint is applied, where * indicates the amplitude and phase for the station height (Up). The seasonal variation (annual) in the geocenter estimated for all cases will be presented in Section 3.4.
Figure 1 shows the seasonal signals appearing in the time series of the estimated range bias, ∆z, and the horizontal gradients (hg) from Case 2, as presented in Table 1 for station 7090. The annual signal in Rb from Case 1 is smaller by 41% than that from Case 2 because the phase difference of ~180° (as shown in Figure 1) results from a cancelation of Rb and troposphere delays (∆z) (this can also be seen in Case 4). The effect of the horizontal gradients is rather small, as shown in Figure 1. It is only ~2% of Rb (8.11 mm), but the amplitude of Rb increases by 9%, from 8.11 mm to 9.29 mm, without the need to adjust the hg (GN and GE), in Case 4. However, the annual amplitude of the estimated Rb is significantly reduced by ~24%, from 8.11 mm to 4.43 mm, in Case 3 when ∆z (which represents a mismodeling of the troposphere delay) was estimated without adjusting hg. Thus, the effects of surface loading on the range bias could be ~8.11 mm, as shown in Case 2. The ∆z and hg in Case 6, shown in Table 1, are estimated, along with an adjustment to station height with a 1 cm constraint applied. The values for ∆z and hg are in agreement with those in Case 2. The annual amplitude and phase for Up will be 6.53/352 without adjusting the ∆z and hg for station height. In any case, ∆z and hg could be separated from the surface-loading-induced change in the station height as well as the range bias. Thus, the estimated station height using only SLR data or the ITRF2020 solution may contain the signals from the errors in the modeling of troposphere delay and the horizontal gradients.
In summary, errors in the modeling of tropospheric delay can lead to a significant SLR rang bias (if only the range bias is adjusted) or variations in station height. These effects cannot be ignored in the determination of geocenter variation.

3.2.3. High-Degree Surface-Loading-Induced Station Displacement

Based on Farrell’s loading theory [22], surface density changes (or anomalies) will result in the three-dimensional displacement of a station, represented by vector   s ( φ , λ ) , which can be evaluated based on Equation (2) with the density coefficients obtained from the gravitational coefficients of the GRACE gravity solution based on the work of Wahr et al. [21]. The global distribution of the amplitude of the annual variations in the surface deformations due to the high-degree (>1) loading from the GRACE monthly solutions with a size of 60 × 60, with 300 km smoothing, were investigated for the period from 2003 to December 2016. Large-scale annual variation occurred over the Amazon, Himalayas, Africa, Greenland, and Russia. The maximum amplitude is estimated to be ~18, 3, 2 mm for the vertical displacement Sr and the horizontal displacement Sφ and Sλ, respectively. The amplitude of annual variation is estimated to be in the order of 1 or 2 mm for vertical displacement and ~0.5 mm for horizontal displacement for the 192 stations in the SLR network. The seasonal signal measured by GRACE is expected to represent the true load effects of a high degree (>1) on the stations. Table 2 shows the annual amplitude and phase for the displacement in the local east, north, and vertical up (ENU) for station 7090, computed using the CSR GRACE monthly solution. Assuming Rb is zero or piecewise constant, a correction of the station height is also estimated with or without geocenter parameters (X, Y and Z) from the SLR data of five satellites over the period from January 2002 to December 2022, with a 1- or 10-mm constraint applied. The solution is denoted as SLR (1) and SLR (10), and SLR (10*) where the superscript * refers to the solution with 10-mm constraint applied but without estimating geocenter parameters shown in Table 2. The results are compared with the seasonal variations for station 7090, estimated using the ITRF2020 solution [8].
As shown in Table 2, the amplitude of the annual variation in the height (up) is in general agreement with the uncertainty between the ITRF2020 solution and the estimate in this study, with a 1 mm constraint. However, the estimated station height will be 8 mm and 335° when the constraint is increased to 10 mm. An evaluation of the annual geocenter variation suggests that a 1 mm constraint is too small, but the results obtained with a 10 mm constraint may be comparable, as shown in the next section.
The monthly range bias should still be adjusted as a test to obtain a comparable solution of geocenter variation with the GPS-based global inversion when the ITRF2020 seasonal estimates are applied to the tracking station in SLR data analysis. This suggests that the seasonal signal in stations estimated from ITRF2020 cannot fully account for the observed seasonal signal appearing in range bias.
The estimated height of 6.52 mm from a 10 mm constraint in the case where the geocenter was not estimated can be considered to represent the total signal of the surface-mass-loading-induced variation in station height derived from SLR, which consists of (1) the degree one loading signal (denoted as Hgs), (2) the high-degree (>1) loading signal (denoted as Hds), and (3) the seasonal signal remaining in the SLR laser ranging residuals (denoted as Hres). The ratio of ~27% (1.77/6.52) represents the contribution of the seasonal change in the station height to the high-degree surface-loading-induced three-dimensional displacement. The difference of −1.46 mm (6.52–7.98) between the estimated station height with and without estimating geocenter parameters could represent the effect of the degree one surface-mass-loading-induced variation of ~22% of the station height. Thus, ~50% of the estimated station height is unexplained in the case where the Rb is assumed to be constant (in full or piecewise) and the effects of the model errors on tropospheric delay are negligible. A large part of this unexplained signal or residual can only be attributed to the seasonal signal recorded in the SLR ranging measurements during the laser pulse flight and are characterized by the seasonal signal in the estimated range bias, since the SLR links between the satellite and the tracking station are both are in moving. Thus, the separation of the degree one mass loading from SLR and additional parameters (such as the range bias or station height with a constraint) are required to account for ~78% of the SLR residual. As shown in Table 2, additional information is required to justify whether the applied constraint is appropriate in this approach by estimating the geocenter along with the station height. However, the constraint is not necessary in the case by estimating the range bias.

3.3. Satellite Ground Track

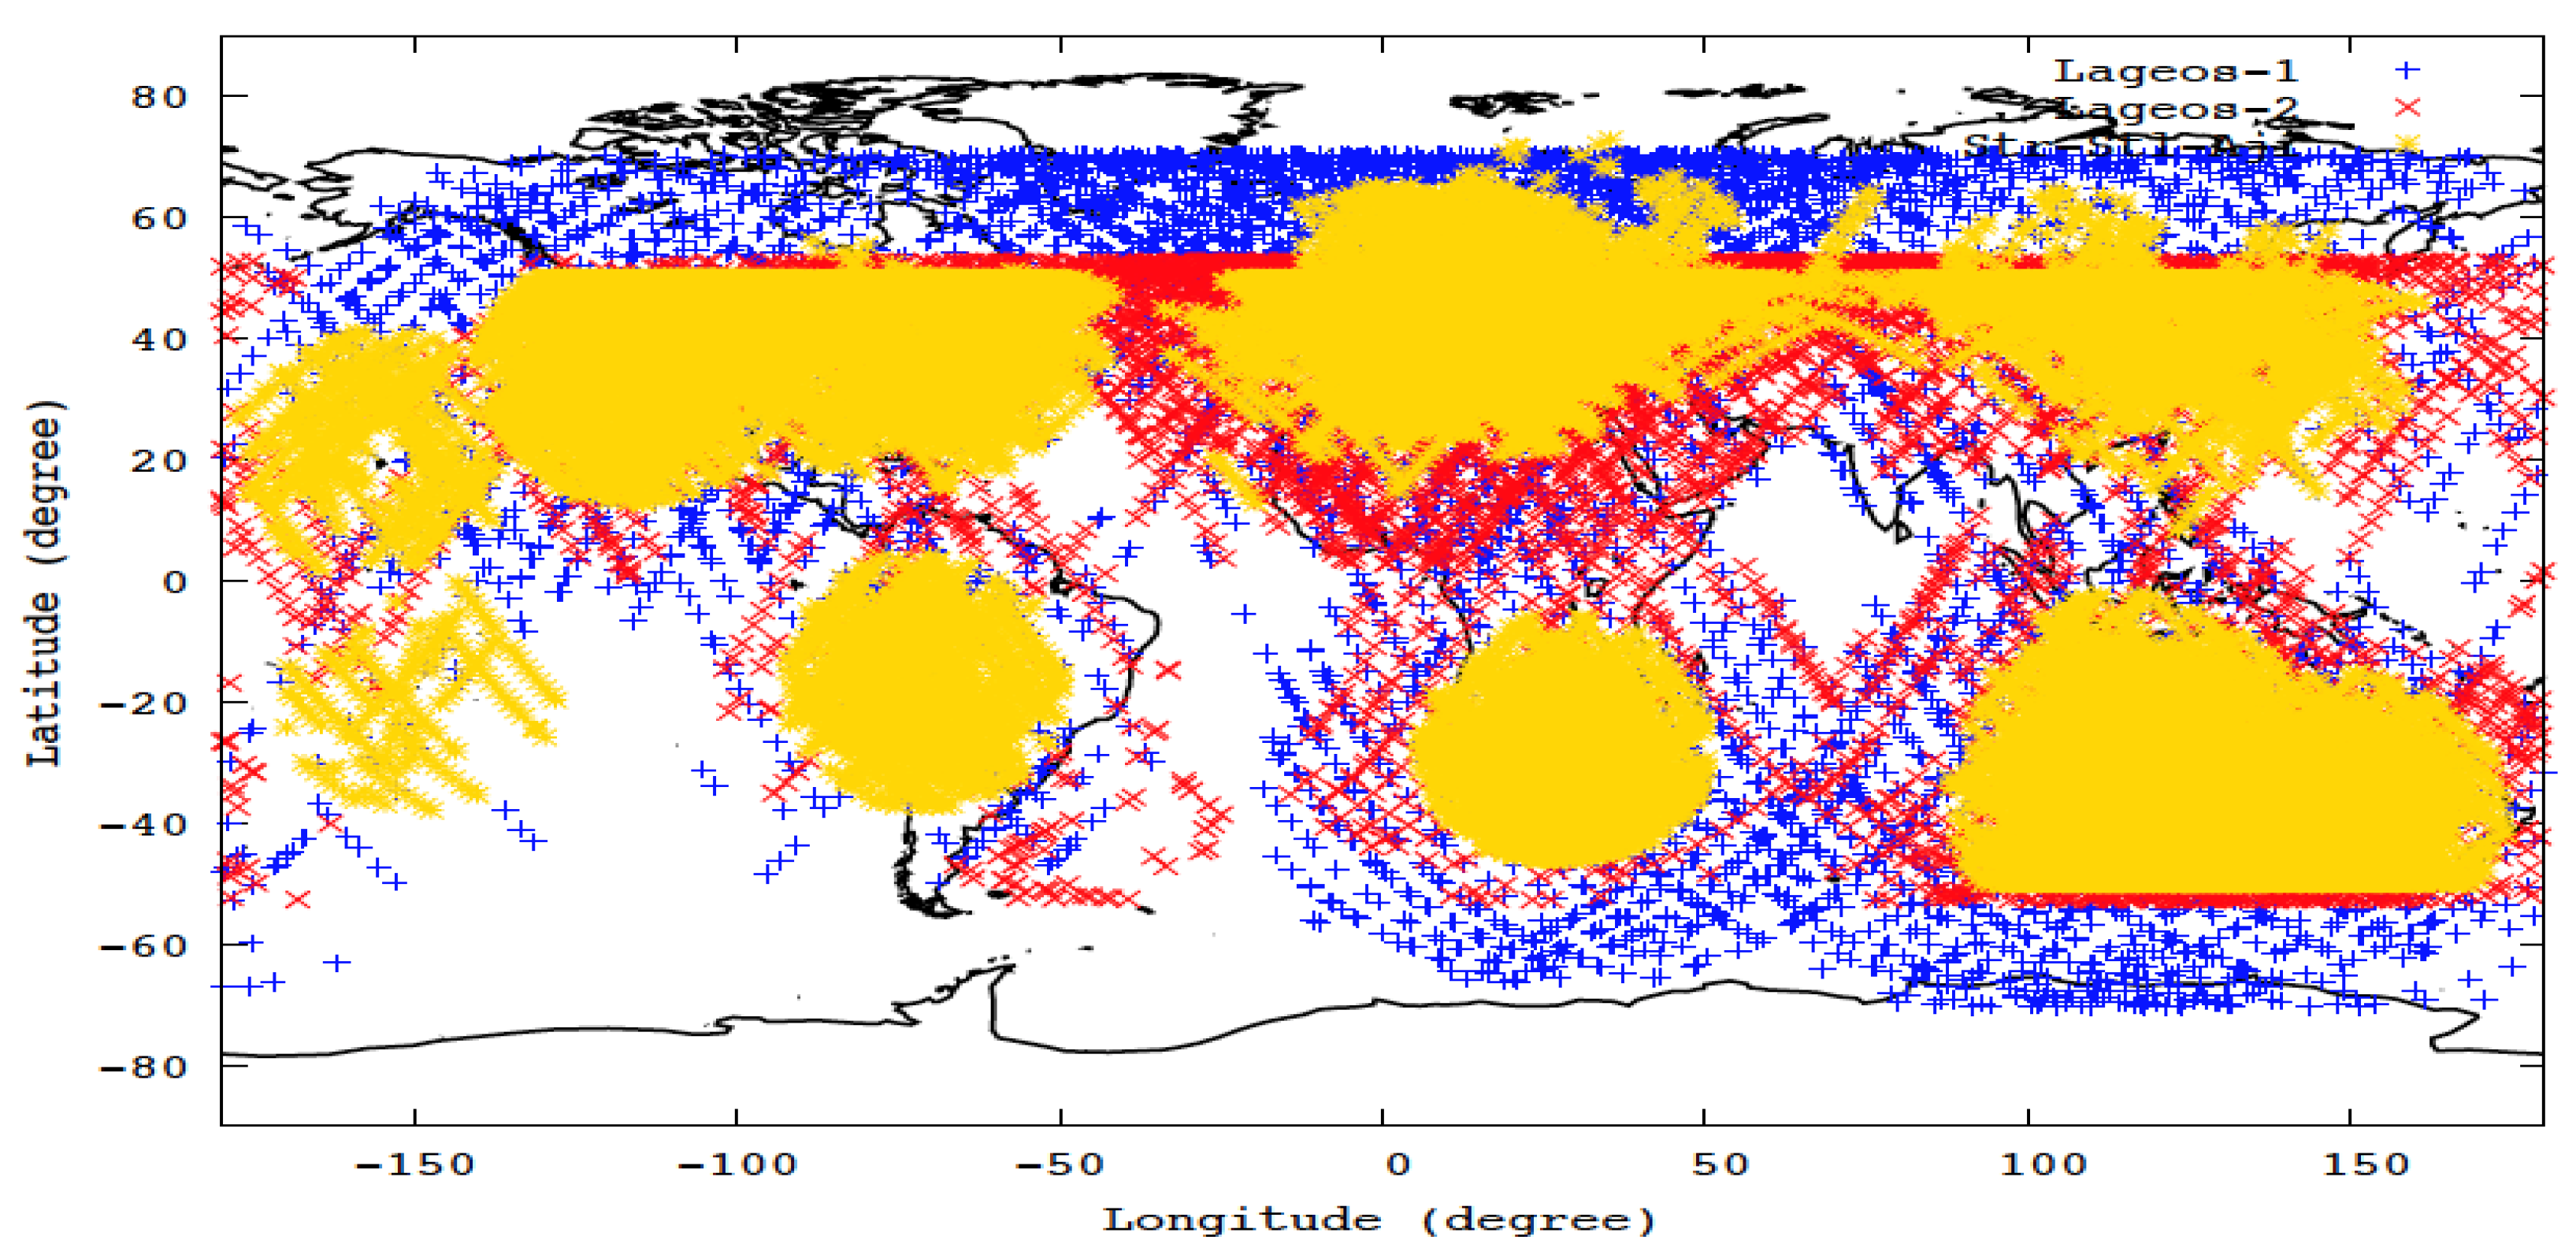
The approach used to directly estimate the geocenter vector is based on observation vector ySLR (in the linearized observation equation y = Hx + ε) represented by the residuals of the SLR tracking data. The accuracy of the estimated state vector x and orbit fitting depends on the temporal and spatial distribution of observations, in addition to the modeling of forcing and measurements to determine the orbit. The spatial distribution of the SLR data is described by the satellite ground track, which is a set of points (in a path) from the vertical projection of the satellite’s orbit onto the surface of the Earth. The satellite traces the surface movements of the Earth along the ground track through a slant laser ranging tracking. Those surface movements result in the displacement of the station position (resulting in the geocenter variation) and produce perturbation in the satellite’s orbit. Although the number of SLR tracking stations (compared with those in the GPS tracking network) is limited and only a segment of a ground track can be obtained for each tracking station, the paths or suborbital points (from the SLR network tracking to multiple satellites) cover much of the continents, especially around coastal areas within the latitude range ±70°, as shown in Figure 2, for August 2015. The monthly SLR tracking data contain ~46,000 observations and ~4400 passes from the five satellites. Thus, it is misleading to mistrust the SLR-derived geocenter motion based on the limited geographic distribution of the SLR network and the Global Inversion strategy of yGPS, which strongly depend on the geographic distribution of the stations.

3.4. Solution to Geocenter Variation from SLR

The solution strategy and methodology follow the discussion presented by Cheng et al. [9]. A new time series of solutions was estimated directly from the SLR data over the time interval of one calendar month from five geodetic satellites, including Starlette, Ajisai, Stella, and LAGEOS 1 and 2. Three components of the geocenter motion, r c m , the laser range bias for all stations, and the lower portion of the gravity field up to five degrees were directly estimated from the SLR data, along with the satellite state vector (3-day arc) and other dynamic parameters, including 12 h CD or CT. This approach provides a unified recovery of the gravity signals obtained from SLR data. The station positions are fixed to the values of ITRF2014 used in this study.
As discussed in Section 3.2, the geocenter coordinates were simultaneously estimated along with the station range bias (or station height) and atmosphere correction terms ∆z, GN, and GE (representing the atmosphere horizontal gradients) for all of the stations (tracking the satellites during the corresponding month) for each monthly interval. The annual amplitude and phase for these parameters from the solutions of six cases are shown in Table 1. The solution for the geocenter variation from the same time series of monthly solutions in six cases is analyzed and presented as follows.
Table 3 compares the annual amplitude and phase (Ψ) for the geocenter variations from the least squares fit to the time series of monthly solutions in different cases by adjusting different combinations of parameters; 1–5 cases are defined in Table 1 in Section 3.2.2. The geocenter coordinates are also estimated, along with the station height (Up) in Cases (6) and (7) with a constraint of 1 or 15 mm applied to all tracking stations. The solutions in Cases 8 and 9 are obtained by estimating the geocenter parameter (X, Y and Z) and the station height (Up) (with a 15 mm constraint applied), along with the zenith delay (∆z) (in Case 8), or estimating Up, ∆z, GN, and GE (in Case 9).
As shown in Table 3, the difference in the amplitude of geocenter variation is less than 0.1 mm for the Y and Z components from Cases 1 and 2, which implies that the effect is small for the geocenter variation; however, this leads to a large Rb, derived from estimations of ∆z and hg (horizontal gradient correction). as seen in Case 5 in Table 3. This may suggest that the contributions from individual ∆z and hg had canceled each other, and this resulted in the phase difference. The smallest amplitude for the X and Z components was obtained in Case 3 without adjusting the hg, or ignoring the contribution of the hg to the seasonal signal in the laser ranging residual, which results in a larger Rb and ∆z, as shown in Case 4 in Table 1, where a significant part of the seasonal signal is absorbed by the Rb and ∆z based on Equations (7) and (8). However, the annual amplitude is increased in the geocenter if the hg (GN and GE) is also adjusted, as shown in Cases 2 and 4. Without adjusting ∆z, the seasonal signal from ∆z could be absorbed by other parameters, resulting in a large signal in the geocenter, but a small Rb, as shown in Case 3 in Table 2. Comparing the results in Cases 2 and 3, a significant difference appears in the geocenter solutions obtained with and without adjusting the parameters of hg, although the signal of hg is smaller than that of Rb and ∆z, as shown in Table 1. An improved model of horizontal gradients is required for the SLR technique. At present, the average, with the difference presented as the uncertainty, is recommended for the geocenter solution based on the solution from Cases 2 and 3 in Table 3.
In the case where the correction of station height is adjusted, a part of the high-degree seasonal signal may be absorbed by the geocenter parameters in the case where a 1 mm constraint is applied, which results in a large annual amplitude of geocenter motion being obtained for the X and Z components. The application of a 10 mm constraint can lead to a better separation of the degree one mass-loading-induced geocenter motion. The annual amplitude will be reduced by 0.07 mm for the X component and 0.12 mm for the Z component if a 25 mm constraint is applied. The results in Cases 8 and 9, estimating ∆z or ∆z + hg (GN and GE) along with the station height, are comparable to the solutions in Cases 2 and 3, where no constraint is required for estimating the station range bias. The general agreement between Case 2 and Case 9 further suggests that the origin of the seasonal signal in the estimated range bias is the surface loading (including the high-degree mass loading) because the station direction of up is directly related to the surface loading change in station height, as discussed in Section 3.2.3.
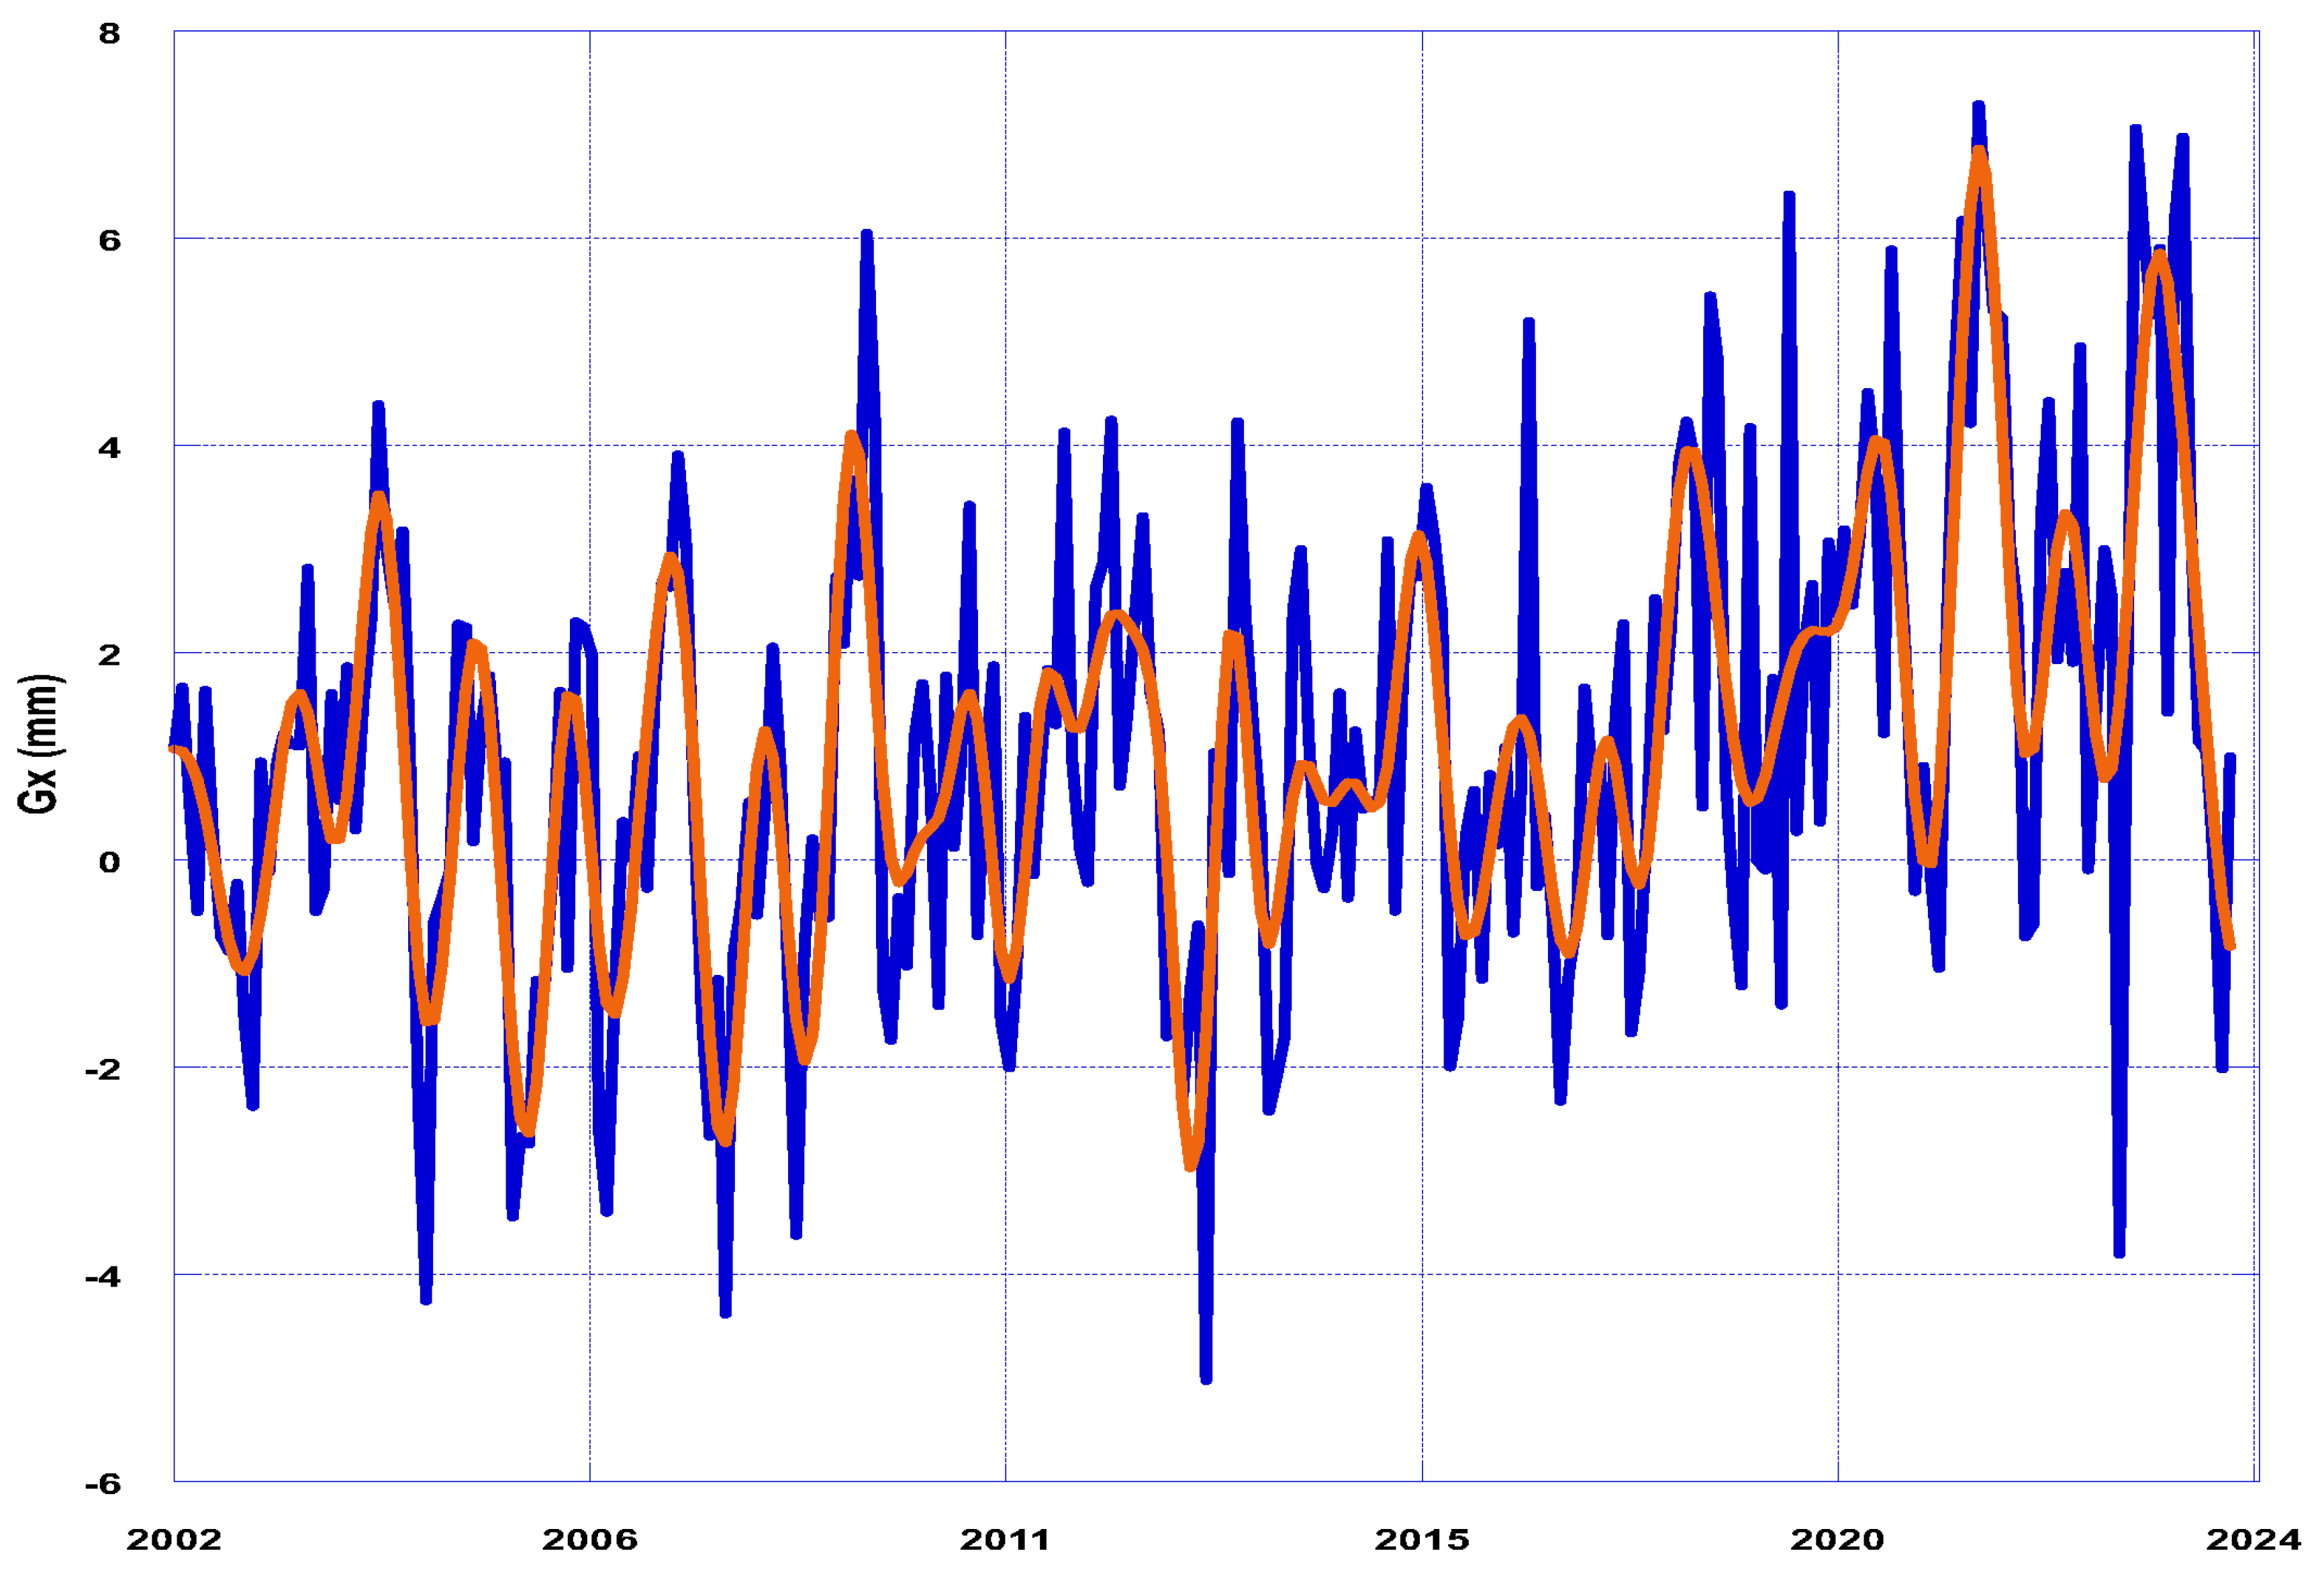
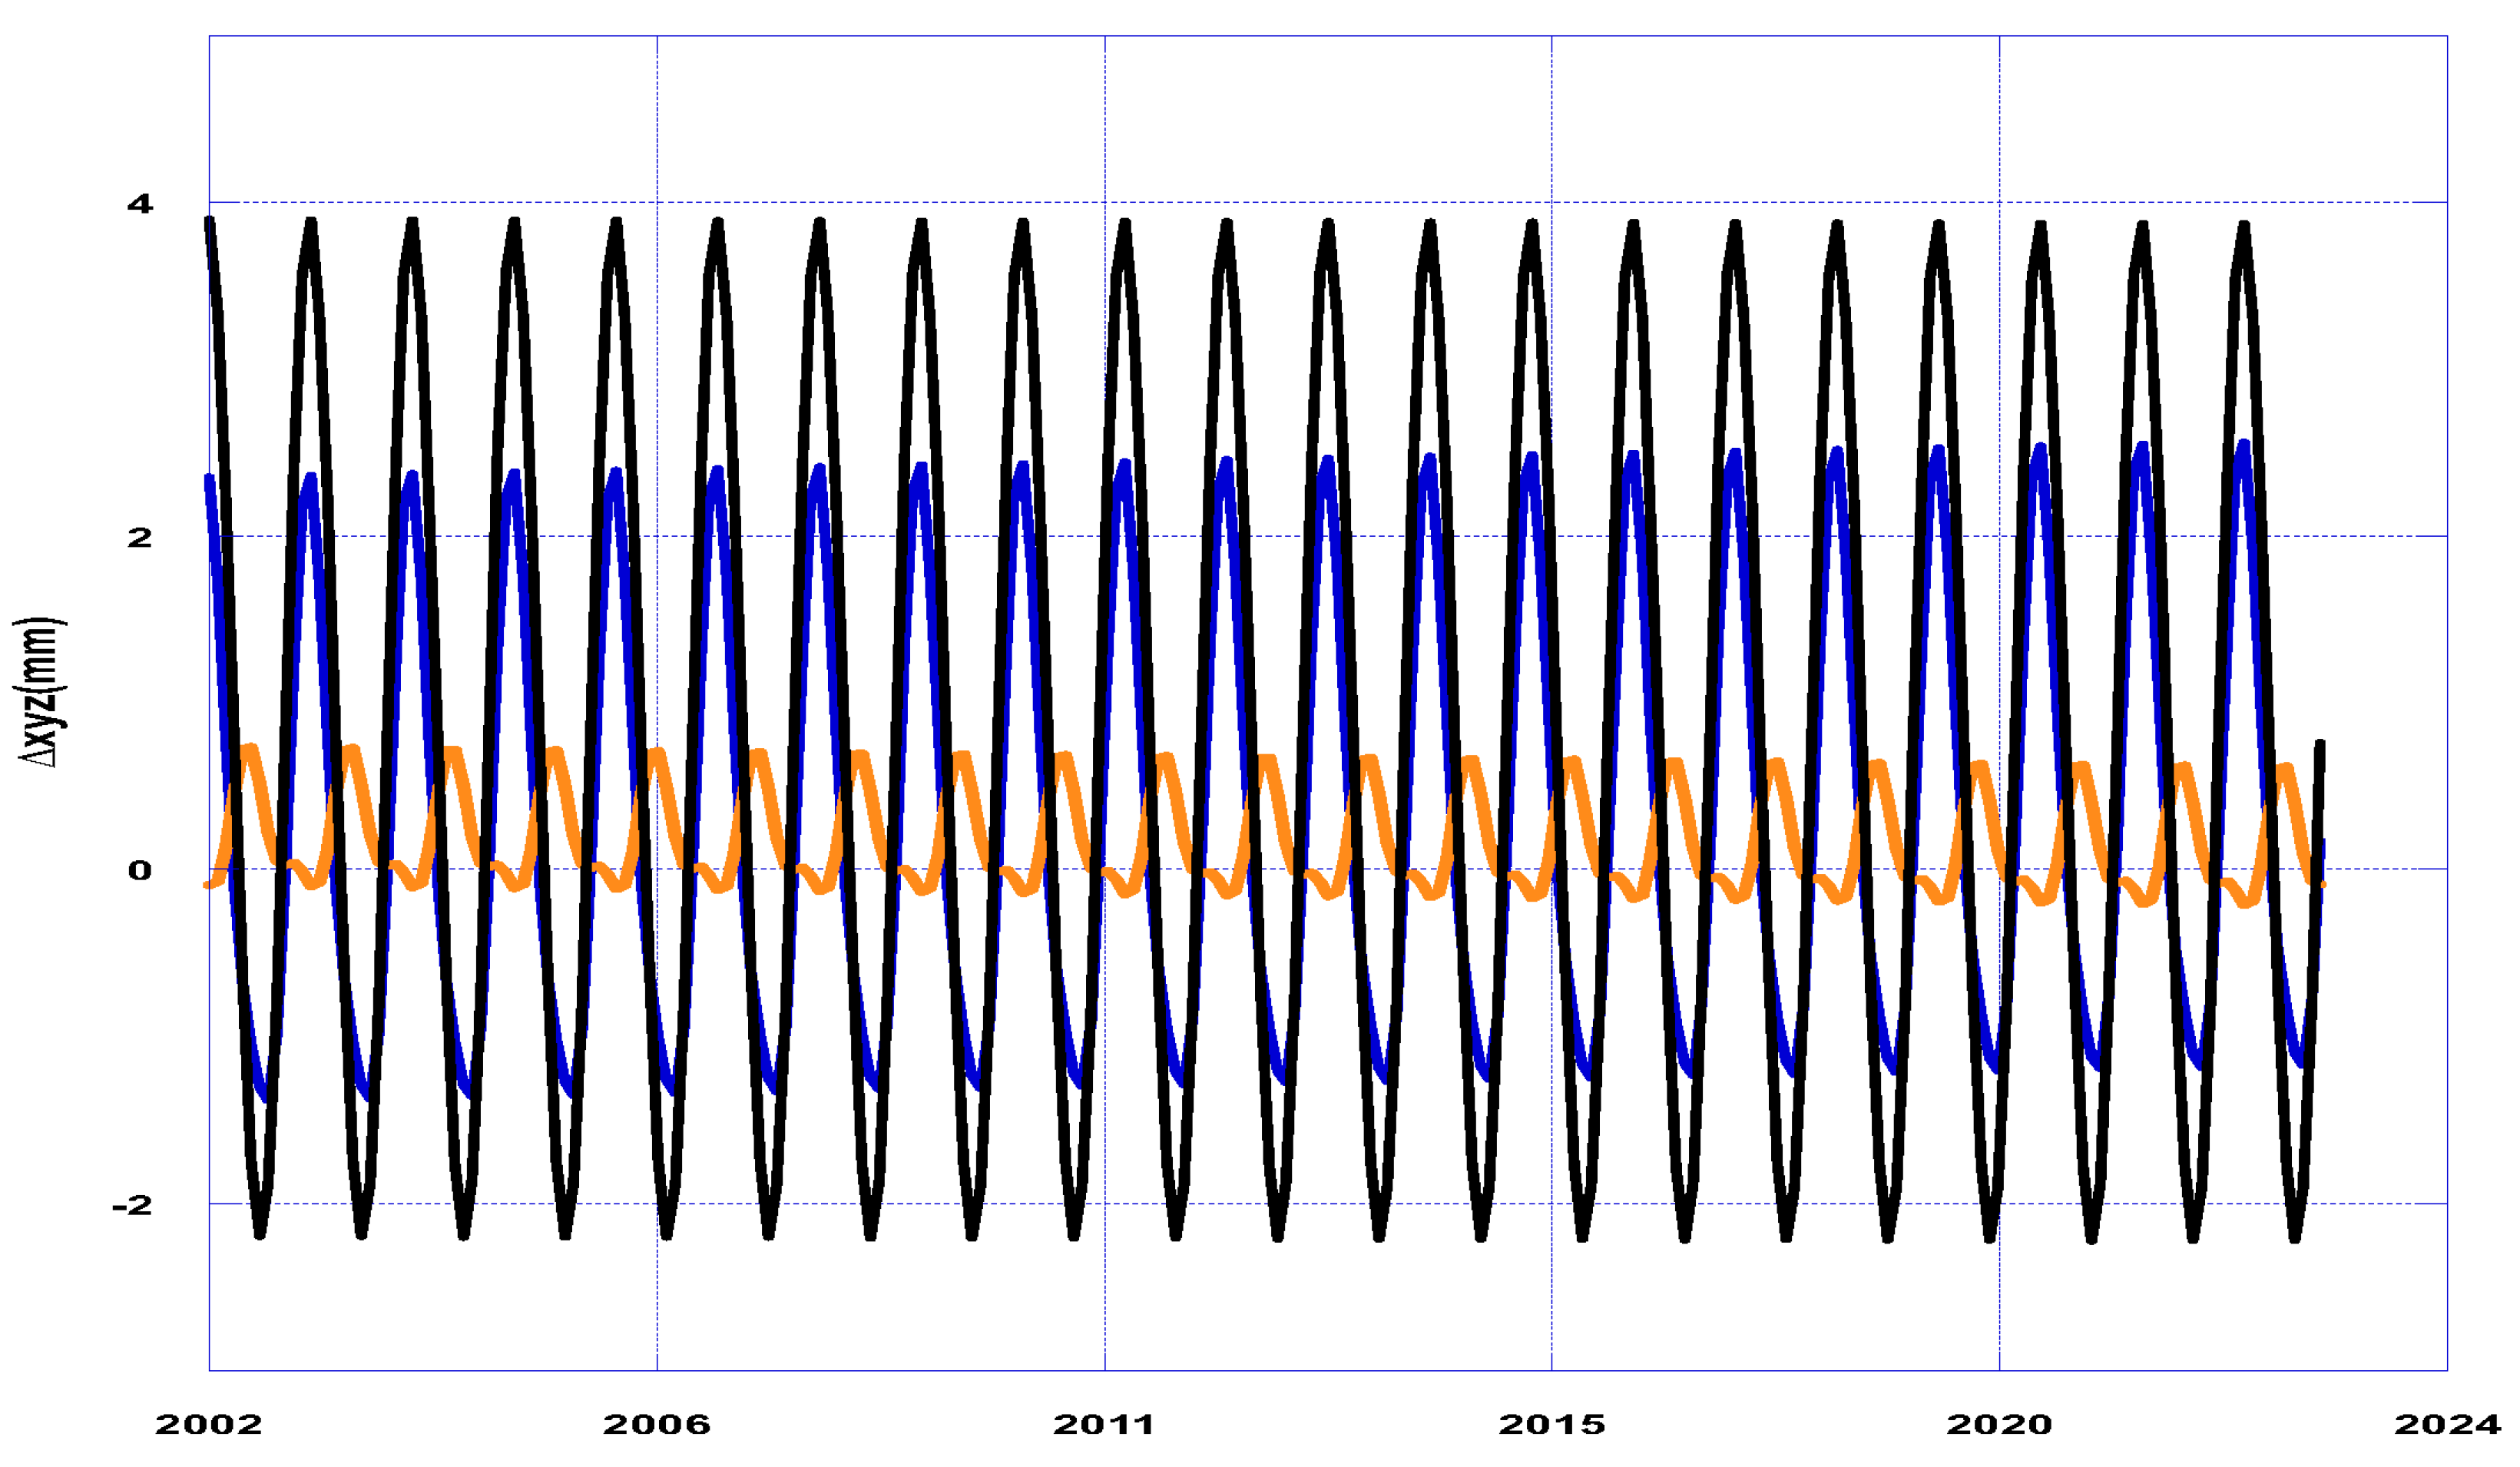
Figure 3, Figure 4 and Figure 5 show the monthly estimates obtained for three components of the geocenter variations from the SLR data by adjusting the station range bias and the thermosphere zenith delay on a monthly basis. A solution for the monthly geocenter was determined by estimating the station range bias globally or over the entire period, as discussed by Cheng et al. [9]. Figure 6 shows the annual and semi-annual fit for the difference between two solutions for the X, Y, and Z components. A considerable signal appears in the difference between the X and Z components. For example, the annual amplitude is estimated to be ~1.7 mm for the X component, ~0.4 mm for the Y component, and ~3.6 mm for the z component. These differences represent the seasonal signals (including the high degree loading effects) recorded in the SLR measurements during laser pulse traveling. These effects can be accommodated by adjusting monthly range biases (Rb) and the correction of tropospheric zenith delay (∆z), or a combination of these (∆z and hg), for the SLR tracking stations and can be considered as the kinematic effects that are required for SLR to be distinguished from the degree-one mass-loading-induced variation.

4. Comparison and Discussion

As discussed in Section 3.4, the amplitude and phase of the geocenter solution will be different when using different combinations of the parameters, including the station range bias (or the station height with the 15 mm constraint applied), atmospheric troposphere delay, and gradients from an analysis of the SLR data of five satellites. In the following comparison, a solution, denoted as ‘mbse’, refers to the time series of the solution for the case where the individual station range bias is estimated for all stations over monthly time intervals. To distinguish it from the ‘mbse’ solution, the ‘gbse’ solution refers to the time series of the solution for the case where the individual station range bias is estimated globally for the entire time period; this solution is like the solution reported by Cheng et al. [9]. In this case, the estimated range bias may represent the systematic error of a station over the entire time span. In this case, the seasonal signal in the SLR measurements (and the higher degree loading signal) will be retained in the estimated geocenter parameters.
A linear trend, annual amplitude, and phase were obtained from the least square fit to the time series for the case defined in Table 3. Averaged amplitude and phases from the ‘mbse’ solution of all cases will be used in the following comparison.

4.1. Annual Geocenter Variation

Table 4 compares the amplitude and phase for the annual variations in the new estimate of geocenter motion, showing the following aspects: (1) the translation components estimated from an analysis of 26 years of weekly site positions (denoted as ILRS) in the development of ITRF2014 [14] and the seasonal terms estimated in the ITRF2020 solution [8]; (2) the monthly SLR solution with the estimations of station range bias over the entire time period, from January 2002 to December 2022; (3) the average monthly SLR solution from Cases 2 and 3 (as shown in Table 3) with an estimation of station range bias and corrections of troposphere delays in ∆z and gh over a monthly time interval; (4) the solution obtained from GRACE GPS [13]; (5) the results from the global inversion based on the GPS/OBP/GRACE: Global Inv. from Wu et al. [4] and Global inv. from Wu et al. [5]; (6) GRACE Technical Note 13 [15] (TN13) + atmosphere and ocean degree one coefficients from AOD (or GAC data); (7) the contribution of the RL06 AOD (Atmosphere and Ocean De-aliasing model) regarding its compatibility with GRACE Release 06 processing [16]. The analysis of the land water storage variability is based on the NOAA Climate Prediction Center (CPC) global climatological soil moisture data [17].
In the case where the monthly station range bias and the troposphere correction, ∆z, are adjusted, the amplitude for annual variation is significantly reduced for the X and Z components compared with the SLR-gsbe solution, as shown in Table 4. The SLR-derived monthly solution, ‘mbse’ (as in Case 3 in Table 3), becomes comparable to the solution from the global inversion and TN13, which represents the effects of degree one mass loading on three components: X, Y and Z. This suggests that the difference between the previous SLR-derived solution (ITRF2014 translation and the ‘gbse’ solution in this study) and the global inversion is due to the kinematic effects recorded in the SLR measurement. This difference cannot be attributed to the deficiency of the geographic distribution of SLR tracking stations. The geocenter solution from ITRF2020 provides further proof of this.
In addition, a correlation coefficient of ~0.4 is estimated for the geocenter X component (GC-X) with the five-degree and order 1 geopotential coefficient C51 (five degrees and order 1) and the Y component (GC-Y) with S51. The correlation coefficient is less than 0.2 for the geocenter parameter (including GC-Z) with other gravity coefficients. The geocenter variation is well separated from the geopotential coefficients.
As shown in Table 4, the annual amplitude and phase from the SLR (mbse) solution is comparable to the solution of ITRF2020. As discussed in Section 3.4 and Table 3, the SLR solution (mbse) presented here represents the degree one loading-induced variation, which is separated from the integrated surface-loading-induced effects by adjusting the station range bias and atmosphere correction ∆a. The procedure used in this study is different to that used in the geocenter solution from ITRF2020, but possible model errors in the atmosphere troposphere zenith delay were not considered in the development of the ITRF solution.
In an earlier study, geocenter variation was evaluated based on the model of atmosphere, ocean, and surface groundwater [38], but the model prediction could not be considered to represent a true signal of geocenter motion due to the limited accuracy of the existing geophysical models. In this study, the prediction from the AOD model is required to restore the values reported in TN13 and ensure they are comparable. The prediction from the CPC model presented here is used to evaluate the contribution of the surface water’s redistribution over the continent. The prediction from the AOD + CPC model shows the possibly significant geocenter signal from the mass redistribution within the atmosphere, ocean, and surface water. Comparison with the amplitude for the X component (as shown in Table 4) may suggest that the estimated annual amplitude (less than the AOD-predicted 1.2 mm or AOD-CPC predicted 1.9 mm) of geocenter variation may be underestimated, although the existing models are imperfect.

4.2. Drift of the Geocenter

Table 5 compares the rate estimated in ITRF2014 from the SLR data in this study and from the ITRF2014 and TN13. When developing the ITRF2014 and ITRF2020 systems, the drift signal of the translation (geocenter offset) is, ideally, absorbed into the estimated velocities of stations in the ITRF system. As expected, the translation rates are essentially zero for the three components in the realization of ITRF2014 and ITRF2020 [8,39]. However, a rate in the range from −0 to −0.2 mm/year was reported in ITRF2020 with respect to the ITRF2014. The rate in the range from 0.1 to 0.3 mm/year from SLR generally agrees with the reported rate for ITRF2020. However, the cause of the opposite trend observed for the time series of X and Y geocenter components from SLR-mbse and TN13 (JPL) is unknown. It is still unclear if this estimated rate might reflect the climate changes induced by the mass transportation between the northern and southern hemispheres [40,41].
By definition, the geocenter or degree one variations are a function of the Earth’s surface-density redistributions (represented by the equivalent water height at the surface) weighted by the degree one Legendre polynomial, P 1 m ( sin ϕ ) ( cos m λ ,   s i n m λ ) (m = 0, 1). The geographic dependency is different for C11, S11, and C10 components. The variations in the S11 or Y component are the mass imbalance between the east (with a longitude from 0 to 180°) and west (with a longitude from 0 to −180°). However, the variations in the C11 or X components are the mass imbalance between the ‘Central region’, center at Greenwich with a longitude ranging from −90° to +90° and the ‘Out central’ region, ranging from 90° in the east to 90° in the east. P 10 ( sin ϕ ) = sin ϕ > 0 for the northern hemisphere and <0 for the southern hemisphere. Thus, variations in the C10 or Z components are the mass imbalance between the northern (with amplitude < 0) and southern hemisphere (with amplitude > 0); for example, the observed ice-melting rate in Greenland and Alaska is different from that of the Antarctica ice sheet. This difference could be an excitation source for the rate for C10 or Z components.

4.3. Uncertainty Estimate

For the amplitude and phase determined from the least square fit to the time series of the SLR-derived monthly solution of the geocenter, the standard deviations (one sigma) are smaller compared with the amplitude. The uncertainty listed in Table 4 reflects the range of changes from several cases, such as the solutions from 2, 3, 4 and 5 satellites, with and without adjusting the range bias, and the different constraints applied in the estimation of the thermosphere zenith delay and z, and horizontal gradients (hg).

5. Conclusions

In this study, the variation in the geocenter vector r c m (CM-CN) is obtained from a linearized system given by y = Hx + ε, where the state vector consists of the geocenter parameters (X, Y, Z) along with the satellite orbits and other dynamic forcing parameters, as well as a 5 × 5 gravity field. The observation vector y is the observed–computed (O-C) of the satellite laser ranging measurements, presented as a set of suborbital points (in a path) representing the vertical projection of the satellite’s orbits onto the surface of the Earth. The distribution of the paths or suborbital points is well covered in most of the continents and around the ocean, with coverage ranging from coast areas with a latitude of approximately ±70° using SLR network tracking to multiple satellites over monthly intervals.
Laser light pulses are traveling through the Earth’s atmosphere between the retroflectors carried on the satellites orbiting the Earth and a ground station. We show that satellite laser ranging measurements have captured a significant number of seasonal signals during as the laser light pulses travel. These seasonal signals appear in the station range bias (with an annual amplitude of a few mm) or the estimated station height. The larger part of the observed seasonal signals that appear in the range bias may be due to the effects of the surface-loading-induced displacement of the tracking site and the additional degree one potential acting on satellite orbit (which may appear as orbit error). The mismodeling of the troposphere delay (∆z) and the atmospheric horizontal gradients (hg) also produces a considerable laser ranging residual. Such seasonal signals can be considered as a kinematic effect, which has a significant impact on the separation of degree one mass loading changes, resulting in geocenter variations.
In a previous study by Cheng et al. [9], the satellite laser range biases were assumed to be zero or piecewise constant due to the systematic errors obtained for the stations in SLR network. With this assumption, the SLR-derived r c m S L R contains not only the degree one mass-loading-induced geocenter variations, but kinetic effects including the high-degree mass loading effect. After removing those effects, the SLR monthly geocenter motion (mbse) becomes comparable with the solution, r c m G P S , obtained from global inversion or TN13. This suggests that the difference between the previous solution of geocenter variation (or ITRF2014 translation) and r c m G P S should not be attributed to the distribution of SLR tracking stations, as the SLR solution (mbse) is obtained based on the well-distributed ground track of stations in the global SLR network, obtained from multiple satellites.
The solution of the geocenter parameters, estimated along with the station height, is highly dependent on the constraint that is applied, which requires additional justification. Adjusting the station range bias is a more effective approach to separate the degree one loading-induced geocenter variations from the kinematic effects.
In summary, the main findings in this study are
  • The signal in the station range bias is a part of the surface-loading-induced variations (including a higher degree of loading) and the mismodeling of the thermosphere zenith delay, which can be separated from each other.
  • Measurements of the gravitational signal, including the geocenter variations from the SLR data, depend on the distribution of the suborbital points or ground tracking of satellites, instead of the geographic distribution of the tracking stations.
  • A new monthly time series of geocenter variation was determined by simultaneously adjusting the station range bias and the thermosphere delay parameters from SLR data. This improved solution is comparable to the solution obtained from global conversions based on GPS displacements.
The agreement between the annual variation and the rate of the SLR solution (mbse) obtained with the ITRF2020 solution suggests that the SLR can produce a valuable operational geocenter variation for geoscience applications.

Funding

This research is supported by the National Aeronautics and Space Administration (NASA) grants 80NSSC20K0766.

Data Availability Statement

The time series of the monthly geocenter solutions will be available at http://podaac.jpl.nasa.gov/gravity/grace-documentation. This research is based on the SLR normal point data provided by International Laser Ranging Service [42] (ILRS; https://cddis.nasa.gov); the Atmosphere Ocean De-aliasing (AOD) products provided by Helmholtz-Zentrum Potsdam–Deutches GeoForschungsZentrum (GFZ; https://doi.org/10.5880/GFZ.1.3.2022.003); the soil moisture data provided by NOAA Climate Prediction Center (CPC) (http://ftp.cpc.ncep.noaa.gov/wd51yf/global_monthly).

Acknowledgments

The author thanks ILRS for providing the satellite laser ranging data for the geodetic satellites, and John Ries at CSR who supported the analysis by maintaining the SLR network setup and editing the SLR data. The insightful comments from anonymous reviewers are greatly appreciated. We thank the Texas Advanced Computing Center for providing computational resources.

Conflicts of Interest

There are no conflicts of interest.

References

  1. Trupin, A.S.; Meier, M.F.; Wahr, J. Effects of melting glaciers on the Earth’s rotation and gravitational field: 1965–1984. Geophys. J. Int. 1992, 108, 1–15. [Google Scholar] [CrossRef]
  2. Swenson, S.; Chambers, D.; Wahr, J. Estimating geocenter variations from a combination of GRACE and ocean model output. J. Geophys. Res. Solid Earth 2008, 113, B08410. [Google Scholar] [CrossRef]
  3. Sun, Y.; Riva, R.; Ditmar, P. Optimizing estimates of annual variations and trends in geocenter motion and J2 from a combination of GRACE data and geophysical models. J. Geophys. Res. Solid Earth 2016, 121, 8352–8370. [Google Scholar] [CrossRef]
  4. Wu, X.; Ray, J.; van Dam, T. Geocenter motion and its geodetic and geophysical implications. J. Geodyn. 2012, 58, 44–61. [Google Scholar] [CrossRef]
  5. Wu, X.; Kusche, J.; Landerer, F.W. A new unified approach to determine geocenter motion using space geodetic and GRACE gravity data. Geophys. J. Int. 2017, 209, 1398–1402. [Google Scholar] [CrossRef]
  6. Rietbroek, R.; Brunnabend, S.E.; Dahle, C.; Kusche, J.; Flechtner, F.; Schröter, J.; Timmermann, R. Changes in total ocean mass derived from GRACE, GPS, and ocean modeling with weekly resolution. J. Geophys. Res. Oceans 2009, 114, C11004. [Google Scholar] [CrossRef]
  7. Watkins, M.M.; Eanes, R.J. Observations of tidally coherent diurnal and semi-diurnal variations in the geocenter. Geophys. Res. Lett. 1997, 24, 2231–2234. [Google Scholar] [CrossRef]
  8. Altamimi, Z.; Rebisschung, P.; Collilieux, X.; Métivier, L.; Chanard, K. ITRF2020: An augmented reference frame refining the modeling of nonlinear station motions. J. Geod. 2023, 97, 47. [Google Scholar] [CrossRef]
  9. Cheng, M.K.; Ries, J.C.; Tapley, B.D. Geocenter Variations from Analysis of SLR data. In Reference Frames for Applications in Geosciences; IAG (International Association of Geodesy); Altamimi, Z., Collilieux, X., Eds.; Springer: Berlin/Heidelberg, Germany, 2013; Volume 138, pp. 19–25. [Google Scholar]
  10. Sosnica, K.; Jaggi, A.; Thaller, D.; Beutler, G.; Dach, R. Contribution of Starlette, Stella, and AJISAI to the SLR-derived global reference frame. J. Geod. 2014, 88, 789–804. [Google Scholar] [CrossRef]
  11. Kang, Z.; Tapley, B.; Chen, J.; Ries, J.; Bettadpur, S. Geocenter variations derived from GPS tracking of the GRACE satellites. J. Geod. 2009, 83, 895–901. [Google Scholar] [CrossRef]
  12. van Helleputte, T.; Visser, P. GPS based orbit determination using accelerometer data. Aerosp. Sci. Technol. 2008, 12, 478–484. [Google Scholar] [CrossRef]
  13. Kuang, D.A.; Bertiger, W.; Desai, S.; Haines, B.J.; Yuan, D.-N. Observed geocenter motion from precise orbit determination of GRACE satellites using GPS tracking and accelerometer data. J. Geod. 2019, 93, 1835–1844. [Google Scholar] [CrossRef]
  14. Altamimi, Z.; Rebischung, P.; Métivier, L.; Collilieux, X. ITRF2014:
A new release of the International Terrestrial Reference Frame modeling nonlinear station motions. J. Geophys. Res. Solid Earth 2016, 121, 6109–6131. [Google Scholar] [CrossRef]
  15. Landerer, F. Jet Propulsion Laboratory (JPL), GRACE Technical Note 13. Contact: [email protected]. Available online: https://podaac.jpl.nasa.gov/gravity/grace-documentation (accessed on 15 March 2024).
  16. Dobslaw, H.; Bergmann-Wolf, I.; Dill, R.; Poropat, L.; Thomas, M.; Dahle, C.; Esselborn, S.; K¨onig, R.; Flechtner, F. A new high-resolution model of non-tidal atmosphere and ocean mass variability for de-aliasing of satellite gravity observations: AOD1B RL06. Geophys. J. Int. 2017, 211, 263–269. [Google Scholar] [CrossRef]
  17. van den Dool, H.; Huang, J.; Fan, Y. Performance and analysis of the constructed analogue method applied to US soil moisture applied over 1981–2001. J. Geophys. Res. Atmos. 2003, 108. [Google Scholar] [CrossRef]
  18. Heiskanen, W.A.; Moritz, H. Physical Geodesy; W.H. Freeman and Co.: San Francisco, CA, USA; London, UK, 1967. [Google Scholar]
  19. Lambeck, K. Geophysical Geodesy; Clarendon Press: Oxford, UK, 1988. [Google Scholar]
  20. Blewitt, G. Self-consistency in reference frames, geocenter definition, and surface loading of the solid Earth. J. Geophys. Res. Solid Earth 2003, 108, 2103. [Google Scholar] [CrossRef]
  21. Wahr, J.; Molenar, M.; Bryan, F. Time variability of the Earth’s gravity field: Hydrological and oceanic effects and their possible detection using GRACE. J. Geophys. Res. Solid Earth 1998, 103, 30205–30229. [Google Scholar] [CrossRef]
  22. Farrell, W.E. Deformation of the Earth by surface loading. Rev. Geophys. 1972, 10, 761–797. [Google Scholar] [CrossRef]
  23. Kusche, J.; Schrama, E.J.O. Surface mass redistribution inversion from global GPS deformation and Gravity Recovery and Climate Experiment (GRACE) gravity data. J. Geophys. Res. Solid Earth 2005, 110, B09409. [Google Scholar] [CrossRef]
  24. Melachroinosa, S.A.; Lemoine, F.G.; Zelensky, N.P.; Rowlands, D.D.; Luthcke, S.B.; Bordyugov, O. The effect of geocenter motion on Jason-2 orbits and the mean sea level. Adv. Space Res. 2013, 51, 1323–1334. [Google Scholar] [CrossRef]
  25. Petit, G.; Luzum, B. IERS Conventions (2010); IERS Technical Note No. 36; International Earth Rotation and Reference Systems Service: Frankfurt, Germany, 2010. [Google Scholar]
  26. Choi, E.-J.; Bang, S.-C.; Sung, K.-P.; Lim, H.-C.; Jung, C.-G.; Kim, I.-Y.; Choi, J.-S. Design and Development of High-Repetition-Rate Satellite Laser Ranging System. J. Astron. Space Sci. 2015, 32, 209–219. [Google Scholar] [CrossRef]
  27. Luceri, V.; Pirri, M.; Rodríguez, J.; Appleby, G.; Pavlis, E.C.; Müller, H. Systematic errors in SLR data and their impact on the ILRS products. J. Geod. 2019, 93, 2357–2366. [Google Scholar] [CrossRef]
  28. Drozdzewski, M.; Sosnica, K. Tropospheric and range biases in Satellite Laser Ranging. J. Geod. 2021, 95, 100. [Google Scholar] [CrossRef]
  29. Mendes, V.B. Modeling the Neutral-Atmosphere Propagation Delay in Radiometric Space Techniques. Ph.D. Thesis, University of New Brunswick, Fredericton, NB, Canada, 1999. [Google Scholar]
  30. Saastamoinen, J. Contributions to the theory of atmospheric refrac- tion, part II, Refraction corrections in satellite geodesy. Bull. Géodésique 1973, 107, 13–24. [Google Scholar] [CrossRef]
  31. Marini, J.W.; Murray, C.W. Correction of Laser Range Tracking Data for Atmospheric Refraction at Elevations above 10 Degrees. International Patent Application NASA-TM-X-70555; Patent Application No. X-591-73-351, 1 November 1973. [Google Scholar]
  32. Mendes, V.B.; Prates, G.; Pavlis, E.C.; Pavlis, D.E.; Langley, R.B. Improved mapping functions for atmospheric refraction correction in SLR. Geophys. Res. Lett. 2002, 29, 53-1–53-4. [Google Scholar] [CrossRef]
  33. Mendes, V.B.; Pavlis, E.C. High-accuracy zenith delay prediction at optical wavelengths. Geophys. Res. Lett. 2004, 31, L14602. [Google Scholar] [CrossRef]
  34. Chen, G.; Herring, T.A. Effects of atmospheric azimuthal asymmetry on the analysis of space geodetic data. J. Geophys. Res. Solid Earth 1997, 102, 20489–20502. [Google Scholar] [CrossRef]
  35. Böhm, J.; Hobiger, T.; Ichikawa, R.; Kondo, T.; Koyama, Y.; Pany, A.; Schuh, H.; Teke, K. Asymmetric tropospheric delays from numerical weather models for UT1 determination from VLBI Intensive sessions on the baseline Wettzell-Tsukuba. J. Geod. 2010, 84, 319–325. [Google Scholar] [CrossRef]
  36. Landskron, D.; Böhm, J. VMF3/GPT3: Refined discrete and empirical troposphere mapping functions. J. Geod. 2018, 92, 349–360. [Google Scholar] [CrossRef]
  37. Drozdzewski, M.; Sosnica, K.; Zus, F.; Balidakis, K. Troposphere delay modeling with horizontal gradients for satellite laser ranging. J. Geod. 2019, 93, 1853–1866. [Google Scholar] [CrossRef]
  38. Dong, D.; Dickey, J.O.; Chao, Y.; Cheng, M.K. Geocenter variations caused by atmosphere, ocean and surface ground water. Geophys. Res. Lett. 1997, 24, 1867–1870. [Google Scholar] [CrossRef]
  39. Altamimi, Z.; Collilieux, X.; Métivier, L. ITRF2008: An improved solution of the International Terrestrial Reference Frame. J. Geod. 2011, 85, 457–473. [Google Scholar] [CrossRef]
  40. Greff-Lefftz, M. Secular variation of the geocenter. J. Geophys. Res. Solid Earth 2000, 105, 25685–25692. [Google Scholar] [CrossRef]
  41. Métivier, L.; Grefftz-Lefftz, M.; Atamimi, Z. On secular geocenter motion: The impact of climate changes. Earth Planet. Sci. Lett. 2010, 296, 360–366. [Google Scholar] [CrossRef]
  42. Pearlman, M.R.; Noll, C.E.; Pavlis, E.C.; Lemoine, F.G.; Combrink, L.; Degnan, J.L.; Kirchner, G.; Schreiber, U. The ILRS: Approaching 20 years and planning for the future. J. Geod. 2019, 93, 2161–2180. [Google Scholar] [CrossRef]
Figure 1. Monthly estimates of laser range bias (Rb* in blue line and Rb in orange line) and correction of troposphere delay (∆z in dash green line) for station 7090, where Rb* is the range bias Rb (specified by a superscript *) obtained by estimating range bias only, while Rb is obtained by simultaneously estimating the range bias, troposphere delay (∆z), and horizontal gradients (GE in solid black line).
Remotesensing 16 01189 g001
Figure 2. Monthly ground track for August 2015 from five satellites: Lageos-1 (blue), Lageos-2 (red), Starlette, Ajisai, and Stella (yellow).
Remotesensing 16 01189 g002
Figure 3. Monthly solutions of the geocenter variation (in blue) in the X component from SLR and comparison with the seasonal variation and beyond (in orange) from a lower pass filter based on the wavelet analysis.
Remotesensing 16 01189 g003
Figure 4. Monthly solution of the geocenter variations (in blue) in the Y component from SLR and comparison with the seasonal variations and beyond (in orange) from a lower pass filter based on the wavelet analysis.
Remotesensing 16 01189 g004
Figure 5. Monthly solution of the geocenter variations (in blue) in the Z component from SLR and comparison with the seasonal variations and beyond (in orange) from a lower pass filter based on the wavelet analysis.
Remotesensing 16 01189 g005
Figure 6. The difference in the seasonal geocenter variations (X in blue, Y in orange, Z in black) derived from the estimation of station range biases (gbse is the global bias case and mbse is the monthly bias case). The difference in the y component is smaller than that in the Z and X components.
Remotesensing 16 01189 g006
Table 1. Annual amplitude (A in units of mm) and phase (Ψ in units of degrees) for the error in the zenith delay (∆z), and the horizontal gradients (hg: GN and GE), along with the estimated range bias (Rb) and the station height (Up) (with sign *) for station 7090.
CaseSolutionRb (A/Ψ)∆z (A/Ψ)GN (A/Ψ)GE (A/Ψ)
1Rb only4.41/152
2Rb + ∆z + hg8.11/1512.13/3300.05/120.16/25
3Rb + hg4.43/151 0.12/1470.30/10
4Rb + ∆z9.29/1542.41/332
5∆z + hg 1.22/1390.14/1660.39/07
6Up + ∆z + hg 7.47/331 *2.24/3370.04/410.18/15
Table 2. Comparison of annual amplitudes for station 7090 in ENU from GRACE, ITRF2020, and SLR.
SolutionE (mm/deg)N (mm/deg)Up (mm/deg)
GRACE0.228/3220.165/2991.77/327
ITRF20200.851(±0.24)/64(±46)2.369(±0.44)/269(±46)3.65(±0.31)/317(±45)
SLR (1) 3.90(±0.09)/322(±5)
SLR (10) 7.98(±0.09)/335(±5)
SLR (10*) 6.52(±0.09)/354±5)
Table 3. Annual amplitude (mm) and phase (Ψ: degree) for the geocenter motions.
Case Solution CaseX (A/Ψ)Y (A/Ψ)Z (A/Ψ)
1Rb1.82/352.87/3012.11/24
2Rb + ∆z + hg1.82/472.90/3022.44/20
3Rb +z1.23/633.27/3041.57/31
4Rb + hg2.81/272.47/2953.28/16
5∆z + hg4.02/171.88/2844.35/10
6Up (1 mm)3.33/202.91/2994.31/13
7Up (10 mm)1.22/653.35/3071.83/28
8Up + ∆z1.25/633.31/3041.44/37
9Up + ∆z + hg1.78/503.13/3042.35/22
Table 4. Observed annual geocenter variations (amplitude in mm; phase in degrees). Convention is Amp cos(ω(t-t0)-Phase), where t0 is January 1.
SolutionsX
(Amp/Phase)
Y
(Amp/Phase)
Z
(Amp/Phase)
ITRF20142.6 ± 0.1/46 ± 33.1 ± 0.1/320 ± 25.7 ± 0.2/28 ± 2
ITRF20201.2 ± 0.2/57 ± 73.5 ± 0.2/332 ± 32.8 ± 0.3/41 ± 7
SLR (gbse)3.2 ± 0.2/17 ± 52.5 ± 0.4/301 ± 64.7 ± 0.4/10 ± 5
SLR (mbse)1.5 ± 0.3/63 ± 53.3 ± 0.2/306 ± 42.6 ± 0.3/31 ± 6
Global Inv11.8 ± 0.2/49 ± 42.7 ± 0.2/325 ± 24.2 ± 0.2/31 ± 3
Global Inv-21.3 ± 0.1/46 ± 43.0 ± 0.2/330 ± 23.3 ± 0.2/26 ± 3
TN13 (JPL)1.5/532.6/3263.3/46
GRACE GPS1.1/542.8/3323.6/45
AOD1.2/1481.4/1711.8/157
CPC0.7/1310.6/2471.1/73
AOD + CPC1.9/1411.6/1922.2/128
Table 5. Observed rates (in mm/year) of the geocenter variations.
SolutionXYZ
ITRF2020−0.00 ± 0.2−0.1 ± 0.1−0.2 ± 0.1
SLR-gbse−0.01 ± 0.010.00 ± 0.010.25 ± 0.01
SLR-mbse0.07 ± 0.020.01 ± 0.010.31 ± 0.01
TN13 (JPL)−0.110.07−0.54
Model~0.2~0.20.3–0.8
Disclaimer/Publisher’s Note: The statements, opinions and data contained in all publications are solely those of the individual author(s) and contributor(s) and not of MDPI and/or the editor(s). MDPI and/or the editor(s) disclaim responsibility for any injury to people or property resulting from any ideas, methods, instructions or products referred to in the content.