Review

Ship Detection with Deep Learning in Optical Remote-Sensing Images: A Survey of Challenges and Advances

by
Tianqi Zhao
1,2,
Yongcheng Wang
1,*,
Zheng Li
1,2,
Yunxiao Gao
1,2,
Chi Chen
1,2,
Hao Feng
1,2 and
Zhikang Zhao
1,2
1
Changchun Institute of Optics, Fine Mechanics and Physics, Chinese Academy of Sciences, Changchun 130033, China
2
University of Chinese Academy of Sciences, Beijing 100049, China
*
Author to whom correspondence should be addressed.
Remote Sens. 2024, 16(7), 1145; https://doi.org/10.3390/rs16071145
Submission received: 2 February 2024 / Revised: 18 March 2024 / Accepted: 19 March 2024 / Published: 25 March 2024
(This article belongs to the Special Issue Remote Sensing of Target Object Detection and Identification II)

Abstract

:
Ship detection aims to automatically identify whether there are ships in the images, precisely classifies and localizes them. Regardless of whether utilizing early manually designed methods or deep learning technology, ship detection is dedicated to exploring the inherent characteristics of ships to enhance recall. Nowadays, high-precision ship detection plays a crucial role in civilian and military applications. In order to provide a comprehensive review of ship detection in optical remote-sensing images (SDORSIs), this paper summarizes the challenges as a guide. These challenges include complex marine environments, insufficient discriminative features, large scale variations, dense and rotated distributions, large aspect ratios, and imbalances between positive and negative samples. We meticulously review the improvement methods and conduct a detailed analysis of the strengths and weaknesses of these methods. We compile ship information from common optical remote sensing image datasets and compare algorithm performance. Simultaneously, we compare and analyze the feature extraction capabilities of backbones based on CNNs and Transformer, seeking new directions for the development in SDORSIs. Promising prospects are provided to facilitate further research in the future.

1. Introduction

Ship detection has important applications in areas such as fisheries management, maritime patrol, and maritime rescue. It contributes to ship traffic management and the maintenance of maritime safety. Therefore, ship detection has broad application prospects in civil and military fields [1]. The core objective is to determine the position of ships and identify their categories.
Optical remote-sensing images are captured via imaging distant ground surfaces using electro-optical sensors on aerial platforms and artificial Earth satellites [2]. With the rapid development of remote sensing, the resolution of optical remote-sensing images has continuously improved. They can provide more details, such as color and texture, as well as a comprehensive database for ship detection. Therefore, how to effectively utilize the existing favorable conditions to maximize the application benefits is an urgent issue to be solved.
Ship-detection methods have experienced two stages of development: rule-based classification and deep learning. In the early methods, the sliding window method was employed to systematically judge all potential areas. It relies on fixed-pattern approaches, such as geometric elements and manually designed features to extract ship features. However, the early methods may generate large amounts of redundant computations, which significantly impact detection speed. Additionally, the manually designed features lack the robustness to resist the interference from complex backgrounds. Therefore, early approaches struggled to meet the requirements of both performance and efficiency.
Compared with traditional methods, deep learning can extract features with stronger semantic information, and enable autonomous learning. In recent years, deep learning has developed rapidly. It has gradually migrated and innovated in the field of ship detection, achieving good results in ship detection in optical remote-sensing images (SDORSIs). However, influenced by factors such as complex maritime environments and ship characteristics, the results of SDORSIs based on deep learning still need improvement. Furthermore, achieving a balance between accuracy and speed is also one of the significant challenges.
At present, some reviews have been published in ship detection. Er et al. [3] collated a large number of popular datasets and reviewed the existing object-detection models. Joseph et al. [4] and Li et al. [5] systematically analyzed the typical methods at each stage of SDORSIs. Kanjir et al. [6] conducted a detailed analysis of the impact of environmental factors on SDORSIs. Li et al. [7] summarized the ship-detection techniques in synthetic aperture radar (SAR) images, along with their advantages and disadvantages.
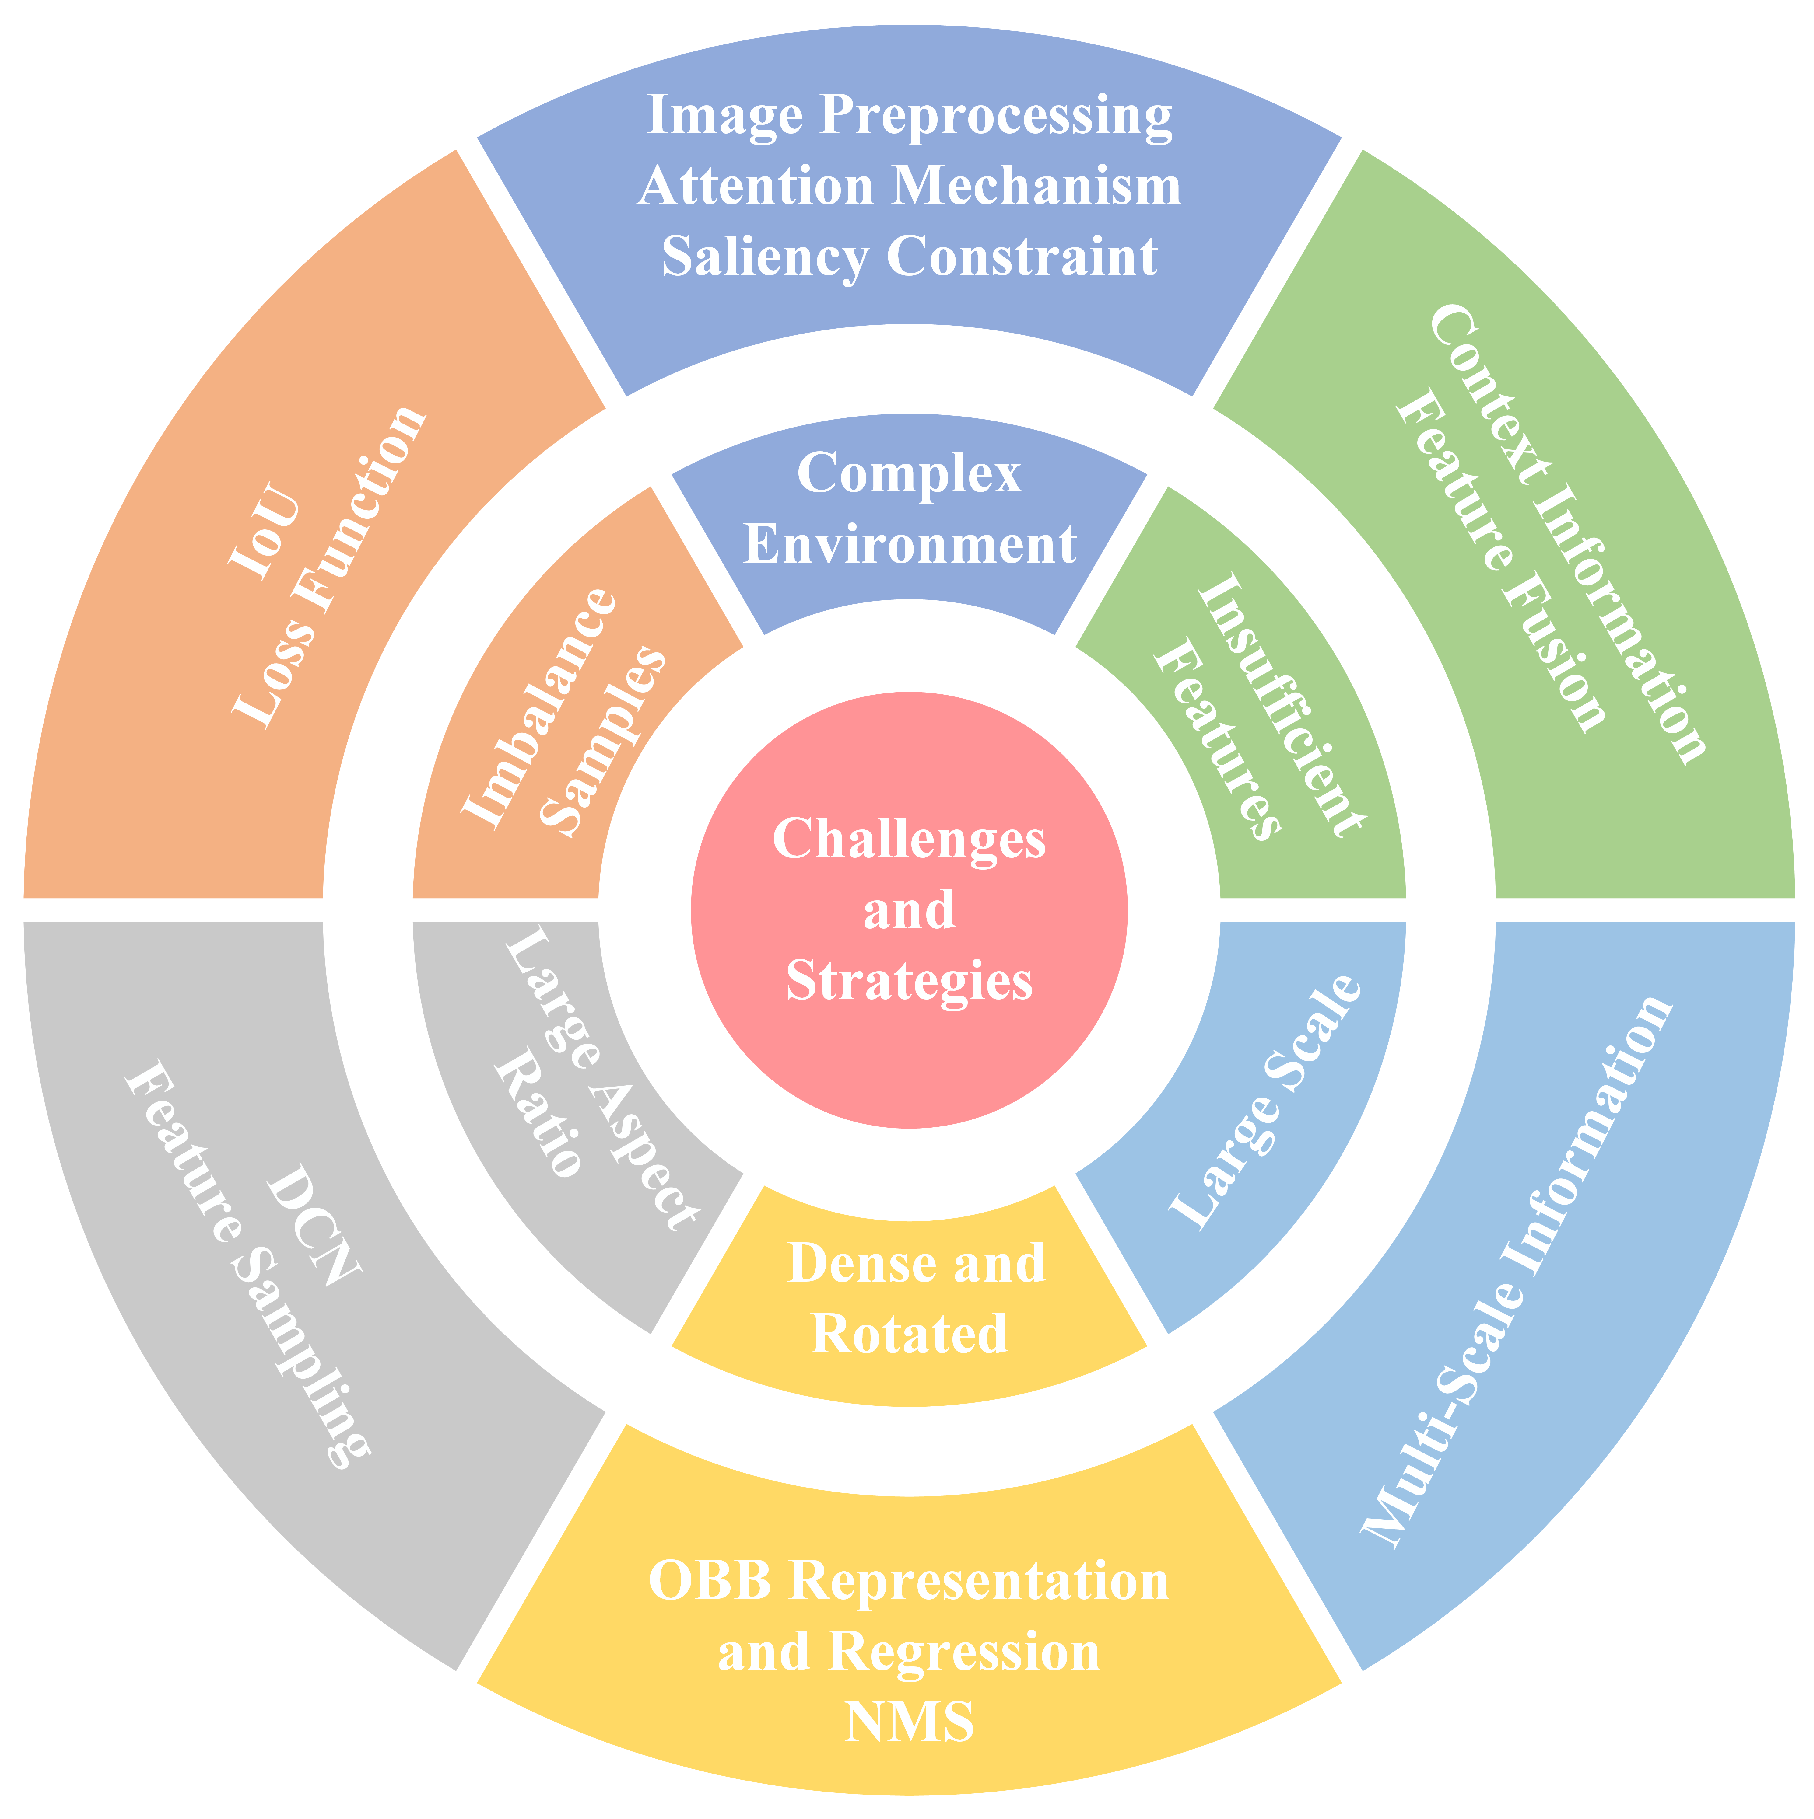
Different from existing reviews, this paper primarily focuses on the challenges associated with SDORSIs. It aims to establish a refined classification system that progresses from the main problems to solutions, and provides readers with a comprehensive understanding of this field. Specifically, according to the characteristics of optical remote-sensing images and ships, we summarize the challenges as follows: complex marine environments, insufficient discriminative features, large scale variations, dense and rotated distributions, large aspect ratios, and imbalances between positive and negative samples, as shown in Figure 1. We take the problems as the driving force and conduct an in-depth analysis for each one. We comprehensively summarize the corresponding solutions and analyze the advantages and disadvantages of the respective solutions. In addition, we chronologically summarize ship-detection technologies, including methods based on manual feature extraction, convolutional neural networks (CNN) and Transformer. Finally, for the first time, we separate and aggregate ship information from comprehensive datasets. We also summarize and analyze the performance improvement effects of existing solutions, as well as compare the feature extraction capabilities of CNNs and Transformer. It is worth noting that the ship-detection methods and datasets discussed in this paper are only for nadir imagery.
To summarize, the main contributions are as follows:
  • We systematically review ship-detection technologies in chronological order, including traditional methods, CNN-based methods, and Transformer-based methods.
  • Guided by ship characteristics, we classify and outline the existing challenges in SDORSIs. based on CNNs and analyze their advantages and disadvantages.
  • We summarize ship datasets and evaluation metrics. Furthermore, we are the first to separate and aggregate ship information from comprehensive datasets. At the same time, we compare and analyze performance improvement of the solutions and the feature extraction abilities of different backbones.
  • Prospects of SDORSIs are presented.
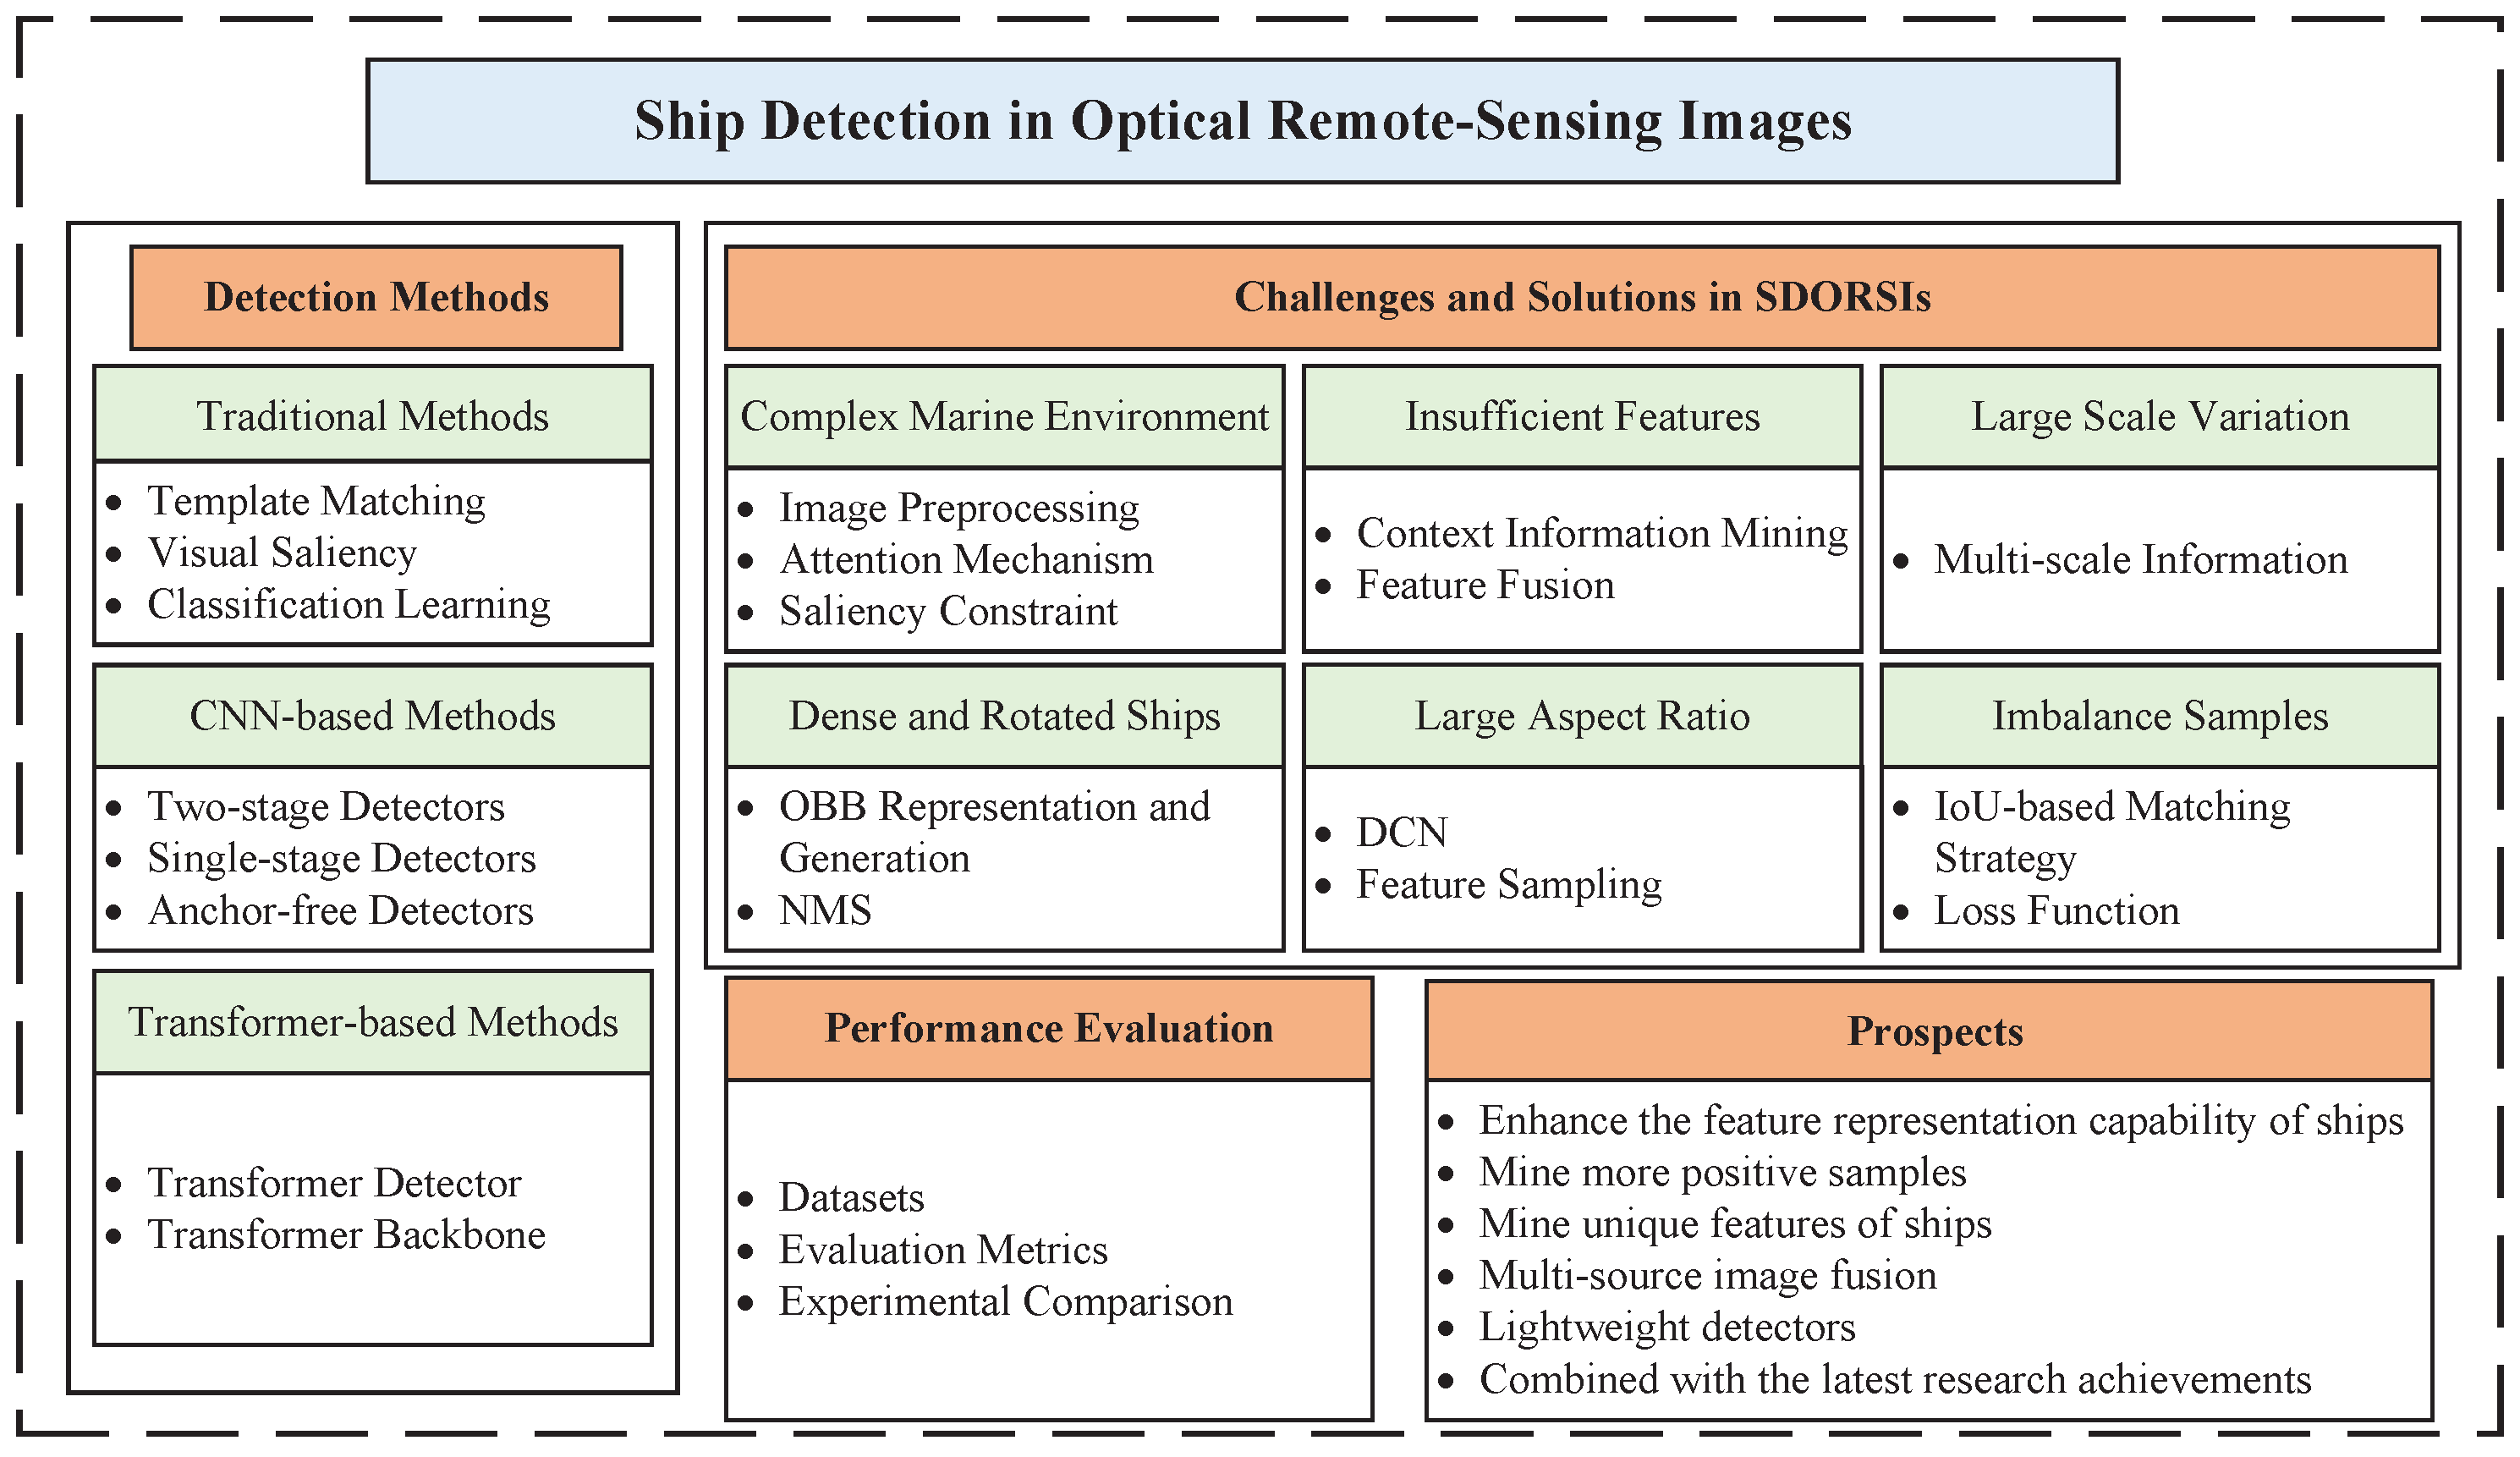
The remaining components of this review are as follows: Section 2 chronologically reviews ship-detection technologies. Section 3 sorts out SDORSI challenges, summarizing improvement methods and their pros and cons. Section 4 summarizes ship datasets and evaluation metrics, comparing the performance of existing algorithms. Section 5 discusses the future development trends. Finally, Section 6 provides a summary of this paper. A research content diagram of this paper is shown in Figure 2.

2. Methods

Ship detection is an important research topic. In this section, we chronologically review the methods of ship-detection technologies, including traditional methods, CNN-based methods, and Transformer-based methods. The timeline of ship-detection methods is shown in Figure 3.

2.1. Traditional Methods

Most traditional ship-detection methods rely on geometric elements and manually designed features to locate ships within the background. Furthermore, they achieve good detection results in specific scenarios. The traditional methods are as follows: template matching, visual saliency, and classification learning.

2.1.1. Template-Matching-Based Method

Template-matching-based methods initially collect ship templates from various angles and environments. Then, they calculate the similarity between the templates and input images to determine the presence of ships. The methods primarily include global template matching, local template matching and feature-point matching. They are simple to operate and exhibit good detection performance in specific scenarios.
Xu et al. [8] proposed a method based on an invariant generalized Hough transform. It exhibited invariance to translation, scaling, and rotation transformation to extract ship shapes. Harvey et al. [9] performed rotational transformation on ship samples to increase the diversity of the templates. The method enhanced the generalization capability of the detector. He et al. [10] proposed a new method based on pose-weighted voting. It is robust in template matching. It further improved the performance.
Template-matching-based methods achieve good results in traditional ship detection. However, they require a lot of prior knowledge to build a template database and are sensitive to the environment, leading to a poor generalization capability.

2.1.2. Visual-Saliency-Based Method

The visual-saliency-based method prioritizes detector focus on regions with visually prominent features by analyzing image characteristics. The method first utilizes saliency detection algorithms to calculate the contrast between a certain region and its surrounding areas. Subsequently, it accomplishes the extraction of ship regions according to the results. The method achieves good results in ship detection.
Xu et al. [11] proposed a saliency model with adaptive weights for extracting candidate ships. The method can identify ships and suppress the interference from complex backgrounds effectively. Nie et al. [12] proposed a method that combined extended wavelet transform with phase saliency regions. It effectively achieved the extraction of regions of interests (ROIs) from complex backgrounds. Qi et al. [13] utilized the phase spectrum of Fourier transform to measure saliency, resulting in better identification of ships. Bi et al. [14] employed a visual attention algorithm to highlight the positions of ships and provided their approximate regions.
The visual-saliency-based method finds extensive application in traditional ship detection. However, it has higher requirements for image quality. When ships are disturbed by cloud or the ship areas are large, it is difficult to obtain ideal results.

2.1.3. Classification-Learning-Based Method

Supervised machine learning is utilized in traditional ship detection. Thus, it is necessary to design suitable classifiers. The network trains classifiers by extracting ship features and labels to predict ships, and then establishes the relationship between ship features and ship categories. The main features include Scale Invariant Feature Transform (SIFT) features [15], histogram of oriented gradients (HOG) features [16], shape and texture features, etc. The commonly used classifiers are SVM, logistic regression, and AdaBoost.
Corbane et al. [17] utilized Radon transform and wavelet transform to extract ship features. Subsequently, the features were combined, employing logistic regression to accomplish ship detection. Song et al. [18] combined shape features with HOG features to construct a feature vector independent of size. Then, the method detected ships through AdaBoost.
However, the above manually designed features only utilize the low-level visual information, and cannot accurately express the complex high-level semantic information in the image. Moreover, because of the large amount of calculation in classifier detection, it is difficult to meet the application requirements of a real-time system.

2.1.4. Summary

In addition to the aforementioned methods, nearshore ship–land segmentation [19,20,21,22] and grayscale information [23] are also common traditional ship-detection methods. They have achieved some good results in specific scenarios. However, they are vulnerable to complex environment and heavily rely on prior knowledge. Additionally, the features are manually designed, and lack good robustness and generalization ability in traditional methods.

2.2. CNN-Based Methods

The CNN-based AlexNet [24] won the first prize in the 2012 ImageNet competition, marking the advent of the CNN era. Since then, CNN-based ship-detection technologies have developed rapidly and achieved excellent results. Compared with traditional methods, CNNs can automatically extract ship features without manual design. The features possess more advanced semantic information, contributing to the improvement of detection results. CNN-based methods are mainly divided into anchor-based methods and anchor-free methods, in which anchor-based methods include a two-stage detector and a single-stage detector.

2.2.1. Two-Stage Detector

The anchor-based detector locates ships by defining a set of anchor boxes. Anchor boxes are a set of rectangular bounding boxes with different sizes and aspect ratios, and evenly distributed at each pixel position in the image. The network predicts and adjusts the positions of anchor boxes to precisely cover the ships. Then, by further judging the category of ship, the network completes the detection. Anchor-based detectors include a two-stage detector and a single-stage detector. The two-stage detector divides the ship detection into two stages. The network first predicts all proposed regions containing ships in the first stage, and then modifies these regions to accurately locate and classify ships in the second stage, as shown in Figure 4. The two-stage detector has high accuracy and robustness. However, due to the refinement process of the proposed regions, the detection efficiency still needs further improvement.
R-CNN: Girshick et al. [25] proposed R-CNN in 2014, marking the first attempt to incorporate deep learning into object detection. It significantly improves the results of detection. R-CNN uses the deep semantic features extracted by a CNN to replace the original shallow features (HOG, SIFT, etc.), further enhancing the discriminability of ships. Specifically, R-CNN first employs the Selective Search (SS) algorithm to divide the input image into approximately 2000 proposed regions, aiming to comprehensively cover the ships. Then, the network utilizes a CNN to extract features of each proposed region in turn, and sends them into the SVM classifier to obtain the detection results. At the same time, the network uses the regressor to adjust the positions of these proposed regions to accurately represent the ships.
SPPNet: Due to the size requirements of the classifier, R-CNN needs to standardize the sizes of proposed regions. It leads to the distortion and deformation of ships. To this end, He et al. [26] proposed SPPNet in 2015 which introduced spatial pyramid pooling (SPP). SPP divides the feature map into a fixed number of grids, and then performs max pooling for each grid. As a result, it can convert feature maps of arbitrary size into fixed-size feature vectors. Furthermore, compared with R-CNN, SPPNet significantly improves detection speed.
Fast R-CNN: In order to enable end-to-end learning for object detection and further improve the training speed, Girshick et al. [27] proposed Fast R-CNN in 2015. The network no longer needs to extract features for each proposed region separately; instead, it cleverly maps the regions to the feature map of the input image. At the same time, Fast R-CNN innovatively proposed ROI pooling, which can adapt the proposed regions of different sizes to a unified size to fit into the subsequent fully connected network. Fast R-CNN replaces the SVM classifier with a softmax layer. Furthermore, by designing a multi-task loss, the network is unified into a whole to train and optimize. Fast R-CNN greatly reduces training costs.
Faster R-CNN: Ren et al. [28] proposed Faster R-CNN, in which a region proposal network (RPN) replaced the SS algorithm for extracting ROIs. RPN proposed anchor boxes for the first time and it greatly improved the detection speed. Anchor boxes are evenly distributed at each pixel position of the feature map and fully cover it. Specifically, in the first stage, Faster R-CNN predicts the foreground and background probability of anchor boxes and performs rough boundary adjustments. Then, it maps anchor boxes to the feature map to support predictions in the second stage.
R-CNN improvement: Following the concept of R-CNN, some detectors improved from R-CNN have been successively proposed, such as Mask R-CNN [29], Cascade R-CNN [30], Libra R-CNN [31], Grid R-CNN [32], etc. These detectors improve Faster R-CNN from different aspects, aiming to meet the application requirements in various scenarios and achieving excellent detection results.
A two-stage detector achieves high precision and robustness in ship detection. For example, Guo et al. [33] proposed rotational Libra R-CNN to accurately predict the position of rotated ships. Li et al. [34] introduced the hierarchical selective filtering layer into Faster R-CNN to generate more accurate prediction boxes. Nie et al. [35] proposed a nearshore ship-detection method based on Mask R-CNN which introduced Soft-NMS to reduce the occurrence of missed detection.

2.2.2. Single-Stage Detector

In the single-stage detector, the results can be directly output after passing through a deep network, eliminating the time-consuming aspect of region proposals, as shown in Figure 5. Compared with the two-stage detector, the single-stage detector trades off the accuracy and efficiency. It is suitable for applications that require high real-time accuracy and high efficiency.
YOLO: Redmon et al. [36] first proposed the representative of single-stage detectors in 2016, known as You Only Look Once (YOLO). The image only passes through the CNN, and the ship category and location can be generated directly. Specifically, YOLOv1 divides the input image into 7 × 7 grids, and each grid generates two prediction boxes to predict the ship category and location. YOLO reduces the complexity of the algorithm and increases the detection speed. However, YOLOv1 can only detect one ship per grid, resulting in poor detection performance for dense ships. Therefore, many researchers have made a series of improvements on the basis of YOLOv1, including data preprocessing, feature extraction, and anchor box generation [37,38,39,40,41]. These methods have elevated the accuracy of single-stage detectors to a new level while maintaining YOLO’s high detection speed, achieving further balance in performance. To date, the latest algorithm in the YOLO series, YOLOv8, has been published in GitHub. It incorporates innovative improvements over YOLOv5, including backbone, decoupling detection head, loss function, and sets the algorithm in an anchor-free form. YOLOv8 has the advantages of light weight and high efficiency.
SSD: Liu et al. [42] combined the regression concept of YOLO with the anchor mechanism of Faster R-CNN, proposing the SSD in 2016. SSD sets anchor boxes with different aspect ratios at each pixel of the feature map for predicting the classification and regression of ships. At the same time, multi-scale detection technology is introduced in SSD. By setting up six scale feature maps, the model gains the capability to detect ships at multiple scales, especially small ones. SSD provides a new approach for the design of single-stage detectors by incorporating the anchor mechanism, which can achieve effective coverage of ships.
RetinaNet: During the training process, anchor mechanisms may lead the model to excessively focus on the background regions where negative samples are located, thereby affecting detection performance. For this reason, Lin et al. [43] proposed RetinaNet in 2017, and Focal Loss effectively addresses the issues of positive and negative samples imbalance as well as difficulty imbalance. By utilizing Focal Loss, the network achieves weighted positive samples through balanced cross-entropy, enhancing the ability to detect positive samples. Simultaneously, the network maps the confidence of each category to a weight coefficient added to the loss, improving the ability of the network to detect difficult samples. The proposal of RetinaNet makes it possible to imagine that the single-stage detector can compete with the two-stage detector in detection accuracy.
There are strict limitations on the detection speed due to the real-time requirements of monitoring the sea situation. Therefore, more and more researchers are committed to deep development of single-stage detectors to meet the requirements of ship detection. For example, Patel et al. [44] compared the detection capabilities of different versions of the YOLO algorithm. Gong et al. [45] integrated the shallow features of SSD and introduced context information, improving the detection accuracy. Wu et al. [46] employed RetinaNet as the backbone and proposed the hierarchical atrous spatial pyramid to obtain larger receptive fields.
In summary, anchor-based detectors include two-stage detectors and single-stage detectors. Anchor boxes fully cover the image per pixel, significantly enhancing detection accuracy. However, the drawbacks of the anchor mechanism are as follows: Firstly, the ship regions occupy only a small portion of an image, resulting in the majority of anchor boxes being assigned to irrelevant backgrounds. Therefore, the massive tiling of anchor boxes introduces redundant computations. Secondly, anchor boxes require setting hyperparameters, and unreasonable configurations may lead to performance degradation. Finally, predefined aspect ratios result in poor performance when matching irregularly shaped ships, causing the detector to lack generalization.

2.2.3. Anchor-Free Detector

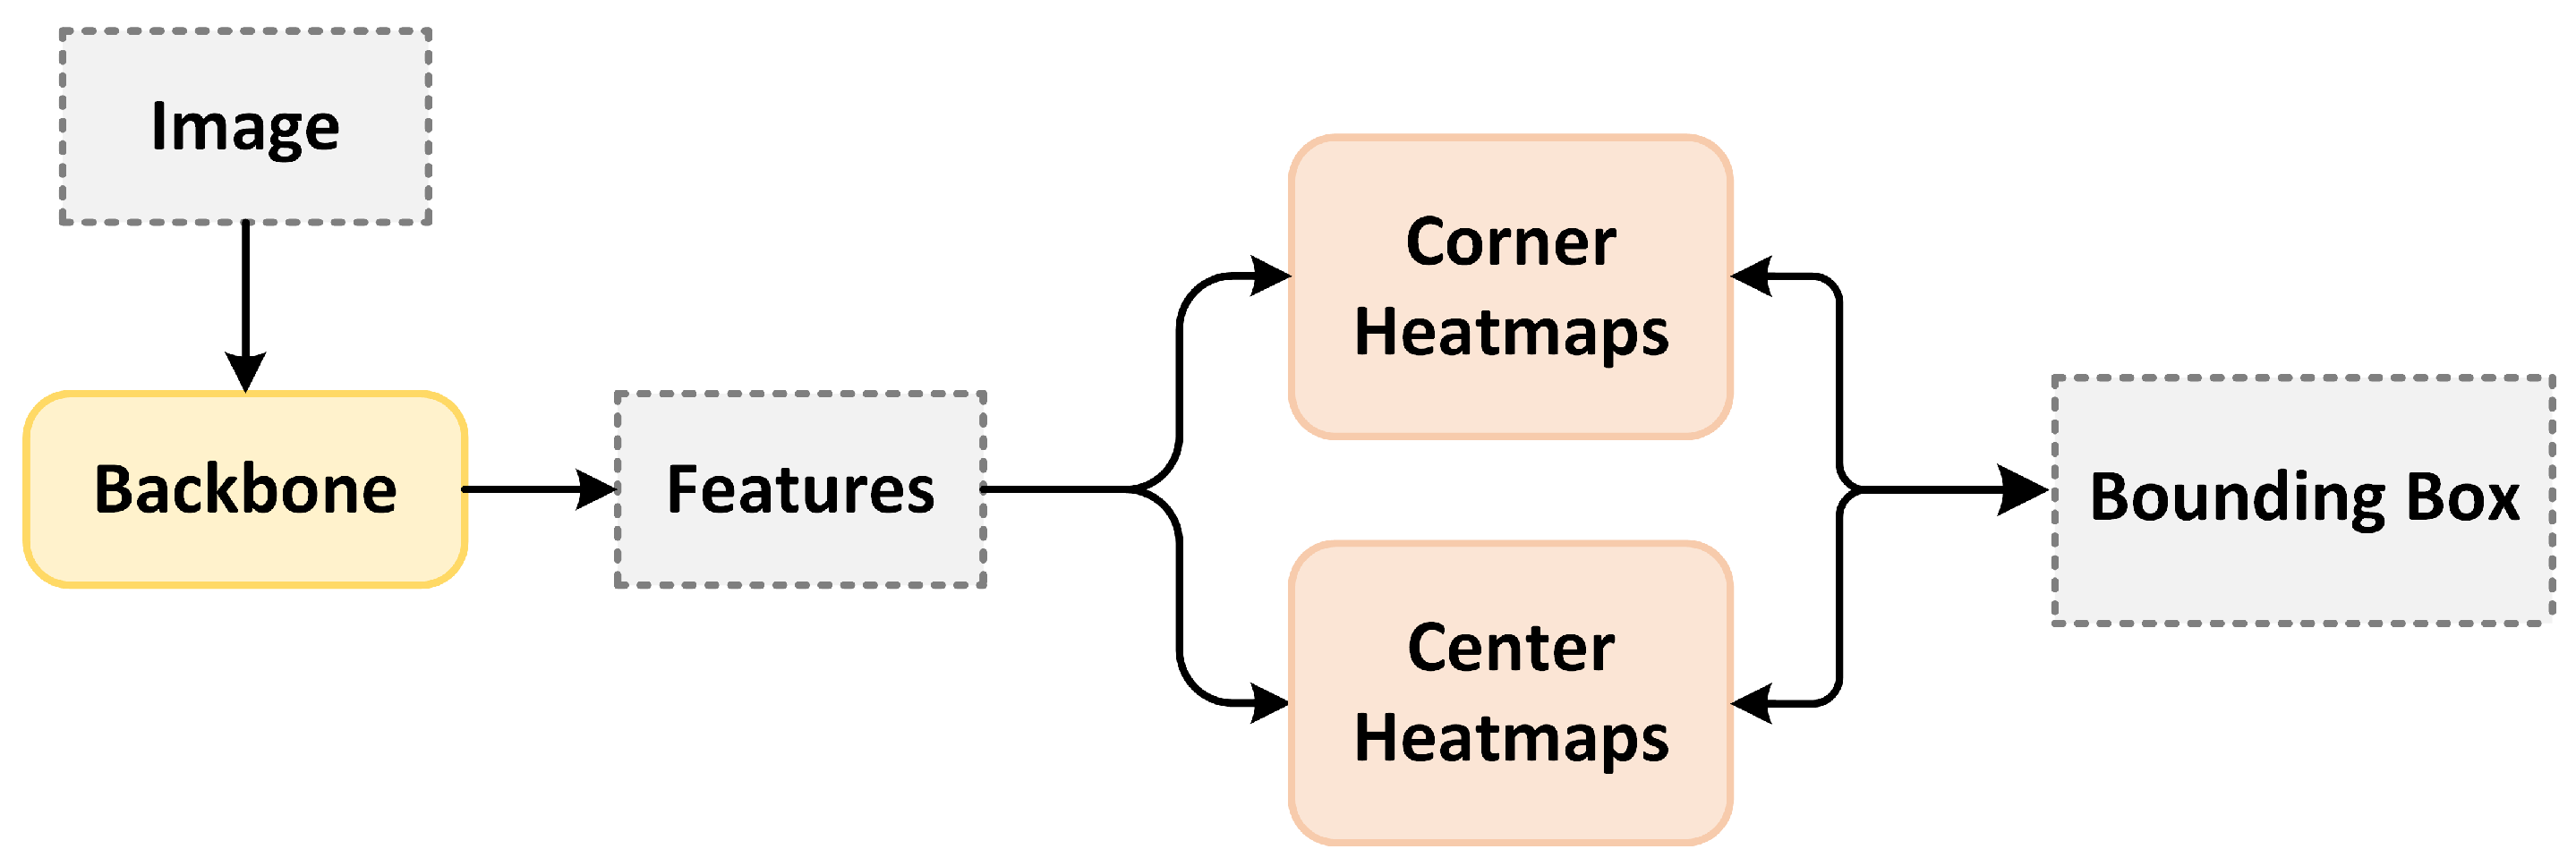
The anchor-free detector breaks limitations of the anchor-based detector, providing a new reference path for ship detection. The anchor-free detector uses keypoints instead of anchor boxes to detect ships, which enhances the ability to process ships of different shapes, as shown in Figure 6. It improves the generalization of the model.
CornerNet: Law et al. [47] proposed CornerNet which was the first to implement the anchor-free detector in 2018. It adopts the keypoint detection method and proposes corner pooling. By predicting the top-left and bottom-right points, Corner pooling generates prediction boxes to determine the ship positions. It significantly reduces the amount of calculation and improves the speed of detection.
CenterNet: Inspired by CornerNet, Zhou et al. [48] proposed CenterNet in 2019. CenterNet takes the peak points of the heatmap generated by the image as the center points of ships. Then, it regresses the width, height, weight, and other information of ships based on the center points to generate prediction boxes.
FCOS: Tian et al. [49] proposed an anchor-free detector using pixel prediction in 2019, named FCOS. It introduces center-ness to measure the distance between predicted pixels and the actual center of ships. Center-ness effectively inhibits the generation of low-quality prediction boxes.
An anchor-free detector has the obvious advantage of alleviating the imbalance between positive and negative samples. Therefore, it achieves excellent performance in ship detection. For example, Yang et al. [50] improved the weight assignment method of center-ness in FCOS, making it better aligned with the shape of ships. It more effectively suppressed the generation of low-quality prediction boxes. Zhuang et al. [51] proposed CMDet based on FCOS to detect rotated ships. Zhang et al. [52] introduced the recall-priority branch based on CenterNet to alleviate the occurrence of missed detection.
However, due to the lack of anchor boxes, the capability of ship detection completely depends on the recognition of keypoints. Anchor-free detector exhibits poor performance for ships with ambiguous keypoints. Moreover, it cannot effectively handle overlapping or occluded ships.

2.2.4. Summary

Compared with traditional ship-detection methods, CNN-based methods demonstrate superior robustness and accuracy. Currently, CNN-based methods have become the primary methods for ship detection. According to the specific requirements, different detectors are adopted in different ship detections. For high-precision detection, two-stage detectors are considered more suitable. Furthermore, single-stage detectors are more suitable for scenes with high requirements for real-time performance. In addition, anchor-free detectors can effectively address problems such as imbalance between positive and negative samples, and redundant calculations in anchor-based detectors.

2.3. Transformer-Based Methods

Vaswani et al. [53] proposed a simple network architecture, Transformer, and implemented efficient natural language processing (NLP) in 2017. Transformer abandons traditional recurrent and convolutional structures, adopting an encoder–decoder structure based on multi-head self-attention mechanism, as shown in Figure 7a,b. In this process, the encoder maps input sequences into a continuous representative sequence through global attention operations. Furthermore, the decoder is auto-regressive. It is able to better capture long-range contextual relationships by interacting with the output of the encoder during sequence generation. Furthermore, the parallel computing capability of Transformer greatly enhances training speed. Benefiting from the satisfactory performance in NLP, researchers are attempting to explore its applications in computer vision. In recent years, Transformer has been extended to object detection and has made great contributions. According to differences in model design, it can be divided into Transformer-based detector and Transformer-based backbone.

2.3.1. Transformer-Based Detector

DETR: Carion et al. [54] proposed DETR, which first applied Transformer to object detection in 2020. DETR views ship detection as a set prediction problem. Specifically, DETR first extracts feature maps using CNN. Then, they are converted into one-dimensional vectors and fed into the encoder along with positional codes. Afterward, the encoder sends the output vectors into the decoder along with object queries. Finally, the decoder sends the output to a shared feed-forward network to obtain the detection result. DETR matches the predicted object queries with ships, seeking an optimal matching scheme with the lowest cost. Therefore, DETR circumvents the NMS procedure and achieves end-to-end detection.
Deformable DETR: The high computational cost and spatial complexity of the self-attention mechanism result in a slow convergence speed of DETR. The resolution that DETR can process is limited, and it is not ideal for detecting small ships. To address it, Zhu et al. [55] incorporated the concepts of deformable convolution and multi-scale features into DETR, proposing Deformable DETR. Furthermore, the deformable attention module was designed to replace the traditional attention module. It allows each reference point to focus only on a set of sampling points in its neighborhood, and the positions of these sampling points are learnable. It reduces the computational burden in irrelevant regions and decreases training time. At the same time, the introduction of multi-scale feature maps realizes the hierarchical processing for ships of different sizes. Deformable DETR is capable of effectively performing detection tasks of different scales.

2.3.2. Transformer-Based Backbone

Swin Transformer: Liu et al. [56] proposed Swin Transformer, attempting to combine the prior knowledge of a CNN with Transformer. Swin Transformer employs the idea of the local context in a CNN, where the model calculates self-attention only within each local window. It significantly reduced the sequence length and improved computational efficiency. Swin Transformer also introduced the idea of translational invariance from CNNs. The shifted window approach facilitates information interaction between adjacent windows, achieving the goal of global information extraction. It first demonstrated that Transformer can be used as a general backbone in computer vision.
PVT: Wang et al. [57] proposed a Transformer backbone suitable for dense object detection, named PVT. By incorporating the pyramid structure from CNN, PVT can extract better multi-scale feature information. Meanwhile, compared with traditional multi-head attention, spatial reduction attention ensures that PVT can obtain high-resolution feature maps while reducing computational cost.
TNT: Transformer struggles to capture the correlation within patches, which leads to the omission of small objects. To this end, Han et al. [58] proposed a Transformer in Transformer (TNT) architecture. TNT further divides each patch and then computes self-attention within each patch. As a result, TNT cannot only model global information, but also better capture local information, extracting more detailed features.

2.3.3. Summary

The issues of high parameters and computational consumption in Transformer greatly restrict its practical application scenarios. Furthermore, the high data requirements make it challenging to achieve satisfactory results on small datasets. These factors limit its development in ship detection. However, compared to CNN-based methods, Transformer can thoroughly explore long-range dependencies in targets, and effectively capture global features. It increases the identifiable information of ships from a global perspective. Transformer has significant potential for development in ship detection. However, there is currently a lack of research on the optimization of ship characteristics, which may be a key hindrance to the development of this field. Therefore, addressing the above issues and fully leveraging the advantages of Transformer in ship detection require more efforts in the future. Furthermore, in order to facilitate the comparison of the three methods, we summarize them and their advantages and disadvantages in Table 1.

3. Challenges and Solutions in Ship Detection

Due to the significant differences between optical remote-sensing images and natural images, and variations in the features of ships compared with other targets, applying classical object detection algorithms directly results in low detection accuracy and missed detection. Therefore, this section summarizes the reasons for the low accuracy in SDORSIs, including complex marine environments, insufficient discriminative features, large scale variations, dense and rotated distributions, large aspect ratios, and imbalances between positive and negative samples. Furthermore, the corresponding solutions based on CNNs and their advantages and disadvantages are analyzed in detail. Challenges and solutions are shown in Figure 8.

3.1. Complex Marine Environments

Optical remote-sensing images can provide rich information, but they are susceptible to factors such as light and weather. These adverse background factors bring significant interference to ship detection, resulting in missed or false detection. At the same time, there are usually only a few ships in remote-sensing images of the sea, while the background occupies the majority of the area. The extreme imbalance phenomenon causes the detector to overly focus on background regions, but ignores the effective extraction of ships. Therefore, it is a necessary processing strategy to guide the network to pay more attention to ships and ignore irrelevant background in SDORSIs. At present, there are several main solutions for complex backgrounds: image preprocessing, attention mechanisms, and salience constraints.

3.1.1. Image-Preprocessing-Based Method

Image preprocessing is one of the feasible methods to deal with complex background. It primarily suppresses the expression of background through prior information during the image preparation stage to reduce the contribution of the background, allowing the model to focus on learning ship features. Through the method of active guidance, image preprocessing greatly reduces the impact of complex background in SDORSIs.
Yu et al. [59] developed an embedded cascade structure. It removes the majority of irrelevant background in advance, and selects regions containing ships for training. The method alleviates the imbalance of the foreground and background, and reduces the interference of the background. Zheng et al. [60], Song et al. [61], and Yang et al. [62] designed image dehazing algorithms to restore images, addressing the issues of cloud occlusion in ocean scenes. Dehazing algorithms improve the image quality and are beneficial for enhancing detection accuracy. However, Li et al. [63] argued that existing dehazing algorithms did not distinguish between blurry and clear images. Excessive deblurring of clear images could lead to degrading image quality. Therefore, they proposed the blurred classification and deblurring module which obtained clear images and improved detection accuracy.
However, it should be noted that some image preprocessing methods require processing images independently based on prior knowledge, lacking generalization ability. Furthermore, some methods may introduce more convolutional layers which require additional training for the network.

3.1.2. Attention-Mechanism-Based Method

Due to the bottleneck in information processing, human cognitive systems always tend to selectively focus on important information and ignore secondary information. The core idea is to weight different parts of the input sequence according to the importance of features, and enhance the contrast between ships and the background at the feature level. Without human intervention, the attention mechanism operates end-to-end. Attention-mechanism-based methods generate prominent feature maps, which effectively highlight ship regions and suppress the expression of irrelevant background regions. Therefore, introducing attention mechanism is one of the effective methods to deal with complex background issues.
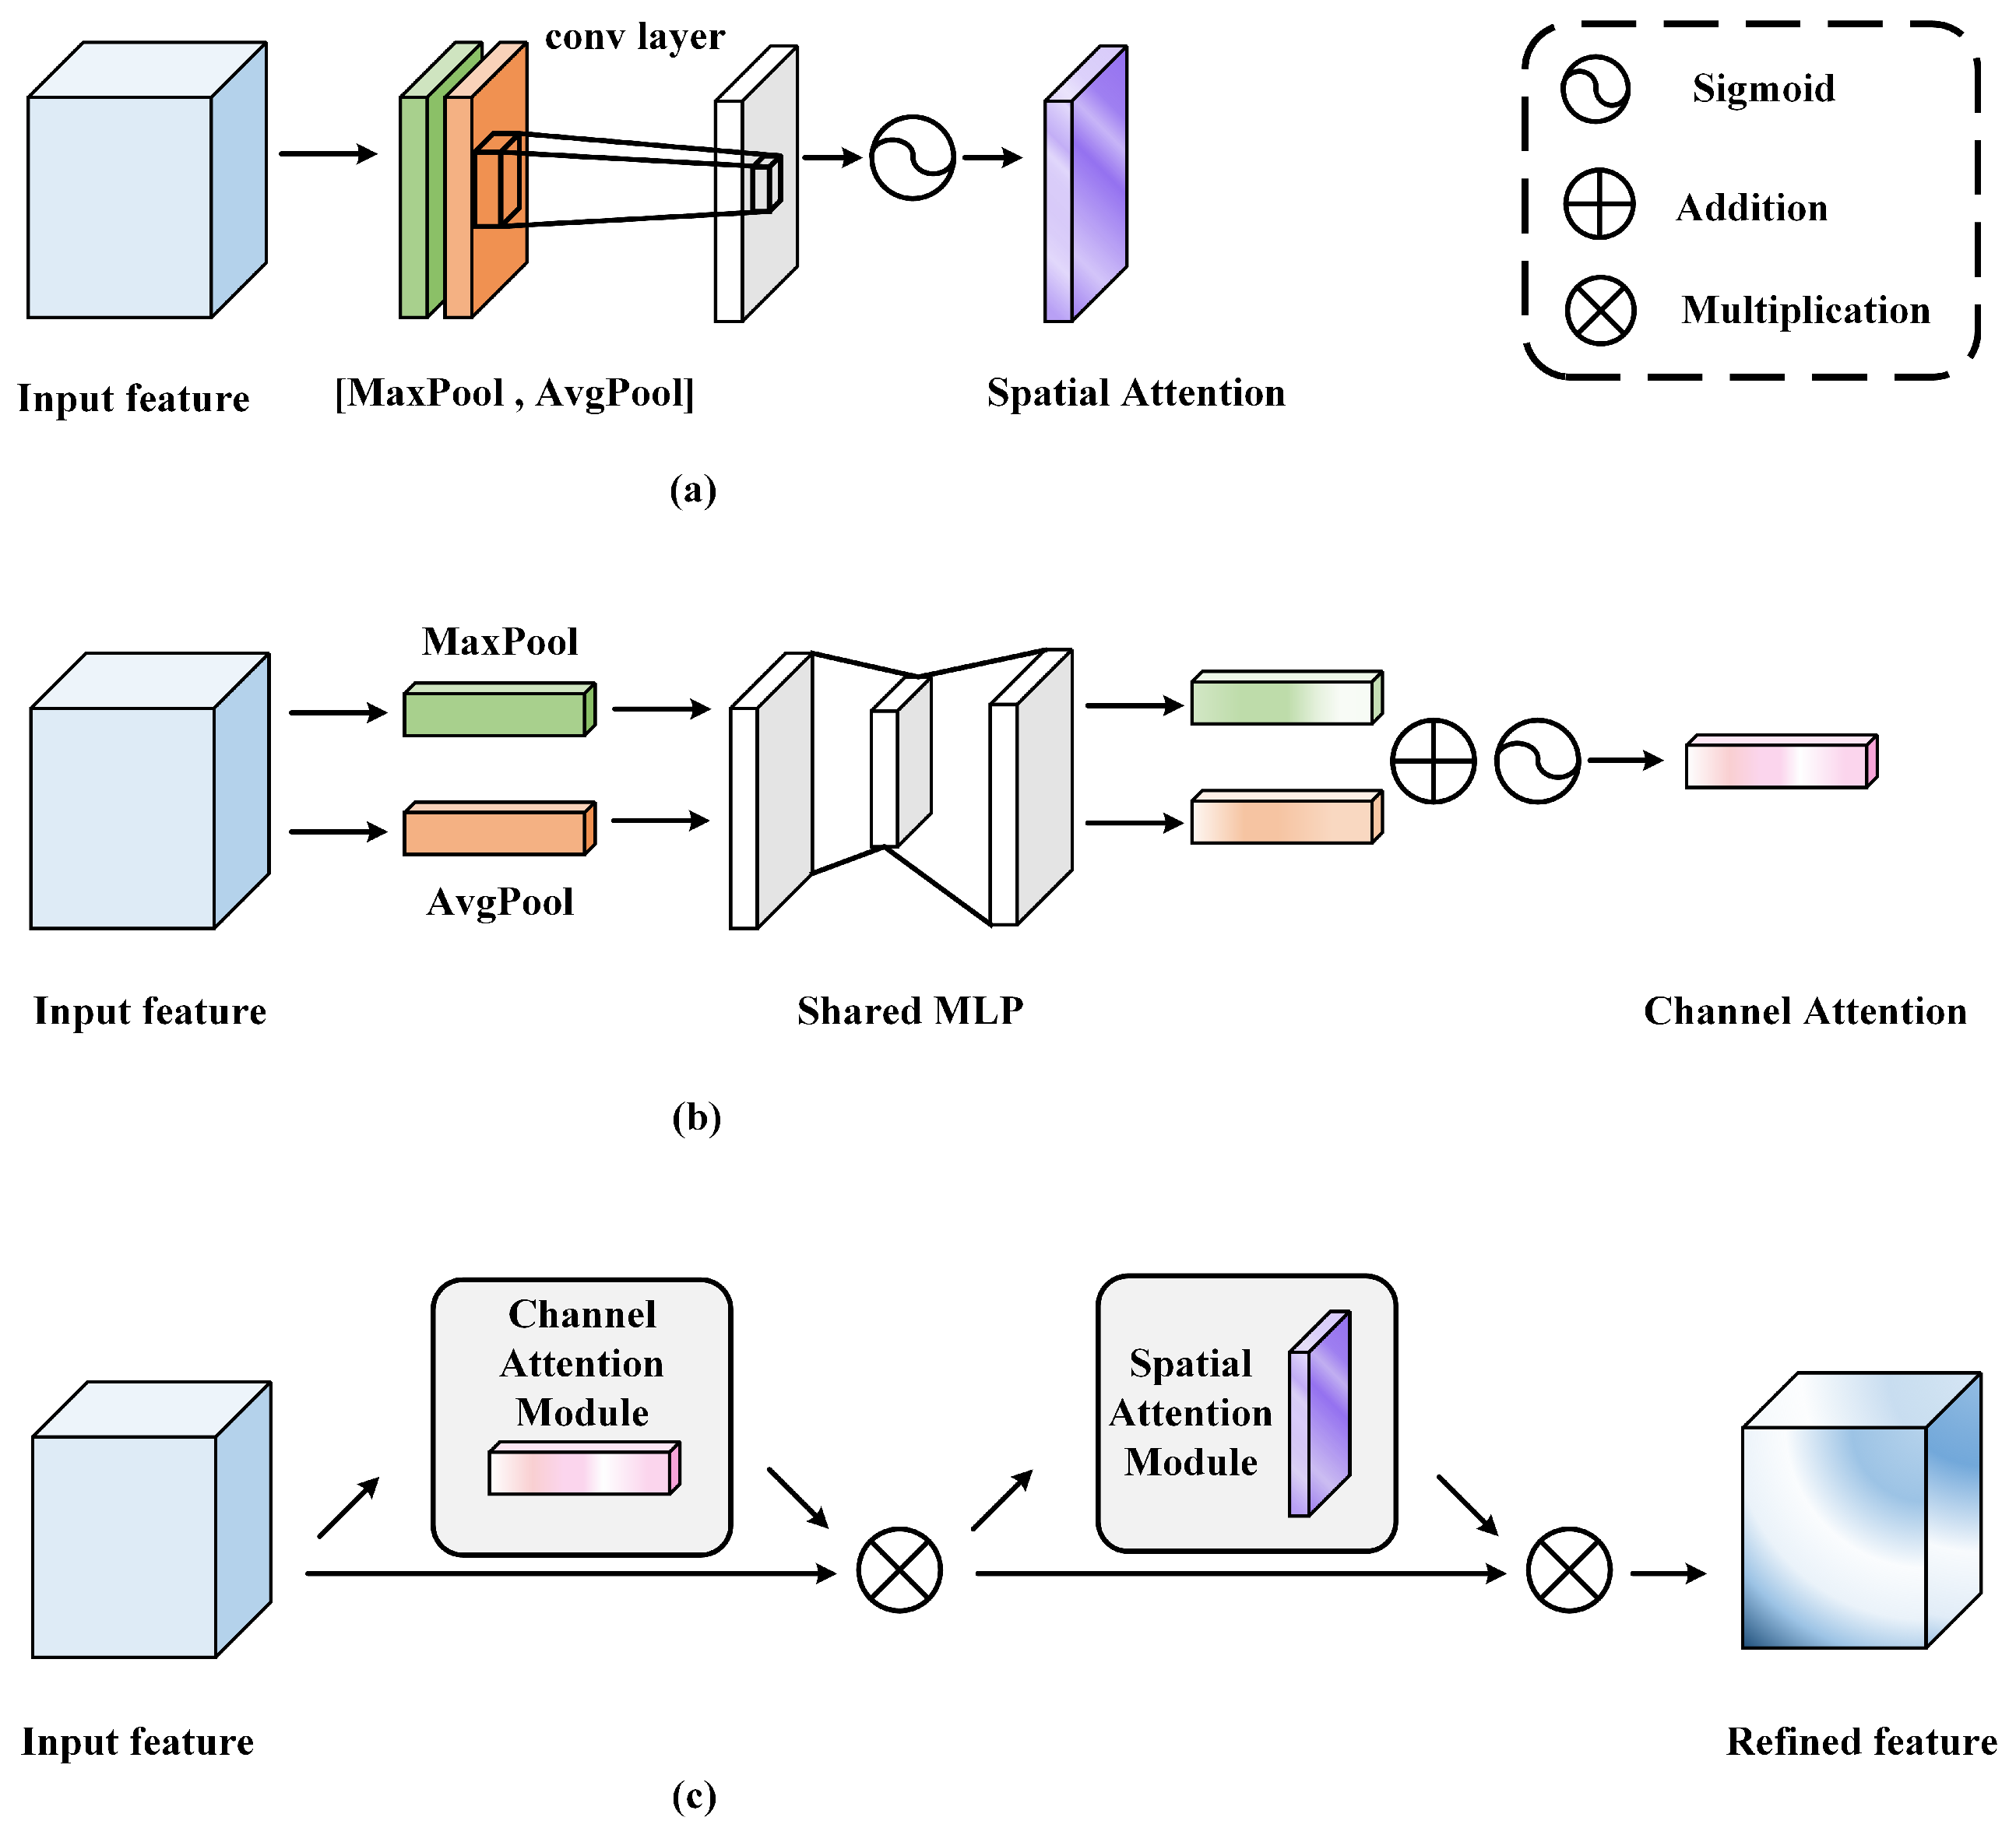
Li et al. [64] introduced the channel attention mechanism, as shown in Figure 9b, into multiple receptive field fusion modules to suppress irrelevant background information. Wang et al. [65] attached the channel attention mechanism to the backbone to enhance the capability of extracting ship features in complex backgrounds. Hu et al. [66] and Qin et al. [67] incorporated both a spatial attention mechanism, as shown in Figure 9a, and a channel attention mechanism to highlight the ships. Chen et al. [68] designed a coordinate attention module. It effectively combines spatial attention and channel attention to enhance the ability of ship feature representation. Qu et al. [69] added a convolutional attention module to YOLOv3, as shown in Figure 9c, highlighting ship features and improving detection accuracy.
However, an attention mechanism increases the complexity of network computing. Furthermore, if the network overly relies on it in SDORSIs, it may lead to a decreased ability to generalize.

3.1.3. Saliency-Constraint-Based Method

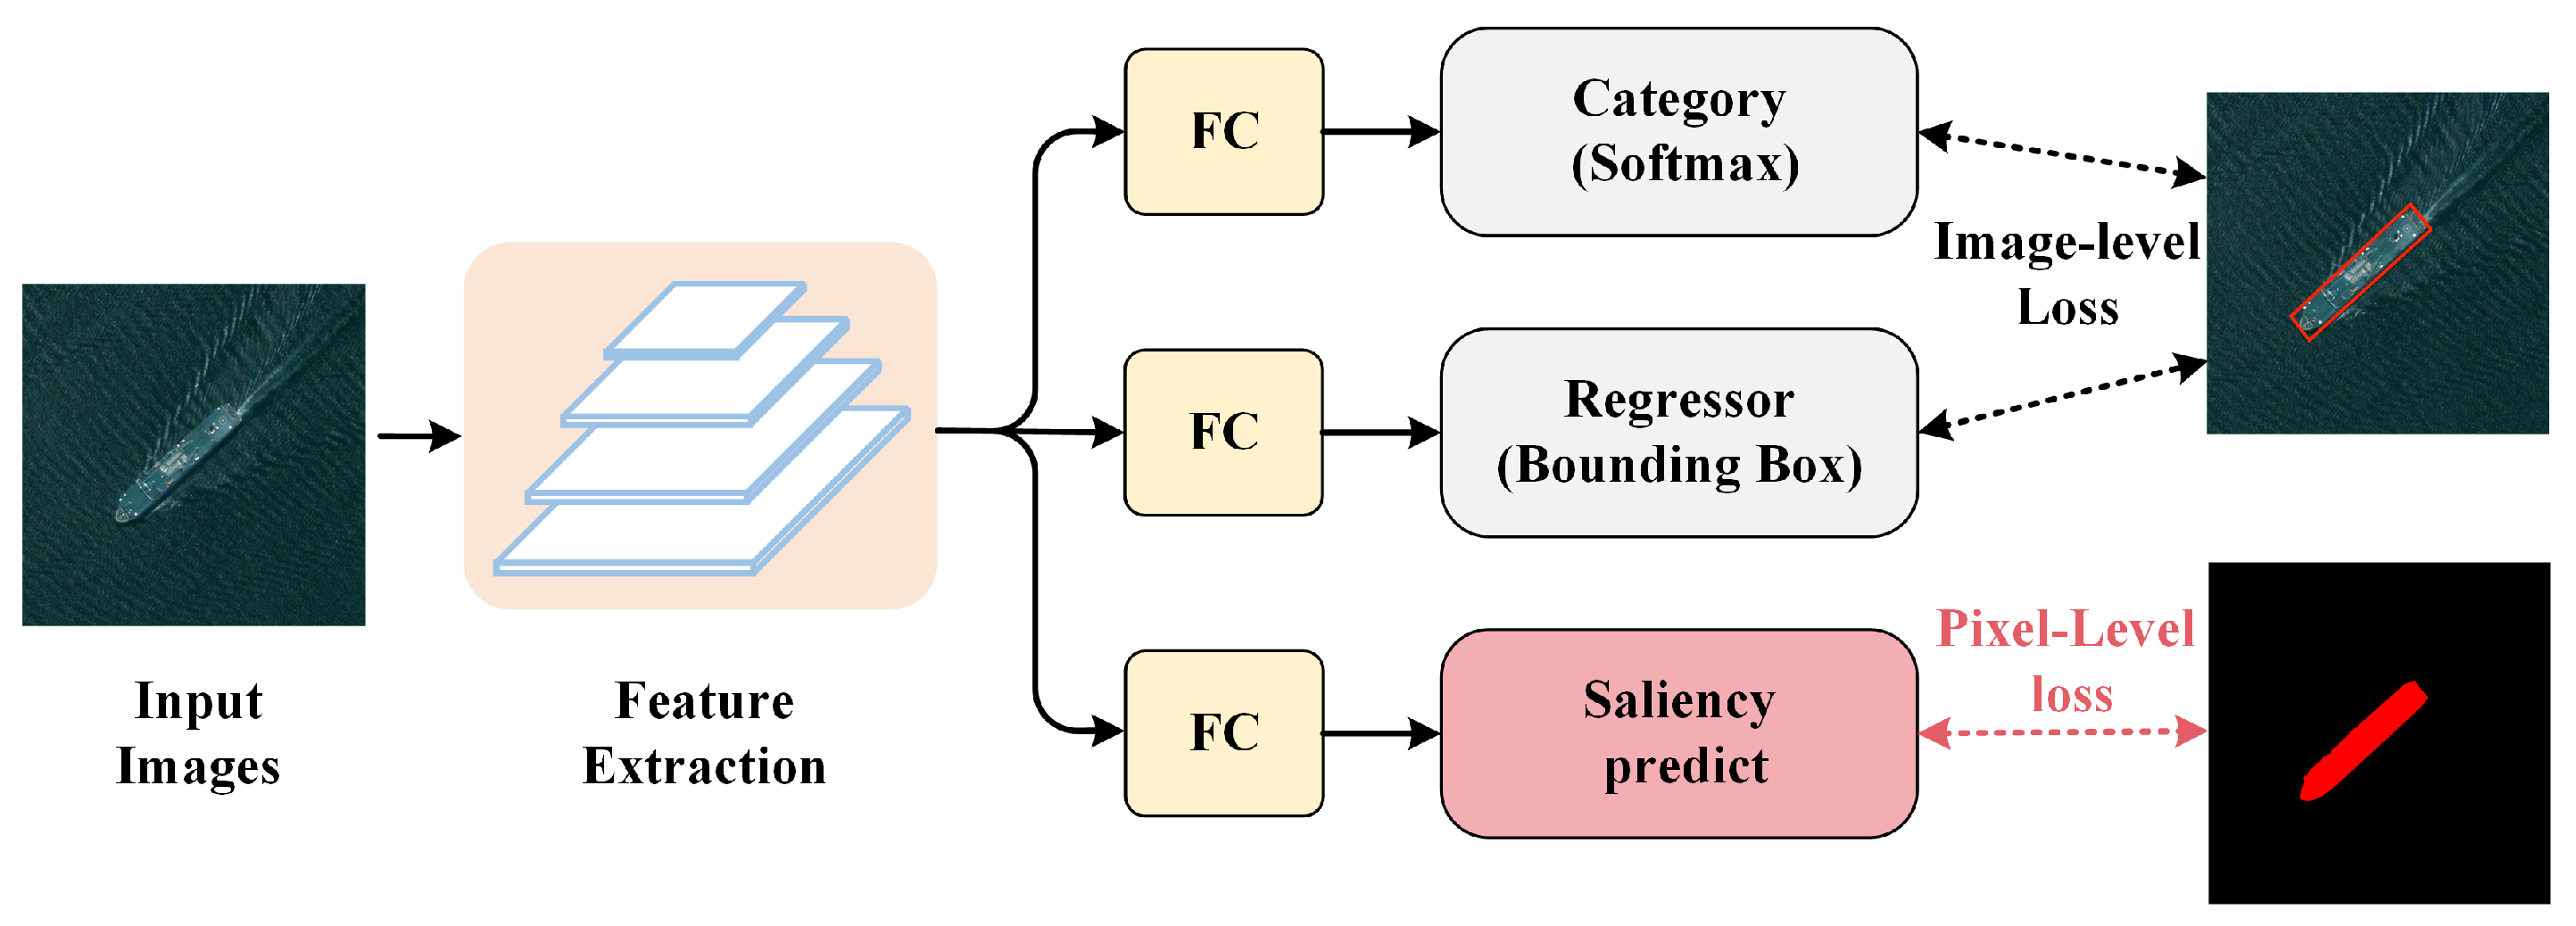
The saliency-constraint-based method adopts the idea of multi-task learning, constraining the network to focus on ships by designing the loss function, as shown in Figure 10. Firstly, the method utilizes prior information to create significance maps as labels. The values on labels reflect the importance of pixel positions, and the higher value indicates the higher attention of the ship. Then, a saliency prediction branch is added to output the predicted saliency maps. Through pixel-level loss constraints, the model pays more attention to ship regions during the training phase, thereby suppressing the impact of the background. The method enables the network to prioritize focusing on saliency regions with obvious visual features, and ignore the irrelevant background. It can narrow down the detection range and enhance detection efficiency.
Ren et al. [70] added a saliency prediction branch to introduce saliency information with stronger foreground expression ability in SDORSIs. It improves the ship detection capability in complex environments. Chen et al. [71] designed a degradation reconstruction enhancement network. By selective degradation, the network obtains “pseudo saliency maps”. Then, the maps are used to guide the network to focus more on ship information and ignore the irrelevant background in the training stage.
Visual saliency employs pixel-level supervision to guide the network and greatly addresses the challenge of complex backgrounds in SDORSIs. However, the generation of saliency maps requires clearer spatial distribution, which has demands on the details and resolution of feature maps. Furthermore, the weight of multi-task loss needs to be adjusted manually.

3.1.4. Summary

Complex environmental interference is one of the main challenges for the difficult improvement of SDORSI results. The existing research indicates that optimization strategies such as image preprocessing, attention mechanisms, and saliency constraints contribute to improving detection performance. The essence of these methods is to highlight ships and make the network focus on ship features. However, the methods are inevitably associated with some disadvantages. Simple methods are not suitable for more complex environments. Furthermore, paying too much attention to the background of a specific dataset leads to overfitting, hindering the network from generalizing. In order to provide readers with a more intuitive understanding, the methods and the main advantages and disadvantages in complex marine environments are shown in Table 2.

3.2. Insufficient Discriminative Features

Unlike occupying a large proportion in natural images, ships usually cover only a few dozen pixels in optical remote-sensing images, which makes them challenging to detect. As a deep network continuously compresses and extracts features, the crucial information of small ships is easily suppressed. Therefore, insufficient discriminative features of small ships are the main reason for missed detection. It remains a challenge in ship detection, and has not been effectively solved. Currently, context information mining and feature fusion are effective methods to improve the accuracy of small ship detection. These methods focus on extracting effective information from the surroundings or inside of ships to enhance the feature expression ability.

3.2.1. Context Information Mining-Based Method

Context information mining refers to enhancing the information processing ability of the network by obtaining the environment information around the ship. The information is closely related to ships and helps to identify small ships with network uncertainty, thereby improving the accuracy and robustness. When detecting small ships, exploring contextual information that is closely connected with the ship can help obtain contents conducive to detection. It can alleviate the issue of insufficient discriminative features of small ships and improve the detection accuracy.
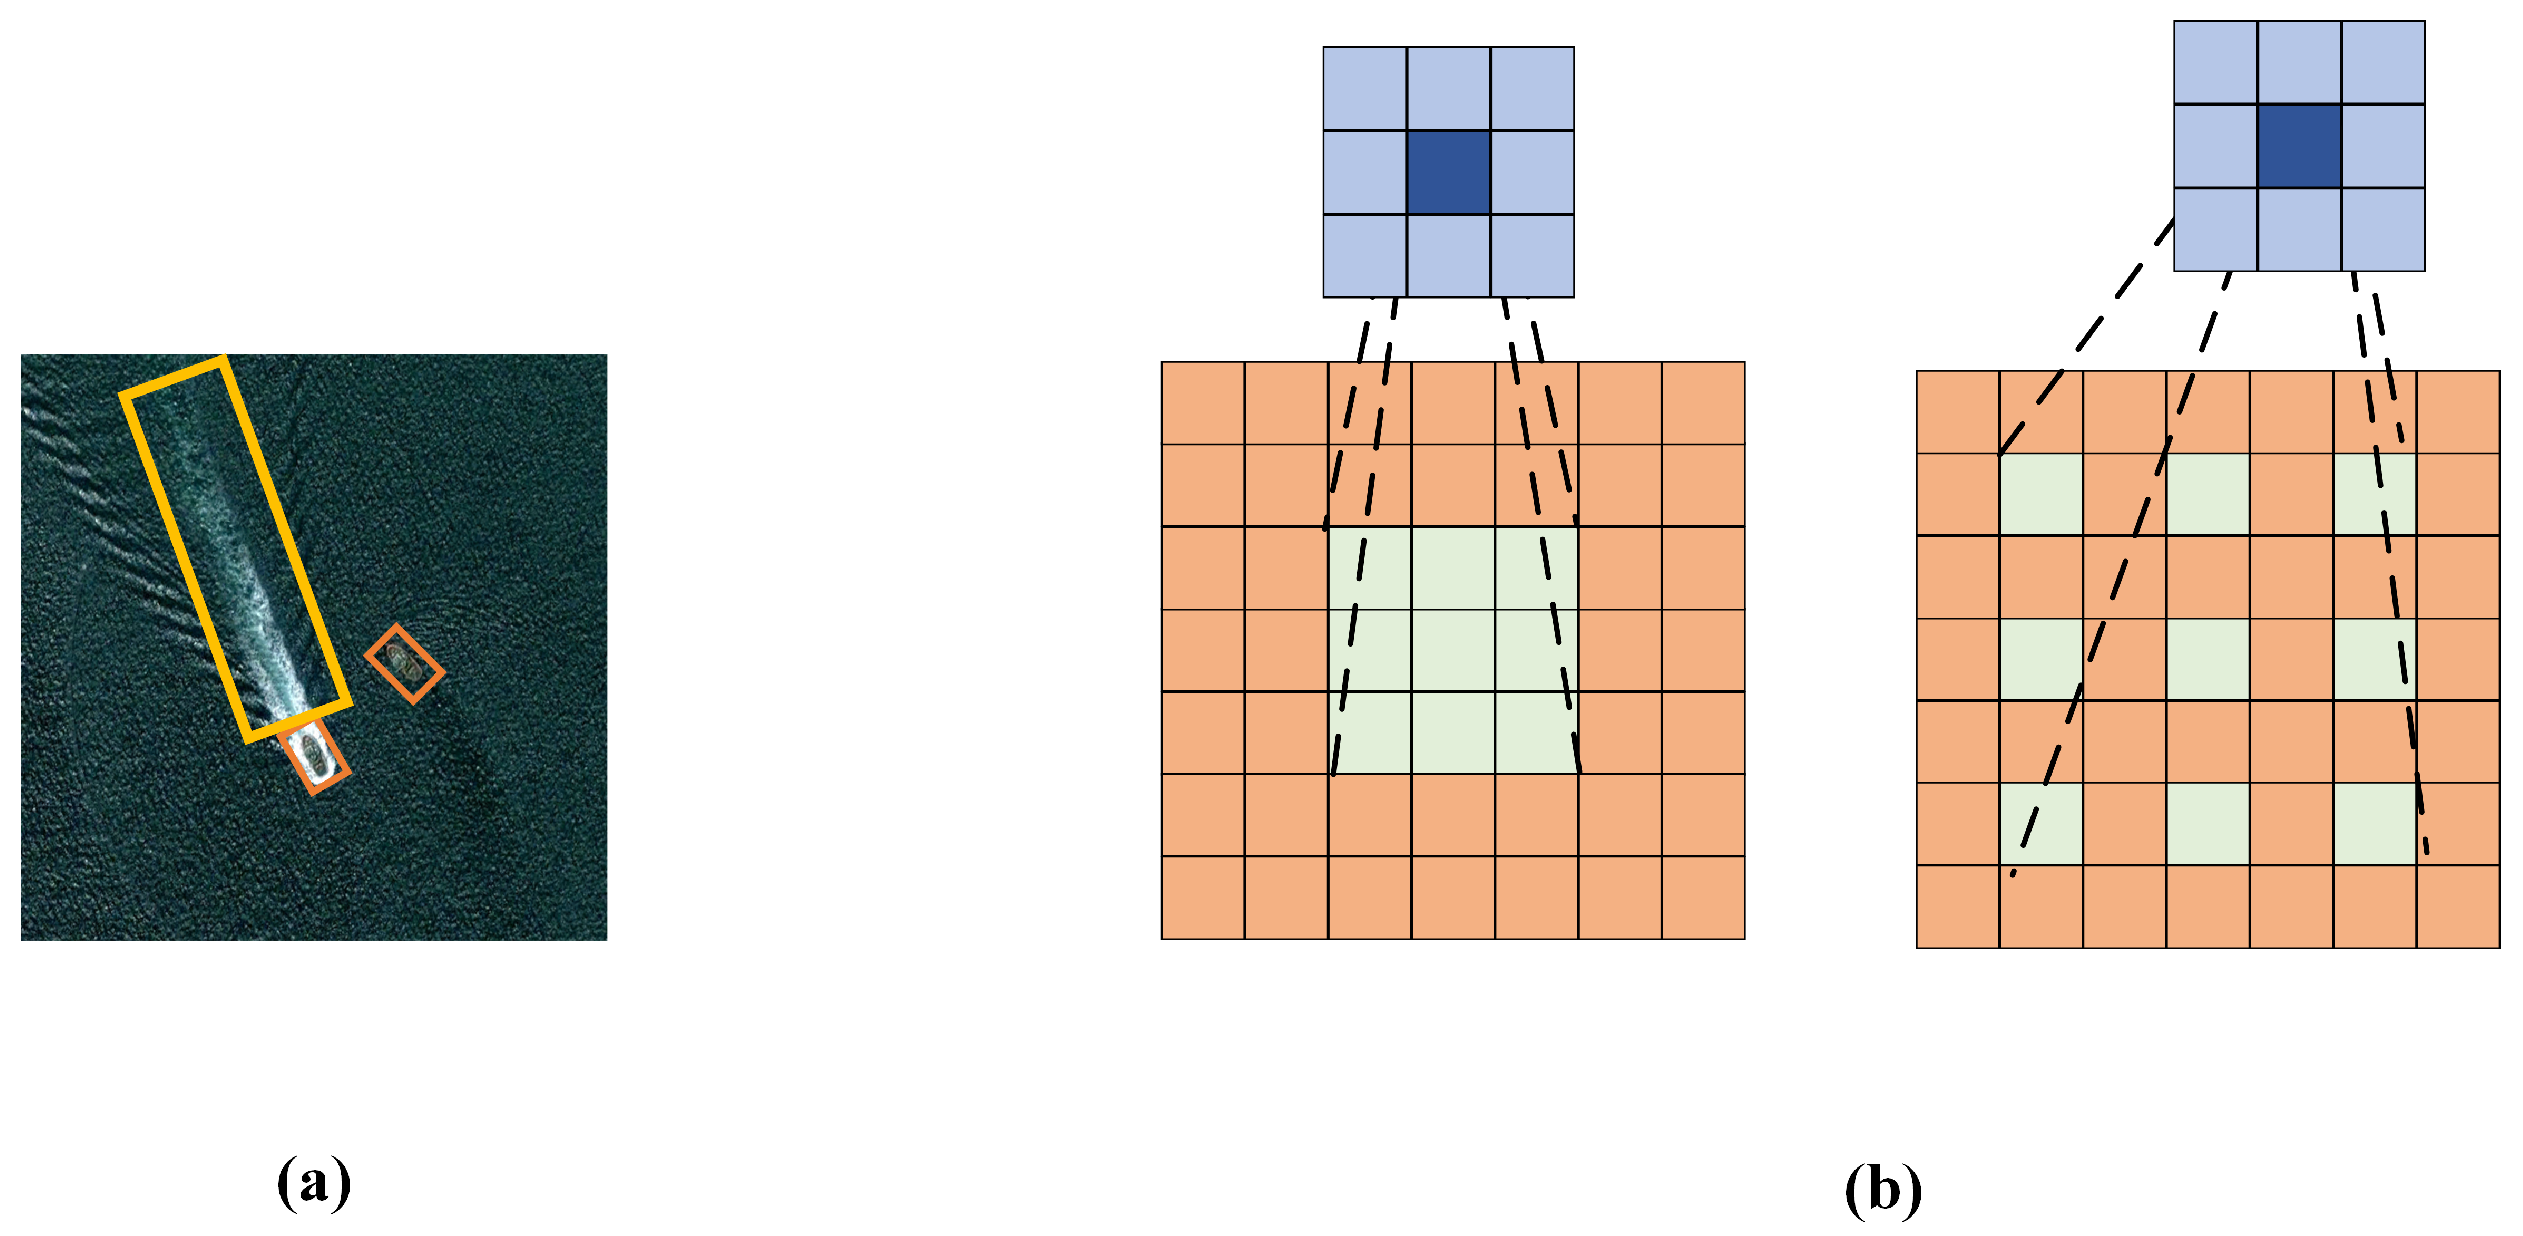
Ship-wake-based method: Ships navigating at sea usually occupy only a few dozen pixels in optical remote-sensing images, but their wake often reaches hundreds of pixels, as shown in Figure 11a. Wake refers to the visual trace created by the movement of ships, such as waves or disturbances on the sea. It is closely associated with ships and provides crucial contextual information, which can be used to enhance ship detection performance. Liu et al. [72], Xue et al. [73], Liu et al. [74], Liu et al. [75], and Liu et al. [76] introduced wake as contextual information. By employing a cascaded method of ships and wake, the network achieved excellent performance.
Dilated-convolution-based method: Increasing the receptive fields while maintaining resolution can help obtain more contextual information, helping the network to detect small ships better. Using a large kernel to extract information is regarded as an effective method for increasing the receptive fields. However, the parameters of it increase the computational burden. Therefore, the dilated convolution is developed as the context information mining method, as shown in Figure 11b. Xu et al. [77], Chen et al. [78], and Zhou et al. [79] used dilated convolution instead of regular convolution to extract ship features. Dilated convolution can capture more context information without bringing too many parameters, introducing more references in SDORSIs.
It is worth noting that the extraction of context information requires a balance, as introducing irrelevant information may harm the performance. Furthermore, because of gaps in the dilated convolution kernel, the feature extraction may result in discontinuity of information. Therefore, the network needs to stack multiple dilated convolutions to ensure the integrity of feature.

3.2.2. Feature-Fusion-Based Method

A CNN has a hierarchical structure, and generates features with multiple resolutions. Shallow features contain more detailed information, such as ship boundary, which is beneficial for ship localization. Furthermore, deep features contain more semantic information, such as the discriminant parts of the ship, which is more conducive to ship classification. Feature fusion can obtain rich semantic information and localization information on a feature map to enhance the discriminative features of small ships.
Liu et al. [80] integrated three feature maps of different sizes in the same channel dimension, enhancing discriminative features. Li et al. [81] first proposed a pooling-based method to integrate features, fully leveraging the advantages of features with different resolutions in ship detection. Tian et al. [82] designed a dense feature reconstruction module. By integrating high-resolution detailed information with low-resolution semantic information, small ship features were enhanced. Qin et al. [83] aggregated features based on residual network to improve the accuracy of ship detection. Han et al. [84] proposed a dense feature fusion network. It effectively integrated information without consuming additional memory space. Wen et al. [85] proposed a method of cross-skip connection to flexibly fuse information.
Feature fusion is an effective method to detect insufficient discriminative features of small ships. However, it increases the computation and model complexity, which are detrimental to detection speed. Furthermore, improper fusion methods may result in loss or confusion of information.

3.2.3. Summary

Insufficient discriminative features are a major challenge in SDORSIs, and enhancing the feature representation ability of ships is a key technology to alleviate this problem. The experiments indicate that methods of context information mining and feature fusion can enhance the discriminative ability of small ships, further improving the detection effect. However, the significant performance gap between small and large ships indicates that there is still considerable room for improvement. Specifically, the unfairness in Intersection over Union (IoU) evaluation and the indifference in regression loss contribute to the disregard of small ships in detection. Therefore, in order to effectively address this challenge, increasing the attention of small ships detection is the key point for future work. The methods and the main advantages and disadvantages of insufficient discriminative feature are shown in Table 3.

3.3. Large Scale Variation

Compared with natural images, the scale variation of ships in optical remote-sensing images is larger. With the down sampling of optical remote-sensing images, the spatial resolution decreases. The information of small ships may vanish in deep features, causing the detector to fail to identify crucial discriminative features. Therefore, only relying on single-scale information for detecting ships of various scales cannot achieve desirable results. The current research challenge lies in achieving satisfactory detection results for ships with different scales using the same network. At present, the introduction of multi-scale information is an effective method to address this issue. The essence is to perform hierarchical processing for large, medium, and small ships.

3.3.1. Multi-Scale Information-Based Method

Due to the absence of excessive down sampling in shallow features, important high-frequency information can be preserved, such as texture, color, and edges. The information helps with the prediction of small ships. After multiple down samplings, the deep features can obtain larger receptive fields, which is helpful for the prediction of large ships. Therefore, utilizing multi-scale feature maps can better complete the fine-grained detection of different scales. However, they are independent from each other in the early prediction of ships, lacking mutual correlation. Then, a multi-scale information-based method based on feature fusion is proposed to alleviate this problem. It enhances the information interaction ability of different scale feature maps, and is widely applied in ship detection.
Feature Pyramid Network (FPN) [86] is a representative method that uses feature fusion to enhance multi-scale information. Through the lateral connection and the top-down pathway, a high-level feature transfers downward and fuses with a low-level feature, as shown in Figure 12. It combines the semantic information and positional information of feature maps, improving the representational ability of multi-scale information. Therefore, FPN can more comprehensively detect multi-scale ships. Tian et al. [87] and Ren et al. [70] proposed a multi-node feature fusion method based on FPN. It fully integrates information from feature maps at different scales, and improves the detection ability of multi-scale ships. Si et al. [88] and Yan et al. [89] used an improved bidirectional FPN to enhance the interactive ability of multi-scale features. Li et al. [90] and Yang et al. [50] improved FPN using the Network Architecture Search algorithm (NAS). It can learn features adaptively and choose more suitable fusion paths to enrich information. Chen et al. [91] combined FPN with the recursive mechanism to further enhance the representational capacity of multi-scale information. Xie et al. [92] proposed an adaptive pyramid network. It can enhance important features, improving detection accuracy. Zhang et al. [93] proposed SCM, which addresses the issue of channel imbalance during the feature fusion. Guo et al. [33] proposed Balanced Feature Pyramid (BFP). It adjusts multi-scale feature maps to the same medium size by interpolation and down sampling. Then, the balanced semantic features are generated by scaling and refining the features. The method alleviates the impact of different size feature maps during fusion. Guo et al. [94] improved BFP and proposed Adaptive Balanced Feature Integration (ABFI). The module can assign different weights to the different feature maps during feature fusion, enabling more accurate detection.
In conclusion, addressing the multi-scale challenge in SDORSIs requires a comprehensive consideration of factors such as scale differences, algorithm design, FPN construction, and so on. It is essential to ensure that the network can accurately and efficiently detect ships of different scales.

3.3.2. Summary

The large-scale variation in SDORSIs is one of the key factors limiting the improvement of performance. Introducing multi-scale information is one of the commonly used methods. Simultaneously, the key factor contributing to the low detection accuracy of large-scale targets detection is the poor performance in small vessels. In the future, enhancing the feature representation capability of small ships and designing multi-branch detection networks are also strategies to address this issue. Furthermore, the research trend lies in how to enhance the light weight of the network and reduce the application threshold in portable mobile devices while ensuring the accuracy of multi-scale ship detection.The methods and the main advantages and disadvantages of large scale variation are shown in Table 4.

3.4. Dense Distribution and Rotated Ships

Due to the arbitrary orientation of ships in optical remote-sensing images, using horizontal bounding boxes (HBBs) cannot accurately represent the orientation of ships, and also introduce excessive background information. At the same time, ships often exhibit a trend of dense and rotated distribution in areas such as nearshore docks. Excessive overlap between bounding boxes leads to the suppression of correct boxes, which further exacerbates the phenomenon of low recall. Therefore, achieving accurate detection of ships with a dense rotated distribution is a challenge in optical remote-sensing images. Currently, employing arbitrary orientation bounding boxes (OBBs) is an effective strategy for detecting rotated ships. OBBs accurately represent the position and orientation information of ships while effectively reducing the introduction of background information. Additionally, improved methods for Non-Maximum Suppression (NMS) alleviate the issue that detection results are incorrectly suppressed in densely distributed ships to a certain extent.

3.4.1. OBB Representation and Regression-Based Method

OBBs introduce angle information based on HBBs. The angle information can effectively represent the sailing direction of the ship. Therefore, OBBs can better highlight the position and orientation information. OBBs also effectively reduce the introduction of background information and separate the densely distributed ships. Accurately representing and generating arbitrary OBBs to locate ships holds higher application value in optical remote-sensing images.
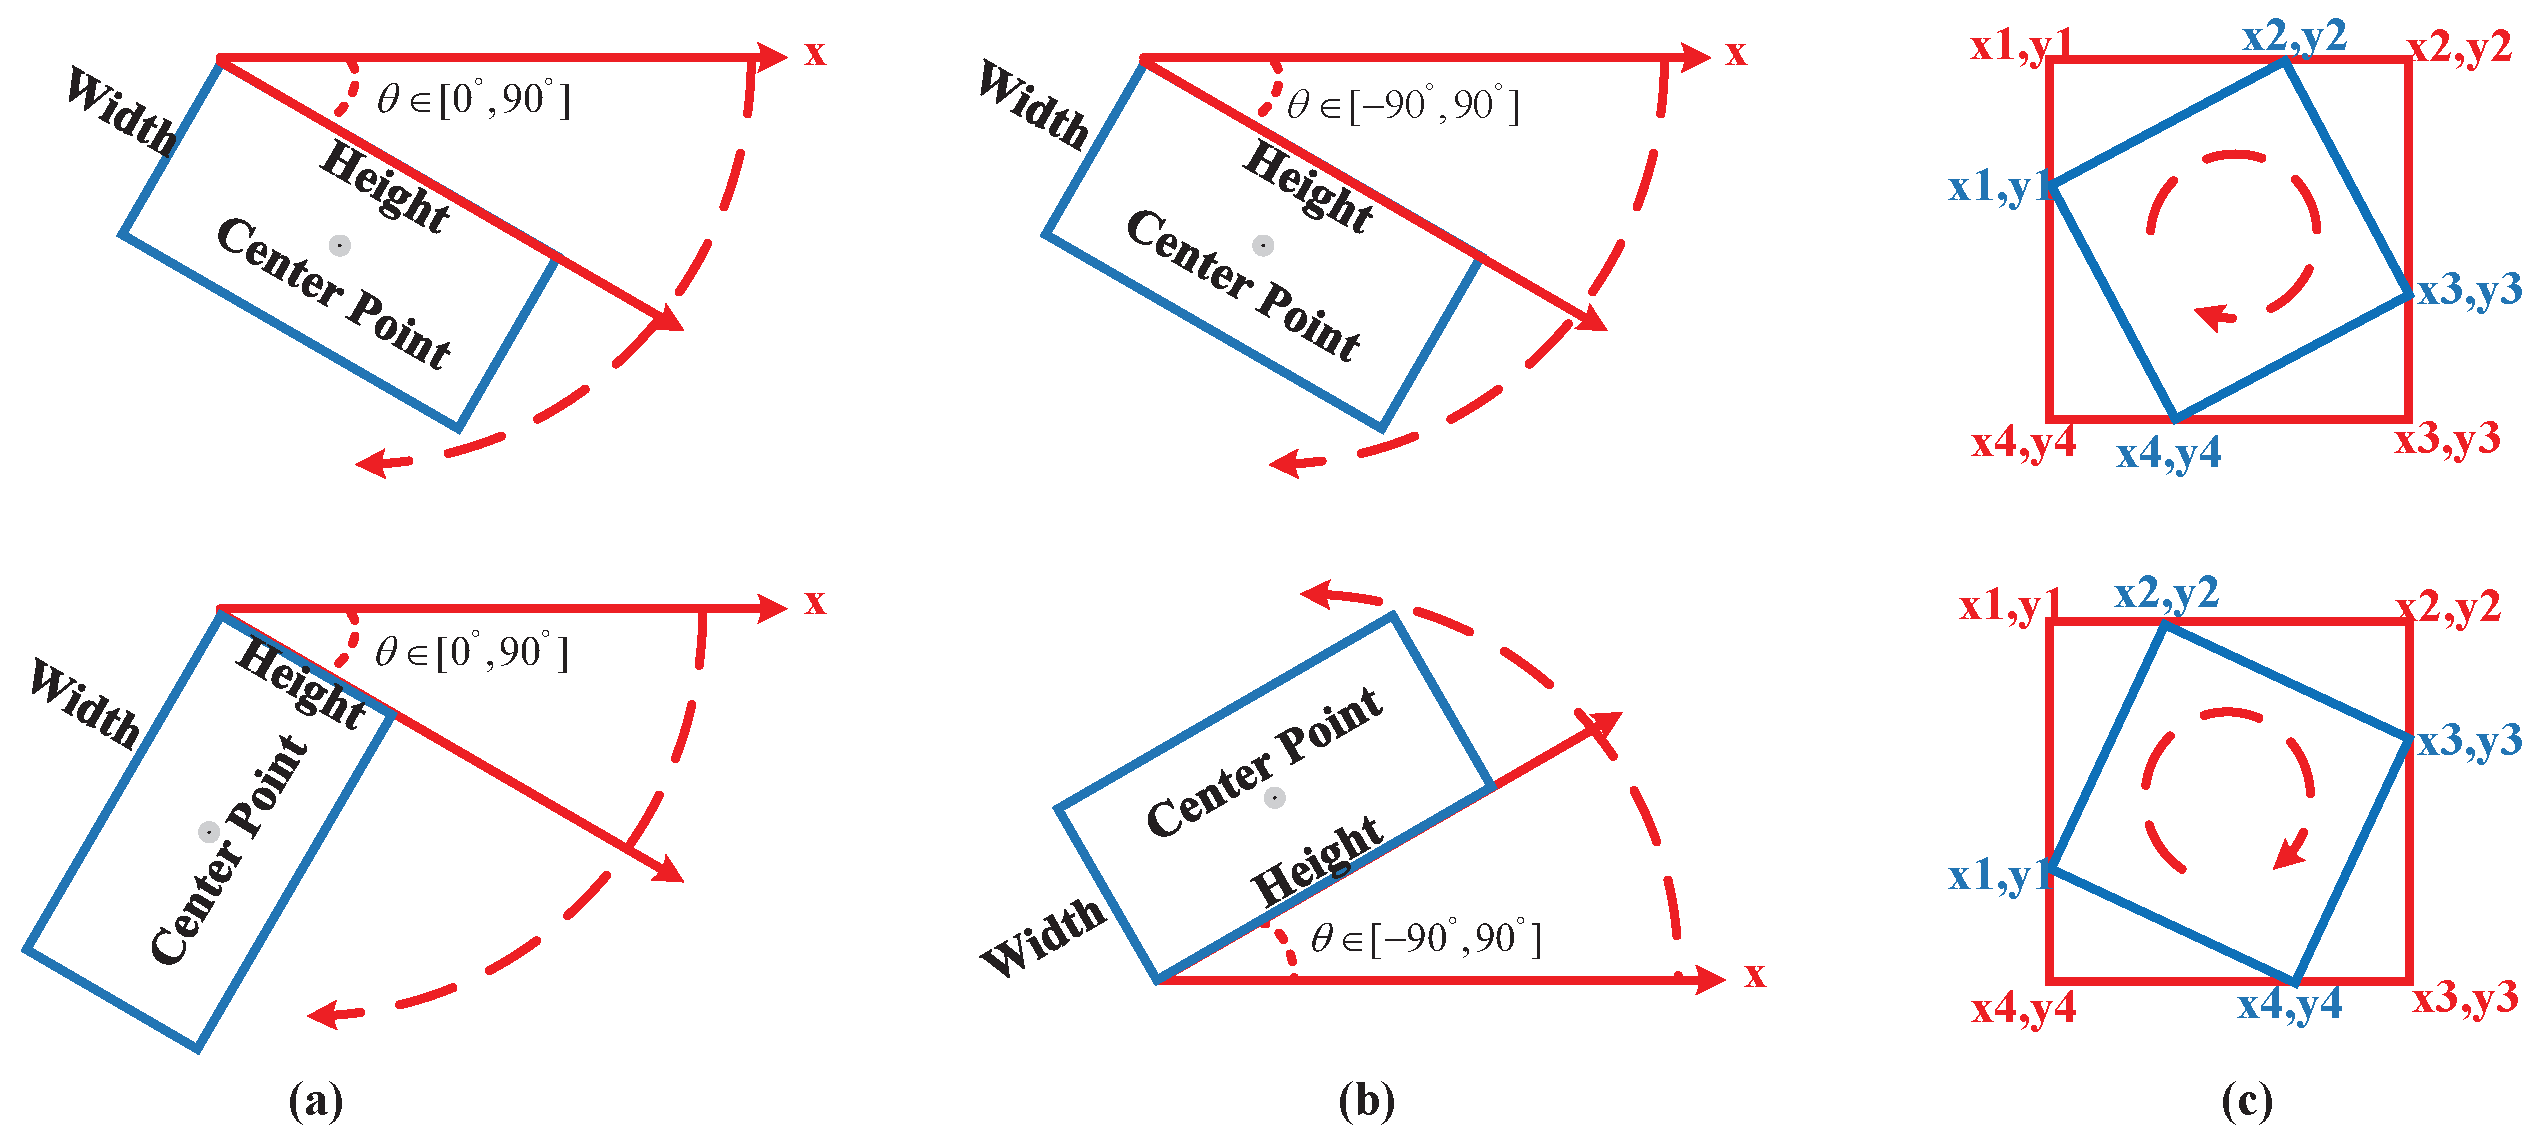
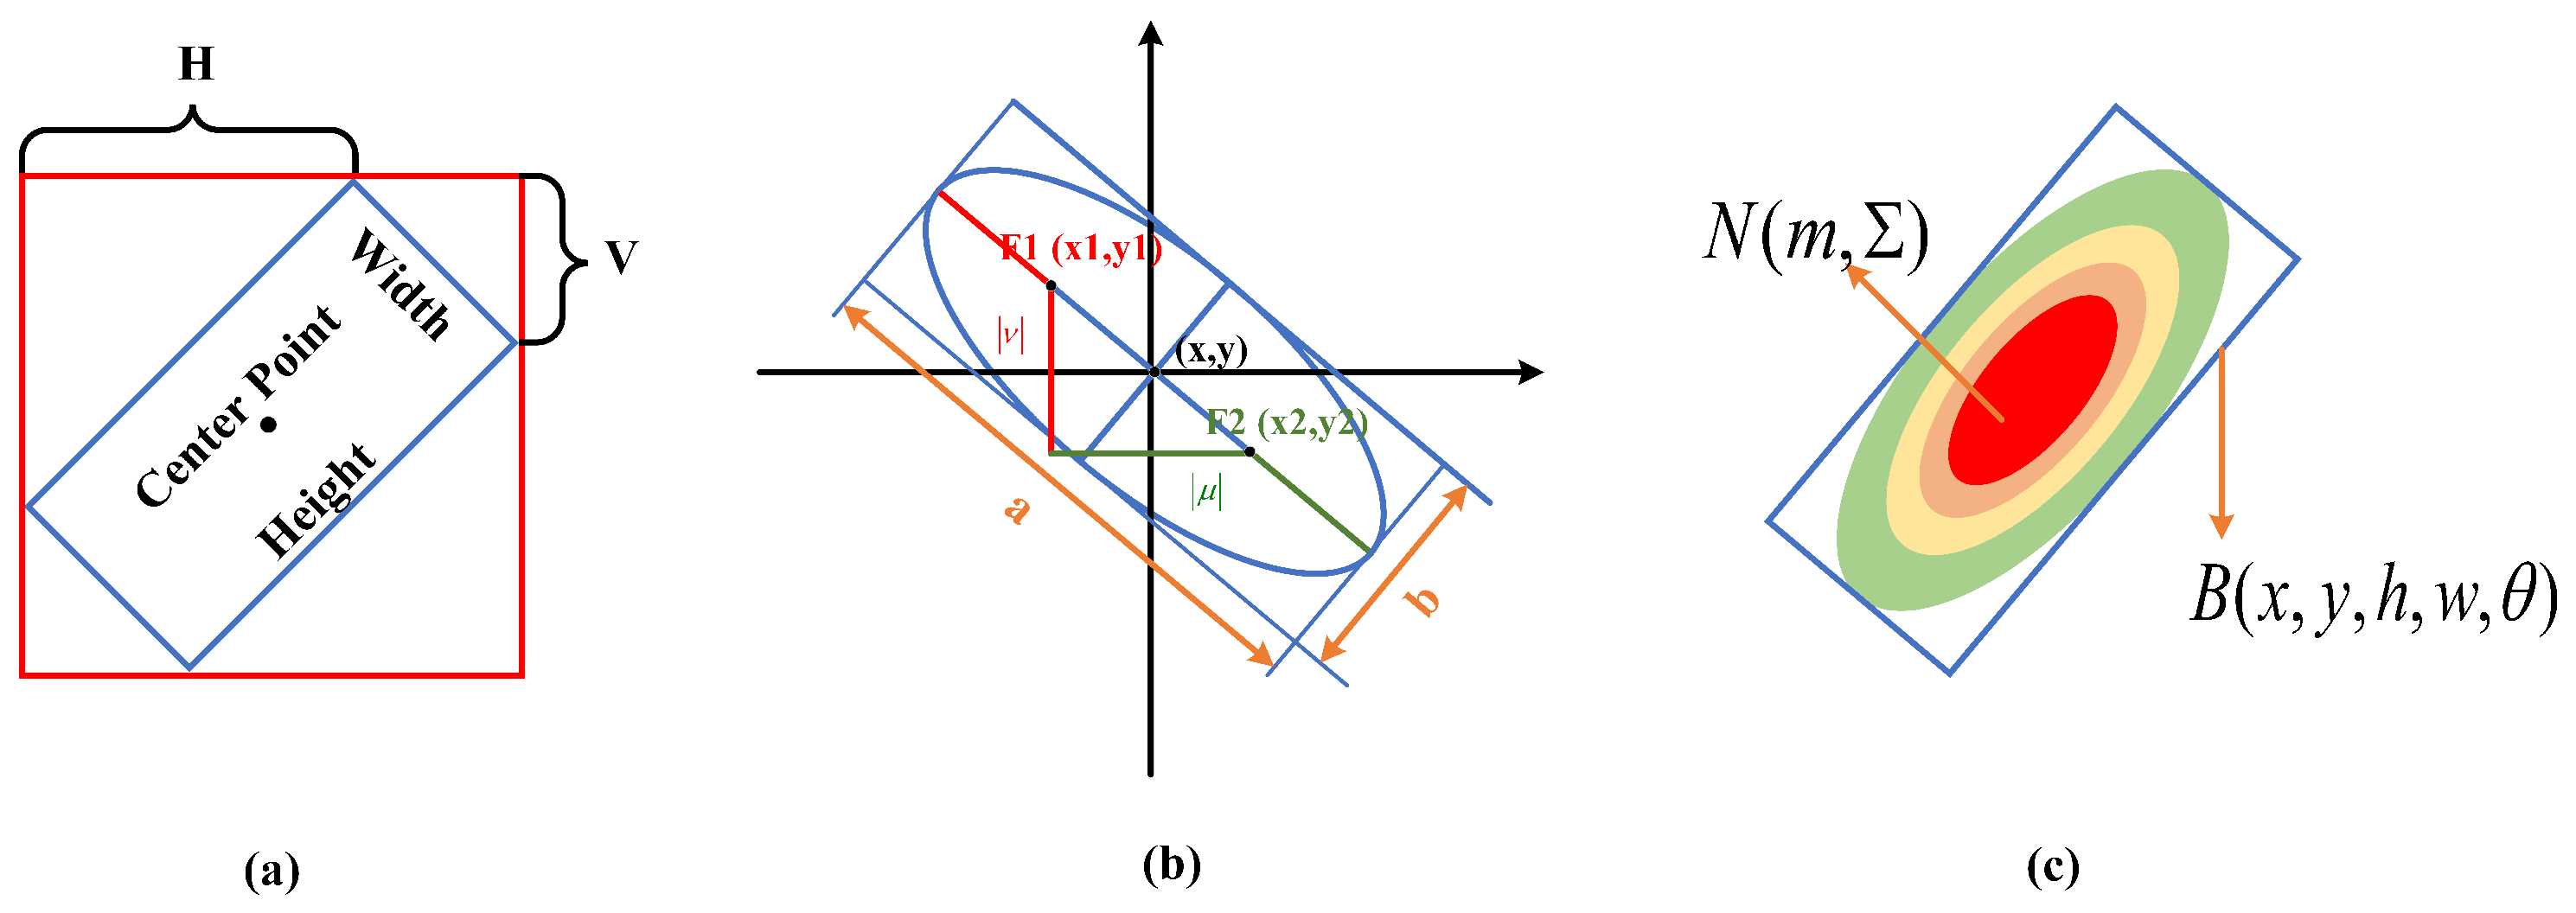
Representation with five parameters: The method with five parameters is one of the classical representations of OBBs, represented by (x, y, w, h, θ ). Specifically, (x, y) represents the center point, (w, h) represents the width and height, and θ represents the rotated angle. The representation of 90 ° cycle defines the height as a rectangular edge that forms an acute angle with the x-axis, and the range of values for θ is [ 0 ° , 90 ° ), as shown in Figure 13a. However, the defined width and height are exchanged when the rotated angle exceeds 90 ° , as shown in Figure 14a. It affects the convergence effectiveness of the network. The representation of 180 ° cycle defines the long side of a rectangular box as the height, and the range of values for θ is [ 90 ° , 90 ° ), as shown in Figure 13b. It can effectively avoid the issue of exchanging width and height. However, there is a value difference when there is an overlap of 90 ° and 90 ° at the boundary, which produces the boundary discontinuity problem, as shown in Figure 14b. It results in a sharp increase in loss at the boundary, affecting the detection performance. Liu et al. [95], Ouyang et al. [96], and Ma et al. [97] used OBBs represented as (x, y, w, h, θ ) to locate ships.
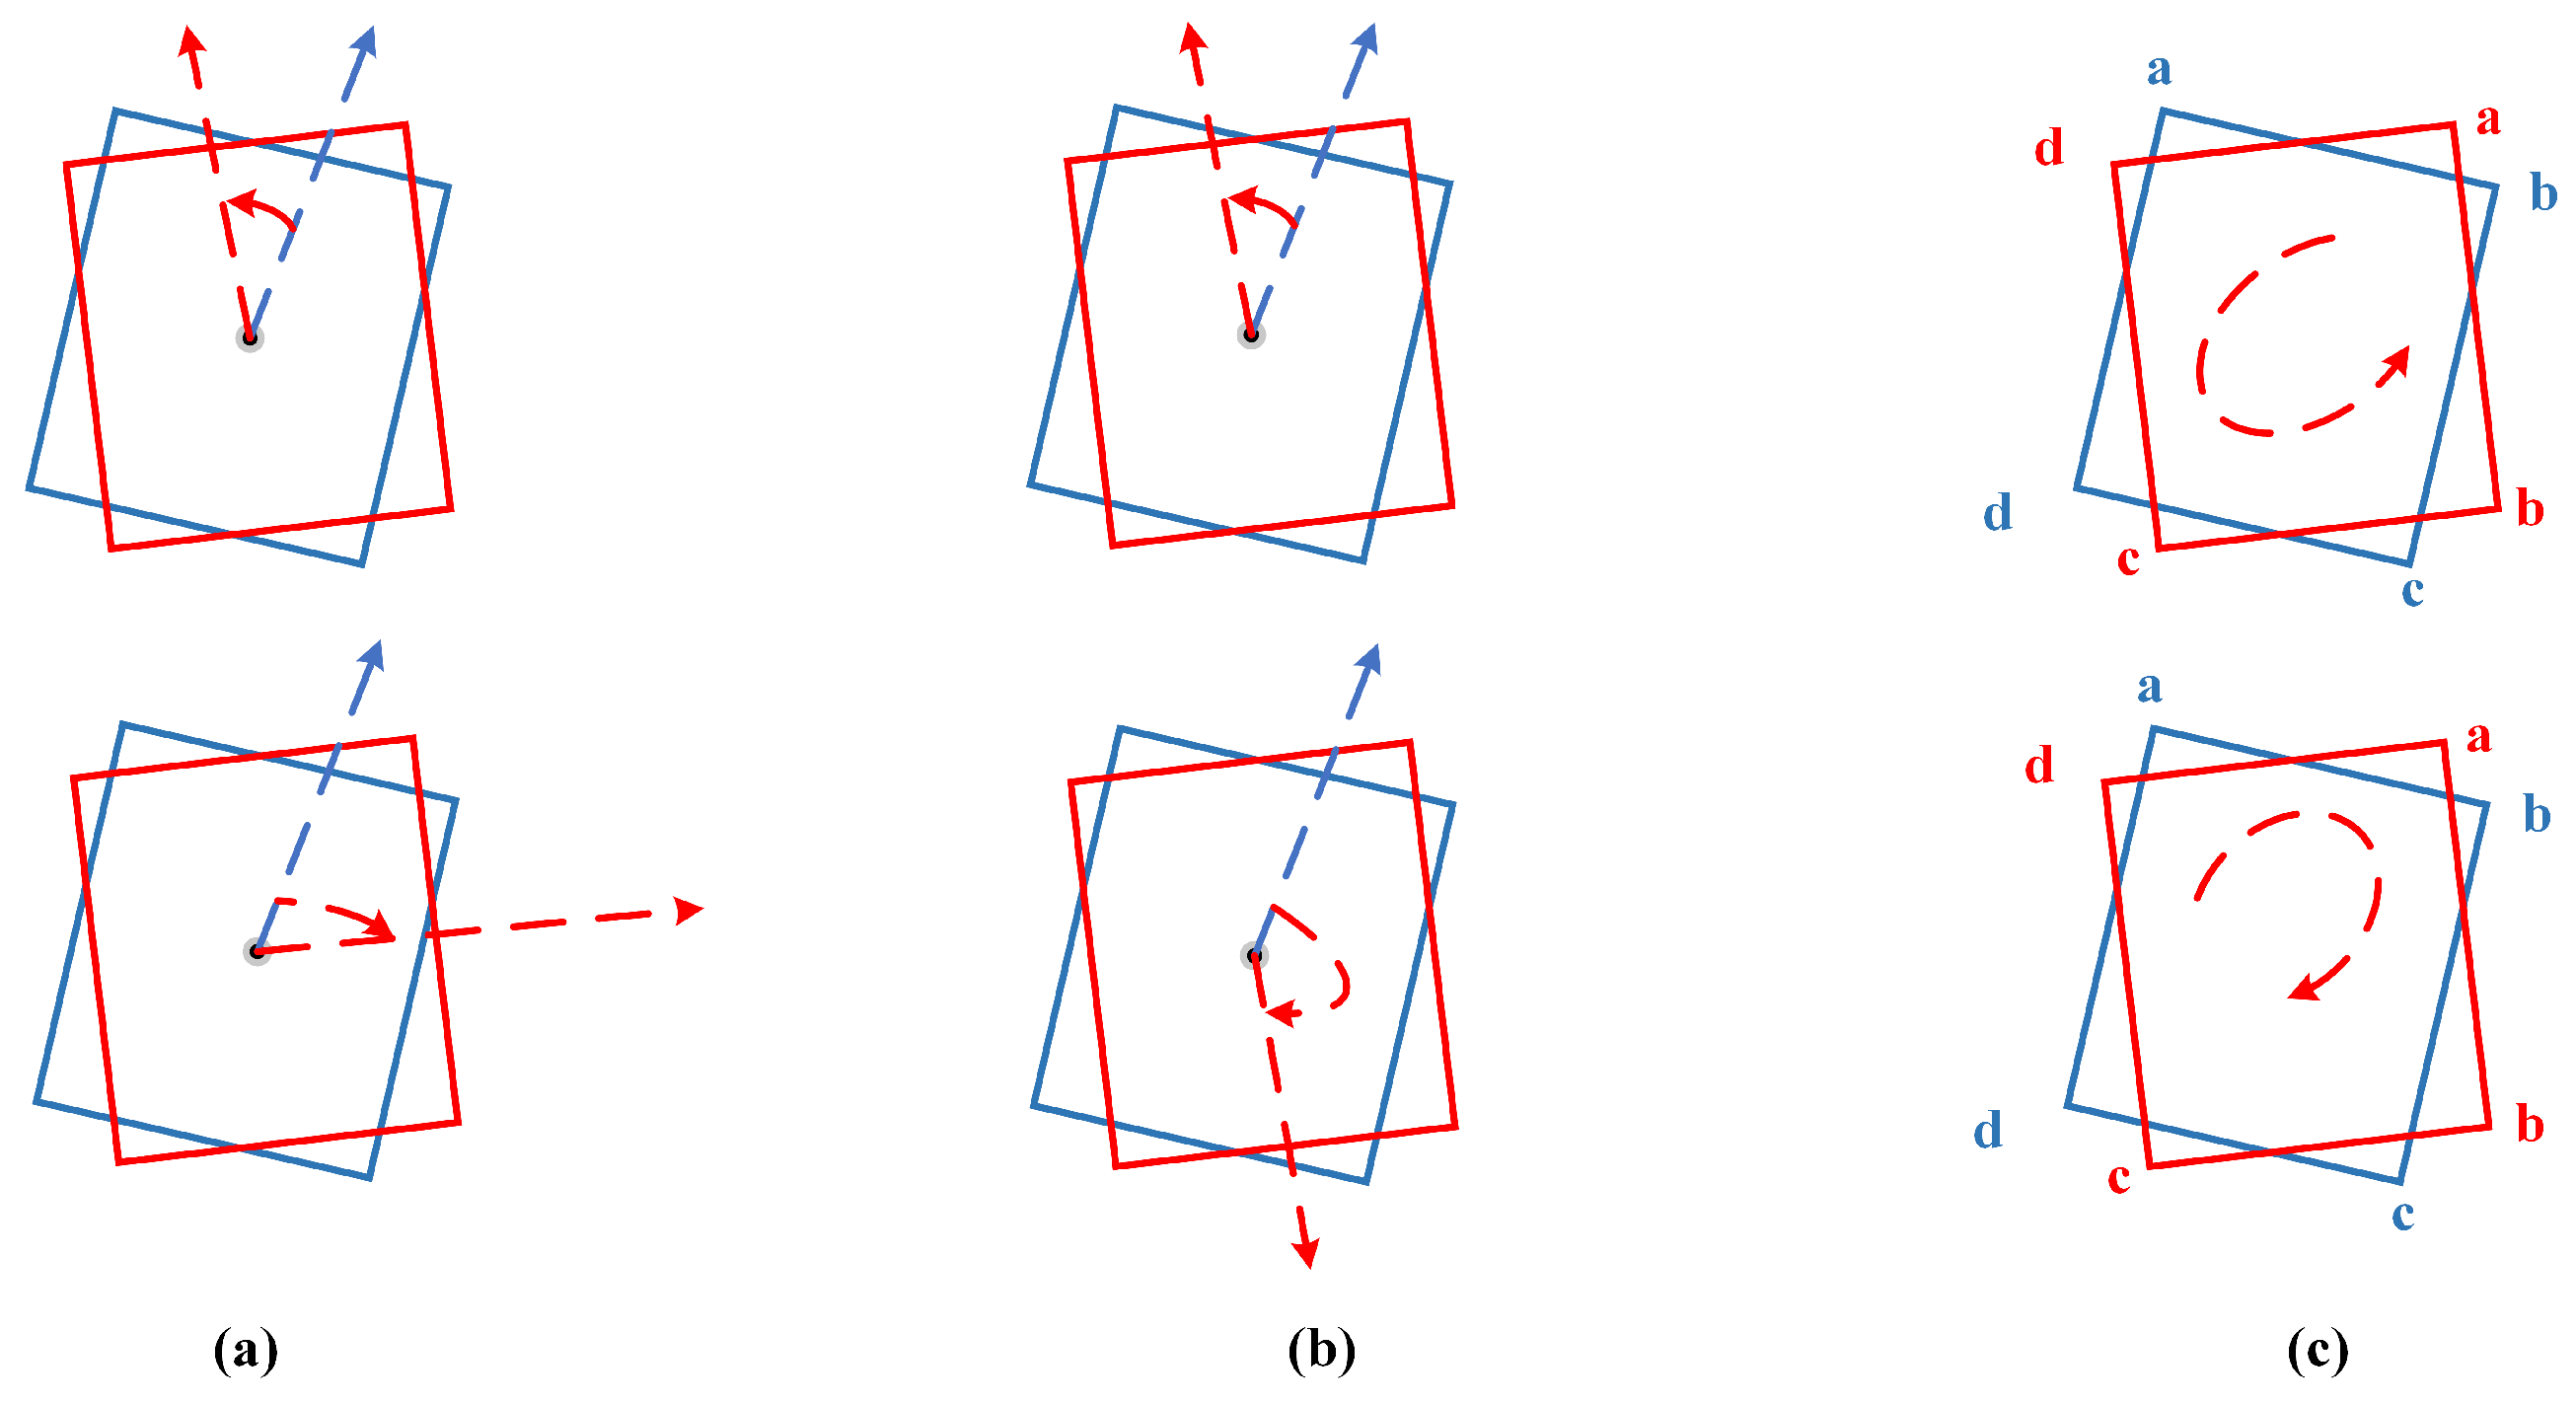
Representation with eight parameters: The method with eight parameters is another classical representation for OBBs, represented by ( x 1 , y 1 , x 2 , y 2 , x 3 , y 3 , x 4 , y 4 ). Specifically, ( x n , y n ) represents the coordinates of the four vertices of OBBs, as shown in Figure 13c. The method determines a unique direction by artificially setting the reference point, rather than representing angle values. However, it also exhibits an issue of loss discontinuity during the regression process. As shown in Figure 14c, the ideal regression process from the blue bounding box to the red ground truth box should be (aa), (bb), (cc), (dd). However, the actual regression process is (ab), (bc), (cd), (da). At the same time, the representation requires more parameters, increasing the learning burden of the network. Zhang et al. [98] used OBBs represented as ( x 1 , y 1 , x 2 , y 2 , x 3 , y 3 , x 4 , y 4 ) to locate ships.
Others: The issue of loss discontinuity, calculated by representations with five parameters and eight parameters, significantly impacts the convergence effectiveness of the model. Therefore, proposing new representations to alleviate this problem is the focus of current research. Su et al. [99] proposed the method represented by (x, y, w, h, O H , O V ) to locate ships, as shown in Figure 15a. OH and OV were normalized horizontal and vertical distance. The method fundamentally addressed the boundary issue of angle regression. Zhou et al. [100] proposed an ellipse method, represented by (x, y, | u | , | v | , m, α ), as shown in Figure 15b, where α = 0 represents that the ship belongs to the second and fourth quadrants; α = 1 represents that the ship belongs to the first and third quadrants. Furthermore, m is the difference between the length of the major axis and the focal vector. It uses vectors to represent angles, avoiding the issue of loss discontinuity caused by direct angle prediction. Yang et al. [101] and Zhang et al. [93] converted the representation with five parameters into a 2D Gaussian distribution, as shown in Figure 15c. It abandons angle representation, avoiding the issue of discontinuity in angles.
Anchor-based regression: It is a common method to use the anchor-based detector to generate OBBs. The detector first presets a set of rotated anchor boxes and overlays the input image with pixel-wise prediction. Then, the detector regresses parameters of the rotated angle, center position, width, and height of positive samples by a predefined method to generate OBBs. For example, KOO et al. [102] used the width or height distance projection to predict the angle and generate OBBs. Ouyang et al. [96] first preset a series of horizontal anchor boxes. Then, the rotated proposal regions were generated by bilinear interpolation. Furthermore, through fully connected layers, OBBs were generated. Li et al. [64] proposed the boundary regression module, which achieved more accurate regression by predicting the offset values for the four edges of each bounding box.
Anchor-free regression: The method of generating OBBs using the anchor-free detector is not constrained by anchor boxes. It usually uses keypoints or segmentation techniques to directly generate the OBBs of ships. Furthermore, compared with the anchor-based detector, it reduces hyperparameters and demonstrates greater generalization. Zhang et al. [93] converted the ship detection into a binary semantic segmentation based on the anchor-free detector. The method generates OBBs directly by selecting pixels above the set threshold. Chen et al. [103] used the network to detect three keypoints: the bow, the stern, and the center. Furthermore, they combined the bow and stern to generate a series of prediction boxes. Then, OBBs were generated using the center points and angle information. Zhang et al. [104] used the bow and the center points to determine the orientation and generate OBBs. Cui et al. [105] used the anchor-free detector to predict the center point and shape of ships for accurately generating OBBs.
Using OBBs in rotated ship detection alleviates the issues introduced by HBBs and achieves good results. However, there are certain limitations in OBBs. The loss discontinuity of classical representations seriously impacts efficiency. Currently, some representations solve this problem, but the calculations are complex. Furthermore, the predefined dimensions, aspect ratio, and angles of anchor boxes are closely related to the dataset. The design of different hyperparameters affects the performance of detection. However, the prior knowledge of anchor boxes is crucial. Their absence may cause the detection accuracy to decrease.

3.4.2. NMS-Based Method

Due to the dense distribution of ships, the use of OBBs for close ship detection may also produce the significant overlap. When the IoU between different ships exceeds the predefined parameter, traditional NMS retains only one bounding box with the highest confidence, and completely discards the other. The operation may lead to the suppression of a correct prediction, resulting in the instance of a missed detection. Therefore, in order to eliminate redundant prediction boxes while maximally preserving correct predictions, the improvement methods of NMS have been proposed.
Bodla et al. [106] proposed Soft-NMS, which considers both the confidence and the overlap of different bounding boxes. It weights the overlapping bounding boxes to reduce their scores, rather than simply removing them with non-maximum confidence. Nie et al. [34] and Zhang et al. [107] employed Soft-NMS instead of traditional NMS, improving the recall in ship detection. Inspired by Soft-NMS, Cui et al. [105] proposed Soft-Rotate-NMS. It combines Soft-NMS with rotated features, making it more suitable for ships with arbitrary orientations.
It is important to note that the setting of the IoU threshold has a significant impact on NMS, requiring constantly manual adjustment to find the optimal threshold during the training process. Therefore, an adaptive threshold NMS algorithm is more in line with the current environment.

3.4.3. Summary

The dense and rotated distribution of ships is one of the challenges in SDORSIs. Existing research indicates that the generation of arbitrary OBBs and the improvement methods of NMS have positive effects. OBBs can more accurately locate the position and orientation of rotated ships. Furthermore, the improvement methods of NMS greatly alleviate the problem of missed detection of dense ships. Solving the issue of boundary discontinuity caused by OBBs has significant research value in the future. However, current OBB representations introduce additional parameters, and require a balance between detection accuracy and speed in practical applications. The methods and the main advantages and disadvantages of dense distribution and rotated ships are shown in Table 5.

3.5. Large Aspect Ratio of Ships

The large aspect ratio is one of the most crucial features of ships. The standard convolution struggles to adapt to the geometric shapes in feature extraction. It inevitably leads to insufficient feature extraction and carries redundant information. Traditional ROI pooling usually extracts square-shaped features during the feature sampling stage. It leads to an uneven distribution of feature samples in two directions, affecting the detection performance. Therefore, it is important to design effective processing methods according to the geometric shapes of ships. Currently, the Deformable Convolutional Network (DCN) and improved methods of feature sampling are effective strategies. These methods aim to adapt to the geometric shapes of ships with large aspect ratios, and enhance the ability to extract irregular features.

3.5.1. DCN-Based Method

DCN [108] achieves the effect of random sampling by adding the offset variable to each sampling point. Moreover, by dynamically adjusting offsets, DCN can adaptively extract feature information from irregularly shaped ships, as shown in Figure 16a. Therefore, compared with the standard convolution, DCN is better able to adapt to geometric deformations such as the shape and size of the ship. It can extract ship features adequately while reducing the introduction of background information.
Su et al. [99] and Chai et al. [109] utilized DCN instead of standard convolution to extract features, enhancing the ability to capture irregular ship features. Guo et al. [94] and Cui et al. [110] integrated DCN into FPN to better adapt to the geometric features of ships. Zhang et al. [52] employed DCN for up sampling, which ensured the robust convolutional process and improved the detection ability for ships with various shapes.
However, it is worth noting that the offsets entirely rely on the compensatory predictions of the network. It may result in unstable performance at the beginning of training. Furthermore, DCN consumes more memory compared to the standard convolution.

3.5.2. Feature Sampling-Based Method

Feature sampling refers to the operation of using ROI pooling or ROI align to obtain the fixed-size feature map. However, traditional feature sampling outputs the same number of feature samples along the width and height directions. It leads to a dense distribution of feature samples in the short side, but a sparse distribution in the long side, significantly impacting detection performance. Therefore, it is necessary to propose a new feature sampling method that adapts to ship geometric shapes. The improved method can match ship shapes and extract feature samples uniformly in both directions, as shown in Figure 16b.
Different from the typical ROI pooling, Li et al. [81] designed a shape-adaptive pooling. It obtains uniformly distributed feature samples in both length and width according to the shapes of ships. Then, it combines these samples into a fixed-size feature map. Guo et al. [111] designed a shape-aware rotated ROI align. It alleviates the problem of uneven feature distribution caused by the typical square-shaped sampling approach. Furthermore, it achieves more accurate feature representations with fewer parameters. Zhang et al. [112] performed three different shape-aware ROI align operations on each ROI. It captures information more accurately for ships with large aspect ratios.
The improved method is an effective approach to enhance the detection result of ships with large aspect ratios. However, it maps multiple feature points to one feature point, which may cause some degree of information loss.

3.5.3. Summary

The large aspect ratio is one of the key factors which constrains the development in SDORSIs. Furthermore, enhancing the ability of network to extract irregular features is a critical technology for alleviating this issue. The experiments show that using DCN to extract features and improving the feature sampling methods are effective strategies. These methods can better adapt to ship shapes and uniformly extract feature samples. However, when extracting features from large images, DCN tends to heavily consume memory which limits application scenarios. Simultaneously, feature sampling maps multiple feature samples to a single feature point, which may cause a certain degree of information loss and calculation errors. The large aspect ratio is the essential distinction between ships and other targets. Therefore, exploring more detection methods designed for the large aspect ratio is one of the future development trends. The methods and the main advantages and disadvantages of large aspect ratio of ships are shown in Table 6.

3.6. Imbalance between Positive and Negative Samples

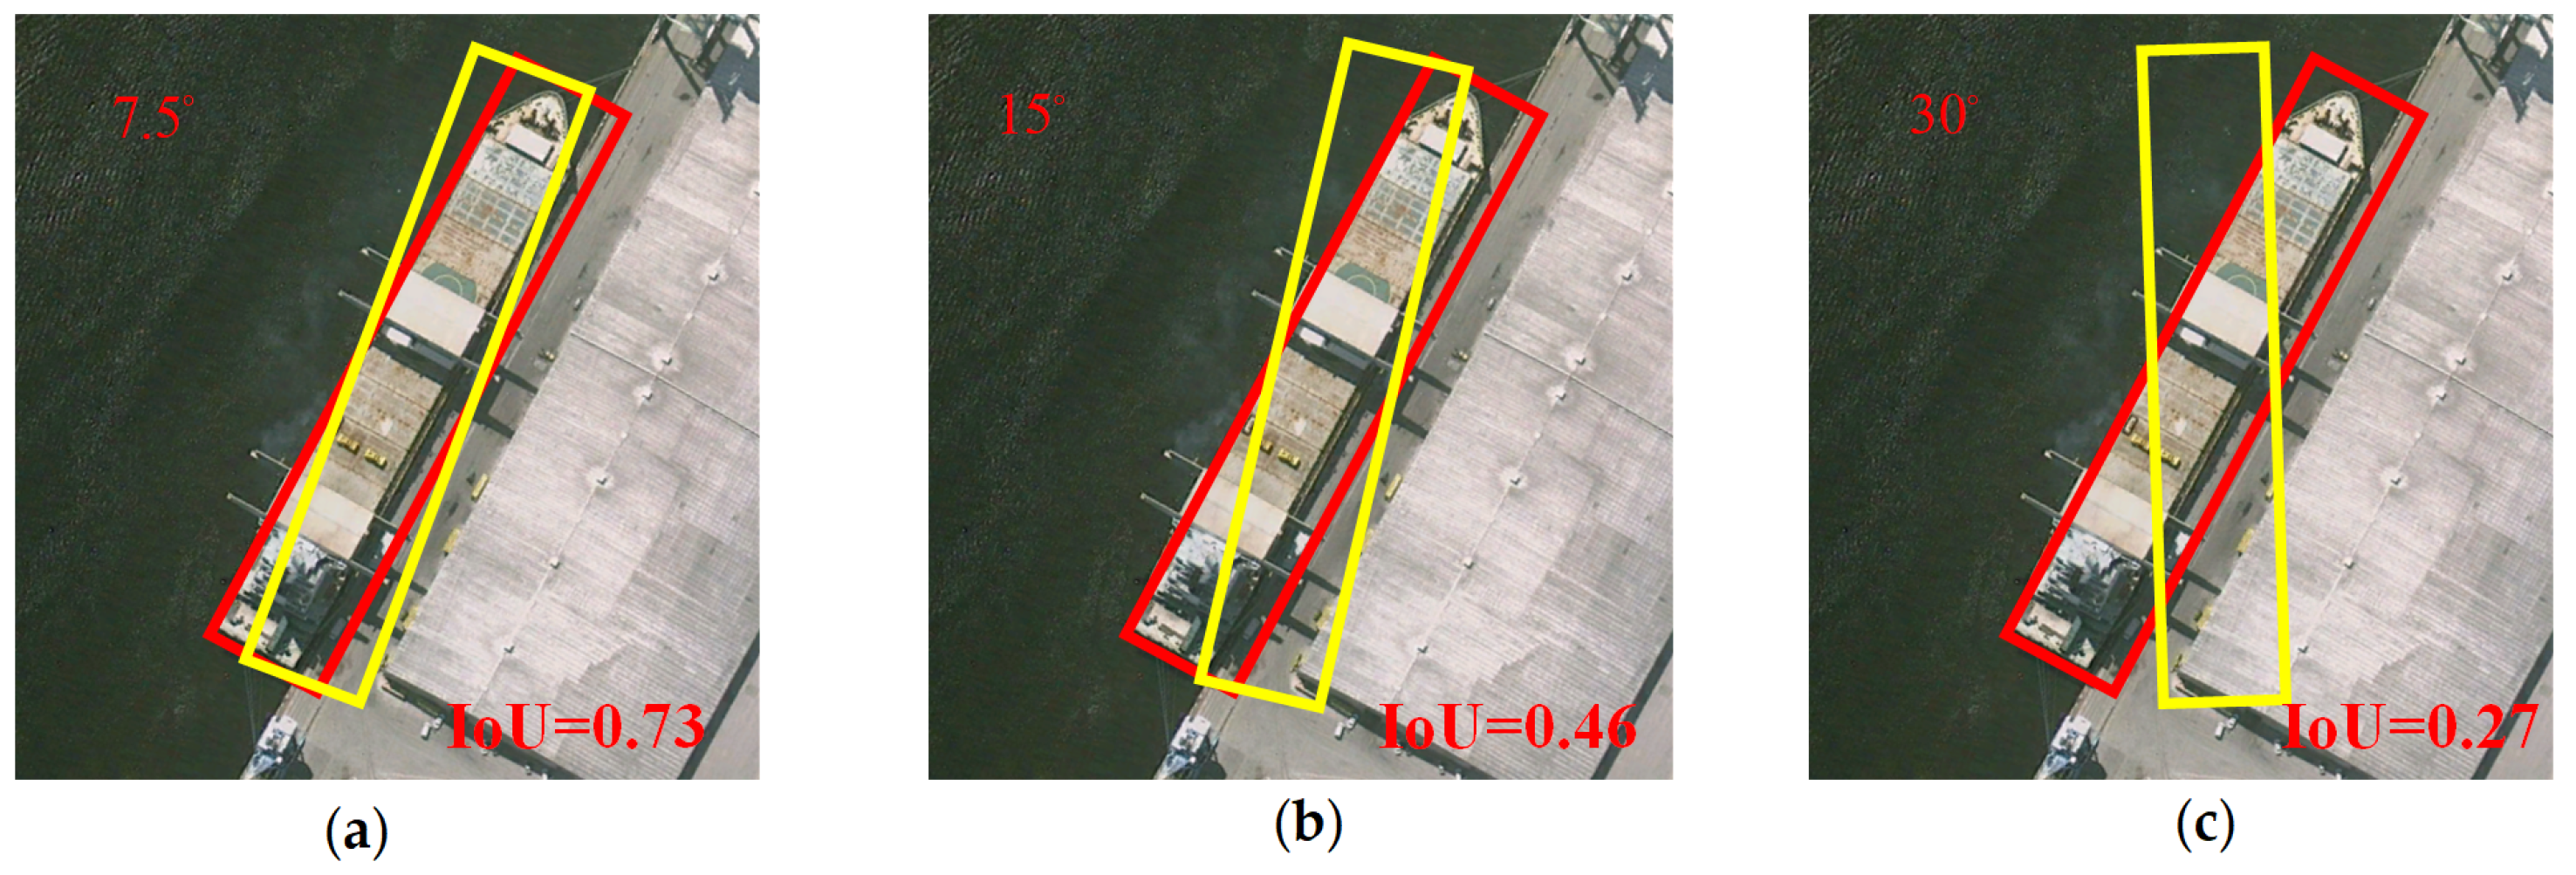
Ships usually occupy only a small portion in optical remote-sensing images, generating a large number of negative samples [113]. Meanwhile, due to the shapes of ships with large aspect ratios and rotated distribution, IoU-based matching strategy imposes stricter constraint. Even a slight angular deviation between the detection boxes seriously disrupts the calculation of IoU, as shown in Figure 17, resulting in insufficient positive samples. The imbalance between positive and negative samples significantly impacts the training of the network. Therefore, it is important to alleviate this problem for the development of SDORSIs. At present, improving the calculation method of IoU and loss function are effective strategies. These methods aim to explore more positive samples to mitigate the impact of insufficient positive samples.

3.6.1. IoU-Based Matching Methods

There is a certain deviation between the prediction box and ground truth box, and IoU is sensitive to angular changes. Even a small angular deviation leads to a large change in the IoU value. Meanwhile, the traditional hard-threshold sample matching strategy also severely limits the selection of positive samples, leading only a small number of high-quality positive samples to meet the filtering criteria. However, these positive samples are insufficient to support the training, constraining the performance of the network. Therefore, improving the calculation method of IoU and dynamically adjusting the IoU threshold are effective strategies to alleviate the imbalance of positive and negative samples.
Zhang et al. [114] and Li et al. [115] proposed a dynamic soft label assignment method, which adjusts the IoU threshold dynamically according to aspect the ratios of ships. It ensures that ships with extreme aspect ratios can still retain sufficient positive samples for training. Song et al. [116] used Skew IoU to calculate the overlapping area between the prediction box and ground truth box. Ma et al. [97] designed a ship orientation classification network. The network first roughly predicts the angular range of each ship. Then, several more precise angles are established within this range. It limits the angular difference to a smaller range, mitigating the impact of angular factors on IoU. Li et al. [81] proposed the orientation-agnostic IoU. The prediction box aligns with the label in orientation, assisting the network in obtaining more positive samples.
The method can better adapt to the features of ships, achieving the exploration of more positive samples. However, improving the calculation method of IoU may introduce additional computation. Furthermore, dynamical threshold requires designing a suitable threshold mapping function and constraining the range of the threshold. Inappropriate mapping ranges may introduce interfering samples.

3.6.2. Loss-Function-Based Method

There is the fact that ships usually occupy a small area in optical remote-sensing images. The number of negative samples is larger than positive samples. It results in the imbalance between positive and negative samples during training. Furthermore, the traditional cross-entropy loss function tends to focus on more negative samples, seriously affecting the detection performance. Therefore, proposing the loss function that can assign more weight to positive samples is an important way to alleviate this problem.
Focal Loss [43] introduced a weighting factor before each category in the loss function to balance the cross-entropy loss:
F L ( p t ) = α t ( 1 p t ) γ log ( p t )
It can alleviate the imbalance of the network. Liu et al. [117] applied Focal Loss in ship detection and it also enabled to focus more on hard samples, enhancing the robustness of the model. Chen et al. [103] assigned the higher weight to pixels near keypoints when calculating loss. It effectively addressed the imbalance caused by the smaller number of keypoints compared with the total pixels in the image.
The method mitigates the impact of the imbalance between positive and negative samples by increasing the contribution of positive samples during training. However, it is worth noting that the weighting factor requires constant manual search for the optimal value.

3.6.3. Summary

The imbalance between positive and negative samples seriously impacts the performance and constrains the development in SDORSIs. The existing research shows that the improvements of the loss function and IoU are the primary ways to alleviate this problem. Improving the calculation method of IoU and dynamically adjusting IoU threshold aim to explore more positive samples during training. Furthermore, the improved loss function aims to assign more weight to positive samples, preventing the model from focusing more on the larger quantity of negative samples. However, the method of dynamically adjusting the IoU threshold relies on the choice of the dataset. The same network may behave differently on different datasets. Furthermore, there is a certain difficulty in selecting hyperparameters for the loss function. Therefore, alleviating the imbalance of samples has great development potential. The methods and the main advantages and disadvantages of imbalance between positive and negative samples are shown in Table 7.

4. Datasets, Evaluation Metrics, and Experiments

High-quality datasets are the foundation for the successful development of deep learning and play a crucial role in ship detection. In this section, we summarize the publicly available ship datasets of optical remote-sensing images and evaluation metrics. It is worth noting that we separated ship information from comprehensive datasets to provide more detailed data for the development of SDORSIs. Furthermore, we meticulously recorded the number of ships and the approximate distribution of ship sizes for each dataset, enabling readers to gain a more intuitive understanding of the data distribution. In addition, we compared and analyzed some representative models on different datasets. Furthermore, we summarized the improvement effects of optimization strategies for ship detection challenges. Finally, by analyzing the feature extraction capabilities of different backbones, we provided new insights into the development of SDORSIs.

4.1. Datasets

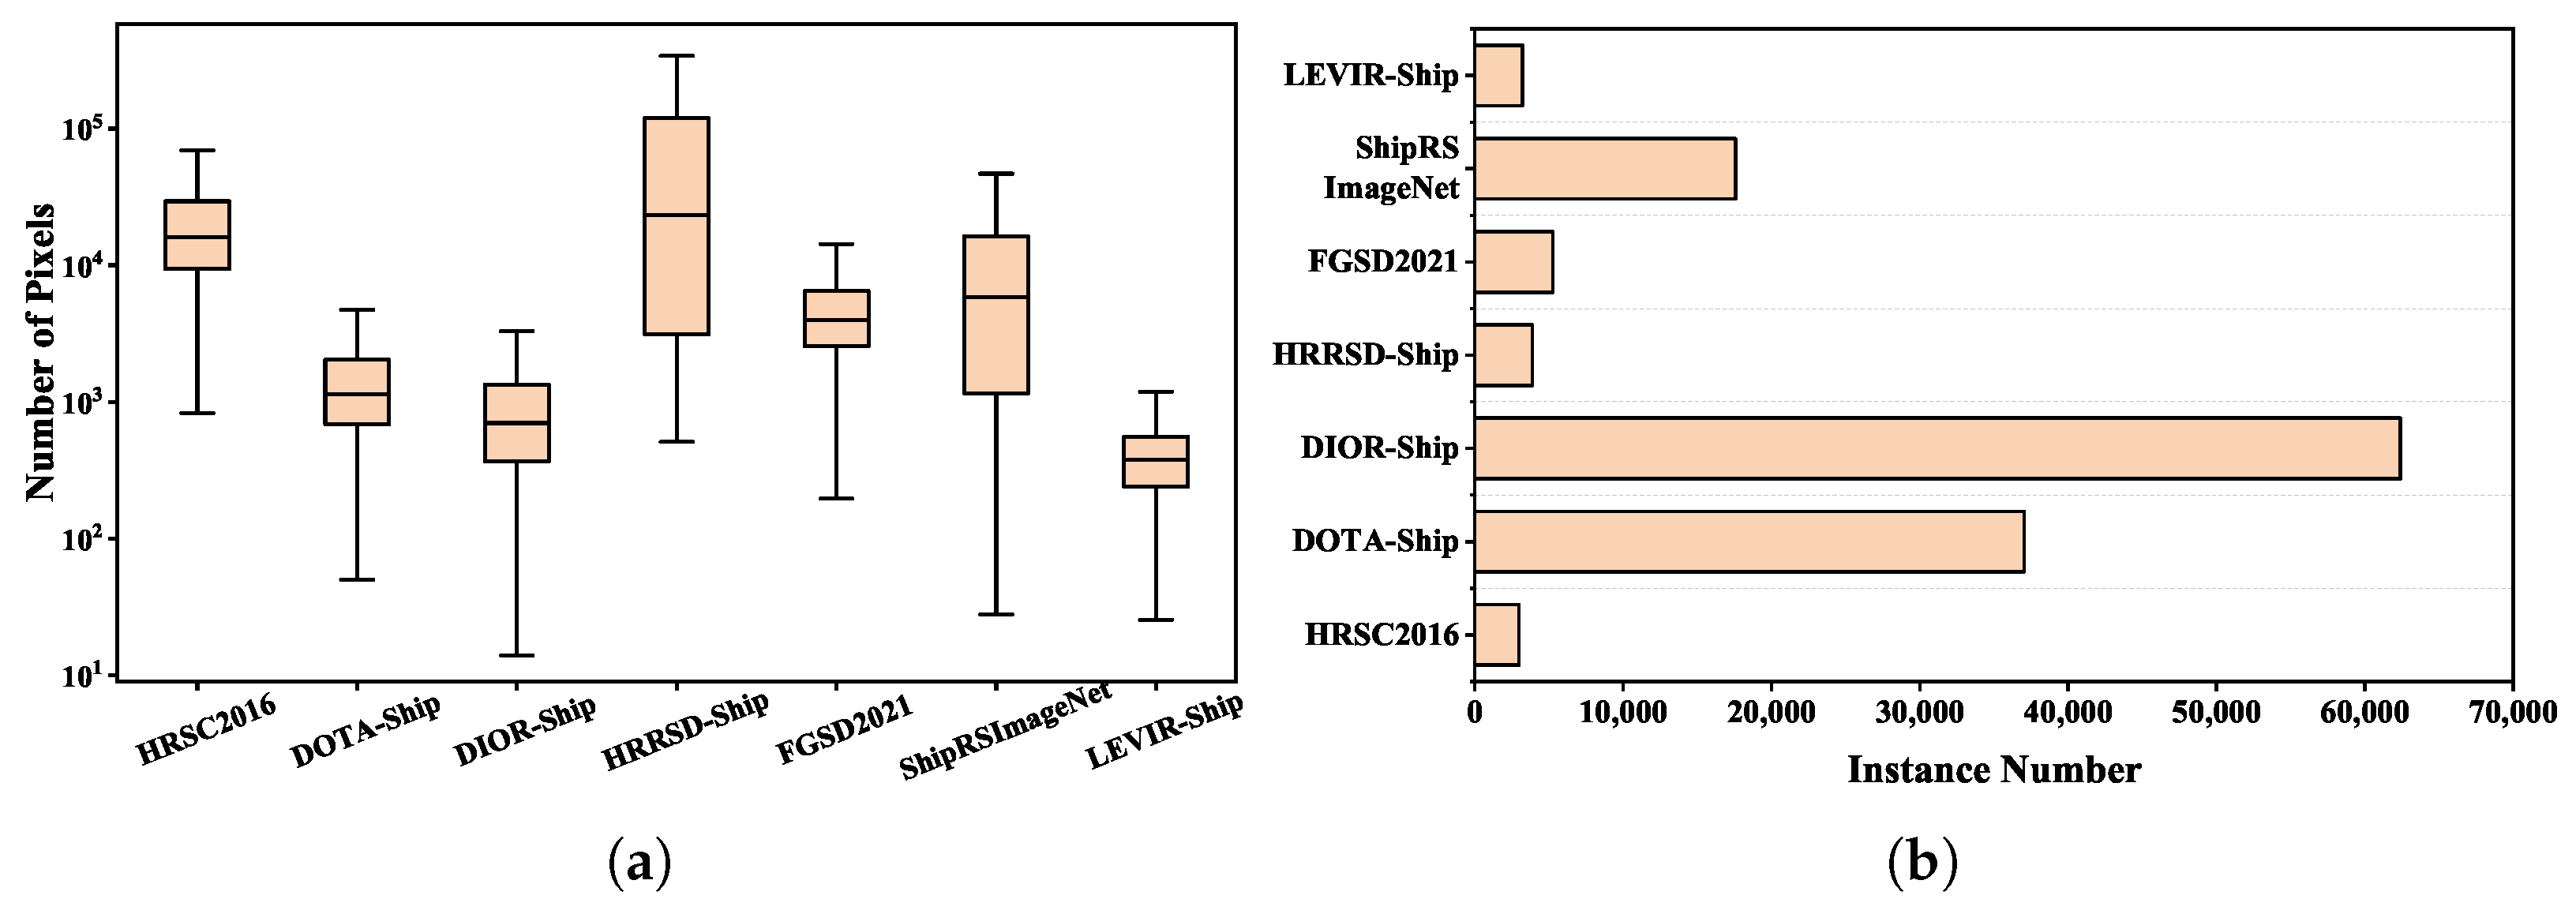
For the first time, we separated ships from comprehensive datasets and compiled specific ship information from seven commonly used optical remote sensing image datasets, as shown in Table 8. We used a box diagram to depict the pixel distribution of ships in each dataset. As shown in Figure 18a, ShipRSImageNet and HRRSD-ship exhibit larger variations in ship scales, which can be effectively alleviated by introducing multi-scale information during detection. The pixels of ships in DIOR-ship and LEVIR-ship are smaller, and focusing on small targets can effectively improve detection accuracy. Additionally, we visually represented the number of ships in each dataset using a bar chart. As shown in Figure 18b, the number of ships in DIOR-ship and DOTA-ship is higher than in others.
HRSC2016: The HRSC2016 [118] dataset was published by Northwestern Polytechnical University in 2016. The dataset consists of 1070 images from six different ports and 2976 labeled ships from Google Earth. The image size ranges from 300 × 300 to 1500 × 900 pixels, and the resolution from 0.4 m to 2 m. It is labeled with HBB and OBB.
DOTA-ship: The DOTA-ship dataset is collected from the DOTA [119] dataset. It includes 434 ship images and 37028 ships. The image size ranges from 800 × 800 to 4000 × 4000 pixels, and the resolution from 0.1m to 1m. It is labeled with HBB and OBB.
DIOR-ship: The DIOR-ship dataset is collected from the DIOR [120] dataset. It includes 2702 ship images and 62,400 ships. The image size is 800 × 800, and the resolution ranges from 0.5 m to 30 m. It is labeled with HBB.
HRRSD-ship: The HRRSD-ship dataset is collected from the HRRSD [121] dataset. It includes 2165 ship images and 3886 ships. The image size ranges from 270 × 370 to 4000 × 5500 pixels, and the resolution from 0.5 m to 1.2 m. It is labeled with HBB.
FGSD2021: Zhang et al. [104] introduced an FGSD2021 dataset at a ground sample distance in 2021. The dataset consists of 636 images from Google Earth and the HRSC2016 dataset. It includes 5274 labeled ships and 20 categories. The average size is 1202 × 1205 pixels, and the resolution is 1m. It is labeled with OBB.
ShipRSImageNet: The ShipRSImageNet [122] dataset is composed of 3435 images from the xView dataset, HRSC2016 dataset, FGSD dataset, Airbus Ship Detection Challenge, and Chinese satellites. It includes 17,573 ships and 50 categories. The size of most original images is 930 × 930 pixels, and the resolution ranges from 0.12 m to 6 m. It is labeled with HBB and OBB.
LEVIR-ship: Chen et al. [71] introduced a LEVIR-ship dataset in 2021, which is a medium-resolution ship dataset. The images were captured from GaoFen-1 and GaoFen-6 satellites. It includes 3896 ship images and 3119 ships. The image size is 512 × 512 pixels, and the resolution is 16 m. It is labeled with HBB.

4.2. Evaluation Metrics

IoU: IoU [123] is a metric used to measure the overlap between the prediction box and the ground truth box. In general, positive samples are filtered by setting the IoU threshold, defined as follows:
I o U = a r e a ( P r o p o s a l G r o u n d T r u t h ) a r e a ( P r o p o s a l G r o u n d T r u t h )
However, IoU lacks consideration for the distance between the prediction box and the ground truth box, failing to accurately reflect their spatial relationship. Therefore, metrics such as GIoU [124] and DIoU [125] were introduced. Based on IoU, GIoU introduces geometric factors to calculate the distance between two bounding boxes. Furthermore, DIoU calculates the distance between the centers of two bounding boxes on the basis of GIoU.
Accuracy, Precision, and Recall: First, we define as follows: true positives (TP) indicate that the prediction is positive and the ground truth is also positive; false positives (FP) indicate that the prediction is positive but the ground truth is negative; false negatives (FN) indicate that the prediction is negative but the ground truth is positive; true negatives (TN) indicate that the prediction is negative and the ground truth is also negative. Then, the definitions of accuracy rate, precision rate, and recall rate are given as follows: Accuracy rate represents the proportion of all correctly predicted samples out of the total samples:
A c c u r a c y = T P + T N T P + T N + F P + F N
Precision rate represents the proportion of correctly predicted positive samples out of all predicted positive samples:
P r e c i s i o n = T P T P + F P
Recall rate represents the proportion of correctly predicted positive samples out of all actual positive samples:
R e c a l l = T P T P + F N
Average precision (AP) and mean average precision (mAP): The curve plotted with the recall rate as the horizontal axis and the precision rate as the vertical axis is called the precision recall curve (PRC). Furthermore, the area under the PRC is called AP. AP is used to characterize the detection accuracy for a single category:
A P = 0 1 P ( R ) d R
Each category corresponds to an AP value, and the average AP value across all categories is called mAP. The mAP is used to evaluate the overall accuracy of the dataset. Furthermore, a higher mAP value indicates better performance of the detector:
m A P = 1 C i = 1 C A P = 1 C i = 1 C 0 1 P i ( R i ) d R i
Frames Per Second (FPS): The speed is as important as the accuracy of detection when measuring the effect of a model. Furthermore, a commonly used metric to evaluate the detection speed is FPS, which represents the number of images recognized per second.

4.3. Experimentation and Analysis

4.3.1. Algorithm Performance Comparison and Analysis

To visually demonstrate the progress in SDORSIs, we compiled some representative models in recent years and listed them in Table 9 and Table 10. According to the data in Table 9, it can be observed that, for the simple ship category datasets, such as HRSC2016, the mAP reaches more than 90%, and the performance is generally saturated since 2023. 3WM-AugNet achieves 90.69% on the HRSC2016 dataset, demonstrating a leading performance.
In contrast, FGSD2021 includes more ship categories and quantities, making it more challenging in SDORSIs. According to the data in Table 10, compared with single-stage detectors, the mAP of two-stage detectors is improved by about 5–10%, meaning that two-stage detectors have the advantage of higher accuracy. Furthermore, compared with anchor-based detectors, the real-time performance of anchor-free detectors is improved by approximately 20–30 FPS. At the same time, it also can achieve satisfactory accuracy. GF-CSL achieves 88.5%, exceeding other algorithms. CenterNet-Rbb demonstrates the best real-time performance. In the 20 categories of FGSD2021, the accuracy of Ave, Sub, and Oth is significantly lower than others. Therefore, it is helpful to design a classification algorithm with stronger discrimination ability to improve the overall detection performance of the model.

4.3.2. Performance of Optimization Strategies Comparison and Analysis

The mAP intuitively proves that a series of optimization strategies for ship characteristics are effective in Table 11. Specifically, attention mechanism is the primary method used to address complex background issues. It can enhance the contrast between ships and the background. Compared with the baseline model, the mAP of the algorithm employing this strategy is improved by about 1 to 4%. As one of the primary methods of multi-scale feature representation, FPN is widely applied in SDORSIs. It can enhance the information interaction ability of feature maps, and effectively identify ships with significant scale variations. The improved methods of FPN can enhance the ability to detect multi-scale ships. Table 11 shows an improvement in mAP of approximately 1 to 6%. Furthermore, OBB representation and regression address the issue of loss discontinuity associated with rotation angles. The mAP in Table 11 is improved by about 0.5 to 7%, confirming its effectiveness. DCN and feature sampling are more adaptive to large aspect ratios. They can reduce the introduction of irrelevant information while adequately extracting ship features. The mAP of the algorithm using this strategy is improved by about 1 to 8%.

4.3.3. Exploration of Transformer Application

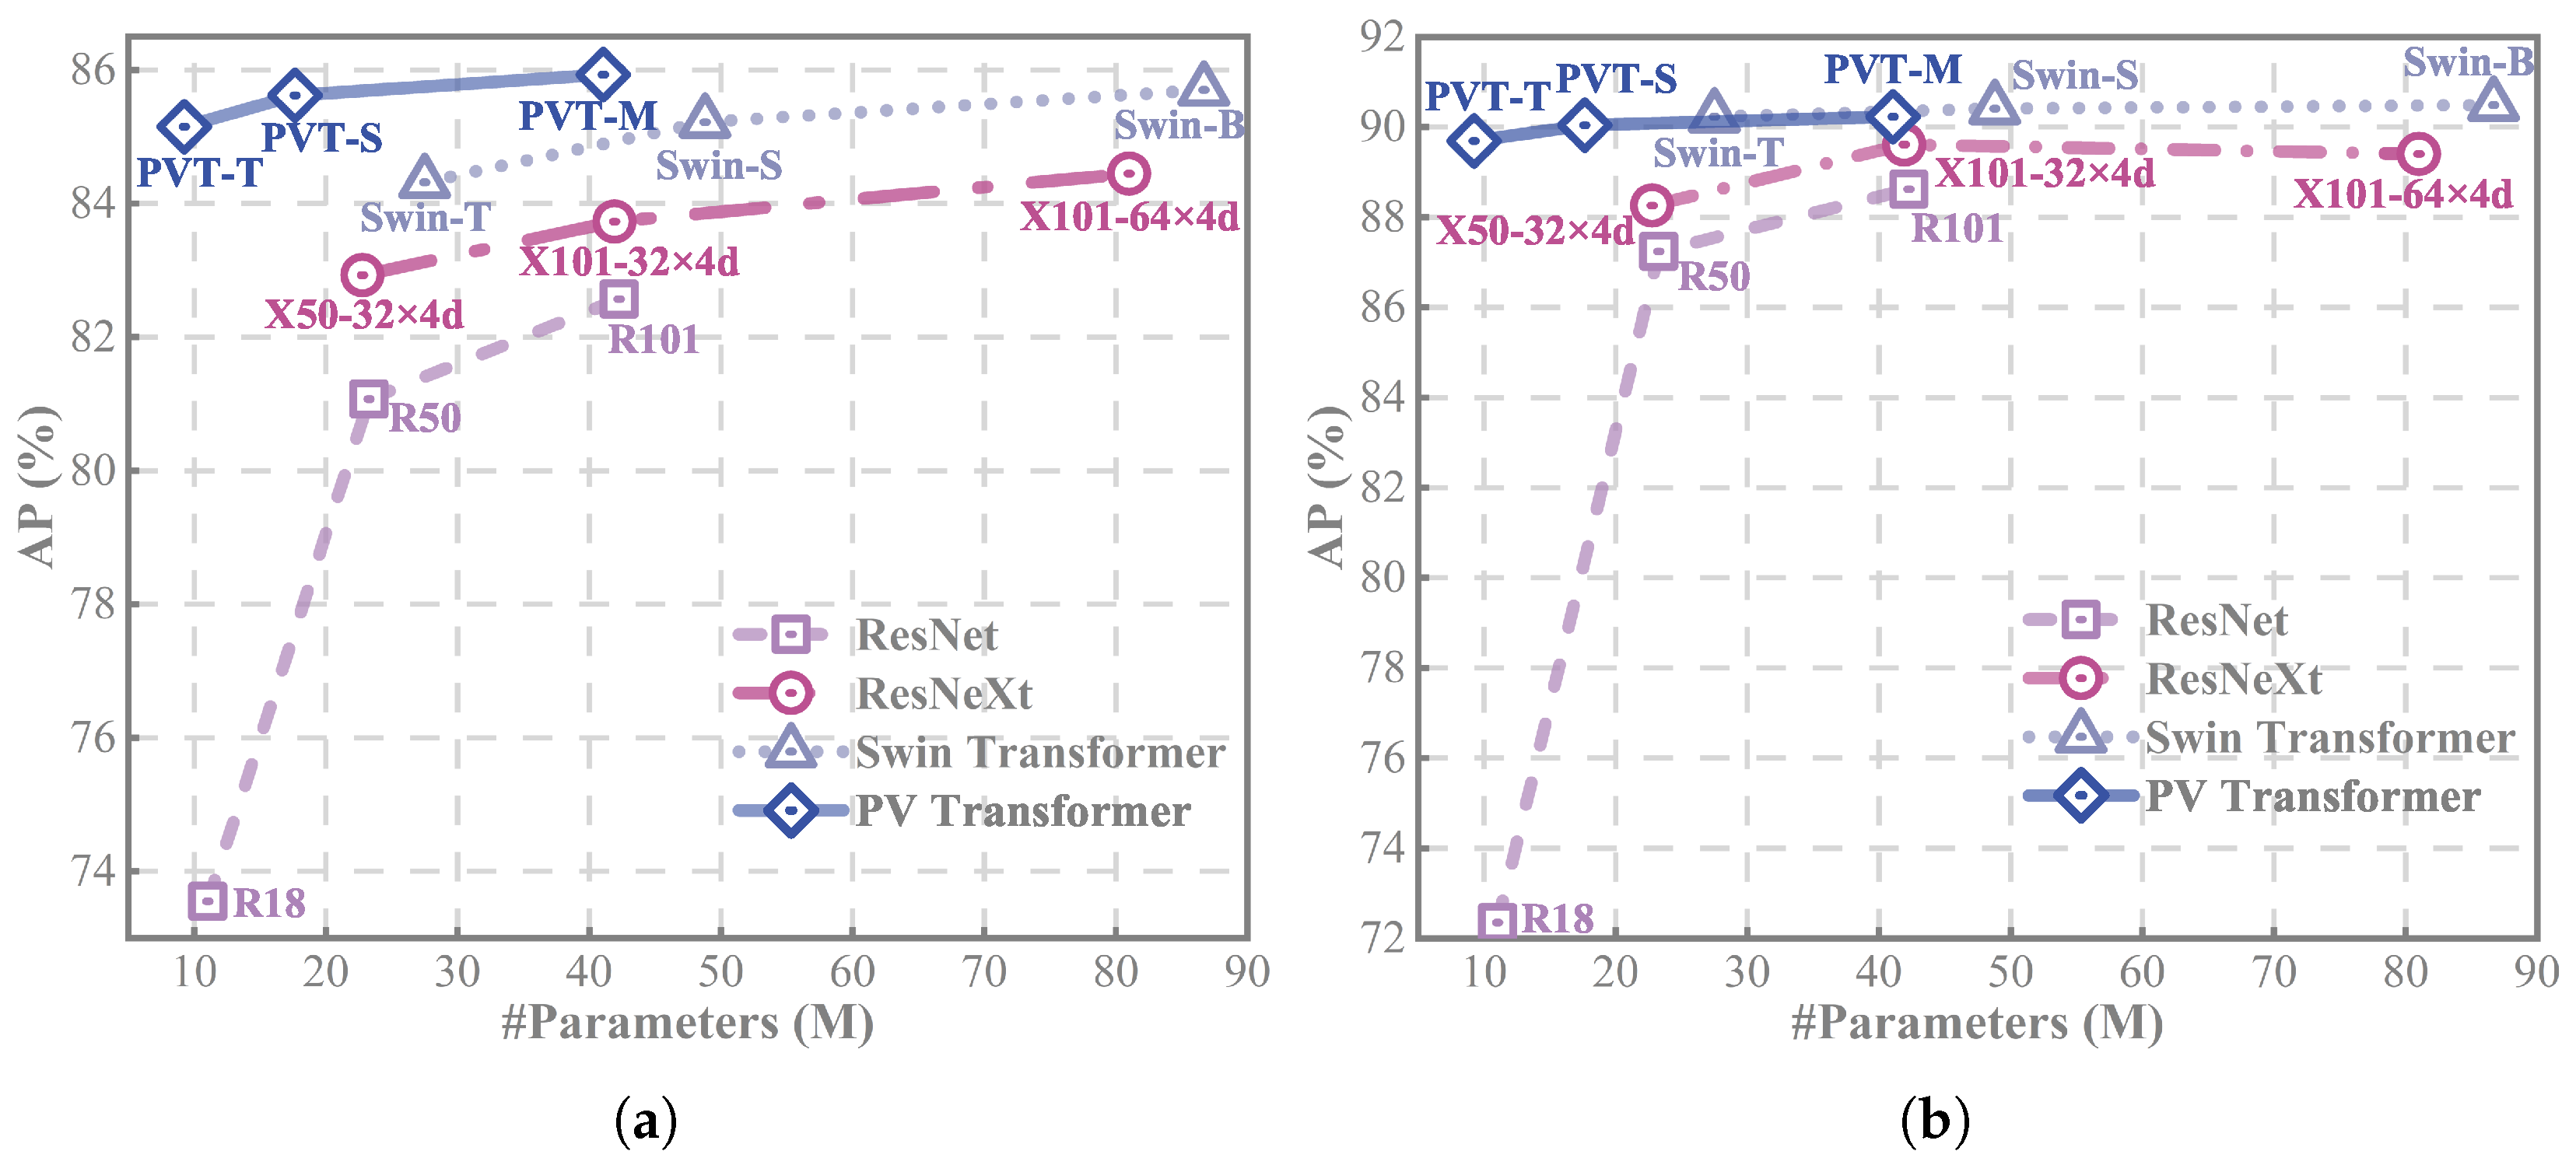
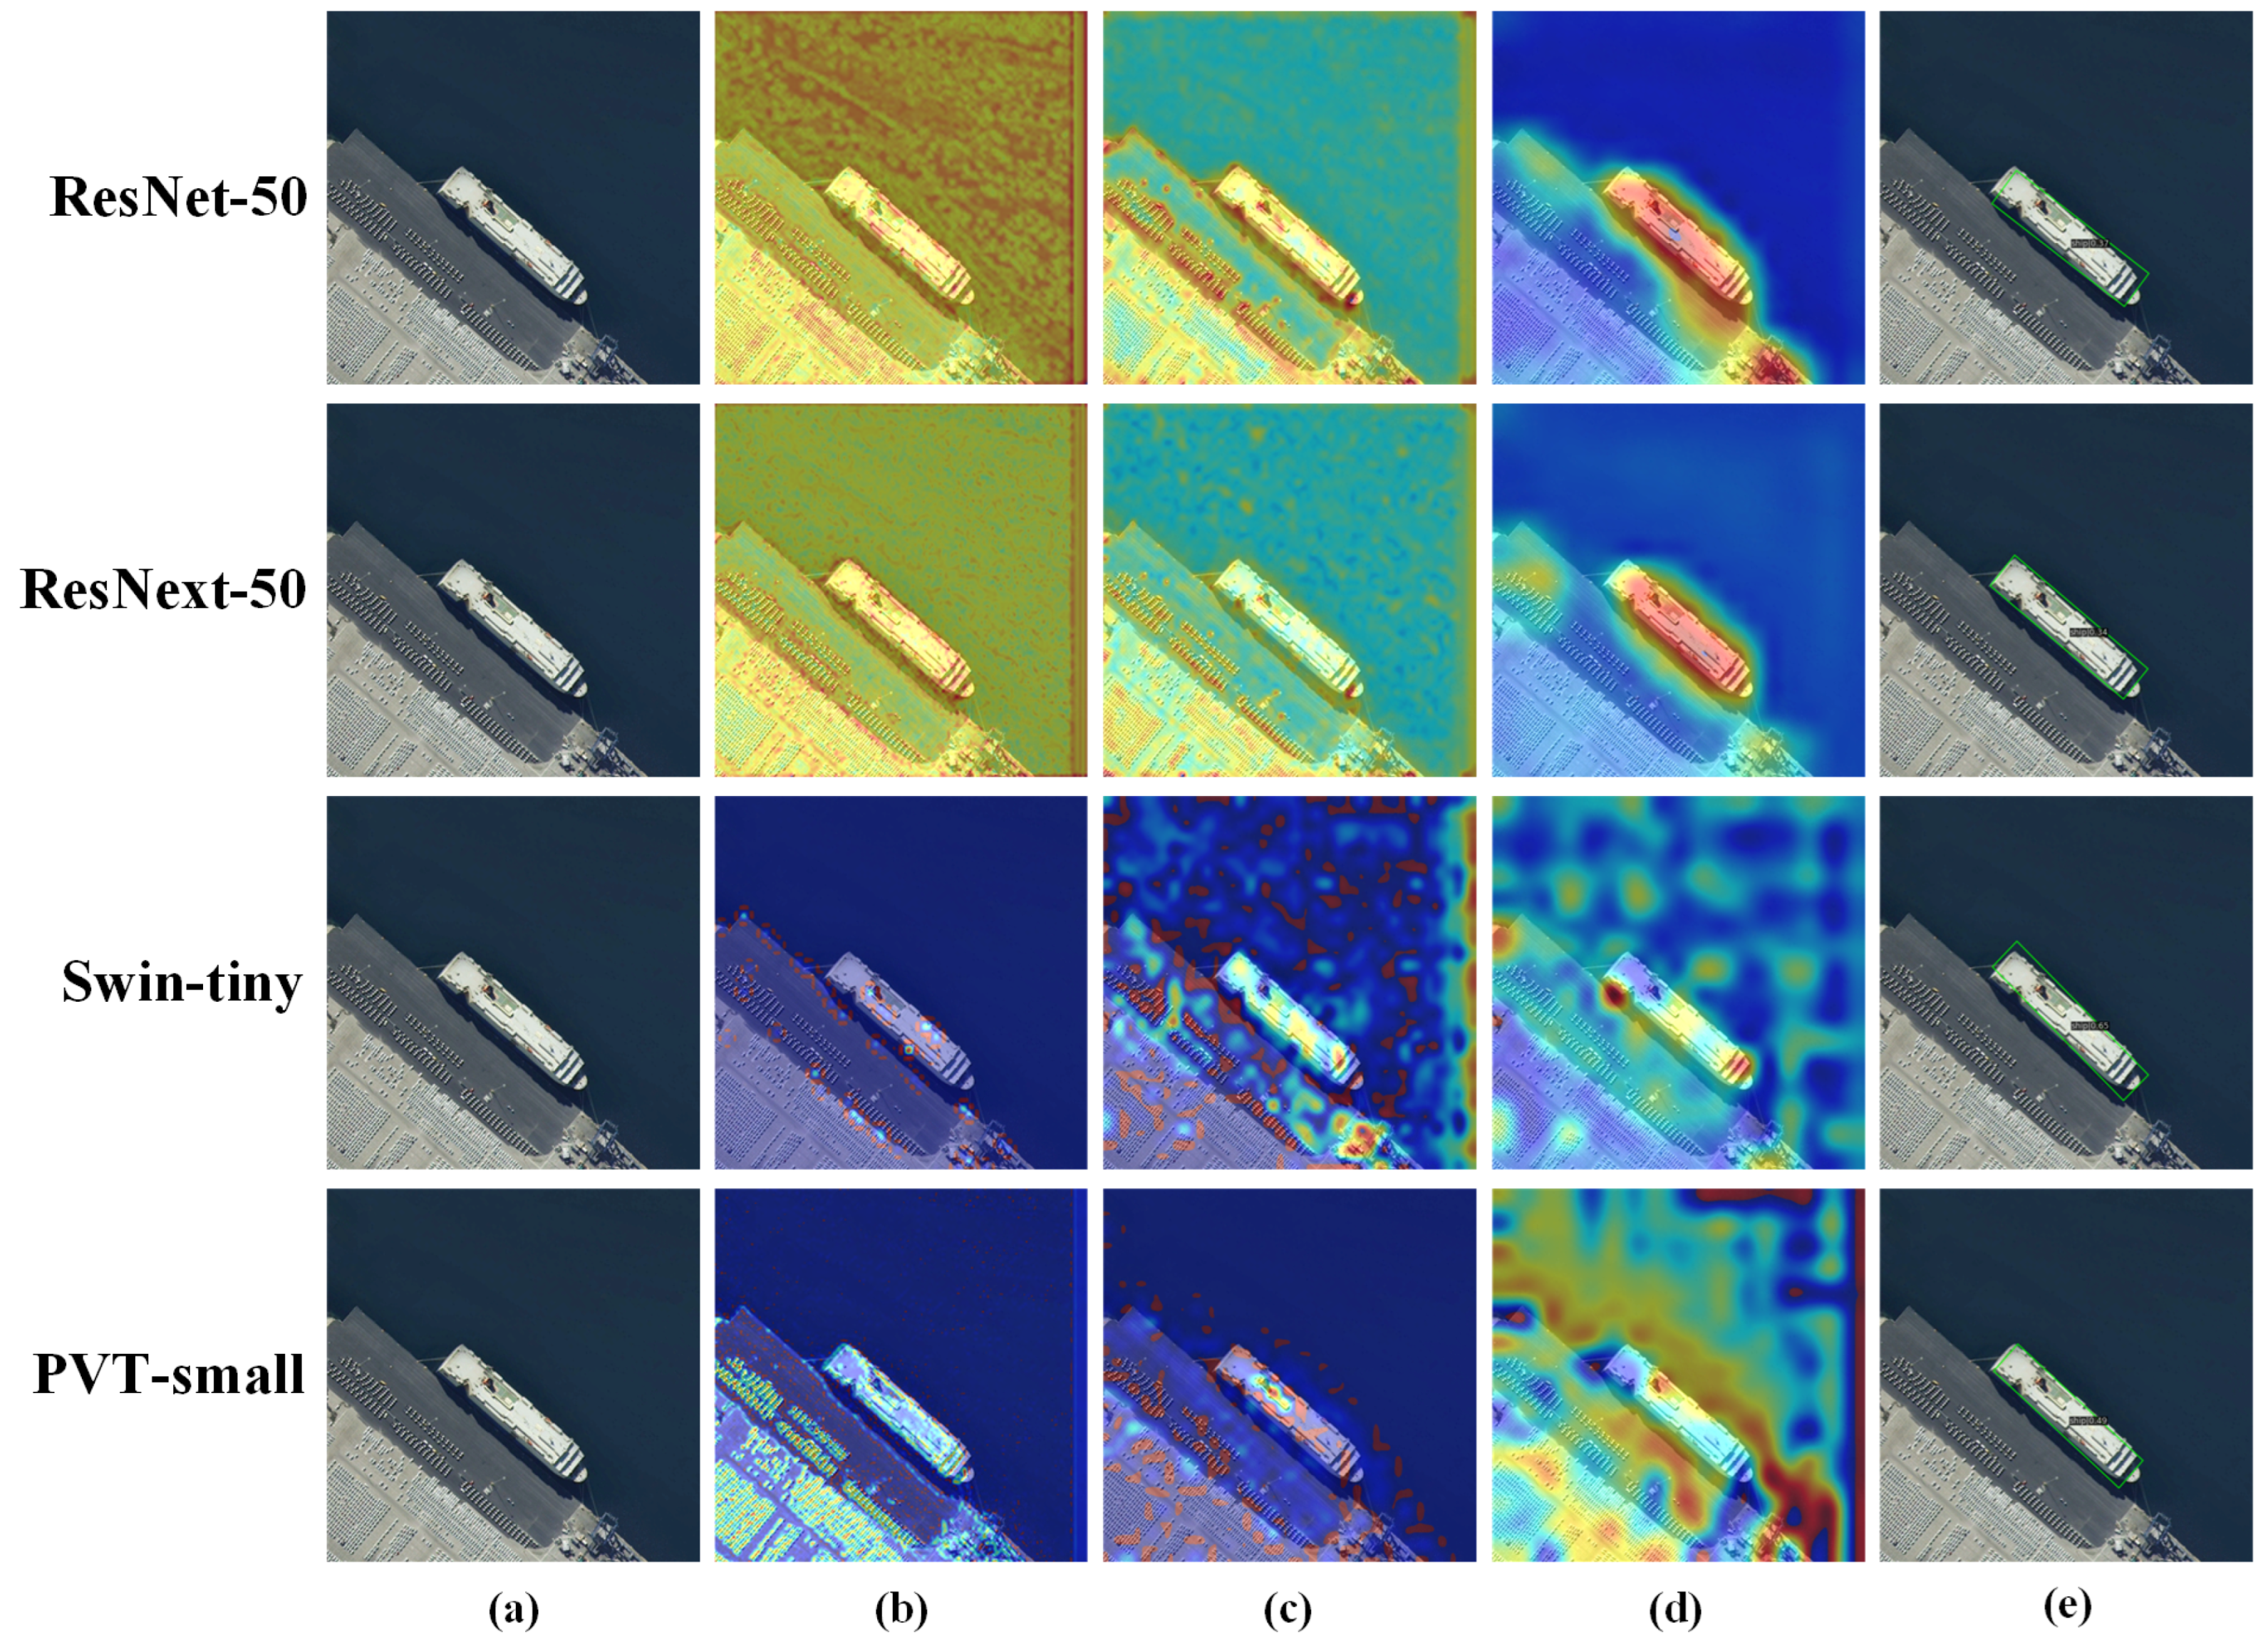
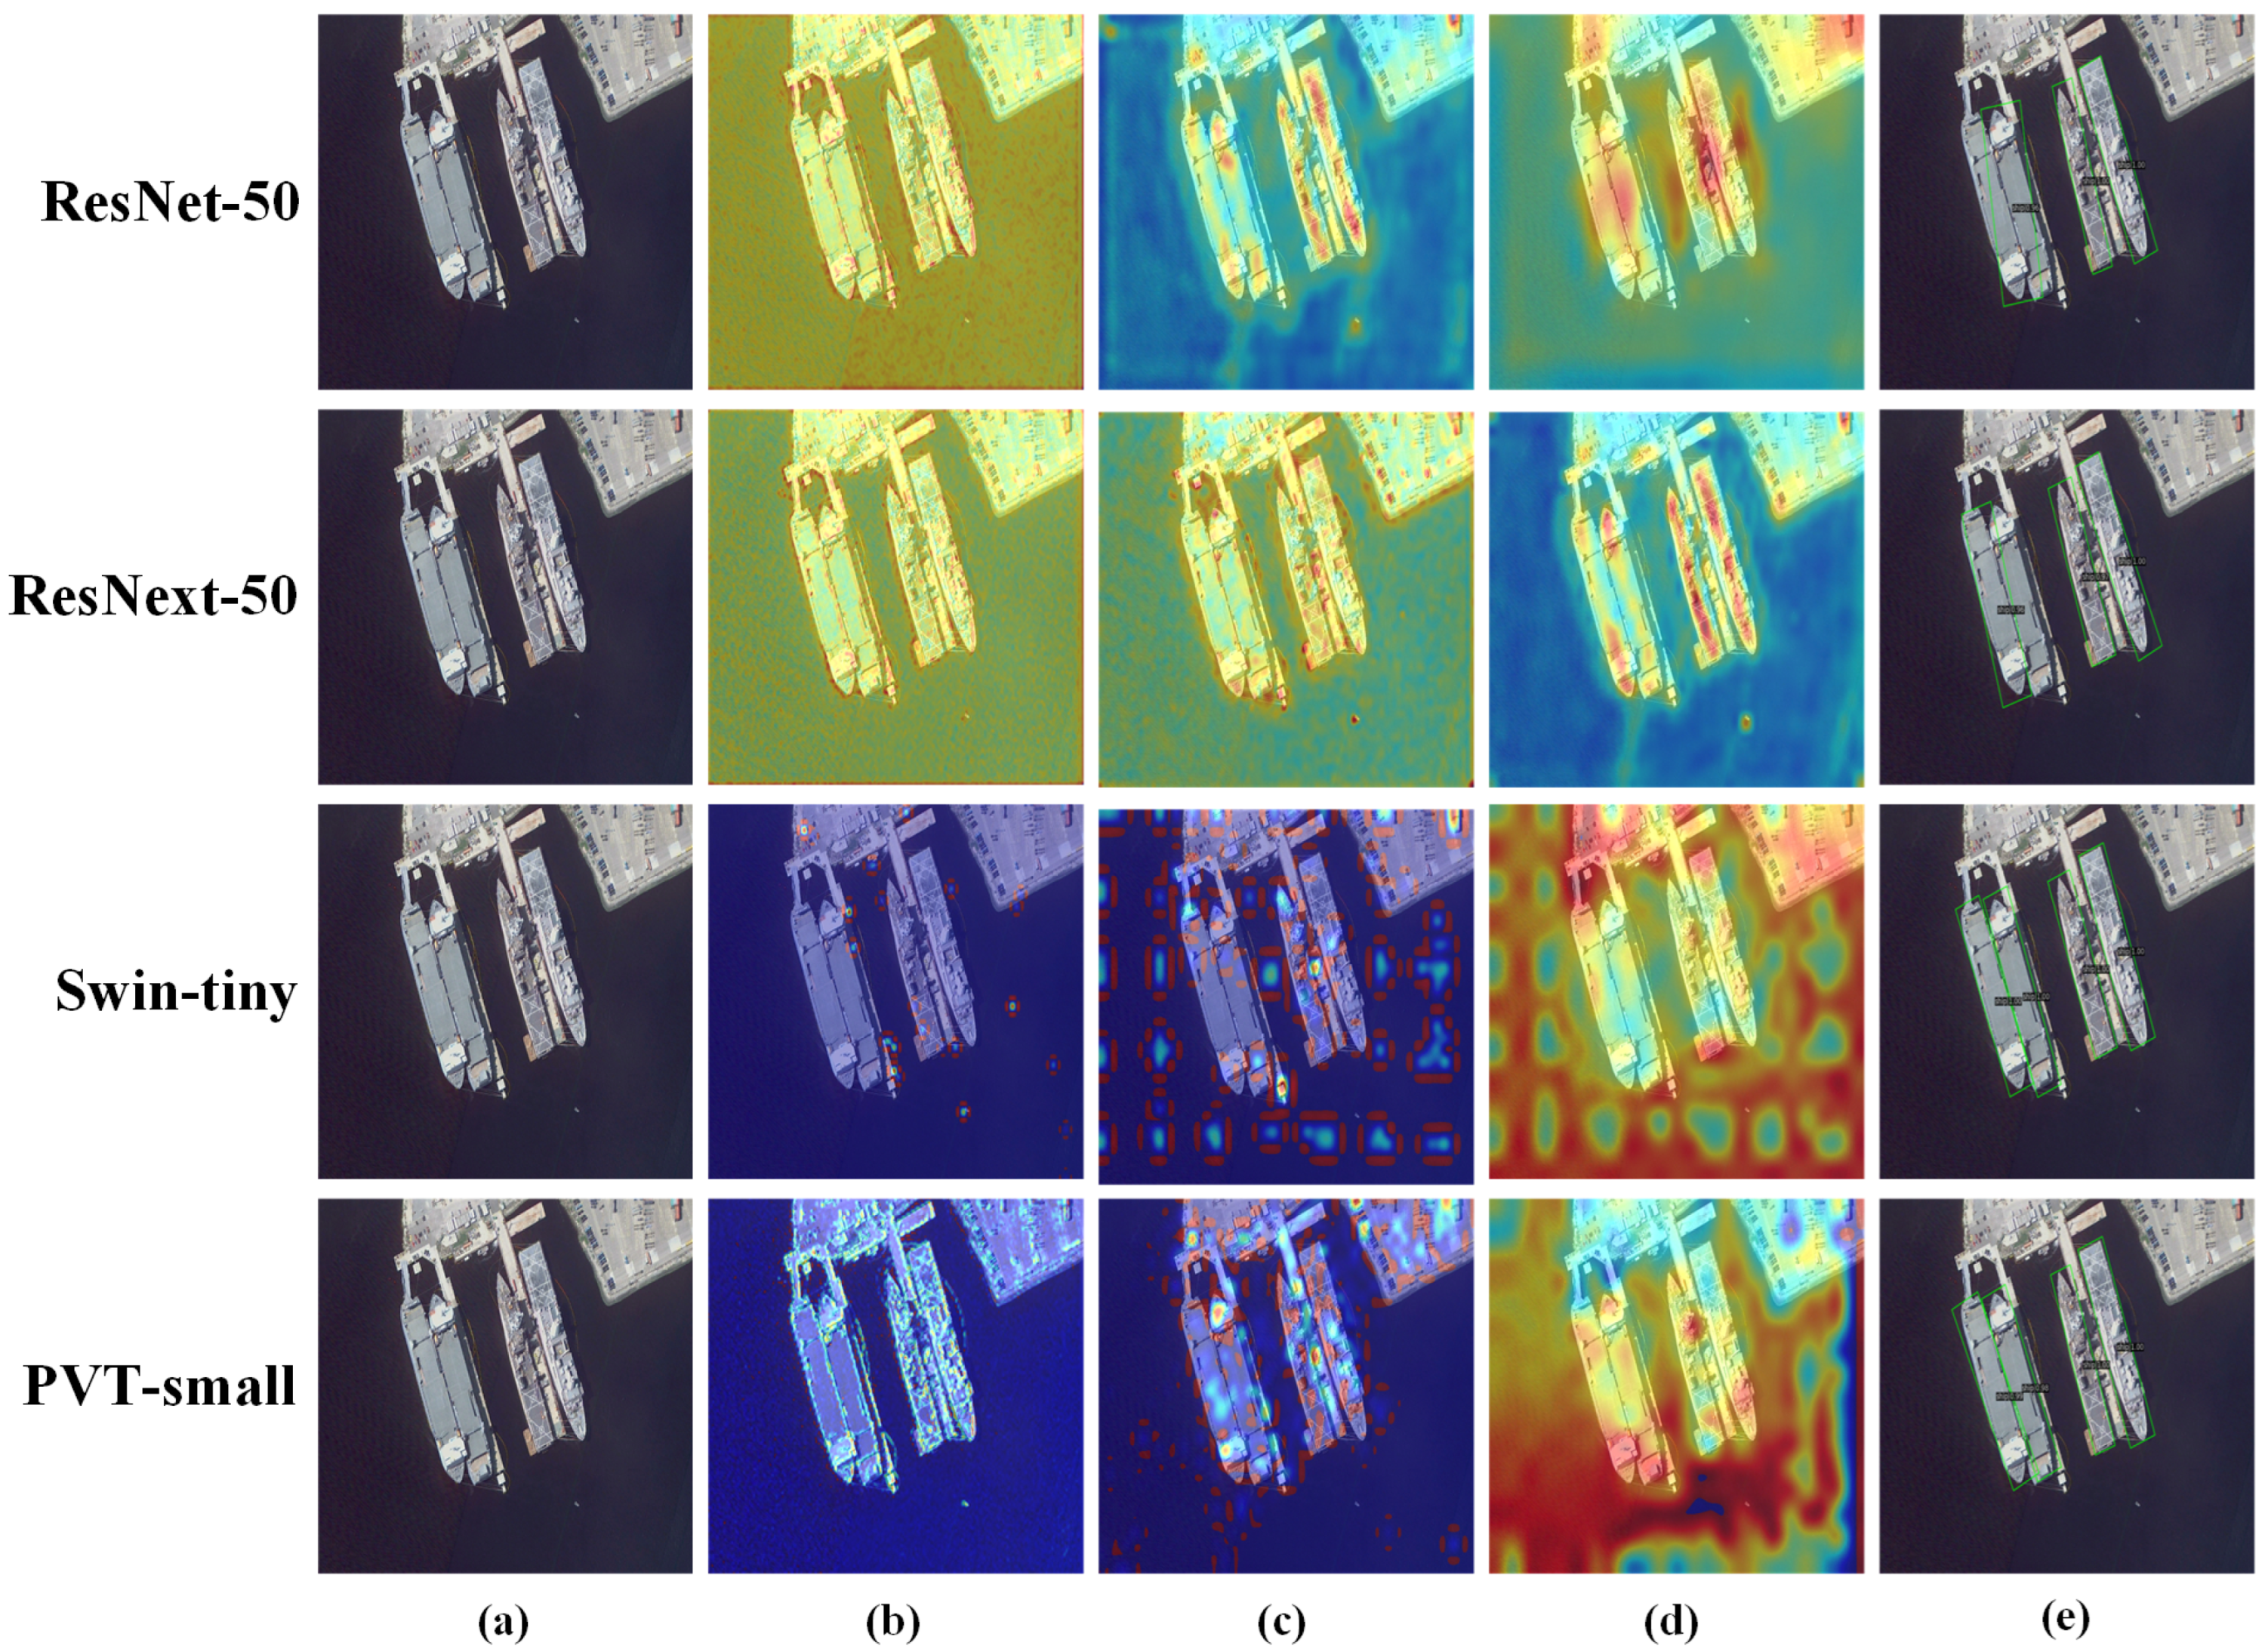
The performance of some competitive detection models are listed in Table 9 and Table 10. It can be observed that most algorithms prioritize the classical CNN models as the primary choice for feature extraction networks. However, the rate of performance growth is slowing down in recent years, indicating that the development of CNN-based algorithms is approaching maturity. To address this, it is an urgent need to break through the bottleneck of algorithmic development to further enhance detection capabilities. In view of the strong performance advantages of Transformer in other computer vision domains, we attempted to explore the feature extraction capability of Transformer for SDORSIs. We compared the detection performance of two representative CNN-based backbones (ResNet and ResNext) and two representative Transformer-based backbones (Swin Transformer and PV Transformer) on the HRSC2016 dataset. At the same time, to ensure the robustness of the results, we chose two detection networks (RetinaNet and RoI_Trans) as baselines. We selected mAP, GFlops, and Parameters as the objective criteria for performance evaluation, as shown in Table 12 and Table 13. Furthermore, in order to intuitively demonstrate the relationship between the parameters’ count and performance of different backbones, we drewthe experimental results in a line chart, as shown in Figure 19.
It can be observed that under the same parameter level, the feature extraction capabilities of Transformer-based backbones are generally higher than those of CNN-based backbones. In Table 12, PVT-Medium achieves the best mAP of 85.93% when choosing RetinaNet as the baseline. Compared to ResNet-101 and ResNext-101 with the same parameter level, PVT-Medium improves by 3.36% and 2.20%, while significantly reducing GFlops. Swin Transformer also takes a leading position in competition with ResNext at the same parameter level. Specifically, under three model parameters (tiny, small, and base), Swin Transformer improves mAP by 1.39%, 1.49%, and 1.25%. In Table 13, Swin-base achieves the highest mAP when RoI_Trans is selected as the baseline. Furthermore, compared to ResNet-18, PVT-tiny improves the mAP by 17.34%. As shown in Figure 19, it is concluded that under the same parameter level, Transformer exhibits stronger feature extraction capability than CNN, leading to better network performance. This is because Transformer can effectively capture dependencies between targets over long distances, building the ability of global information awareness, while CNNs can only extract information within a small window, and the information is quite limited. Exploring the connections between ship and ship or ship and ocean from a global perspective can provide important clues for SDORSIs. Therefore, Transformer has great potential in SDORSIs. Furthermore, further research is important to explore optimization strategies for Transformers based on the characteristics of ships.
We visualize feature heatmaps of each backbone at the low, middle, and high levels to compare the differences in feature extraction capabilities between CNNs and Transformer. The feature heatmaps for RetinaNet and RoI_Trans are, respectively, presented in Figure 20 and Figure 21. According to the figures, as the network depth increases, CNN-based backbones (ResNet and ResNext) gradually pay more attention to ship regions. This is because the receptive field of deep-layer features increases, resulting in the feature collecting a wider range of information, so that the network can learn the comprehensive features of ships. However, the convolution is still a locally sliding feature extraction operation, and the extracted features are only concerned with the local scenes. Transformer-based backbones (Swin and PVT) process information from a global perspective, and the core self-attention operation can capture correlations between all pixels. For ship detection, the network can gather all ship-related clues to assist in prediction, avoiding the limitations of feature extraction confined to local windows. As shown in Figure 20 and Figure 21, the feature heatmaps of PVT focus on the edge details of ships at shallow feature levels, while the deep-level features establish global dependencies, thereby activating more associated regions to assist ship detection. Furthermore, in order to reduce the computational burden, Swin Transformer limits self-attention within a window and realizes the interaction between windows through sliding operations. The heatmaps in figures also indicate that attention is more concentrated within certain windows.

5. Discussions and Prospects

The rapid development of deep learning has led to significant progress in SDORSIs. However, there is still a considerable gap to reach mature applications, due to the six factors summarized in this paper that constrain the development of SDORSIs. Therefore, we discuss and prospect the future development directions in this section:
  • Utilizing super-resolution and other feature enhancement methods to selectively enhance the feature representation ability of small-scale ships, which improve the recall for small ships when the scale variation is extensive. It contributes to further enhancing the overall detection accuracy.
  • To address the challenge of imbalance between positive and negative samples, supplementing the quantity of positive samples, such as methods of mining samples from the ignored set and using adaptive IoU thresholds, are helpful to increase the contribution of positive samples during network training.
  • Directly transferring common object detection networks to ship detection often fails to produce satisfactory results. Therefore, it is one of the future trends to mine the inherent features of ships, such as the wake of moving ships, large aspect ratios and so on, and design targeted ship detection networks.
  • Utilizing image fusion methods of different modalities, such as spatial information and frequency domain information, optical remote-sensing images and SAR images, enables the advantageous complementarity of information. Therefore, It helps to improve the detection accuracy of ships with cloud and fog cover and small-scale ships.
  • Designing compact and efficient detection models is more in line with the needs of applications. Therefore, the research on lightweight models, such as knowledge distillation, network pruning, and NAS, is an important strategy for deploying models to embedded devices.
  • By comparing the feature extraction capabilities of CNNs and Transformer, this paper preliminarily verifies that the global modeling concept of Transformer is helpful to improve the detection accuracy of the network. Therefore, drawing inspiration from the latest research achievements in computer vision is the direction for future development.

6. Conclusions

Ship detection in optical remote-sensing images has broad application prospects in both civilian and military domains, and is the focal point in object detection. However, a comprehensive and systematic survey that addresses the challenges faced by SDORSIs in realistic scenarios is lacking. To address this gap, this paper based on the characteristics and challenges of ships, systematically reviews the development and current research status in SDORSIs. Specifically, this paper provides a systematic review of object detection methods, including both traditional and deep learning-based methods. Furthermore, the analysis of the application scenarios of these methods is conducted in SDORSIs. Secondly, we analyze the challenges faced in detection based on the characteristics of ships, including complex marine environments, insufficient discriminative features, large scale variations, dense and rotated distributions, large aspect ratios, and imbalances between positive and negative samples. The improvement strategies for these six issues are summarized in detail. Then, we firstly compile ship information from comprehensive datasets and compare the performance of representative models. We explore the application prospects of Transformer in SDORSIs through experiments. Finally, we put forward the prospects for the development trends in SDORSIs.
We hope that this review can promote development in SDORSIs. In the future, we will continue to monitor the latest technologies in ship detection. Furthermore, we are eager to successful deploy ship detectors into embedded devices and achieve high-precision real-time detection.

Author Contributions

T.Z. wrote the manuscript; Y.W. gave professional guidance and edited; Z.L. gave advice and edited; Y.G. and Z.Z. gave advice; C.C. and H.F. revised the manuscript. All authors have read and agreed to the published version of the manuscript.

Funding

This research received no external funding.

Data Availability Statement

The data presented in this study are available in the article.

Conflicts of Interest

The authors declare no conflict of interest.

References

  1. Abileah, R. Surveying coastal ship traffic with LANDSAT. In Proceedings of the OCEANS 2009, Biloxi, MS, USA, 26–29 October 2009; pp. 1–6. [Google Scholar] [CrossRef]
  2. Li, Z.; Wang, Y.; Zhang, N.; Zhang, Y.; Zhao, Z.; Xu, D.; Ben, G.; Gao, Y. Deep Learning-Based Object Detection Techniques for Remote Sensing Images: A Survey. Remote Sens. 2022, 14, 2385. [Google Scholar] [CrossRef]
  3. Er, M.J.; Zhang, Y.; Chen, J.; Gao, W. Ship detection with deep learning: A survey. Artif. Intell. Rev. 2023, 56, 11825–11865. [Google Scholar] [CrossRef]
  4. Iwin Thanakumar Joseph, S.; Sasikala, J.; Sujitha Juliet, D. Ship detection and recognition for offshore and inshore applications: A survey. Int. J. Intell. Unmanned Syst. 2019, 7, 177–188. [Google Scholar]
  5. Bo, L.; Xiaoyang, X.; Xingxing, W.; Wenting, T. Ship detection and classification from optical remote sensing images: A survey. Chin. J. Aeronaut. 2021, 34, 145–163. [Google Scholar]
  6. Kanjir, U.; Greidanus, H.; Oštir, K. Vessel detection and classification from spaceborne optical images: A literature survey. Remote Sens. Environ. 2018, 207, 1–26. [Google Scholar] [CrossRef] [PubMed]
  7. Li, J.; Xu, C.; Su, H.; Gao, L.; Wang, T. Deep learning for SAR ship detection: Past, present and future. Remote Sens. 2022, 14, 2712. [Google Scholar] [CrossRef]
  8. Xu, J.; Fu, K.; Sun, X. An Invariant Generalized Hough Transform Based Method of Inshore Ships Detection. In Proceedings of the 2011 International Symposium on Image and Data Fusion, Tengchong, China, 9–11 August 2011; pp. 1–4. [Google Scholar] [CrossRef]
  9. Harvey, N.R.; Porter, R.; Theiler, J. Ship detection in satellite imagery using rank-order grayscale hit-or-miss transforms. In Proceedings of the Visual Information Processing XIX; SPIE: Bellingham, WA, USA, 2010; Volume 7701, pp. 9–20. [Google Scholar]
  10. He, H.; Lin, Y.; Chen, F.; Tai, H.M.; Yin, Z. Inshore Ship Detection in Remote Sensing Images via Weighted Pose Voting. IEEE Trans. Geosci. Remote Sens. 2017, 55, 3091–3107. [Google Scholar] [CrossRef]
  11. Xu, F.; Liu, J.; Sun, M.; Zeng, D.; Wang, X. A hierarchical maritime target detection method for optical remote sensing imagery. Remote Sens. 2017, 9, 280. [Google Scholar] [CrossRef]
  12. Nie, T.; He, B.; Bi, G.; Zhang, Y.; Wang, W. A method of ship detection under complex background. ISPRS Int. J. Geo-Inf. 2017, 6, 159. [Google Scholar] [CrossRef]
  13. Qi, S.; Ma, J.; Lin, J.; Li, Y.; Tian, J. Unsupervised Ship Detection Based on Saliency and S-HOG Descriptor from Optical Satellite Images. IEEE Geosci. Remote Sens. Lett. 2015, 12, 1451–1455. [Google Scholar] [CrossRef]
  14. Bi, F.; Zhu, B.; Gao, L.; Bian, M. A Visual Search Inspired Computational Model for Ship Detection in Optical Satellite Images. IEEE Geosci. Remote Sens. Lett. 2012, 9, 749–753. [Google Scholar] [CrossRef]
  15. Lowe, D. Object recognition from local scale-invariant features. In Proceedings of the Seventh IEEE International Conference on Computer Vision, Kerkyra, Greece, 20–27 September 1999; Volume 2, pp. 1150–1157. [CrossRef]
  16. Dalal, N.; Triggs, B. Histograms of oriented gradients for human detection. In Proceedings of the 2005 IEEE Computer Society Conference on Computer Vision and Pattern Recognition (CVPR’05), San Diego, CA, USA, 20–25 June 2005; Volume1; pp. 886–893. [Google Scholar] [CrossRef]
  17. Corbane, C.; Najman, L.; Pecoul, E.; Demagistri, L.; Petit, M. A complete processing chain for ship detection using optical satellite imagery. Int. J. Remote Sens. 2010, 31, 5837–5854. [Google Scholar] [CrossRef]
  18. Song, Z.; Sui, H.; Wang, Y. Automatic ship detection for optical satellite images based on visual attention model and LBP. In Proceedings of the 2014 IEEE Workshop on Electronics, Computer and Applications, Ottawa, ON, USA, 8–9 May 2014; pp. 722–725. [Google Scholar] [CrossRef]
  19. Zhu, C.; Zhou, H.; Wang, R.; Guo, J. A Novel Hierarchical Method of Ship Detection from Spaceborne Optical Image Based on Shape and Texture Features. IEEE Trans. Geosci. Remote Sens. 2010, 48, 3446–3456. [Google Scholar] [CrossRef]
  20. Liu, G.; Zhang, Y.; Zheng, X.; Sun, X.; Fu, K.; Wang, H. A New Method on Inshore Ship Detection in High-Resolution Satellite Images Using Shape and Context Information. IEEE Geosci. Remote Sens. Lett. 2014, 11, 617–621. [Google Scholar] [CrossRef]
  21. Antelo, J.; Ambrosio, G.; Gonzalez, J.; Galindo, C. Ship detection and recognitionin high-resolution satellite images. In Proceedings of the 2009 IEEE International Geoscience and Remote Sensing Symposium, Cape Town, South Africa, 12–17 July 2009; Volume 4, pp. IV–514–IV–517. [Google Scholar] [CrossRef]
  22. Xu, J.; Sun, X.; Zhang, D.; Fu, K. Automatic Detection of Inshore Ships in High-Resolution Remote Sensing Images Using Robust Invariant Generalized Hough Transform. IEEE Geosci. Remote Sens. Lett. 2014, 11, 2070–2074. [Google Scholar] [CrossRef]
  23. Zhu, L.; Xiong, G.; Guo, D.; Yu, W. Ship target detection and segmentation method based on multi-fractal analysis. J. Eng. 2019, 2019, 7876–7879. [Google Scholar] [CrossRef]
  24. Krizhevsky, A.; Sutskever, I.; Hinton, G.E. Imagenet classification with deep convolutional neural networks. Adv. Neural Inf. Process. Syst. 2012, 25. [Google Scholar] [CrossRef]
  25. Girshick, R.; Donahue, J.; Darrell, T.; Malik, J. Rich Feature Hierarchies for Accurate Object Detection and Semantic Segmentation. In Proceedings of the 2014 IEEE Conference on Computer Vision and Pattern Recognition, Columbus, OH, USA, 23–28 June 2014; pp. 580–587. [Google Scholar] [CrossRef]
  26. He, K.; Zhang, X.; Ren, S.; Sun, J. Spatial Pyramid Pooling in Deep Convolutional Networks for Visual Recognition. IEEE Trans. Pattern Anal. Mach. Intell. 2015, 37, 1904–1916. [Google Scholar] [CrossRef]
  27. Girshick, R. Fast r-cnn. In Proceedings of the IEEE International Conference on Computer Vision, Santiago, Chile, 7–13 December 2015; pp. 1440–1448. [Google Scholar]
  28. Ren, S.; He, K.; Girshick, R.; Sun, J. Faster R-CNN: Towards Real-Time Object Detection with Region Proposal Networks. IEEE Trans. Pattern Anal. Mach. Intell. 2017, 39, 1137–1149. [Google Scholar] [CrossRef]
  29. He, K.; Gkioxari, G.; Dollár, P.; Girshick, R. Mask R-CNN. IEEE Trans. Pattern Anal. Mach. Intell. 2020, 42, 386–397. [Google Scholar] [CrossRef]
  30. Cai, Z.; Vasconcelos, N. Cascade R-CNN: Delving Into High Quality Object Detection. In Proceedings of the 2018 IEEE/CVF Conference on Computer Vision and Pattern Recognition, Salt Lake City, UT, USA, 18–23 June 2018; pp. 6154–6162. [Google Scholar] [CrossRef]
  31. Pang, J.; Chen, K.; Shi, J.; Feng, H.; Ouyang, W.; Lin, D. Libra R-CNN: Towards Balanced Learning for Object Detection. In Proceedings of the 2019 IEEE/CVF Conference on Computer Vision and Pattern Recognition (CVPR), Long Beach, CA, USA, 15–20 June 2019; pp. 821–830. [Google Scholar] [CrossRef]
  32. Lu, X.; Li, B.; Yue, Y.; Li, Q.; Yan, J. Grid R-CNN. In Proceedings of the 2019 IEEE/CVF Conference on Computer Vision and Pattern Recognition (CVPR), Long Beach, CA, USA, 15–20 June 2019; pp. 7355–7364. [Google Scholar] [CrossRef]
  33. Guo, H.; Yang, X.; Wang, N.; Song, B.; Gao, X. A Rotational Libra R-CNN Method for Ship Detection. IEEE Trans. Geosci. Remote Sens. 2020, 58, 5772–5781. [Google Scholar] [CrossRef]
  34. Li, Q.; Mou, L.; Liu, Q.; Wang, Y.; Zhu, X.X. HSF-Net: Multiscale Deep Feature Embedding for Ship Detection in Optical Remote Sensing Imagery. IEEE Trans. Geosci. Remote Sens. 2018, 56, 7147–7161. [Google Scholar] [CrossRef]
  35. Nie, S.; Jiang, Z.; Zhang, H.; Cai, B.; Yao, Y. Inshore Ship Detection Based on Mask R-CNN. In Proceedings of the IGARSS 2018—2018 IEEE International Geoscience and Remote Sensing Symposium, Valencia, Spain, 22–27 July 2018; pp. 693–696. [Google Scholar] [CrossRef]
  36. Redmon, J.; Divvala, S.; Girshick, R.; Farhadi, A. You Only Look Once: Unified, Real-Time Object Detection. In Proceedings of the 2016 IEEE Conference on Computer Vision and Pattern Recognition (CVPR), Las Vegas, NV, USA, 27–30 June 2016; pp. 779–788. [Google Scholar] [CrossRef]
  37. Redmon, J.; Farhadi, A. YOLO9000: Better, Faster, Stronger. In Proceedings of the 2017 IEEE Conference on Computer Vision and Pattern Recognition (CVPR), Honolulu, HI, USA, 21–26 July 2017; pp. 6517–6525. [Google Scholar] [CrossRef]
  38. Redmon, J.; Farhadi, A. Yolov3: An incremental improvement. arXiv 2018, arXiv:1804.02767. [Google Scholar]
  39. Bochkovskiy, A.; Wang, C.Y.; Liao, H.Y.M. Yolov4: Optimal speed and accuracy of object detection. arXiv 2020, arXiv:2004.10934. [Google Scholar]
  40. Li, C.; Li, L.; Jiang, H.; Weng, K.; Geng, Y.; Li, L.; Ke, Z.; Li, Q.; Cheng, M.; Nie, W.; et al. YOLOv6: A single-stage object detection framework for industrial applications. arXiv 2022, arXiv:2209.02976. [Google Scholar]
  41. Wang, C.Y.; Bochkovskiy, A.; Liao, H.Y.M. YOLOv7: Trainable bag-of-freebies sets new state-of-the-art for real-time object detectors. In Proceedings of the IEEE/CVF Conference on Computer Vision and Pattern Recognition, Vancouver, BC, Canada, 17–24 June 2023; pp. 7464–7475. [Google Scholar]
  42. Liu, W.; Anguelov, D.; Erhan, D.; Szegedy, C.; Reed, S.; Fu, C.Y.; Berg, A.C. Ssd: Single shot multibox detector. In Proceedings of the Computer Vision–ECCV 2016: 14th European Conference, Amsterdam, The Netherlands, 11–14 October 2016; Proceedings, Part I 14. Springer: Berlin/Heidelberg, Germany, 2016; pp. 21–37. [Google Scholar]
  43. Lin, T.Y.; Goyal, P.; Girshick, R.; He, K.; Dollár, P. Focal Loss for Dense Object Detection. IEEE Trans. Pattern Anal. Mach. Intell. 2020, 42, 318–327. [Google Scholar] [CrossRef]
  44. Patel, K.; Bhatt, C.; Mazzeo, P.L. Deep learning-based automatic detection of ships: An experimental study using satellite images. J. Imaging 2022, 8, 182. [Google Scholar] [CrossRef]
  45. Gong, W.; Shi, Z.; Wu, Z.; Luo, J. Arbitrary-oriented ship detection via feature fusion and visual attention for high-resolution optical remote sensing imagery. Int. J. Remote Sens. 2021, 42, 2622–2640. [Google Scholar] [CrossRef]
  46. Wu, J.; Pan, Z.; Lei, B.; Hu, Y. LR-TSDet: Towards tiny ship detection in low-resolution remote sensing images. Remote Sens. 2021, 13, 3890. [Google Scholar] [CrossRef]
  47. Law, H.; Deng, J. Cornernet: Detecting objects as paired keypoints. In Proceedings of the European Conference on Computer Vision (ECCV), Munich, Germany, 8–14 September 2018; Springer: Berlin/Heidelberg, Germany, 2018; pp. 734–750. [Google Scholar]
  48. Zhou, X.; Wang, D.; Krähenbühl, P. Objects as points. arXiv 2019, arXiv:1904.07850. [Google Scholar]
  49. Tian, Z.; Shen, C.; Chen, H.; He, T. FCOS: Fully Convolutional One-Stage Object Detection. In Proceedings of the 2019 IEEE/CVF International Conference on Computer Vision (ICCV), Seoul, Republic of Korea, 27 October–2 November 2019; pp. 9626–9635. [Google Scholar] [CrossRef]
  50. Yang, Y.; Pan, Z.; Hu, Y.; Ding, C. CPS-Det: An anchor-free based rotation detector for ship detection. Remote Sens. 2021, 13, 2208. [Google Scholar] [CrossRef]
  51. Zhuang, Y.; Liu, Y.; Zhang, T.; Chen, H. Contour Modeling Arbitrary-Oriented Ship Detection From Very High-Resolution Optical Remote Sensing Imagery. IEEE Geosci. Remote Sens. Lett. 2023, 20, 6000805. [Google Scholar] [CrossRef]
  52. Zhang, Y.; Sheng, W.; Jiang, J.; Jing, N.; Wang, Q.; Mao, Z. Priority branches for ship detection in optical remote sensing images. Remote Sens. 2020, 12, 1196. [Google Scholar] [CrossRef]
  53. Vaswani, A.; Shazeer, N.; Parmar, N.; Uszkoreit, J.; Jones, L.; Gomez, A.N.; Kaiser, Ł.; Polosukhin, I. Attention is all you need. arXiv 2023, arXiv:1706.03762. [Google Scholar] [CrossRef]
  54. Carion, N.; Massa, F.; Synnaeve, G.; Usunier, N.; Kirillov, A.; Zagoruyko, S. End-to-end object detection with transformers. In Proceedings of the European Conference on Computer Vision, Tel Aviv, Israel, 23–27 October 2020; Springer: Berlin/Heidelberg, Germany, 2020; pp. 213–229. [Google Scholar]
  55. Zhu, X.; Su, W.; Lu, L.; Li, B.; Wang, X.; Dai, J. Deformable detr: Deformable transformers for end-to-end object detection. arXiv 2020, arXiv:2010.04159. [Google Scholar]
  56. Liu, Z.; Lin, Y.; Cao, Y.; Hu, H.; Wei, Y.; Zhang, Z.; Lin, S.; Guo, B. Swin Transformer: Hierarchical Vision Transformer using Shifted Windows. In Proceedings of the 2021 IEEE/CVF International Conference on Computer Vision (ICCV), Montreal, QC, Canada, 10–17 October 2021; pp. 9992–10002. [Google Scholar] [CrossRef]
  57. Wang, W.; Xie, E.; Li, X.; Fan, D.P.; Song, K.; Liang, D.; Lu, T.; Luo, P.; Shao, L. Pyramid vision transformer: A versatile backbone for dense prediction without convolutions. In Proceedings of the IEEE/CVF International Conference on Computer Vision, Montreal, BC, Canada, 11–17 October 2021; pp. 568–578. [Google Scholar]
  58. Han, K.; Xiao, A.; Wu, E.; Guo, J.; Xu, C.; Wang, Y. Transformer in transformer. Adv. Neur. In. 2021, 34, 15908–15919. [Google Scholar]
  59. Yu, Y.; Yang, X.; Li, J.; Gao, X. A Cascade Rotated Anchor-Aided Detector for Ship Detection in Remote Sensing Images. IEEE Trans. Geosci. Remote Sens. 2022, 60, 5600514. [Google Scholar] [CrossRef]
  60. Zheng, Y.; Su, J.; Zhang, S.; Tao, M.; Wang, L. Dehaze-AGGAN: Unpaired Remote Sensing Image Dehazing Using Enhanced Attention-Guide Generative Adversarial Networks. IEEE Trans. Geosci. Remote Sens. 2022, 60, 5630413. [Google Scholar] [CrossRef]
  61. Song, R.; Li, T.; Li, T. Ship detection in haze and low-light remote sensing images via colour balance and DCNN. Appl. Ocean Res. 2023, 139, 103702. [Google Scholar] [CrossRef]
  62. Yang, Y.; Wang, C.; Liu, R.; Zhang, L.; Guo, X.; Tao, D. Self-augmented Unpaired Image Dehazing via Density and Depth Decomposition. In Proceedings of the 2022 IEEE/CVF Conference on Computer Vision and Pattern Recognition (CVPR), Orleans, LA, USA, 18–24 June 2022; pp. 2027–2036. [Google Scholar] [CrossRef]
  63. Ying, L.; Miao, D.; Zhang, Z. 3WM-AugNet: A Feature Augmentation Network for Remote Sensing Ship Detection Based on Three-Way Decisions and Multigranularity. IEEE Trans. Geosci. Remote Sens. 2023, 61, 1001219. [Google Scholar] [CrossRef]
  64. Li, L.; Zhou, Z.; Wang, B.; Miao, L.; An, Z.; Xiao, X. Domain adaptive ship detection in optical remote sensing images. Remote Sens. 2021, 13, 3168. [Google Scholar] [CrossRef]
  65. Wang, Q.; Shen, F.; Cheng, L.; Jiang, J.; He, G.; Sheng, W.; Jing, N.; Mao, Z. Ship detection based on fused features and rebuilt YOLOv3 networks in optical remote-sensing images. Int. J. Remote Sens. 2021, 42, 520–536. [Google Scholar] [CrossRef]
  66. Hu, J.; Zhi, X.; Shi, T.; Zhang, W.; Cui, Y.; Zhao, S. PAG-YOLO: A portable attention-guided YOLO network for small ship detection. Remote Sens. 2021, 13, 3059. [Google Scholar] [CrossRef]
  67. Qin, C.; Wang, X.; Li, G.; He, Y. An Improved Attention-Guided Network for Arbitrary-Oriented Ship Detection in Optical Remote Sensing Images. IEEE Geosci. Remote Sens. Lett. 2022, 19, 6514805. [Google Scholar] [CrossRef]
  68. Chen, Y.; Wang, J.; Zhang, Y.; Liu, Y. Arbitrary-oriented ship detection based on Kullback–Leibler divergence regression in remote sensing images. Earth Sci. Inform. 2023, 16, 3243–3255. [Google Scholar] [CrossRef]
  69. Qu, Z.; Zhu, F.; Qi, C. Remote sensing image target detection: Improvement of the YOLOv3 model with auxiliary networks. Remote Sens. 2021, 13, 3908. [Google Scholar] [CrossRef]
  70. Ren, Z.; Tang, Y.; He, Z.; Tian, L.; Yang, Y.; Zhang, W. Ship Detection in High-Resolution Optical Remote Sensing Images Aided by Saliency Information. IEEE Trans. Geosci. Remote Sens. 2022, 60, 5623616. [Google Scholar] [CrossRef]
  71. Chen, J.; Chen, K.; Chen, H.; Zou, Z.; Shi, Z. A Degraded Reconstruction Enhancement-Based Method for Tiny Ship Detection in Remote Sensing Images With a New Large-Scale Dataset. IEEE Trans. Geosci. Remote Sens. 2022, 60, 5625014. [Google Scholar] [CrossRef]
  72. Liu, Y.; Zhang, R.; Deng, R.; Zhao, J. Ship detection and classification based on cascaded detection of hull and wake from optical satellite remote sensing imagery. GIScience Remote Sens. 2023, 60, 2196159. [Google Scholar] [CrossRef]
  73. Xue, F.; Jin, W.; Qiu, S.; Yang, J. Rethinking Automatic Ship Wake Detection: State-of-the-Art CNN-Based Wake Detection via Optical Images. IEEE Trans. Geosci. Remote Sens. 2022, 60, 5613622. [Google Scholar] [CrossRef]
  74. Liu, Y.; Zhao, J.; Qin, Y. A novel technique for ship wake detection from optical images. Remote Sens. Environ. 2021, 258, 112375. [Google Scholar] [CrossRef]
  75. Liu, Z.; Xu, J.; Li, J.; Plaza, A.; Zhang, S.; Wang, L. Moving Ship Optimal Association for Maritime Surveillance: Fusing AIS and Sentinel-2 Data. IEEE Trans. Geosci. Remote Sens. 2022, 60, 5635218. [Google Scholar] [CrossRef]
  76. Liu, Y.; Deng, R.; Zhao, J. Simulation of Kelvin wakes in optical images of rough sea surface. Appl. Ocean Res. 2019, 89, 36–43. [Google Scholar] [CrossRef]
  77. Xu, Q.; Li, Y.; Shi, Z. LMO-YOLO: A Ship Detection Model for Low-Resolution Optical Satellite Imagery. IEEE J. Sel. Topics Appl. Earth Observ. Remote Sens. 2022, 15, 4117–4131. [Google Scholar] [CrossRef]
  78. Chen, L.; Shi, W.; Deng, D. Improved YOLOv3 based on attention mechanism for fast and accurate ship detection in optical remote sensing images. Remote Sens. 2021, 13, 660. [Google Scholar] [CrossRef]
  79. Zhou, L.; Li, Y.; Rao, X.; Liu, C.; Zuo, X.; Liu, Y. Ship Target Detection in Optical Remote Sensing Images Based on Multiscale Feature Enhancement. Comput. Intell. Neurosci. 2022, 2022, 2605140. [Google Scholar] [CrossRef]
  80. Liu, W.; Ma, L.; Chen, H. Arbitrary-Oriented Ship Detection Framework in Optical Remote-Sensing Images. IEEE Geosci. Remote Sens. Lett. 2018, 15, 937–941. [Google Scholar] [CrossRef]
  81. Li, L.; Zhou, Z.; Wang, B.; Miao, L.; Zong, H. A Novel CNN-Based Method for Accurate Ship Detection in HR Optical Remote Sensing Images via Rotated Bounding Box. IEEE Trans. Geosci. Remote Sens. 2021, 59, 686–699. [Google Scholar] [CrossRef]
  82. Tian, L.; Cao, Y.; He, B.; Zhang, Y.; He, C.; Li, D. Image enhancement driven by object characteristics and dense feature reuse network for ship target detection in remote sensing imagery. Remote Sens. 2021, 13, 1327. [Google Scholar] [CrossRef]
  83. Qin, P.; Cai, Y.; Liu, J.; Fan, P.; Sun, M. Multilayer Feature Extraction Network for Military Ship Detection From High-Resolution Optical Remote Sensing Images. IEEE J. Sel. Topics Appl. Earth Observ. Remote Sens. 2021, 14, 11058–11069. [Google Scholar] [CrossRef]
  84. Han, Y.; Yang, X.; Pu, T.; Peng, Z. Fine-Grained Recognition for Oriented Ship Against Complex Scenes in Optical Remote Sensing Images. IEEE Trans. Geosci. Remote Sens. 2022, 60, 5612318. [Google Scholar] [CrossRef]
  85. Wen, G.; Cao, P.; Wang, H.; Chen, H.; Liu, X.; Xu, J.; Zaiane, O. MS-SSD: Multi-scale single shot detector for ship detection in remote sensing images. Appl. Intell. 2023, 53, 1586–1604. [Google Scholar] [CrossRef]
  86. Lin, T.Y.; Dollár, P.; Girshick, R.; He, K.; Hariharan, B.; Belongie, S. Feature Pyramid Networks for Object Detection. In Proceedings of the 2017 IEEE Conference on Computer Vision and Pattern Recognition (CVPR), Honolulu, HI, USA, 21–26 July 2017; pp. 936–944. [Google Scholar] [CrossRef]
  87. Tian, Y.; Wang, X.; Zhu, S.; Xu, F.; Liu, J. LMSD-Net: A Lightweight and High-Performance Ship Detection Network for Optical Remote Sensing Images. Remote Sens. 2023, 15, 4358. [Google Scholar] [CrossRef]
  88. Si, J.; Song, B.; Wu, J.; Lin, W.; Huang, W.; Chen, S. Maritime Ship Detection Method for Satellite Images Based on Multiscale Feature Fusion. IEEE J. Sel. Topics Appl. Earth Observ. Remote Sens. 2023, 16, 6642–6655. [Google Scholar] [CrossRef]
  89. Yan, Z.; Li, Z.; Xie, Y.; Li, C.; Li, S.; Sun, F. ReBiDet: An Enhanced Ship Detection Model Utilizing ReDet and Bi-Directional Feature Fusion. Appl. Sci. 2023, 13, 7080. [Google Scholar] [CrossRef]
  90. Li, J.; Li, Z.; Chen, M.; Wang, Y.; Luo, Q. A new ship detection algorithm in optical remote sensing images based on improved R3Det. Remote Sens. 2022, 14, 5048. [Google Scholar] [CrossRef]
  91. Chen, W.; Han, B.; Yang, Z.; Gao, X. MSSDet: Multi-Scale Ship-Detection Framework in Optical Remote-Sensing Images and New Benchmark. Remote Sens. 2022, 14, 5460. [Google Scholar] [CrossRef]
  92. Xie, X.; Li, L.; An, Z.; Lu, G.; Zhou, Z. Small Ship Detection Based on Hybrid Anchor Structure and Feature Super-Resolution. Remote Sens. 2022, 14, 3530. [Google Scholar] [CrossRef]
  93. Zhang, X.; Wang, G.; Zhu, P.; Zhang, T.; Li, C.; Jiao, L. GRS-Det: An Anchor-Free Rotation Ship Detector Based on Gaussian-Mask in Remote Sensing Images. IEEE Trans. Geosci. Remote Sens. 2021, 59, 3518–3531. [Google Scholar] [CrossRef]
  94. Guo, H.; Bai, H.; Yuan, Y.; Qin, W. Fully deformable convolutional network for ship detection in remote sensing imagery. Remote Sens. 2022, 14, 1850. [Google Scholar] [CrossRef]
  95. Liu, Q.; Xiang, X.; Yang, Z.; Hu, Y.; Hong, Y. Arbitrary Direction Ship Detection in Remote-Sensing Images Based on Multitask Learning and Multiregion Feature Fusion. IEEE Trans. Geosci. Remote Sens. 2021, 59, 1553–1564. [Google Scholar] [CrossRef]
  96. Ouyang, L.; Fang, L.; Ji, X. Multigranularity Self-Attention Network for Fine-Grained Ship Detection in Remote Sensing Images. IEEE J. Sel. Topics Appl. Earth Observ. Remote Sens. 2022, 15, 9722–9732. [Google Scholar] [CrossRef]
  97. Ma, J.; Zhou, Z.; Wang, B.; Zong, H.; Wu, F. Ship detection in optical satellite images via directional bounding boxes based on ship center and orientation prediction. Remote Sens. 2019, 11, 2173. [Google Scholar] [CrossRef]
  98. Zhang, D.; Wang, C.; Fu, Q. OFCOS: An Oriented Anchor-Free Detector for Ship Detection in Remote Sensing Images. IEEE Geosci. Remote Sens. Lett. 2023, 20, 6004005. [Google Scholar] [CrossRef]
  99. Su, N.; Huang, Z.; Yan, Y.; Zhao, C.; Zhou, S. Detect Larger at Once: Large-Area Remote-Sensing Image Arbitrary-Oriented Ship Detection. IEEE Geosci. Remote Sens. Lett. 2022, 19, 6505605. [Google Scholar] [CrossRef]
  100. Zhou, K.; Zhang, M.; Zhao, H.; Tang, R.; Lin, S.; Cheng, X.; Wang, H. Arbitrary-Oriented Ellipse Detector for Ship Detection in Remote Sensing Images. IEEE J. Sel. Topics Appl. Earth Observ. Remote Sens. 2023, 16, 7151–7162. [Google Scholar] [CrossRef]
  101. Yang, X.; Yan, J.; Ming, Q.; Wang, W.; Zhang, X.; Tian, Q. Rethinking rotated object detection with gaussian wasserstein distance loss. In Proceedings of the International Conference on Machine Learning, PMLR, Virtual Event, 18–24 July 2021; pp. 11830–11841. [Google Scholar]
  102. Koo, J.; Seo, J.; Jeon, S.; Choe, J.; Jeon, T. RBox-CNN: Rotated bounding box based CNN for ship detection in remote sensing image. In Proceedings of the 26th ACM SIGSPATIAL International Conference on Advances in Geographic Information Systems, Seattle, WA, USA, 6–9 November 2018; pp. 420–423. [Google Scholar]
  103. Chen, J.; Xie, F.; Lu, Y.; Jiang, Z. Finding Arbitrary-Oriented Ships From Remote Sensing Images Using Corner Detection. IEEE Geosci. Remote Sens. Lett. 2020, 17, 1712–1716. [Google Scholar] [CrossRef]
  104. Zhang, F.; Wang, X.; Zhou, S.; Wang, Y.; Hou, Y. Arbitrary-Oriented Ship Detection Through Center-Head Point Extraction. IEEE Trans. Geosci. Remote Sens. 2022, 60, 5612414. [Google Scholar] [CrossRef]
  105. Cui, Z.; Leng, J.; Liu, Y.; Zhang, T.; Quan, P.; Zhao, W. SKNet: Detecting Rotated Ships as Keypoints in Optical Remote Sensing Images. IEEE Trans. Geosci. Remote Sens. 2021, 59, 8826–8840. [Google Scholar] [CrossRef]
  106. Bodla, N.; Singh, B.; Chellappa, R.; Davis, L.S. Soft-NMS–improving object detection with one line of code. In Proceedings of the IEEE International Conference on Computer Vision, Venice, Italy, 22–29 October 2017; pp. 5561–5569. [Google Scholar]
  107. Zhang, Y.; Guo, L.; Wang, Z.; Yu, Y.; Liu, X.; Xu, F. Intelligent ship detection in remote sensing images based on multi-layer convolutional feature fusion. Remote Sens. 2020, 12, 3316. [Google Scholar] [CrossRef]
  108. Dai, J.; Qi, H.; Xiong, Y.; Li, Y.; Zhang, G.; Hu, H.; Wei, Y. Deformable Convolutional Networks. In Proceedings of the 2017 IEEE International Conference on Computer Vision (ICCV), Venice, Italy, 22–29 October 2017; pp. 764–773. [Google Scholar] [CrossRef]
  109. Chai, B.; Nie, X.; Gao, H.; Jia, J.; Qiao, Q. Remote Sensing Images Background Noise Processing Method for Ship Objects in Instance Segmentation. J. Indian Soc. Remote Sens. 2023, 51, 647–659. [Google Scholar] [CrossRef]
  110. Cui, Z.; Sun, H.M.; Yin, R.N.; Jia, R.S. SDA-Net: A detector for small, densely distributed, and arbitrary-directional ships in remote sensing images. Appl. Intell. 2022, 52, 12516–12532. [Google Scholar] [CrossRef]
  111. Guo, B.; Zhang, R.; Guo, H.; Yang, W.; Yu, H.; Zhang, P.; Zou, T. Fine-Grained Ship Detection in High-Resolution Satellite Images With Shape-Aware Feature Learning. IEEE J. Sel. Topics Appl. Earth Observ. Remote Sens. 2023, 16, 1914–1926. [Google Scholar] [CrossRef]
  112. Zhang, J.; Huang, R.; Li, Y.; Pan, B. Oriented ship detection based on intersecting circle and deformable RoI in remote sensing images. Remote Sens. 2022, 14, 4749. [Google Scholar] [CrossRef]
  113. Li, Z.; Wang, Y.; Zhang, Y.; Gao, Y.; Zhao, Z.; Feng, H.; Zhao, T. Context Feature Integration and Balanced Sampling Strategy for Small Weak Object Detection in Remote-Sensing Imagery. IEEE Geosci. Remote Sens. Lett. 2024, 112, 102966. [Google Scholar] [CrossRef]
  114. Zhang, C.; Xiong, B.; Li, X.; Kuang, G. Aspect-Ratio-Guided Detection for Oriented Objects in Remote Sensing Images. IEEE Geosci. Remote Sens. Lett. 2022, 19, 8024805. [Google Scholar] [CrossRef]
  115. Li, Y.; Bian, C.; Chen, H. Dynamic Soft Label Assignment for Arbitrary-Oriented Ship Detection. IEEE J. Sel. Topics Appl. Earth Observ. Remote Sens. 2023, 16, 1160–1170. [Google Scholar] [CrossRef]
  116. Song, Z.; Wang, L.; Zhang, G.; Jia, C.; Bi, J.; Wei, H.; Xia, Y.; Zhang, C.; Zhao, L. Fast Detection of Multi-Direction Remote Sensing Ship Object Based on Scale Space Pyramid. In Proceedings of the 2022 18th International Conference on Mobility, Sensing and Networking (MSN), Guangzhou, China, 4–16 December 2022; pp. 1019–1024. [Google Scholar] [CrossRef]
  117. Liu, M.; Chen, Y.; Ding, D. AureNet: A Real-Time Arbitrary-oriented and Ship-based Object Detection. In Proceedings of the 2023 IEEE 2nd International Conference on Electrical Engineering, Big Data and Algorithms (EEBDA), Changchun, China, 24–26 February 2023; pp. 647–652. [Google Scholar] [CrossRef]
  118. Liu, Z.; Wang, H.; Weng, L.; Yang, Y. Ship Rotated Bounding Box Space for Ship Extraction From High-Resolution Optical Satellite Images With Complex Backgrounds. IEEE Geosci. Remote Sens. Lett. 2016, 13, 1074–1078. [Google Scholar] [CrossRef]
  119. Xia, G.S.; Bai, X.; Ding, J.; Zhu, Z.; Belongie, S.; Luo, J.; Datcu, M.; Pelillo, M.; Zhang, L. DOTA: A Large-Scale Dataset for Object Detection in Aerial Images. In Proceedings of the 2018 IEEE/CVF Conference on Computer Vision and Pattern Recognition, Salt Lake City, UT, USA, 18–23 June 2018; pp. 3974–3983. [Google Scholar] [CrossRef]
  120. Li, K.; Wan, G.; Cheng, G.; Meng, L.; Han, J. Object detection in optical remote sensing images: A survey and a new benchmark. ISPRS J. Photogramm. Remote Sens. 2020, 159, 296–307. [Google Scholar] [CrossRef]
  121. Zhang, Y.; Yuan, Y.; Feng, Y.; Lu, X. Hierarchical and Robust Convolutional Neural Network for Very High-Resolution Remote Sensing Object Detection. IEEE Trans. Geosci. Remote Sens. 2019, 57, 5535–5548. [Google Scholar] [CrossRef]
  122. Zhang, Z.; Zhang, L.; Wang, Y.; Feng, P.; He, R. ShipRSImageNet: A Large-Scale Fine-Grained Dataset for Ship Detection in High-Resolution Optical Remote Sensing Images. IEEE J. Sel. Topics Appl. Earth Observ. Remote Sens. 2021, 14, 8458–8472. [Google Scholar] [CrossRef]
  123. Yu, J.; Jiang, Y.; Wang, Z.; Cao, Z.; Huang, T. Unitbox: An advanced object detection network. In Proceedings of the 24th ACM international conference on Multimedia, Amsterdam, The Netherlands, 15–19 October 2016; pp. 516–520. [Google Scholar]
  124. Rezatofighi, H.; Tsoi, N.; Gwak, J.; Sadeghian, A.; Reid, I.; Savarese, S. Generalized Intersection Over Union: A Metric and a Loss for Bounding Box Regression. In Proceedings of the 2019 IEEE/CVF Conference on Computer Vision and Pattern Recognition (CVPR), Long Beach, CA, USA, 15–20 June 2019; pp. 658–666. [Google Scholar] [CrossRef]
  125. Zheng, Z.; Wang, P.; Liu, W.; Li, J.; Ye, R.; Ren, D. Distance-IoU loss: Faster and better learning for bounding box regression. In Proceedings of the AAAI Conference on Artificial Intelligence, New York, NY, USA, 7–12 February 2020; Volume 34, pp. 12993–13000. [Google Scholar]
  126. Jiang, Y.; Zhu, X.; Wang, X.; Yang, S.; Li, W.; Wang, H.; Fu, P.; Luo, Z. R2CNN: Rotational region CNN for orientation robust scene text detection. arXiv 2017, arXiv:1706.09579. [Google Scholar]
  127. Ma, J.; Shao, W.; Ye, H.; Wang, L.; Wang, H.; Zheng, Y.; Xue, X. Arbitrary-Oriented Scene Text Detection via Rotation Proposals. IEEE Trans. Multimedia 2018, 20, 3111–3122. [Google Scholar] [CrossRef]
  128. Ding, J.; Xue, N.; Long, Y.; Xia, G.S.; Lu, Q. Learning RoI Transformer for Oriented Object Detection in Aerial Images. In Proceedings of the 2019 IEEE/CVF Conference on Computer Vision and Pattern Recognition (CVPR), Long Beach, CA, USA, 15–20 June 2019; pp. 2844–2853. [Google Scholar] [CrossRef]
  129. Xu, Y.; Fu, M.; Wang, Q.; Wang, Y.; Chen, K.; Xia, G.S.; Bai, X. Gliding Vertex on the Horizontal Bounding Box for Multi-Oriented Object Detection. IEEE Trans. Pattern Anal. Mach. Intell. 2021, 43, 1452–1459. [Google Scholar] [CrossRef] [PubMed]
  130. Song, Q.; Yang, F.; Yang, L.; Liu, C.; Hu, M.; Xia, L. Learning Point-Guided Localization for Detection in Remote Sensing Images. IEEE J. Sel. Topics Appl. Earth Observ. Remote Sens. 2021, 14, 1084–1094. [Google Scholar] [CrossRef]
  131. Xie, X.; Cheng, G.; Wang, J.; Yao, X.; Han, J. Oriented R-CNN for Object Detection. In Proceedings of the 2021 IEEE/CVF International Conference on Computer Vision (ICCV), Montreal, QC, Canada, 10–17 October 2021; pp. 3500–3509. [Google Scholar] [CrossRef]
  132. Ming, Q.; Zhou, Z.; Miao, L.; Zhang, H.; Li, L. Dynamic anchor learning for arbitrary-oriented object detection. In Proceedings of the AAAI Conference on Artificial Intelligence, Washington DC, USA, 7–14 February 2021; Volume 35, pp. 2355–2363. [Google Scholar]
  133. Yang, X.; Yan, J.; Feng, Z.; He, T. R3det: Refined single-stage detector with feature refinement for rotating object. In Proceedings of the AAAI conference on artificial intelligence, Washington DC, USA, 7–14 February 2021; Volume 35, pp. 3163–3171. [Google Scholar]
  134. Ming, Q.; Miao, L.; Zhou, Z.; Yang, X.; Dong, Y. Optimization for Arbitrary-Oriented Object Detection via Representation Invariance Loss. IEEE Geosci. Remote Sens. Lett. 2022, 19, 8021505. [Google Scholar] [CrossRef]
  135. Ming, Q.; Miao, L.; Zhou, Z.; Dong, Y. CFC-Net: A Critical Feature Capturing Network for Arbitrary-Oriented Object Detection in Remote-Sensing Images. IEEE Trans. Geosci. Remote Sens. 2022, 60, 5605814. [Google Scholar] [CrossRef]
  136. Han, J.; Ding, J.; Li, J.; Xia, G.S. Align Deep Features for Oriented Object Detection. IEEE Trans. Geosci. Remote Sens. 2022, 60, 5602511. [Google Scholar] [CrossRef]
  137. Pan, C.; Li, R.; Liu, W.; Lu, W.; Niu, C.; Bao, Q. Remote Sensing Image Ship Detection Based on Dynamic Adjusting Labels Strategy. IEEE Trans. Geosci. Remote Sens. 2023, 61, 4702621. [Google Scholar] [CrossRef]
  138. Xiao, Z.; Qian, L.; Shao, W.; Tan, X.; Wang, K. Axis learning for orientated objects detection in aerial images. Remote Sens. 2020, 12, 908. [Google Scholar] [CrossRef]
  139. Feng, P.; Lin, Y.; Guan, J.; He, G.; Shi, H.; Chambers, J. TOSO: Student’s-T Distribution Aided One-Stage Orientation Target Detection in Remote Sensing Images. In Proceedings of the ICASSP 2020—2020 IEEE International Conference on Acoustics, Speech and Signal Processing (ICASSP), Barcelona, Spain, 4–8 May 2020; pp. 4057–4061. [Google Scholar] [CrossRef]
  140. Yi, J.; Wu, P.; Liu, B.; Huang, Q.; Qu, H.; Metaxas, D. Oriented Object Detection in Aerial Images with Box Boundary-Aware Vectors. In Proceedings of the 2021 IEEE Winter Conference on Applications of Computer Vision (WACV), Waikoloa, HI, USA, 3–8 January 2021; pp. 2149–2158. [Google Scholar] [CrossRef]
  141. Deng, G.; Wang, Q.; Jiang, J.; Hong, Q.; Jing, N.; Sheng, W.; Mao, Z. A Low Coupling and Lightweight Algorithm for Ship Detection in Optical Remote Sensing Images. IEEE Geosci. Remote Sens. Lett. 2022, 19, 6513505. [Google Scholar] [CrossRef]
  142. Liang, D.; Geng, Q.; Wei, Z.; Vorontsov, D.A.; Kim, E.L.; Wei, M.; Zhou, H. Anchor Retouching via Model Interaction for Robust Object Detection in Aerial Images. IEEE Trans. Geosci. Remote Sens. 2022, 60, 5619213. [Google Scholar] [CrossRef]
  143. Yang, X.; Yang, J.; Yan, J.; Zhang, Y.; Zhang, T.; Guo, Z.; Sun, X.; Fu, K. SCRDet: Towards More Robust Detection for Small, Cluttered and Rotated Objects. In Proceedings of the 2019 IEEE/CVF International Conference on Computer Vision (ICCV), Seoul, Republic of Korea, 27 October–2 November 2019; pp. 8231–8240. [Google Scholar] [CrossRef]
  144. Han, J.; Ding, J.; Xue, N.; Xia, G.S. ReDet: A Rotation-equivariant Detector for Aerial Object Detection. In Proceedings of the 2021 IEEE/CVF Conference on Computer Vision and Pattern Recognition (CVPR), Nashville, TN, USA, 20–25 June 2021; pp. 2785–2794. [Google Scholar] [CrossRef]
  145. Yang, X.; Yan, J. Arbitrary-oriented object detection with circular smooth label. In Proceedings of the Computer Vision–ECCV 2020: 16th European Conference, Glasgow, UK, 23–28 August 2020; Proceedings, Part VIII 16. Springer: Berlin/Heidelberg, Germany, 2020; pp. 677–694. [Google Scholar]
  146. Yang, X.; Hou, L.; Zhou, Y.; Wang, W.; Yan, J. Dense Label Encoding for Boundary Discontinuity Free Rotation Detection. In Proceedings of the 2021 IEEE/CVF Conference on Computer Vision and Pattern Recognition (CVPR), Nashville, TN, USA, 20–25 June 2021; pp. 15814–15824. [Google Scholar] [CrossRef]
  147. Qian, W.; Yang, X.; Peng, S.; Yan, J.; Guo, Y. Learning modulated loss for rotated object detection. In Proceedings of the AAAI conference on artificial intelligence, Washington DC, USA, 7–14 February 2021; Volume 35, pp. 2458–2466. [Google Scholar]
  148. Li, W.; Chen, Y.; Hu, K.; Zhu, J. Oriented RepPoints for Aerial Object Detection. In Proceedings of the 2022 IEEE/CVF Conference on Computer Vision and Pattern Recognition (CVPR), New Orleans, LA, USA, 18–24 June 2022; pp. 1819–1828. [Google Scholar] [CrossRef]
  149. Wang, J.; Li, F.; Bi, H. Gaussian Focal Loss: Learning Distribution Polarized Angle Prediction for Rotated Object Detection in Aerial Images. IEEE Trans. Geosci. Remote Sens. 2022, 60, 4707013. [Google Scholar] [CrossRef]
  150. Zhang, F.; Wang, X.; Zhou, S.; Wang, Y. DARDet: A Dense Anchor-Free Rotated Object Detector in Aerial Images. IEEE Geosci. Remote Sens. Lett. 2022, 19, 8024305. [Google Scholar] [CrossRef]
  151. Yu, D.; Xu, Q.; Liu, X.; Guo, H.; Lu, J.; Lin, Y.; Lv, L. Dual-Resolution and Deformable Multihead Network for Oriented Object Detection in Remote Sensing Images. IEEE J. Sel. Topics Appl. Earth Observ. Remote Sens. 2023, 16, 930–945. [Google Scholar] [CrossRef]
  152. Hua, Z.; Pan, G.; Gao, K.; Li, H.; Chen, S. AF-OSD: An Anchor-Free Oriented Ship Detector Based on Multi-Scale Dense-Point Rotation Gaussian Heatmap. Remote Sens. 2023, 15, 1120. [Google Scholar] [CrossRef]
  153. He, K.; Zhang, X.; Ren, S.; Sun, J. Deep Residual Learning for Image Recognition. In Proceedings of the 2016 IEEE Conference on Computer Vision and Pattern Recognition (CVPR), Las Vegas, NV, USA, 27–30 June 2016; pp. 770–778. [Google Scholar] [CrossRef]
  154. Xie, S.; Girshick, R.; Dollár, P.; Tu, Z.; He, K. Aggregated Residual Transformations for Deep Neural Networks. In Proceedings of the 2017 IEEE Conference on Computer Vision and Pattern Recognition (CVPR), Honolulu, HI, USA, 21–26 July 2017; pp. 5987–5995. [Google Scholar] [CrossRef]
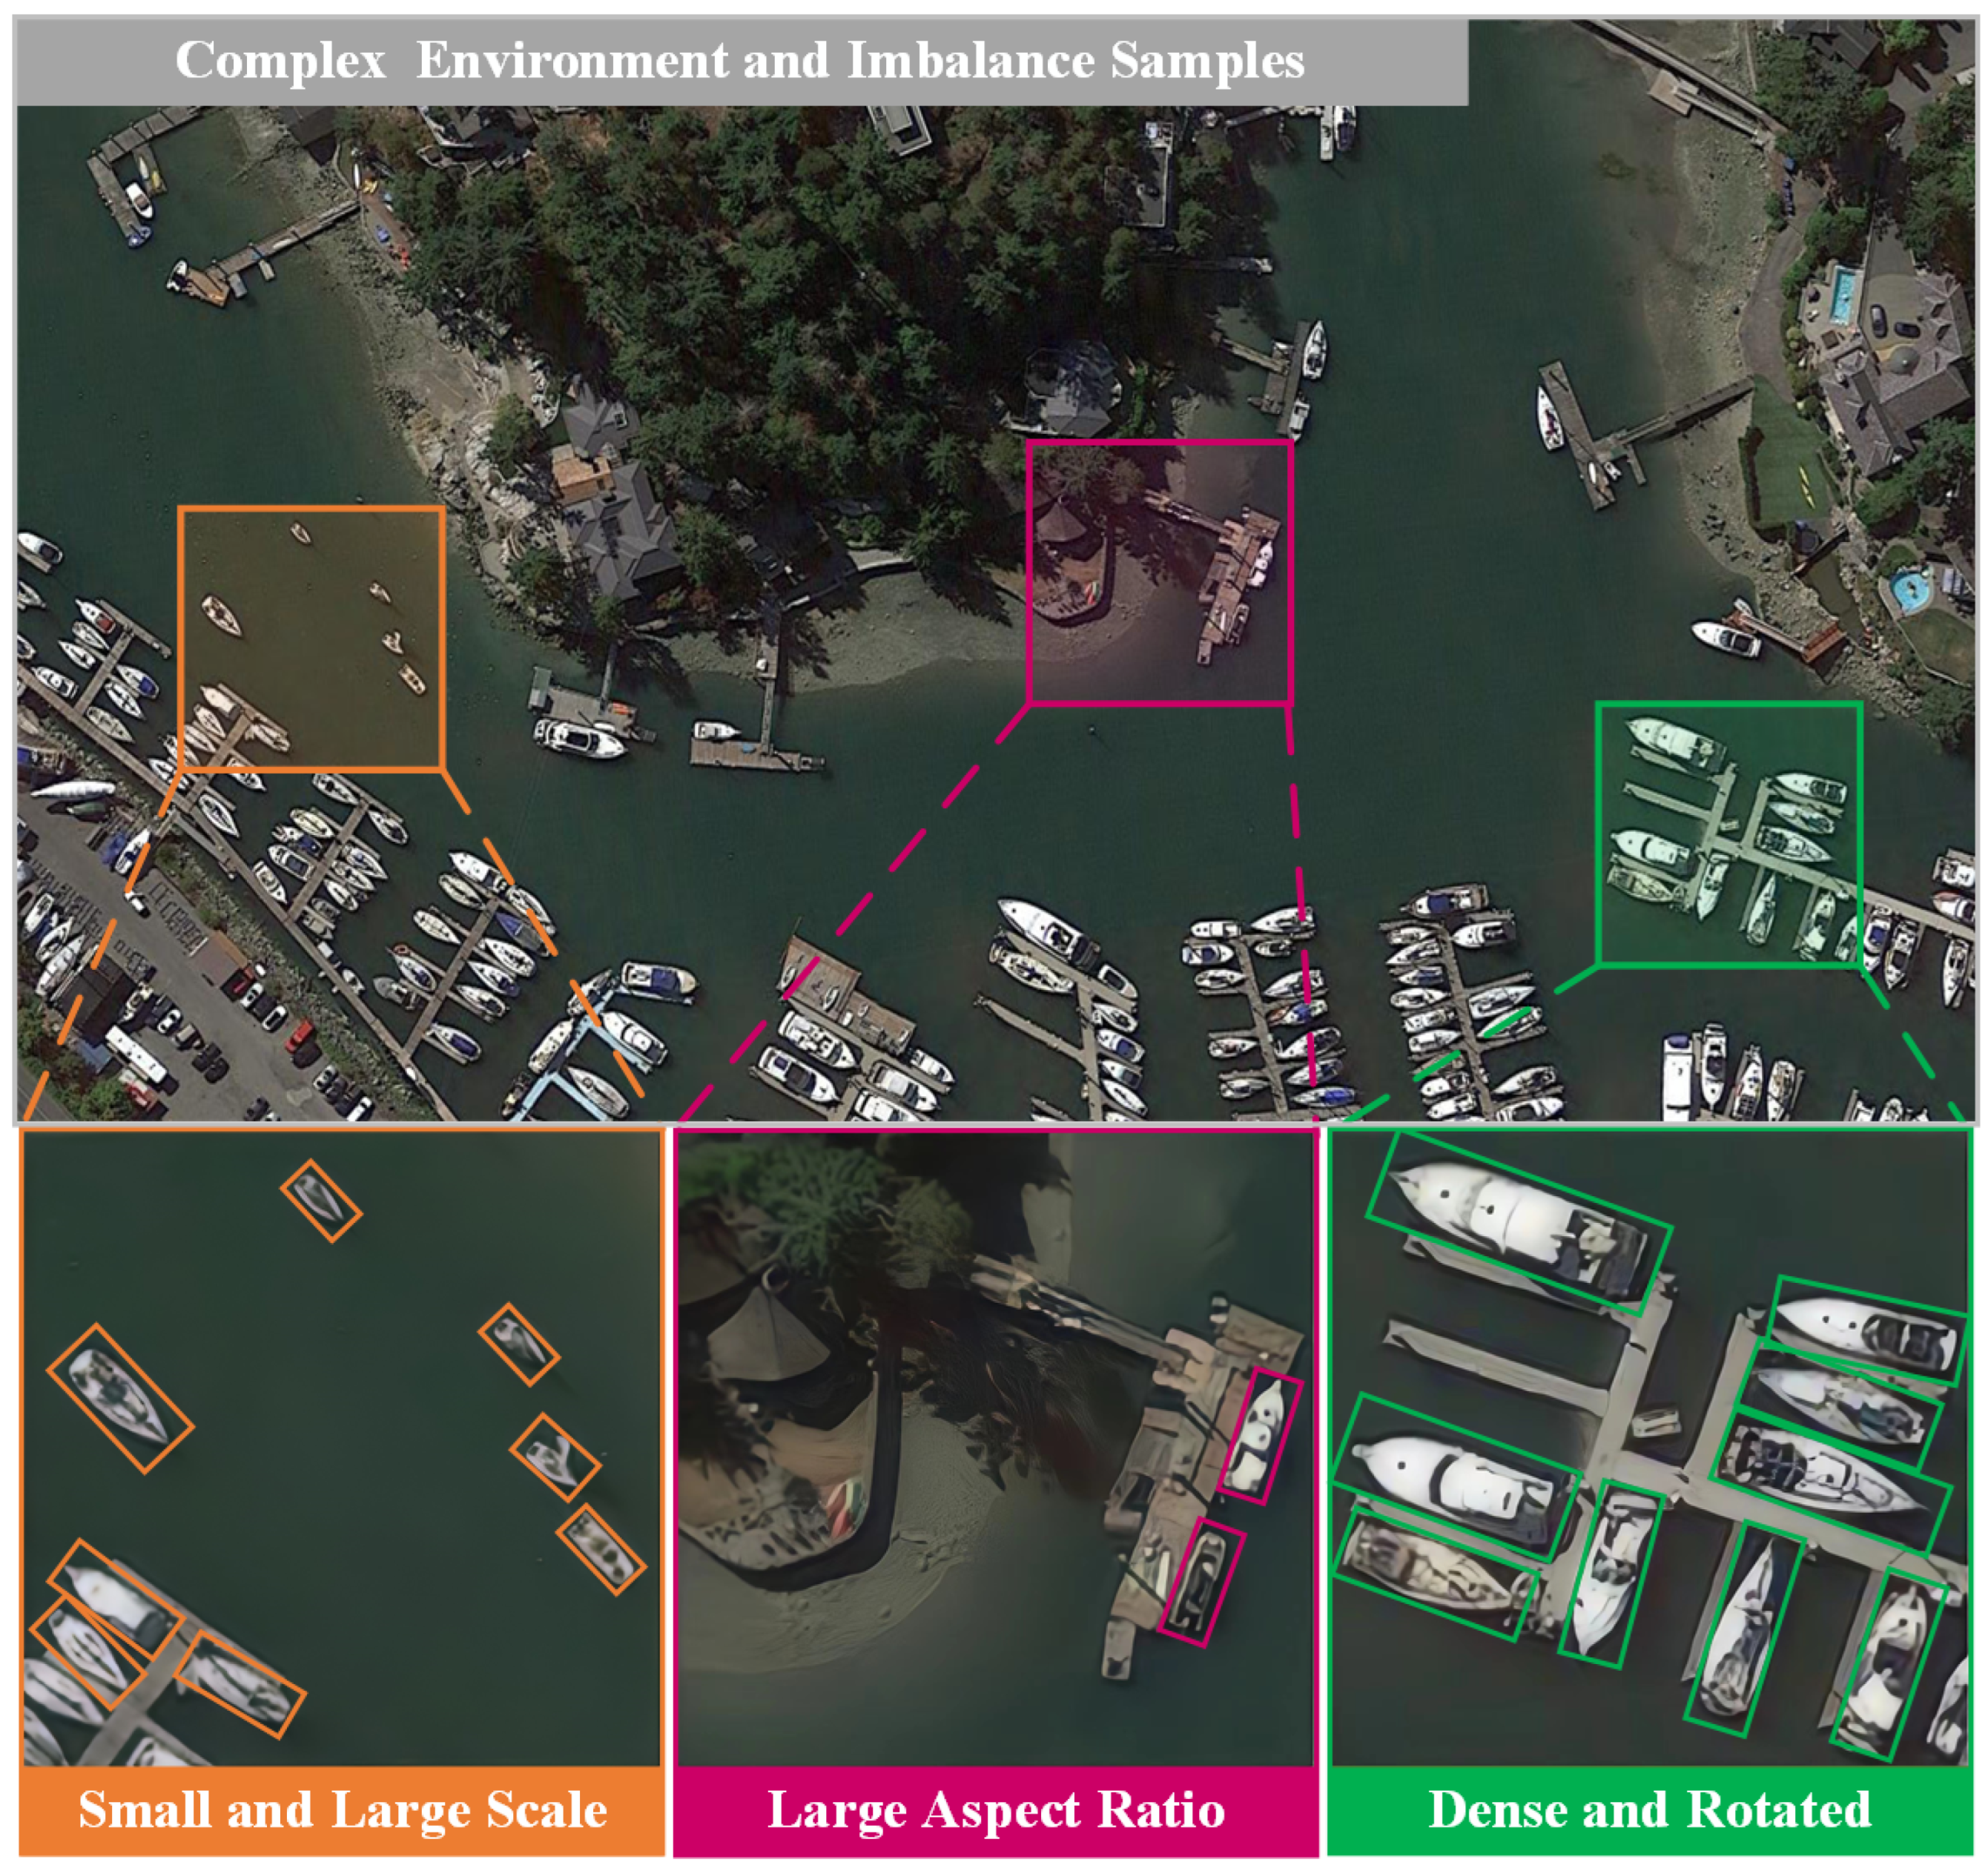
Figure 1. Main challenges in SDORSIs.
Remotesensing 16 01145 g001
Figure 2. The research content of the paper.
Remotesensing 16 01145 g002
Figure 3. The timeline of ship-detection methods.
Remotesensing 16 01145 g003
Figure 4. Schematic diagram of two-stage detector.
Remotesensing 16 01145 g004
Figure 5. Schematic diagram of single-stage detector.
Remotesensing 16 01145 g005
Figure 6. Schematic diagram of anchor-free detector.
Remotesensing 16 01145 g006
Figure 7. Schematic diagram of Transformer. (a) Encoder–decoder structure. (b) Self-attention mechanism.
Remotesensing 16 01145 g007
Figure 8. Challenges and solutions for improvement.
Remotesensing 16 01145 g008
Figure 9. Schematic diagram of attention mechanisms. (a) Spatial attention mechanism. (b) Channel attention mechanism. (c) Convolutional block attention module.
Remotesensing 16 01145 g009
Figure 10. Schematic diagram of saliency constraint, the red square is the saliency constraint.
Remotesensing 16 01145 g010
Figure 11. Schematic diagram of context information mining. (a) Comparison between the ship and its wake. (b) Comparison between standard convolution (kernel size = 3, rate = 1) and dilated convolution (kernel size = 3, rate = 2).
Remotesensing 16 01145 g011
Figure 12. Schematic diagram of FPN.
Remotesensing 16 01145 g012
Figure 13. Schematic diagram of classical representations. (a) Five parameters ( 90 ° cycle). (b) Five parameters ( 180 ° cycle). (c) Eight parameters.
Remotesensing 16 01145 g013
Figure 14. Schematic diagram of the issues of classical representations. The ground truth boxes are shown in red, and the bounding boxes are shown in blue. (a) Five parameters ( 90 ° cycle). (b) Five parameters ( 180 ° cycle). (c) Eight parameters.
Remotesensing 16 01145 g014
Figure 15. Schematic diagram of others. (a) Six parameters represented by (x, y, w, h, O H , O V ). (b) An ellipse method represented by (x, y, | u | , | v | , m, α ). (c) Gaussian distribution, and the confidence is highest in the red area.
Remotesensing 16 01145 g015
Figure 16. Schematic diagram of methods for large aspect ratios, orange indicates sampling points. (a) Comparison between standard convolution and deformable convolution, and the latter is deformable convolution. (b) Comparison between standard sampling and improved sampling, and the latter better matches the shape.
Remotesensing 16 01145 g016
Figure 17. Schematic diagrams of IoU at different angles. The ground truth boxes are shown in red, and the bounding boxes are shown in yellow. (a) The angle difference is 7.5 ° , the IoU is 0.73. (b) The angle difference is 15 ° , the IoU is 0.46. (c) The angle difference is 30 ° , the IoU is 0.27.
Remotesensing 16 01145 g017
Figure 18. Statistical chart of specific ship information. (a) Box diagram of ship pixel distribution. (b) Bar chart of instance numbers.
Remotesensing 16 01145 g018
Figure 19. The performance for different backbones. (a) Line chart of performance for RetinaNet. (b) Line chart of performance for RoI_Trans.
Remotesensing 16 01145 g019
Figure 20. Feature heatmaps of each backbone for RetinaNet. (a) Inputs. (b) Shallow feature heatmaps. (c) Intermediate feature heatmaps. (d) Deep feature heatmaps. (e) Predicted boxes and confidence scores.
Remotesensing 16 01145 g020
Figure 21. Feature heatmaps of each backbone for RoI_Trans. (a) Inputs. (b) Shallow feature heatmaps. (c) Intermediate feature heatmaps. (d) Deep feature heatmaps. (e) Predicted boxes and confidence scores.
Remotesensing 16 01145 g021
Table 1. Methods of ship detection and main advantages and disadvantages.
MethodsAdvantagesDisadvantagesReferences
Traditional
Methods
Template
Matching
It is simple to operate.It requires a lot of prior knowledge and is sensitive to the environment.[8,9,10]
Visual
Saliency
It calculates the contrast between a certain region and its surrounding areas to extract regions.It has higher requirements for image quality.[11,12,13,14]
Classification
Learning
It establishes the relationship between ship features and ship categories.The manually designed features only utilize the low-level visual information and cannot express the complex semantic information.[17,18]
CNN-based
Methods
Two-stage
Detector
It divides the ship detection into two stages and has high accuracy and robustness.Detection efficiency of two-stage detector may be lower than single-stage detector.[25,26,27,28,29,30,31,32]
Single-stage
Detector
It is suitable for the applications that require high real-time accuracy and high efficiency.Detection accuracy of single-stage detector may be lower than two-stage detector.[36,37,38,39,40,41,42,43]
Anchor-free
Detector
It uses keypoints instead of anchor boxes to detect ships which improves the generalization of the model.It exhibits poor performance for ships with ambiguous keypoints.[47,48,49]
Transformer
Methods
Detector
Backbone
It can explore long-range dependencies in targets, and effectively capture global features.The high data requirements make it challenging to achieve satisfactory results on small datasets.[54,55,56,57,58]
Table 2. Methods and main advantages and disadvantages of complex marine environments.
MethodsAdvantagesDisadvantagesReferences
Image
Preprocessing
Exclude
Background
It filters out untargeted images in advance.Introducing convolutional layers requires additional training for the network.[59]
Dehazing
Algorithm
It improves the quality of the image by eliminating the impact of clouds and fog.Excessive dehazing may result in information loss. Simple algorithms are not suitable for complex scenes.[60,61,62,63]
Attention
Mechanism
Channel
Attention
Mechanism
It adjusts channel weights dynamically to focus on ships.It has limitations in extracting global information.[64,65,66,67]
Spatial Attention
Mechanism
It highlights important information in the image to focus on ships.It may excessively focus on local structures, leading to a decreased ability to generalize.[66,67]
Convolutional
Attention
Module
It adjusts convolutional kernel weights dynamically at different positions to focus on ships.Introducing additional computation.[68,69]
Saliency
Constraint
Saliency
Constraint
It uses the concept of multi-task learning and pixel-level supervision to focus on ships.It has a high requirement for the resolution of the images. The weight needs to be adjusted manually.[70,71]
Table 3. Methods and main advantages and disadvantages of insufficient discriminative feature.
MethodsAdvantagesDisadvantagesReferences
Context
Information
Mining
Ship WakeThe wake is closely related to the ship and can provide additional discriminative information.Excessive context information may compromise detection performance.[72,73,74,75,76]
Dilated
Convolution
It enhances the receptive field without introducing additional parameters while maintaining resolution.There are gaps in the dilated convolution kernel, which leads to information discontinuity.[77,78,79]
Feature
Fusion
Feature
Fusion
Integrating information from feature maps with different resolutions can extract rich semantic information and localization information to enhance information interaction capabilities.Improper fusion methods may result in loss or confusion of information.[80,81,82,83,84,85]
Table 4. Methods and main advantages and disadvantages of large scale variation.
MethodsAdvantagesDisadvantagesReferences
Multi-Scale
Information
FPN and
Improvements
It enables the model to handle ships of different scales through the pyramid structure and the feature fusion is used to enhance the information interaction ability to improve the detection accuracy.By introducing the pyramid structure, it increases the computational complexity and training time.[33,50,70,86,87,88,89,90,91,92,93,94]
Table 5. Methods and main advantages and disadvantages of dense distribution and rotated ships.
MethodsAdvantagesDisadvantagesReferences
OBB
Representation
Five
Parameters
It is represented by (x, y, w, h, θ ) and more accurately represents the position and orientation information of ships.At the angle boundary, angle change leads to a sharp increase in loss.[95,96,97]
Eight
Parameters
It is represented by ( x 1 , y 1 , x 2 , y 2 , x 3 , y 3 , x 4 , y 4 ) and does not use angles to represent direction.It produces loss discontinuity and a large number of parameters.[98]
OthersIt can alleviate the problem of loss discontinuity.Some methods increase the computational complexity and the training time.[93,99,100,101]
OBB
Regression
Anchor-BasedIt utilizes predefined anchor boxes for the OBB’s more accurate regression.The performance is greatly influenced by hyperparameters, which are related to sizes and aspect ratios of predefined anchor boxes.[64,96,102]
Anchor-FreeIt is not constrained by sizes and aspect ratios of anchor boxes, reducing hyperparameters.Due to the absence of prior information provided by anchor boxes, the results are sometimes lower than anchor-based methods.[93,103,104,105]
NMSSoft-NMSIt alleviates the problem of missed dense ships by weighting overlapping bounding boxes.It is not combined with rotated feature of the ship.[35,106,107]
Soft-Rotate
-NMS
It combines rotated features with Soft-NMS, making it more suitable for ship detection.The IoU threshold has a significant impact on NMS.[105]
Table 6. Methods and main advantages and disadvantages of large aspect ratio of ships.
MethodsAdvantagesDisadvantagesReferences
DCNDCNIt can adaptively extract feature information for irregularly shaped ships by randomly sampling.The offset of sampling points entirely relies on the prediction of network and DCN consumes more memory compared to the standard convolution.[52,94,99,109,110]
Feature
Sampling
ROI Pooling
ROI Align
It adapts to the ship geometry of the large aspect ratio, and extracts features uniformly in different directions.It maps multiple feature points to one feature point, which may cause some degree of information loss and computational error.[81,111,112]
Table 7. Methods and main advantages and disadvantages of imbalance between positive and negative samples.
MethodsAdvantagesDisadvantagesReferences
IoUImproved IoU
Calculation
It can obtain more positive samples to participate in training by improving the calculation method of IoU.It introduces additional computation and increases the complexity of the network.[81,97,116]
Dynamical IoU
Threshold
It dynamically adjusts the threshold based on the shape of the ship to obtain more positive samples.It requires designing a suitable threshold mapping function and constraining the range of threshold. Inappropriate mapping ranges may introduce interfering samples.[114,115]
Loss FunctionImproved Loss
Function
It assigns more weight to positive samples during loss calculation, and improves their contribution in training.It relies on hyperparameters tuning, and requires constant manual search for the optimal value.[43,103,117]
Table 8. Summary of public optical remote sensing image ship datasets.
DatasetYearImageCategoryInstanceResolutionImage SizeLabel
HRSC2016 [118]20161070429760.4–2 m300 × 300–1500 × 900HBB, OBB
DOTA-ship [119]2017434137,0280.5 m800 × 800–4000 × 4000HBB, OBB
DIOR-ship [120]20182702162,4000.5–30 m800 × 800HBB
HRRSD-ship [121]20192165138860.5–1.2m270 × 370–4000 × 5500HBB
FGSD2021 [104]20216362052741 m1202 × 1205OBB
ShipRSImageNet [122]202134355017,5730.12–6 m930 × 930HBB, OBB
LEVIR-ship [71]202138961311916m512 × 512HBB
Table 9. The performance of each algorithm on HRSC2016 datasets. mAP refers to the mAP computed on the PASCAL VOC2007. The optimal results are shown in bold, and sub-optimal results are shown in underline.
MethodYearPublicationBackboneInput_SizemAP
Anchor-based (Two-stage)
R 2 CNN [126]2017ICPRResNet-101800 × 80073.07
RRPN [127]2018TMMResNet-101800 × 80079.08
RoI_Trans [128]2019CVPRResNet-101512 × 80086.20
Gliding Vertex [129]2021TPAMIResNet-101512 × 80088.20
OPLD [130]2021JSTARResNet-501024 × 133388.44
Oriented R-CNN [131]2021ICCVResNet-1011333 × 80090.50
Anchor-based (One-stage)
DAL [132]2021AAAIResNet-101416 × 41688.95
R 3 Det [133]2021AAAIResNet-101800 × 80089.26
DLAO [99]2022GRSLDCNDarknet25800 × 80088.28
RIDet-Q [134]2022GRSLResNet-101800 × 80089.10
CFC-Net [135]2022TGRSResNet-101800 × 80089.70
S 2 A-Net [136]2022TGRSResNet-101512 × 80090.17
DSA-Net [67]2022GRSLCSPDarknet-53608 × 60890.41
DAL-BCL [137]2023TGRSCSPDarknet-53800 × 80089.70
3WM-AugNet [63]2023TGRSResNet-101512 × 51290.69
Anchor-free
Axis Learning [138]2020RSResNet-101800 × 80078.15
TOSO [139]2020ICASSPResNet-101800 × 80079.29
SKNet [105]2021TGRSHourglass-104511 × 51188.30
BBAVectors [140]2021WACVResNet-101608 × 60888.60
CHPDet [104]2022TGRSDLA-34512 × 51288.81
LCNet [141]2022GRSLRepVGG-A1416 × 41689.50
CMDet [51]2023GRSLResNet-50640 × 64090.20
AEDet [100]2023JSTARCSPDarknet-53800 × 80090.45
Table 10. The performance of each algorithm on FGSD2021 datasets. The short name of the class is defined as (abbreviation-full name): AIR-AIRCRAFT CARRIERS, WAS-WASP CLASS, TAR-TARAWA CLASS, AUS-AUSTIN CLASS, WHI-WHIDBEY ISLAND CLASS, SAN-SAN ANTONIO CLASS, NEW-NEWPORT CLASS, TIC-TICONDEROGA CLASS, BUR-ARLEIGH BURKE CLASS, PER-PERRY CLASS, LEW-LEWIS CLARK CLASS, SUP-SUPPLY CLASS, KAI-HENRY J. KAISER CLASS, HOP-BOB HOPE CLASS, MER-MERCY CLASS, FRE-FREEDOM CLASS, IND-INDEPENDENCE CLASS, AVE-AVENGER CLASS, SUB-SUBMARINE, and OTH-OTHER. mAP refers to the mAP computed on the PASCAL VOC2007. The optimal results are shown in bold, and sub-optimal results are shown in underline.
MethodBackboneAirWasTarAusWhiSanNewTicBurPerLewSupKaiHopMerFreIndAveSubOthmAPFPS
Anchor-based (Two-stage)
R 2 CNN [126]Resnet5089.980.980.579.487.087.844.289.089.679.580.447.781.587.410082.410066.450.957.278.110.3
RoI_Trans [128]Resnet5090.988.687.289.578.588.881.889.689.890.471.774.773.781.678.610075.678.468.066.983.519.2
Oriented R-CNN [131]Resnet5090.989.781.581.179.688.298.989.890.687.860.473.981.886.710060.010079.466.963.782.527.4
DEA-Net [142]Resnet5090.491.484.693.588.794.592.190.792.488.960.681.685.490.399.783.198.576.668.569.286.012.1
SCRDet [143]Resnet5077.390.487.489.878.890.954.588.389.674.968.459.290.477.281.873.910043.943.857.175.99.2
ReDet [144]ReResnet5090.990.680.381.589.388.481.888.890.390.578.176.090.787.098.284.490.974.685.371.285.413.8
Anchor-based (One-stage)
Retinanet [43]Resnet5089.789.278.287.377.086.962.781.583.370.646.869.980.283.110080.689.761.542.59.173.535.6
CSL [145]Resnet5089.781.377.280.271.477.252.787.787.774.257.197.277.680.510072.710032.637.040.773.710.4
R 3 Det [133]Resnet5090.980.981.590.179.387.529.577.489.469.759.967.380.776.872.783.390.938.423.140.070.514.0
DCL [146]Resnet5089.981.478.680.778.087.949.878.787.276.160.676.990.480.078.877.910037.131.245.673.310.0
RSDet [147]Resnet5089.880.475.877.378.688.826.184.787.675.255.174.489.789.310086.410027.637.650.673.715.4
S 2 A-Net [136]Resnet5090.981.473.389.180.989.981.289.290.788.960.575.981.689.210068.690.961.355.764.780.233.1
Anchor-free
BBAVectors [140]Resnet5099.590.975.994.390.952.988.590.080.472.276.988.299.610094.010074.558.963.181.183.618.5
CHPDet [104]DLA3490.990.489.689.389.699.199.490.290.290.370.787.989.296.510085.110084.468.556.987.941.7
CenterNet [48]DLA3467.277.979.275.566.879.876.883.189.077.754.572.677.410010060.874.846.544.16.870.548.5
RepPoint [148]Resnet5091.289.285.689.387.693.194.291.588.783.371.481.189.491.595.682.610086.664.757.585.736.7
GF-CSL [149]Resnet5092.690.386.690.588.295.397.989.891.286.969.785.692.792.599.785.198.686.779.470.488.540.3
DARDet [150]Resnet5090.989.269.789.688.081.490.389.590.579.762.587.990.289.210068.981.866.344.356.280.331.9
DDMNet [151]DDRNet3998.289.892.597.191.694.990.990.090.579.080.291.790.093.610093.210074.848.769.487.343.8
Table 11. The performance of optimization strategies on HRSC2016 datasets. The improve values are shown in bold.
ChallengesStrategiesMethodsYearmAP
Complex environmentAttention MechanismAM [45]202182.67 (+1.81)
CDA [64]202187.20 (+0.70)
CLM [67]202286.18 (+1.13)
GCM [67]202287.75 (+2.70)
DFAM [84]202278.65 (+3.70)
Image PreprocessingDe_haze [61]202395.27 (+1.59)
Saliency ConstraintSPB * [70]202286.51 (+0.99)
Large Aspect RatioFeature SamplingAP [81]202189.20 (+0.80)
OP [105]202188.30 (+1.80)
DCNDCN [99]202286.42 (+8.46)
DRoI [67]202289.21 (+0.61)
Dense and Rotated shipOBB RepresentationGaussian-Mask [93]202188.38 (+0.87)
Six Parameters [99]202288.28 (+3.55)
ICR-Head [67]202289.17 (+0.57)
MDP-RGH [152]202389.69 (+4.75)
DAL [137]202389.70 (+0.20)
OBB RegressionEL [50]202187.70 (+1.92)
BR [64]202187.40 (+2.00)
OAC [98]202391.07 (+6.89)
KLD [68]202389.87 (+3.94)
Large Scale VariationMulti-scale InformationSCM [93]202188.43 (+0.92)
FFM [45]202183.34 (+2.48)
NASFCOS-FPN [50]202188.20 (+2.42)
FES * [70]202287.01 (+1.49)
DFF [84]202274.95 (+2.63)
FE-FPN [98]202384.11 (+6.05)
AF-OSD [152]202389.69 (+1.80)
RFF-Net [68]202383.91 (+3.96)
* means that the model used only partial data.
Table 12. The performance of different backbones for RetinaNet on HRSC2016 datasets. The optimal results are shown in bold, and sub-optimal results are shown in underline.
BackbonesParams(M)GFLOPs(G)mAP
ResNet-18 [153]11.0238.0773.55
ResNet-50 [153]23.2886.1081.07
ResNet-101 [153]42.28163.9982.57
ResNext-50-32 × 4d [154]22.7789.2582.93
ResNext-101-32 × 4d [154]41.91167.8383.73
ResNext-101-64 × 4d [154]81.00324.9984.45
Swin-tiny [56]27.5095.3684.32
Swin-small [56]48.79188.1085.22
Swin-base [56]86.68334.1685.70
PVT-tiny [57]9.2432.4085.15
PVT-small [57]17.6563.5185.62
PVT-Medium [57]41.07108.9685.93
Table 13. The performance of different backbones for RoI_Trans on HRSC2016 datasets. The optimal results are shown in bold, and sub-optimal results are shown in underline.
BackbonesParams(M)GFLOPs(G)mAP
ResNet-18 [153]11.0238.0772.35
ResNet-50 [153]23.2886.1087.24
ResNet-101 [153]42.28163.9988.62
ResNext-50-32 × 4d [154]22.7789.2588.26
ResNext-101-32 × 4d [154]41.91167.8389.61
ResNext-101-64 × 4d [154]81.00324.9989.40
Swin-tiny [56]27.5095.3690.23
Swin-small [56]48.79188.1090.41
Swin-base [56]86.68334.1690.49
PVT-tiny [57]9.2432.4089.69
PVT-small [57]17.6563.5190.04
PVT-Medium [57]41.07108.9690.23
Disclaimer/Publisher’s Note: The statements, opinions and data contained in all publications are solely those of the individual author(s) and contributor(s) and not of MDPI and/or the editor(s). MDPI and/or the editor(s) disclaim responsibility for any injury to people or property resulting from any ideas, methods, instructions or products referred to in the content.