Article

Scattering-Point-Guided Oriented RepPoints for Ship Detection

1
Key Laboratory of Technology in Geo-Spatial Information Processing and Application System, Chinese Academy of Sciences, Beijing 100190, China
2
Aerospace Information Research Institute, Chinese Academy of Sciences, Beijing 100094, China
3
School of Electronic, Electrical and Communication Engineering, University of Chinese Academy of Sciences, Beijing 100049, China
4
School of Software Engineering, Xi’an Jiaotong University, Xi’an 710049, China
*
Author to whom correspondence should be addressed.
Remote Sens. 2024, 16(6), 933; https://doi.org/10.3390/rs16060933
Submission received: 29 January 2024 / Revised: 28 February 2024 / Accepted: 4 March 2024 / Published: 7 March 2024
(This article belongs to the Special Issue Remote Sensing of Target Object Detection and Identification II)

Abstract

:
Ship detection finds extensive applications in fisheries management, maritime rescue, and surveillance. However, detecting nearshore targets in SAR images is challenging due to land scattering interference and non-axisymmetric ship shapes. Existing SAR ship detection models struggle to adapt to oriented ship detection in complex nearshore environments. To address this, we propose an oriented-reppoints target detection scheme guided by scattering points in SAR images. Our method deeply integrates SAR image target scattering characteristics and designs an adaptive sample selection scheme guided by target scattering points. This incorporates scattering position features into the sample quality measurement scheme, providing the network with a higher-quality set of proposed reppoints. We also introduce a novel supervised guidance paradigm that uses target scattering points to guide the initialization of reppoints, mitigating the influence of land scattering interference on the initial reppoints quality. This achieves adaptive feature learning, enhancing the quality of the initial reppoints set and the performance of object detection. Our method has been extensively tested on the SSDD and HRSID datasets, where we achieved mAP scores of 89.8% and 80.8%, respectively. These scores represent significant improvements over the baseline methods, demonstrating the effectiveness and robustness of our approach. Additionally, our method exhibits strong anti-interference capabilities in nearshore detection and has achieved state-of-the-art performance.

1. Introduction

Currently, radar application scenarios are continuously expanding, with various radar systems emerging and advancing rapidly [1]. Synthetic aperture radar (SAR) functions as an active microwave imaging system, impervious to natural conditions such as illumination, clouds, and weather. Consequently, it boasts the capability for all-weather, day-and-night observation of the Earth’s surface, establishing itself as a primary tool for current maritime applications [2]. Ship detection, a main direction in the maritime domain [3], holds a critical role in monitoring maritime transportation, managing ports, and overseeing maritime zones [4]. In recent years, more and more SAR satellites have been successfully launched [5,6,7], with continuous advancements in collaborative observation techniques [8]. The improvement of data quality [9], the further diversity of imaging scenarios, and the continuous establishment and upgrading of SAR datasets [10,11] have greatly promoted the development of intelligent technology for the interpretation of SAR images [12].
Among traditional algorithms, CFAR [13] stands out as one of the most widely used detection methods, relying on manually crafted features. This method entails modeling cluttered backgrounds by setting the background threshold to a predetermined level, thus identifying abnormal pixel points that deviate from the background distribution. Various CFAR-based detection algorithms have emerged by employing different background-modeling models [14,15,16,17]. However, it is still susceptible to interference from complex environments, and its nearshore environment detection performance is low.
Due to advancements in deep learning algorithms, numerous CNN-based object detection techniques tailored to natural scenes have been applied in SAR target detection [18]. These algorithms leverage the robust feature extraction and representation capabilities inherent in CNNs [19], exhibiting superior performance in detection when compared to traditional methods such as CFAR [20]. However, a significant limitation arises from the fact that most of these detection networks are designed based on horizontal bounding boxes, commonly used in natural scenes. Traditional horizontal bounding boxes exhibit overlap in nearshore ship detection, introducing interference from land areas beyond the target region and hindering the extraction of detailed target features. Consequently, this challenge limits the network’s ability to effectively capture a target’s fine-grained structural texture features [21]. In contrast, oriented bounding boxes avoid these issues.
In reference to the previously mentioned concern, numerous algorithms centered around oriented object detection have been introduced. These algorithms are predominantly categorized into two main types: two-stage algorithms employing anchor boxes and single-stage algorithms without anchor boxes.
The first type of anchor box detection algorithm based on the rotated box (RBOX) often oversamples anchor boxes with a specified aspect ratio and generates a large number of anchor boxes. On the one hand, it greatly increases the number of parameters and the computational complexity. On the other hand, the anchor frame with artificially fixed proportions is difficult to adapt to multi-scale and multi-directional ship targets. At the same time, when distinguishing between positive and negative samples through intersection over union (IoU), it will further aggravate the problem of the imbalance between positive and negative samples and the insufficiency of positive samples. Accordingly, the recall rate of the model will be reduced, and problems such as category skew and network degradation will occur, which make it difficult to achieve the network’s generalization ability. The second type of detection algorithm improves the representation of bounding boxes by implementing a combined strategy of initializing anchor points and fine-tuning anchor points. The model scale and computational complexity are reduced. However, due to the lack of a target position prior, there is a lack of effective guidance when performing feature learning and initializing anchor points, and strong land scattering points in complex nearshore environments further interfere with the generation of initialized anchor points, resulting in lower learning sample quality and poor network detection performance.
In response to the aforementioned challenges, we propose a directional anchor-free detection network guided by significant scattering features in SAR images. Firstly, we adopt a lightweight single-stage reppoints detection architecture, which generates target boxes through reppoints and exhibits stronger adaptability and higher detection granularity for nearshore directional targets. Secondly, by comprehensively considering the imaging mechanism of SAR and the physical characteristics of strong scatterers such as ships, we integrate SAR image scattering properties for the first time. We extract strong scattering points from SAR images and design an adaptive sample selection scheme guided by these scattering points to select high-quality samples for network training. Additionally, we design a supervision guidance mechanism that utilizes target scattering points to guide the initialization of reppoints, thus achieving adaptive feature learning. The main contributions of our work can be summarized as follows:
1.
A reppoints-based object detection network deeply fused with SAR scattering characteristics is proposed, which leverages the profound integration of SAR image scattering properties to guide the network for high-quality learning, enabling fine-grained nearshore detection.
2.
To address the issue of low sample quality, this study introduces an innovative adaptive sample selection scheme known as SPG-ASS (Scattering-Point-Guided Adaptive Sample Selection). The method integrates the positional features of strong scattering points on ships to enhance the overall quality of samples. By extracting scattering points and clustering their positions into the optimal number of clusters, the method measures the similarity between the scattering point clusters and the set of sample points using the cosine similarity metric to achieve the best match. This, in turn, determines the quality score of the sample points. Finally, the adaptive selection of high-quality samples is achieved using the TOP K algorithm. This method further improves the quality of reppoints.
3.
To reduce land scattering interference and further improve the quality of initialized reppoints, a novel reppoints supervision guidance paradigm is proposed. This paradigm aligns target scattering points with initialized reppoints at the point level by employing an intermediary framework. Using the KLD (Kullback–Leibler Divergence) loss, it integrates the structural and positional attributes of scattering point clusters into the supervised learning process of initialized reppoints. During the training phase, this paradigm effectively guides the reppoints to extract the semantic features of key regions in targets.

2. Related Works

2.1. Deep Learning-Based Object Detection

Object detection, as one of the fundamental visual tasks in deep learning, has seen the emergence of numerous algorithms with the advancements in deep learning. These algorithms can mainly be categorized into two classes: two-stage methods using anchor boxes and single-stage detectors without anchor boxes.
Two-stage methods using anchor boxes: Candidate regions are generated in the first stage, followed by the mapping of these regions to a fixed size in the second stage for classification and bounding box regression. For instance, R-CNN [22] utilizes selective search algorithms to produce candidate regions and then employs convolutional operations to obtain bounding boxes and their respective classes. SPP-Net [23] addresses the drawbacks of repeated convolutions and fixed output sizes. Fast R-CNN [24], building upon the aforementioned methods, utilizes ROI (Region of Interest) pooling to extract target features, sharing the tasks of bounding box regression and classification, thereby achieving end-to-end training. Faster R-CNN [25] replaces the selective search algorithm with an RPN (Region Proposal Network) to generate candidate boxes, significantly reducing algorithmic complexity. FPN [26] introduces a pyramid structure to leverage information from various scales, considerably enhancing the performance of object detection tasks.
Single-stage detectors without anchor boxes: These detectors do not rely on complex anchor box designs and accomplish object detection in a single stage. For example, YOLO-V1 [27] divides the image into a grid and predicts bounding boxes and confidence for all objects within each grid cell in one go. SSD [28] efficiently detects objects of various scales and aspect ratios by introducing multi-scale feature extraction and the Default Boxes mechanism. RetinaNet [29] addresses the issue of imbalanced positive and negative samples through the design of focal loss. CenterNet [30] models objects as the center points of bounding boxes, where the detector finds the center point through keypoint estimation and regresses other attributes of the target. Reppoints [31], considering the limited granularity in existing feature learning, utilizes a set of representative points to adaptively learn key semantic positions in the image, thereby achieving classification and regression.

2.2. Oriented Object Detection

Traditional horizontal bounding boxes often lack the capability to capture target orientation information and are prone to background interference, especially in intricate environments. Consequently, oriented object detection has emerged as a pivotal research area. For instance, ROI Transformer [32] employs spatial transformations of Regions of Interest, learning transformation parameters supervised by annotated directional bounding boxes. Oriented-RCNN [33] adjusts the regression parameters of the Region Proposal Network (RPN) to six, directly generating oriented proposals for corresponding targets. Utilizing KLD [34] to construct the Gaussian representation of oriented bounding boxes, it redesigns rotation regression losses, dynamically adjusting parameter gradients for object alignment. G-Rep [35] devises a unified Gaussian representation to construct Gaussian distributions for both OBBs and PointSets, accompanied by a Gaussian regression loss to further enhance object detection performance. Oriented Reppoints [36] utilizes an adaptive point learning methodology to capture the geometric information of arbitrary orientation instances and formulate schemes for adaptive point quality assessment and sample allocation.
Various oriented bounding box (OBB) detection algorithms have found applications in SAR ship detection. For instance, Zhang et al. [37] proposed a Rotated Region Proposal Network to generate multi-directional proposals with ship azimuth information, thereby enhancing the performance of multi-angle target detection. Yang et al. [38] introduced R-RetinaNet, which utilizes scale calibration methods to contrast scale distributions. They leveraged a task-level Feature Pyramid Network to fuse features, alleviating conflicts between different targets. Additionally, an adaptive IOU threshold training method was introduced to address imbalance issues. Yue et al. [39] proposed a method for detecting oriented ships in synthetic aperture radar (SAR) images, which improved the accuracy of detecting small oriented ships by fusing high-resolution feature maps and dynamically mining rotated positive samples (DRPSM). Sun et al. [40] proposed the SPAN, which integrates scattering characteristics for ship detection and classification. This addresses the weak detection performance caused by the lack of SAR features in conventional detectors. Zhang et al. [2] proposed an object detection network based on scatter-point-guided region proposal, combining SAR image scattering characteristics to guide an RPN in generating crucial proposals. They incorporated supervised contrastive learning to mitigate category differences, thereby enhancing the target detection performance.

2.3. Sample Assignment for Object Detection

Sample allocation plays a crucial role in the performance of object detection. Various sample allocation methods have been proposed, such as Faster R-CNN [25], SSD [28], and RetinaNet [29], which employ IOU for positive sample selection, relying on manually designed thresholds. ATSS dynamically adjusts thresholds based on the statistical features of sample groups. OTA [41] extends the consideration to ambiguous sample allocation (one-to-many) by transforming sample allocation into a dynamic programming problem. Furthermore, PAA [42] adapts sample allocation in a probabilistic manner. APAA [36] addresses the limitations of IOU in directional scenes by proposing an adaptive sample point set allocation scheme based on a comprehensive evaluation of orientation, classification, localization, and pixel-wise correlation. Although the above algorithms have proven their effectiveness in the field of optical images, in the field of SAR, we still need to further explore methods tailored to the characteristics of SAR images.

3. Materials and Methods

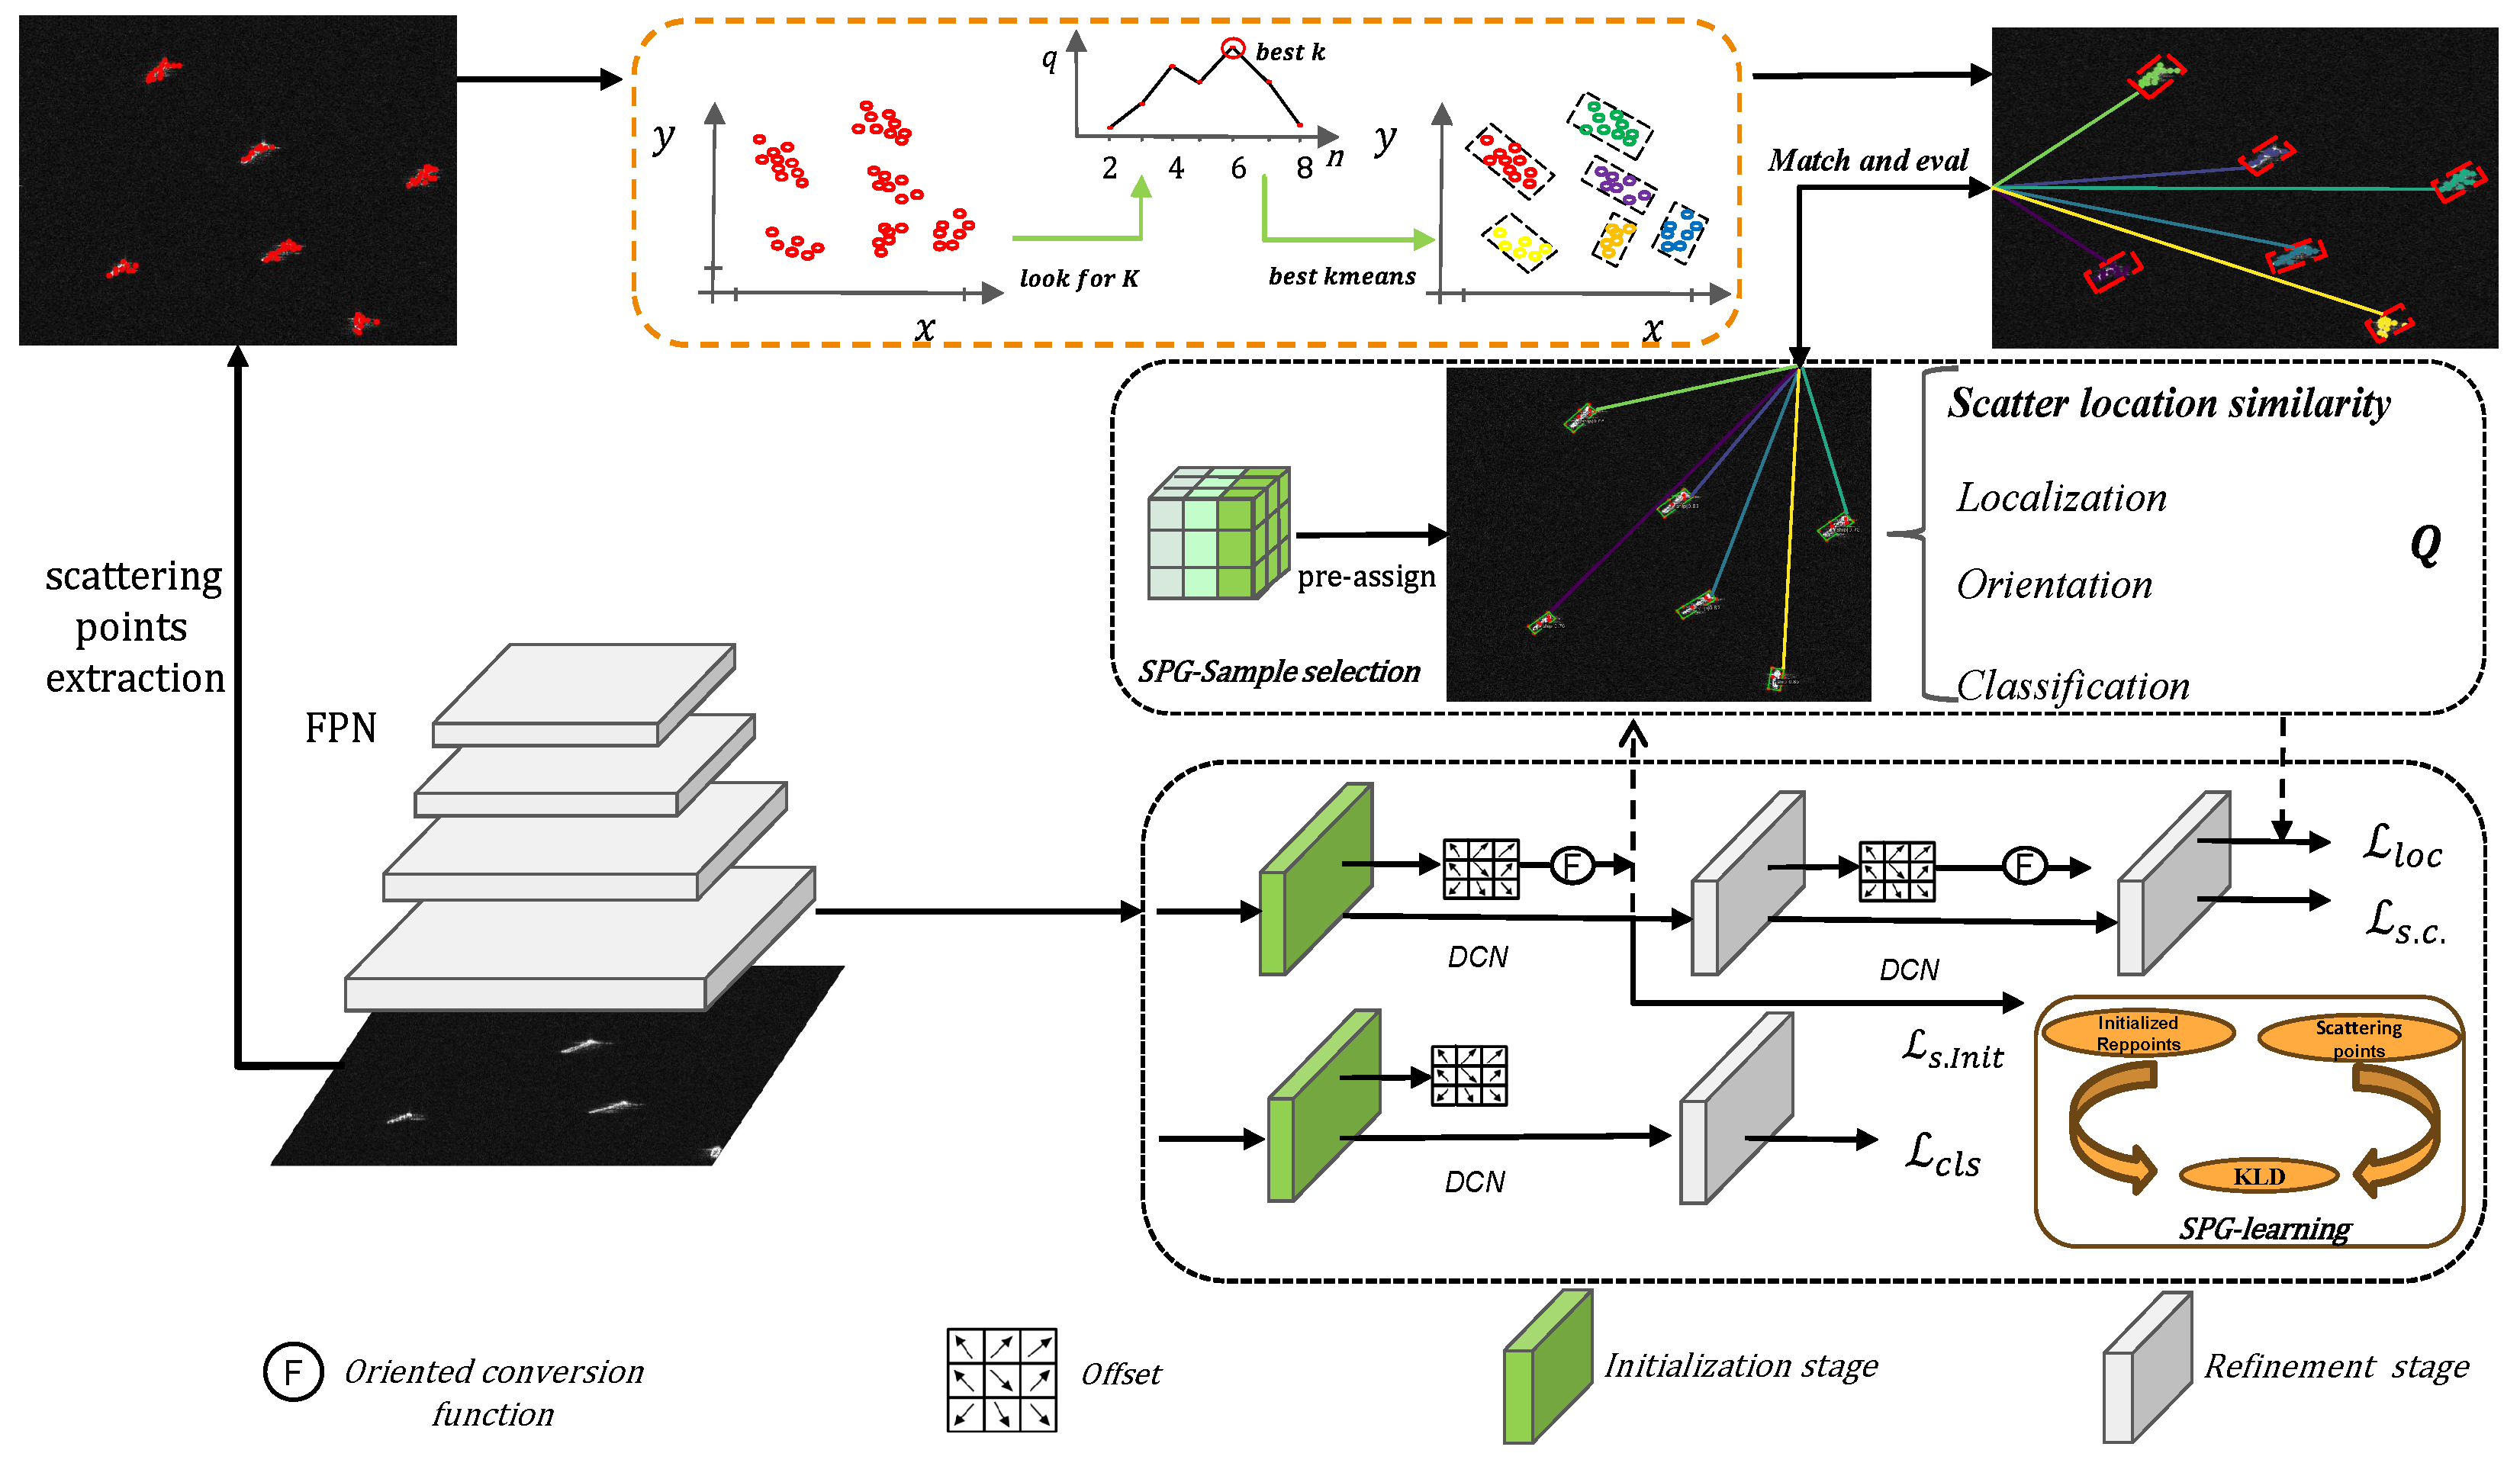
3.1. Overview of Model Structure

Figure 1 illustrates an overview of our proposed method. Our method can be mainly divided into four parts. The first part is the FPN backbone network, the second part is scattering point extraction and matching evaluation, the third part is adaptive sample selection, and the fourth part is reppoints generation of shared headers. This method starts with inputting the SAR image, which enters two feature extraction channels at the same time. One channel is the scattering point extraction branch based on corner points, and a strong scattering point set is obtained and adaptive clustering processing is performed to obtain several point clusters. The other channel is the deep semantic feature extraction part based on FPN, which extracts high-level features and then sends them to the shared headers. Through this two-stage operation, initialized reppoints and finely corrected reppoints are obtained. In the training phase, the initialized reppoints are sent to the adaptive sample selection part to evaluate the point set quality using matched and aligned scattering point clusters so as to select high-quality samples for learning. In addition, in order to improve the quality of the initialized reppoints, guided learning is performed through the SPG learning part. In the testing phase, the oriented detection results are directly generated by the finely corrected reppoints through the conversion function.

3.2. Scattering-Point-Guided Adaptive Sample Selection (SPG-ASS)

3.2.1. Extraction of Scattering Points and Clustering

Ships usually have metal shells composed of a large number of strong scattering structures, such as dihedral angles, trihedral angles, etc., which, in turn, result in the strong scattering phenomena of ships in SAR images when combined with the unique imaging mechanism of the SAR system. These strong scattering points often contain the structure and location characteristics of the ship itself. For this reason, we use the Harris corner detector to extract corner points. In order to reduce the interference of land scattering, the corner point threshold is set to 0.2 , and a part of the low-quality corner point responses are filtered. In order to better capture the global ship scattering characteristics, the maximum number of corner points is set to 100. In order to better capture the local characteristics of the ship, the minimum Euclidean distance is set to 10. The obtained scattering point set is R s p { ( x i , y i ) } i = 1 N . In order to better realize the guiding role of the SAR scattering point set, cluster processing [43] is performed on the point set, with K [ 2 , 8 ] , and the silhouette coefficient is used as the evaluation metric for the cluster quality. By iteratively looping through this process, the optimal cluster number K is determined, and its clustering effect is shown in Figure 2.
Afterward, based on the allocation strategy, they are assigned to the corresponding initialized reppoints for quality evaluation.

3.2.2. Feature Matching and Adaptive Sample Selection

We improve the quality metric for adaptive sample reppoints, which is different from APAA [36], and we introduce a scattering position metric in the quality assessment to more comprehensively measure the quality of the sample reppoints and provide higher-quality samples for model training.
The extracted set of scattering points is R s p { ( x i , y i ) } i = 1 N , which is clustered to obtain a number of clusters. The number of clusters is obtained by measuring the optimal silhouette coefficient of the clusters; the scattering cluster center point set is C { ( x i , y i ) } i = 1 K , where K denotes the optimal number of clusters. The point set of sample reppoints is R = { S 1 , S 2 , S 3 , , S m } , where S i = { ( x j , y j ) } j = 1 9 , and m denotes the generation of m samples. We use cosine similarity as the similarity measure between point set clusters and initialized reppoints, thereby achieving matching and assessment between scattering cluster center points and initialized reppoints. The average cosine similarity between the scattering cluster center points and the sample reppoints can be expressed as E i k :
E i k = 1 N j = 1 9 ( c o s < e i j , e k * > )
where N = 9 indicates that each sample’s reppoints consists of nine points. e i j represents the vector denoting each point within every sample’s reppoints, while e k * denotes the vector representing the scattering cluster center points. By traversing all scattering cluster center points, we obtain the cosine similarity matrix E between sample reppoints and the scattering cluster center points:
E = ( E 1 , 1 ) ( E 1 , 2 ) ( E 1 , n ) ( E 2 , 1 ) ( E 2 , 2 ) ( E 2 , n ) ( E m , 1 ) ( E m , 2 ) ( E m , n )
By computing the average cosine similarity between the extracted scattering cluster center points and the sample reppoints, we obtain the similarity matrix E R m × n . Taking the maximum along the dimension of n, we derive the optimal match between the samples and the scattering cluster center points, along with their corresponding cosine similarity, denoted as follows:
max n ( E ) = max ( E 1 , 1 , E 1 , 2 , , E 1 , n ) max ( E 2 , 1 , E 2 , 2 , , E 2 , n ) max ( E m , 1 , E m , 2 , , E m , n )
In order to facilitate integration with other quality scores, the corresponding cosine distance is obtained based on the cosine similarity, thereby generating the quality score Q s p R m .
Q s p = 1 max n ( E )
In summary, the score Q s p , measured by the scattering position, is obtained, and then our quality evaluation part can be divided into the following:
Q u n i o n = Q c l s + μ 1 Q s p + μ 2 Q l o c + μ 2 Q o r i
Among these measures, Q s p denotes the similarity measure for scattering positions, while Q l o c represents the assessment of the spatial positioning quality, computed through the positioning loss converted by GIoU [44]. Q o r i employs the Chamfer distance [45] to gauge directional disparities, whereas Q c l s utilizes FocalLoss [29] to evaluate the correlation in category quality. A dynamic TOP K sample selection scheme is devised based on their quality assessment scores. Quality score lists are generated during different iterations, and these scores are arranged in ascending order. Additionally, a random sampling rate σ is set to adaptively adjust the number of positive samples, denoted by k.
k = σ × N t
where N t represents the total number of generated samples, and the initial default setting for σ is 0.2 . Subsequently, during the training phase, the top k samples with the highest quality assessment scores are selected as positive samples for training. Considering the practical application scenarios of SAR target detection, we restrict the utilization of this approach solely to the training phase, aiming to reduce the computational load during the detection phase.

3.3. Scattering-Point-Guided Reppoints Dynamic Learning (SPG Learning)

Ship misdetection tends to happen in nearshore scenarios due to the presence of land scattering interference, which results in the poor generation of initial reppoints. Additionally, some outliers appear in the adaptive learning stage of key semantic features for reppoints, which further reduces the performance of ship detection.
We add supervisory information based on scattering point location priors during the initialization point generation stage, thereby guiding reppoints to learn features from key semantic parts of the target. This reduces the land scattering interference and makes the extracted features more accurate and complete.
Specifically, scattering points play a critical role in representing ship features within SAR images. Once we perform positive sample selection using SPG-ASS, we acquire the corresponding positive sample set of reppoints and assign ground truth (GT) boxes to them. Subsequently, we utilize these GT boxes to identify matching clusters of scattering points positioned accordingly. This alignment process ensures a cohesive match between scattering points and sample reppoints, thereby consolidating more of the inherent structural and positional features of targets into the supervised information. Consequently, this offers valuable guidance for initializing reppoints, facilitating a more effective learning process regarding the key semantic features of the target. Ultimately, this procedure significantly elevates the quality of the initialized point set. The learning process is depicted in Figure 3.
After initialization, the reppoints are generated as R = { S 1 , S 2 , S 3 , , S m } , where S i = { ( x j , y j ) } j = 1 9 . To better achieve the adaptive learning of the target’s crucial semantic parts by initializing reppoints, we utilize Kullback–Leibler Divergence (KLD) [34] as the regression loss for supervised optimization. Specifically, Gaussian distributions are employed to individually model the scattering point clusters and the reppoints generated during initialization. Subsequently, the KLD loss is computed based on the Gaussian distributions between these two sets of points. This enables the dynamic adaptive adjustment of gradients for each parameter based on the loss between the two point sets. Such an approach is advantageous for facilitating the adaptive collaborative optimization of the initialized reppoints and, consequently, enabling the learning of key semantic features of the target. The computation of the Gaussian distribution of the point set is as follows:
N ( x i | μ , Σ ) = 1 2 π det ( Σ ) exp 1 2 ( x i μ ) T Σ 1 ( x i μ )
where μ represents the mean value, and Σ represents the covariance matrix. The calculation of KLD for the Gaussian distribution of point sets is as follows:
D K L ( N p N t ) = 1 2 ( μ p μ t ) T Σ t 1 ( μ p μ t ) + Tr ( Σ t 1 Σ p ) + ln | Σ t | | Σ p | 1
where N p and N t represent the Gaussian distributions of the initialized reppoints and the corresponding position scattering point cluster, respectively. Consequently, the loss between the two sets of points is obtained as follows:
L s . Init = 1 1 2 + f ( D )
where f ( · ) denotes a non-linear function applied to distances, in this case using s q r t ( D ) . The overall loss function for the entire training process is as follows:
L total = L cls + α L s 1 + β L s 2 + γ L s . Init
where α , β , and γ represent balancing weighting coefficients, and L s 1 and L s 2 , respectively, represent the spatial localization losses during the initialization stage and the fine-tuning stage. The spatial localization loss comprises two components: positioning loss [44] and spatial constraint loss [36]. Additionally, L s . Init indicates the guidance loss of SPG learning.

4. Results and Discussion

4.1. Dataset and Its Evaluation Metrics

We conducted experiments on the SSDD [46] and HRSID datasets [10]. The SSDD dataset consists of 1160 images, with 928 images used for training and 232 images (including 46 nearshore images and 186 offshore images) used for testing. These images are sourced from RADARSAT-2, TerraSAR-X, and Sentinel-1, with resolutions ranging from 1 m to 15 m and with the C and X bands. The HRSID dataset comprises 5604 images, with 65% used for training and 35% for testing. The image slice resolutions in this dataset range from 0.5 m to 3 m. All images were resized to 800 × 800 pixels, and the data augmentation approach exclusively employs random flipping to enhance the sample set.
In our experiments, we used mAP (mean Average Precision) to evaluate the performance of the network. Its expression is as follows:
mAP = 1 K j = 1 K 0 1 precision ( recall ) d ( recall )
Besides mAP, we also utilized Recall as another important metric to reflect the performance of our method. Its expression is as follows:
Recall = N T P N T P + N F N
where N T P represents the number of true positives, and N F N represents the number of false negatives.

4.2. The Details of the Experiment

The entire experiment was implemented within the mmrotate codebase. The total number of training epochs was 50, and the SGD optimizer was used with a learning rate of 0.0025, a momentum parameter of 0.9, and a weight decay of 0.0001. Learning rate adjustments were made using a stepwise strategy with adjustment nodes at (38, 40, 42, 44, 46, 48). All training and testing experiments in this paper were conducted on the Ubuntu 18.04 operating system. As for hardware specifications, the experiments were performed using an Intel i5-13490F CPU (Intel, Santa Clara, CA, USA) and an NVIDIA RTX 4080 GPU (NVIDIA, Santa Clara, CA, USA).

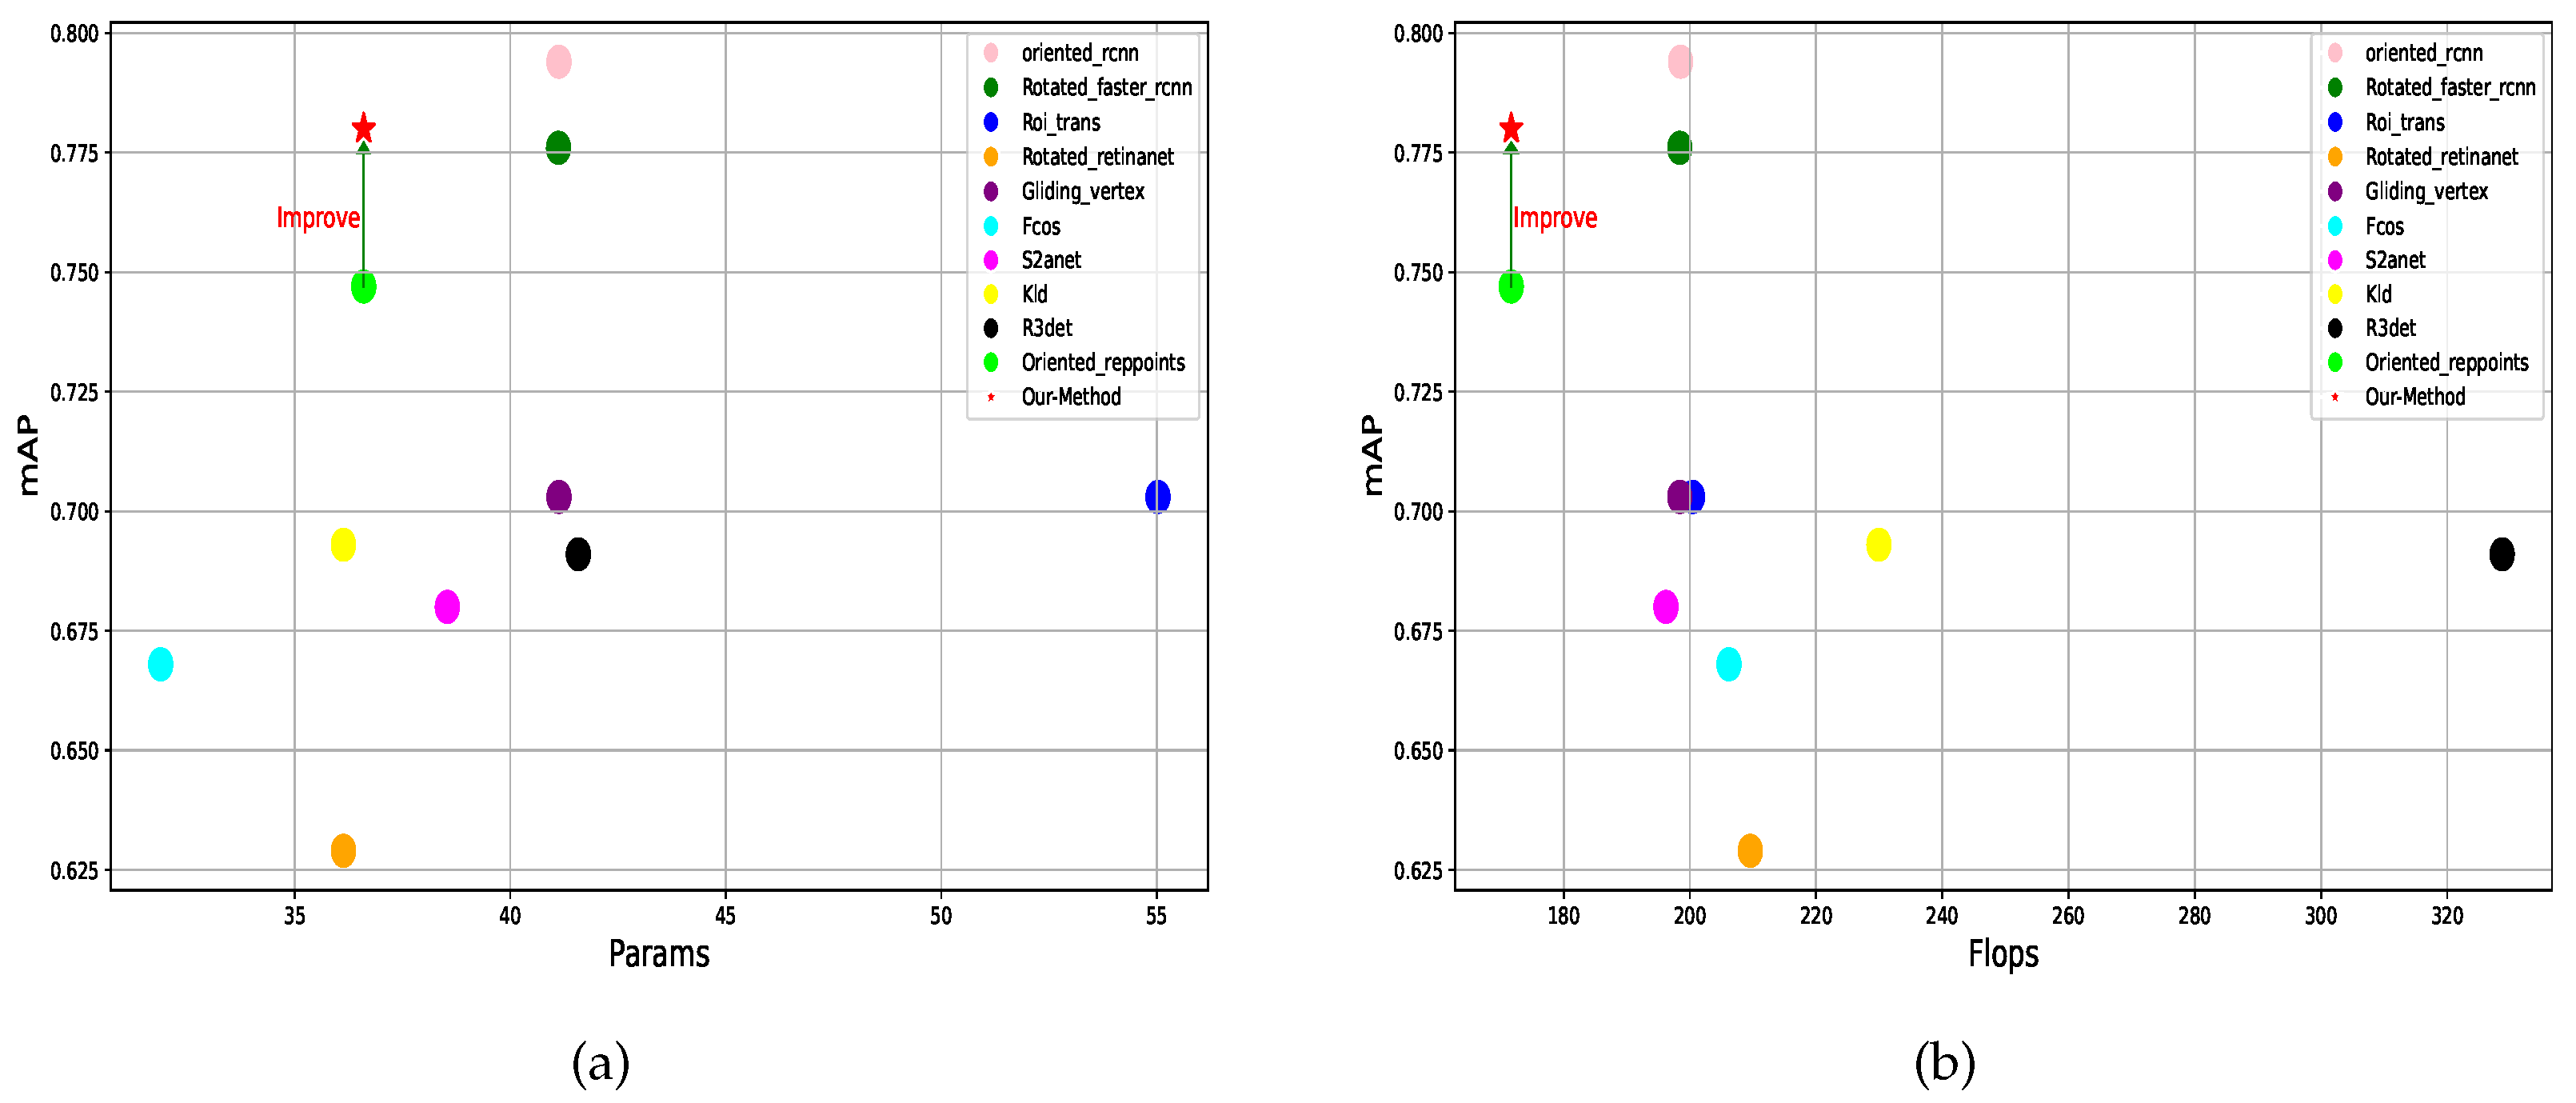
4.3. Comparison with State-of-the-Art Methods

In order to validate the effectiveness of our SPG oriented-reppoints method, we compared our method with ten other state-of-the-art directional target detection algorithms on a unified SSDD dataset; their mAP and Recall values were computed for nearshore scenarios, offshore scenarios, and hybrid scenarios, as shown in Table 1.
The compared methods include (1) two-stage object detectors based on anchor boxes: oriented-rcnn [33], Roi-Transformer [32], and Rotated-faster-rcnn [25], Gliding-vertex [47]; (2) anchor-free object detectors: Fcos [48] and oriented reppoints (baseline) [36]; (3) single-stage detectors based on anchor points: Rotated-retinanet [29], S2anet [49], Kld [34], and R3det [50]. Ultimately, our method achieved 78 % mAP and 88.5 % Recall in nearshore scenes and 89.8 % mAP and 94.4 % Recall in hybrid scenes, surpassing all methods except oriented-rcnn. Particularly in nearshore scenes, in terms of mAP, our method significantly outperforms other anchor-free algorithms and some anchor-based methods. Furthermore, compared to our baseline method (oriented reppoints), our method demonstrated a 3.3 % mAP and 2.2 % Recall improvement in nearshore scenes and a 0.26 % mAP and 0.4 % Recall improvement in mixed scenes. This validates the effectiveness of our method over the baseline.
The ship detection capabilities of these methods for the nearshore scenario are directly exhibited in Figure 4. As shown in the figure, our algorithm can detect ships in complex nearshore environments, while other methods exhibit varying degrees of false positives and misses. In Figure 4b–g, the targets on land were mistakenly detected as ships. In Figure 4c,e, the clutter on the sea surface was mistakenly detected as a ship. In Figure 4e,g, the nearshore ship was missed.
Simultaneously, we considered the practical application scenarios of the models and compared their parameter sizes and computational complexities. As illustrated in Figure 5, our method’s model parameter size constitutes 88.98 % of that of oriented-rcnn, while its computational complexity represents 86 % of oriented-rcnn’s. However, the difference in detection accuracy between our method and oriented-rcnn is merely 1.4 % . To some extent, our method achieves comparable precision to oriented-rcnn while possessing a smaller parameter size and reduced computational overhead. Moreover, in contrast to the baseline method, our approach significantly enhances model performance without increasing the model’s parameters or computational complexity. This reinforces the practical superiority of our method in detection scenarios.
Furthermore, to further analyze the performance of our algorithm, we conducted tests on the HRSID dataset. The results are shown in Table 2. Our method achieved an improvement of 3.6% in nearshore environments and 4.5% in mixed scenarios compared to the baseline. Multiple metrics reached the state-of-the-art (SOTA) level, further demonstrating the effectiveness and robustness of our method.

4.4. Ablation Experiments

In this section, to analyze the effectiveness of various proposed components within our method, we employed the original oriented-reppoints method as a baseline and evaluated its performance first. Subsequently, we conducted a series of ablation experiments and compared their results. To ensure the reliability of these experimental outcomes, all experiments were conducted under identical conditions and with identical settings.
We incorporated two parts into the baseline method to study their impacts separately: adaptive sample selection guided by scattering points (SPG-ASS) and adaptive reppoints learning guided by scattering points (SPG learning). The experimental results are presented in Table 3. When solely incorporating SPG-ASS, the mAP is increased by 1.3 % , and the network’s detection Recall is increased by 1.5 % , benefiting from the exclusivity of high-quality samples in the network training and learning processes. When solely incorporating the SPG learning part, the mAP and Recall for nearshore detection are improved by 1.6 % and 0.2 % , respectively. As indicated in row IV of Table 3, when both components were integrated into our network, it exhibited greater performance improvements. The mAP and Recall for nearshore detection are increased by 3.3 % and 2.2 % , respectively. Additionally, these components were applied during the training phase of our network, without increasing the computational load during the testing phase.

4.4.1. SPG-ASS

Given the utilization of an anchor-free mechanism within our network architecture, the acquisition of high-quality samples stands as a pivotal factor in effectively detecting intricate nearshore targets. We introduced SPG-ASS into the baseline model. By incorporating scattering point positional information, during the training phase, we can select higher-quality samples for learning, thereby avoiding issues of model degradation caused by low-quality samples. In Figure 6a, due to the lack of scattering point position information of the target with the adaptive sampling scheme, the correlation between the sample’s classification confidence and localization score (IoU) is low. Moreover, a considerable number of samples are concentrated in regions with both lower classification confidence and lower localization scores, indicating low sample quality overall.
In contrast, as depicted in Figure 6b, by incorporating the scattering position information, the localization quality scores and classification confidence of the samples are significantly increased compared to Figure 6a without this integration. This approach has led to the selection of numerous high-quality samples exhibiting higher classification confidence and localization scores. This substantiates the effectiveness of our method in selecting high-quality samples. In addition, we conducted a comparative analysis in nearshore environments using both the baseline method and the improved approach with SPG-ASS.
As depicted in Figure 7b,e, it is evident that the baseline method is prone to false positives and false negatives in nearshore detection. Conversely, the detection outcomes of the improved approach, as illustrated in Figure 7c,f, exhibit a significant decrease in false negatives and the absence of false positives. This further corroborates the effectiveness of our SPG-ASS component.

4.4.2. SPG Learning

To further explore the impact of SPG learning, we independently incorporated it into the baseline task. As indicated in Table 3, by employing SPG learning techniques, the adaptive feature learning capability of the initial reppoints is focused on the semantic features at critical target locations so as to mitigate the impact of land-based scattering interference. Furthermore, to further illustrate the effectiveness of our approach, we visualized the features of the backbone network.
As shown in Figure 8b,e, in the baseline task, the network is more sensitive to land scattering, making it difficult for adaptive points to learn the key semantic features of the target itself in nearshore detection. However, after applying adaptive point learning guided by scattering points, the results in Figure 8c,f show that land scattering interference is suppressed. The scattering-guided initialization points move toward the key semantic areas of the ship, enabling the network to highlight the significance of the target itself while reducing attention to land regions. This improves the robustness and accuracy of nearshore ship detection. Furthermore, we conducted tests on both the baseline and improved methods with SPG learning in nearshore environments. The results are shown in Figure 9. False detections and missed detections occur with the baseline. Meanwhile, the detection results generated by the improved method are consistent with the ground-truth bounding boxes. This further validates the effectiveness of the SPG learning component.

4.4.3. SPG Oriented Reppoints Detection

In addition, we simultaneously incorporated the two proposed modules into the baseline network. The detection results are shown in Figure 10. Figure 10a–c represent the ground truth, while Figure 10d–f illustrate the detection results of our proposed method. As depicted in Figure 10, our approach achieves the precise detection of objects in various scenes, such as offshore and nearshore, by adapting reppoints transformations. This demonstrates the effectiveness of our approach.

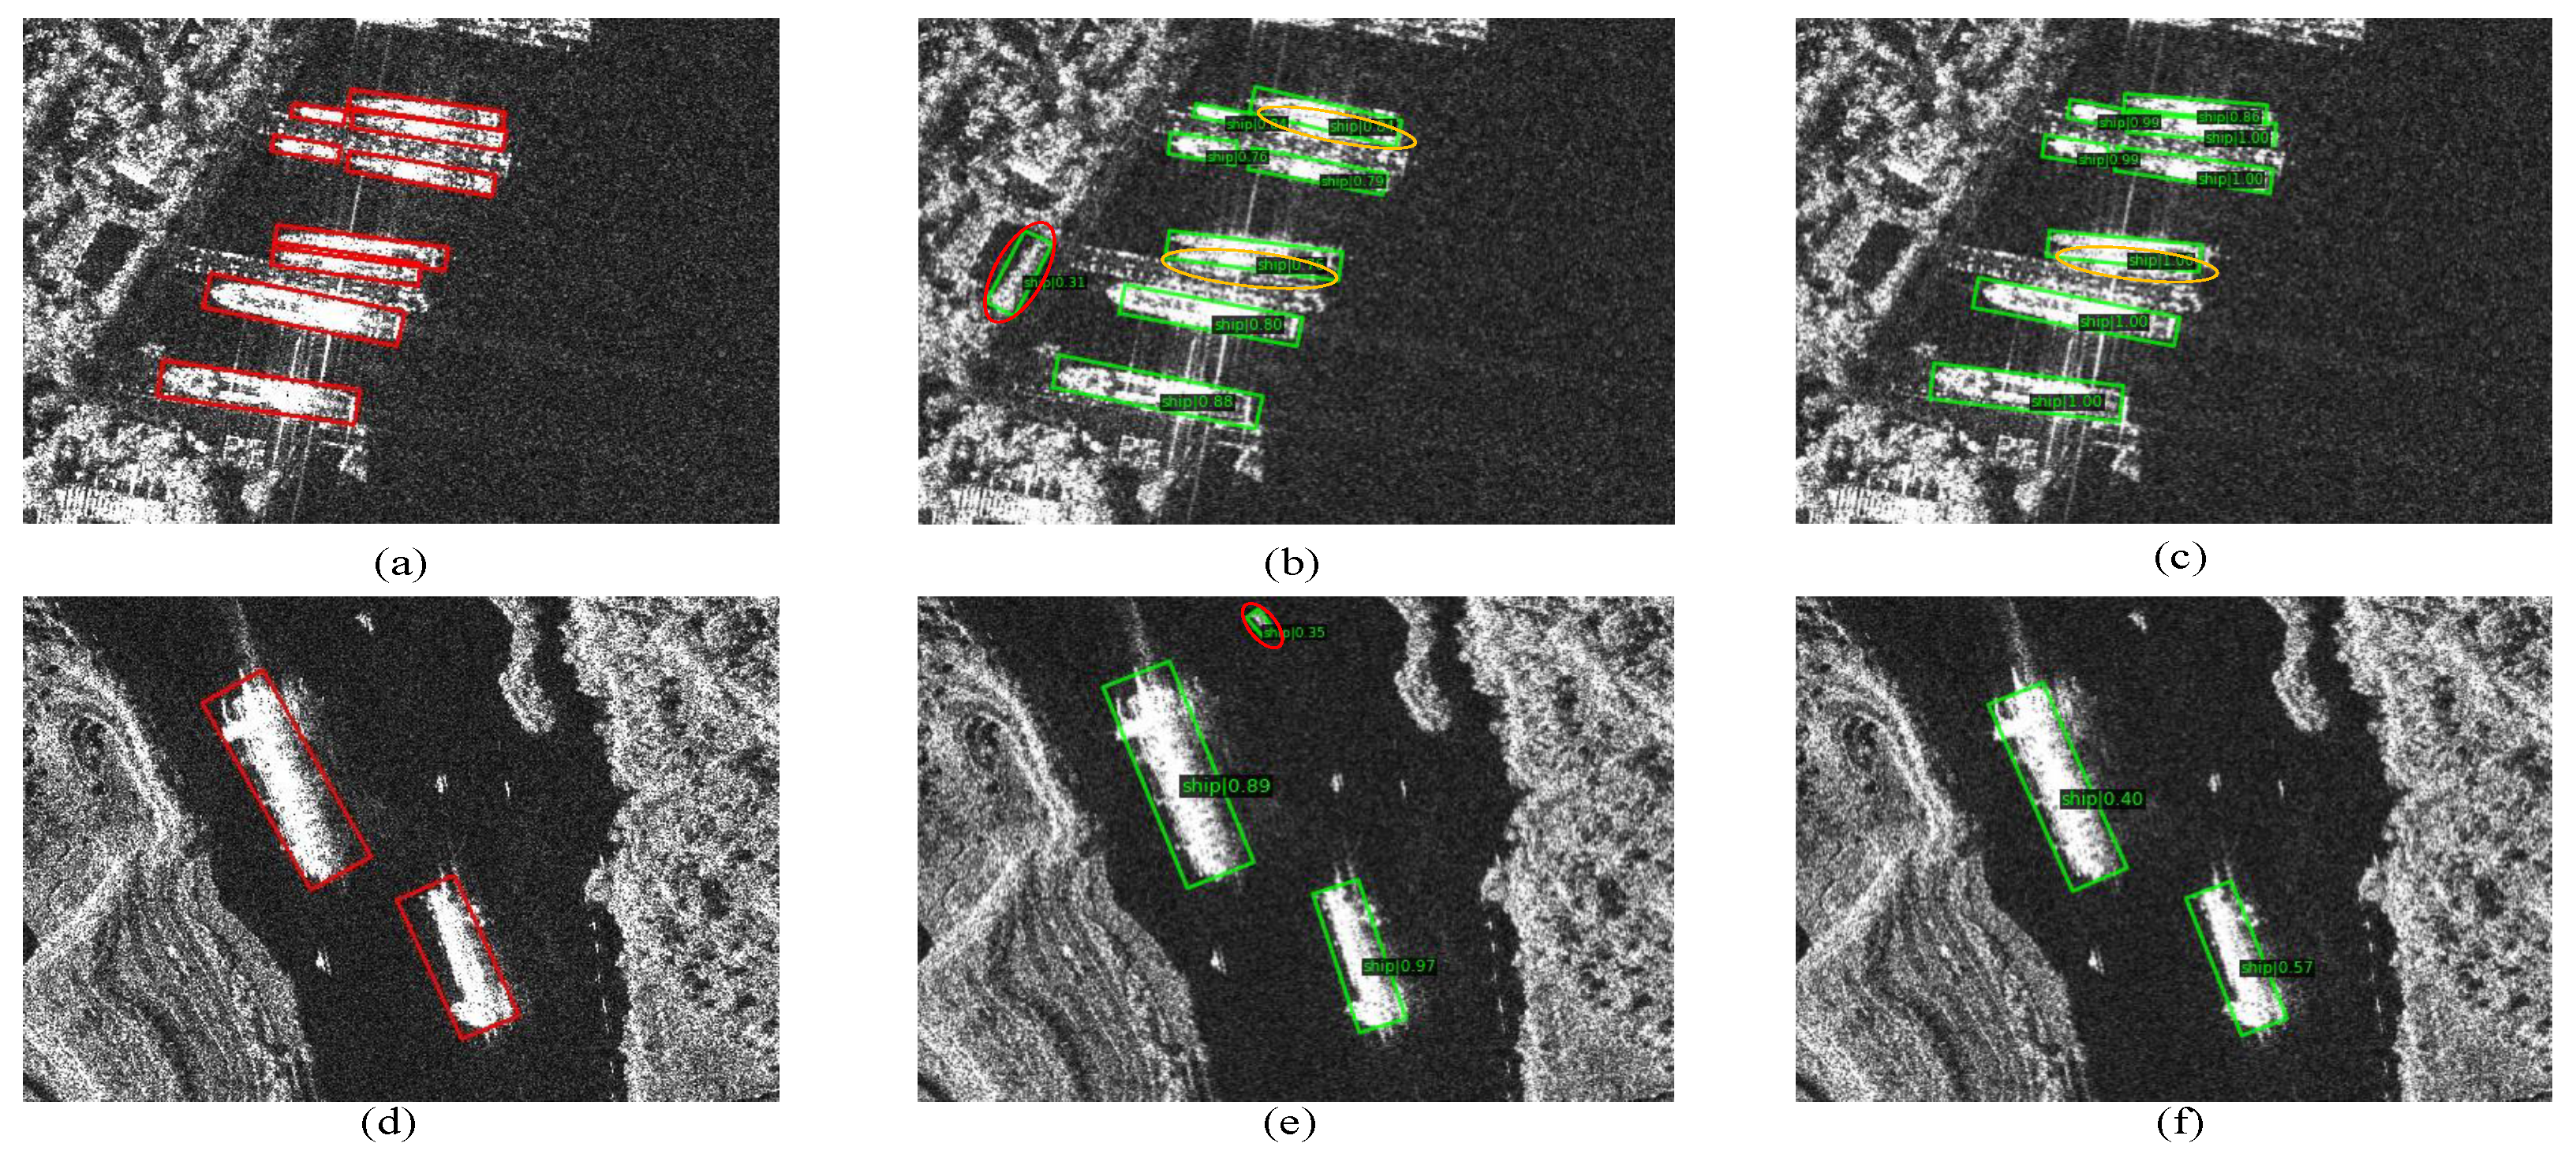
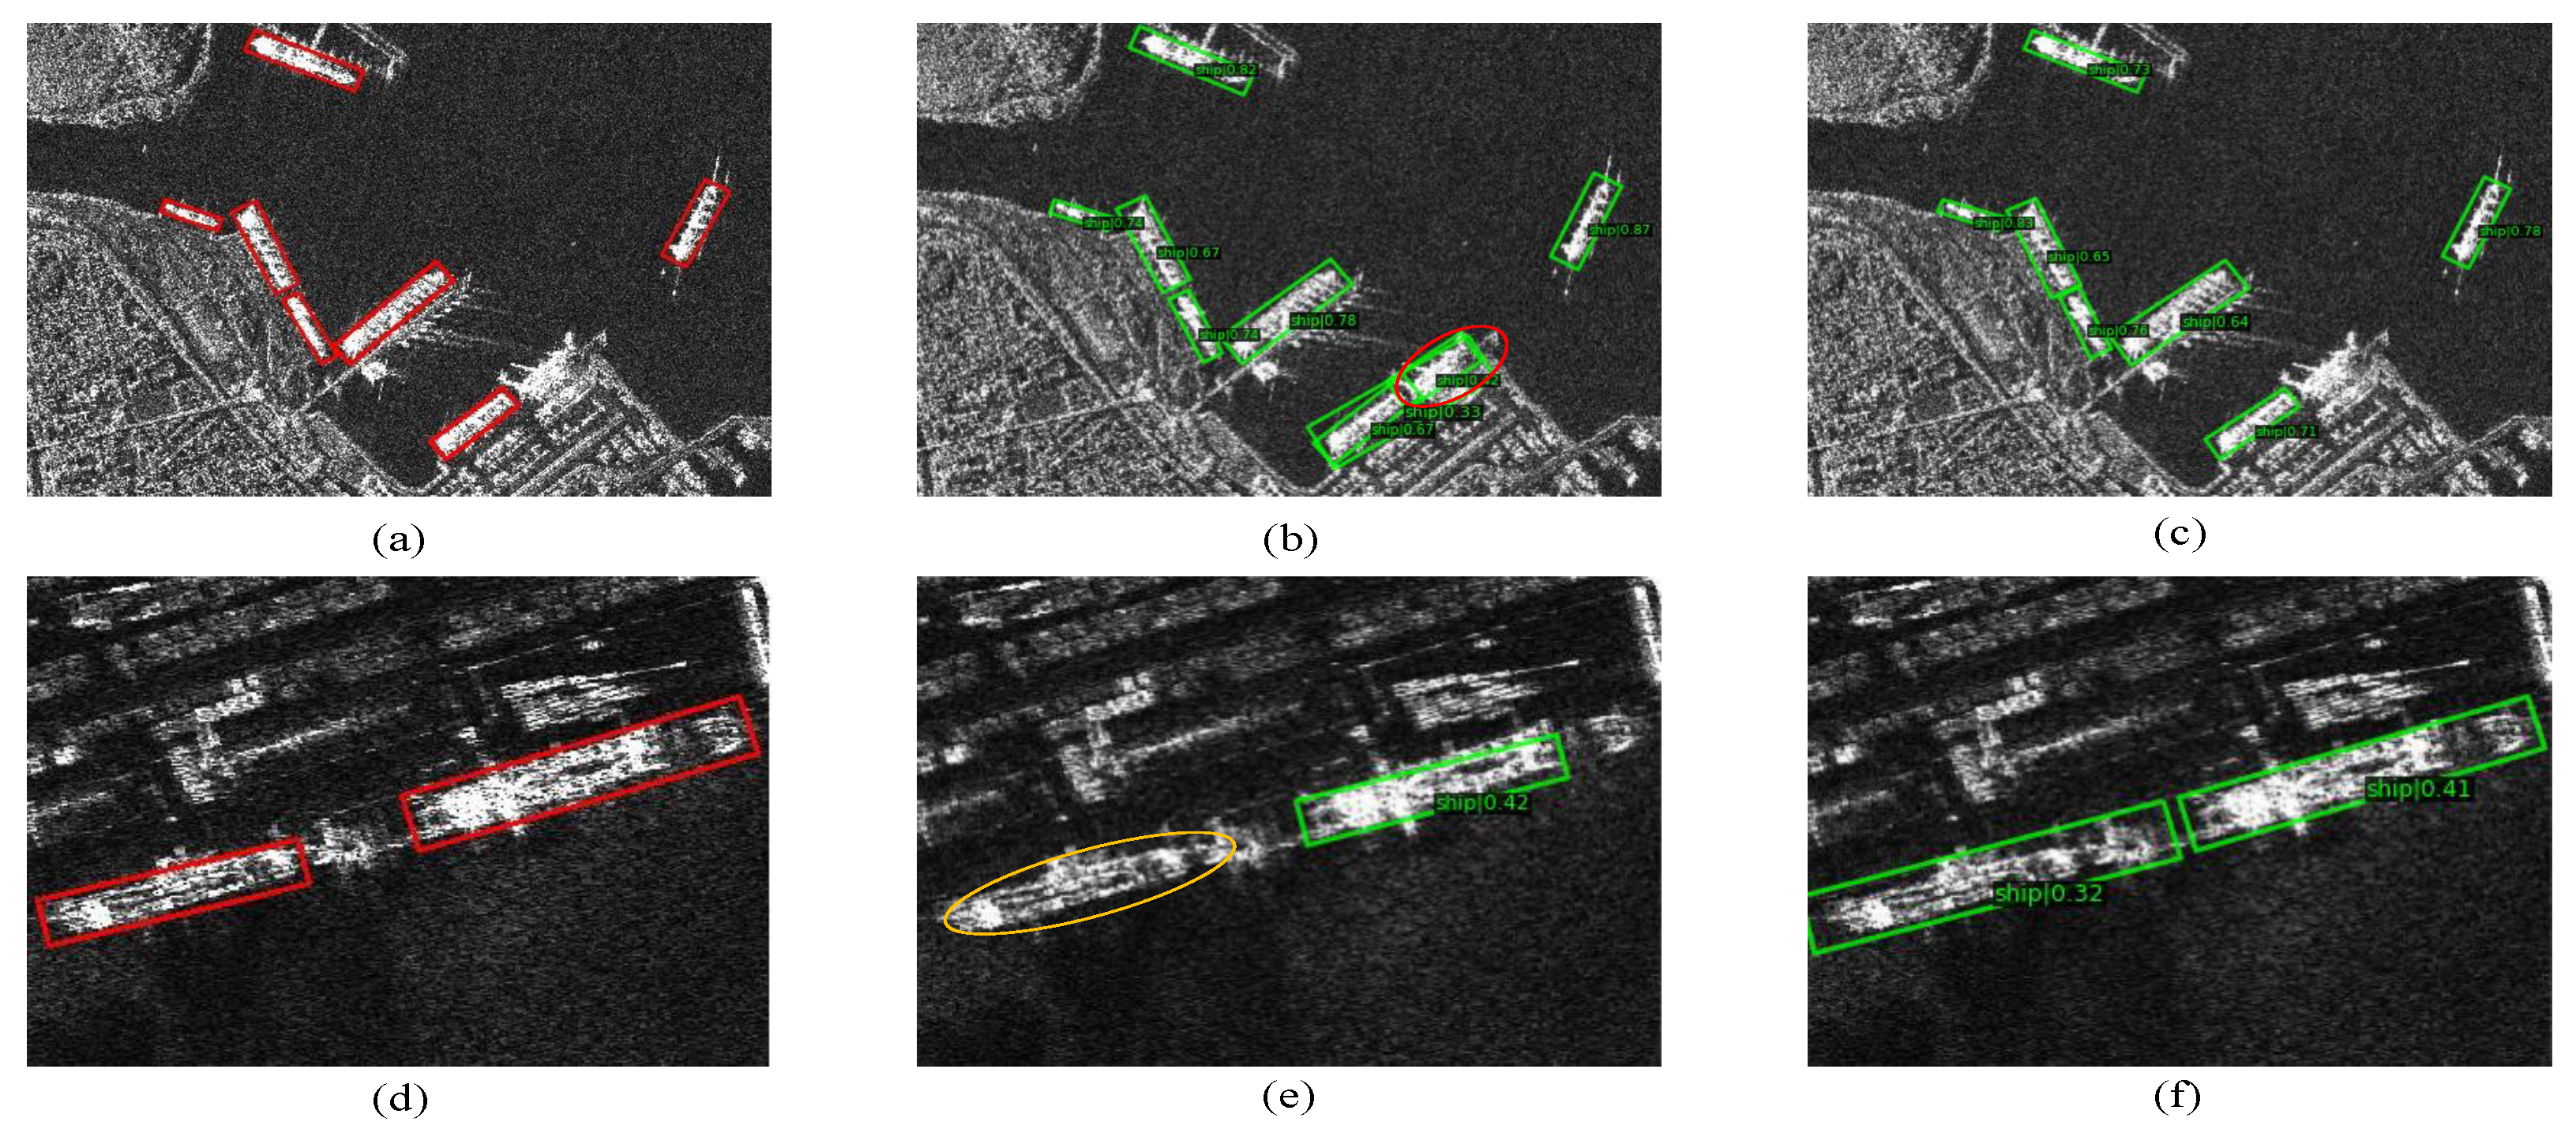
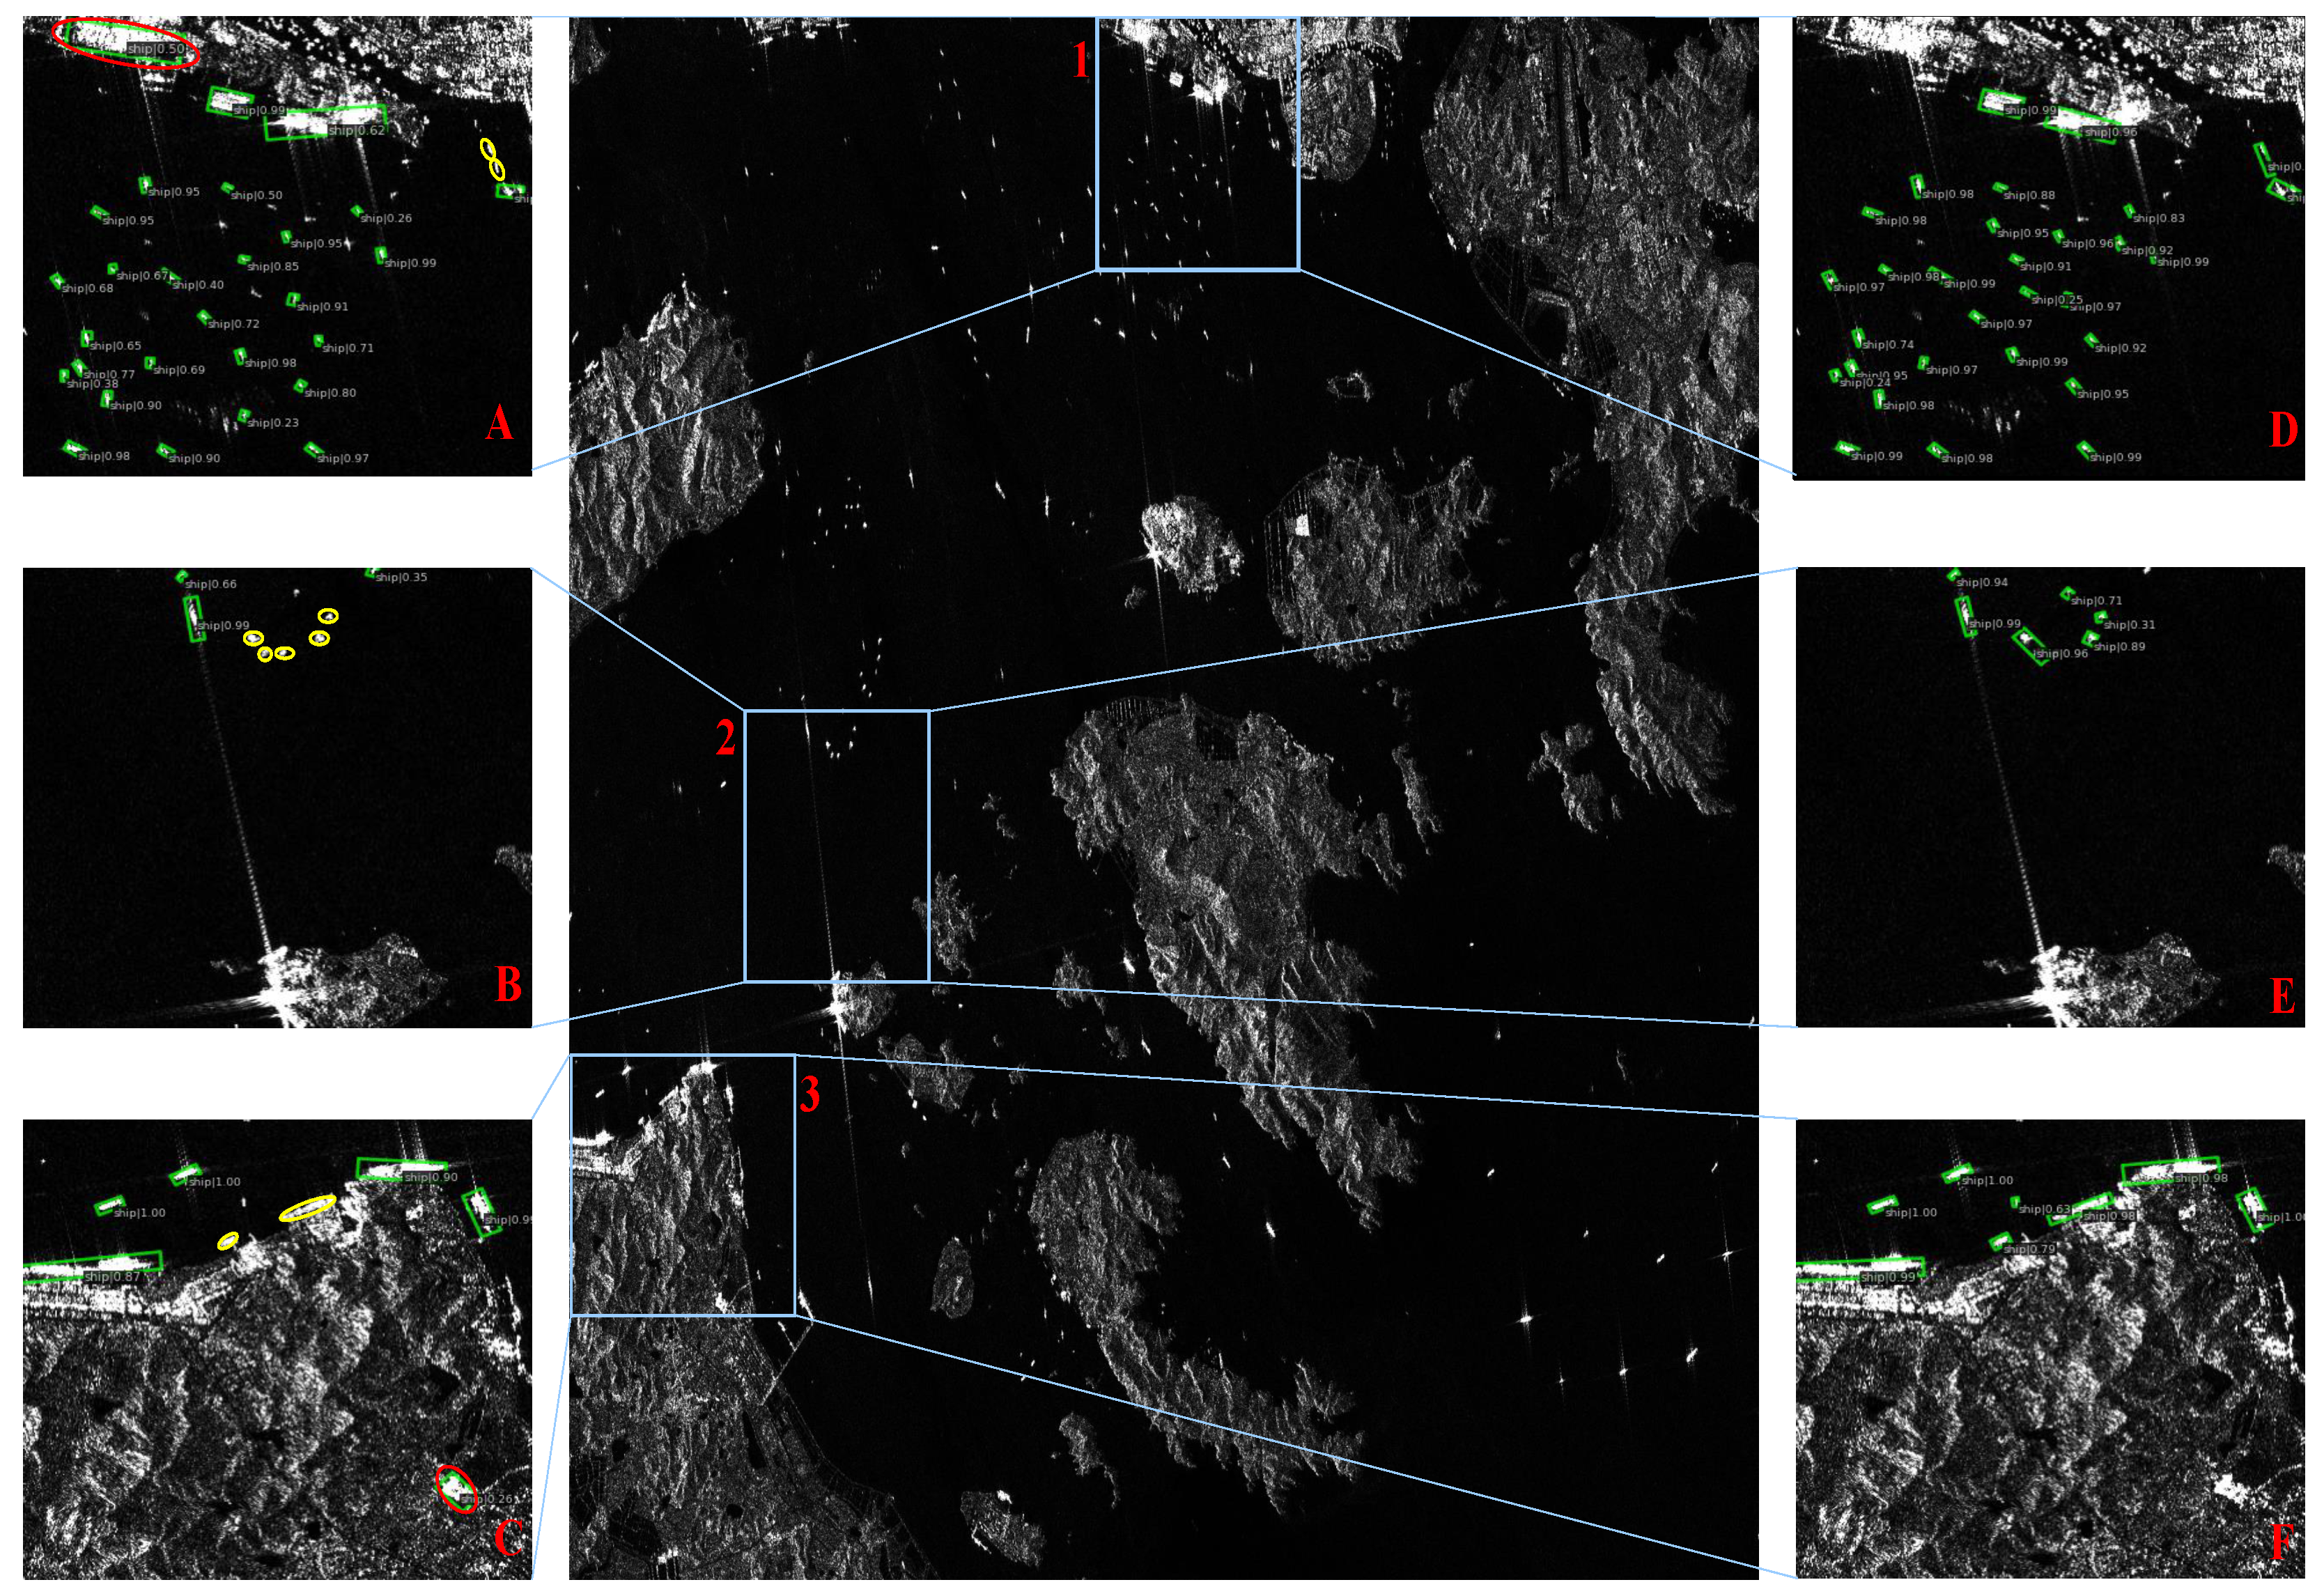
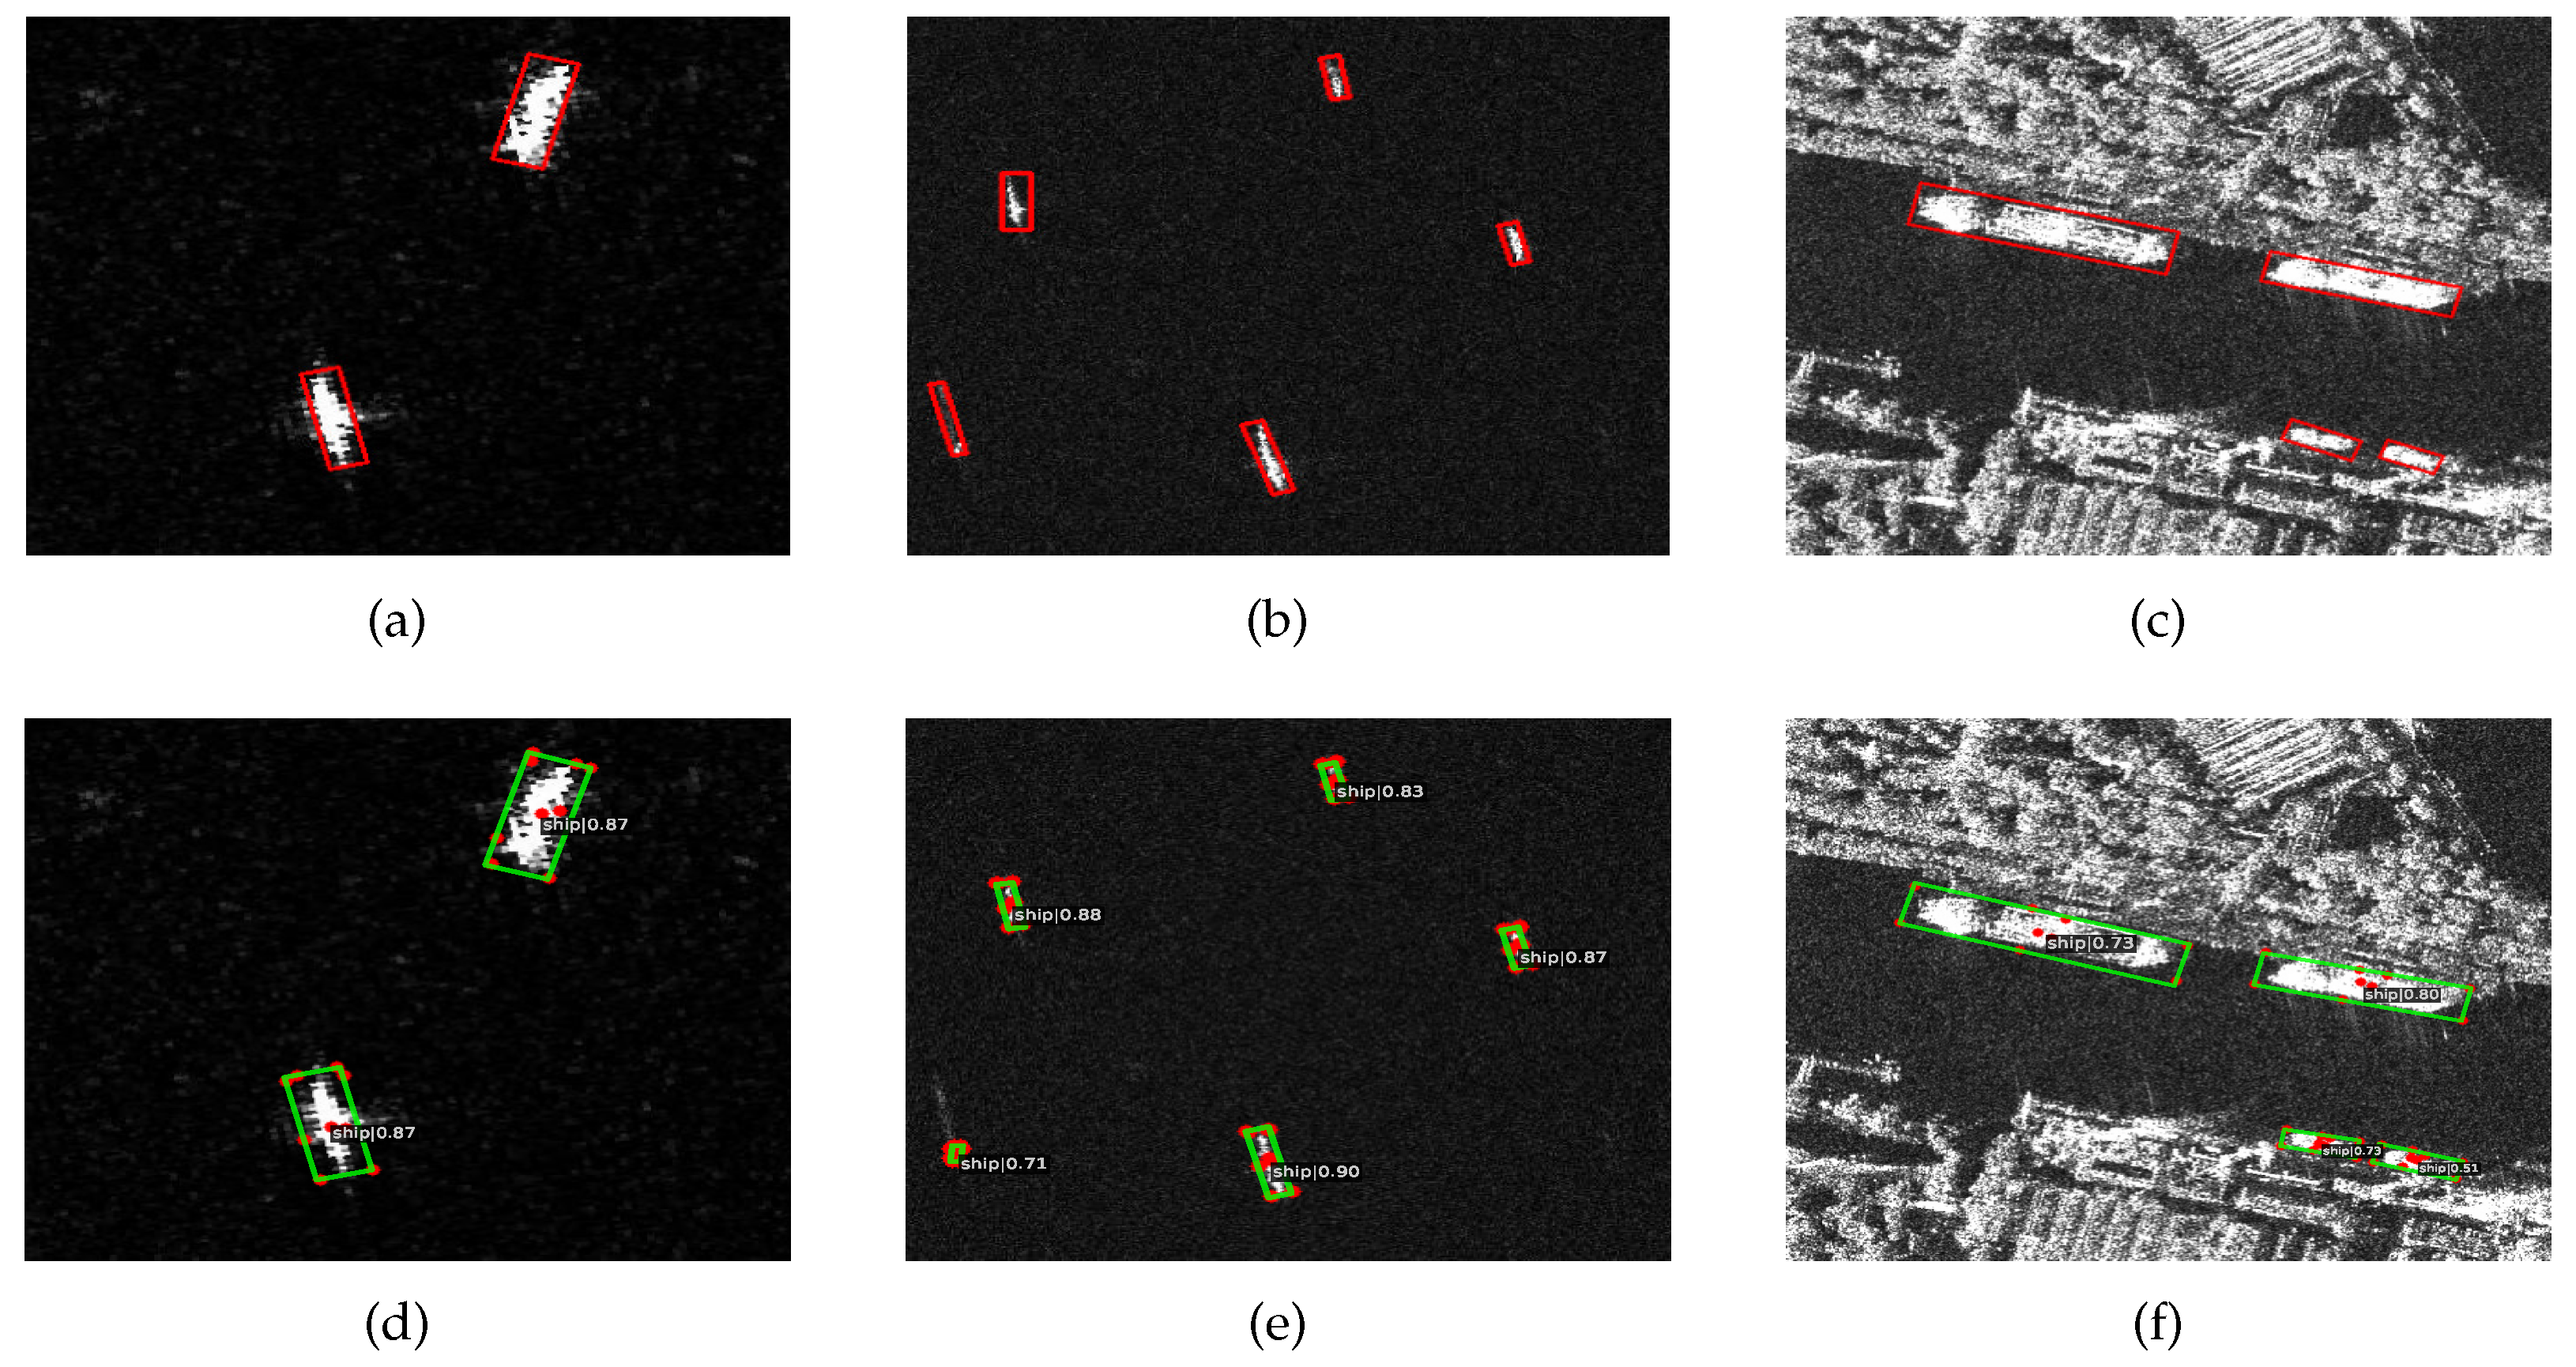
4.5. Qualitative Evaluation

Additionally, to assess the generalization performance of our method, a SAR image captured in the vicinity of the Zhoushan port area was chosen for ship detection, with the specific details outlined in Table 4.
We selected three representative areas within the image for analysis, as illustrated in Figure 11. Area 1 comprises a mixed scene of nearshore and offshore areas, while area 2 depicts an offshore scene, and area 3 portrays a nearshore scene. The oriented_rcnn method, having the best mAP value on the SSDD dataset, was chosen for comparison with the proposed method. The left three subplots Figure 11A–C showcase the detection results obtained using the oriented_rcnn method. In contrast, the right three subplots Figure 11D–F display the detection outcomes achieved by our proposed method. In subplot A, there are likely to be false and missed detections in the nearshore area when using oriented_rcnn. However, our method, as depicted in subplot D, not only effectively detects nearshore ships but also avoids false positives in the strong scattering areas on land. This also shows that our method has better ability to resist land scattering interference.
From subplot B in Figure 11, it is evident that there were some missed detections during offshore detection. However, our proposed method, as depicted in subplot E, presents more comprehensive detection results, with a significantly reduced rate of missed detections. Additionally, in nearshore scenarios, such as the area illustrated in Figure 11, there exists prominent strong scattering areas on land, closely adjacent to the ships, significantly increasing the difficulty of ship detection. The detection results of oriented_rcnn, as shown in subplot C, exhibit both missed detections in nearshore areas and false positives on land. In contrast, our method’s detection results, displayed in subplot F, identify all ship targets in that area without producing false detections on land targets. Overall, our method demonstrates superior detection and generalization performance in practical scenarios.

4.6. Discussion

The experimental results on the SSDD and HRSID datasets validate the effectiveness of our proposed method. On the SSDD dataset, our method outperformed the baseline by 3.2% and performed comparably to oriented-rcnn in nearshore environments, achieving a suboptimal level. To further verify the method’s generalization and reliability, we conducted a comparative study on the HRSID dataset, which is larger in scale, richer in imaging modes, and more complex in nearshore environments. The results show that our proposed method outperformed the baseline by 3.6% and achieved the state-of-the-art level on this dataset. Additionally, we observed performance fluctuations on different datasets, mainly due to differences in dataset characteristics. The HRSID dataset has a more complex nearshore environment with diverse slice characteristics, and the detection results in these complex scenarios also reflect the robustness and generalization of our method. Our method benefits from the anchor-free detection framework guided by scattering points, which provides higher granularity for recognizing ships in complex nearshore environments and has higher perceptual adaptability for detecting directional ships. Moreover, the SPG learning mechanism can better learn the features of nearshore ships, reduce false alarms on land, achieve feature focusing, and thus achieve higher detection accuracy. We also conducted ablation experiments to explore the roles of various parts of the proposed method. However, this method currently has some shortcomings. For example, both the adaptive sample selection scheme and the adaptive learning part rely on the extraction of scattering points from the target. If the area occupied by ships is limited or the scattering from ships is weak, resulting in fewer or no corner points being extracted, the method may fail. In the future, we plan to redesign the scattering point extraction part and introduce more efficient and advanced network structures for scattering feature extraction and fusion.

5. Conclusions

In summary, we propose an anchor-free detection scheme based on oriented reppoints guided by the scattering characteristics of SAR images. This scheme addresses the challenges of detecting oriented ships in complex nearshore environments. Initially, considering the scattering mechanism of metal-made ships, the strong points, such as corner points, are extracted as positional prior information. Then, we use the positional information of scattering points for adaptive sample selection, enabling the superior selection of high-quality sample points during the training phase and thus avoiding model degradation caused by low-quality samples. Furthermore, we enhance the reppoints quality in the initializing phase by a novel supervised guidance paradigm, allowing the network to learn more refined representations of the electromagnetic features of ships, consequently reducing land scattering interference in complex nearshore environments. Our method offers new insights into the integration of scattering features and demonstrates effectiveness in various environments, especially in nearshore scenes with significant land interference. On the SSDD dataset, our method achieves an mAP of 78% for nearshore detection, which is a 3.3% improvement over the baseline. To further validate the robustness of our method, we tested it on the HRSID dataset, where it achieves an mAP of 56.8% for nearshore detection, a 3.6% improvement over the baseline, reaching the state-of-the-art (SOTA) level compared to other methods. In the future, we will try to extend this methodology to other application scenarios so as to improve other object detection tasks with SAR images.

Author Contributions

Conceptualization, W.Z. and L.H.; methodology, W.Z.; software, W.Z.; validation, W.Z., H.L. and L.H.; formal analysis, W.Z.; investigation, W.Z.; resources, L.H.; data curation, W.Z.; writing—original draft preparation, W.Z.; writing—review and editing, W.Z., L.H. and C.Y.; visualization, W.Z.; supervision, L.H.; project administration, L.H.; funding acquisition, L.H. All authors have read and agreed to the published version of the manuscript.

Funding

This research was funded by the Youth Innovation Promotion Association No. 2019127, Chinese Academy of Sciences.

Data Availability Statement

The majority of the dataset is available at https://github.com/TianwenZhang0825/Official-SSDD, (accessed on 15 September 2023).

Acknowledgments

We sincerely appreciate the constructive comments and suggestions of the anonymous reviewers, which have greatly helped to improve this paper.

Conflicts of Interest

The authors declare no conflicts of interest.

References

  1. Zhou, G.; Lin, G.; Liu, Z.; Zhou, X.; Li, W.; Li, X.; Deng, R. An optical system for suppression of laser echo energy from the water surface on single-band bathymetric LiDAR. Opt. Lasers Eng. 2023, 163, 107468. [Google Scholar] [CrossRef]
  2. Zhang, Y.; Lu, D.; Qiu, X.; Li, F. Scattering-Point-Guided RPN for Oriented Ship Detection in SAR Images. Remote Sens. 2023, 15, 1411. [Google Scholar] [CrossRef]
  3. Zheng, Y.; Liu, P.; Qian, L.; Qin, S.; Liu, X.; Ma, Y.; Cheng, G. Recognition and depth estimation of ships based on binocular stereo vision. J. Mar. Sci. Eng. 2022, 10, 1153. [Google Scholar] [CrossRef]
  4. Reigber, A.; Scheiber, R.; Jager, M.; Prats-Iraola, P.; Hajnsek, I.; Jagdhuber, T.; Papathanassiou, K.P.; Nannini, M.; Aguilera, E.; Baumgartner, S.; et al. Very-High-Resolution Airborne Synthetic Aperture Radar Imaging: Signal Processing and Applications. Proc. IEEE 2013, 101, 759–783. [Google Scholar] [CrossRef]
  5. Castelletti, D.; Farquharson, G.; Stringham, C.; Duersch, M.; Eddy, D. Capella space first operational SAR satellite. In Proceedings of the 2021 IEEE International Geoscience and Remote Sensing Symposium IGARSS, Brussels, Belgium, 11–16 July 2021; pp. 1483–1486. [Google Scholar]
  6. Jordan, R.L.; Huneycutt, B.L.; Werner, M. The SIR-C/X-SAR synthetic aperture radar system. IEEE Trans. Geosci. Remote Sens. 1995, 33, 829–839. [Google Scholar] [CrossRef]
  7. Orzel, K.; Fujimaru, S.; Obata, T.; Imaizumi, T.; Arai, M. The on-orbit demonstration of the small SAR satellite. Initial calibration and observations. In Proceedings of the 2022 IEEE Radar Conference (RadarConf22), New York City, NY, USA, 21–25 March 2022; pp. 1–5. [Google Scholar]
  8. Mao, Y.; Zhu, Y.; Tang, Z.; Chen, Z. A novel airspace planning algorithm for cooperative target localization. Electronics 2022, 11, 2950. [Google Scholar] [CrossRef]
  9. Zhang, F.; Yao, X.; Tang, H.; Yin, Q.; Hu, Y.; Lei, B. Multiple mode SAR raw data simulation and parallel acceleration for Gaofen-3 mission. IEEE J. Sel. Top. Appl. Earth Obs. Remote Sens. 2018, 11, 2115–2126. [Google Scholar] [CrossRef]
  10. Wei, S.; Zeng, X.; Qu, Q.; Wang, M.; Su, H.; Shi, J. HRSID: A high-resolution SAR images dataset for ship detection and instance segmentation. IEEE Access 2020, 8, 120234–120254. [Google Scholar] [CrossRef]
  11. Bastani, F.; Wolters, P.; Gupta, R.; Ferdinando, J.; Kembhavi, A. SatlasPretrain: A Large-Scale Dataset for Remote Sensing Image Understanding. In Proceedings of the IEEE/CVF International Conference on Computer Vision, Paris, France, 2–6 October 2023; pp. 16772–16782. [Google Scholar]
  12. Yasir, M.; Niang, A.J.; Hossain, M.S.; Islam, Q.U.; Yang, Q.; Yin, Y. Ranking Ship Detection Methods Using SAR Images Based on Machine Learning and Artificial Intelligence. J. Mar. Sci. Eng. 2023, 11, 1916. [Google Scholar] [CrossRef]
  13. Kuttikkad, S.; Chellappa, R. Non-Gaussian CFAR techniques for target detection in high resolution SAR images. In Proceedings of the 1st International Conference on Image Processing, Austin, TX, USA, 3–16 November 1994; Volume 1, pp. 910–914. [Google Scholar]
  14. El-Darymli, K.; McGuire, P.; Power, D.; Moloney, C. Target detection in synthetic aperture radar imagery: A state-of-the-art survey. J. Appl. Remote Sens. 2013, 7, 071598. [Google Scholar] [CrossRef]
  15. Leng, X.; Ji, K.; Yang, K.; Zou, H. A bilateral CFAR algorithm for ship detection in SAR images. IEEE Geosci. Remote Sens. Lett. 2015, 12, 1536–1540. [Google Scholar] [CrossRef]
  16. Dai, H.; Du, L.; Wang, Y.; Wang, Z. A modified CFAR algorithm based on object proposals for ship target detection in SAR images. IEEE Geosci. Remote Sens. Lett. 2016, 13, 1925–1929. [Google Scholar] [CrossRef]
  17. Liao, M.; Wang, C.; Wang, Y.; Jiang, L. Using SAR Images to Detect Ships From Sea Clutter. IEEE Geosci. Remote Sens. Lett. 2008, 5, 194–198. [Google Scholar] [CrossRef]
  18. Ai, J.; Tian, R.; Luo, Q.; Jin, J.; Tang, B. Multi-Scale Rotation-Invariant Haar-Like Feature Integrated CNN-Based Ship Detection Algorithm of Multiple-Target Environment in SAR Imagery. IEEE Trans. Geosci. Remote Sens. 2019, 57, 10070–10087. [Google Scholar] [CrossRef]
  19. Yasir, M.; Liu, S.; Mingming, X.; Wan, J.; Pirasteh, S.; Dang, K.B. ShipGeoNet: SAR Image-Based Geometric Feature Extraction of Ships Using Convolutional Neural Networks. IEEE Trans. Geosci. Remote Sens. 2024, 62, 1–13. [Google Scholar] [CrossRef]
  20. Chang, Y.L.; Anagaw, A.; Chang, L.; Wang, Y.C.; Hsiao, C.Y.; Lee, W.H. Ship detection based on YOLOv2 for SAR imagery. Remote Sens. 2019, 11, 786. [Google Scholar] [CrossRef]
  21. Chen, S.; Zhang, J.; Zhan, R. R2FA-Det: Delving into high-quality rotatable boxes for ship detection in SAR images. Remote Sens. 2020, 12, 2031. [Google Scholar] [CrossRef]
  22. Girshick, R.; Donahue, J.; Darrell, T.; Malik, J. Rich feature hierarchies for accurate object detection and semantic segmentation. In Proceedings of the IEEE Conference on Computer Vision and Pattern Recognition, Columbus, OH, USA, 23–28 June 2014; pp. 580–587. [Google Scholar]
  23. He, K.; Zhang, X.; Ren, S.; Sun, J. Spatial Pyramid Pooling in Deep Convolutional Networks for Visual Recognition. In Computer Vision—ECCV 2014; Springer International Publishing: Berlin/Heidelberg, Germany, 2014; pp. 346–361. [Google Scholar] [CrossRef]
  24. Girshick, R.B. Fast R-CNN. arXiv 2015, arXiv:1504.08083. [Google Scholar]
  25. Ren, S.; He, K.; Girshick, R.B.; Sun, J. Faster R-CNN: Towards Real-Time Object Detection with Region Proposal Networks. arXiv 2015, arXiv:1506.01497. [Google Scholar] [CrossRef] [PubMed]
  26. Lin, T.; Dollár, P.; Girshick, R.B.; He, K.; Hariharan, B.; Belongie, S.J. Feature Pyramid Networks for Object Detection. arXiv 2016, arXiv:1612.03144. [Google Scholar]
  27. Redmon, J.; Divvala, S.; Girshick, R.; Farhadi, A. You Only Look Once: Unified, Real-Time Object Detection. In Proceedings of the IEEE Conference on Computer Vision and Pattern Recognition (CVPR), Las Vegas, NV, USA, 27–30 June 2016. [Google Scholar]
  28. Liu, W.; Anguelov, D.; Erhan, D.; Szegedy, C.; Reed, S.; Fu, C.Y.; Berg, A.C. Ssd: Single shot multibox detector. In Proceedings of the Computer Vision—ECCV 2016: 14th European Conference, Amsterdam, The Netherlands, 11–14 October 2016; Part I. Springer: Berlin/Heidelberg, Germany, 2016; Volume 14, pp. 21–37. [Google Scholar]
  29. Lin, T.Y.; Goyal, P.; Girshick, R.; He, K.; Dollár, P. Focal loss for dense object detection. In Proceedings of the IEEE International Conference on Computer Vision, Venice, Italy, 22–29 October 2017; pp. 2980–2988. [Google Scholar]
  30. Zhou, X.; Wang, D.; Krähenbühl, P. Objects as Points. arXiv 2019, arXiv:1904.07850. [Google Scholar]
  31. Yang, Z.; Liu, S.; Hu, H.; Wang, L.; Lin, S. RepPoints: Point Set Representation for Object Detection. arXiv 2019, arXiv:1904.11490. [Google Scholar]
  32. Ding, J.; Xue, N.; Long, Y.; Xia, G.S.; Lu, Q. Learning RoI transformer for oriented object detection in aerial images. In Proceedings of the IEEE/CVF Conference on Computer Vision and Pattern Recognition, Long Beach, CA, USA, 16–17 June 2019; pp. 2849–2858. [Google Scholar]
  33. Xie, X.; Cheng, G.; Wang, J.; Yao, X.; Han, J. Oriented R-CNN for object detection. In Proceedings of the IEEE/CVF International Conference on Computer Vision, Montreal, BC, Canada, 11–17 October 2021; pp. 3520–3529. [Google Scholar]
  34. Yang, X.; Yang, X.; Yang, J.; Ming, Q.; Wang, W.; Tian, Q.; Yan, J. Learning high-precision bounding box for rotated object detection via kullback-leibler divergence. Adv. Neural Inf. Process. Syst. 2021, 34, 18381–18394. [Google Scholar]
  35. Hou, L.; Lu, K.; Yang, X.; Li, Y.; Xue, J. G-Rep: Gaussian Representation for Arbitrary-Oriented Object Detection. Remote Sens. 2023, 15, 757. [Google Scholar] [CrossRef]
  36. Li, W.; Zhu, J. Oriented RepPoints for Aerial Object Detection. arXiv 2021, arXiv:2105.11111. [Google Scholar]
  37. Zhang, Z.; Guo, W.; Zhu, S.; Yu, W. Toward Arbitrary-Oriented Ship Detection With Rotated Region Proposal and Discrimination Networks. IEEE Geosci. Remote Sens. Lett. 2018, 15, 1745–1749. [Google Scholar] [CrossRef]
  38. Yang, R.; Pan, Z.; Jia, X.; Zhang, L.; Deng, Y. A Novel CNN-Based Detector for Ship Detection Based on Rotatable Bounding Box in SAR Images. IEEE J. Sel. Top. Appl. Earth Obs. Remote Sens. 2021, 14, 1938–1958. [Google Scholar] [CrossRef]
  39. Yue, T.; Zhang, Y.; Wang, J.; Xu, Y.; Liu, P.; Yu, C. A Precise Oriented Ship Detector in SAR Images Based on Dynamic Rotated Positive Sample Mining. IEEE J. Sel. Top. Appl. Earth Obs. Remote Sens. 2023, 16, 10022–10035. [Google Scholar] [CrossRef]
  40. Sun, Y.; Wang, Z.; Sun, X.; Fu, K. SPAN: Strong Scattering Point Aware Network for Ship Detection and Classification in Large-Scale SAR Imagery. IEEE J. Sel. Top. Appl. Earth Obs. Remote Sens. 2022, 15, 1188–1204. [Google Scholar] [CrossRef]
  41. Ge, Z.; Liu, S.; Li, Z.; Yoshie, O.; Sun, J. OTA: Optimal Transport Assignment for Object Detection. arXiv 2021, arXiv:2103.14259. [Google Scholar]
  42. Kim, K.; Lee, H.S. Probabilistic Anchor Assignment with IoU Prediction for Object Detection. arXiv 2020, arXiv:2007.08103. [Google Scholar]
  43. Zhou, G.; Wu, G.; Zhou, X.; Xu, C.; Zhao, D.; Lin, J.; Liu, Z.; Zhang, H.; Wang, Q.; Xu, J.; et al. Adaptive model for the water depth bias correction of bathymetric LiDAR point cloud data. Int. J. Appl. Earth Obs. Geoinf. 2023, 118, 103253. [Google Scholar] [CrossRef]
  44. Rezatofighi, H.; Tsoi, N.; Gwak, J.; Sadeghian, A.; Reid, I.; Savarese, S. Generalized intersection over union: A metric and a loss for bounding box regression. In Proceedings of the IEEE/CVF Conference on Computer Vision and Pattern Recognition, Long Beach, CA, USA, 16–17 June 2019; pp. 658–666. [Google Scholar]
  45. Butt, M.A.; Maragos, P. Optimum design of chamfer distance transforms. IEEE Trans. Image Process. 1998, 7, 1477–1484. [Google Scholar] [CrossRef] [PubMed]
  46. Zhang, T.; Zhang, X.; Li, J.; Xu, X.; Wang, B.; Zhan, X.; Xu, Y.; Ke, X.; Zeng, T.; Su, H.; et al. SAR ship detection dataset (SSDD): Official release and comprehensive data analysis. Remote Sens. 2021, 13, 3690. [Google Scholar] [CrossRef]
  47. Xu, Y.; Fu, M.; Wang, Q.; Wang, Y.; Chen, K.; Xia, G.S.; Bai, X. Gliding Vertex on the Horizontal Bounding Box for Multi-Oriented Object Detection. IEEE Trans. Pattern Anal. Mach. Intell. 2021, 43, 1452–1459. [Google Scholar] [CrossRef] [PubMed]
  48. Tian, Z.; Shen, C.; Chen, H.; He, T. FCOS: Fully Convolutional One-Stage Object Detection. arXiv 2019, arXiv:1904.01355. [Google Scholar]
  49. Han, J.; Ding, J.; Li, J.; Xia, G.S. Align deep features for oriented object detection. IEEE Trans. Geosci. Remote Sens. 2022, 60, 1–11. [Google Scholar] [CrossRef]
  50. Yang, X.; Liu, Q.; Yan, J.; Li, A. R3Det: Refined Single-Stage Detector with Feature Refinement for Rotating Object. arXiv 2019, arXiv:1908.05612. [Google Scholar] [CrossRef]
Figure 1. The model structure It consists of the FPN backbone network, scattering point extraction and matching evaluation, adaptive sample selection, and shared header for reppoints generation. Additionally, L s . c indicates the spatial constraint loss, L l o c indicates the localization loss, and L s . I n i t indicates the SPG learning loss.
Remotesensing 16 00933 g001
Figure 2. The extracted scattering points(red color) and their clustered results(different colors). (ac) The extracted scattering points from the ships. (df) The scattering points after clustering.
Remotesensing 16 00933 g002
Figure 3. SPG learning. After alignment via GT bounding boxes, Gaussian distribution is employed to fit the scattering points and initialize reppoints, followed by computing the KLD loss, achieving supervised-guided learning.
Remotesensing 16 00933 g003
Figure 4. A comparison of methods for nearshore detection. The red, yellow, and green circles represent false positives, misses, and correct detections, respectively. (a) Ground truth. (b) Fcos. (c) R3det. (d) Oriented-rcnn. (e) Rotated-retinanet. (f) Roi-trans. (g) S2anet. (h) Our method.
Remotesensing 16 00933 g004
Figure 5. Model parameters and their flops against mAP, the red star represents the performance of our method. (a) Model parameters against mAP. (b) Model flops against mAP.
Remotesensing 16 00933 g005
Figure 6. The impact of SPG-ASS on the correlation between the classification confidence and localization score of oriented reppoints. (a) Without SPG-ASS. (b) With SPG-ASS.
Remotesensing 16 00933 g006
Figure 7. Nearshore detection comparison. (a,d) Ground truth. (b,e) Without SPG-ASS. (c,f) With SPG-ASS. The red, yellow, and green represent false positives, misses, and correct detections, respectively.
Remotesensing 16 00933 g007
Figure 8. Visualization of the confidence heatmaps, the gradient from blue to red represents the increasing level of attention focus. (a,d) Ground truth. (b,e) Without SPG learning. (c,f) With SPG learning.
Remotesensing 16 00933 g008
Figure 9. Nearshore detection comparison. (a,d) Ground truth. (b,e) Without SPG learning. (c,f) With SPG learning. The red circles indicate false detections, green circles indicate correct detections, while the yellow circles indicate missed detections.
Remotesensing 16 00933 g009
Figure 10. The detection results of our proposed method. (ac) Ground truth in the SAR image. (df) The detection results from our proposed method.
Remotesensing 16 00933 g010
Figure 11. Ship detection results of Sentinel-1 SAR image. Areas 1, 2, and 3 represent mixed scenes, offshore scenes, and nearshore scenes, respectively. Subplots (AC) are the detection results of oriented_rcnn for the three areas, and subplots (DF) are the detection results of our method. Red circles indicate false detections, and yellow circles indicate missed detections.
Remotesensing 16 00933 g011
Table 1. Comparison with state-of-the-art methods (SSDD).
MethodBackbonemAPRecallParams (M)Flops (GFLOPs)
NearshoreOffshoreTotalNearshoreOffshoreTotal
Oriented-rcnnR-50-FPN0.7940.9060.9020.8470.9630.93441.13198.53
Rotated-faster-rcnnR-50-FPN0.7760.9040.8960.8240.9630.92941.12198.40
Roi-transR-50-FPN0.7030.9030.8930.7790.9430.90255.03200.41
Rotated-retinanetR-50-FPN0.6290.9040.8640.7630.9450.90036.13209.58
Gliding-vertexR-50-FPN0.7030.9030.8920.7630.9350.89341.13198.40
FcosR-50-FPN0.6680.9040.8100.7400.9380.88931.89206.20
S2anetR-50-FPN0.6800.8970.8040.7860.9280.89338.54196.21
KldR-50-FPN0.6930.9040.8920.7710.9550.91036.13229.95
R3detR-50-FPN0.6910.9060.8900.7400.9650.91041.58328.70
Oriented reppoints (baseline)R-50-FPN0.7470.9040.8950.8630.9650.94036.60171.70
Our methodR-50-FPN0.7800.9040.8980.8850.9630.94436.60171.70
Table 2. Comparison with state-of-the-art methods (Hrsid).
MethodBackbonemAPRecallParams (M)Flops (GFLOPs)
NearshoreOffshoreTotalNearshoreOffshoreTotal
Oriented-rcnnR-50-FPN0.5430.9050.7810.6700.9570.83041.13198.53
Rotated-faster-rcnnR-50-FPN0.5230.9010.7740.6390.9550.81541.12198.40
Roi-transR-50-FPN0.5210.9060.7740.6680.9530.82755.03200.41
Rotated-retinanetR-50-FPN0.4810.9030.6890.6320.9450.81236.13209.58
Gliding-vertexR-50-FPN0.5090.9030.7090.6280.9340.79941.13198.40
FcosR-50-FPN0.3830.9030.6960.5440.9540.77231.89206.20
S2anetR-50-FPN0.4930.9050.7590.6450.9490.81438.54196.21
KldR-50-FPN0.5060.9040.7760.7710.9690.84436.13229.95
R3detR-50-FPN0.4630.9040.7080.6050.9350.78941.58328.70
Oriented reppoints (baseline)R-50-FPN0.5320.9050.7630.6690.9550.84036.60171.70
Our methodR-50-FPN0.5680.9060.8080.8100.9630.86936.60171.70
Table 3. Ablation experiments.
SPG-ASSSPG LearningMap (Nearshore) ↑Recall (Nearshore) ↑
I 0.7470.863
II 0.7600.878
III 0.7630.865
IV0.7800.885
Table 4. Details of SAR images.
SatelliteCenter (Longitude/Latitude)Scene Date (UTC)Imaging ModeResolutionBandPolarization
Sentinel-1122.147°/29.369°12 May 2019 09:53:10.579856IW13.957 mCVH
Disclaimer/Publisher’s Note: The statements, opinions and data contained in all publications are solely those of the individual author(s) and contributor(s) and not of MDPI and/or the editor(s). MDPI and/or the editor(s) disclaim responsibility for any injury to people or property resulting from any ideas, methods, instructions or products referred to in the content.

