Abstract
The second-largest wildfire in the history of South Korea occurred in 2022 due to strong winds and dry climates. Quantitative evaluation of soil erosion is necessary to prevent subsequent sediment disasters in the wildfire areas. The erosion rates in two watersheds affected by the wildfires were assessed using the revised universal soil loss equation (RUSLE), a globally popular model, and the soil erosion model for mountain areas (SEMMA) developed in South Korea. The GIS-based models required the integration of maps of the erosivity factor, erodibility factor, length and slope factors, and cover and practice factors. The rainfall erosivity factor considering the 50-year and 80-year probability of rainfall increased from coastal to mountainous areas. For the LS factors, the traditional version (TV) was initially used, and the flow accumulation version (FAV) was additionally considered. The cover factor of the RUSLE and the vegetation index of the SEMMA were calculated using the normalized difference vegetation index (NDVI) extracted from Sentinel-2 images acquired before and after the wildfire. After one year following the wildfire, the NDVI increased compared to during the year of the wildfire. Although the RUSLE considered a low value of the P factor (0.28) for post-fire watersheds, it overestimated the erosion rate by from 3 to 15 times compared to the SEMMA. The erosion risk with the SEMMA simulation decreased with the elapsed time via the vegetation recovery and stabilization of topsoil. While the FAV of RUSLE oversimulated by 1.65~2.31 times compared to the TV, the FAV of SEMMA only increased by 1.03~1.19 times compared to the TV. The heavy rainfall of the 50-year probability due to Typhoon Khanun in 2023 generated rill and gully erosions, landslides, and sediment damage in the post-fire watershed on forest roads for transmission tower construction or logging. Both the RUSLE and SEMMA for the TV and FAV predicted high erosion risks for disturbed hillslopes; however, their accuracy varied in terms of the intensity and extent. According to a comparative analysis of the simulation results of the two models and the actual erosion situations caused by heavy rain, the FAV of SEMMA was found to simulate spatial heterogeneity and a reasonable erosion rate.
1. Introduction
Recently, the history of large-scale wildfires around the world is being rewritten. The 2020 Australian wildfire was recorded as one of the largest wildfires in the world, with a damaged area of 18.6 million hectares [1,2]. Another the mega wildfire occurred in Canada in 2023, damaging a total of 18.5 million hectares [3]. The main natural causes of these expanded wildfires were extreme weather events such as lightning strikes, prolonged drought, high temperatures, heat waves, and strong winds [4,5,6]. The severity of international large-scale wildfires due to climate change has increased extraordinarily since entering the 21st century [7,8,9,10], and it is predicted that it will become more serious in the future [11]. Although it was relatively small compared to the scale of global wildfires, the second-largest wildfire in Korean history occurred in Uljin in 2022 [12]. Large-scale wildfires increase toxicity and carbon dioxide emissions and deteriorate soil, water, and air quality in remote areas [2]. Furthermore, if heavy rain occurs in wildfire areas, the risk of flooding increases, and it is difficult to avoid subsequent sediment disasters as a result of excessive erosion and landslides [13,14]. However, the intensity and frequency of extreme rainfalls are expected to increase further as large-scale wildfires gradually increase due to climate change [15,16,17].
The most frequently used model for assessing soil erosion risk in large-scale wildfire areas is the GIS-based RUSLE, which has been developed in conjunction with remote sensing technologies [18,19,20]. Among the vegetation indices extracted from satellite images, the normalized difference vegetation index (NDVI), computed from the red and near-infrared bands, is a highly utilized indicator and can reflect the recovery of post-fire vegetation. [21,22,23,24,25]. Although the revised universal soil loss equation (RUSLE) is an old empirical model developed based on agricultural lands [26], it has been continuously used to estimate soil erosion in large-scale forest areas by using the NDVI extracted from satellite images to calculate the cover factor with technologies of geospatial information [27,28,29,30,31,32,33,34]. To overcome local heterogeneity in parameters such as rainfall, soil, and vegetation, the soil erosion model for mountain areas (SEMMA) was developed using mountainous data measured in South Korea [35], and it showed a higher determination coefficient and Nash–Sutcliffe simulation efficiency compared to the RUSLE at the plot scale [36]. The SEMMA-Ic for large-scale application utilizes the digital elevation model (DEM), and the vegetation index of the NDVI was verified for applicability through comparison with monitoring data from a small watershed [37]. A simulation using the SEMMA-Ic predicted reasonable erosion rates and presented that soil erosion was predominantly increased in upper mountainous areas with steep slopes and silt loam with a shallow soil depth among fire-damaged areas [38]. However, there have been no comparative studies in which the SEMMA has been simultaneously applied to large-scale wildfire areas with the GIS-based RUSLE, which is highly utilized worldwide.
The Uljin watersheds damaged by wildfires in the dry spring urgently need their erosion risk to be assessed to prepare for flooding in the rainy summer because there are cities located in the lower reaches of the rivers. Suitable models are required to quantitatively evaluate the erosion to establish timely and phased strategies to reduce the erosion rate and sediment yield. The objectives of this study are as follows: (1) to estimate the erosion rates in two watersheds with the GIS-based RUSLE and SEMMA using satellite images sensed before and after the Uljin wildfire, (2) to identify the changes in erosion risks in the two watersheds before and after the wildfire, and (3) to present the applicability and improvement direction of the two models for wildfire watersheds through a comparative analysis of the simulation results of the two models, existing data measured in the wildfire areas, and the actual erosion situations caused by heavy rain.
2. Methodology
2.1. Study Area
The second-largest wildfire in the history of South Korea occurred in the Uljin and Samcheok areas in March 2022. The size damaged by the wildfire was 20,923 ha. The Uljin wildfire areas, located at 36°58′51″~37°08′43″N and 129°12′36″~25′53″E, are located in the eastern part of the Taebaek Mountain Range, South Korea (Figure 1). Before the wildfires, the dominant vegetation species was Pinus densiflora, which is vulnerable to fire in a monsoon climate and was distributed throughout the entire east coast region [39]. The parent rock in this area is mainly granite from the Early Late Proterozoic (Geo Big Data open platform) [40]. The main texture of the surface soil is sandy loam, according to the National Institute of Agricultural Sciences (NIAS). The soil order in the USDA soil taxonomy (1975) [41] is Inceptisols, and they have changed horizons and lost iron and aluminum, but they retain some weathering minerals [42]. The Uljin area, where the wildfire occurred in 2022, has a long-term record (1993–2022) of an average temperature of 12.9 °C and an annual precipitation rate of 1178.3 mm from the Korea Meteorological Administration (KMA). This area has a steep west-high and east-low topography between the East Sea and the Taebaek Mountains and is a place where orographic precipitation is frequently caused by the influence of the northeast air current. In spring (March to May), west winds are dominant due to the influence of mobile high pressure, and local winds which are hot, dry, and strong frequently blow due to the Foehn phenomenon. In the summer season (June to September), cold and humid east winds flow in under the influence of high pressure in the Sea of Okhotsk, and precipitations occur frequently due to the influence of northeast air currents based on the KMA.
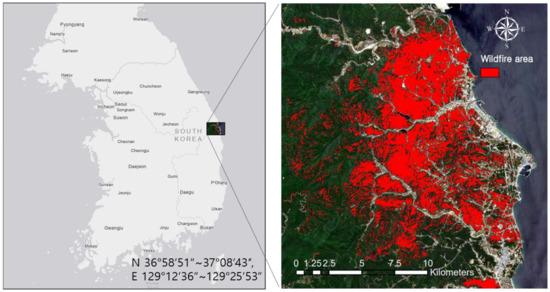
Figure 1.
Maps of the location and wildfire damages highlighted by a red box in Uljin and Samcheok areas.
The wildfires predominantly occurred at elevations between 50 m and 300 m. The area damaged by the wildfires in the Bugucheon watershed was 24.6 km2, accounting for 45.1% of the total area. The Namdaecheon watershed, with a damaged area of 34.4 km2 and 27.0%, showed a smaller wildfire intensity than the Bugucheon watershed. The rainfall measurement stations and mountainous tops are depicted in the topographic map in Figure 2. As shown in the wildfire evidence photos (①–⑧) in Figure 2, the mountain ridges dominated by Pinus densiflora at an elevation of 100 m~300 m were damaged by the crown fire that burned even the tops of the trees. The middle hillslopes showed a stem fire, with charred trunks of trees. The lower slopes near the river, where many oak trees live, had relatively less fire damage than the upper slopes, where many pine trees live. As indicated on the map in Figure 2, there are three rainfall observation points at distances of approximately 10 km within the study area. The two points located in Sogok and Jukbyeon are the automatic weather system (AWS), and the one point located in Uljin is the meteorological station (MS).
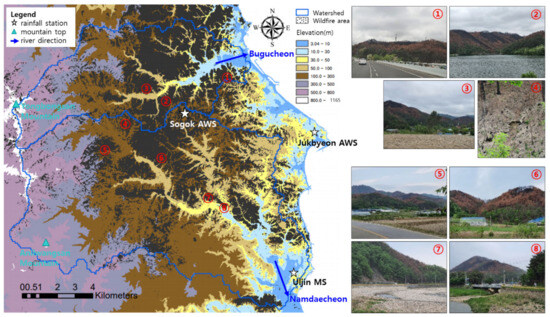
Figure 2.
Topographical characteristics of the basins and field evidence photos (①–⑧) of the wildfire damage within the watersheds of Bugucheon River and Namdaecheon River in May 2022 after the wildfire. AWS stands for automatic weather system, and MS is short for meteorological station.
The Uljin region affected by wildfire includes the two watersheds of the Bugucheon River and Namdaecheon River (Figure 2). The area and stream length of the Bugucheon watershed are 54.6 km2 and 9.4 km, respectively. The area and stream length of the Namdaecheon watershed are 127.5 km2 and 12.0 km, respectively. The watersheds have a west-high and east-low topography. Yongbongsan Mountain (999.7 m) and Anilwangsan Mountains (819.3 m) are to the west, so the rivers generally flow from west to east. The slope is steep along the ridges at the top of the mountain, and the slope becomes gentler toward the outlets of the basins, so farmlands and villages have formed around the river, and cities are located in the estuaries. According to the slope analysis of the DEM, the mean slopes of the Bugucheon and Namdaecheon watersheds are 25.5° ± 12.3° and 22.1° ± 12.4°, respectively. The steep slopes (>15°) in the Bugucheon watershed accounted for 79.5% of the total area, which was greater than that (70.5%) in the Namdaecheon watershed (Table 1). These rivers are typical mountain rivers with steep river slopes, high flow velocities, short concentration times of peak flow, and a high risk of flooding. Therefore, flash floods can transport a lot of bed loads as well as suspended loads, so the risk of sediment disasters increases rapidly [43,44].

Table 1.
Area ratios of Bugucheon and Namdaecheon watersheds according to slope gradient classification.
2.2. Soil Erosion Models
2.2.1. RUSLE and SEMMA
The empirical model known as the universal soil loss equation (USLE) has been widely used as an erosion prediction technology for soil conservation. Many researchers have developed the USLE from over 10,000 plots to measure runoff and soil erosion [45]. The revised universal soil loss equation (RUSLE), at the plot-to-hillslope scale, is applied to estimate soil erosion over extended areas and in different contexts, including forests, rangeland, and disturbed areas [26]. The RUSLE has more flexibility in modelling erosion in new conditions and is more efficient than the USLE. The GIS-based RUSLE was used to quantify the soil loss by using rainfall, soil, a DEM, and satellite image datasets as input parameters.
The RUSLE and USLE are multiplicative relationships, as shown in Equation (1).
where is the mean annual soil loss, is the rainfall erosivity factor, is the soil erodibility factor, is the slope length and steepness factor, is the cover factor, and is erosion control practice factor.
The RUSLE has limited applications in other areas with different climates, topographies, soils, and cover conditions. To overcome the local heterogeneity of the RUSLE, the SEMMA was developed in South Korea using soil loss data from mountain slopes caused by a single period of heavy rain [35]. This model has been applied not only to natural mountain areas but also to areas with rapid changes in the mountain environment such as wildfires, logging, landslides, and slope management. The model was improved to the SEMMA-Ic to enable it to be applied to large-scale mountainous areas using satellite images and a DEM [37], as shown in Equation (2).
where is the sediment yield (g/m2) from the hillslopes, is the rainfall factor consisting of the rainfall energy and maximum rainfall intensity for 30 min, is the vegetation index calculated from the NDVI, is the soil factor considering the coarse stone and soil depth, is the topography factor extracted from a DEM, is a coefficient, and are the exponents.
The basic model of the SEMMA [35] consists of eight multiple regression functions according to the ranges of rainfall and vegetation coverage. The heavy rain condition designated the probability of rainfall in the Gangneung area with a 50-year frequency over 24 h. The average annual rainfall in the Uljin area is less than that in the Gangneung area, where the SEMMA was developed, and the probable rainfall is also relatively small. The probable rainfall with a 50-year frequency in the Uljin area is 270 mm. Therefore, the multiple regression equations are presented in Table 2, considering the heavy rain conditions of the SEMMA-Ic model. Equations (3) and (4) are equations classified according to whether the vegetation index Ic is greater or less than 0.7. Under the conditions of the vegetation index Ic being less than 0.7, the exponent of the topography factor, To, shows a negative value. This result is generated by decreasing surface runoff and increasing subsurface flow on steeper forested hillslopes [35,46,47]. When precipitation exceeds the infiltration capacity of the surface, the soil loss increases generally with the length and incline of the slope as rills develop along with the increase in overland flow accumulated with the length of the slope. A multiple regression model undivided by the vegetation index is presented in Equation (5). Since the equation shows a higher determination coefficient, Equation (5) was used to estimate the erosion rate in this study.
Table 2.
Multiple regression models of SEMMA-Ic corrected with an interval of rainfall depth (>270mm) and vegetation index (≤0.7 or >0.7).
The RUSLE and SEMMA were simulated in a GIS environment using the Arc GIS 10.7 platform. Each model parameter was acquired in the form of a digital map, and the erosion rate was estimated on a cell-by-cell basis.
2.2.2. Rainfall Erosivity Factor
The rainfall erosivity factors used in the RUSLE and SEMMA were calculated from the equations of the relationships between the rainfall kinetic energy and rainfall intensity. The RUSLE uses an exponential function developed by Brown and Foster (1987) [48], as shown in Equation (6). The SEMMA adopts the exponential equation of Van Dijk et al. (2002) [49], who integrated and analyzed data measured around the world, as shown in Equation (7).
where is the rainfall energy in J/m2, is the average intensity of the storm in mm/h, and is the rainfall depth in mm.
The erosivity factor of the RUSLE and SEMMA is calculated by the following Equation (8).
where is the maximum rainfall intensity for 30 min in mm/h. is the rainfall erosivity factor (J h/m) in the SEMMA.
The soil erosion caused by a few large events of rainfall accounts for the high percentage of a common number of events [50]. According to a watershed monitoring study by Shin et al. (2013) [44], the erosion caused by a single extreme rainfall event accounted for 93% of the total erosion over a five-year period. When designing a grit chamber and retention basin, it is recommended to consider recent increases in rainfall and reflect a design frequency of 50 years or more from the past 30-year frequency. As the magnitude of rainfall has recently increased, it is recommended to reflect the design with a 50-year frequency or more from the past 30-year frequency. The probability of rainfall in the Uljin area using the data from the KMA (1971–2020) were calculated by the Regional Frequency Analysis for Hydrological Data software (ver. 2020-09-17) [51]. The probable rainfalls for a 50-year and 80-year frequency were 274.3 mm and 295.6 mm per 24 h, respectively. Table 3 shows erosivity factors such as the rainfall depth, rainfall intensity, rainfall kinetic energy, and erosivity index used in the RUSLE and SEMMA. The rainfall erosivity factor of the SEMMA was 5.4% larger than that of RUSLE and was actually 64.5% larger considering an exponent of 1.073 in Equation (5).
Table 3.
Erosivity factors for probability of rainfall with 50-year and 80-year frequency.
2.2.3. Cover and Practice Factors
The cover factor of the RUSLE and the vegetation index of the SEMMA were extracted from satellite images. The satellite images with a 10 m resolution were acquired, as shown in Figure 3, to identify the vegetation cover before and after the Uljin wildfire in March 2022. Information on the location and scale of the wildfire damage was obtained from the images from 2021 and 2022. From the changes in the images from 2022 and 2023, it is possible to understand the recovery and secondary management of the vegetation after the wildfire. The NDVI is an index that evaluates the vitality of vegetation using the property that plant leaves reflect more near-infrared rays than soil [52]. Its value varies between -1 and 1, where low values can be found at water bodies, in bare soil, and in built-up areas. The NDVI is positively corrected with the amount of green biomass, so it can be used to give an indication of the differences in green vegetation coverage.
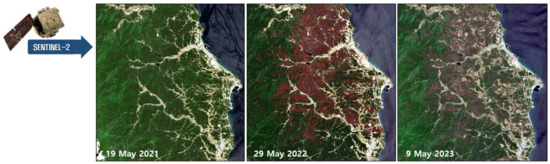
Figure 3.
Sentinel-2 images of the Uljin area before, during the year of, and one year after the wildfire.
The NDVI distributions extracted from the Sentinel-2 satellite images shown in Figure 3 are shown in Figure 4. There is a clear difference in the distribution in the Bugucheon and Namdaecheon watersheds before, during the year of, and one year after the Uljin wildfire. The NDVI for the post-fire images in 2022 and 2023 was similar, ranging from −0.15 to 0.74. The values for the pre-fire image in 2021 showed a wider range from -0.58 to 0.94. The minimum value for the seas and lakes and the maximum values for the forest areas should be in a similar range before and after the wildfire. The NDVI for 2021 was corrected based on the minimum and maximum values in 2022.
where denotes the reconstructed data, represents the observed data, represents the based data, and and are the maximum value and minimum value, respectively. This method is similar to data assimilation, in that the noisy time series are reconstructed by the background data and observed data with the weights [53].
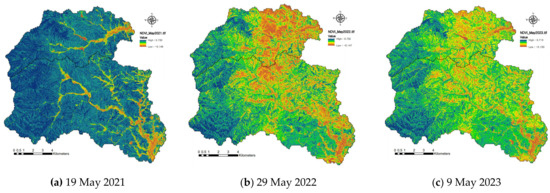
Figure 4.
NDVI changes in Bugucheon and Namdaecheon watersheds in 2021 before (a), in 2022, during the year of (b), and in 2023, one year (c) after the Uljin wildfire.
Most of the pre-wildfire mountainous areas showed high values of the NDVI (>0.6), except for rivers, cities, bare land, and non-vegetation areas. (Figure 4a). However, the areas affected by a high fire intensity showed low NDVI values of less than 0.2 and were similar to those of bare land (Figure 4b). The NDVI values one year after the wildfire increased compared to those in the year of the wildfire (2022), as shown in Figure 4c. Despite the anthropogenic disturbance caused by logging operations, the vegetation was observed to regenerate rapidly in the burned areas.
The cover factor, C, of the RUSLE can be calculated using the exponential function for the NDVI, as shown in the following equation:
where and are parameters that determine the shape of the NDVI-C curve. An value of 2 and a value of 1 seem to give reasonable results, according to the study by Van der Knijff et al. (1999) [28].
The vegetation index in the SEMMA was obtained from the relationship between Ic and the NDVI using a contrast-stretching method [35,37]. The function obtained from the Sentinel-2 satellite images is as follows:
where the values of Ic have to be at least greater than 0.04 and, at most, less than 1.0. The range of Ic values calculated using the above NDVI was from −0.07 to 0.85, and values less than 0.04 were corrected to the standard value.
The practice factor of the RUSLE and the correction factor of the vegetation index utilize the land use map. The P factor, improved by Tian et al. (2021) [54], provides information for not only agricultural areas but also for mountainous and hilly areas. The correction factors in the SEMMA follow P factors for the land use of cities, wetlands, and water (Table 4). The vegetation index of the SEMMA reflects correction factors for city-, wetland-, and water-based P factors.
Table 4.
P factors in RUSLE and correction factors in SEMMA according to land use.
2.2.4. Soil Factor
As the content of silt and sand increases, the erodibility of soil increases. In contrast, if the content of clay with a high adhesion and chemical bonding increases, the erodibility of the soil decreases [55,56]. The critical shear velocity that affects the detachment and transport of soil particles is minimum for a soil particle diameter of around 0.2 mm and increases with increasing particle size [57]. The soil texture with regard to the proportion of sand, silt, and clay-sized particles is an important parameter for soil erodibility.
In the RUSLE, the erodibility factor, , considers organic matter, the soil structure, and the permeability of the soil as well as the soil texture. Organic matter reduces soil erodibility because it reduces soil detachment and increases infiltration. The nomograph for soil erodibility [46] consists of soil profile parameters, as shown in Equation (12).
where is the soil erodibility (t/ac/unit R), is the content of organic matter (%), is the ratio of the particle size fractions, is the structure index (1 to 4), and is the permeability index (1 to 6). M is a function of the primary particle size fractions and is given by Equation (13).
where is the percentage of silt (%), is the percentage of very fine sand (%), and is the percentage of clay (%).
Since coarse stones beneath the surface decrease infiltration rates and increase erosion, (mm/h), which is the permeability index for the fine soil fraction with less than 2 mm soil permeability, was recalculated by (mm/h) using Equation (14) [58].
where is the ratio of coarse fragments > 2 mm.
Additionally, for samples with an organic matter content higher than 4%, an upper limit equal to this value was imposed according to the nomograph restrictions. Since the surface stone cover () reduces soil erodibility, i.e., the sediment yield [59], its effect was also incorporated by using Equation (15) [60].
where is the correction factor. The final value of was recalculated by multiplying it by the correction factor.
In particular, mountainous areas have a higher content of coarse stones, making them more resistant to erosion than agricultural lands [61]. Coarse stones, which have a high shear resistance and protect fine soil, reduce soil erosion. The soil ratio index in the SEMMA was defined as the relative ratio of fine soils to coarse stones [35].
where is the soil ratio index, and means the ratio of fine soils less than 2 mm.
Organic material, such as leaves and twigs of trees, the litter layer, and organic matter in forest areas, is converted to ash by fire. The permeable material that retains water on the ground decreases with the combustion of the litter layer and organic matter. These organic components contribute to reducing soil erosion [62,63]. The depth of permeable soil related to the growth of plants may increase infiltration and subsurface flow [35,64]. However, soils in wildfire-prone terrain have generally shallow depths on low-permeability bedrock [65]. The shallow depth reduces rainfall infiltration and increases surface runoff and soil erosion [66]. Therefore, the erodibility of mountainous soils is proportional to the mean size and ratio index of the surface soil and is inversely proportional to the organic matter content and soil depth, as shown in Equation (17).
where is a dimensionless variable, since indicates the mean size of surface soil (mm), is the soil ratio index, is the ratio of organic matter, and represents the soil depth (mm).
The soil maps (1:25,000) provided by the National Institute of Agricultural Sciences and Rural Development Administration [67] were used to calculate the subfactors of the soil. NIAS offered information on the soil texture, stone content, and effective soil depth, as shown in Figure 5. The surface soil was mostly sandy loam in the mountain hillslopes and loam in the deposition zones and agricultural land, as shown in Figure 5a. As shown in Figure 5b, soils with a stone content of more than 15% occupied the widest range. The stone content in the high-elevation areas was over 40%. The soil depth decreased from 1.0 m to 0.2 m with the increase in altitude (Figure 5c). Wildfires burn not only the vegetation coverage but also the layers of litter and organic matter covering the ground surface. However, the changes in the organic matter content of the soil due to the fire were not significant according to the analysis of the field data. The content of organic matter in this study was estimated by the multiple regression equation from the data measured in the wildfire area [35,37]. The new equation considers the bulk density and soil depth, as shown in the following Equation (18):
where is the dry bulk density of the soil (g/cm3) according to the soil texture.
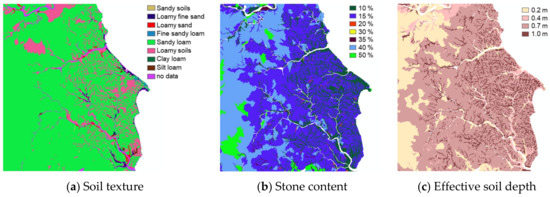
Figure 5.
Distribution maps for soil texture (a), stone content (b), and effective soil depth (c).
2.2.5. Topography Factor
Generally, the steeper and longer a slope is, the more susceptible it is to soil erosion. The LS factor, a topographical component in the RUSLE, consists of the L factor of the slope length [45] and the S factor of the slope steepness [68,69,70] in the following traditional version (TV):
where is the slope length (m), is a variable slope length exponent, 22.13 is the length (m) of a standard erosion plot, and is the slope angle, which is based on an evaluation of data from disturbed lands with slopes of up to 84%.
The exponent m of the length factor is related to the ratio of rill to inter-rill erosion [69,70,71].
For soils that are classified as being moderately susceptible to erosion, McCool et al. (1989) [70] proposed the slope exponent addressed by Equation (21).
The slope exponent, , is a function of the slope angle. In the RUSLE, the soils are classified into low, moderate, and high susceptibility according to the ratio of rill erosion to inter-rill erosion. Wildfire areas have a low susceptibility because the surface soil is not directly disturbed by physical activities such as cultivation and construction. Rill and gully erosion in even post-fire land as well as in forested land are frequently observed to be less than those in agricultural and developed lands [72,73,74]. Post-fire soils with a low susceptibility to rill erosion use a value of β that is defined by half that given by Equation (20). This model considers the exponents for rangeland and pasture, where the ratio of rill to inter-rill erosion is low [26].
In the RULSE, the LS factor was improved in order to obtain an accurate derivation from a digital elevation model [75]. The RUSLE has attempted several times to simulate watershed erosion using the flow accumulation versions (FAVs) [76,77,78,79] along with the earlier TV [18,45,54]. The LS of the TV in Equation (19) considers erosion by rainfall within a standard plot [45]. Another LS version that was used to assess erosion from flow accumulated along the flow direction, as presented by Moore and Burch (1986) [76], is presented as follows:
where Flow accumulation represents the contribution of an area accumulated upslope for a given cell, and Cell size is the size of the grid cell (m).
The length factor in the SEMMA [30] takes into account the 10 m standard length of experimental plots established in fields, and the slope factor is the same as that in the USLE. The topological factor (To) in the SEMMA, calculated by the multiple of slope factor and length factor (LS), is identical to that in the RUSLE. Basically, the erosion rate in bare soil increases along with the increase in the slope and length [68,69,70,71]. However, on natural hillslopes, the erosion rate decreases frequently with the increase in the steepness and length of the slope due to increased depression storage, the roughness coefficient, infiltration, and the underground flow rate [64,80]. This is the reason for the exponent of the topography factor, To, receiving a negative value in Equation (3) of the SEMMA, when the vegetation index, Ic, is less than 0.7. Equation (5) used in this study considered an exponent of 0.375 for the topography factor To. In other words, the erosion rate of the SEMMA responds less sensitively than the topography factor of the RUSLE.
A DEM (digital elevation model) with a 10 m grid was generated from digital topographic maps (1:5000) provided by the National Geographic Information Institute (NGII). The slope angles extracted from the DEM were used to estimate the length–slope factor and the topography factor. The watershed boundaries and flow accumulation were determined using the process of watershed delineation in the hydrology function of ArcToolbox.
2.2.6. Simulation of Models
The distribution maps of the rainfall erosivity factor, R, shown in Figure 6 and Figure 7, were an interpolation of rainfall data from the five weather stations of Donghae, Bonghwa, Taebaek, and Uljin-Jeongok, including the Uljin MS. As a result of the fact that the probability of rainfall in the northwest mountainous areas was greater than that in the coastal areas surrounding the Uljin MS, indicated in the map in Figure 2, the rainfall erosivity factor (R) increased from the coastal to the mountainous areas.
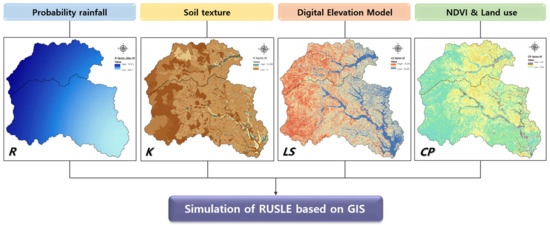
Figure 6.
Simulation processes of RUSLE based on GIS using main factor maps. R is the rainfall erosivity factor, K is the erodibility factor, LS is the length and slope factors, and CP is the cover and practice factors.
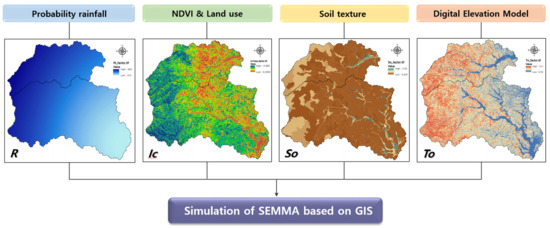
Figure 7.
Simulation processes of SEMMA based on GIS using main factor maps. R is the rainfall erosivity factor, Ic is the vegetation index considering correction factor, So is the soil factor, and To is the topography factor.
The rainfall erosivity factor determined by Brown and Foster (2002) [48] was in the range from 392.1 to 666.2 J/m/h for a 50-year and 80-year probability of rainfall. The distribution of the soil erodibility factor, K, showed small values in areas with a high stone content above a 500 m altitude and high values of 0.50 t/ha/unit R in agricultural lands near waterside. The slope and length factors (LS) are dependent on the slope angle and showed a range from 0.03 to 9.34. The cover and practice factor (CP) followed the following order: bare land > agricultural land > wildfire area > forest land. The erosion rate of the RUSLE was simulated using Equation (1) based on GIS, as shown in Figure 6.
The rainfall erosivity factor determined by van Dijk et al. (2002) [49] was in the range from 414.0 to 700.8 and was generally bigger than that determined by Brown and Foster (1987) [38], as shown in Figure 6 and Figure 7. The vegetation index (Ic) considering that the correction factor was in the range from 0.0002 to 0.860 and showed similar low values in intense wildfire areas, urban areas, and water. The soil factor (So) in the range from 0.042 to 2.53 followed the following order: agricultural land > ridge of mountain > forest hillslope. The topography factor (To) showed a range from 0.03 to 15.1 and a similar distribution to that of the slope and length factors (LS). The SEMMA simulation, which used Equation (5), was carried out through the processes employing GIS tools, as shown in Figure 7.
3. Results
3.1. Estimation of Erosion Rate
The traditional versions of the RUSLE and SEMMA, which were used to assess the erosion rate for the wildfire watersheds, used Equation (19) to calculate the topographical indices. The simulations by the TVs of the RUSLE and SEMMA were evaluated for two watersheds and for two rainfall conditions with a 50-year and 80-year frequency of rainfall and for three NDVI conditions before, during the same year of, and one year after the wildfire. The Food and Agriculture Organization (FAO) of the United Nations [81] classified the degree of erosion into four levels: low erosion if less than 10 t/ha, moderate erosion if greater than 10 t/ha and less than 50 t/ha, high erosion if greater than 50 t/ha and less than 200 t/ha, and very high erosion if greater than 200 t/ha. The erosion rates estimated in this study were evaluated by the erosion degree of the FAO.
The simulation results of the RUSLE for a probability of rainfall with a 50-year and 80-year frequency showed that moderate erosion (>10 t/ha and <50 t/ha) extended over a wide area in the Bugucheon and Namdaecheon watersheds in 2022 and 2023 after the wildfire (Figure 8a,b). The level of high and very high erosion (>50 t/ha) increased with increasing the probability of rainfall and decreased from 2022 to 2023 after the fire. A very high erosion rate (>200 t/ha) was seen in developing bare slopes such as quarries, construction, and transmission towers and on the artificial bare slopes of roadsides and riversides as well as steep hillslopes damaged significantly by the wildfire. As a result of an RUSLE simulation for a basin in Attica, eastern Greece [18], the post-fire erosion rate was significantly higher overall, ranging from 4.53 to 5.98 t/ha/yr, and areas disturbed by development showed higher erosion rates of 3.75~18.58 t/ha/yr. The RUSLE has shown high erosion rates (265 t/ha/yr) on steeper slope parts, even in non-fire watersheds [33]. The erosion rates estimated in the Uljin wildfire watersheds were relatively high, as more than 70% of the hillslopes are steep slopes. The erosion rate of the SEMMA, which is less susceptible to topographical factors, showed that low erosion (<10 t/ha) occupied the largest area in the Bugucheon and Namdaecheon watersheds, as shown in Figure 9. High erosion rates (>50 t/ha and <200 t/ha) were predominantly observed in steep hillslopes damaged by the 2022 wildfire (Figure 9a,b). The erosion rate decreased generally in 2023, one year later, rather than in 2022, the same year after the fire.
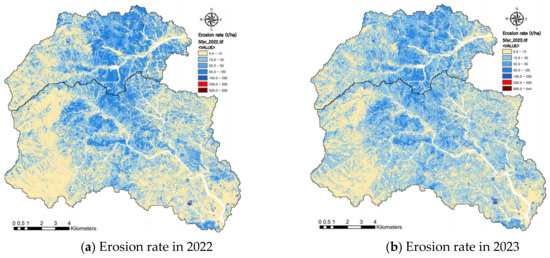
Figure 8.
Change in erosion rates simulated by traditional version of RUSLE for 50-year probability of rainfall according to elapsed years after wildfire.
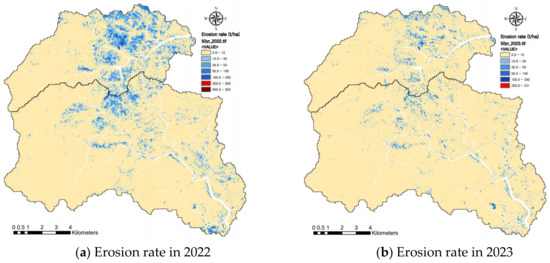
Figure 9.
Change in erosion rates simulated by traditional version of SEMMA for 50-year probability of rainfall according to the elapsed years after wildfire.
Table 5 shows a comparison of the statistical results of the erosion rates estimated by the traditional versions of the RUSLE and SEMMA for the Bugucheon and Namdaecheon watersheds according to the year and probability of rainfall. The RUSLE overestimated the mean erosion rates in the two watersheds by from 3 to 15 times compared to the SEMMA. As most wildfires occur in areas with steep slopes (>15°), the RUSLE, which is more susceptible to slope factors, oversimulated the erosion rate compared to the SEMMA. The maximum erosion rates calculated by the RUSLE and SEMMA were 762.2 t/ha in the bare steep slopes of developed areas and 588.0 t/ha in the artificial bare slopes of roadsides, respectively. The mean erosion rates calculated by the RUSLE and SEMMA for the two watersheds were 14.8 ± 10.7 t/ha and 3.0 ± 3.0 t/ha, respectively. The highest erosion rates for the wildfire areas were estimated to be 517.8 t/ha on a 40.4° hillslope by the RUSLE and 288.8 t/ha on a 40.4° hillslope by the SEMMA. As shown by the data observed in the wildfire areas in South Korea, the erosion rate from plots with sandy soils were in the range of 86~180 t/ha, and the sediment yield from the small basin was 71.2 t/ha after an extremely heavy rain event (>500-year probability of rainfall) [44]. Although the wildfire areas have steep slopes, the actual erosion rates were less than 200 t/ha because they have aggregated soil, coarse stones, burnt trees, and roots. The RUSLE overestimated the erosion rates in the post-fire hillslopes despite considering a low value of the P factor of 0.28 for forests. The Bugucheon watershed, which suffered a damage level of 45.1% from wildfires, showed a higher mean erosion rate than the Namdaecheon watershed, which had a lower damage level of 27.0%. On the other hand, the total level of soil erosion in the Namdaecheon watershed, which has a large area, was greater than that in the Bugucheon watershed. The erosion ratio is the ratio of the erosion amounts before and after a wildfire. The changes in the SEMMA-estimated erosion ratio from 2022 to 2023 decreased generally. Nonetheless, the changes in the RUSLE-estimated erosion ratio were not significant. In this study, although the SEMMA appeared to estimate more reasonable erosion rates than the RUSLE, the applications of this model for wildfire areas around the world still requires caution.
Table 5.
Comparison of statistical results of erosion rates simulated by TVs of RUSLE and SEMMA for Bugucheon and Namdaecheon watersheds according to the year and probability of rainfall.
3.2. Evaluation of Erosion Risk in Wildfire Watersheds
The erosion risk aggravated in the watersheds due to the wildfire was evaluated by comparing the amount of erosion before and after the wildfire. The evaluation of the erosion risk using the RUSLE and SEMMA was conducted for a 50-year and 80-year probability of rainfall events and for the post-fire years of 2022 and 2023. The erosion risk evaluated by the RUSLE increased most significantly for an 80-year probability of rainfall in 2022 immediately after the wildfire. Figure 10 shows the changes in erosion risk estimated by the RUSLE for a 50-year probability of rainfall according to the elapsed years after the wildfire. The erosion risk of a high erosion degree (>50 t/ha) greatly increased in 2022 and decreased according to the elapsed years after the wildfire. The extent of moderate erosion (>10 t/ha and <50 t/ha) in 2023 increased significantly compared to 2022. May is a time when the vitality of natural vegetation increases rapidly. The satellite image in 2023 was acquired on 9 May, which is approximately 10 days earlier than the image acquired on 19 May 2021, and approximately 20 days earlier than the image acquired on 29 May 2022. In other words, it was judged that the vegetation vitality in 2023 would have been relatively low compared to 2021 and 2022. This is the reason why the risk of erosion increased by more than 10 t/ha on the non-fire steep slopes (Figure 8 and Figure 10b). Therefore, it is necessary to acquire high-quality satellite images and accurate data assimilation in the analysis of noisy time series.
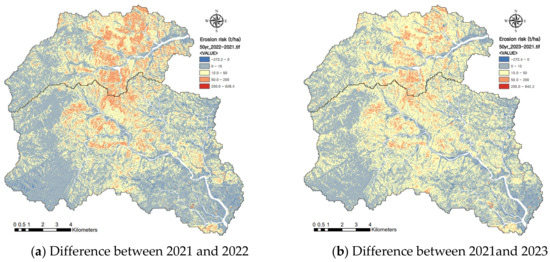
Figure 10.
Changes in erosion risk estimated by RUSLE for 50-year probability of rainfall according to the elapsed years after wildfire.
The erosion risk estimated by the SEMMA was also the highest for an 80-year probability of rainfall in 2022 after the wildfire. The erosion risk changes evaluated by the SEMMA for a 50-year probability of rainfall, according to the elapsed years after the wildfire, are shown in Figure 11. In particular, an erosion risk of a very high erosion degree (>200 t/ha) was observed on the steep mountain ridges where the wildfire intensity was high. The erosion risk was greatly reduced in 2023 due to rapid vegetation recovery and the stabilization of the topsoil.
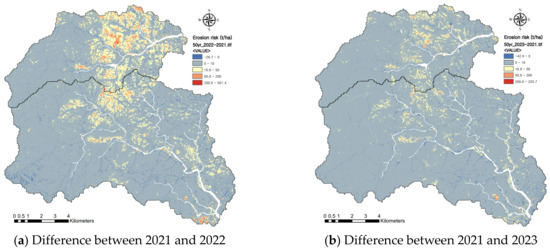
Figure 11.
Changes in erosion risk estimated by SEMMA for 50-year probability of rainfall according to the elapsed years after wildfire.
The mean and total erosion risks simulated by the RUSLE and SEMMA, according to the watersheds and a 50-year and 80-year frequency of rainfall, are simultaneously displayed in one graph in Figure 12. The mean and total erosion risks determined by the RUSLE were 4.5 ± 1.9 times greater than that determined by the SEMMA for the two watersheds. The erosion risk determined by the SEMMA decreased by 2 times with the elapsed time. However, the erosion risk determined by the RUSLE did not change significantly from 2022 to 2023. The total erosion risk determined by the RUSLE increased with the increase in the watershed area due to the RUSLE’s overestimation. However, the total erosion risk determined by the SEMMA did not change significantly with the watershed area. This means that the RUSLE can oversimulate spatially more than the SEMMA. The GIS-based SEMMA can be a useful empirical model for conducting an urgent quantitative assessment of the erosion risk in large-scale wildfire areas.
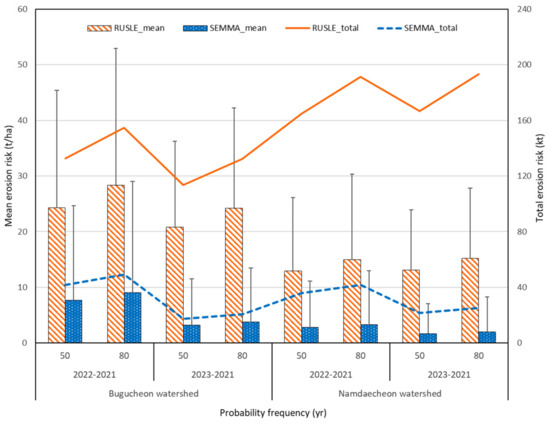
Figure 12.
Changes in mean and total erosion risks in Bugucheon and Namdaecheon watersheds according to the year and probability of rainfall.
3.3. Estimation of Models Considering Flow Accumulation
The erosion rates were additionally estimated by the flow accumulation versions (FAVs) of the RUSLE and SEMMA using Equation (22) to calculate the LS factor. The maximum flow accumulations of the Bugucheon watershed and Namdaecheon watershed were 2.10 × 10⁶ and 4.95 × 10⁶, respectively. The erosion rate by the FAV of the RUSLE for the Bugucheon watershed and Namdaecheon watershed in 2022 after the wildfire increased significantly, and the maximum value exceeded 10,000 t/ha, as shown in Figure 13a. Such extreme erosion may be possible through huge gully expansion or landslides. The maximum post-fire sediment yield was observed at 2800 t/ha on the channel volume following the Johnston Peak Fire in 1960, and their means were in the following order: channel volume (240 t/ha), hillslope point (110 t/ha), and hillslope plot (60 t/ha) [82]. As with the published post-fire measured rates of hillslope erosion, the maximum erosion rates decreased in the following order: hillslope point (<415 t/ha), bounded plots (<170 t/ha), and sediment traps (<70 t/ha) [83]. This is explained by the fact that as the hillslope length increases, the deposition also increases in the runoff process. The GIS-based RUSLE and SEMMA cannot simulate the runoff process. However, they must be simulated so that the erosion rate increases on the hillslope of the cell unit due to rill development with an increase in surface runoff. In post-fire mountainous hillslopes, the incision and expansion of rills are not frequently observed due to obstruction by residues and the stems and roots of plants [74,84]. The FAV of the RUSLE greatly overestimated compared to the TV, as shown in Figure 13a. The FAV of the SEMMA was simulated to have increased slightly compared to the TV (Figure 13b). The statistical results of the erosion rates estimated by the FAVs of the RUSLE and SEMMA are compared in Table 6. The last column of Table 6 shows the erosion ratio of FAV to TV in 2022. While the erosion rates of the RUSLE increased by 1.65~2.31 times, those of the SEMMA only increased by 1.03~1.19 times. Additional research for flow accumulation should be conducted to find an improvement direction and to determine the use scope of the GIS-based SEMMA model in evaluating watershed erosion.
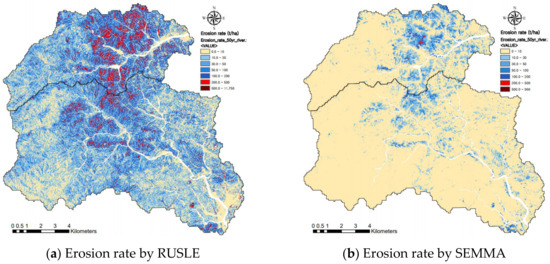
Figure 13.
Comparison of erosion rates simulated by flow accumulation version of RUSLE and SEMMA for 50-year probability of rainfall in 2022.
Table 6.
Comparison of statistical results of erosion rates simulated by flow accumulation version of RUSLE and SEMMA for Bugucheon and Namdaecheon watersheds in 2022 according to probability of rainfall.
4. Discussions
4.1. Effect of Heavy Rainfall in Post-Fire Watersheds
There was no heavy rain immediately after the wildfire. The biggest rainfall event in 2022 was just 79 mm/d of rainfall caused by Typhoon Hinnamnor. In 2023, the maximum rainfall caused by Typhoon Khanun was 150 mm/d at the Uljin MS (Table 7), as indicated on the map in Figure 2. The rainfall depth recorded at the Jukbyeon AWS, located 8.0 km north of the Uljin MS, was 171.0 mm/d. The rainfall at the Sogok AWS, located 11.4 km northwest of the Uljin MS, was certainly 70 mm/d more than that at the Uljin MS, as shown in Table 6. Since the weather in mountainous areas changes rapidly, there was a large difference in the rainfall distribution within nearby distances. The 1-h maximum rainfall intensity recorded at the Sogok AWS was 51.5 mm/h, which was higher than the Uljin MS. At the Sogok AWS, the 24-h rainfall was smaller than the probability of rainfall of a 50-year frequency in the Uljin area, but the rainfall intensity was greater than that.
Table 7.
Comparison of observed data of rainfall events caused by Typhoon Khanun in rainfall stations and probability of rainfall of 50-year frequency in the Uljin area.
The photos of hillslopes and rivers after the typhoon were plotted on the map of the erosion rate simulated by the SEMMA, as shown in Figure 14. Erosion and sediment damages were observed in the Bugucheon watershed due to Typhoon Khanun one year after the wildfire. However, the damages were not observed in the Namdaecheon watershed. The photo of the tributary of the Bugucheon River shown in Figure 14 shows the deposition of a large amount of sediment at the confluence with the mainstream. The reason for the high sediment yield ratio in the Bugokcheon watershed located near the Sogok AWS was that the precipitation exceeded the 50-year frequency. Moreover, in the post-fire regions where there were forest roads for transmission tower construction and logging, the incision and expansion of rills, gully erosions, and landslides were active, and a large amount of sediment that was transported into the rivers was deposited at the confluences where the flow velocity decreased. In the case of the Namdaecheon watershed, where the rainfall was relatively low, soil erosion from the post-fire hillslopes was not serious, and there was no significant change in the sediments deposited on the riverbeds (Figure 14).
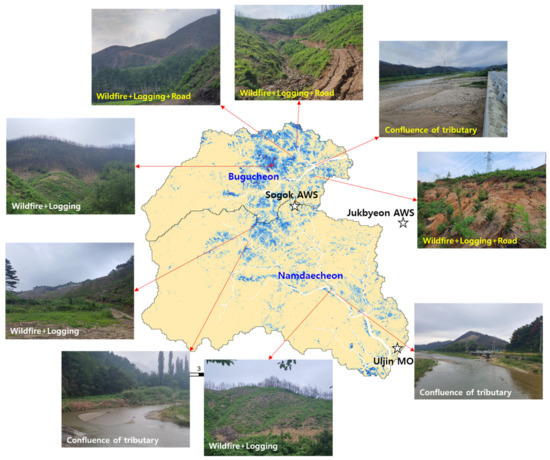
Figure 14.
The field evidence photos of erosion and sediment damage in the Bugucheon and Namdaecheon watersheds by rainfall events of Typhoon Khanun in 2023 after the wildfire in 2022. The stars and arrows indicate rainfall stations and photo points, respectively. Yellow texts in the photo mean that there was erosion and sediment damage, and white texts mean that there was no major damage.
The management of hillslopes after a wildfire is divided into three types: (1) wildfire damage and natural recovery, (2) wildfire damage and logging, (3) wildfire damage, logging, and roads. These are roads created to install transmission towers before a wildfire or newly built roads to transport firewood. It was assessed that this heavy rain may have caused low-level erosion (<10 t/ha) on the hillslopes of (1) wildfire damage and natural recovery. However, it is believed that high-level erosion occurred on the steep hillslopes, as predicted by the SEMMA. On the other land, the hillslopes of (3) wildfire damage, logging, and roads appear to have experienced very-high-level erosion (>200 t/ha), as predicted by the RUSLE, and Gupta (2001) [85] also mentioned that the erosion risk increased intensively in areas with a low NDVI due to wildfires and logging.
4.2. Comparison of TVs and FAVs of RUSLE and SEMMA
The spatial patterns of erosion rates estimated by the TVs and FAVs of the RUSLE and SEMMA were plotted to match the actual points of rill and gully development and landslides on roadcuts (Figure 15). Both the RUSLE and SEMMA predicted the erosion risks for the selected points, although their accuracy varied in terms of the intensity and extent. A very high erosion level of over 200 t/ha is accompanied by rill and gully erosions. The TV and FAV of the RUSLE estimated a soil erosion level of over 200 t/ha; however, the estimated scales were excessively broad. The circular photo shows that rill and gully developments were limited on the hillslopes due to the heterogeneity of vegetation cover. The square photo indicates the location of landslides on roadcuts. The FAV of the SEMMA implemented these spatial patterns better. In particular, excessive erosion on hillslopes caused a large amount of sediment to flow into the rivers; even so, this was influenced by the spatial pattern of erosion and deposition zones during the runoff process. Mallinis et al. (2009) [86] noted that the spatial pattern of erosion processes must be an important consideration because fire-induced cover heterogeneity is a major factor controlling runoff and sediment transport capacity.
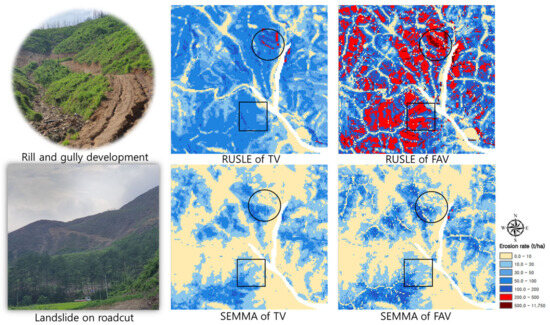
Figure 15.
The spatial patterns of erosion rates determined by the traditional versions (TVs) and flow accumulation versions (FAVs) of the RUSLE and SEMMA. The circles and squares indicate the locations of rill and gully development and landslides on roadcuts, respectively.
5. Conclusions
This study utilized the RUSLE and SEMMA based on the ArcGIS analysis tools to evaluate erosion risk in watersheds before and after a wildfire. The NDVI extracted from Sentinel-2 images decreased greatly compared to before the wildfire; nevertheless, in the next year, it increased as the vegetation recovered despite logging operations. Multiple regression models of the SEMMA were represented by considering extreme rainfall in the Uljin area. The RUSLE considered the recent P factor following land use and the K factor recalculated by the ratio of coarse stones to correct overestimation in mountainous areas. The LS factors were calculated by the traditional versions and flow accumulation versions of the RUSLE and SEMMA. The distributions of the rainfall erosivity factor were an interpolation of rainfall data from five weather stations, including the Uljin MS, and appeared to increase from the coastal to mountainous areas.
The erosion rates of the TV of the RUSLE in 2022 and 2023 showed that the extent of moderate erosion (>10 t/ha and <50 t/ha) increased significantly after the wildfire. The estimated erosion rates of the TV of the SEMMA indicated that low erosion (<10 t/ha) occupied the largest area. The erosion rates determined by the RUSLE for the two watersheds were overestimated compared to the SEMMA. The RUSLE for post-fire hillslopes oversimulated the erosion rates due to steep slopes even though wildfire areas have aggregated soil, coarse stones, burnt trees, and roots. The Bugucheon watershed, where the wildfire was severe, showed a higher mean erosion rate than the Namdaecheon watershed. The erosion risk increased most significantly for an 80-year probability of rainfall in 2022 immediately after the wildfire. While the erosion risks determined by the SEMMA decreased with the elapsed time, those determined by the RUSLE did not change significantly from 2022 to 2023. The FAV of the RUSLE greatly oversimulated the erosion rate compared to the TV. The FAV of the SEMMA calculated slightly greater values than the TV and appropriately implemented spatial patterns. Typhoon Khanun in 2023 was accompanied by heavy rain exceeding the 50-year probability of rainfall in the post-fire Uljin area. Rill and gully erosions and landslides due to the heavy rainfall occurred in the Bugucheon watershed with forest roads for transmission tower construction and logging. The Uljin watersheds have topographical characteristics such as steep mountainous rivers and hillslopes and climatic characteristics with a high risk of locally extreme rainfall. Even in areas where vegetation recovery is rapid, excessive artificial disturbance should be avoided to reduce erosion risk in post-fire areas. In particular, to prepare for disastrous extreme heavy rainfall, continuous efforts are needed to increase the accuracy of model simulations that assess erosion risk.
Author Contributions
Conceptualization, S.S.S. and S.D.P.; methodology, S.S.S. and G.K.; software, G.K.; validation, S.S.S., S.D.P. and G.K.; formal analysis, S.S.S.; investigation, S.S.S. and G.K.; resources, S.D.P.; G.K.; data curation, G.K.; writing—original draft preparation, S.S.S.; writing—review and editing, S.S.S. and G.K.; visualization, S.S.S.; supervision, G.K. and S.D.P.; project administration, S.S.S. and S.D.P.; funding acquisition, S.S.S. and S.D.P. All authors have read and agreed to the published version of the manuscript.
Funding
This research was funded by the Basic Science Research Program through the National Research Foundation of Korea, funded by the Ministry of Education (No. 2021R1A6A1A03044326) and the Ministry of Science and ICT (No. 2023R1A2C1007132).
Data Availability Statement
The data presented in this study are available upon request from the corresponding author. The data are not publicly available due to national research regulations.
Conflicts of Interest
The authors declare no conflicts of interest.
References
- Binskin, M.; Bennett, A.; Macintosh, A. Royal Commission into Natural Disaster Arrangements; Commonwealth of Australia: Sydney, Australia, 2020; p. 115. ISBN ISBN 978-1-921091-46-9. Available online: https://nla.gov.au/nla.obj-2916701335/view (accessed on 25 January 2021).
- Haque, M.K.; Azad, M.A.K.; Hossain, M.Y.; Ahmed, T.; Uddin, M.; Hossain, M.M. Wildfire in Australia during 2019–2020, Its Impact on Health, Biodiversity and Environment with Some Proposals for Risk Management: A Review. J. Environ. Prot. 2021, 12, 391–414. [Google Scholar] [CrossRef]
- Canadian Interagency Forest Fire Centre. National Fire Situation Reports (Archive); Canadian Interagency Forest Fire Centre: Winnipeg, MB, Canada, 2023. [Google Scholar]
- Alexander, H.; Moir, N. The monster’: A short history of Australia’s biggest forest fire. Sydney Morning Herald, 20 December 2019. [Google Scholar]
- Prociv, K. Pacific Northwest heat wave continues after historic weekend. NBC News, 16 May 2023. [Google Scholar]
- Leonard, D. Experts see climate change fingerprint in worsening heat waves and fires. The Washington Post, 18 May 2023. [Google Scholar]
- FAO. Global forest fire assessment 1990–2000. Forest Resources Assessment Programme. Working Paper No. 55. 2001. Available online: https://www.fao.org/forestry/fo/fra/docs/Wp55eng.pdf (accessed on 9 April 2014).
- Littell, J.S.; McKenzie, D.; Peterson, D.L.; Westerling, A.L. Climate and wildfire area burned in western U. S. ecoprovinces, 1916-2003. Ecol. Appl. 2009, 19, 1003–1021. [Google Scholar] [CrossRef] [PubMed]
- Dennison, P.E.; Brewer, S.C.; Arnold, J.D.; Moritz, M.A. Large wildfire trends in the western United States, 1984–2011. Geophys. Res. Lett. 2014, 41, 2928–2933. [Google Scholar] [CrossRef]
- Filkov, A.I.; Ngo, T.; Matthews, S. Impact of Australia’s catastrophic 2019/20 bushfire season on communities and environment. Retrospective analysis and current trends. J. Saf. Sci. Resil. 2020, 1, 44–56. [Google Scholar] [CrossRef]
- Flannigan, M.; Cantin, A.S.; De Groot, W.J.; Wotton, M.; Newbery, A.; Gowman, L.M. Global wildland fire season severity in the 21st century. For. Ecol. Manag. 2013, 294, 54–61. [Google Scholar] [CrossRef]
- Baek, S.; Lim, J.; Kim, W. Analysis on the Fire Progression and Severity Variation of the Massive Forest Fire Occurred in Uljin, Korea, 2022. Forests 2022, 13, 2185. [Google Scholar] [CrossRef]
- Pelletier, J.D.; Brad Murray, A.; Pierce, J.L.; Bierman, P.R.; Breshears, D.D.; Crosby, B.T.; Ellis, M.E.; Foufoula-Georgiou, A.; Heimsath, M.; Houser, C. Forecasting the response of Earth’s surface to future climatic and land use changes: A review of methods and research needs. Earth’s Future 2015, 3, 220–251. [Google Scholar] [CrossRef]
- Sankey, J.B.; Kreitler, J.; Hawbaker, T.J.; McVay, J.L.; Miller, M.E.; Mueller, E.R.; Vaillant, N.M.; Lowe, S.E.; Sankey, T.T. Climate, wildfire, and erosion ensemble foretells more sediment in western USA watersheds Geophys. Res. Lett. 2017, 44, 8884–8892. [Google Scholar] [CrossRef]
- Myhre, G.; Alterskjær, K.; Stjern, C.W.; Hodnebrog, Ø.; Marelle, L.; Samset, B.H.; Sillmann, J.; Schaller, N.; Fischer, E.; Schulz, M.; et al. Frequency of extreme precipitation increases extensively with event rareness under global warming. Sci. Rep. 2019, 9, 16063. [Google Scholar] [CrossRef]
- Coscarelli, R.; Aguilar, E.; Petrucci, O.; Vicente-Serrano, S.M.; Zimbo, F. The Potential Role of Climate Indices to Explain Floods, Mass-Movement Events and Wildfires in Southern Italy. Climate 2021, 9, 156. [Google Scholar] [CrossRef]
- Gründemann, G.J.; van de Giesen, N.; Brunner, L.; van der Ent, R. Rarest rainfall events will see the greatest relative increase in magnitude under future climate change. Commun. Earth Environ. Vol. 2022, 3, 235. [Google Scholar] [CrossRef]
- Efthimiou, N.; Psomiadisc, E.; Panagosa, P. Fire severity and soil erosion susceptibility mapping using multi-temporal Earth Observation data: The case of Mati fatal wildfire in Eastern Attica, Greece. CATENA 2020, 187, 104320. [Google Scholar] [CrossRef] [PubMed]
- Sánchez, Y.S.; Graña, A.M.; Santos- Francés, F. Remote Sensing Calculation of the Influence of Wildfire on Erosion in High Mountain Areas. Agronomy 2021, 11, 1459. [Google Scholar] [CrossRef]
- Tselka, I.; Krassakis, P.; Rentzelos, A.; Koukouzas, N.; Parcharidis, I. Assessing Post-Fire Effects on Soil Loss Combining Burn Severity and Advanced Erosion Modeling in Malesina, Central Greece. Remote Sens. 2021, 13, 5160. [Google Scholar] [CrossRef]
- Chéret, V.; Denux, J.P. Mapping wildfire danger at regional scale with an index model integrating coarse spatial resolution remote sensing data. J. Geophys. Res. 2007, 112, G02006. [Google Scholar] [CrossRef]
- Chen, X.; Vogelmann, J.E.; Rollins, M.; Ohlen, D.; Key, C.H.; Yang, L.; Huang, C.; Shi, H. Detecting post-fire burn severity and vegetation recovery using multitemporal remote sensing spectral indices and field-collected composite burn index data in a ponderosa pine forest. Int. J. Remote Sens. 2011, 32, 7905–7927. [Google Scholar] [CrossRef]
- Leon, J.R.R.; Van Leeuwen, W.J.D.; Casady, G.M. Using MODIS-NDVI for the Modeling of Post-Wildfire Vegetation Response as a Function of Environmental Conditions and Pre-Fire Restoration Treatments. Remote Sens. 2012, 4, 598–621. [Google Scholar] [CrossRef]
- Ryu, J.H.; Han, K.S.; Hong, S.; Park, N.W.; Lee, Y.W.; Cho, J. Satellite-Based Evaluation of the Post-Fire Recovery Process from the Worst Forest Fire Case in South Korea. Remote Sens. 2018, 10, 918. [Google Scholar] [CrossRef]
- Argentiero, I.; Ricci, G.F.; Elia, M.; D’Este, M.; Giannico, V.; Ronco, F.V.; Gentile, F.; Sanesi, G. Combining methods to estimate post-fire soil erosion using remote sensing data. Forests 2021, 12, 1105. [Google Scholar] [CrossRef]
- Renard, K.G.; Foster, G.R.; Weesies, G.A.; McCool, D.K.; Yoder, D.C. Predicting Soil Erosion by Water: A Guide to Conservation Planning with the Revised Universal Soil Loss Equation (RUSLE); US Department of Agriculture Handbook 703; US Department of Agriculture-Agricultural Search Service: Washington, DC, USA, 1997. [Google Scholar]
- Drake, N.A.; Zhang, X.; Berkhout, E.; Bonifacio, R.; Grimes, D.; Wainwright, J.; Mulligan, M. Modeling soil erosion at global and regional scales using remote sensing and GIS techniques. In Spatial Analysis for Remote Sensing and GIS; Atkinson, P., Ed.; Wiley: London, UK, 1998; pp. 241–261. [Google Scholar]
- Van der Knijff, J.M.; Jones, R.J.A.; Montanarella, L. Soil Erosion Risk in Italy; EUR 19022 EN; Office for Official Publications of the European Communities: Luxembourg, 1999. [Google Scholar]
- Lim, K.J.; Sagong, M.; Engel, B.A.; Tang, Z.; Choi, J.; Kim, K.S. GIS-based Sediment Assessment Tool. Catena 2005, 64, 61–80. [Google Scholar] [CrossRef]
- De Asis, A.M.; Omasa, K. Estimation of vegetation parameter for modeling soil erosion using linear spectral mixture analysis of landsat ETM data. J. Photogramm. Remote Sens. 2007, 62, 309–324. [Google Scholar] [CrossRef]
- Zhou, P.; Luukkanen, O.; Tokola, T.; Nieminen, J. Effect of vegetation cover on soil erosion in a mountainous watershed. Catena 2008, 75, 319–325. [Google Scholar] [CrossRef]
- Ban, J.K.; Yu, I.; Jeong, S. Estimation of Soil Erosion Using RUSLE Model and GIS Techniques for Conservation Planning from Kulekhani Reservoir Catchment, Nepal. J. Korean Soc. Hazard Mitig. 2016, 16, 323–330. [Google Scholar] [CrossRef][Green Version]
- Gelagay, H.S.; Minale, A.S. Soil loss estimation using GIS and Remote sensing techniques: A case of Koga watershed, Northwestern Ethiopia. Int. Soil Water Conserv. Res. 2016, 4, 126–136. [Google Scholar] [CrossRef]
- Jazouli, A.E.; Barakat, A.; Ghafri, A.; Moutaki, S.E.; Ettaqy, A.; Khellouk, R. Soil erosion modeled with USLE, GIS, and remote sensing: A case study of Ikkour watershed in Middle Atlas (Morocco). Geosci. Lett. 2017, 4, 25. [Google Scholar] [CrossRef]
- Park, S.D.; Lee, K.S.; Shin, S.S. Statistical Soil Erosion Model for Burnt Mountain Areas in Korea-RUSLE Approach. J. Hydrol. Eng. 2012, 17, 292–304. [Google Scholar] [CrossRef]
- Park, S.D.; and Shin, S.S. Evaluation for Application of Soil Erosion Models in Burnt Hillslopes—RUSLE, WEPP, and SEMMA. KSCE J. Civ. Environ. Eng. Res. 2011, 31, 221–232. [Google Scholar]
- Shin, S.S.; Park, S.D.; Lee, J.S.; Lee, K.S. SEMMA revision to evaluate soil erosion on mountainous watershed of large scale. KSCE J. Civ. Environ. Eng. Res. 2013, 46, 885–896. [Google Scholar]
- Shin, S.S.; Park, S.D.; Kim, G. Risk Assessment of Soil Erosion Using a GIS-Based SEMMA in Post-Fire and Managed Watershed. Sustainability 2022, 14, 7339. [Google Scholar] [CrossRef]
- Kim, Y.; Kim, C.G.; Lee, K.S.; Choung, Y. Effects of Post-Fire Vegetation Recovery on Soil Erosion in Vulnerable Montane Regions in a Monsoon Climate: A Decade of Monitoring. J. Plant Biol. 2021, 64, 123–133. [Google Scholar] [CrossRef]
- Kim, J.C.; Koh, H.J.; Lee, S.R.; Lee, C.B.; Choi, S.J.; Park, G.H. Explanatory Note of the Gangreung-Sokcho Sheet; Korea Institute of Geoscience and Mineral Resources: Daejeon, Republic of Korea, 2001. [Google Scholar]
- U.S. Department of Agriculture. Soil Taxonomy: A Basic System of Soil Classification for Making and Interpreting Soil Surveys; Agriculture Handbook 436; U.S. Department of Agriculture: Washington, DC, USA, 1975. [Google Scholar]
- The National Atlas of Korea II. 2020. Available online: https://nationalatlas.ngii.go.kr/pages/page_2298.php (accessed on 31 December 2020).
- Shin, S.S.; Park, S.D.; Lee, S.K.; Ji, M.G. Estimating critical stream power by the distribution of gravel-bed materials in the meandering river. J. Korea Water Resour. Assoc. 2012, 45, 151–163. [Google Scholar] [CrossRef]
- Shin, S.S.; Park, S.D.; and Lee, K.S. Sediment and hydrological response to vegetation recovery following wildfire on hillslopes and the hollow of a small watershed. J. Hydrol. 2013, 499, 154–166. [Google Scholar] [CrossRef]
- Wischmeier, W.H.; Smith, D.D. Rainfall energy and its relationship to soil loss. Trans. Am. Geophys. Union 1958, 39, 285–291. [Google Scholar]
- Heusch, B. L’érosion du Pré-Rif. Une étude quantitative de l’érosion hydraulique dans les collines marneuses du Pré-Rif occidental. Ann. De Pech. For. De Maroc 1970, 12, 9–176. [Google Scholar]
- Odemerho, F.O. Variation in erosion-slope relationship on cut slopes along a tropical highway. Singap. J. Trop. Geogr. 1986, 7, 98–107. [Google Scholar] [CrossRef]
- Brown, L.C.; Foster, G.R. Storm erosivity using idealized intensity distributions. Trans. ASAE 1987, 30, 379–386. [Google Scholar] [CrossRef]
- Van Dijk, A.I.J.M.; Bruijnzeel, L.A.; Rosewell, C.J. Rainfall intensity-kinetic energy relationships. J. Hydrol. 2002, 261, 1–23. [Google Scholar] [CrossRef]
- Gonzalez-Hidalgo, J.C.; Batalla, R.J.; Cerda, A.; de Luis, M. A regional analysis of the effects of largest events on soil erosion. Catena 2012, 95, 85–90. [Google Scholar] [CrossRef]
- Ministry of Environment. Development of Program for Rainfall Frequency Analysis; Report of Republic of Korea; Ministry of Environment: Sejong, Republic of Korea, 2020. [Google Scholar]
- Rouse, J.W.; Haas, R.H.; Schell, J.A.; Deering, D.W. Monitoring vegetation systems in the Great Plains with ERTS. In Proceedings of the Third ERTS Symposium, NASA SP-351, Washington, DC, USA, 10–14 December 1973; p. 1008. [Google Scholar]
- Li, S.; Xu, L.; Jing, Y.; Yin, H.; Li, X.; Guan, X. High-quality vegetation index product generation: A review of NDVI time series reconstruction techniques. Int. J. Appl. Earth Obs. Geoinf. 2021, 105, 102640. [Google Scholar] [CrossRef]
- Tian, P.; Zhu, Z.; Yue, Q.; He, Y.; Zhang, Z.; Hao, F. Soil erosion assessment by RUSLE with improved P factor and its validation: Case study on mountainous and hilly areas of Hubei Province, China. Int. Soil Water Conserv. Res. 2021, 9, 433–444. [Google Scholar] [CrossRef]
- Yariv, S. Comments on the mechanism of soil detachment by rainfall. Geoderma 1976, 15, 393–399. [Google Scholar] [CrossRef]
- Poesen, J. Rainwash experiments on the erodibility of loose sediments. Earth Surf. Process. Landf. 1981, 6, 285–307. [Google Scholar] [CrossRef]
- Savat, J. Common an uncommon selectivity in the process of fluid transportation: Field observations and laboratory experiments on bare surfaces. CATENA Supplement. 1982, 1, 139–160. [Google Scholar]
- Brakensiek, D.L.; Rawls, W.J.; Stephenson, G.R. Determining the saturated hydraulic conductivity of a soil containing rock fragments. Soil Sci. Soc. Am. J. 1986, 50, 834–835. [Google Scholar] [CrossRef]
- Panagos, P.; Meusburger, K.; Ballabio, C.; Borrelli, P.; Alewell, C. Soil erodibility in Europe: A high-resolution dataset based on LUCAS. Sci. Total Environ. 2014, 479, 189–200. [Google Scholar] [CrossRef]
- Poesen, J.W.; Torri, D.; Bunte, K. Effects of rock fragments on soil erosion by water at different spatial scales: A review. Catena 1994, 23, 141–166. [Google Scholar] [CrossRef]
- Luce, C.H. Forests and wetlands. In Environmental Hydrology; Ward, A.D., Elliot, W.J., Eds.; Lewis Publishers: Boca Raton, FL, USA, 1995; pp. 253–283. [Google Scholar]
- Voroney, R.P.; van Veen, J.A.; Paul, E.A. Organic carbon dynamics in grassland soils. II. Model validation and simulation of the long-term effects of cultivation and rainfall erosion. Can. J. Soil Sci. 1981, 61, 211–224. [Google Scholar] [CrossRef]
- Ekwue, E.I.; Ohu, J.O. A model to describe soil detachment by rainfall. Soil Tillage Res. 1990, 16, 299–306. [Google Scholar] [CrossRef]
- Quinn, N.W.; Morgan, R.P.C.; Smith, A.J. Simulation of soil erosion induced by human trampling. J. Environ. Manag. 1980, 10, 155–165. [Google Scholar]
- Shakesby, R.A. Post-wildfire soil erosion in the Mediterranean: Review and future research directions. Earth-Sci. Rev. 2011, 105, 71–100. [Google Scholar] [CrossRef]
- Wilkinson, M.T.; Humphreys, G.S. The soil protection function: A brief history and its rediscovery. Geoderma 2007, 139, 73–78. [Google Scholar]
- National Institute of Agricultural Sciences, RDA. Korean Soil Information System. 2016. Available online: https://soil.rda.go.kr/geoweb/soilmain.do# (accessed on 13 April 2022).
- McCool, D.K.; Brown, L.C.; Foster, G.R.; Mutchler, C.K.; Meyer, L.D. Revised slope steepness factor for the Universal Soil Loss Equation. Trans. Am. Soc. Agric. Eng. 1987, 30, 1387–1396. [Google Scholar] [CrossRef]
- McCool, D.K.; Foster, G.R.; Weesies, G.A. Slope length and steepness factor. In Predicting Soil Erosion by Water—A Guide to Conservation Planning with the Revised Universal Soil Loss Equation (RUSLE); Renard, K.G., Foster, G.R., Weesies, G.A., McCool, D.K., Yoder, D.C., Eds.; USDA-ARS Special Publication: Washington, DC, USA, 1993; Chapter 4. [Google Scholar]
- McCool, D.K.; Brown, L.C.; Foster, G.R.; Mutchler, C.K.; Meyer, L.D. Revised slope length factor for the Universal Soil Loss Equation. Trans. Am. Soc. Agric. Eng. 1989, 32, 1571–1576. [Google Scholar] [CrossRef]
- Foster, G.R.; Meyer, L.D.; Onstad, D.A. A runoff erosivity factor and variable slope length exponents for soil loss estimates. Trans. Am. Soc. Agric. Eng. 1977, 20, 683–687. [Google Scholar] [CrossRef]
- Scott, D.F.; Van Wyk, D.B. The effects of wildfire on soil wettability and hydrological behaviour of an afforested catchment. J. Hydrol. 1990, 121, 239–256. [Google Scholar] [CrossRef]
- Cerdà, A.; Flanagan, D.C.; Le Bissonnais, Y.; Boardman, J. Soil erosion and agriculture. Soil Tillage Res. 2009, 106, 107–108. [Google Scholar] [CrossRef]
- Shin, S.S.; Park, S.D.; Pierson, F.B.; Williams, C.J. Evaluation of physical erosivity factor for interrill erosion on steep vegetated hillslopes. J. Hydrol. 2019, 571, 559–572. [Google Scholar] [CrossRef]
- Phinzi, K.; Ngetar, N.S. The assessment of water-borne erosion at catchment level using GIS-based RUSLE and remote sensing: A review. Int. Soil Water Conserv. Res. 2019, 7, 27–46. [Google Scholar] [CrossRef]
- Moore, I.D.; Burch, G.J. Physical basis of the length slope factor in the universal soil loss equation. Soil Sci. Soc. Am. J. 1986, 50, 1294–1298. [Google Scholar] [CrossRef]
- Mitasova, H.; Hofierka, J.; Zlocha, M.; Iverson, L.R. Modelling topographic potential for erosion and deposition using GIS. Int. J. Geogr. Inf. Syst. 1996, 10, 629–641. [Google Scholar] [CrossRef]
- Desmet, P.J.J.; Govers, G. A GIS procedure for automatically calculating the USLE LS factor on topographically complex landscape units. J. Soil Water Conserv. 1996, 51, 427–433. [Google Scholar]
- Elnashar, A.; Zeng, H.; Wu, B.; Fenta, A.A.; Nabil, M.; Duerler, R. Soil erosion assessment in the Blue Nile Basin driven by a novel RUSLE-GEE framework. Sci. Total Environ. 2021, 793, 148466. [Google Scholar] [CrossRef] [PubMed]
- Poesen, J. The influence of slope angle on infiltration rate and Hortonian overland flow volume. Z. Für Geomeorphologie Suppl. 1984, 49, 117–131. [Google Scholar]
- Food and Agriculture Organization of the United Nations [FAO]. Metodologia Provisional para Evaluación de la Degradación de los Suelos; FAO/PNUMA: Rome, Italy; UNEP: Nairobi, Kenya; UNESCO: Paris, France, 1980. [Google Scholar]
- Moody, J.A.; Martin, D.A. Synthesis of sediment yields after wildland fire in different rainfall regimes in the western United States. Int. J. Wildland Fire 2009, 18, 96–115. [Google Scholar] [CrossRef]
- Shakesby, R.A.; Doerr, S.H. Wildfire as a hydrological and geomorphological agent. Earth-Sci. Rev. 2006, 74, 269–307. [Google Scholar] [CrossRef]
- Shin, S.S.; Park, S.D.; Sim, Y.J.; Rye, J.H. Hydraulic conditions of incipient rill by raindrop-induced overland flow on steep slopes of sandy soil. Water 2023, 15, 502. [Google Scholar] [CrossRef]
- Gupta, H.S. Terrain Evaluation for Eco-Restoration using Remote Sensing and GIS. In Proceedings of the 4th AGILE conference on GIScience, Brno, Czech Republic, 19–21 April 2001; pp. 424–434. [Google Scholar]
- Mallinis, G.; Maris, F.; Kalinderis, I.; Koutsias, N. Assessment of Post-fire Soil Erosion Risk in Fire-Affected Watersheds Using Remote Sensing and GIS. GIScience Remote Sens. 2009, 46, 388–410. [Google Scholar] [CrossRef]
Disclaimer/Publisher’s Note: The statements, opinions and data contained in all publications are solely those of the individual author(s) and contributor(s) and not of MDPI and/or the editor(s). MDPI and/or the editor(s) disclaim responsibility for any injury to people or property resulting from any ideas, methods, instructions or products referred to in the content. |
© 2024 by the authors. Licensee MDPI, Basel, Switzerland. This article is an open access article distributed under the terms and conditions of the Creative Commons Attribution (CC BY) license (https://creativecommons.org/licenses/by/4.0/).