Abstract
Forest fires are caused by various climatic and anthropogenic factors. In Republic of Korea, forest fires occur frequently during spring when the humidity is low. During the past decade, the number of forest fire incidents and the extent of the damaged area have increased. Satellite imagery can be applied to assess damage from these unpredictable forest fires. Despite the increasing threat, there is a lack of comprehensive analysis and effective strategies for addressing these forest fires, particularly considering the diverse topography of Republic of Korea. Herein, we present an approach for the automated detection of forest fire damage using Sentinel-2 images of 14 areas affected by forest fires in Republic of Korea during 2019–2023. The detection performance of deep learning (DL), machine learning, and spectral index methods was analyzed, and the optimal model for detecting forest fire damage was derived. To evaluate the independent performance of the models, two different burned areas exhibiting distinct characteristics were selected as test subjects. To increase the classification accuracy, tests were conducted on various combinations of input channels in DL. The combination of false-color RNG (B4, B8, and B3) images was optimal for detecting forest fire damage. Consequently, among the DL models, the HRNet model achieved excellent results for both test regions with intersection over union scores of 89.40 and 82.49, confirming that the proposed method is applicable for detecting forest fires in diverse Korean landscapes. Thus, suitable mitigation measures can be promptly designed based on the rapid analysis of damaged areas.
1. Introduction
Forest fires, which damage both life and property in forests or their surrounding areas, are caused by various factors such as topographical and weather conditions and human negligence. In Republic of Korea, forest fires occur suddenly during the dry season from March to May, when the humidity is low [1]. According to the Korean Forest Service (https://www.forest.go.kr/ (accessed on 24 January 2024)), an average of 537 forest fires have occurred per year in the past decade, damaging 3560 ha of area. In 2022, 756 forest fires occurred, resulting in 24,797 ha of burned area. Specifically, a considerably large forest fire occurred in March 2022 in Uljin and Samcheok, lasting 10 days; it resulted in the spread of several domestic forest fires, affecting approximately 20,923 ha [2]. From a national perspective, forest fires are large-scale disasters that demand a substantial amount of human resources and time to mitigate the damage caused. Anthropogenic forest fires, which account for most forest fire incidents in Republic of Korea, are even more challenging to tackle quickly because their occurrence cannot be predicted as easily as natural forest fires [3]. The Korean Forest Service categorizes forest fire management into three stages: prevention, suppression, and post-suppression [4]. Local governments are making major efforts to prevent forest fires, although completely preventing their occurrence is challenging through proactive prevention measures alone. Therefore, research on efficiently detecting burned areas is necessary to establish a prompt and accurate response system for assessing the extent and magnitude of forest fire damage [5].
Previous studies have detected forest fire damage using satellite imagery that can help to periodically survey extensive areas [6,7,8,9,10]. These studies have emphasized the importance of satellite imagery owing to its potential for application in environmental monitoring and natural disaster management, as well as its advantage in enhancing preparedness in situations when predicting the time and location of forest fires is difficult [11]. In satellite optical images, the reflectance properties of burned and intact forests are contrasting [12,13]; particularly, burned forests exhibit low reflectance values in the near-infrared (NIR) range and high reflectance values in the short-wavelength infrared (SWIR) range, whereas intact forests exhibit low reflectance values in the red range and high reflectance values in the NIR range [14]. Based on these characteristics, spectral indices (SI), such as the normalized difference vegetation index (NDVI), burn area index, char soil index, and normalized burn ratio (NBR), have been developed to effectively detect burned areas [15,16,17,18]. Additionally, studies have been conducted using the difference scheme to emphasize the contrast between areas before and after forest fires [19,20,21,22]. Escuin et al. [23] presented noteworthy findings for evaluating the severity of burned areas using NDVI, NBR, and their differenced indices—dNDVI and dNBR. Particularly, the use of differential imaging has been effective in distinguishing between burned and unburned areas, whereas single-temporal indices have demonstrated superior performance in assessing severe damage caused by forest fires. Furthermore, Smiraglia et al. [24] effectively identified forest fire areas by analyzing dNBR, dNBR2, and dNDVI.
The estimation index developed based on the spectral characteristics of optical images is highly effective in measuring forest fire damage. However, its performance may vary depending on the fire severity, land cover (LC) type, and regional characteristics [25]. Recently, the use of machine learning (ML) and deep learning (DL) techniques has been emphasized to accurately detect forest fire damage. Specifically, research incorporating DL has proven to be effective in detecting burned forests and is being rapidly developed [26,27,28,29]. Hu et al. [30] evaluated the performance of nine ML and DL models in a large-scale forest fire area. DL models generally showed higher performance, but when spatial contextual information was lacking, ML methods yielded better results. A previous study [31] demonstrated that utilizing high-resolution Planet Scope images, particularly in the NIR band, based on the U-Net architecture was most suitable for detecting burned forests in 12 forest fire regions in Republic of Korea. Furthermore, various combinations of input variables, including RGB images, have been considered to improve the performance of burned area detection using DL and ML methods [32,33,34,35]. Knopp et al. [36] analyzed Sentinel-2 images using random forest and U-Net models and determined that a five-band combination (red, green, blue, NIR, and SWIR) is optimal as the input channel. Lee et al. [37] confirmed that in U-Net analysis, the addition of dNDVI and dNBR to all bands as input combinations in the pre- and post-periods resulted in the best performance for two burned areas in Republic of Korea. Tonbul et al. [38] demonstrated the higher performance of a method that incorporated NBR, dNBR, and NDVI SI into DL with ML models, compared to a method that used only spectral bands. This report suggested the effectiveness of utilizing indices based on spectral bands for burned area detection.
Previous studies have generally shown insufficient consideration of the variability in terrain characteristics and LC types depending on the location of forest fires. Consequently, these limitations have posed challenges in accurately assessing the extent of fire damage in affected areas. Therefore, the aim of this study was to propose effective methods for rapidly and accurately assessing the extent of fire damage in Republic of Korea by selecting optimized input images and models tailored to its complex and variable terrain and LC types. Our study specifically targeted the automatic detection of burned areas resulting from 14 recent forest fires. We analyzed burned area performance detection when utilizing DL models (U-Net and HRNet), ML (AutoML), and spectral indices (NDVI and NBR). Specifically, we investigated the impact of different input images with a particular emphasis on DL models, exploring two plans and three combinations. Additionally, we conducted a comparative analysis based on LC to evaluate detection performance in the complex terrain of Republic of Korea. Following this process, we identified the optimal burned area detection input images and models tailored to Republic of Korea’s geographical characteristics, with the overarching goal of proposing efficient methods for assessing the damage caused by forest fires.
2. Study Area and Data
2.1. Study Area
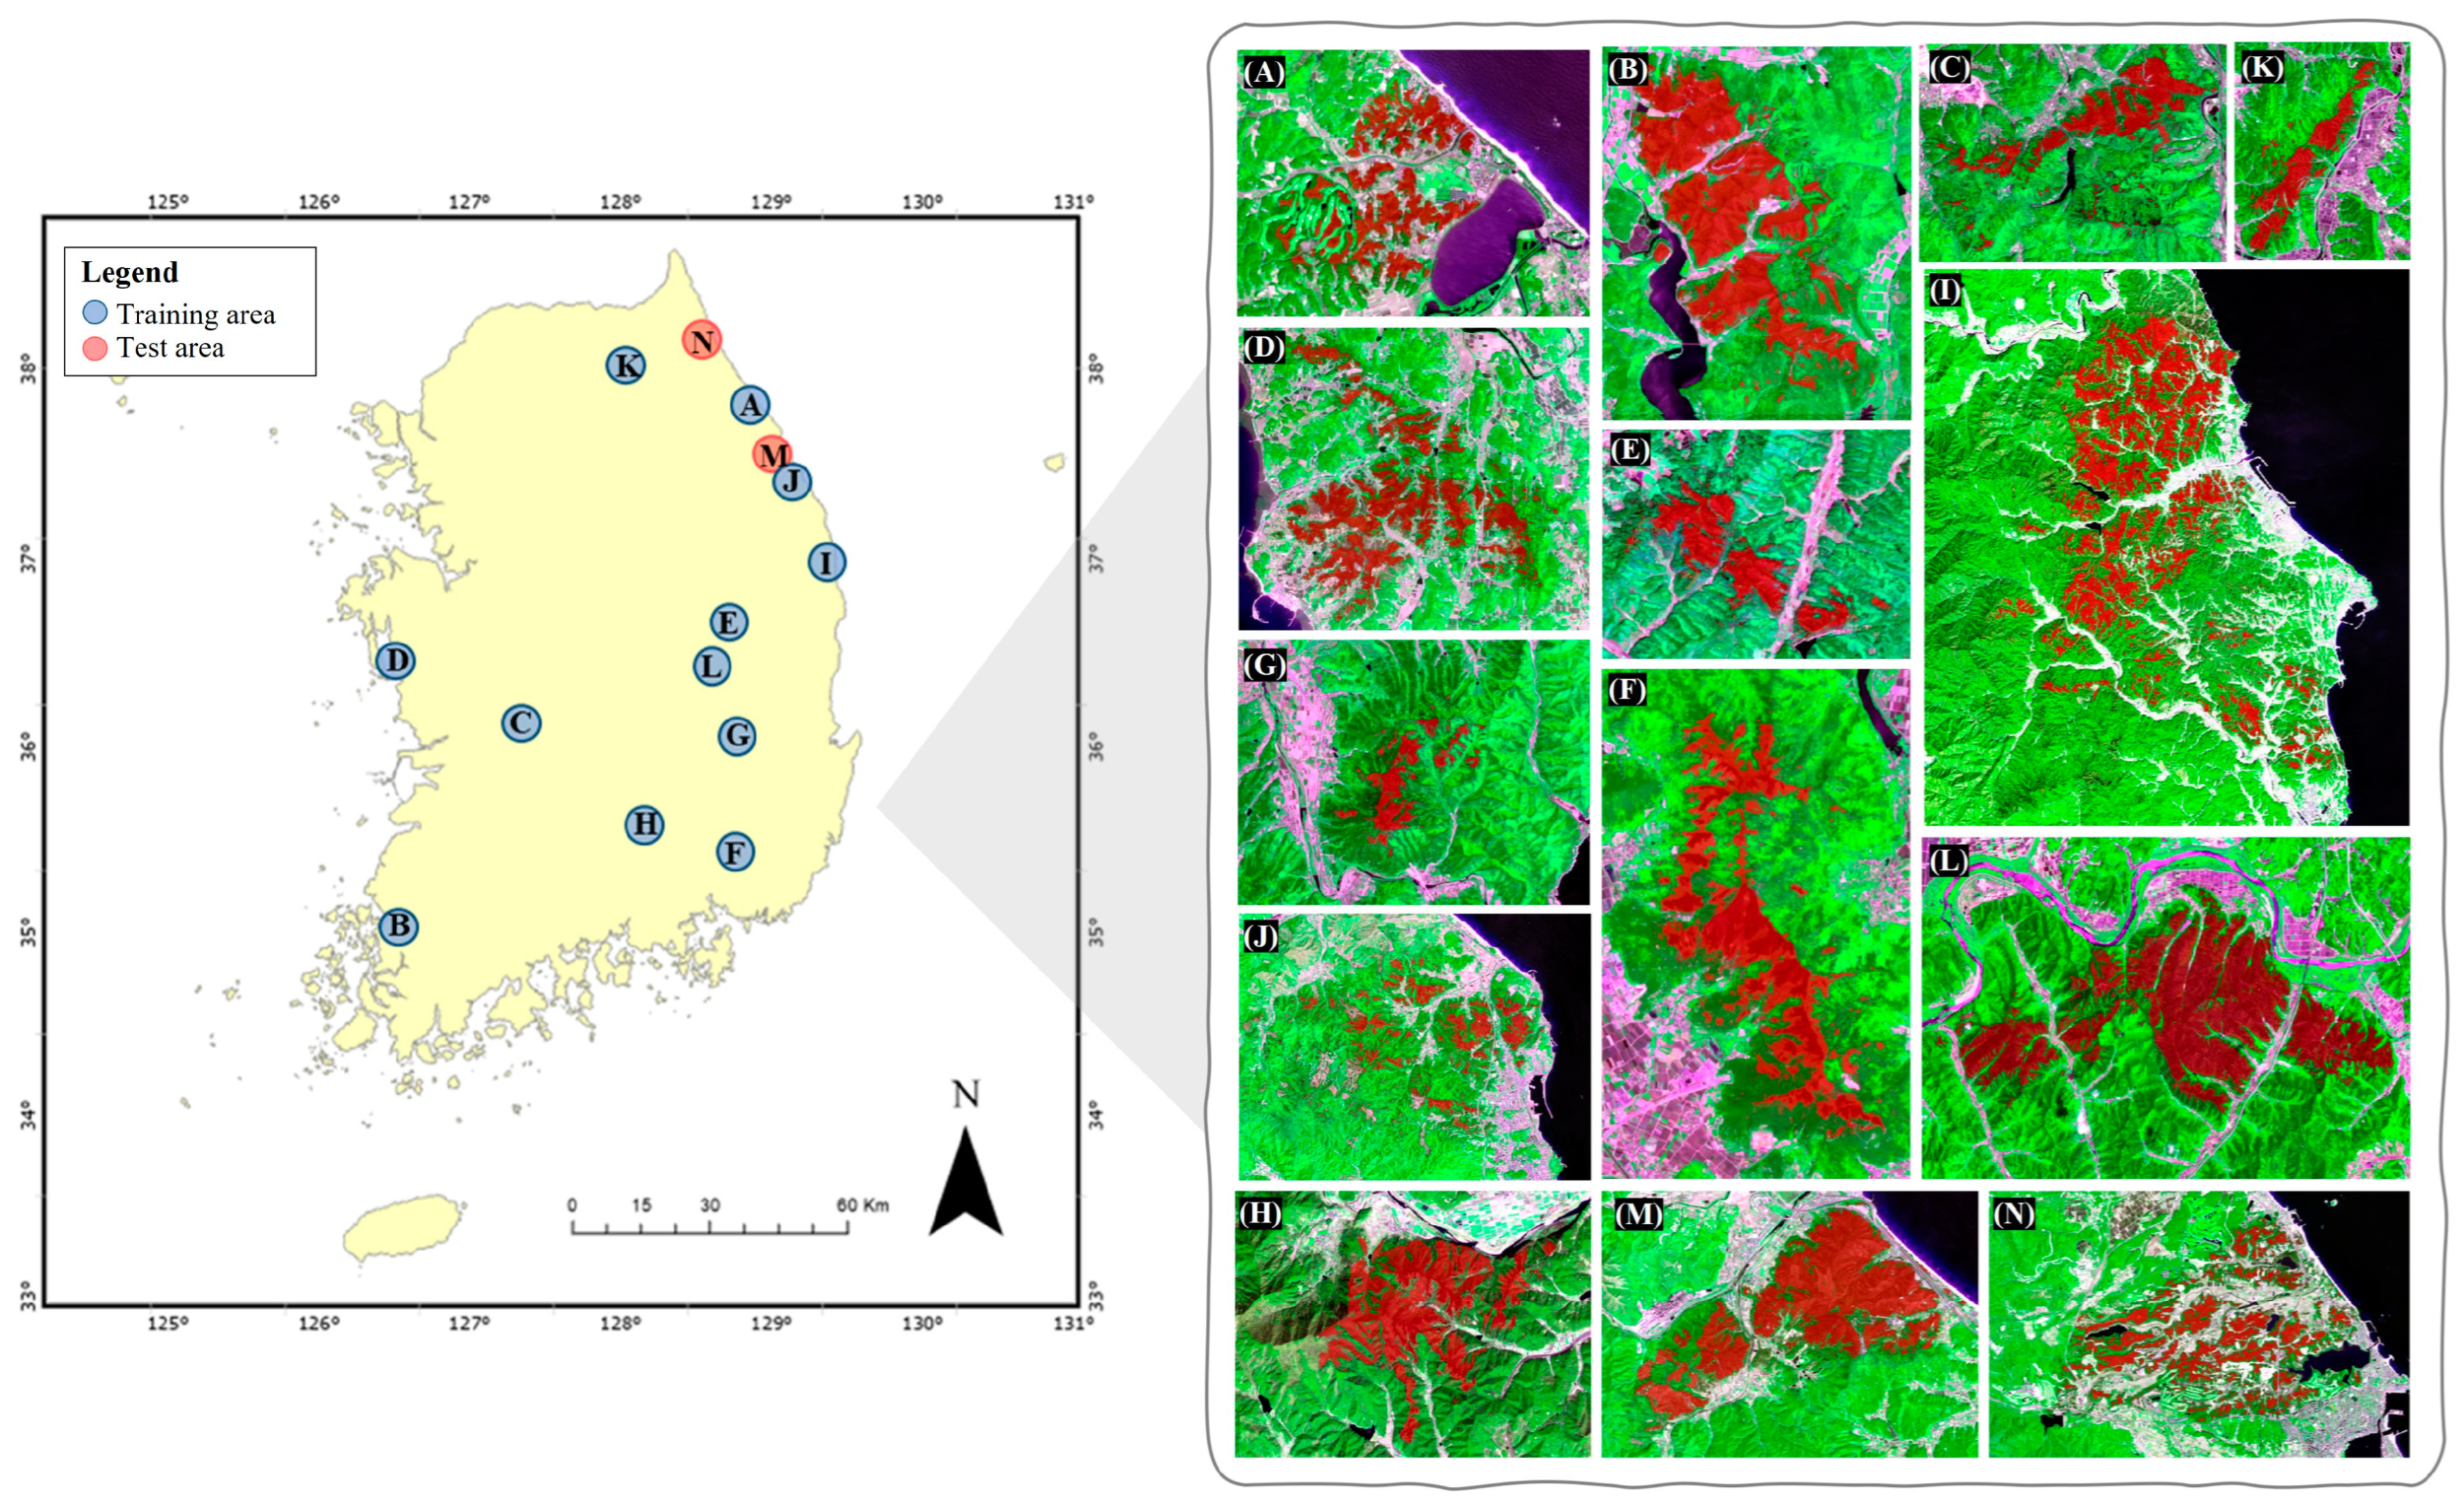
Fourteen forest fire incidents that occurred in Republic of Korea over the past 5 years (2019–2023) and covered 210 ha or more area were selected for analysis (Figure 1). Over 67% of the land in Republic of Korea is covered by forests and is vulnerable to fires. Approximately 60% of forest fires occur during the dry spring, when precipitation is low [39]. Furthermore, forest fires in Republic of Korea are more likely to be caused by anthropogenic factors, such as the burning of agricultural fields and accidental fires caused by human negligence, rather than natural causes. These fires pose a major threat in densely populated urban areas, causing substantial damage [2,40]. The 14 forest fires analyzed in this study occurred in various regions throughout Korea, with their locations encompassing various LCs such as urban areas, barren lands, and water bodies, in addition to forests. The Ministry of Environment, Republic of Korea (ME) classifies LC into seven major categories: urban areas, croplands, forests, grasslands, wetlands, barren lands, and waterbodies, providing this classification annually (Figure S1).
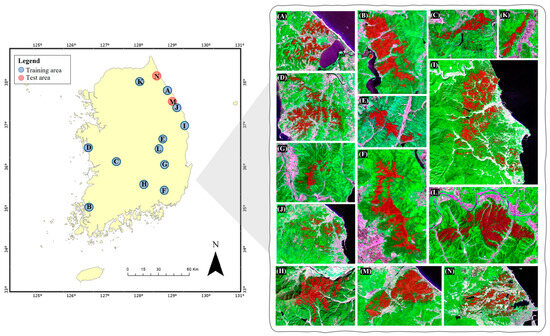
Figure 1.
False-color RNG (B4, B8, and B3) images of study areas (areas (A–N)), with red polygons indicating burned areas. The forest fire events are listed in Table 1.
Previous studies achieved optimal results when performing ML and DL analyses by dividing the dataset into training, validation, and test sets at various ratios, such as 8:1:1 or 6:2:2 [28,36]. However, with this approach, it is difficult to assess burned area detection performance objectively because images from the same area as the training dataset can also be used in the test. Therefore, in this study, the datasets used for ML and DL were analyzed by dividing 12 of the 14 areas mentioned in Table 1 in an 8:2 ratio. Furthermore, to conduct an independent performance analysis of the forest fire detection model, fires that occurred in Areas M and N in 2019 were selected as Test Areas. The forest fire that occurred in Area M exhibited relatively dense burned regions, but Area N showed a dispersed burn pattern reflecting intermixed urban areas. Therefore, these areas were selected as suitable test sites for the burned area detection model for Republic of Korea. The characteristics of the forest fire-affected areas used in the study are listed in Table 1.

Table 1.
Characteristics of the forest fires in Republic of Korea and Sentinel-2 images used for training and validation.
2.2. Sentinel-2 Multispectral Instrument
Images from the multispectral instrument (MSI) on board the Sentinel-2 satellite were utilized for this research. These images are openly provided by the European Space Agency (ESA, https://scihub.copernicus.eu/ (accessed on 6 June 2023)), which operates two satellites, Sentinel-2A and B, each with a temporal resolution of 10 days. If data from both satellites are used, the revisit period is shortened to 5 days. Sentinel-2 consists of 13 spectral bands with spatial resolutions ranging from 10 to 60 m, covering visible, NIR, and SWIR regions [41]. The information on the spectral bands used in the study is provided in Table 2. In Republic of Korea, the changes in the four seasons are distinct, leading to rapid transformations in the surrounding forests. Therefore, to conduct an accurate analysis, 39 level-1C images were obtained (Table 1) by referencing the event start and finish dates and focusing on images with a cloud cover of 10% or less.
Table 2.
Sentinel-2 spectral band information used in this study.
3. Methodology
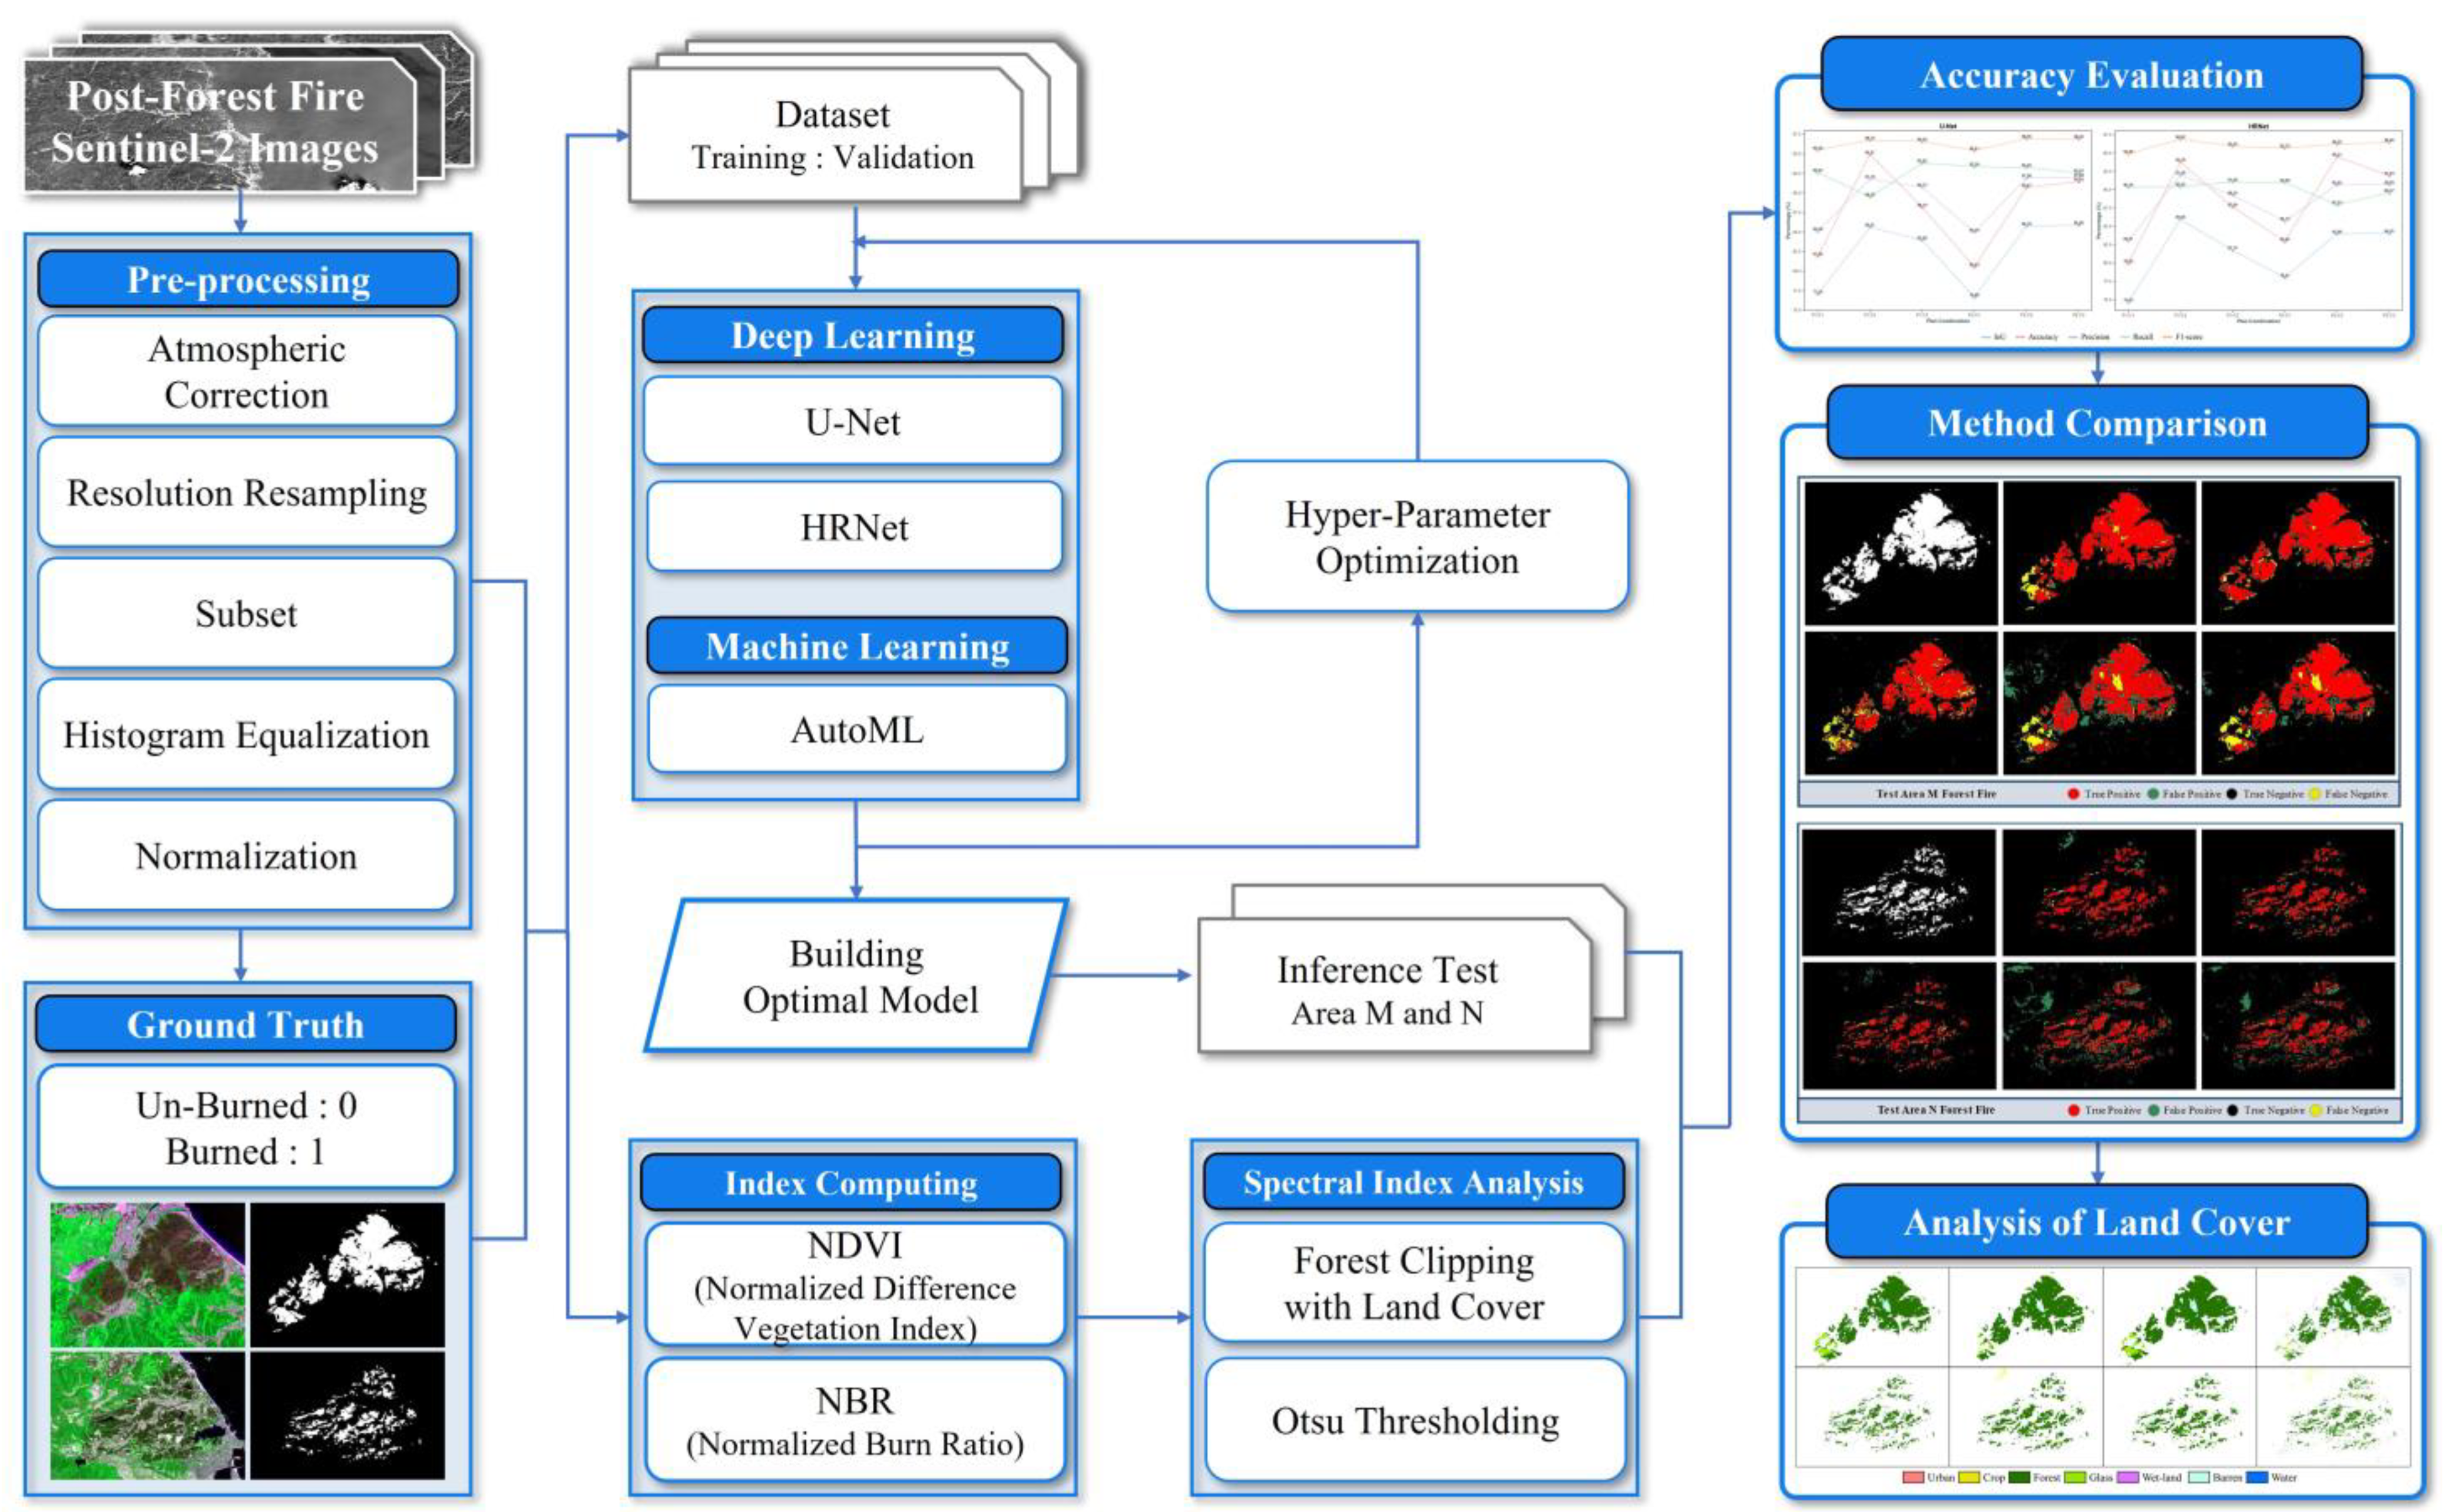
The research flow chart is depicted in Figure 2. The following steps were undertaken:
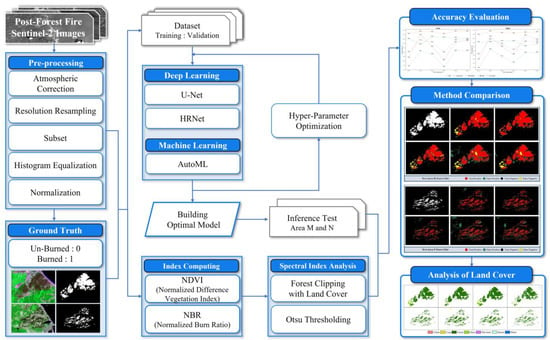
Figure 2.
Flowchart of burned area detection in this study.
- (1)
- Satellite image preprocessing: preprocess images to correct atmospheric disturbances in Sentinel-2 satellite images and improve clarity.
- (2)
- Generation of ground truth (GT) data: manually label forest fire-affected areas within the imagery for training and validation.
- (3)
- Creation of method-specific datasets: tailor datasets for different detection methods (DL, ML, and SI) by extracting relevant features and integrating GT data.
- (4)
- Environment configuration and hyperparameter optimization: set up computational resources and fine-tune algorithm parameters for optimal performance.
- (5)
- Evaluation of detection results: assess algorithm performance using accuracy assessment techniques and compare with GT data.
- (6)
- Analysis of forest fire damage in relation to LC types: analyze the detected forest fire damage areas in the context of different LC types, such as forests and grass.
3.1. Data Preparation
3.1.1. Sentinel-2 Image Preprocessing
To detect forest fire areas, the following preprocessing steps were performed.
- Level-1C images with top of atmosphere (TOA) reflectance values were atmospherically corrected using Sen2cor to derive level-2A surface reflectance with bottom of atmosphere (BOA) reflectance values [42].
- To align the spatial resolution of the Sentinel-2 image with that of the band, an up-sampling process was performed. The nearest neighbor interpolation method was applied to resample the SWIR (B11 and B12) data with a spatial resolution of 20–10 m.
- A subset of equal size was obtained through the area of intersection, utilizing the geographical coordinates from the areas where forest fires occurred.
- The image was reconstructed using histogram equalization to emphasize the contrast and make it easier to distinguish burned woodland and intact forest areas. Linear stretching was applied to expand the contrast of the histogram, resulting in values between 2% and 98%.
- Min–max normalization was applied because the distribution of reflectance values varies among different bands. The reflectance values were rescaled to a range of 0–255 using the minimum and maximum values of each band.
3.1.2. Generation of Ground Truth
GT data are crucial for evaluating the accuracy of detection algorithms. To generate the GT dataset for analyzing forest fire regions, pre-processed Sentinel-2 images along with Google Earth images were utilized. The labeling process was conducted manually by directly inspecting and labeling the areas using the Labkit tool within ImageJ Fiji Java 8. Unburned areas were designated as 0 and burned areas as 1. Using the semi-automatic labeling capability of the Labkit tool, which partially relies on user perception [43], the labeling process was completed. Subsequently, the acquired Sentinel-2 images were analyzed to identify regions affected by fire.
3.2. Deep Learning Approaches
This study compared various combinations of input channels to detect burned areas caused by forest fires, including natural-color RGB (B4, B3, and B2) and false-color RNG (B4, B8, and B3) images. False-color images are particularly useful for identifying forest fire damage. Previous studies have evaluated the feasibility of DL-based models for burn area segmentation in some localities testing band combinations for suitability [36,44]. Furthermore, the results obtained by applying indices were analyzed to distinguish burned forests according to the input channel. The combinations of spectral bands and indices analyzed in the study are listed in Table 3. Two analysis plans were established: Plan 1 included three combinations of individual spectral bands from MSI, and Plan 2 included additional SI (NDVI and NBR). The addition of SI to the input channels in Plan 2 was aimed to improve burn area detection while still maintaining the optimal input combination for DL.
Table 3.
Plan and input parameter combinations for deep learning forest fire detection.
3.2.1. U-Net Model
Ronneberger et al. [45] proposed U-Net, a DL model with a network structure that resembles the letter U, hence the name. The model has been used in various research fields, including satellite image segmentation and medical image analysis. It shows good performance in these applications using a small amount of training data. The U-Net architecture primarily involves the fusion of low-resolution features into high-resolution features through up-sampling while utilizing skip connections to transmit information from the encoder to the decoder. Consequently, the model can effectively preserve the characteristics and high-resolution information of important objects and perform segmentation tasks efficiently. In this study, three different backbones were considered for the UNet model: VGGNet, ResNet, and S5-D16. Among them, S5-D16 exhibited the most superior performance and was thus chosen as the backbone for the UNet model. Consequently, an analysis of the U-Net model using S5-D16 as the backbone was conducted.
3.2.2. HRNet Model
The HRNet model constructs its network by gradually including multi-scale feature fusions, considering both high-resolution and low-resolution features simultaneously. This model can effectively manage various sizes and comprehensive information of objects [46]. The HRNet modification HRNetV2 is a network architecture designed to improve the performance of segmentation in high-resolution images. This network can maintain the original high resolution while simultaneously preserving the characteristics of various resolutions during the computation process [47]. An extension of HRNetV2 that incorporates an object-contextual representations (OCR) mechanism, named HRNetV2+OCR, was proposed [48]. This extension enhances the segmentation of each pixel by actively utilizing contextual information from neighboring pixels and objects, resulting in more accurate object segmentation. In this study, the HRNetV2+OCR model was utilized using HRNetV2-W48 as the backbone. Here, “W” represents the width of the network; the larger the number, the deeper the network and the greater the number of parameters.
3.2.3. Deep Learning Environment
For DL analysis, a dataset was constructed by selecting only the patches from the built GT data that exhibited burned areas. To boost the training data size, augmentation techniques such as random flip, random rotate, grid distortion, brightness contrast, and gaussian blur were applied to the training dataset using the Python Albumentations library. The DL models used in this study were subjected to iterative experimentation to tune their hyperparameters, resulting in optimal performance for each model. Each model was trained for 40,000 iterations, and the performance of the test dataset was evaluated using the checkpoint of the best-performing model. A crop size of 256 × 256 pixels was chosen as it yielded the best results among the three sizes tested (128, 256, and 512 pixels). The batch size and learning rate of the two models were determined through iterative experimentation. The hyperparameters of the DL model used in the study are listed in Table 4. They were derived from optimal values based on repeated experiments, and these settings are an important component of the DL model.
Table 4.
Hyperparameters used in the DL model for detecting forest fire-damaged areas.
3.3. Machine Learning Approaches
3.3.1. AutoML Model
AutoML can automate the process of applying ML to increase productivity and efficiency [49,50]. It improves the performance accuracy through automatic parameter optimization for various artificial intelligence models, such as random forest, support vector machine, and gradient boosting machine, and then assembles the top N models as a best-performing model. Moreover, this technique minimizes the involvement of the model developer in the process, from data preprocessing to algorithm selection and tuning.
3.3.2. Machine Learning Environment
For ML analysis, ArcGIS Pro v2.9.0 was used to extract spectral band values and GT data for each point based on the coordinates of satellite imagery (in geo-tiff format) for each region. Random data sampling was performed to address the imbalance between the burned and unburned areas, with a ratio of approximately 1:10. Subsequently, an AutoML analysis was conducted using the open-source, low-code-based ML library PyCaret in Python. This involved binary classification, 10-fold cross-validation, and grid search for hyperparameter optimization. Consequently, the optimal ML model for each input image was constructed.
3.4. Spectral Indices-Based Approaches
NDVI and NBR indices were applied to analyze the SI-based data. In the SI analysis, the threshold can be set based on the user’s visual judgment. However, to analyze the automatic burned area detection performance, the thresholding technique proposed by Otsu [51] was employed. The Otsu algorithm divides pixels into two classes using a user-defined threshold value, t; iteratively calculates the contrast distributions of the two classes; and selects the optimal threshold value, t, which maximizes the uniformity of the contrast distributions for each class (Equation (1)). Through this process, a binary comparison was performed between the burned and unburned areas.
The interclass average is the probability that pixels and belong to classes and , respectively.
3.4.1. Normalized Difference Vegetation Index (NDVI)
Tucker [15] developed NDVI as an index that capitalizes on a striking difference in reflectance of plants between the NIR and red wavelengths. In plants, reflectance in the NIR band is high, whereas that in the red region is relatively low. The NDVI value obtained through Equation (2) varies from −1 to 1. NDVI may be used to assess vegetation characteristics. It is utilized not only for forest monitoring, soil moisture analysis, and LC change detection, but also for monitoring natural disasters, such as forest fires and dust storms.
3.4.2. Normalized Burn Ratio
García and Caselles [18] developed NBR, which utilizes the difference in reflectance between NIR and SWIR to detect damage caused by forest fires. The calculating formula for NBR is similar to that for NDVI. Unaffected forests that have not experienced forest fires exhibit high NIR reflectance, whereas burned forests have high reflectance values in the SWIR band. Thus, a high NBR value indicates undamaged forest areas, while a low value indicates recently burned areas and resembles bare ground. Generally, in areas that have not been burned, the NBR value tends to be close to zero. This study applied the B12 band, which showed high performance in previous research, to calculate the NBR index (Equation (3)) using two SWIR bands in Sentinel-2 images [52].
3.4.3. Spectral Indices Analysis
When analyzing NDVI and NBR, images are collected before and after the occurrence of a forest fire, and subsequently, the difference is calculated to determine the extent of the burned forest. However, in this study, we used the LCs provided by the National Geographic Information Institute to compare the performance of a single-temporal automated analysis. Initially, a forest-masking shapefile was constructed for the whole of Republic of Korea. Subsequently, a code was implemented using the Geospatial Data Abstraction Library [53] to clip the forest area based on the footprint of the input satellite image, resulting in a forest-masking shapefile. This shapefile was used to exclude water bodies and urban areas from our analysis as they exhibit low reflectance similar to burned areas. Finally, an exponential analysis was performed using the Otsu algorithm, and this process was implemented with a Python-based automated framework.
3.5. Accuracy Evaluation
The performance of the forest fire area detection model was evaluated using a confusion matrix, which represents the relationship between the model’s predicted results and actual values. Model performance was evaluated using accuracy (Equation (4)), precision (Equation (5)), recall (Equation (6)), F1-score (Equation (7)), and intersection over union (IoU, Equation (8)) based on the derived true positive (TP), false positive (FP), false negative (FN), and true negative (TN) forest fire pixels detected by the model. These indices can be used to evaluate the predictive ability of the model and assist in interpreting the results. Accuracy indicates the overall prediction accuracy, whereas precision and recall measure how accurately the model predicted and how well it detected the actual case. The F1-score is applied to evaluate the overall performance of a model by considering the balance between precision and recall. IoU is used to evaluate model accuracy by measuring the overlap of predicted and actual regions in object detection or segmentation. These evaluation metrics were used to assess the performance of the forest fire damage detection model; additionally, the strengths and weaknesses of the model were determined to provide future improvement directions.
4. Results
4.1. Input Image Combination for Deep Learning Models
Table 5 lists the quantitative results of U-Net and HRNet. The results were averaged for Test Areas M and N (Figure 1) to provide an overall performance comparison for each model and combination. The quantitative analysis results, obtained by applying various combinations of input variables, differed slightly in the application results of C2 and C3 between the models. When C1 was applied, it showed the worst performance across all models. Across DL models, U-Net exhibited superior performance with an IoU of 85.61 and 85.76% in the P1-C2 and P2-C3 datasets, respectively. However, HRNet achieved the best result with an IoU of 85.95 for P1-C2. Both DL models demonstrated the poorest performance when applied to P1-C1.
Table 5.
DL model performance depending on input image combination.
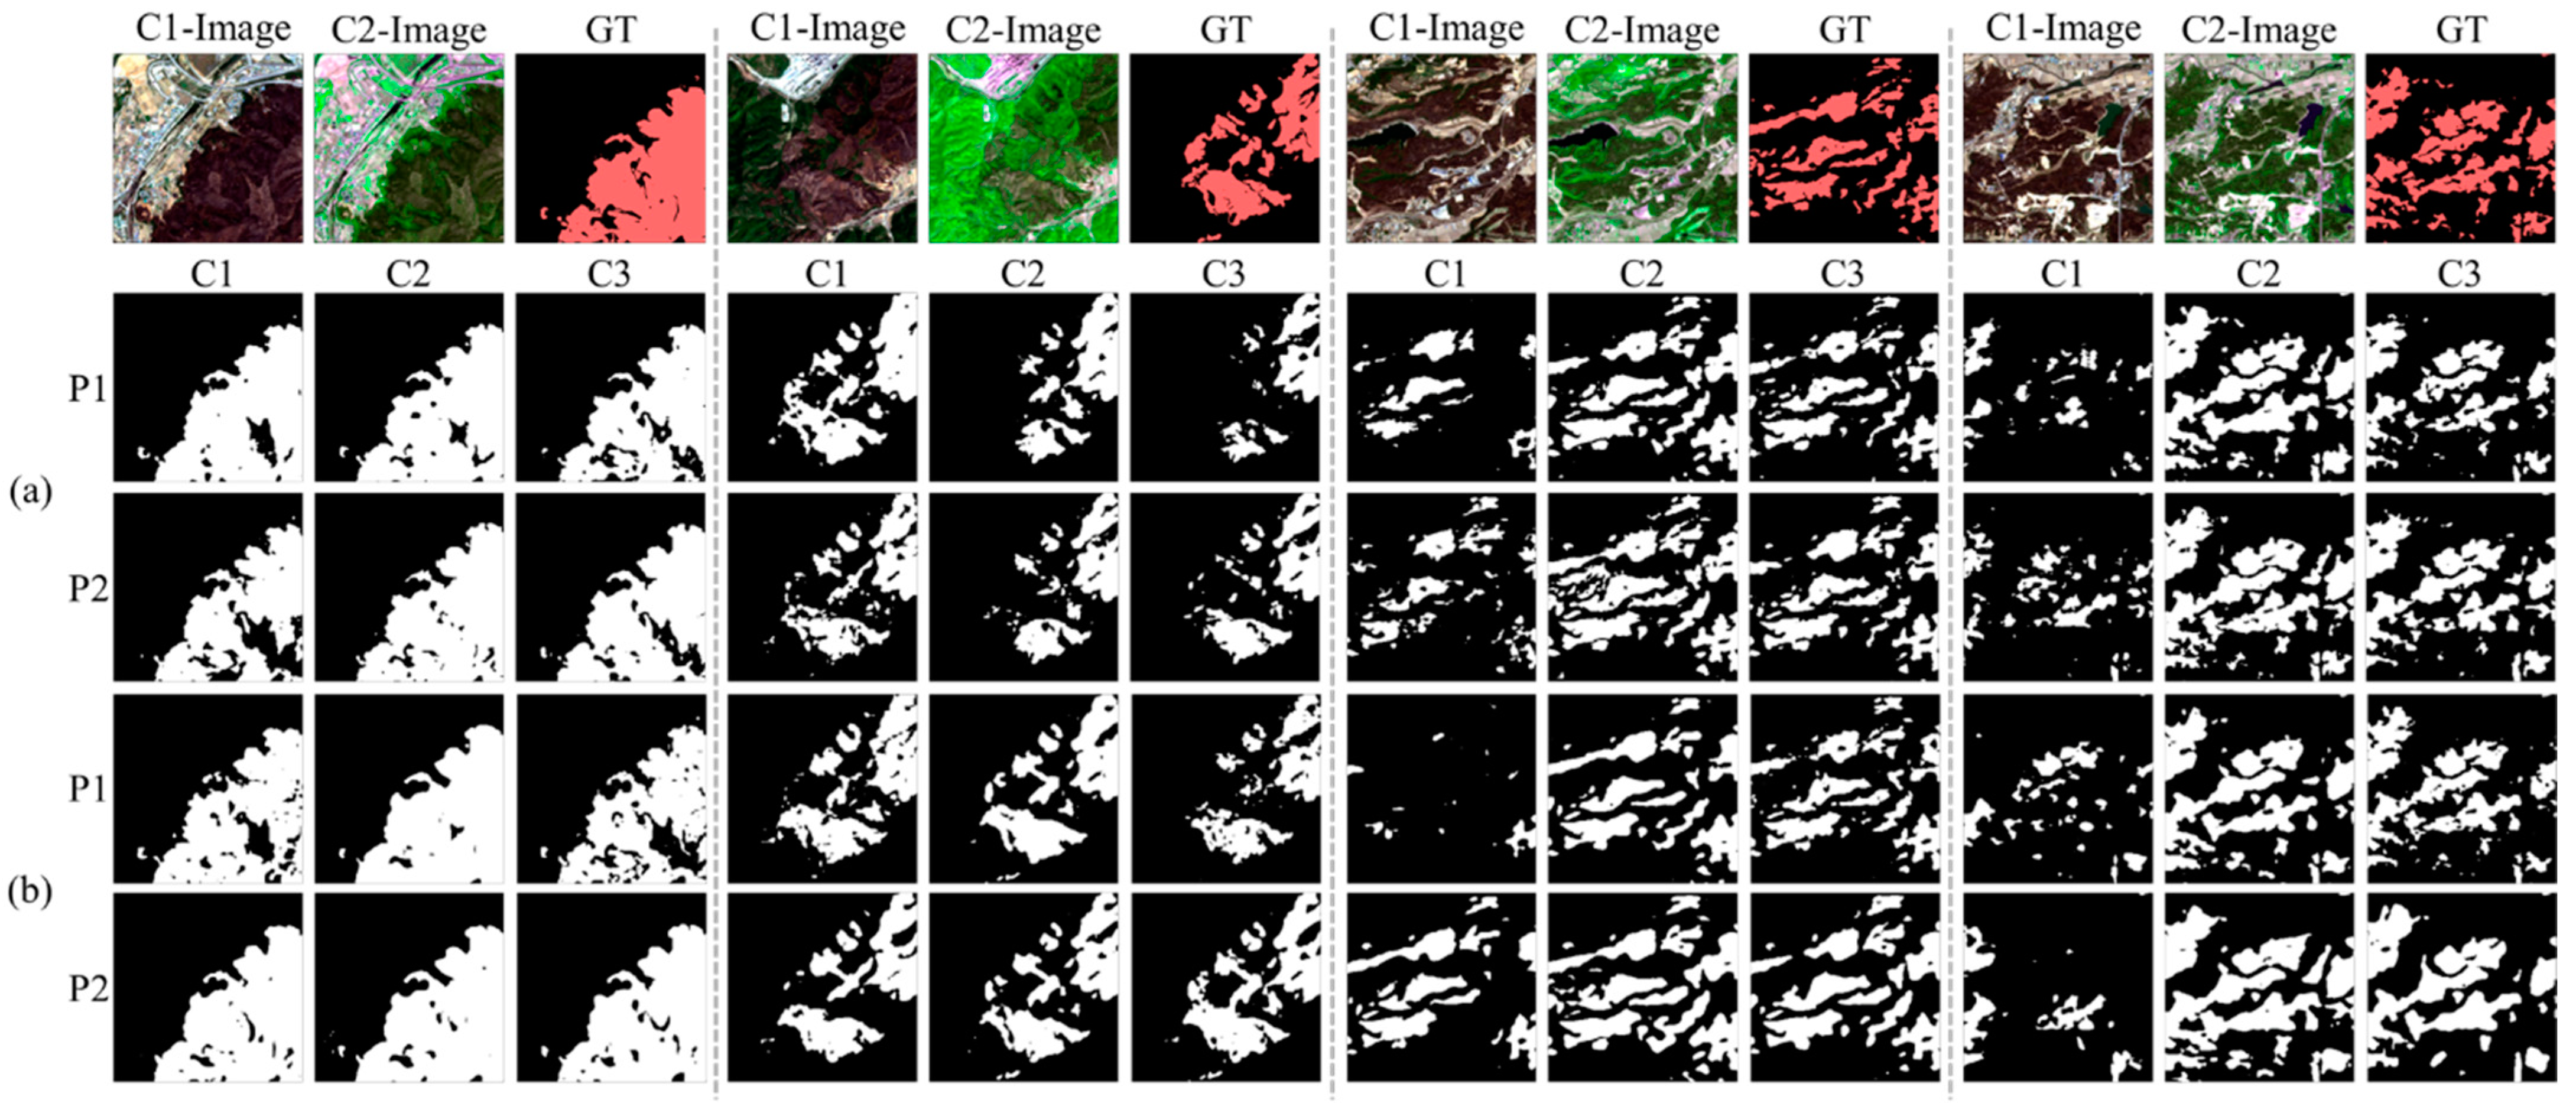
A comparison of the quantitative results of each plan revealed no significant differences overall. Figure 3 demonstrates that effective segmentation was achieved in dense forest fire areas. However, from a qualitative perspective, anomalies were detected in buildings, agricultural areas, and other mixed areas in urban and suburban regions. From the perspective of input images, C1 exhibited low results in the input images, similar to quantitative values. This was interpreted as a result of subtle differences in pixel values in urban areas in the C1 image, whereas burned forests and other areas were clearly distinguished in images that included spectral bands beyond the visible spectra, such as NIR and SWIR. From the perspectives of P1 and P2, the final outcomes were compared when a single time point SI was used and not used. Unexpectedly, C2 images outperformed the others in cases excluding the index, implying that even with only false-color three-band imagery, the effective detection of burned areas can be achieved. Therefore, even in the absence of the SWIR band in optical satellites, it will be possible to apply this approach to different environments in the future.
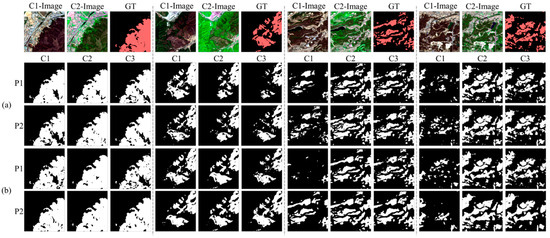
Figure 3.
Qualitative results of deep learning input image combination analysis. Analysis for each patch of Test Areas M and N. The relevant information regarding the explanation of C1, C2, C3, and P1, P2 is provided in Table 3. (a) U-Net and (b) HRNet.
4.2. Comparison of the Model Results in Test Study Areas
The analysis of each combination of P1 and P2 in Section 4.1 was performed by applying P1-C2, which showed the best performance. The quantitative accuracies of DL and ML model analyses and SI-based methods, such as NDVI and NBR, are presented in Table 6, for study Areas M and N, respectively. In Area M, NDVI exhibited the lowest accuracy with an IoU of 61.50%, although it showed high accuracy in all other methods. However, in the detection of burned areas in the imbalanced data of Area N, the DL method demonstrated significantly superior performance compared to the ML and SI methods. This highlights the DL method’s ability to exhibit superior classification performance even in scenarios where the data are imbalanced. By applying AutoML in the ML methods, wherein several ML models were automatically evaluated and selected, light gradient boosting machine was selected as the algorithm with the highest performance. In the SI-based approach, NBR demonstrated superior performance compared to NDVI. Therefore, NBR can be effectively utilized for detecting forest fire damage when classifying burned forests instead of or in addition to NDVI.
Table 6.
Quantitative performance of each forest fire detection analysis model in Test Areas M and N. Accuracy evaluation of each model (%).
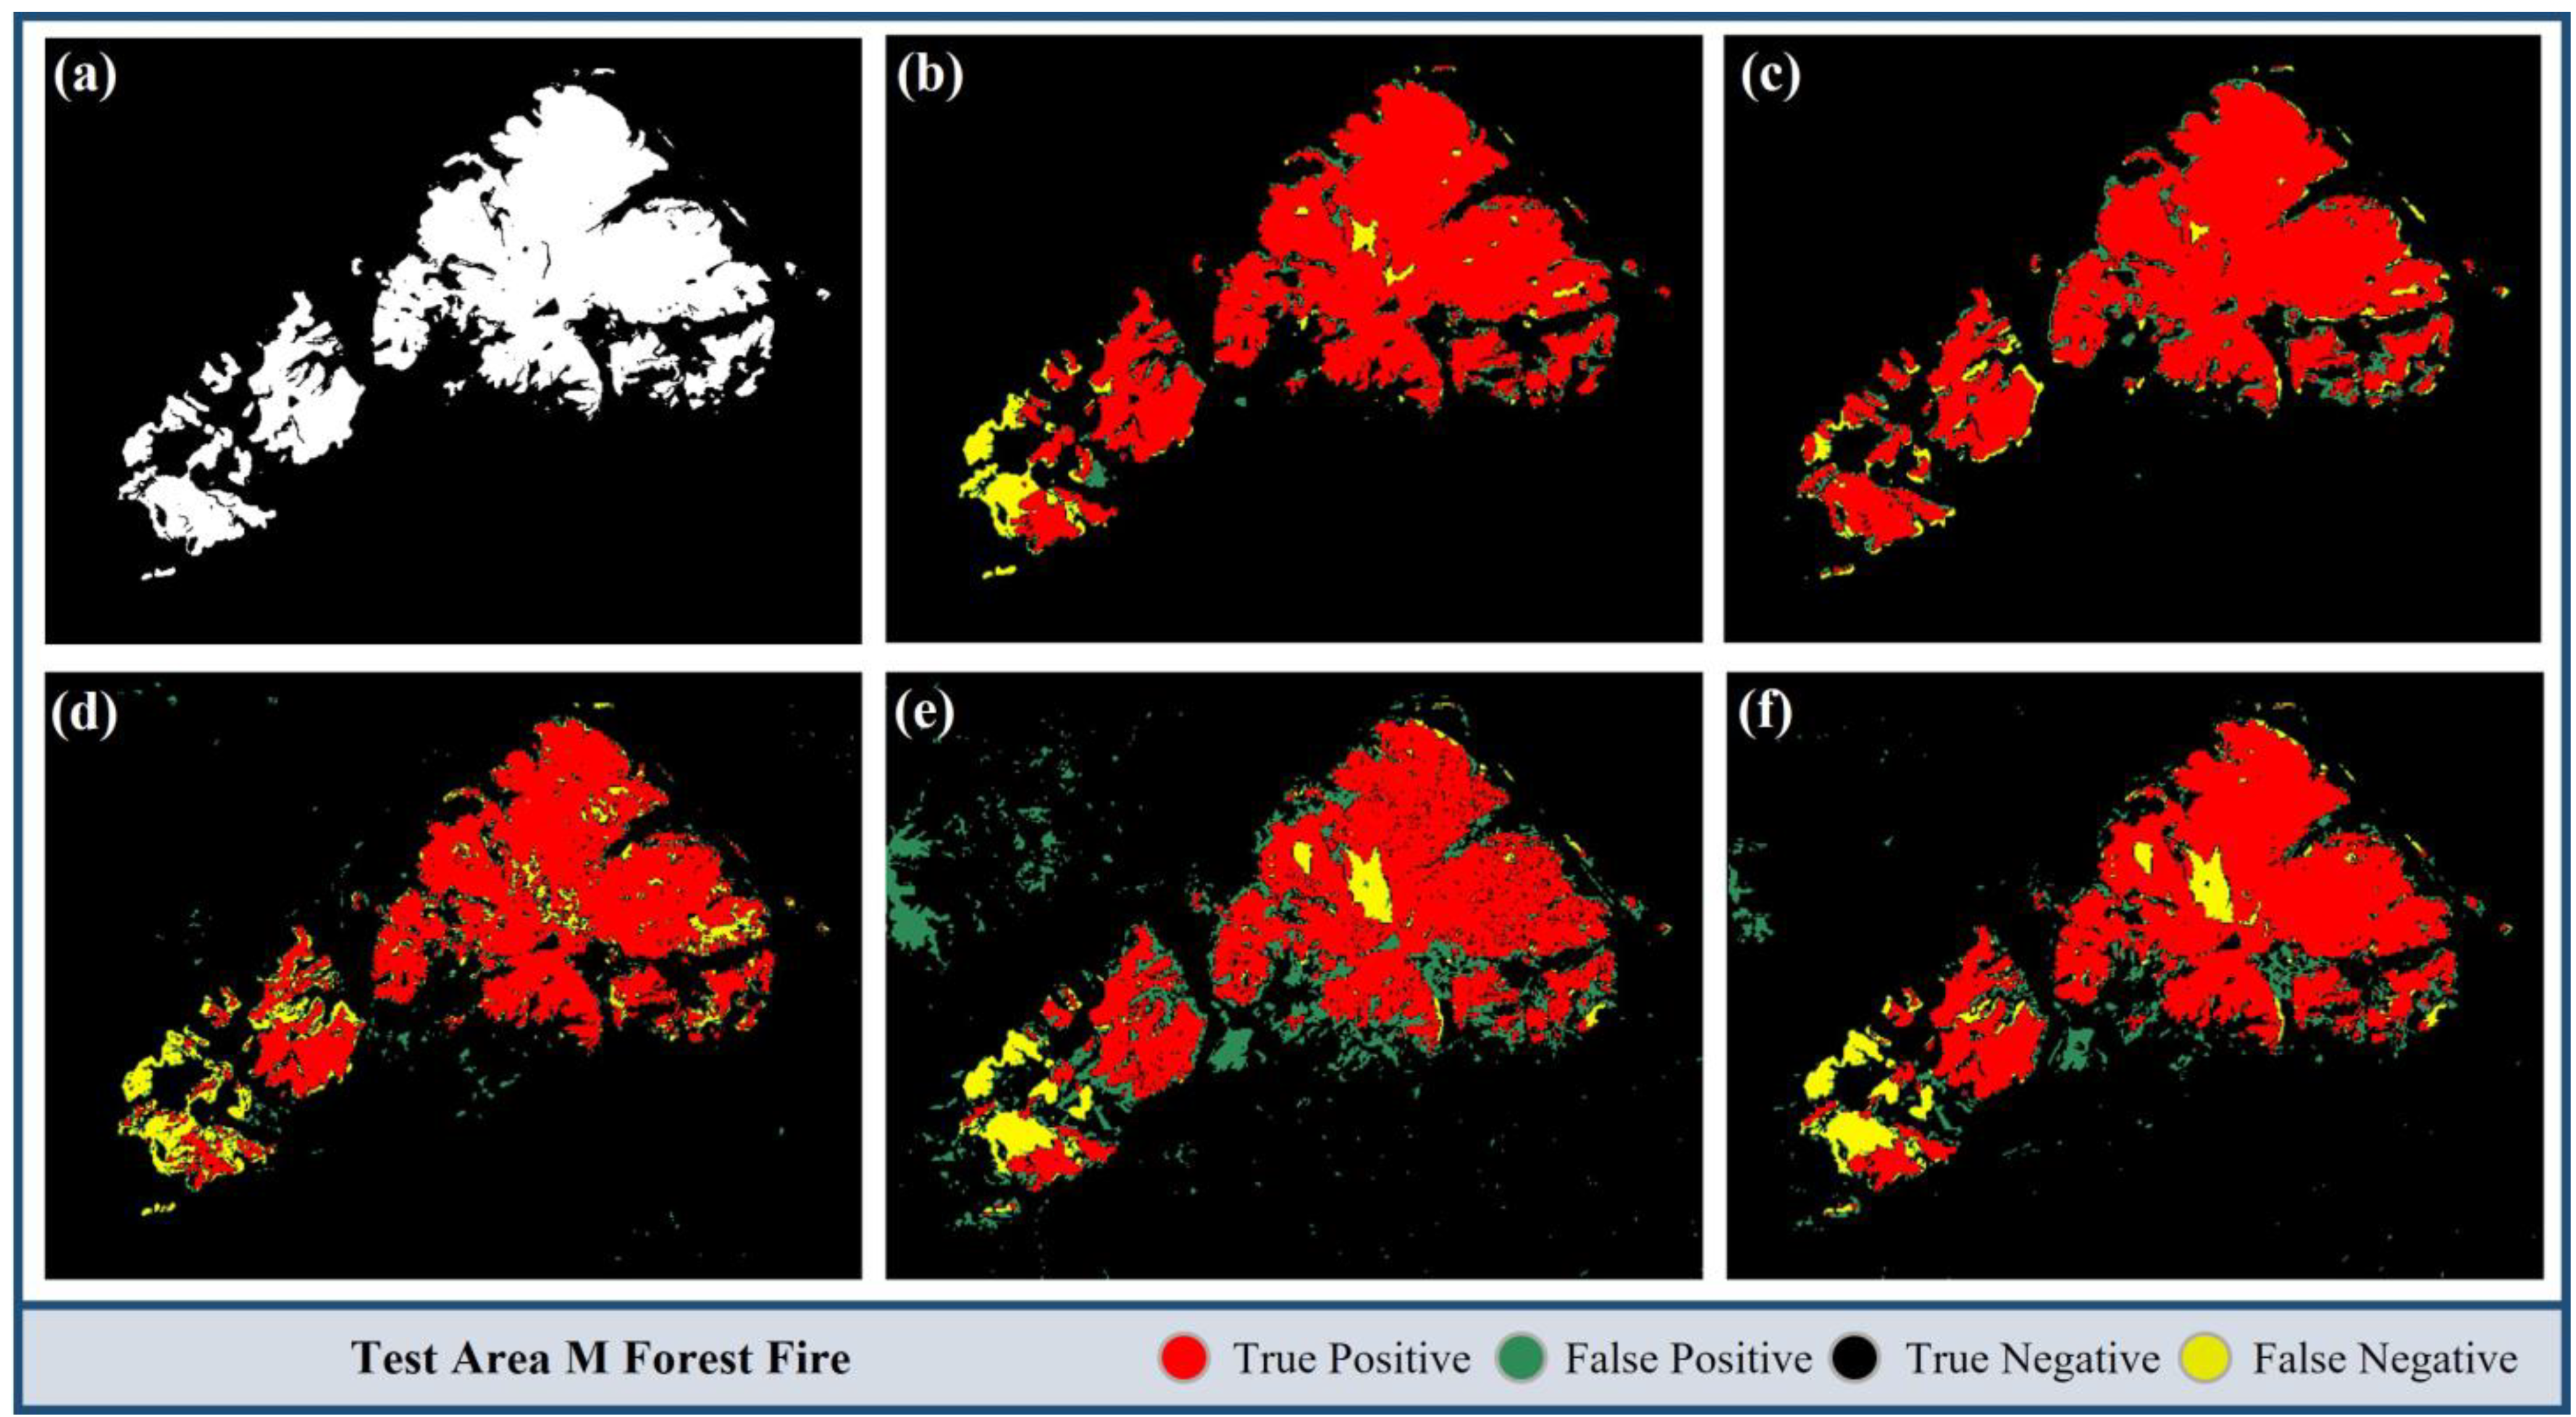
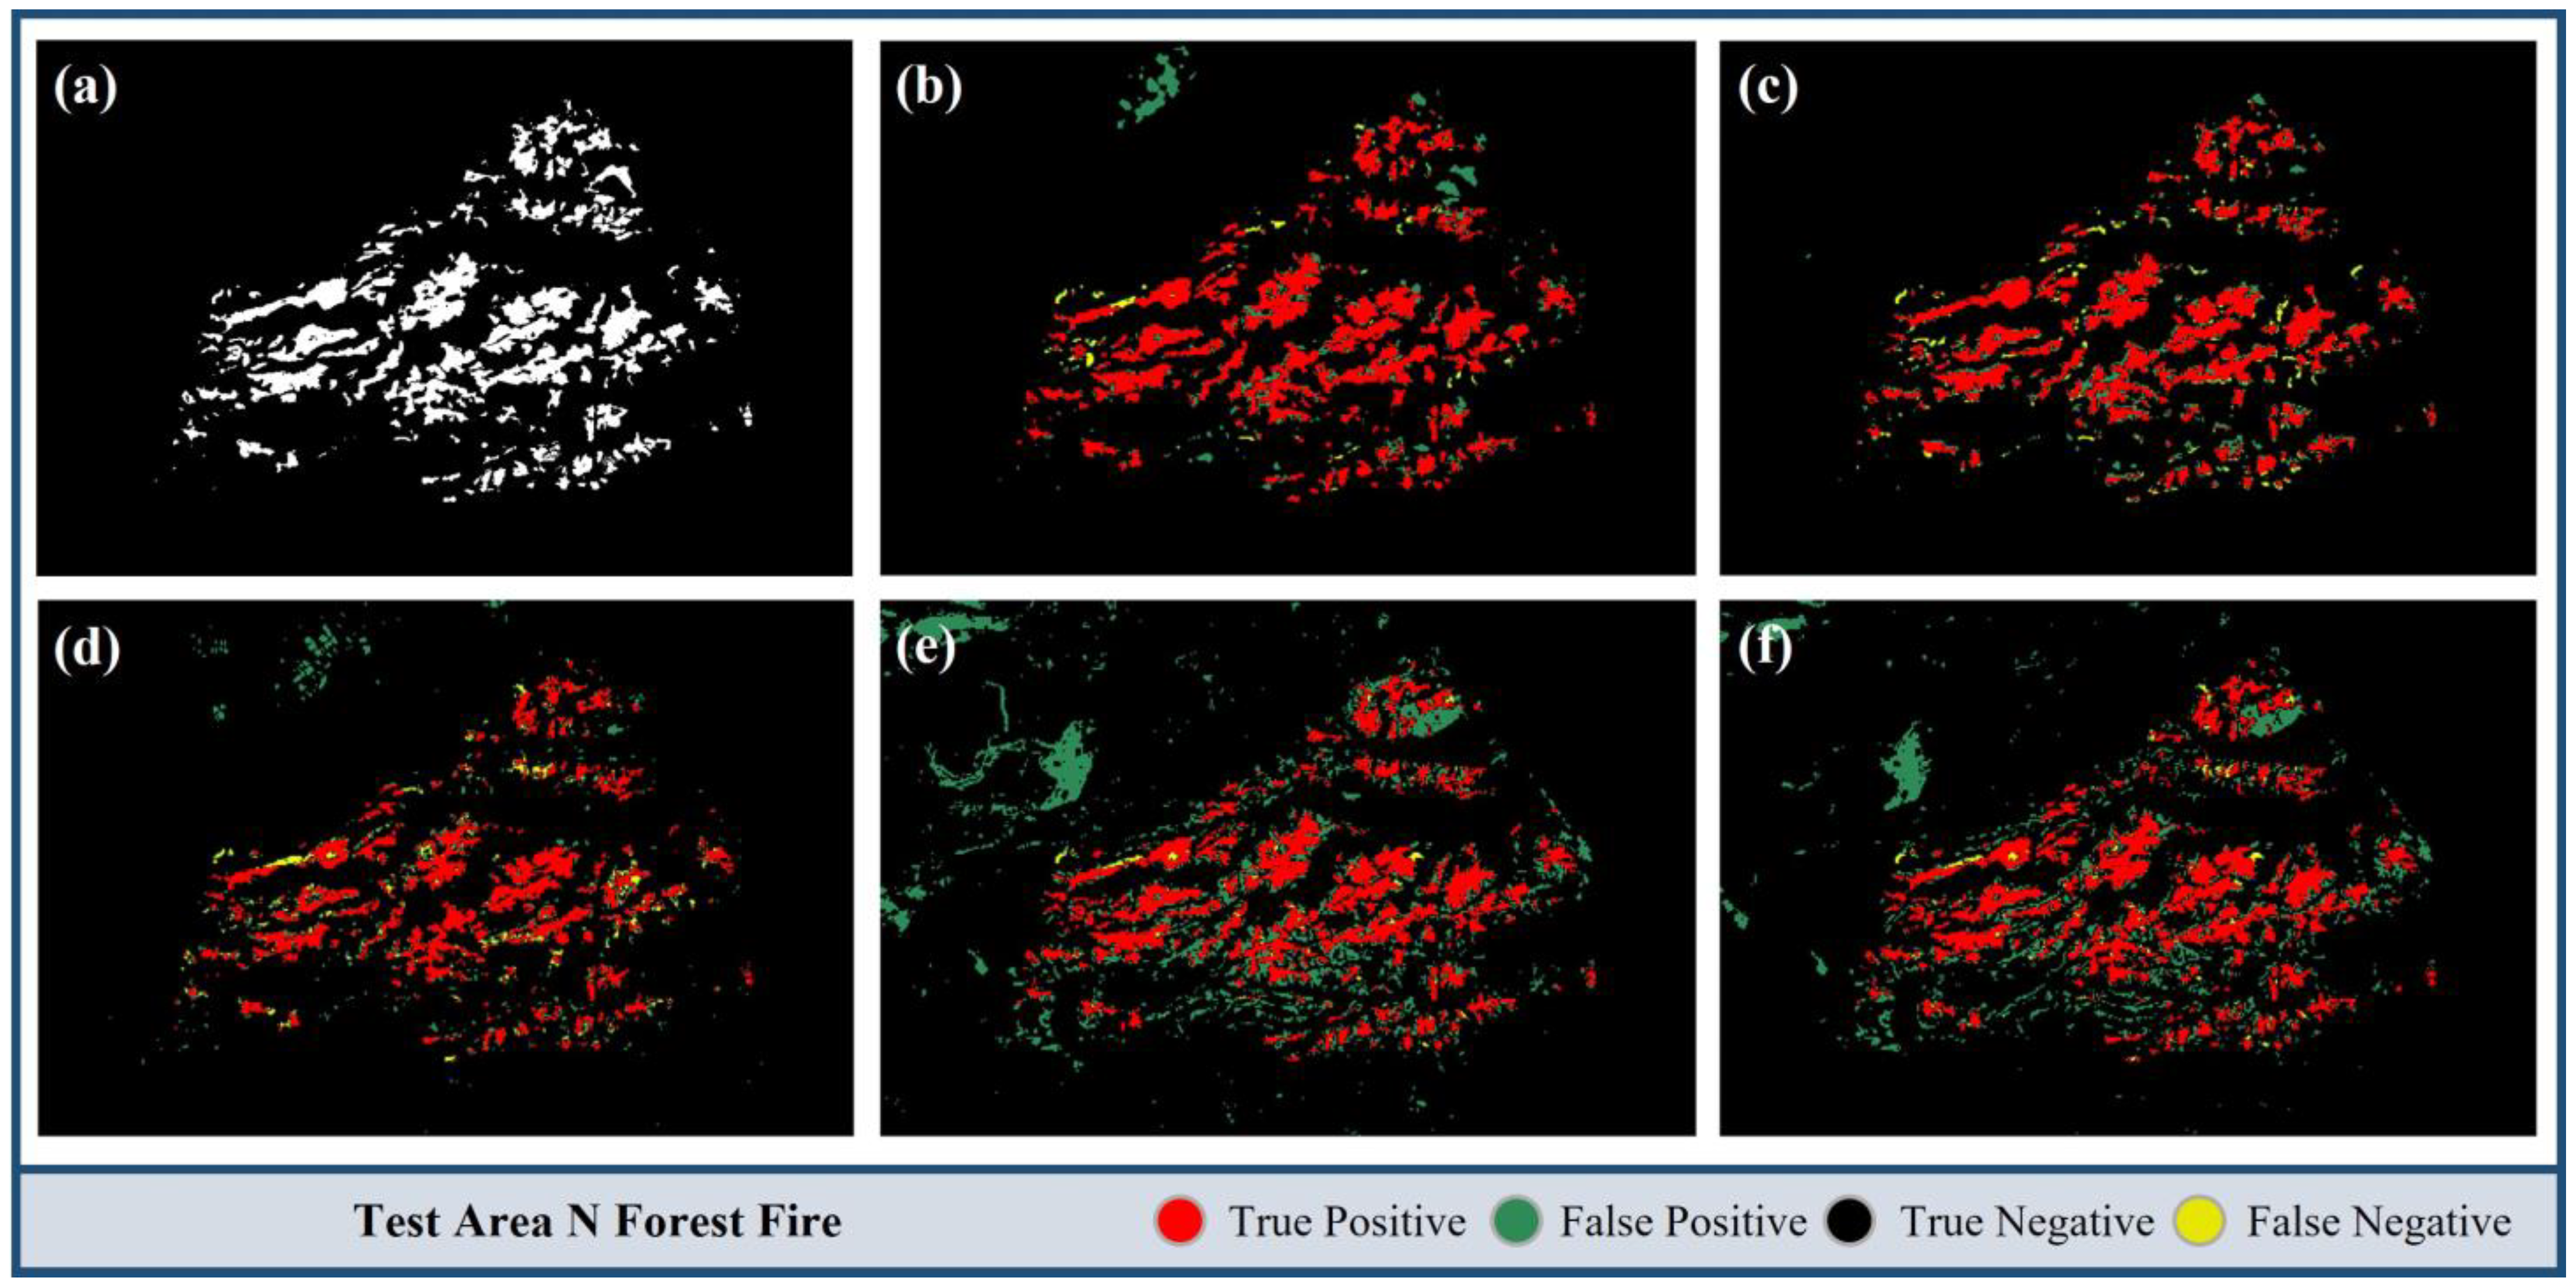
In a comparison of the IoU value of DL models, HRNet exhibited higher values for both study areas. However, when comparing the F1-score, which is a metric for evaluating the model performance on imbalanced datasets, U-Net showed a performance of 95.55% in Area N, whereas HRNet showed a performance of 89.70%. This finding shows that U-Net can effectively overcome imbalanced conditions in complex geographical settings. However, as shown in Figure 4 and Figure 5, U-Net exhibited a tendency to incorrectly classify glass as forest, demonstrating the model’s limitations. Thus, there is a need for future improvements and enhancements. The lower performance of HRNet can be attributed to its tendency towards underestimates in certain areas. Therefore, this issue needs to be identified, and measures should be implemented to address it.

Figure 4.
Forest fire detection performance results of the models in Area M: (a) GT, (b) U-Net, (c) HRNet, (d) AutoML, (e) NDVI, and (f) NBR.
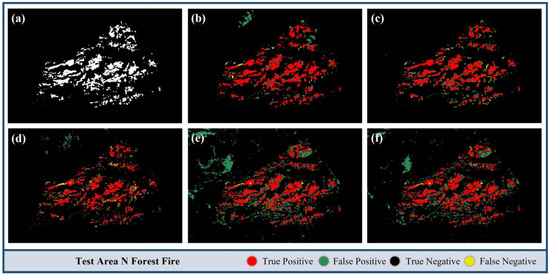
Figure 5.
Forest fire detection performance results of the models in Area N: (a) GT, (b) U-Net, (c) HRNet, (d) AutoML, (e) NDVI, and (f) NBR.
4.3. Analysis Considering Land Cover
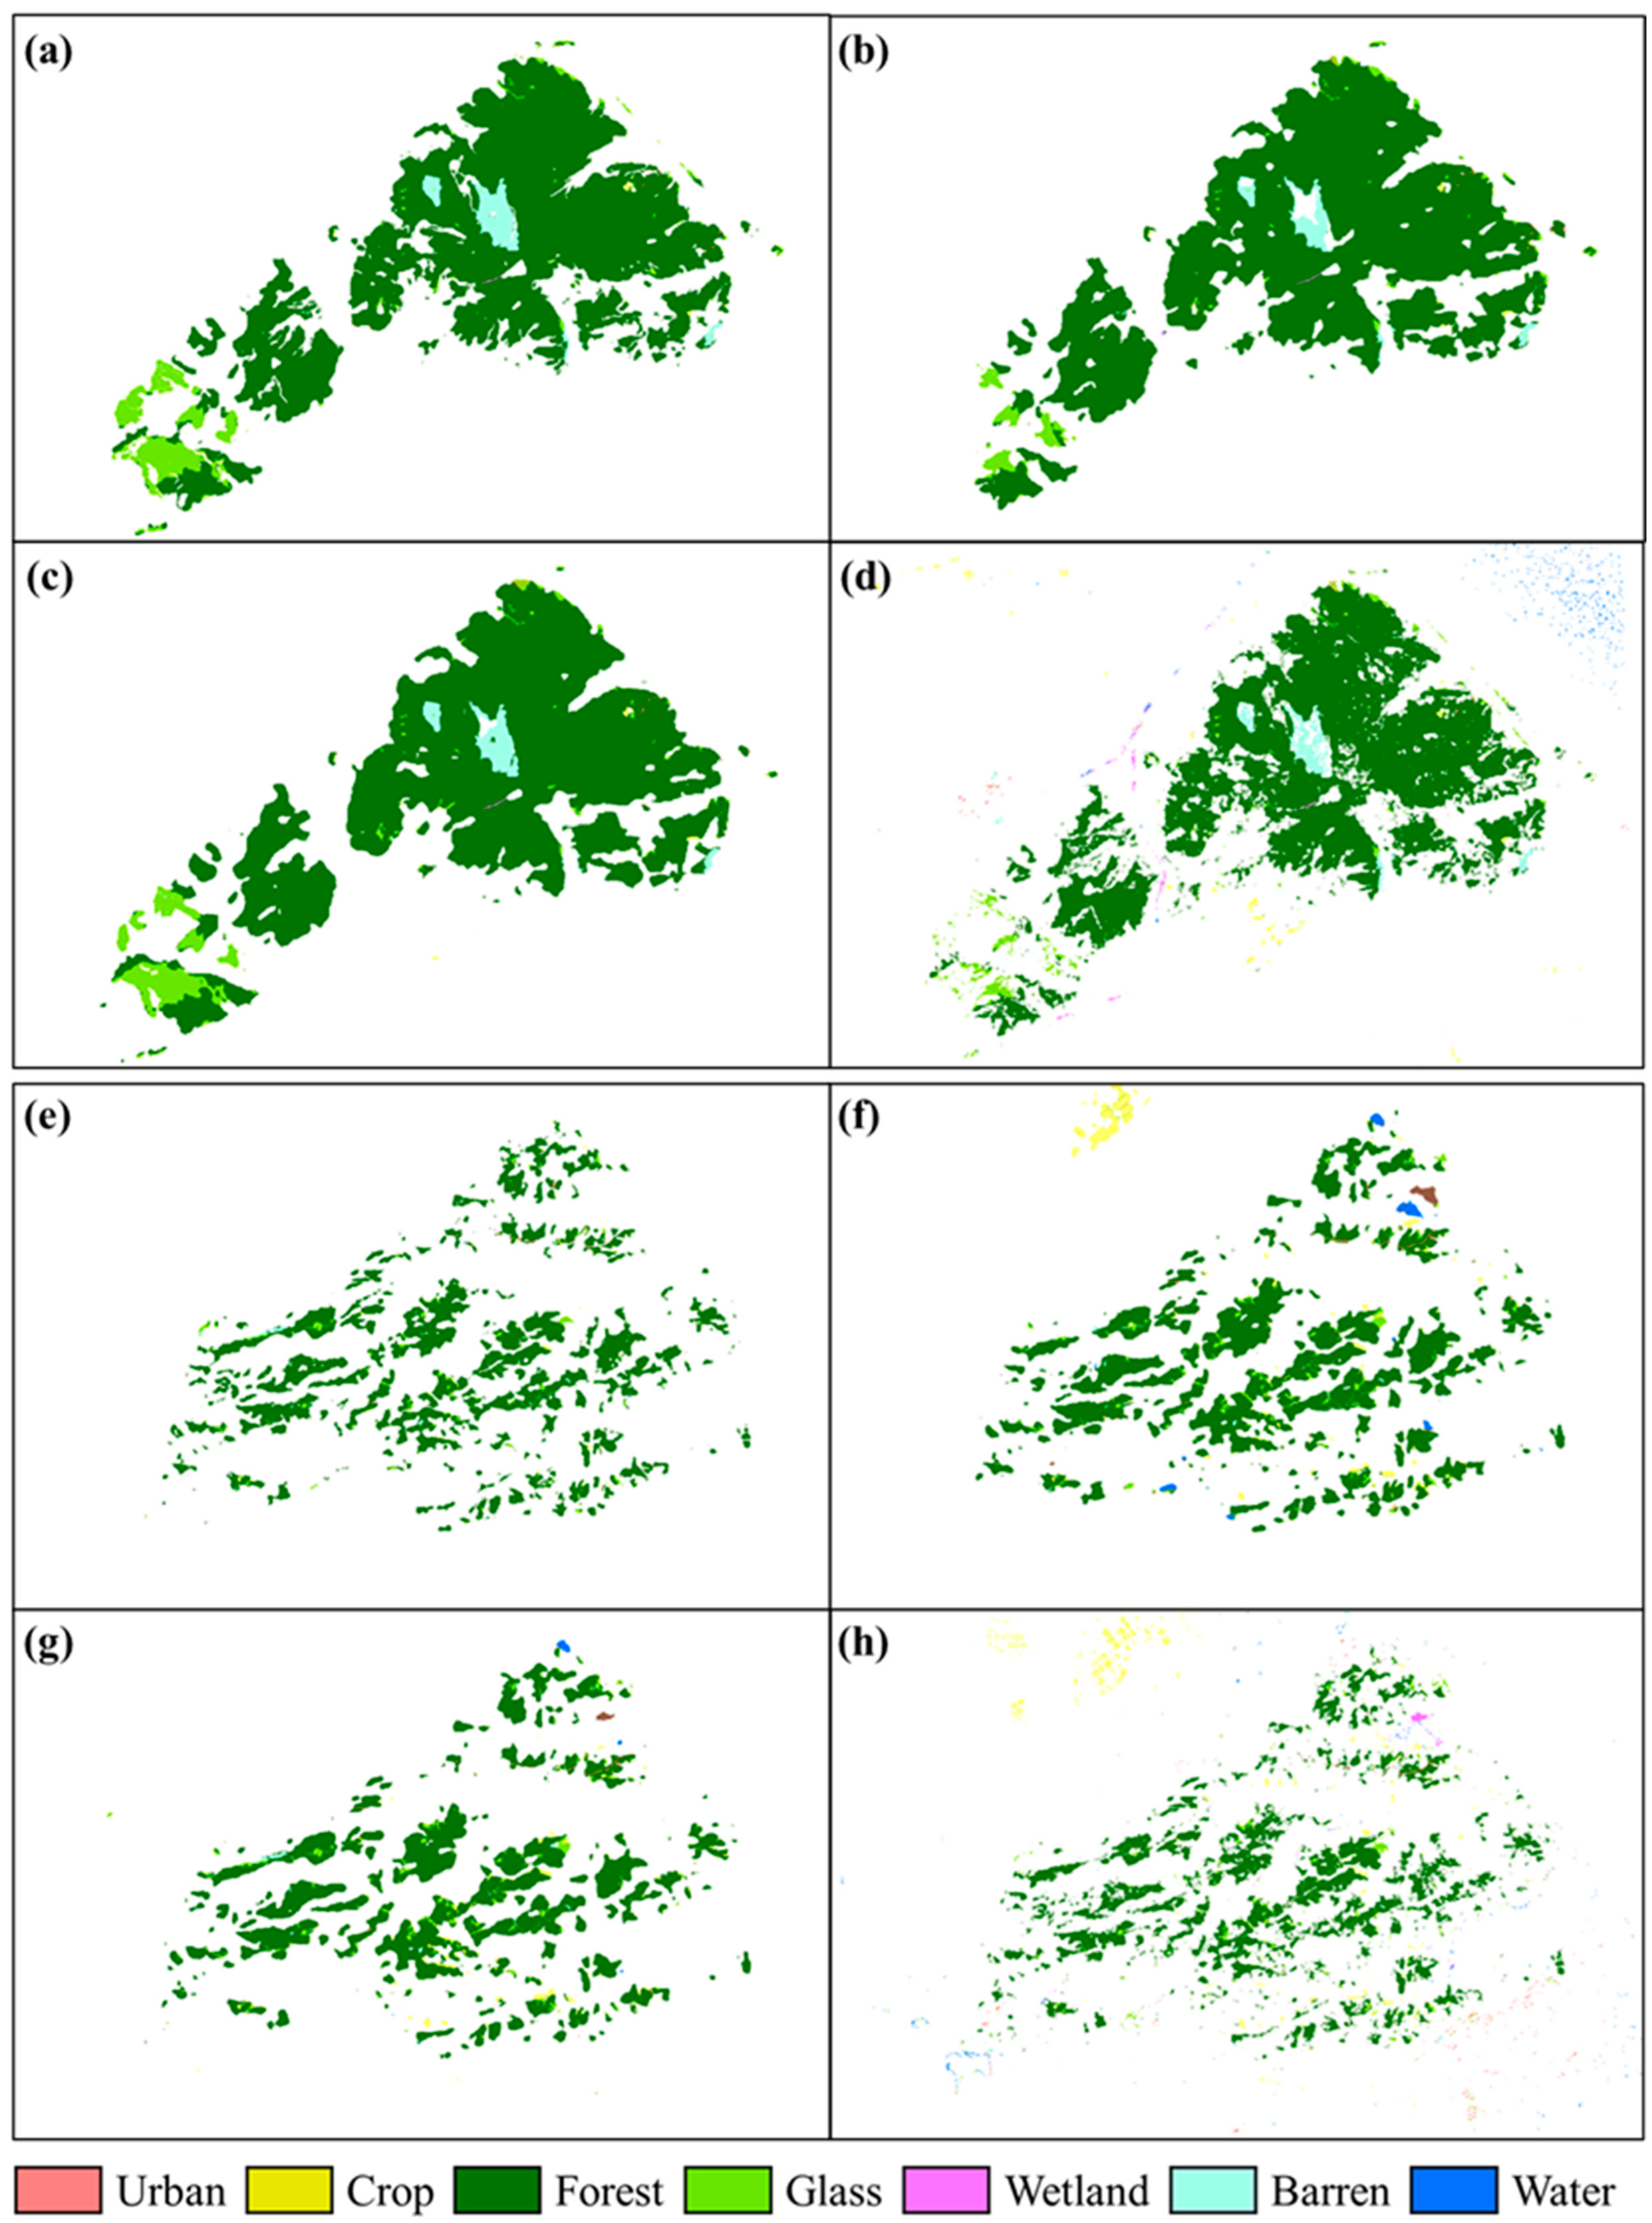
Based on the analysis of Sentinel-2 imagery, we conducted a spatial overlay analysis utilizing LCs to estimate the fire-damaged area by LC type in a wildfire-affected region (Figure 6). The estimated fire-damaged area by LC type revealed that forests constitute the majority of the damaged area. Furthermore, through detailed analysis, we confirmed the presence of fire risk in not only forests but also other LC types, such as grass and barren areas, which are not typically associated with crops or logging. In Area M, the overall detection performance was satisfactory, but AutoML exhibited some false detections in water areas (0.70%). When analyzing Area N, although U-Net showed effective performance in detecting burned areas, it displayed high false detection rates in water (1.29%) and crop (5.81%) areas based on LC analysis. These results suggest that the model’s performance may vary across different LC types. In contrast, HRNet showed lower detection rates in urban areas (0.42%) and water bodies (0.34%), which are less susceptible to wildfire damage, whereas forests (88.29%) dominated the damaged area, indicating its suitability for wildfire damage detection. In the case of AutoML, relatively high false positive rates occurred in urban (1.43%), crop (8.12%), and water (0.78%) areas (Table 7).
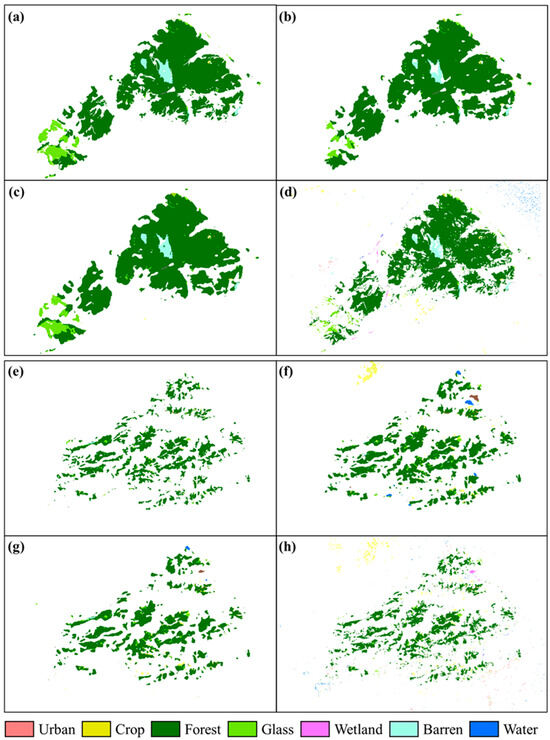
Figure 6.
Visualization of damage prediction by LC type. Area M: (a) GT, (b) U-Net, (c) HRNet, and (d) AutoML; Area N: (e) GT, (f) U-Net, (g) HRNet, and (h) AutoML.
Table 7.
Forest fire damage estimation for each LC type in the Test Area (%).
It is essential to emphasize the significance of LC analysis results. Accurate identification of wildfire damage relies on LC analysis, enabling us to identify damaged areas across diverse terrains and LC types. Additionally, further research is needed to enhance model performance through improved data preprocessing and parameter tuning. Furthermore, in-depth analysis of LC types with lower detection rates is warranted to refine wildfire damage detection strategies.
5. Discussion
In this study, we evaluated different spectral bands and indices as well as ML and DL algorithms for automated burned area detection using Sentinel-2 single-temporal satellite imagery. Our results were comparable with those of previous studies on DL input channels [37,38], and it was confirmed that even when single-temporal images were used, high detection performance can be achieved if a high-quality dataset is available. However, the application of SI to a single image to represent forest fire damage showed a relatively low improvement in accuracy. The accuracy was improved by including data reflecting the spatiotemporal characteristics before and after forest fire damage, enabling the more accurate detection of vegetation changes.
Comparable levels of accuracy were achieved when imagery from very high-resolution (VHR) satellites was used in DL models [31]. Our results indicate that DL models can extract effective information about forest fires, even from relatively low-resolution imagery. However, Sentinel-2 imagery has limitations in the timing of image acquisition compared to VHR imagery, and it is affected by sunlight and clouds. Therefore, to overcome the limitations of Sentinel-2, future research should focus on input data preparation and fusion with other imagery platforms, such as the Sentinel-1 satellite, which collects images regardless of whether it is day or night.
To compare DL and ML models with SI NDVI and NBR analyses, the detection of burned areas was automated using single-temporal satellite imagery, LCs, and the Otsu algorithm. U-Net and HRNet have their own characteristics and strengths, notably their effectiveness even with limited datasets [27]. U-Net is based on a simple encoder–decoder structure, making it quick to train and easy to interpret [45]. In contrast, HRNet is valuable for effectively learning multi-scale features in high-resolution images [47]. Strategies such as data augmentation can be employed to overcome the challenges of training on small datasets, thereby improving the generalization performance of the models. Model selection depends on the nature of the problem and the characteristics of the data; therefore, further analysis comparing these models with state-of-the-art approaches is necessary. Additionally, it is important to recognize the limitations of U-Net and HRNet and explore new research directions to overcome them. For example, developing more efficient learning algorithms and evaluating performance in various application domains can deepen our understanding of different aspects of the models. However, applying the Otsu algorithm to noisy images may pose difficulties for SI-based technology [30]. Specifically, many regions in South Korea comprise a mixture of urban and other areas. While the ME produces LC data using high-resolution images, the long production period and update cycle limit the utility of SI-based technology [54,55]. This study found that these factors were primary contributors to the occurrence of noise when applying the Otsu algorithm. Therefore, with the advancement of research related to the ongoing generation of LC data, more accurate analysis could be performed when reference datasets with shorter update cycles are utilized. This advancement is expected to greatly improve the accuracy of burned area detection technology.
In this study, we compared the independent test results of Areas M and N, which exhibit different LC distribution patterns. In the relatively dense burned area of Area M, all methods demonstrated high performance. However, in Area N, the detection performance was reduced owing to the mixed terrain comprising urban and forest areas. The findings are similar to those of a previous study [37]. Knopp et al. [36] also reported that misclassification occurs in specific LC types, such as dark coastal areas, agricultural lands, and volcanic rocks, which appear as burned areas. These difficulties indicate challenges in detecting burned forests in complex terrains. Republic of Korea possesses diverse topographical features, necessitating the exploration of new methods suitable for these varied environments in future research. For instance, DL input channels that consider the characteristics of forests can be introduced by utilizing topographical information from digital elevation models. This can enhance the accuracy of forest fire damage detection in complex terrain environments. Our study findings can assist in developing suitable mitigation plans for forest fires.
Forest fires in Republic of Korea are often extremely small compared to those in other parts of the world, and analyzing them is an important challenge, especially in areas with mixed urban and forest LCs. Therefore, the evaluation of DL model performance using combined Sentinel-2 and VHR satellite imagery data in mixed urban–forest areas is crucial. While VHR satellite imagery has high spatiotemporal resolutions, it mostly focuses on high spatial resolution and covers only four bands (B, G, R, and NIR) [56]. Considering these characteristics, in future research, we plan to apply the RNG imagery that demonstrated excellent performance in VHR imagery and compare it with the method proposed in this study. With this approach, we expect that the forest fire detection model can be further improved and tuned to the terrains and environments of Republic of Korea. Our current and future research will contribute to the effective development of applied models for domestic forest fire management and prevention.
It is important to note that the current analysis was limited to a binary classification of burned and unburned areas, and accurate analysis beyond this is challenging. A recent study attempted to label the severity level of fires to enable research based on DL [57]. This approach could enable more accurate assessment of fire damage severity. Therefore, future research should focus on analyzing and developing models considering the severity levels of fires.
6. Conclusions
In this study, we compared and analyzed the performance of five automated burned area detection methods using single-temporal Sentinel-2 satellite imagery of 14 forest fire areas in Republic of Korea. To evaluate the performance of each model, two separate burned areas were selected as test regions. Furthermore, to develop an optimal combination of input variables, a comparative analysis was conducted by applying two plans and three combinations. The DL method exhibited the highest accuracy compared to the other methods. U-Net was capable of perceiving intricate patterns or features, and this is especially beneficial for dealing with imbalanced datasets. However, it exhibited a tendency to misclassify agricultural lands as forested areas. In contrast, HRNet demonstrated the highest accuracy in both qualitative and quantitative analyses. HRNet effectively detected and distinguished forest fire damage with high accuracy in the two contrast test regions, thereby confirming its stability in various terrains and conditions and its ability to rapidly identify forest fire damage.
Supplementary Materials
The following supporting information can be downloaded at: https://www.mdpi.com/2072-4292/16/5/884/s1, Figure S1: Test area LC map. (a) Area M and (b) Area N; Figure S2: U-Net and HRNet performance graph according to input image combination.
Author Contributions
Conceptualization, D.L.; methodology, D.L.; software, J.B. and S.P.; formal analysis, D.L. and S.S.; data curation, D.L. and J.S.; writing—original draft preparation, D.L., S.S., J.B. and S.P.; writing—review and editing, D.L., D.S., Y.L. and J.K.; supervision, J.K. All authors have read and agreed to the published version of the manuscript.
Funding
This research was supported by a grant (2021-MOIS37-002) of the Intelligent Technology Development Program on Disaster Response and Emergency Management, funded by the Ministry of Interior and Safety (MOIS, Republic of Korea).
Data Availability Statement
The data presented in this study are available on request from the corresponding author.
Acknowledgments
The authors express sincere gratitude to the anonymous reviewers and the editor for dedicating their valuable time to provide constructive feedback and valuable recommendations.
Conflicts of Interest
Author Dongju Seo was employed by the company Hyun Kang Engineering Co., Ltd. The remaining authors declare that the research was conducted in the absence of any commercial or financial relationships that could be construed as a potential conflict of interest.
Correction Statement
This article has been published with a minor correction as there are color replacements needed in Figures 2, 4, and 5. This change does not affect the scientific content of the article.
References
- Földi, L.; Kuti, R. Characteristics of forest fires and their impact on the environment. Acad. Appl. Res. Mil. Public Manag. Sci. 2016, 15, 5–17. [Google Scholar] [CrossRef]
- Korea Forest Service. Forest Fire Statistical Yearbook; Korea Forest Service: Daejeon, Republic of Korea, 2022.
- Jiao, Q.; Fan, M.; Tao, J.; Wang, W.; Liu, D.; Wang, P. Forest fire patterns and lightning-caused forest fire detection in Heilongjiang Province of China using satellite data. Fire 2023, 6, 166. [Google Scholar] [CrossRef]
- Jung, H.G.; An, H.J.; Lee, S.M. Agricultural Policy Focus: Improvement Tasks for Effective Forest Fire Management; Korea Rural Economic Institute: Naju, Republic of Korea, 2017; pp. 1–20. Available online: https://www.dbpia.co.kr/pdf/pdfView.do?nodeId=NODE07220754 (accessed on 1 January 2024).
- Filipponi, F. Exploitation of sentinel-2 time series to map burned areas at the national level: A case study on the 2017 Italy wildfires. Remote Sens. 2019, 11, 622. [Google Scholar] [CrossRef]
- Sertel, E.; Alganci, U. Comparison of pixel and object-based classification for burned area mapping using SPOT-6 images. Geomat. Nat. Hazards Risk 2016, 7, 1198–1206. [Google Scholar] [CrossRef]
- Hawbaker, T.J.; Vanderhoof, M.K.; Beal, Y.-J.; Takacs, J.D.; Schmidt, G.L.; Falgout, J.T.; Williams, B.; Fairaux, N.M.; Caldwell, M.K.; Picotte, J.J.; et al. Mapping burned areas using dense time-series of Landsat data. Remote Sens. Environ. 2017, 198, 504–522. [Google Scholar] [CrossRef]
- Lasaponara, R.; Tucci, B.; Ghermandi, L. On the use of satellite Sentinel 2 data for automatic mapping of burnt areas and burn severity. Sustainability 2018, 10, 3889. [Google Scholar] [CrossRef]
- Liu, J.; Heiskanen, J.; Maeda, E.E.; Pellikka, P.K. Burned area detection based on Landsat time series in savannas of southern Burkina Faso. Int. J. Appl. Earth Obs. Geoinf. 2018, 64, 210–220. [Google Scholar] [CrossRef]
- Belenguer-Plomer, M.A.; Tanase, M.A.; Fernandez-Carrillo, A.; Chuvieco, E. Burned area detection and mapping using Sentinel-1 backscatter coefficient and thermal anomalies. Remote Sens. Environ. 2019, 233, 111345. [Google Scholar] [CrossRef]
- Ghali, R.; Akhloufi, M.A. Deep learning approaches for wildland fires using satellite remote sensing data: Detection, mapping, and prediction. Fire 2023, 6, 192. [Google Scholar] [CrossRef]
- Chu, T.; Guo, X. Remote sensing techniques in monitoring post-fire effects and patterns of forest recovery in boreal forest regions: A review. Remote Sens. 2013, 6, 470–520. [Google Scholar] [CrossRef]
- Gaveau, D.L.; Descals, A.; Salim, M.A.; Sheil, D.; Sloan, S. Refined burned-area mapping protocol using Sentinel-2 data increases estimate of 2019 Indonesian burning. Earth System Science Data. 2021, 13, 5353–5368. [Google Scholar] [CrossRef]
- Abid, N.; Malik, M.I.; Shahzad, M.; Shafait, F.; Ali, H.; Ghaffar, M.M.; Weis, C.; Wehn, N.; Liwicki, M. Burnt Forest Estimation from Sentinel-2 Imagery of Australia using Unsupervised Deep Learning. In Proceedings of the Digital Image Computing: Techniques and Applications (DICTA), Gold Coast, Australia, 29 November–1 December 2021. [Google Scholar]
- Tucker, C.J. Red and photographic infrared linear combinations for monitoring vegetation. Remote Sens. Environ. 1979, 8, 127–150. [Google Scholar] [CrossRef]
- Chuvieco, E.; Martin, M.P.; Palacios, A. Assessment of different spectral indices in the red-near-infrared spectral domain for burned land discrimination. Int. J. Remote Sens. 2002, 23, 5103–5110. [Google Scholar] [CrossRef]
- Smith, A.M.; Wooster, M.J.; Drake, N.A.; Dipotso, F.M.; Falkowski, M.J.; Hudak, A.T. Testing the potential of multi-spectral remote sensing for retrospectively estimating fire severity in African Savannahs. Remote Sens. Environ. 2005, 97, 92–115. [Google Scholar] [CrossRef]
- García, M.L.; Caselles, V. Mapping burns and natural reforestation using Thematic Mapper data. Geocarto Int. 1991, 6, 31–37. [Google Scholar] [CrossRef]
- Veraverbeke, S.; Lhermitte, S.; Verstraeten, W.W.; Goossens, R. Evaluation of pre/post-fire differenced spectral indices for assessing burn severity in a Mediterranean environment with Landsat Thematic Mapper. Int. J. Remote Sens. 2011, 32, 3521–3537. [Google Scholar] [CrossRef]
- Veraverbeke, S.; Hook, S.; Hulley, G. An alternative spectral index for rapid fire severity assessments. Remote Sens. Environ. 2012, 123, 72–80. [Google Scholar] [CrossRef]
- Navarro, G.; Caballero, I.; Silva, G.; Parra, P.C.; Vázquez, Á.; Caldeira, R. Evaluation of forest fire on Madeira Island using Sentinel-2A MSI imagery. Int. J. Appl. Earth Obs. Geoinf. 2017, 58, 97–106. [Google Scholar] [CrossRef]
- Ponomarev, E.; Zabrodin, A.; Ponomareva, T. Classification of fire damage to boreal forests of Siberia in 2021 based on the dNBR index. Fire 2022, 5, 19. [Google Scholar] [CrossRef]
- Escuin, S.; Navarro, R.; Fernández, P. Fire severity assessment by using NBR (Normalized Burn Ratio) and NDVI (Normalized Difference Vegetation Index) derived from LANDSAT TM/ETM images. Int. J. Remote Sens. 2008, 29, 1053–1073. [Google Scholar] [CrossRef]
- Smiraglia, D.; Filipponi, F.; Mandrone, S.; Tornato, A.; Taramelli, A. Agreement index for burned area mapping: Integration of multiple spectral indices using Sentinel-2 satellite images. Remote Sens. 2020, 12, 1862. [Google Scholar] [CrossRef]
- Mpakairi, K.S.; Ndaimani, H.; Kavhu, B. Exploring the utility of Sentinel-2 MSI derived spectral indices in mapping burned areas in different land-cover types. Sci. Afr. 2020, 10, e00565. [Google Scholar] [CrossRef]
- Pinto, M.M.; Libonati, R.; Trigo, R.M.; Trigo, I.F.; DaCamara, C.C. A deep learning approach for mapping and dating burned areas using temporal sequences of satellite images. ISPRS J. Photogramm. Remote Sens. 2020, 160, 260–274. [Google Scholar] [CrossRef]
- Khryashchev, V.; Larionov, R. Wildfire segmentation on satellite images using deep learning. In Proceedings of the Moscow Workshop on Electronic and Networking Technologies (MWENT), Moscow, Russia, 11–13 March 2020. [Google Scholar] [CrossRef]
- Huot, F.; Hu, R.L.; Goyal, N.; Sankar, T.; Ihme, M.; Chen, Y.F. Next day wildfire spread: A machine learning dataset to predict wildfire spreading from remote-sensing data. IEEE Trans. Geosci. Remote Sens. 2022, 60, 1–13. [Google Scholar] [CrossRef]
- Seydi, S.T.; Sadegh, M. Improved burned area mapping using monotemporal Landsat-9 imagery and convolutional shift-transformer. Measurement 2023, 216, 112961. [Google Scholar] [CrossRef]
- Hu, X.; Ban, Y.; Nascetti, A. Uni-temporal multispectral imagery for burned area mapping with deep learning. Remote Sens. 2021, 13, 1509. [Google Scholar] [CrossRef]
- Cho, A.Y.; Park, S.E.; Kim, D.J.; Kim, J.; Li, C.; Song, J. Burned area mapping using Unitemporal Planetscope imagery with a deep learning based approach. IEEE J. Sel. Top. Appl. Earth Obs. Remote Sens. 2022, 16, 242–253. [Google Scholar] [CrossRef]
- Gibson, R.; Danaher, T.; Hehir, W.; Collins, L. A remote sensing approach to mapping fire severity in south-eastern Australia using sentinel 2 and random forest. Remote Sens. Environ. 2020, 240, 111702. [Google Scholar] [CrossRef]
- Bar, S.; Parida, B.R.; Pandey, A.C. Landsat-8 and Sentinel-2 based Forest fire burn area mapping using machine learning algorithms on GEE cloud platform over Uttarakhand, Western Himalaya. Remote Sens. Appl. Soc. Environ. 2020, 18, 100324. [Google Scholar] [CrossRef]
- Prabowo, Y.; Sakti, A.D.; Pradono, K.A.; Amriyah, Q.; Rasyidy, F.H.; Bengkulah, I.; Ulfa, K.; Candra, D.S.; Imdad, M.T.; Ali, S. Deep learning dataset for estimating burned areas: Case study, Indonesia. Data 2022, 7, 78. [Google Scholar] [CrossRef]
- Alkan, D.; Karasaka, L. Segmentation of LANDSAT-8 images for burned area detection with deep learning. Int. Arch. Photogramm. Remote Sens. Spat. Inf. Sci. 2023, 48, 455–461. [Google Scholar] [CrossRef]
- Knopp, L.; Wieland, M.; Rättich, M.; Martinis, S. A deep learning approach for burned area segmentation with Sentinel-2 data. Remote Sens. 2020, 12, 2422. [Google Scholar] [CrossRef]
- Lee, C.; Park, S.; Kim, T.; Liu, S.; Md Reba, M.N.; Oh, J.; Han, Y. Machine learning-based forest burned area detection with various input variables: A case study of South Korea. Appl. Sci. 2022, 12, 10077. [Google Scholar] [CrossRef]
- Tonbul, H.; Yilmaz, E.O.; Kavzoglu, T. Comparative analysis of deep learning and machine learning models for burned area estimation using Sentinel-2 image: A case study in Muğla-Bodrum, Turkey. In Proceedings of the International Conference on Recent Advances in Air and Space Technologies (RAST), Istanbul, Turkey, 7–9 June 2023. [Google Scholar] [CrossRef]
- Korea Meteorological Institute. Meteorological Technology & Policy; Korea Meteorological Institute: Seoul, Republic of Korea, 2019; Volume 12. Available online: https://www.kma.go.kr/down/t_policy/t_policy_20200317.pdf (accessed on 1 January 2024).
- Bae, M.; Chae, H. Regional characteristics of forest fire occurrences in Korea from 1990 to 2018. J. Korean Soc. Hazard Mitig. 2019, 19, 305–313. [Google Scholar] [CrossRef]
- Drusch, M.; Del Bello, U.; Carlier, S.; Colin, O.; Fernandez, V.; Gascon, F.; Hoersch, B.; Isola, C.; Laberinti, P.; Martimort, P.; et al. Sentinel-2: ESA’s optical high-resolution mission for GMES operational services. Remote Sens. Environ. 2012, 120, 25–36. [Google Scholar] [CrossRef]
- Louis, J.; Debaecker, V.; Pflug, B.; Main-Knorn, M.; Bieniarz, J.; Mueller-Wilm, U.; Cadau, E.; Gascon, F. Sentinel-2 Sen2Cor: L2A processor for users. In Proceedings of the Living Planet Symposium, Prague, Czech Republic, 9–13 May 2016; Available online: http://esamultimedia.esa.int/multimedia/publications/SP-740/SP-740_toc.pdf (accessed on 6 June 2023.).
- Arzt, M.; Deschamps, J.; Schmied, C.; Pietzsch, T.; Schmidt, D.; Tomancak, P.; Haase, R.; Jug, F. LABKIT: Labeling and segmentation toolkit for big image data. Front. Comput. Sci. 2022, 4, 10. [Google Scholar] [CrossRef]
- Rashkovetsky, D.; Mauracher, F.; Langer, M.; Schmitt, M. Wildfire detection from multisensor satellite imagery using deep semantic segmentation. IEEE J. Sel. Top. Appl. Earth Obs. Remote Sens. 2021, 14, 700–7016. [Google Scholar] [CrossRef]
- Ronneberger, O.; Fischer, P.; Brox, T. U-net: Convolutional networks for biomedical image segmentation. In Proceedings of the International Conference on Medical Image Computing and Computer-Assisted Intervention—MICCAI 2015, Munich, Germany, 5–9 October 2015; Navab, N., Hornegger, J., Wells, W.M., Frangi, A.F., Eds.; Springer International Publishing: Cham, Switzerland, 2015; pp. 234–241. [Google Scholar] [CrossRef]
- Sun, K.; Zhao, Y.; Jiang, B.; Cheng, T.; Xiao, B.; Liu, D.; Mu, Y.; Wang, X.; Liu, W.; Wang, J. High-resolution representations for labeling pixels and regions. arXiv 2019, arXiv:1904.04514. [Google Scholar] [CrossRef]
- Wang, J.; Sun, K.; Cheng, T.; Jiang, B.; Deng, C.; Zhao, Y.; Liu, D.; Mu, Y.; Tan, M.; Wang, X.; et al. Deep high-resolution representation learning for visual recognition. IEEE Trans. Pattern Anal. Mach. Intell. 2020, 43, 3349–3364. [Google Scholar] [CrossRef] [PubMed]
- Yuan, Y.; Chen, X.; Wang, J. Object-contextual representations for semantic segmentation. In Proceedings of the Computer Vision–ECCV 2020: 16th European Conference, Glasgow, UK, 23–28 August 2020; Vedaldi, A., Bischof, H., Brox, T., Frahm, J.M., Eds.; Springer International Publishing: Cham, Switzerland, 2020; Volume 12351. [Google Scholar] [CrossRef]
- He, X.; Zhao, K.; Chu, X. AutoML: A survey of the state-of-the-art. Knowl.-Based Syst. 2021, 212, 106622. [Google Scholar] [CrossRef]
- Salehin, I.; Islam, M.S.; Saha, P.; Noman, S.M.; Tuni, A.; Hasan, M.M.; Baten, A. AutoML: A systematic review on automated machine learning with neural architecture search. J. Inf. Intell. 2023, 2, 52–81. [Google Scholar] [CrossRef]
- Otsu, N. A threshold selection method from gray-level histograms. IEEE Trans. Syst. Man Cybern. 1979, 9, 62–66. [Google Scholar] [CrossRef]
- Amos, C.; Petropoulos, G.P.; Ferentinos, K.P. Determining the use of Sentinel-2A MSI for wildfire burning & severity detection. Int. J. Remote Sens. 2019, 40, 905–930. [Google Scholar] [CrossRef]
- GDAL Documentation. Available online: https://gdal.org/index.html (accessed on 22 April 2022).
- Jo, W.; Lim, Y.; Park, K.H. Deep learning based land cover classification using convolutional neural network: A case study of Korea. J. Korean Geogr. Soc. 2019, 54, 1–16. [Google Scholar]
- Son, S.; Lee, S.H.; Bae, J.; Ryu, M.; Lee, D.; Park, S.R.; Seo, D.; Kim, J. Land-cover-change detection with aerial orthoimagery using segnet-based semantic segmentation in Namyangju city, South Korea. Sustainability 2022, 14, 12321. [Google Scholar] [CrossRef]
- Martins, V.S.; Roy, D.P.; Huang, H.; Boschetti, L.; Zhang, H.K.; Yan, L. Deep learning high resolution burned area mapping by transfer learning from Landsat-8 to PlanetScope. Remote Sens. Environ. 2022, 280, 113203. [Google Scholar] [CrossRef]
- Hu, X.; Zhang, P.; Ban, Y. Large-scale burn severity mapping in multispectral imagery using deep semantic segmentation models. ISPRS J. Photogramm. Remote Sens. 2023, 196, 228–240. [Google Scholar] [CrossRef]
Disclaimer/Publisher’s Note: The statements, opinions and data contained in all publications are solely those of the individual author(s) and contributor(s) and not of MDPI and/or the editor(s). MDPI and/or the editor(s) disclaim responsibility for any injury to people or property resulting from any ideas, methods, instructions or products referred to in the content. |
© 2024 by the authors. Licensee MDPI, Basel, Switzerland. This article is an open access article distributed under the terms and conditions of the Creative Commons Attribution (CC BY) license (https://creativecommons.org/licenses/by/4.0/).