


Spatio-Temporal Variation of Cyanobacteria Blooms in Taihu Lake Using Multiple Remote Sensing Indices and Machine Learning

 , ,
, ,  ,
,
Abstract
1. Introduction
2. Methodology
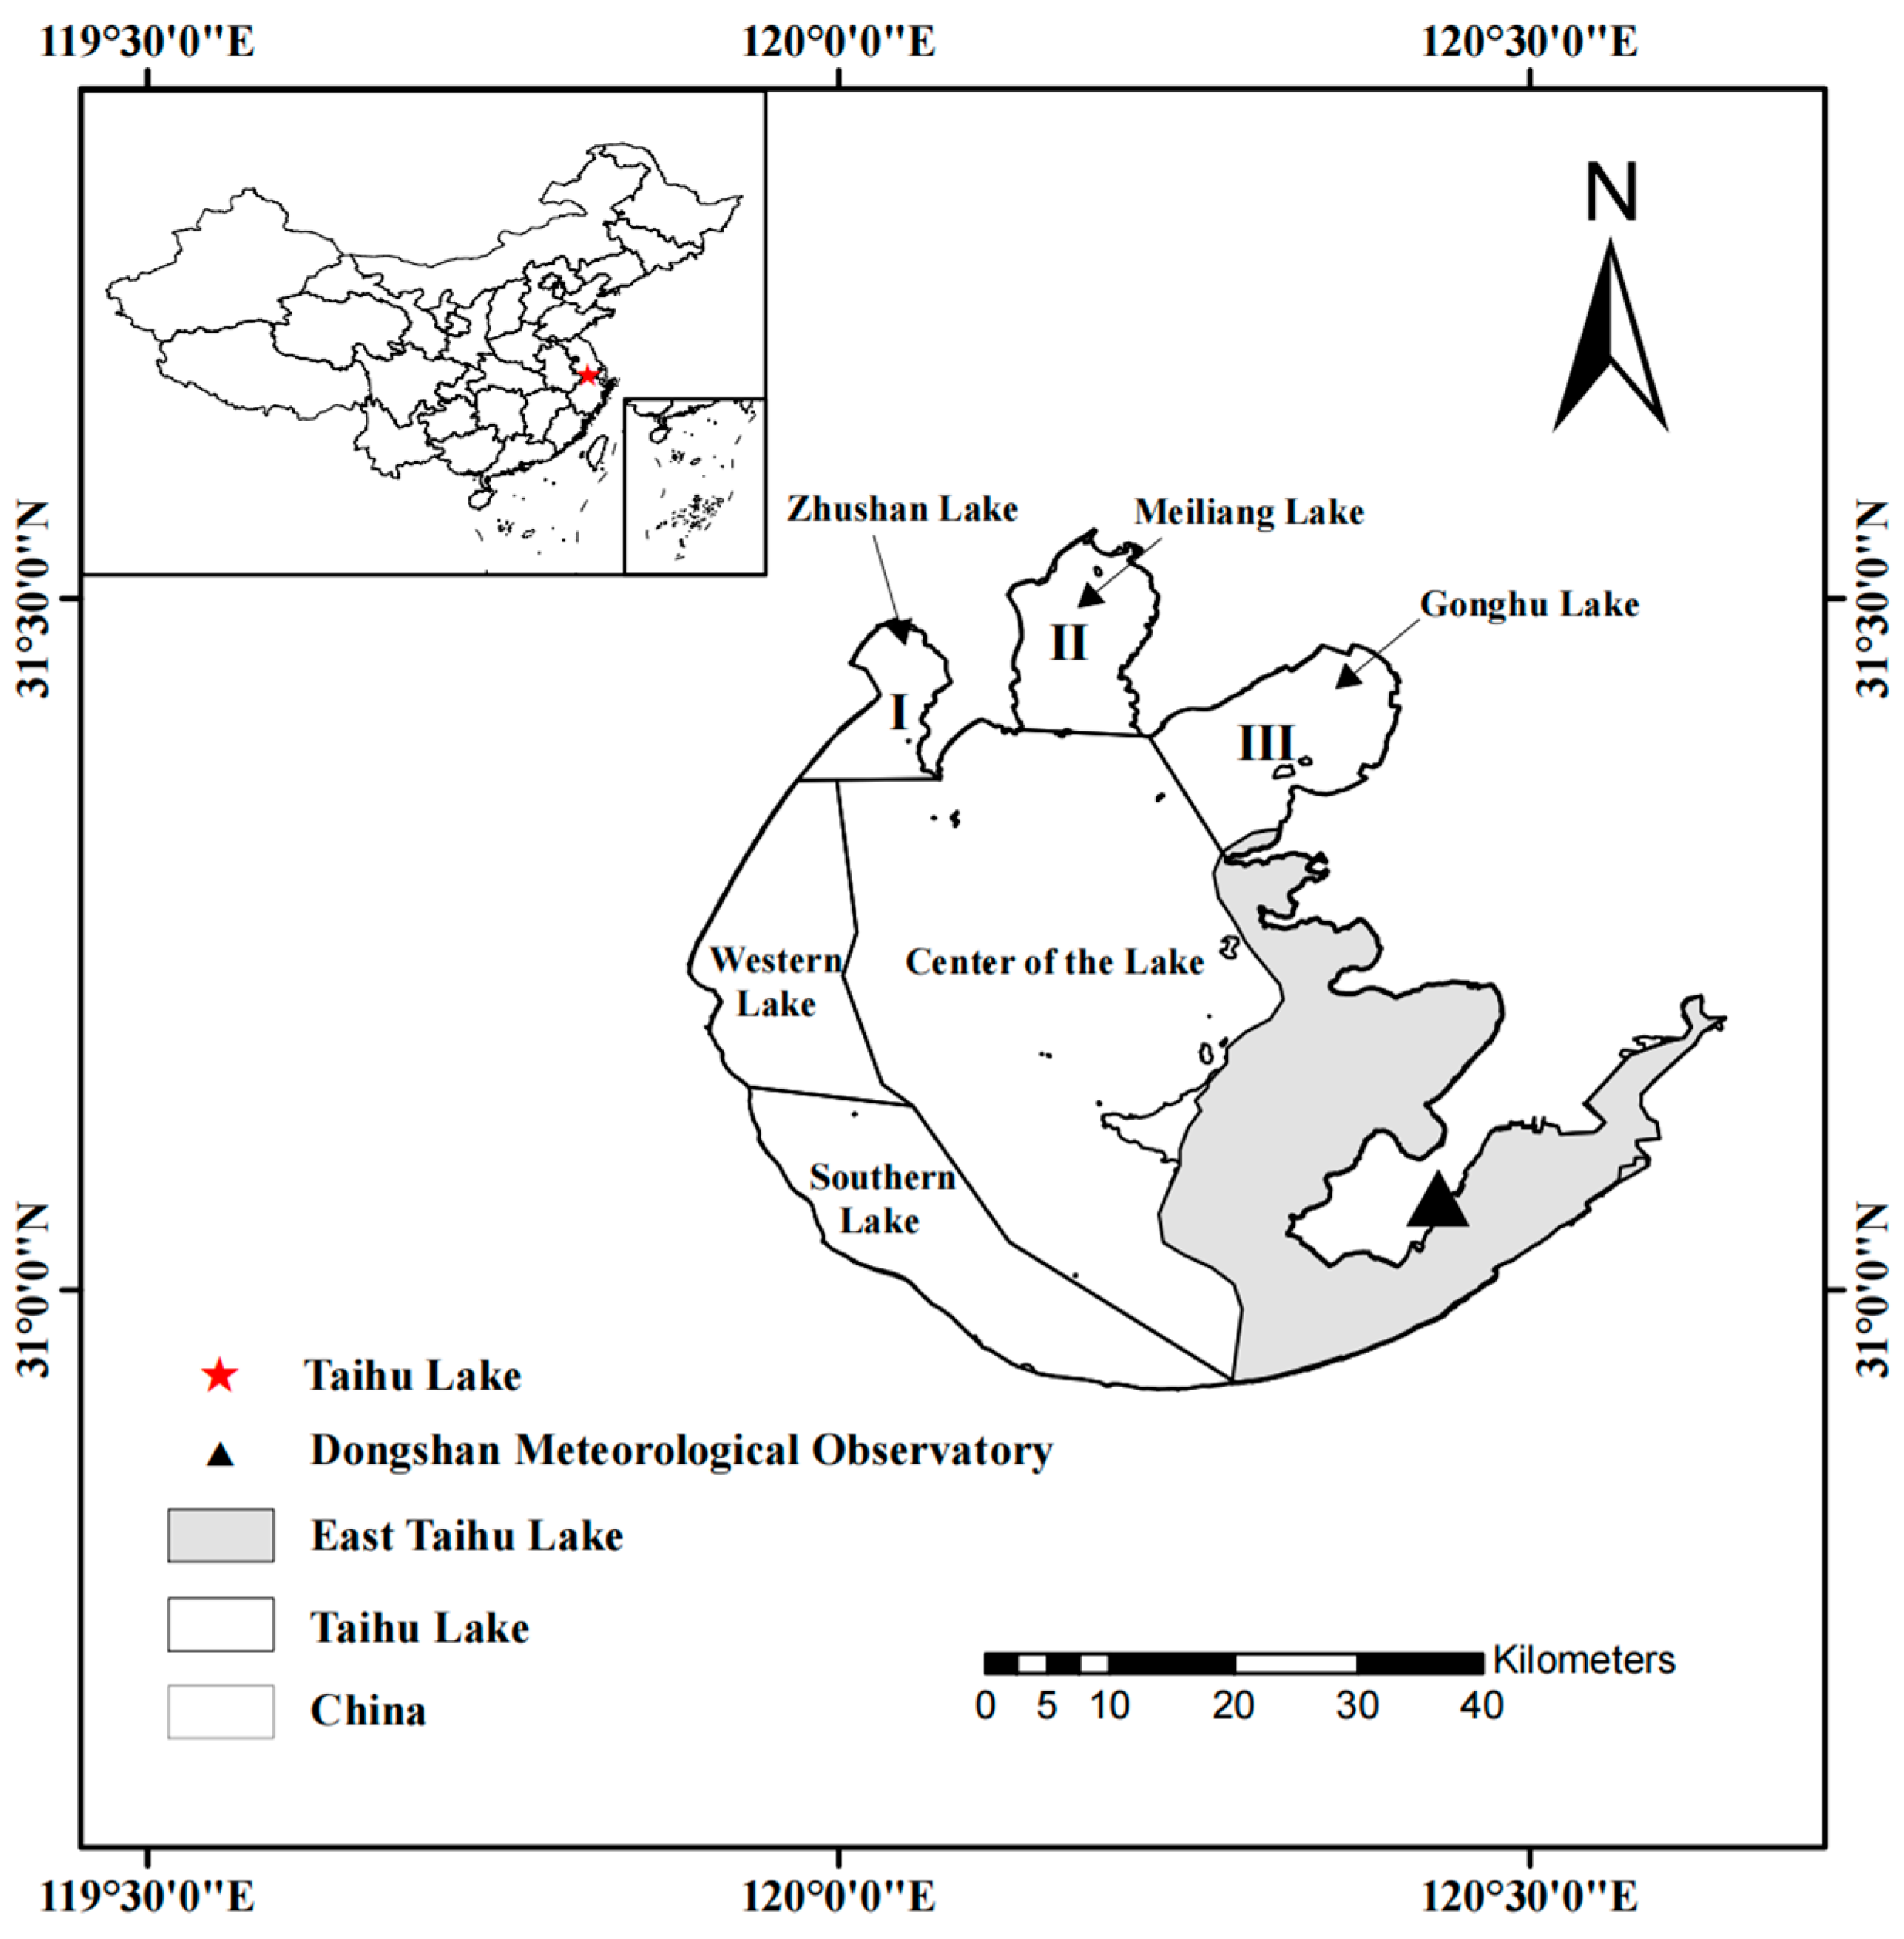
2.1. Study Area
2.2. Data
2.2.1. MODIS Data
2.2.2. Sentinel-2 Data
3. Methods
3.1. WVA-QPSO-RF Method
3.2. Trend Analysis
3.3. Precision Evaluation Index
3.4. Occurrence Frequency of Cyanobacteria Blooms
4. Results
4.1. Comparison of Cyanobacteria Extraction Methods
4.2. Temporal Variation Pattern
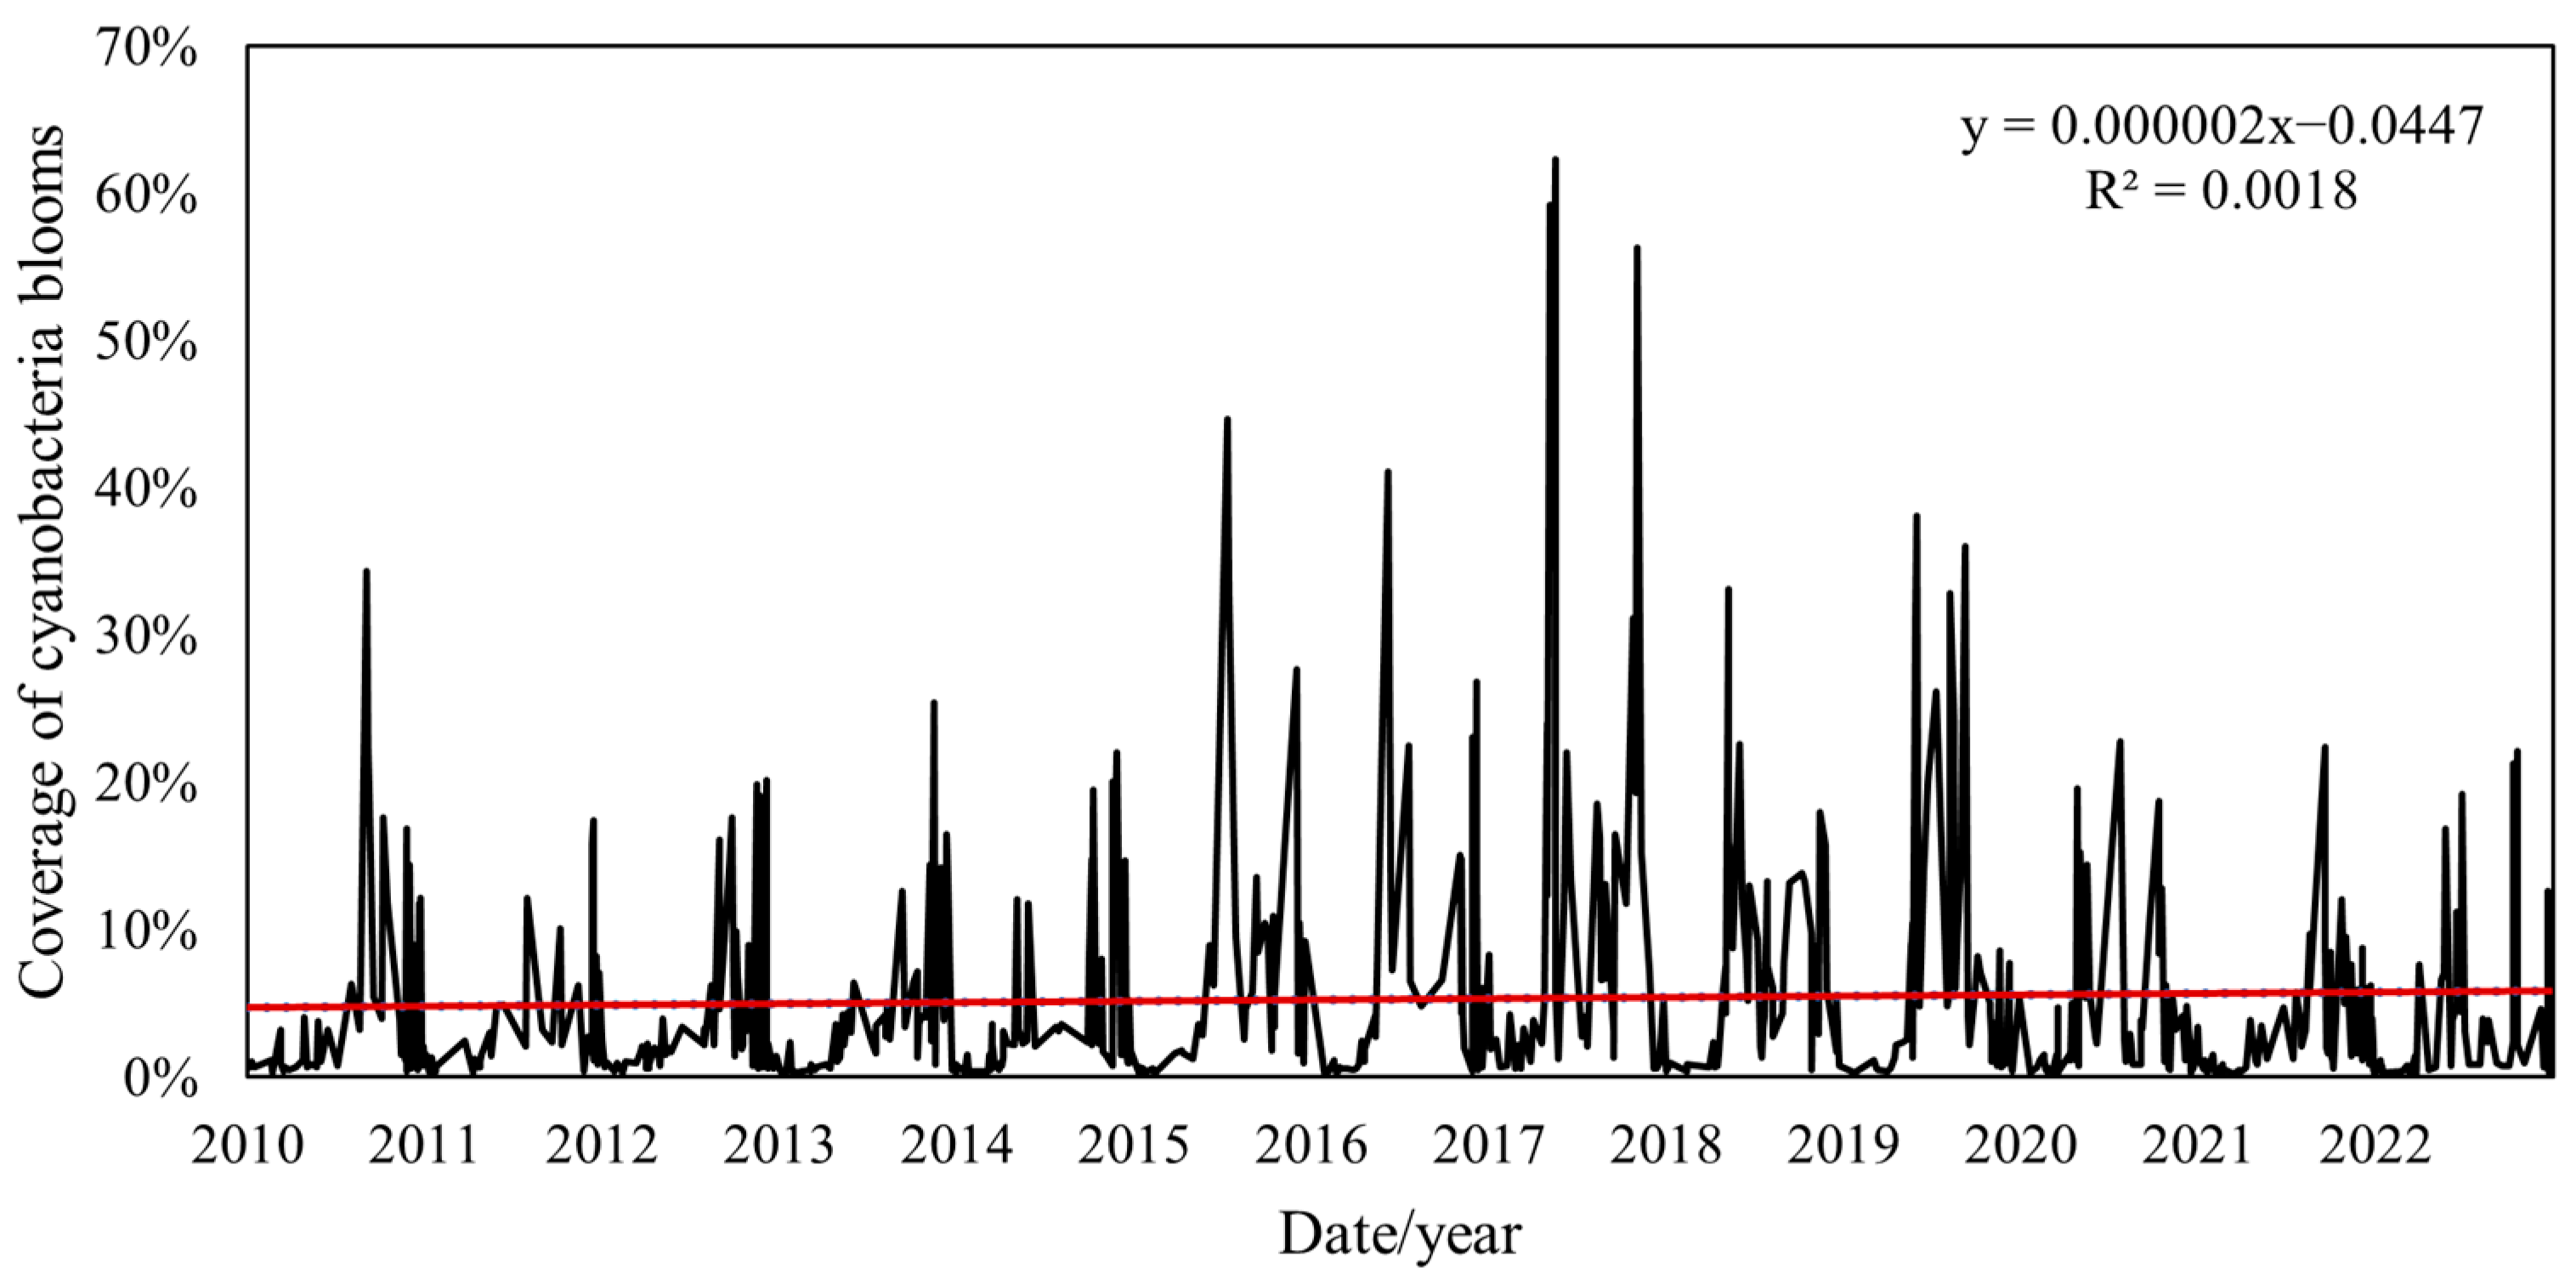
4.2.1. Changes in Coverage Areas of Cyanobacteria Blooms
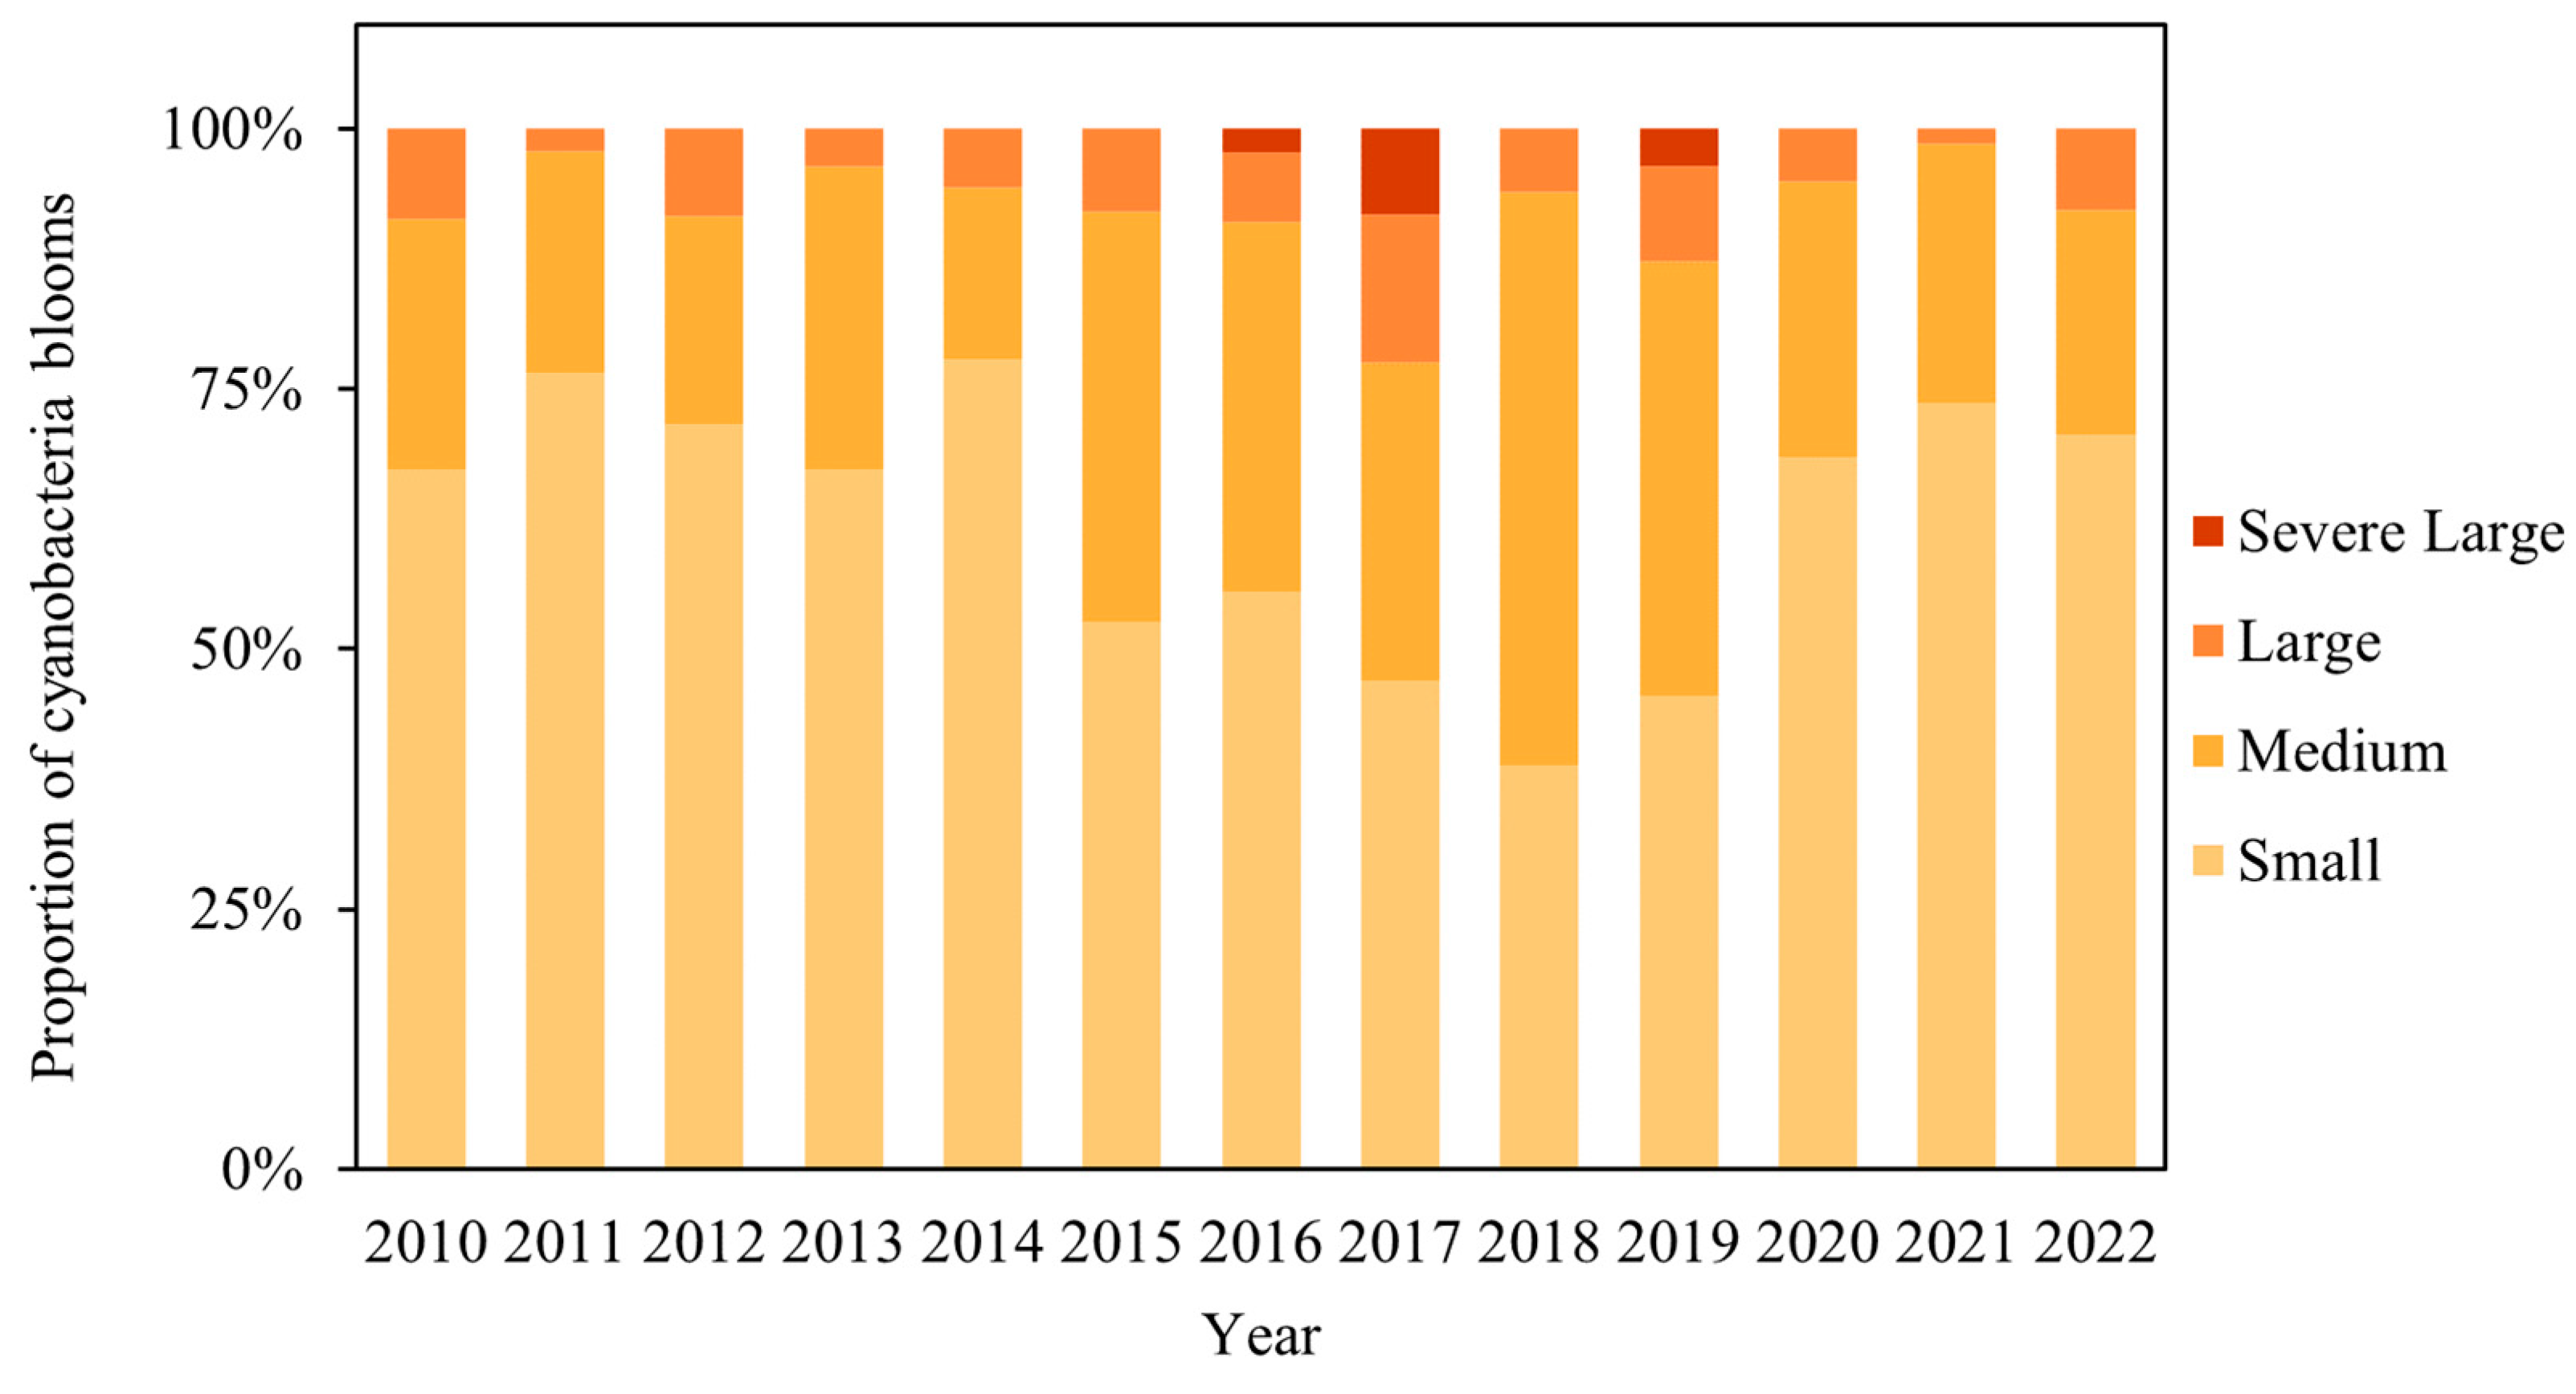
4.2.2. Changes in the Spatial Areas of Cyanobacteria
4.2.3. Changes in the Occurrence Frequency of Cyanobacteria Blooms
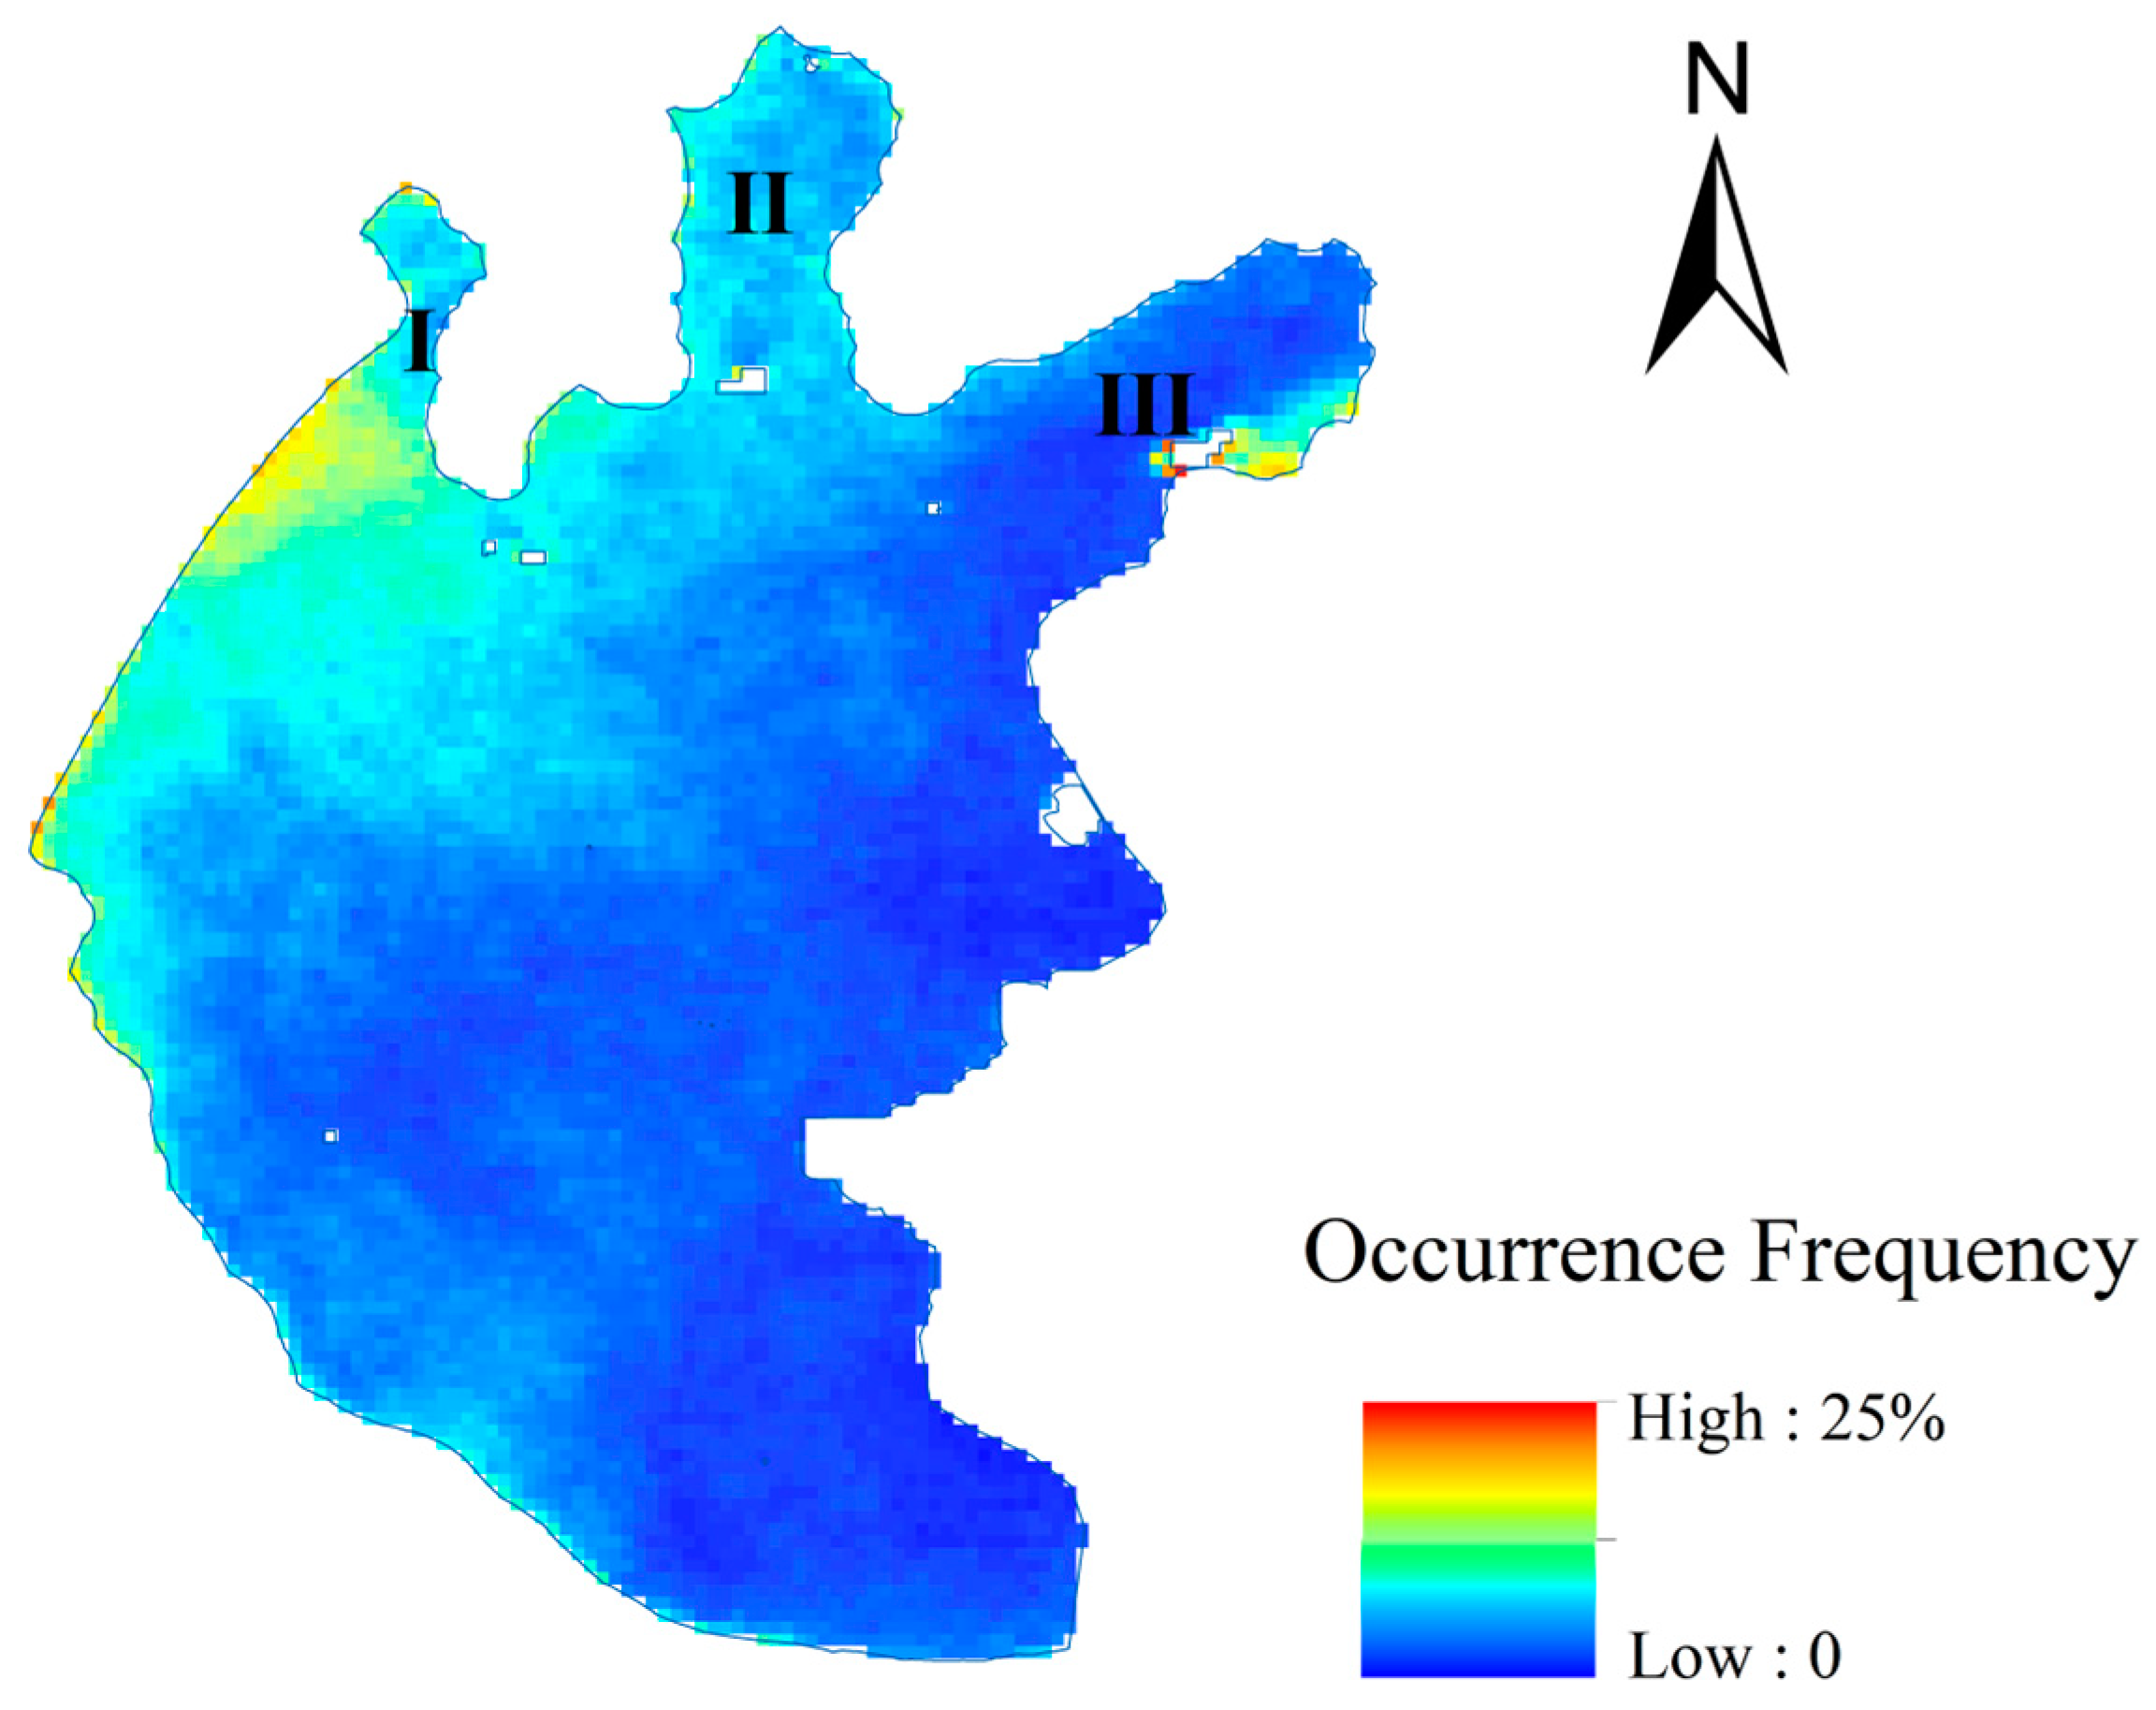
4.3. Spatial Variation Patterns
- 1.
- Spatial distribution of average cyanobacteria blooms occurrence frequency from 2010 to 2022
- 2.
- Changes in the spatial distribution of cyanobacteria bloom occurrence frequency during 2010–2022
- 3.
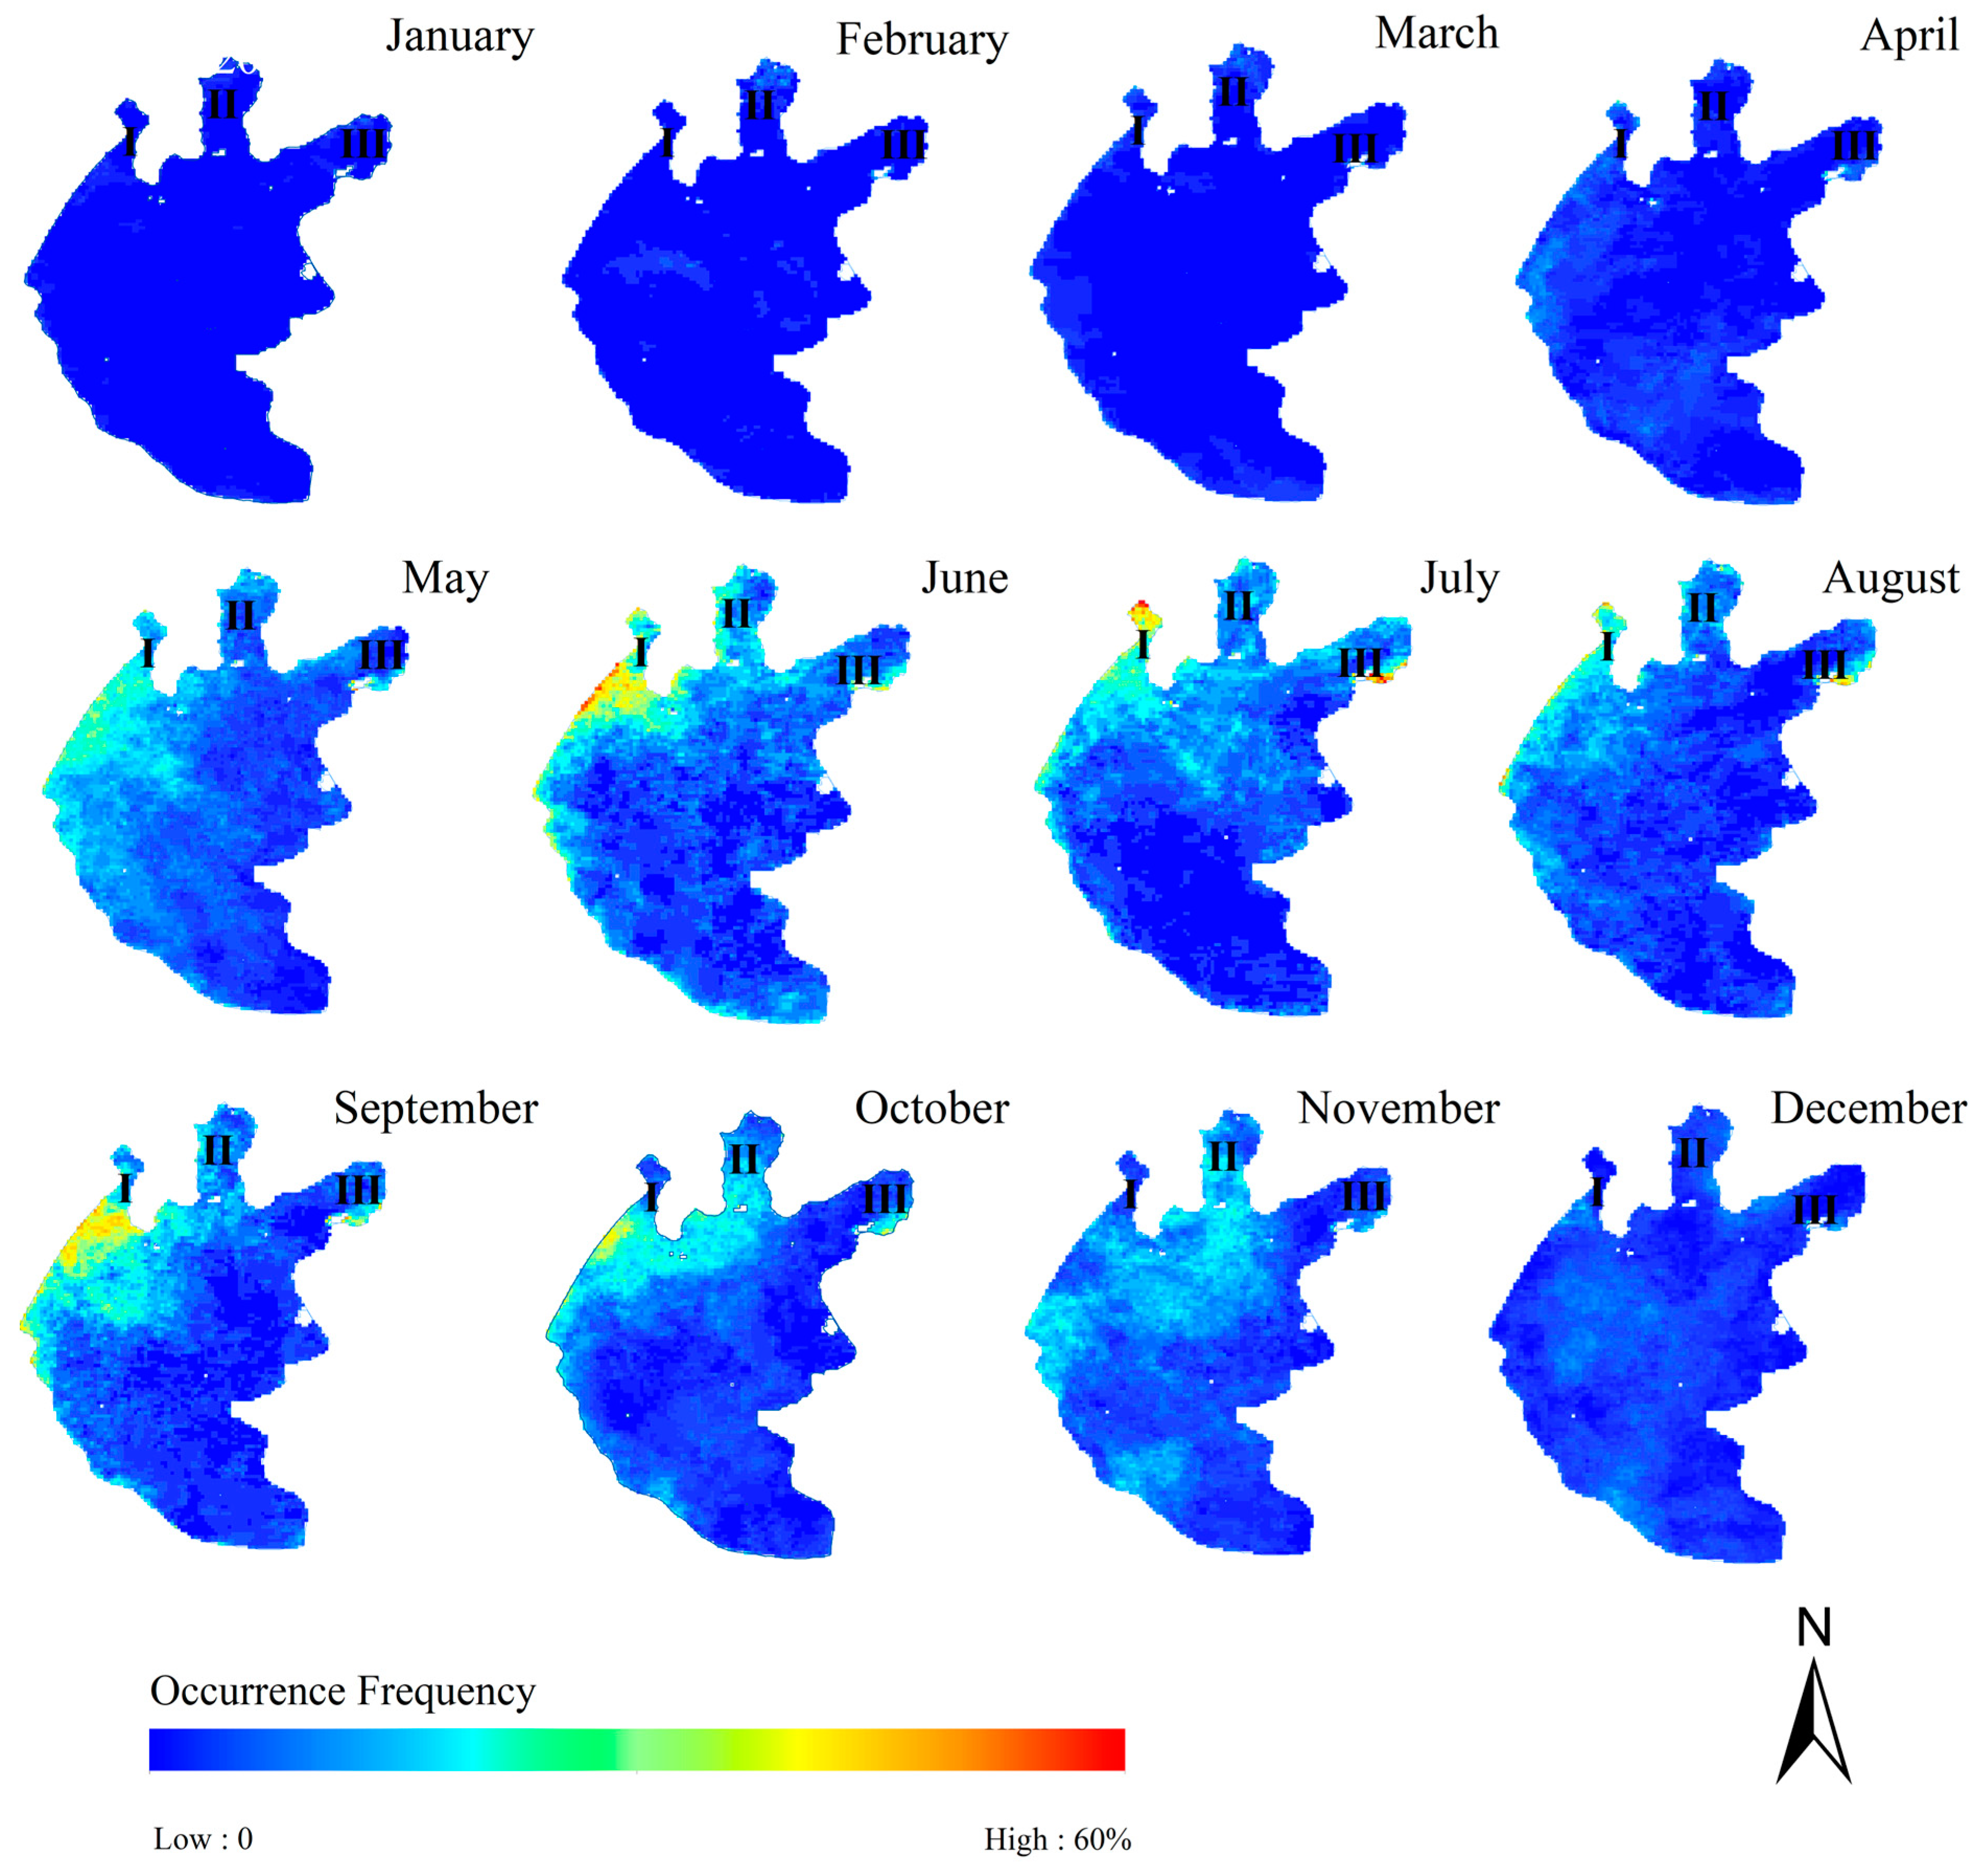
- Changes in the spatial distribution of cyanobacteria bloom occurrence frequency during the year
5. Discussion
5.1. Analysis of Cyanobacteria Bloom during 2010–2020
5.2. Applicability of WVA-QPSO-RF Method in Other Lakes
6. Conclusions
Supplementary Materials
Author Contributions
Funding
Data Availability Statement
Conflicts of Interest
References
- Zhang, W.; Liu, J.; Xiao, Y.; Zhang, Y.; Yu, Y.; Zheng, Z.; Liu, Y.; Li, Q. The Impact of Cyanobacteria Blooms on the Aquatic Environment and Human Health. Toxins 2022, 14, 658. [Google Scholar] [CrossRef]
- Yang, S.Q.; Liu, P.W. Strategy of Water Pollution Prevention in Taihu Lake and Its Effects Analysis. J. Gt. Lakes Res. 2010, 36, 150–158. [Google Scholar] [CrossRef]
- Jia, T.; Zhang, X.; Dong, R. Long-Term Spatial and Temporal Monitoring of Cyanobacteria Blooms Using MODIS on Google Earth Engine: A Case Study in Taihu Lake. Remote Sens. 2019, 11, 2269. [Google Scholar] [CrossRef]
- Qi, L.; Hu, C.; Visser, P.M.; Ma, R. Diurnal Changes of Cyanobacteria Blooms in Taihu Lake as Derived from GOCI Observations. Limnol. Oceanogr. 2018, 63, 1711–1726. [Google Scholar] [CrossRef]
- Wang, S.; Zhang, X.; Wang, C.; Chen, N. Temporal Continuous Monitoring of Cyanobacterial Blooms in Lake Taihu at an Hourly Scale Using Machine Learning. Sci. Total Environ. 2023, 857, 159480. [Google Scholar] [CrossRef] [PubMed]
- Wu, L.; Zhu, Y.; Zhu, X. Analysis on Influencing Factors of Continuous Cyanobacteria Outbreak in Taihu Lake from 2007 to 2020. Water Resour. Dev. Manag. 2023, 9, 43–49+84. [Google Scholar] [CrossRef]
- Liang, Q.; Zhang, Y.; Ma, R.; Loiselle, S.; Li, J.; Hu, M. A MODIS-Based Novel Method to Distinguish Surface Cyanobacterial Scums and Aquatic Macrophytes in Lake Taihu. Remote Sens. 2017, 9, 133. [Google Scholar] [CrossRef]
- Feng, L.; Hu, C.; Han, X.; Chen, X.; Qi, L. Long-Term Distribution Patterns of Chlorophyll-a Concentration in China’s Largest Freshwater Lake: MERIS Full-Resolution Observations with a Practical Approach. Remote Sens. 2014, 7, 275–299. [Google Scholar] [CrossRef]
- Malahlela, O.E.; Oliphant, T.; Tsoeleng, L.T.; Mhangara, P. Mapping Chlorophyll-a Concentrations in a Cyanobacteria-and Algae-Impacted Vaal Dam Using Landsat 8 OLI Data. S. Afr. J. Sci. 2018, 114, 1–9. [Google Scholar] [CrossRef]
- Mishra, S.; Mishra, D.R. Normalized Difference Chlorophyll Index: A Novel Model for Remote Estimation of Chlorophyll-a Concentration in Turbid Productive Waters. Remote Sens. Environ. 2012, 117, 394–406. [Google Scholar] [CrossRef]
- Mishra, S.; Stumpf, R.P.; Schaeffer, B.A.; Werdell, P.J.; Loftin, K.A.; Meredith, A. Measurement of Cyanobacterial Bloom Magnitude Using Satellite Remote Sensing. Sci. Rep. 2019, 9, 18310. [Google Scholar] [CrossRef] [PubMed]
- Ogashawara, I.; Li, L.; Moreno-Madriñán, M.J. Slope Algorithm to Map Algal Blooms in Inland Waters for Landsat 8/Operational Land Imager Images. J. Appl. Remote Sens. 2017, 11, 012005. [Google Scholar] [CrossRef]
- Oyama, Y.; Fukushima, T.; Matsushita, B.; Matsuzaki, H.; Kamiya, K.; Kobinata, H. Monitoring Levels of Cyanobacterial Blooms Using the Visual Cyanobacteria Index (VCI) and Floating Algae Index (FAI). Int. J. Appl. Earth Obs. Geoinform. 2015, 38, 335–348. [Google Scholar] [CrossRef]
- Qin, X.; Xia, W.; Hu, X.; Shao, Z. Dynamic Variations of Cyanobacterial Blooms and Their Response to Urban Development and Climate Change in Lake Chaohu Based on Landsat Observations. Environ. Sci. Pollut. Res. 2022, 29, 33152–33166. [Google Scholar] [CrossRef] [PubMed]
- Shi, K.; Zhang, Y.; Zhou, Y.; Liu, X.; Zhu, G.; Qin, B.; Gao, G. Long-Term MODIS Observations of Cyanobacterial Dynamics in Lake Taihu: Responses to Nutrient Enrichment and Meteorological Factors. Sci. Rep. 2017, 7, 40326. [Google Scholar] [CrossRef] [PubMed]
- Tomlinson, M.C.; Stumpf, R.P.; Wynne, T.T.; Dupuy, D.; Burks, R.; Hendrickson, J.; Fulton III, R.S. Relating Chlorophyll from Cyanobacteria-Dominated Inland Waters to a MERIS Bloom Index. Remote Sens. Lett. 2016, 7, 141–149. [Google Scholar] [CrossRef]
- Hu, C. A Novel Ocean Color Index to Detect Floating Algae in the Global Oceans. Remote Sens. Environ. 2009, 113, 2118–2129. [Google Scholar] [CrossRef]
- Ananias, P.H.M.; Negri, R.G.; Dias, M.A.; Silva, E.A.; Casaca, W. A Fully Unsupervised Machine Learning Framework for Algal Bloom Forecasting in Inland Waters Using MODIS Time Series and Climatic Products. Remote Sens. 2022, 14, 4283. [Google Scholar] [CrossRef]
- Cao, H.; Han, L.; Li, L. A Deep Learning Method for Cyanobacterial Harmful Algae Blooms Prediction in Taihu Lake, China. Harmful Algae 2022, 113, 102189. [Google Scholar] [CrossRef]
- Song, Z.; Xu, W.; Dong, H.; Wang, X.; Cao, Y.; Huang, P.; Hou, D.; Wu, Z.; Wang, Z. Research on Cyanobacterial-Bloom Detection Based on Multispectral Imaging and Deep-Learning Method. Sensors 2022, 22, 4571. [Google Scholar] [CrossRef]
- Yan, K.; Li, J.; Zhao, H.; Wang, C.; Hong, D.; Du, Y.; Mu, Y.; Tian, B.; Xie, Y.; Yin, Z.; et al. Deep Learning-Based Automatic Extraction of Cyanobacterial Blooms from Sentinel-2 MSI Satellite Data. Remote Sens. 2022, 14, 4763. [Google Scholar] [CrossRef]
- Bouslihim, Y.; Kharrou, M.H.; Miftah, A.; Attou, T.; Bouchaou, L.; Chehbouni, A. Comparing Pan-Sharpened Landsat-9 and Sentinel-2 for Land-Use Classification Using Machine Learning Classifiers. J. Geovis. Spat. Anal. 2022, 6, 35. [Google Scholar] [CrossRef]
- Pan, X.; Yang, Z.; Yang, Y.; Sun, Y.; Liu, S.; Xie, W.; Li, T. Comparison and Applicability Analysis of Methods for Extracting Cyanobacteria from Lake Taihu Based on GF-6 Data. J. Lake Sci. 2022, 34, 1866–1876. [Google Scholar]
- Isaac, E.; Easwarakumar, K.; Isaac, J. Urban Landcover Classification from Multispectral Image Data Using Optimized AdaBoosted Random Forests. Remote Sens. Lett. 2017, 8, 350–359. [Google Scholar] [CrossRef]
- Sonobe, R.; Yamaya, Y.; Tani, H.; Wang, X.; Kobayashi, N.; Mochizuki, K. Assessing the Suitability of Data from Sentinel-1A and 2A for Crop Classification. GISci. Remote Sens. 2017, 54, 918–938. [Google Scholar] [CrossRef]
- Mantovani, R.G.; Rossi, A.L.D.; Vanschoren, J.; Bischl, B.; De Carvalho, A.C.P.L.F. Effectiveness of Random Search in SVM Hyper-Parameter Tuning. In Proceedings of the 2015 IEEE International Joint Conference on Neural Networks (IJCNN), Killarney, Ireland, 12–17 July 2015; pp. 1–8. [Google Scholar]
- Sheng, X.; Xi, M.; Sun, J.; Xu, W. Quantum-Behaved Particle Swarm Optimization with Novel Adaptive Strategies. J. Algorithms Comput. Technol. 2015, 9, 143–161. [Google Scholar] [CrossRef]
- Islam, A.R.M.T.; Saha, A.; Ghose, B.; Pal, S.C.; Chowdhuri, I.; Mallick, J. Landslide Susceptibility Modeling in a Complex Mountainous Region of Sikkim Himalaya Using New Hybrid Data Mining Approach. Geocarto Int. 2022, 37, 9021–9046. [Google Scholar] [CrossRef]
- Zhang, C.; Xie, Y.; Liu, D.; Wang, L. Fast Threshold Image Segmentation Based on 2D Fuzzy Fisher and Random Local Optimized QPSO. IEEE Trans. Image Process. 2016, 26, 1355–1362. [Google Scholar] [CrossRef]
- Mergin, A.A.; Premi, M.G. Convolutional Neural Networks (CNN) with Quantum-Behaved Particle Swarm Optimization (QPSO)-Based Medical Image Fusion. Int. J. Image Graph. 2022, 2340005. [Google Scholar] [CrossRef]
- Xu, X.; Shan, D.; Wang, G.; Jiang, X. Multimodal Medical Image Fusion Using PCNN Optimized by the QPSO Algorithm. Appl. Soft Comput. 2016, 46, 588–595. [Google Scholar] [CrossRef]
- Qi, Y.; Xue, K.; Wang, W.; Cui, X.; Liang, R. Prediction Model of Borehole Spontaneous Combustion Based on Machine Learning and Its Application. Fire 2023, 6, 357. [Google Scholar] [CrossRef]
- Kim, G.H.J.; Shi, Y.; Yu, W.; Wong, W.K. A Study Design for Statistical Learning Technique to Predict Radiological Progression with an Application of Idiopathic Pulmonary Fibrosis Using Chest CT Images. Contemp. Clin. Trials 2021, 104, 106333. [Google Scholar] [CrossRef]
- Zhou, X.; Wen, H.; Zhang, Y.; Xu, J.; Zhang, W. Landslide Susceptibility Mapping Using Hybrid Random Forest with GeoDetector and RFE for Factor Optimization. Geosci. Front. 2021, 12, 101211. [Google Scholar] [CrossRef]
- McFeeters, S.K. The Use of the Normalized Difference Water Index (NDWI) in the Delineation of Open Water Features. Int. J. Remote Sens. 1996, 17, 1425–1432. [Google Scholar] [CrossRef]
- Villa, P.; Mousivand, A.; Bresciani, M. Aquatic Vegetation Indices Assessment through Radiative Transfer Modeling and Linear Mixture Simulation. Int. J. Appl. Earth Obs. Geoinform. 2014, 30, 113–127. [Google Scholar] [CrossRef]
- Alawadi, F. Detection of Surface Algal Blooms Using the Newly Developed Algorithm Surface Algal Bloom Index (SABI). In Proceedings of the Remote Sensing of the Ocean, Sea Ice, and Large Water Regions 2010, Toulouse, France, 21–23 September 2010; SPIE: Bellingham, WA, USA, 2010; Volume 7825, pp. 45–58. [Google Scholar]
- Ma, J.; Li, X.; Ma, S.; Zhang, X.; Li, G.; Yu, Y. Temporal Trends of “Old” and “New” Persistent Halogenated Organic Pollutants in Fish from the Third Largest Freshwater Lake in China during 2011–2018 and the Associated Health Risks. Environ. Pollut. 2020, 267, 115497. [Google Scholar] [CrossRef] [PubMed]
- Luo, J.; Li, X.; Ma, R.; Li, F.; Duan, H.; Hu, W.; Qin, B.; Huang, W. Applying Remote Sensing Techniques to Monitoring Seasonal and Interannual Changes of Aquatic Vegetation in Taihu Lake, China. Ecol. Indic. 2016, 60, 503–513. [Google Scholar] [CrossRef]
- Xu, J.; Lyu, H.; Xu, X.; Li, Y.; Li, Z.; Lei, S.; Bi, S.; Mu, M.; Du, C.; Zeng, S. Dual Stable Isotope Tracing the Source and Composition of POM during Algae Blooms in a Large and Shallow Eutrophic Lake: All Contributions from Algae? Ecol. Indic. 2019, 102, 599–607. [Google Scholar] [CrossRef]
- Yang, X.; Wei, X.; Xu, X.; Zhang, Y.; Li, J.; Wan, J. Characteristics of Dissolved Organic Nitrogen in the Sediments of Six Water Sources in Taihu Lake, China. Int. J. Environ. Res. Public Health 2019, 16, 929. [Google Scholar] [CrossRef] [PubMed]
- Swain, R.; Sahoo, B. Mapping of Heavy Metal Pollution in River Water at Daily Time-Scale Using Spatio-Temporal Fusion of MODIS-Aqua and Landsat Satellite Imageries. J. Environ. Manag. 2017, 192, 1–14. [Google Scholar] [CrossRef] [PubMed]
- Khaleal, F.M.; El-Bialy, M.Z.; Saleh, G.M.; Lasheen, E.S.R.; Kamar, M.S.; Omar, M.M.; El-Dawy, M.N.; Abdelaal, A. Assessing Environmental and Radiological Impacts and Lithological Mapping of Beryl-Bearing Rocks in Egypt Using High-Resolution Sentinel-2 Remote Sensing Images. Sci. Rep. 2023, 13, 11497. [Google Scholar] [CrossRef]
- Mondal, P.; McDermid, S.S.; Qadir, A. A Reporting Framework for Sustainable Development Goal 15: Multi-Scale Monitoring of Forest Degradation Using MODIS, Landsat and Sentinel Data. Remote Sens. Environ. 2020, 237, 111592. [Google Scholar] [CrossRef]
- Hutengs, C.; Vohland, M. Downscaling Land Surface Temperatures at Regional Scales with Random Forest Regression. Remote Sens. Environ. 2016, 178, 127–141. [Google Scholar] [CrossRef]
- Wu, H.; Li, W. Downscaling Land Surface Temperatures Using a Random Forest Regression Model with Multitype Predictor Variables. IEEE Access 2019, 7, 21904–21916. [Google Scholar] [CrossRef]
- Zhao, W.; Duan, S.-B.; Li, A.; Yin, G. A Practical Method for Reducing Terrain Effect on Land Surface Temperature Using Random Forest Regression. Remote Sens. Environ. 2019, 221, 635–649. [Google Scholar] [CrossRef]
- Ananias, P.H.M.; Negri, R.G. Anomalous Behaviour Detection Using One-Class Support Vector Machine and Remote Sensing Images: A Case Study of Algal Bloom Occurrence in Inland Waters. Int. J. Digit. Earth 2021, 14, 921–942. [Google Scholar] [CrossRef]
- Sen, P.K. Estimates of the Regression Coefficient Based on Kendall’s Tau. J. Am. Stat. Assoc. 1968, 63, 1379–1389. [Google Scholar] [CrossRef]
- Kendall, M.G. Rank Correlation Methods; Griffin: London, UK, 1948. [Google Scholar]
- Mann, H.B. Nonparametric Tests against Trend. Econom. J. Econom. Soc. 1945, 13, 245–259. [Google Scholar] [CrossRef]
- Jiang, W.; Yuan, L.; Wang, W.; Cao, R.; Zhang, Y.; Shen, W. Spatio-Temporal Analysis of Vegetation Variation in the Yellow River Basin. Ecol. Indic. 2015, 51, 117–126. [Google Scholar] [CrossRef]
- Liu, L.; Xiang, A.; Feng, Y.; Wei, D.Q.; Yang, H.; Xia, X.S. Cyanobacteria Diversity in Eutrophic Lake of Yunnan, China. Adv. Mater. Res. 2012, 343, 914–919. [Google Scholar] [CrossRef]
- Wu, H.; Jia, G.; Xu, B.; Shao, Y.; Zhao, X. Analysis of Variation and Driving Factors of Total Phosphorus in Lake Taihu, 1980–2020. J. Lake Sci. 2021, 33, 974–991. [Google Scholar]
- Zhu, G.; Shi, K.; Li, W.; Li, N. Seasonal Forecast Method of Cyanobacterial Bloom Intensity in Eutrophic Lake Taihu, China. J. Lake Sci. 2020, 32, 1421. [Google Scholar] [CrossRef]
- Han, X.; Zhu, G.; Xu, H.; Wilhelm, S.W.; Qin, B.; Li, Z. Source Analysis of Urea-N in Lake Taihu during Summer. Environ. Sci. 2014, 35, 2547–2556. [Google Scholar]
- Li, S.; Liu, C.; Sun, P.; Ni, T. Response of Cyanobacterial Bloom Risk to Nitrogen and Phosphorus Concentrations in Large Shallow Lakes Determined through Geographical Detector: A Case Study of Taihu Lake, China. Sci. Total Environ. 2022, 816, 151617. [Google Scholar] [CrossRef]
- Wang, Y.; Guo, Y.; Zhao, Y.; Wang, L.; Chen, Y.; Yang, L. Spatiotemporal Heterogeneities and Driving Factors of Water Quality and Trophic State of a Typical Urban Shallow Lake (Taihu, China). Environ. Sci. Pollut. Res. 2022, 29, 53831–53843. [Google Scholar] [CrossRef]
- Shi, W.; Zhang, Y.; Wang, M. Deriving Total Suspended Matter Concentration from the Near-Infrared-Based Inherent Optical Properties over Turbid Waters: A Case Study in Lake Taihu. Remote Sens. 2018, 10, 333. [Google Scholar] [CrossRef]
- Liu, X.; Zhang, Y.; Shi, K.; Zhou, Y.; Tang, X.; Zhu, G.; Qin, B. Mapping Aquatic Vegetation in a Large, Shallow Eutrophic Lake: A Frequency-Based Approach Using Multiple Years of MODIS Data. Remote Sens. 2015, 7, 10295–10320. [Google Scholar] [CrossRef]
- Qi, Y.; Hu, S.; Huo, S.; Xi, B.; Zhang, J.; Wang, X. Spatial Distribution and Historical Deposition Behaviors of Perfluoroalkyl Substances (PFASs) in Sediments of Lake Chaohu, a Shallow Eutrophic Lake in Eastern China. Ecol. Indic. 2015, 57, 1–10. [Google Scholar] [CrossRef]
- Huang, J.; Xu, Q.; Wang, X.; Ji, H.; Quigley, E.J.; Sharbatmaleki, M.; Li, S.; Xi, B.; Sun, B.; Li, C. Effects of Hydrological and Climatic Variables on Cyanobacterial Blooms in Four Large Shallow Lakes Fed by the Yangtze River. Environ. Sci. Ecotechnol. 2021, 5, 100069. [Google Scholar] [CrossRef] [PubMed]
- Lin, S.S.; Shen, S.L.; Zhou, A.; Lyu, H.M. Assessment and Management of Lake Eutrophication: A Case Study in Lake Erhai, China. Sci. Total Environ. 2021, 751, 141618. [Google Scholar] [CrossRef] [PubMed]
- Wang, Z.; Xin, C.; Sun, Z.; Luo, J.; Ma, R. Automatic Extraction Method of Aquatic Vegetation Types in Small Shallow Lakes Based on Sentinel-2 Data: A Case Study of Cuiping Lake. Remote Sens. Inform. 2019, 34, 132–141. [Google Scholar]
- Fastner, J.; Abella, S.; Litt, A.; Morabito, G.; Vörös, L.; Pálffy, K.; Straile, D.; Kümmerlin, R.; Matthews, D.; Phillips, M.G.; et al. Combating Cyanobacterial Proliferation by Avoiding or Treating Inflows with High P Load—Experiences from Eight Case Studies. Aquat. Ecol. 2016, 50, 367–383. [Google Scholar] [CrossRef]
- Liu, X.; Li, Y.L.; Liu, B.G.; Qian, K.M.; Chen, Y.W.; Gao, J.F. Cyanobacteria in the Complex River-Connected Poyang Lake: Horizontal Distribution and Transport. Hydrobiologia 2016, 768, 95–110. [Google Scholar] [CrossRef]
- Wang, W.; Yang, P.; Xia, J.; Zhang, S.; Hu, S. Changes in the Water Environment and Its Major Driving Factors in Poyang Lake from 2016 to 2019, China. Environ. Sci. Pollut. Res. 2023, 30, 3182–3196. [Google Scholar] [CrossRef]


| Band | Name | Wavelength Range/nm | Spatial Resolution/m |
|---|---|---|---|
| 1 | Red | 620–670 | 500 |
| 2 | Near-Infrared | 841–876 | 500 |
| 3 | Blue | 459–479 | 500 |
| 4 | Green | 545–565 | 500 |
| 5 | Short-Wave Infrared | 1230–1250 | 500 |
| Month | Date |
|---|---|
| 1 | 18 January 2023 |
| 2 | 28 February 2017 |
| 3 | 29 March 2022 |
| 4 | 9 April 2018 |
| 5 | 24 May 2019 |
| 6 | 3 June 2019 |
| 7 | 18 July 2018 |
| 8 | 12 August 2019 |
| 9 | 30 September 2021 |
| 10 | 10 October 2022 |
| 11 | 20 November 2019 |
| 12 | 14 December 2022 |
| Month | Evaluation Index | NDVI Threshold | NDWI Threshold | FAI Threshold | RF (NDVI & NDWI) | ABD-RF | WVA-RF | WVA-QPSO-RF-A | WVA-QPSO-RF |
|---|---|---|---|---|---|---|---|---|---|
| January | precision | 0.72 | 0.76 | 0.77 | 0.87 | 0.93 | 0.90 | 0.92 | 0.95 |
| recall | 0.85 | 0.89 | 0.84 | 0.89 | 0.94 | 0.93 | 0.93 | 0.94 | |
| F1 score | 0.78 | 0.82 | 0.80 | 0.88 | 0.93 | 0.91 | 0.92 | 0.95 | |
| February | precision | 0.72 | 0.70 | 0.75 | 0.88 | 0.92 | 0.89 | 0.91 | 0.94 |
| recall | 0.83 | 0.90 | 0.86 | 0.90 | 0.91 | 0.92 | 0.90 | 0.93 | |
| F1 score | 0.77 | 0.79 | 0.80 | 0.89 | 0.92 | 0.90 | 0.90 | 0.94 | |
| March | precision | 0.84 | 0.65 | 0.71 | 0.87 | 0.94 | 0.84 | 0.94 | 0.97 |
| recall | 0.74 | 0.87 | 0.65 | 0.87 | 0.88 | 0.96 | 0.73 | 0.94 | |
| F1 score | 0.79 | 0.74 | 0.68 | 0.87 | 0.91 | 0.90 | 0.82 | 0.95 | |
| April | precision | 0.63 | 0.56 | 0.63 | 0.88 | 0.95 | 0.87 | 0.94 | 0.97 |
| recall | 0.82 | 0.88 | 0.83 | 0.88 | 0.91 | 0.95 | 0.94 | 0.96 | |
| F1 score | 0.71 | 0.68 | 0.72 | 0.88 | 0.93 | 0.91 | 0.94 | 0.96 | |
| May | precision | 0.53 | 0.53 | 0.49 | 0.61 | 0.84 | 0.74 | 0.82 | 0.90 |
| recall | 0.84 | 0.56 | 0.83 | 0.56 | 0.79 | 0.80 | 0.94 | 0.97 | |
| F1 score | 0.65 | 0.55 | 0.62 | 0.58 | 0.82 | 0.77 | 0.88 | 0.93 | |
| June | precision | 0.93 | 0.87 | 0.83 | 0.91 | 0.99 | 0.99 | 0.93 | 0.96 |
| recall | 0.76 | 0.76 | 0.86 | 0.76 | 0.86 | 0.89 | 0.75 | 0.99 | |
| F1 score | 0.84 | 0.81 | 0.84 | 0.83 | 0.92 | 0.94 | 0.83 | 0.98 | |
| July | precision | 0.68 | 0.73 | 0.65 | 0.77 | 0.80 | 0.88 | 0.93 | 0.88 |
| recall | 0.91 | 0.82 | 0.91 | 0.82 | 0.89 | 0.91 | 0.88 | 0.95 | |
| F1 score | 0.78 | 0.77 | 0.76 | 0.79 | 0.84 | 0.90 | 0.90 | 0.91 | |
| August | precision | 0.86 | 0.68 | 0.86 | 0.82 | 0.82 | 0.88 | 0.76 | 0.97 |
| recall | 0.73 | 0.87 | 0.70 | 0.87 | 0.77 | 0.94 | 0.88 | 0.94 | |
| F1 score | 0.79 | 0.76 | 0.77 | 0.85 | 0.79 | 0.91 | 0.82 | 0.96 | |
| September | precision | 0.79 | 0.78 | 0.60 | 0.92 | 0.94 | 0.95 | 0.90 | 0.96 |
| recall | 0.94 | 0.96 | 0.92 | 0.96 | 0.90 | 0.93 | 0.96 | 0.96 | |
| F1 score | 0.86 | 0.86 | 0.73 | 0.94 | 0.92 | 0.94 | 0.93 | 0.96 | |
| October | precision | 0.32 | 0.26 | 0.28 | 0.86 | 0.90 | 0.80 | 0.78 | 0.92 |
| recall | 0.55 | 0.96 | 0.67 | 0.96 | 0.94 | 0.74 | 0.93 | 0.96 | |
| F1 score | 0.41 | 0.41 | 0.39 | 0.91 | 0.92 | 0.77 | 0.85 | 0.94 | |
| November | precision | 0.53 | 0.58 | 0.49 | 0.72 | 0.91 | 0.80 | 0.83 | 0.95 |
| recall | 0.57 | 0.60 | 0.31 | 0.89 | 0.95 | 0.97 | 0.95 | 0.99 | |
| F1 score | 0.55 | 0.59 | 0.38 | 0.80 | 0.93 | 0.88 | 0.88 | 0.97 | |
| December | precision | 0.66 | 0.53 | 0.60 | 0.93 | 0.96 | 0.98 | 0.96 | 0.98 |
| recall | 0.97 | 0.89 | 0.94 | 0.89 | 0.87 | 0.88 | 0.93 | 0.95 | |
| F1 score | 0.78 | 0.66 | 0.73 | 0.91 | 0.92 | 0.93 | 0.95 | 0.97 |
Disclaimer/Publisher’s Note: The statements, opinions and data contained in all publications are solely those of the individual author(s) and contributor(s) and not of MDPI and/or the editor(s). MDPI and/or the editor(s) disclaim responsibility for any injury to people or property resulting from any ideas, methods, instructions or products referred to in the content. |
© 2024 by the authors. Licensee MDPI, Basel, Switzerland. This article is an open access article distributed under the terms and conditions of the Creative Commons Attribution (CC BY) license (https://creativecommons.org/licenses/by/4.0/).
Share and Cite
Pan, X.; Yuan, J.; Yang, Z.; Tansey, K.; Xie, W.; Song, H.; Wu, Y.; Yang, Y. Spatio-Temporal Variation of Cyanobacteria Blooms in Taihu Lake Using Multiple Remote Sensing Indices and Machine Learning. Remote Sens. 2024, 16, 889. https://doi.org/10.3390/rs16050889
Pan X, Yuan J, Yang Z, Tansey K, Xie W, Song H, Wu Y, Yang Y. Spatio-Temporal Variation of Cyanobacteria Blooms in Taihu Lake Using Multiple Remote Sensing Indices and Machine Learning. Remote Sensing. 2024; 16(5):889. https://doi.org/10.3390/rs16050889
Chicago/Turabian StylePan, Xin, Jie Yuan, Zi Yang, Kevin Tansey, Wenying Xie, Hao Song, Yuhang Wu, and Yingbao Yang. 2024. "Spatio-Temporal Variation of Cyanobacteria Blooms in Taihu Lake Using Multiple Remote Sensing Indices and Machine Learning" Remote Sensing 16, no. 5: 889. https://doi.org/10.3390/rs16050889
APA StylePan, X., Yuan, J., Yang, Z., Tansey, K., Xie, W., Song, H., Wu, Y., & Yang, Y. (2024). Spatio-Temporal Variation of Cyanobacteria Blooms in Taihu Lake Using Multiple Remote Sensing Indices and Machine Learning. Remote Sensing, 16(5), 889. https://doi.org/10.3390/rs16050889