


Intra-Annual Cumulative Effects and Mechanisms of Climatic Factors on Global Vegetation Biomes’ Growth


Abstract
1. Introduction
2. Data
2.1. NDVI Data
2.2. Climate Data
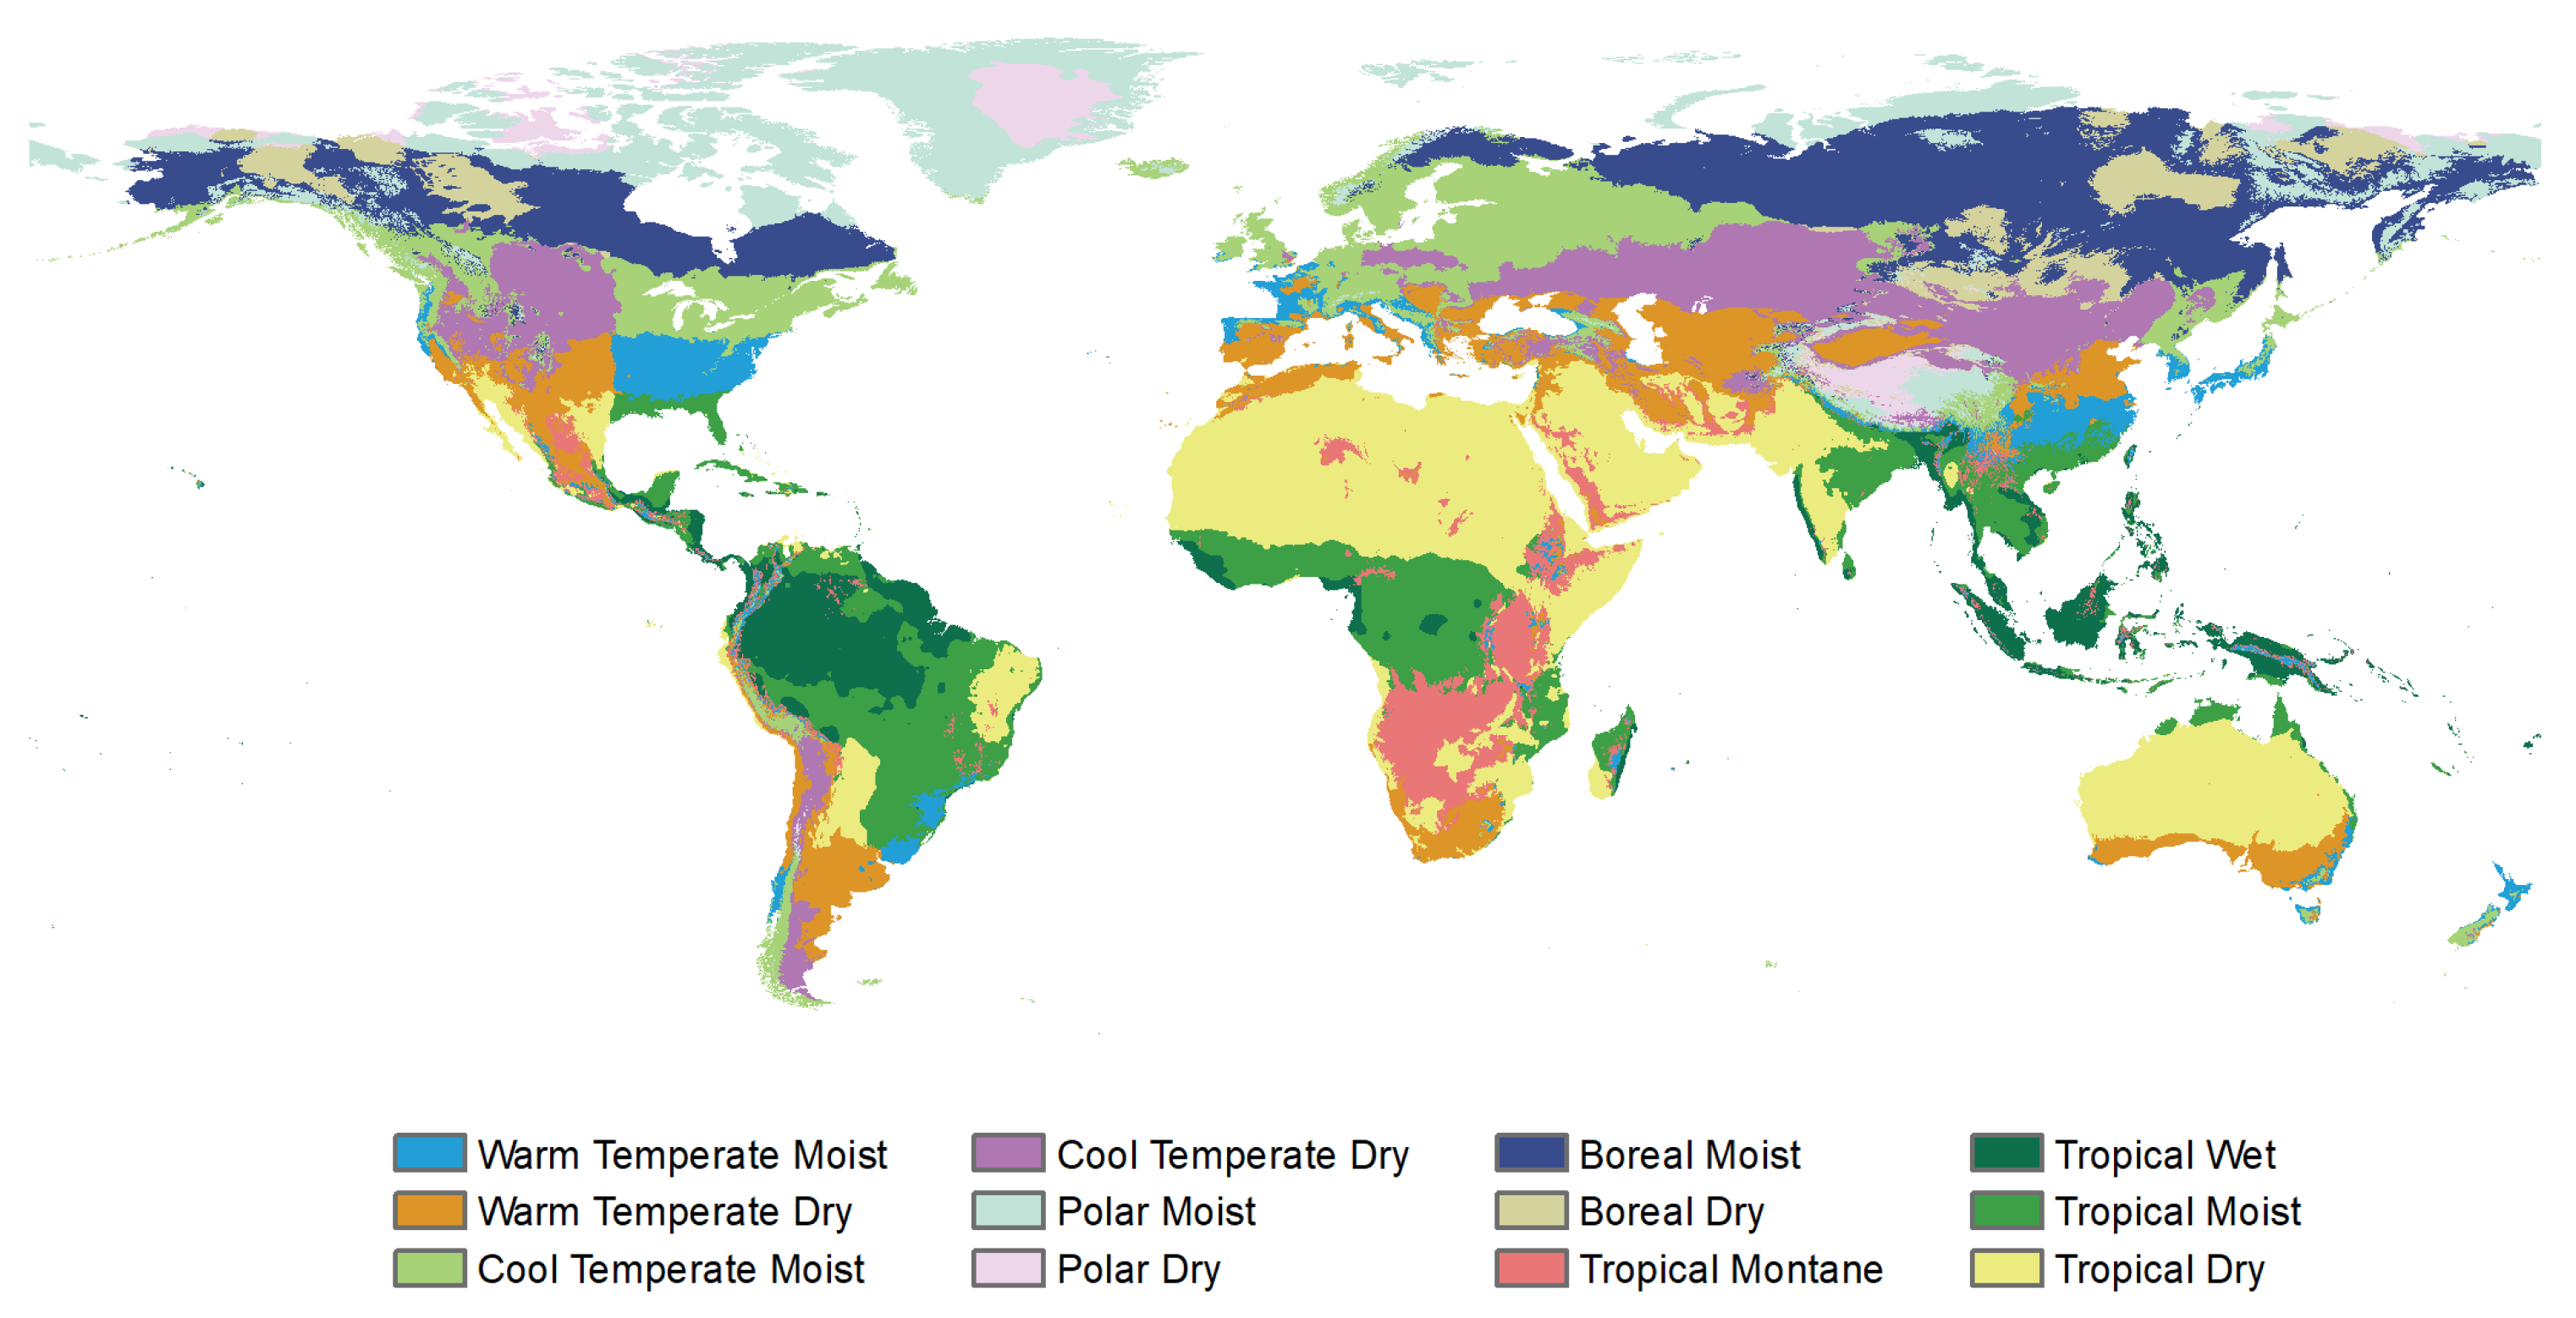
2.3. Vegetation Type Data
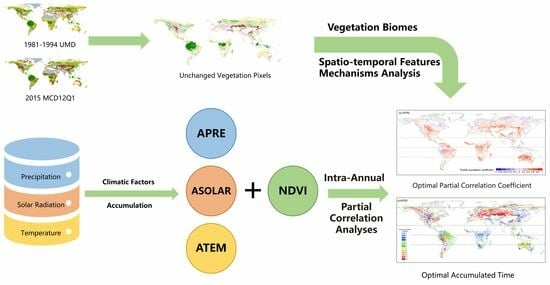
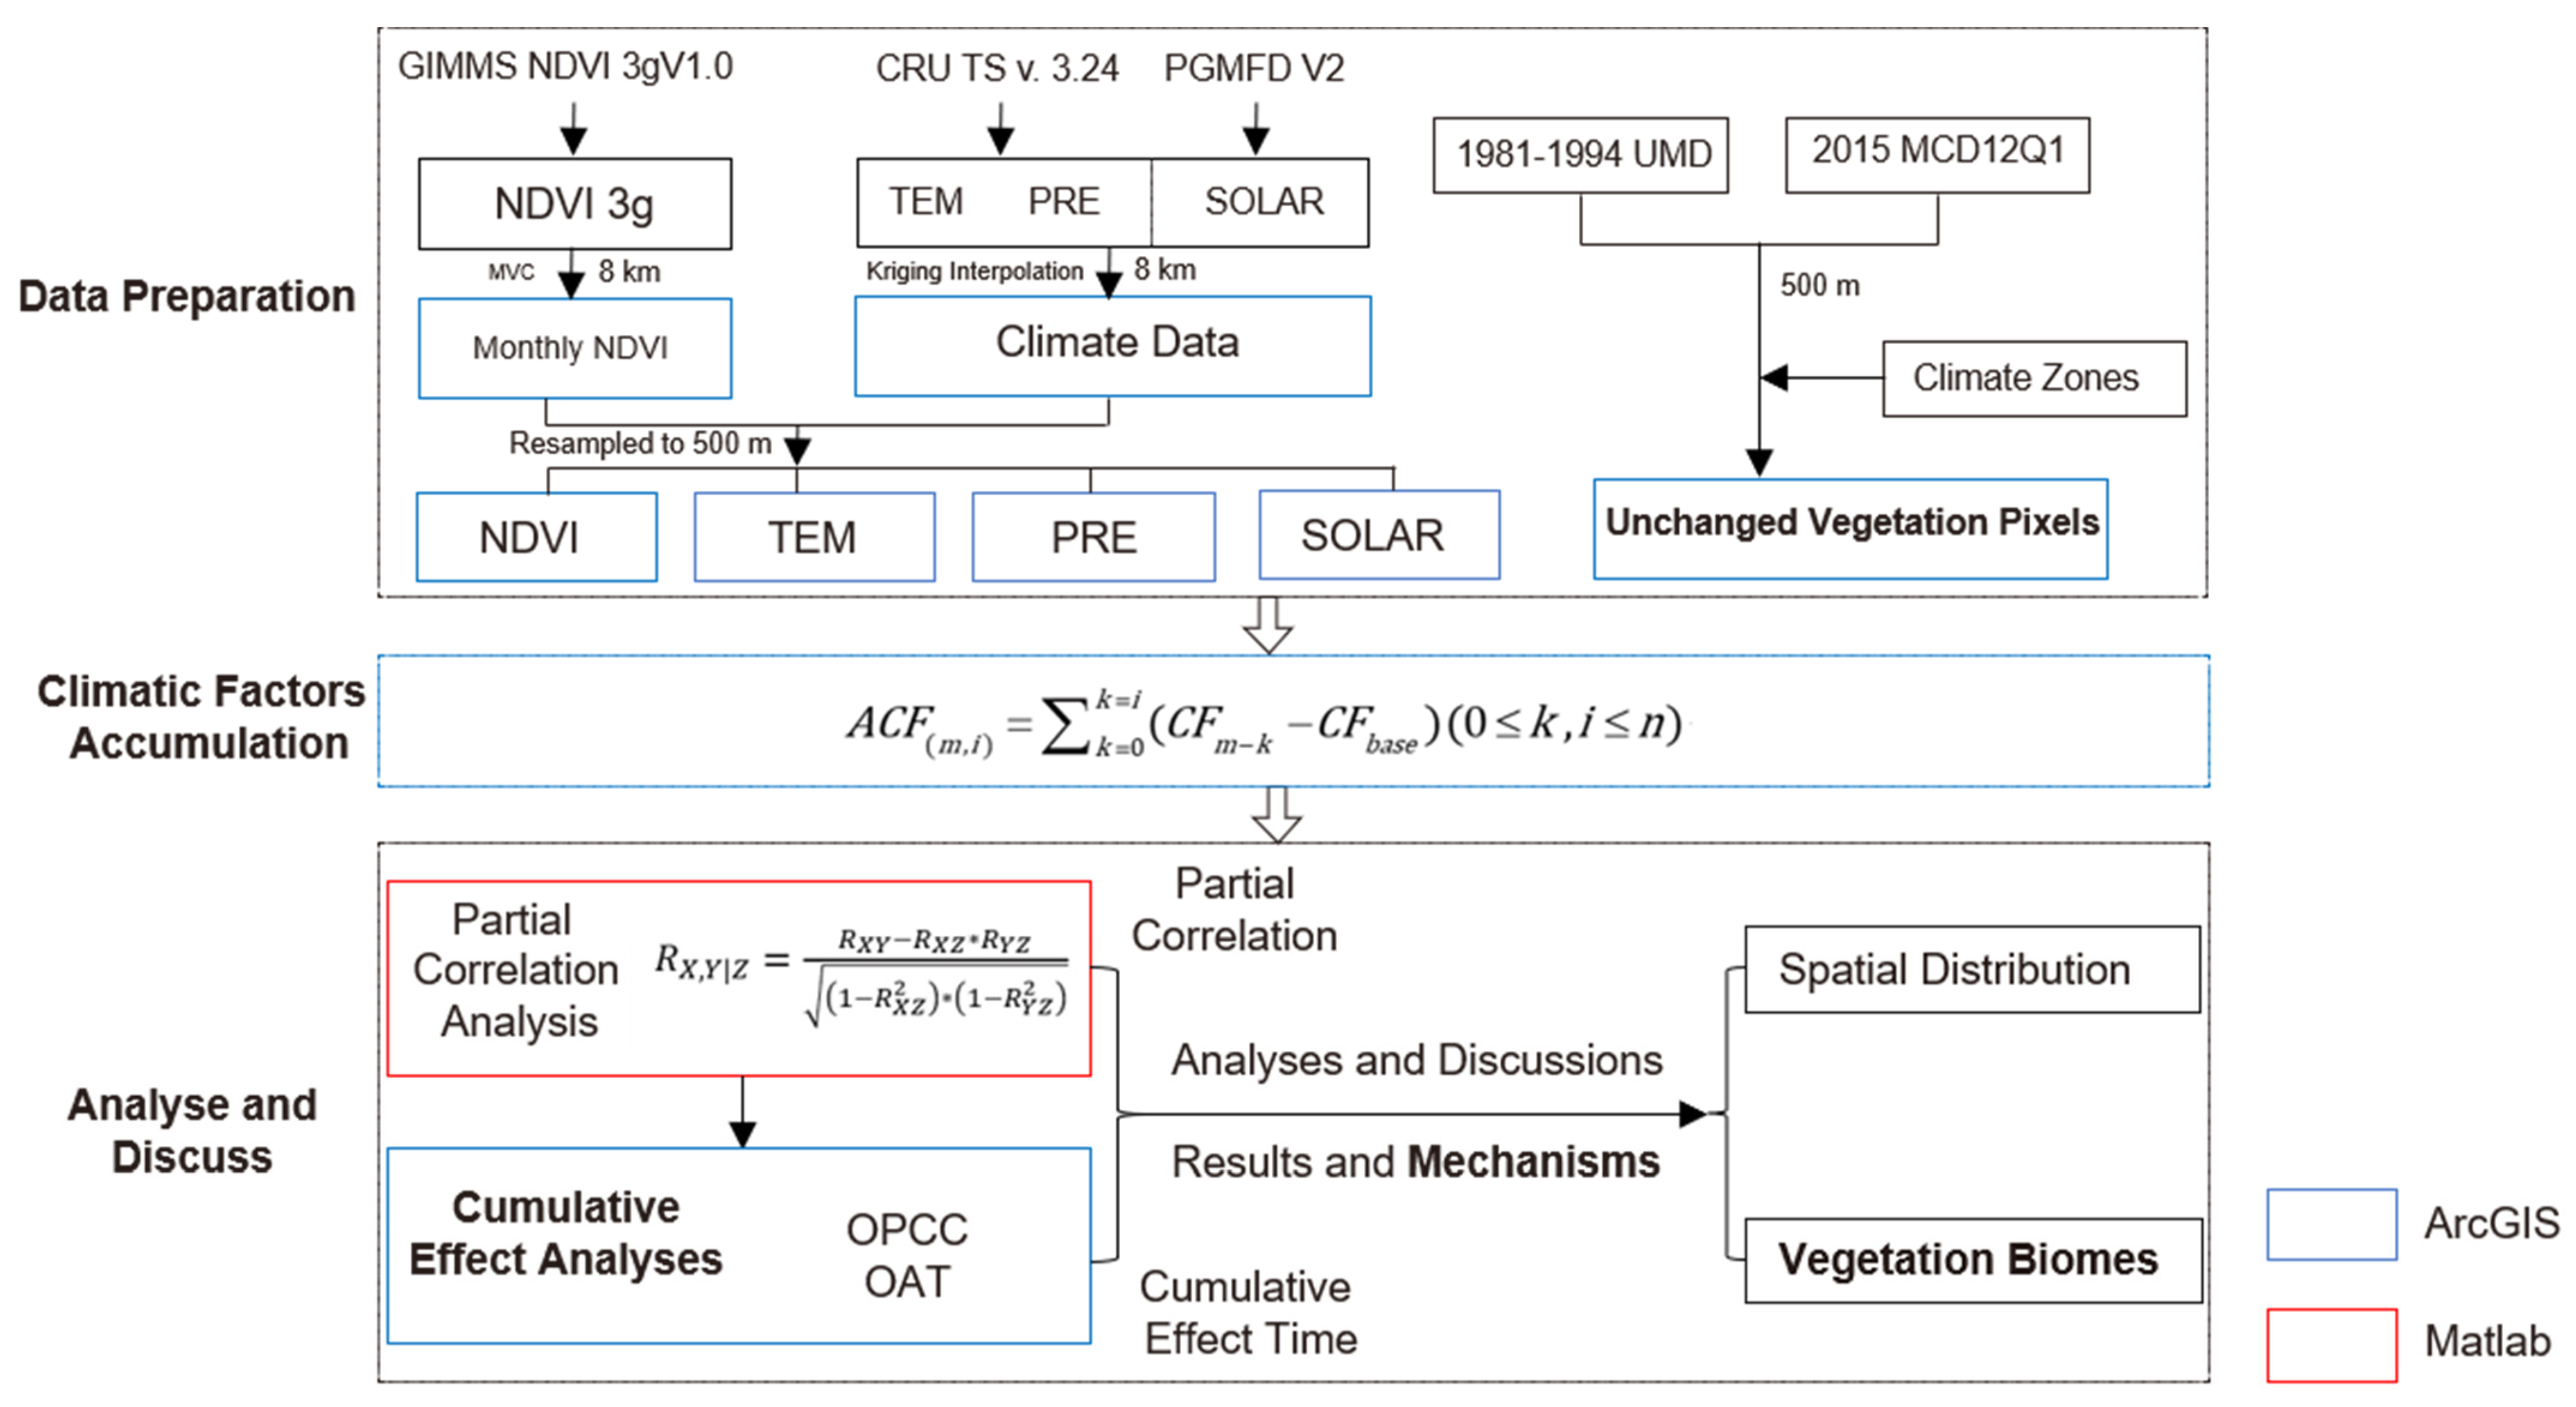
3. Methods
3.1. Accumulated Climatic Factors
3.2. Partial Correlation Analyses and Cumulative Effect Analyses
4. Results
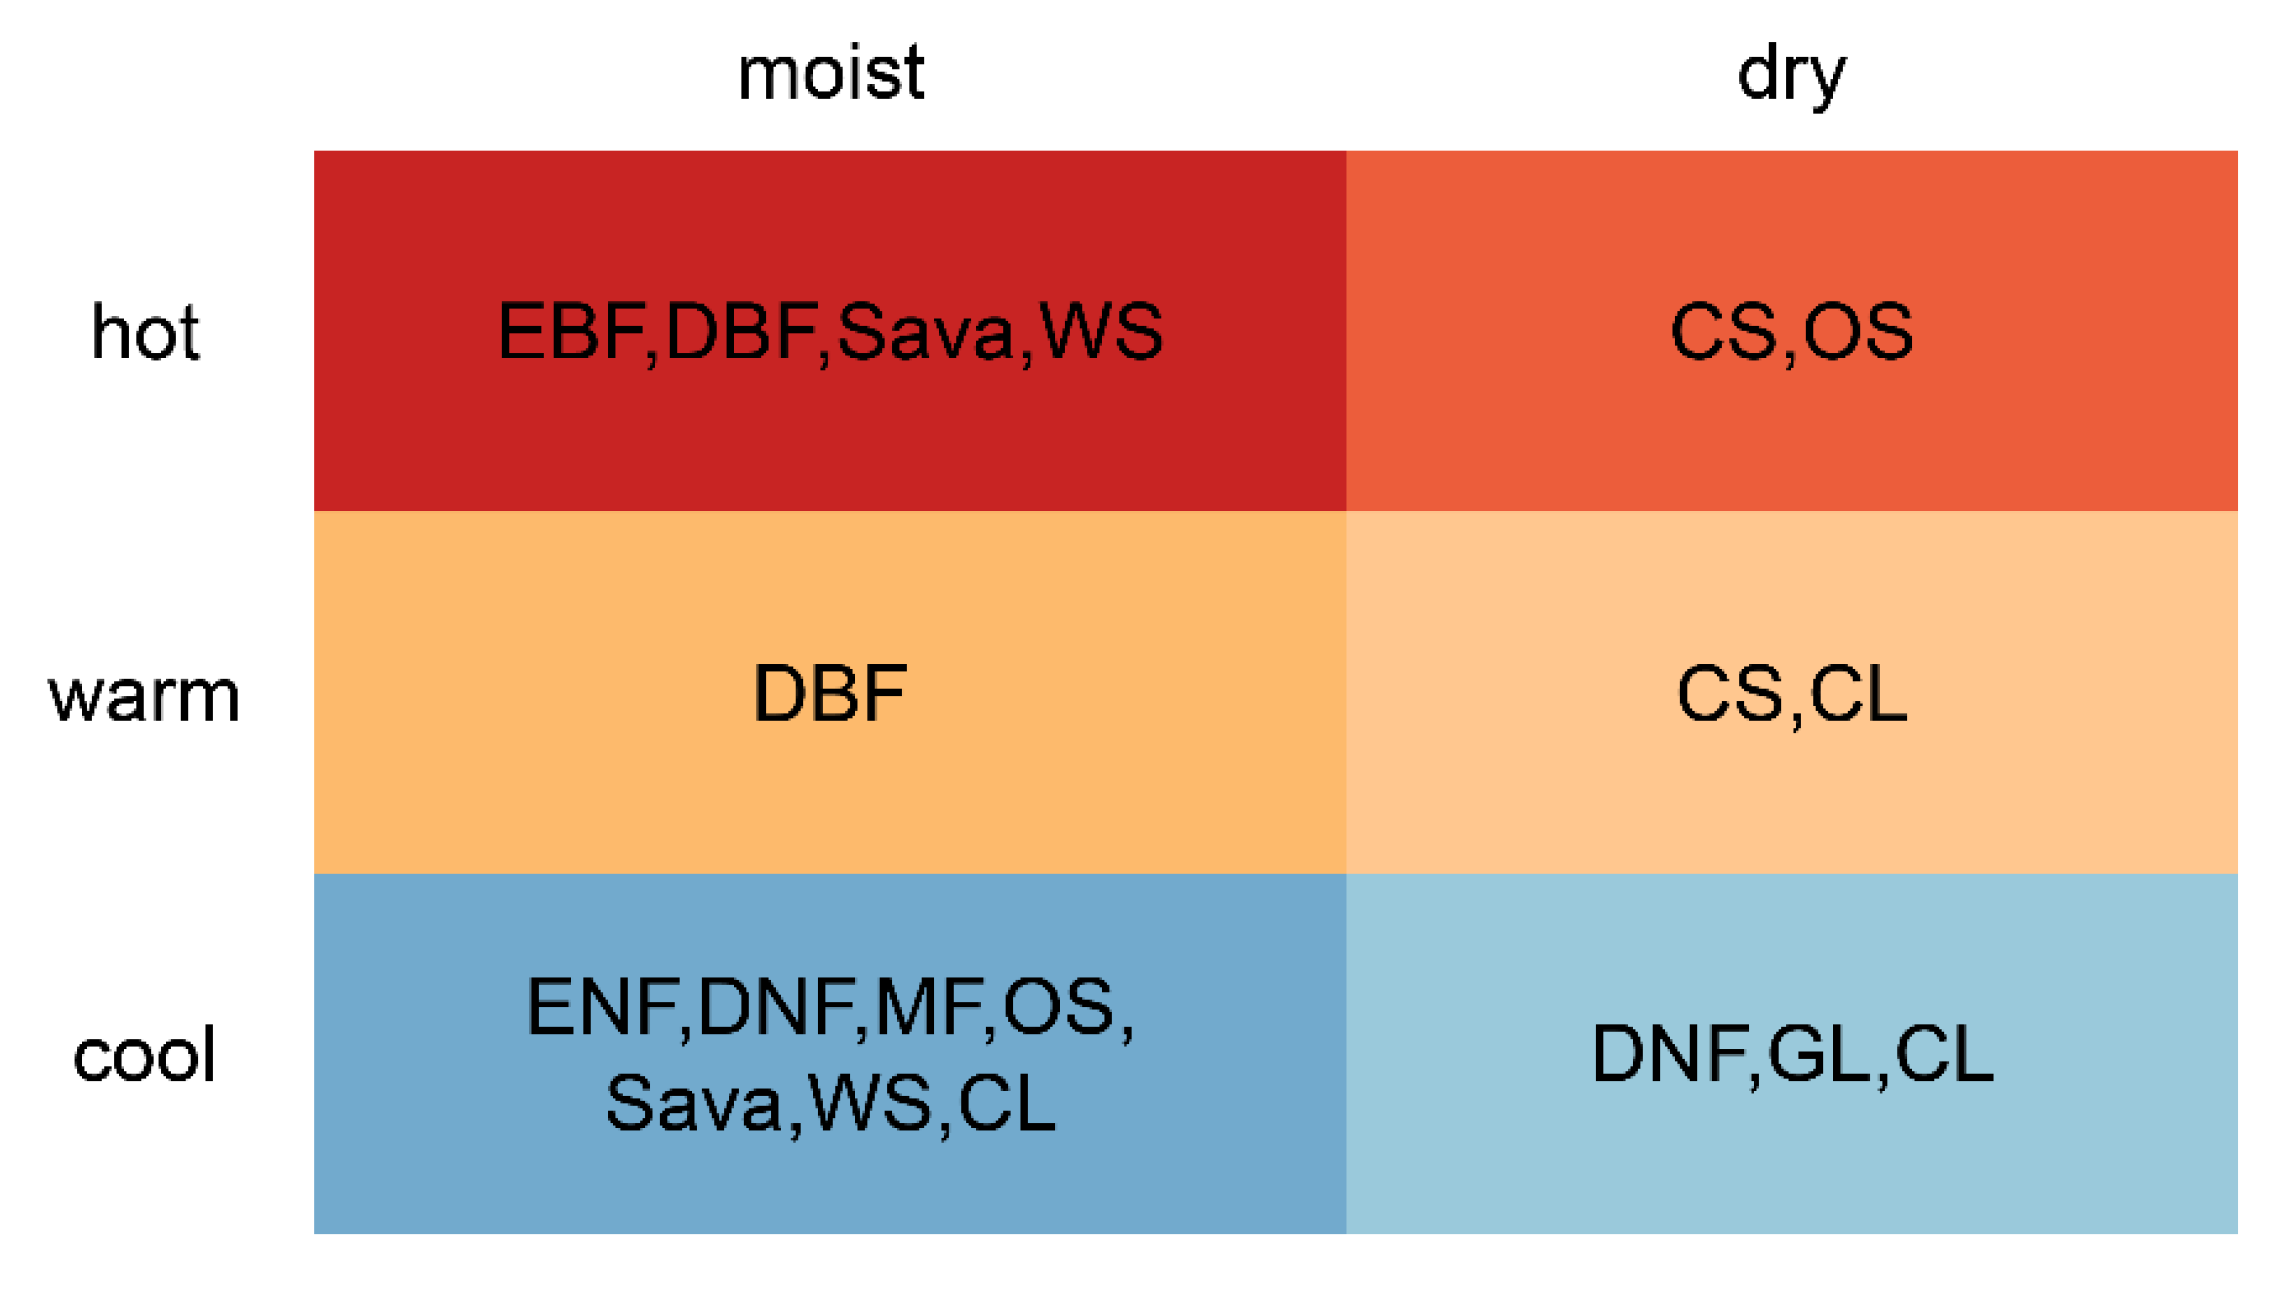
4.1. Global Distribution of Unchanged Vegetation Types
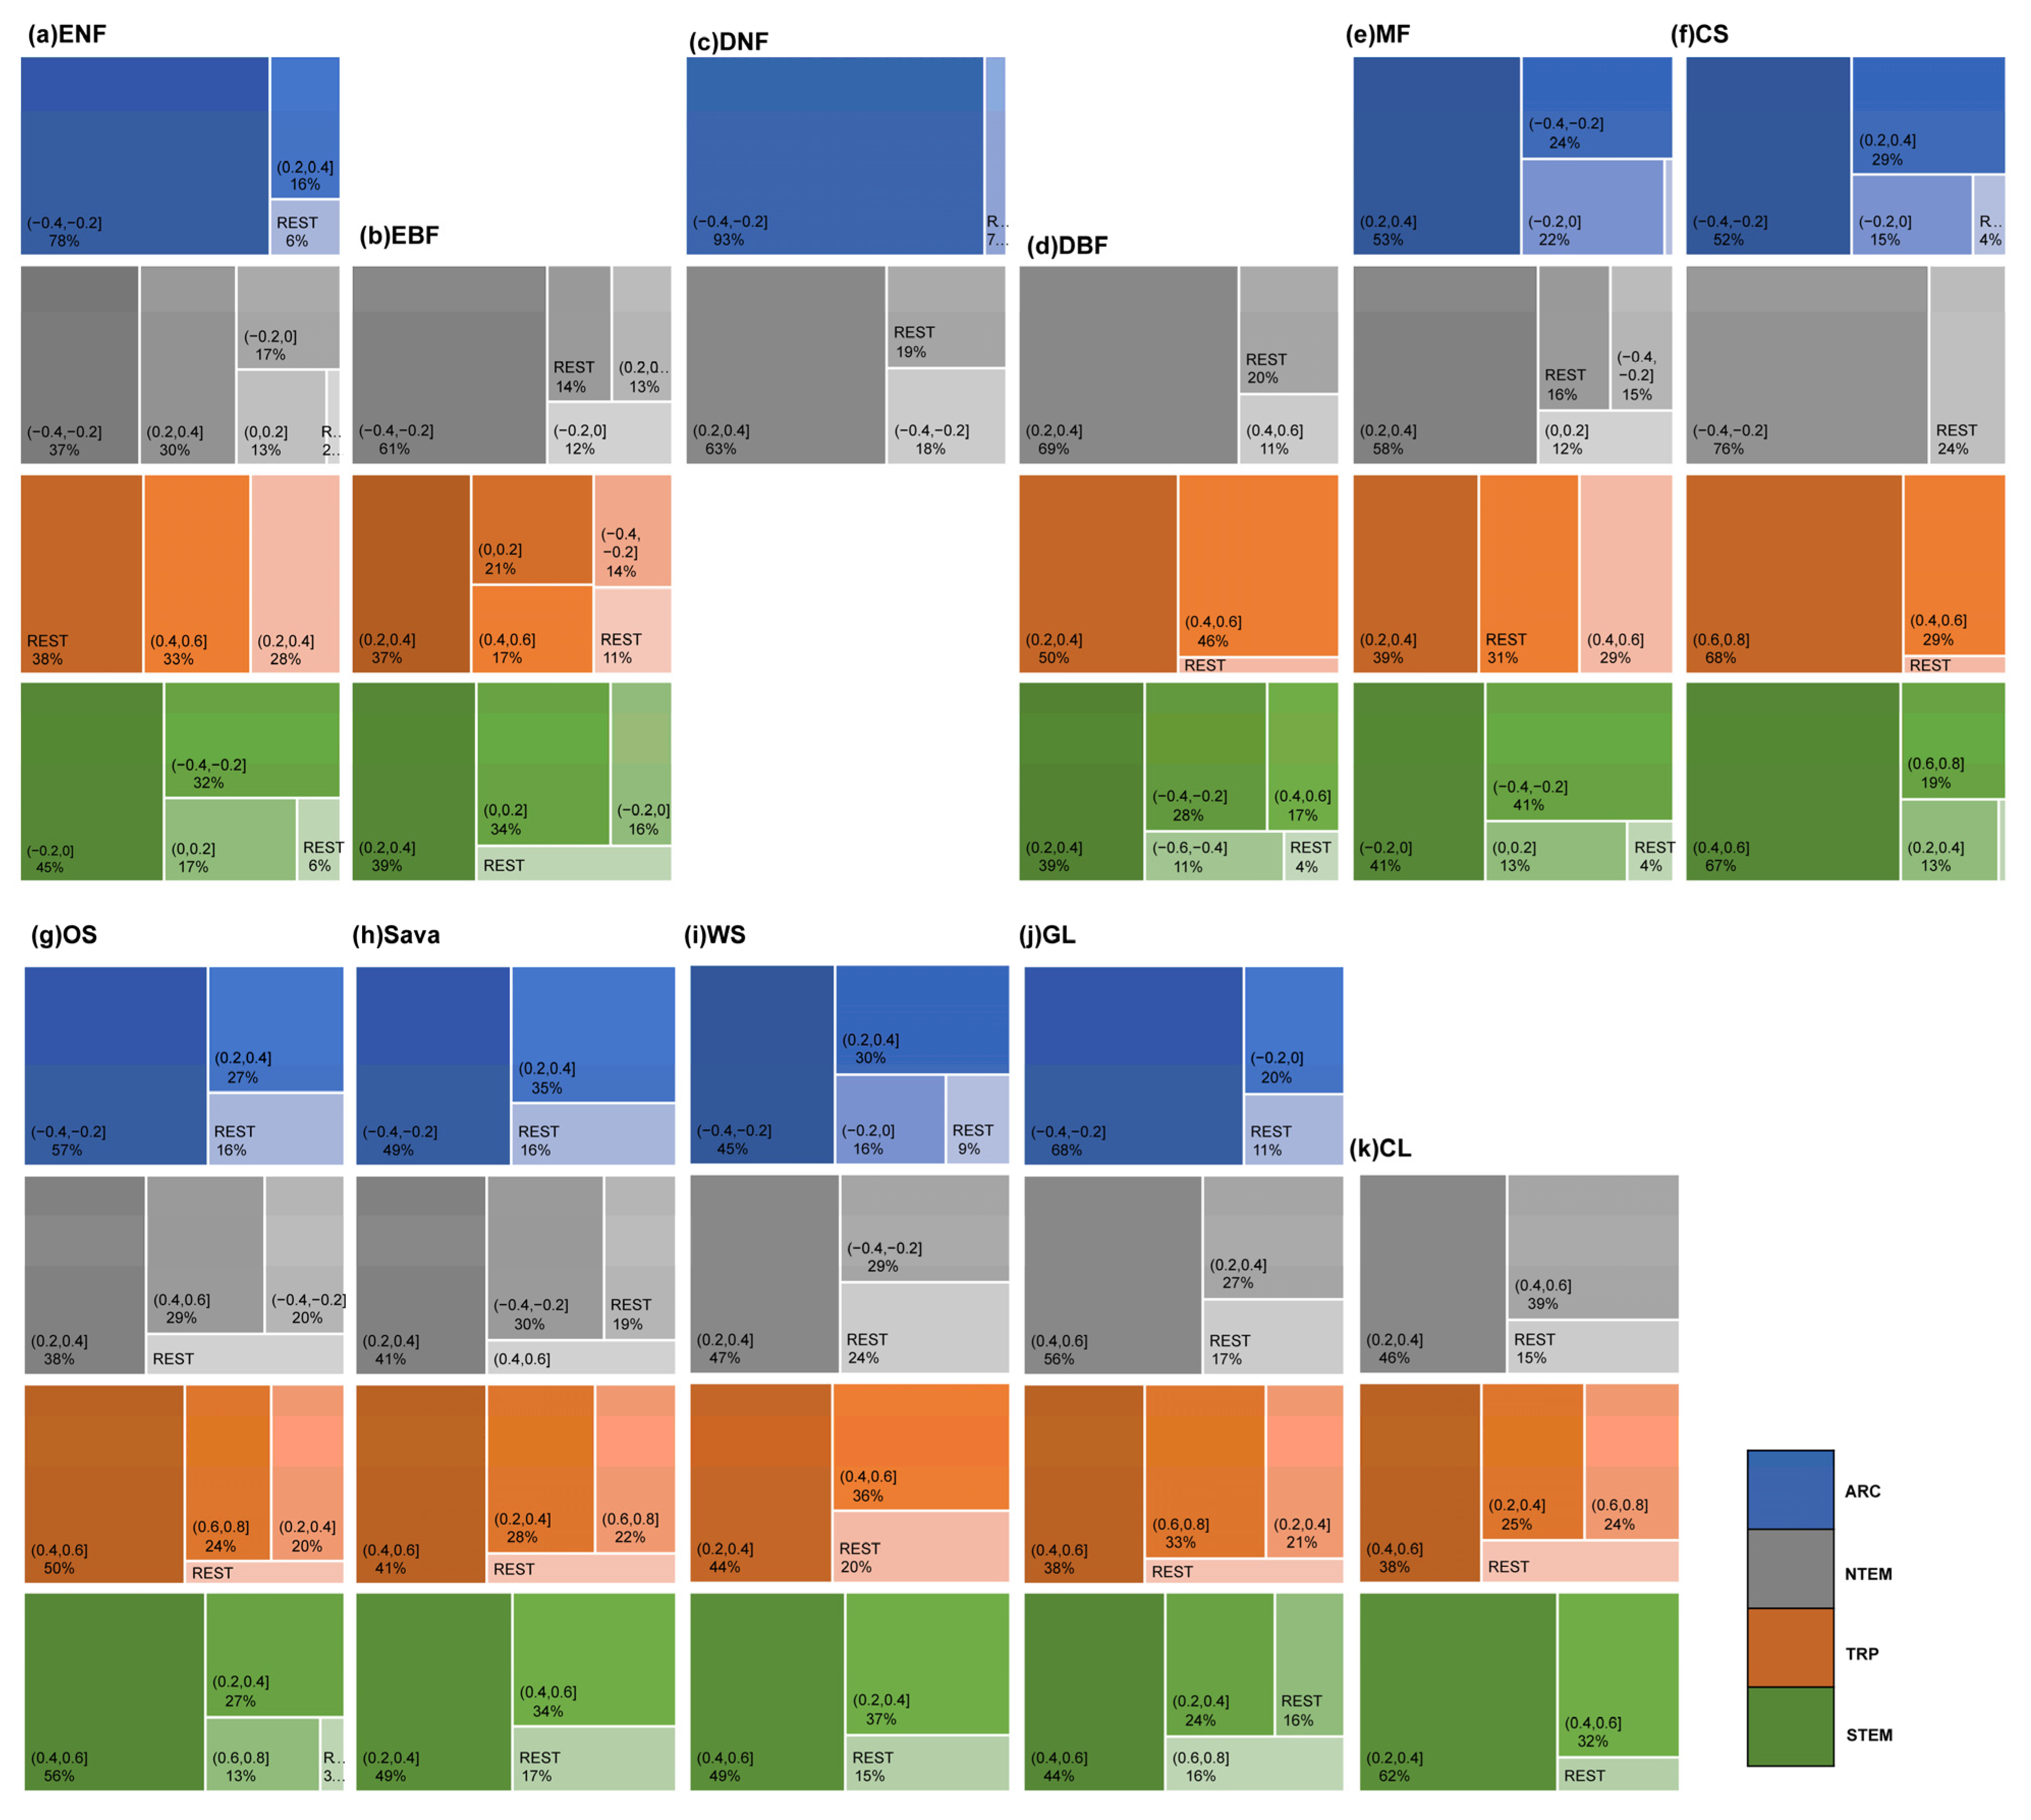
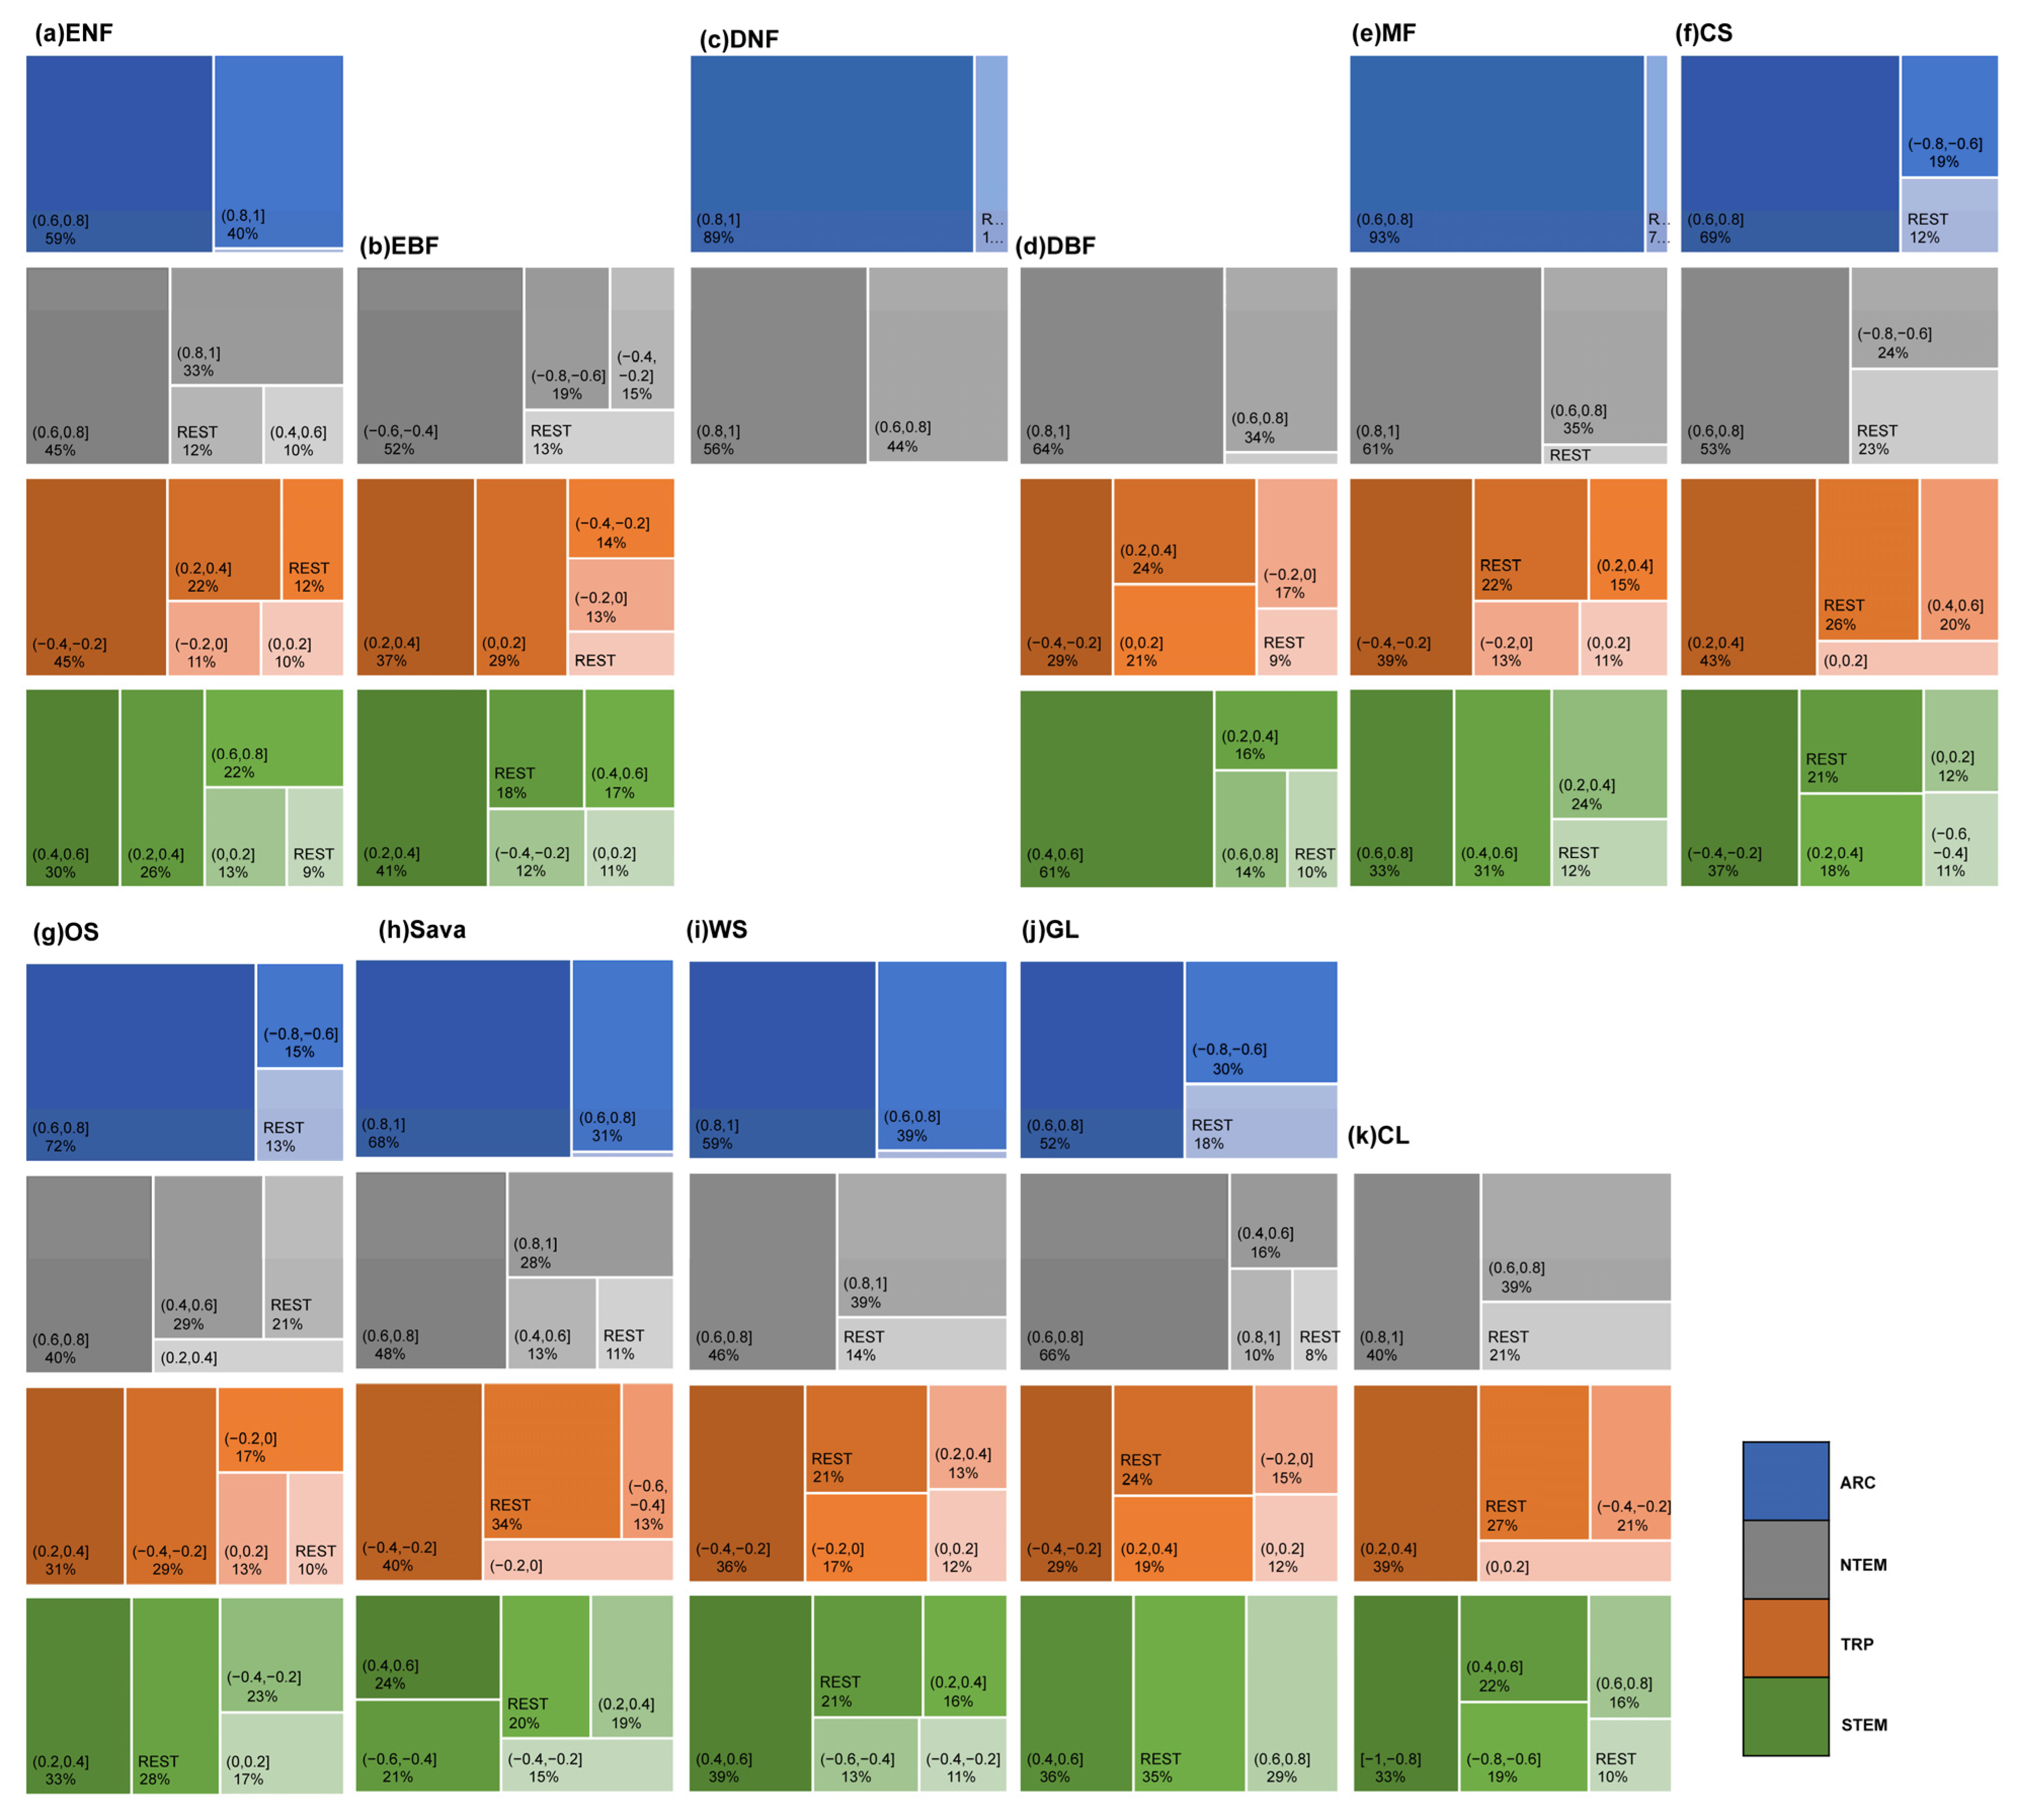
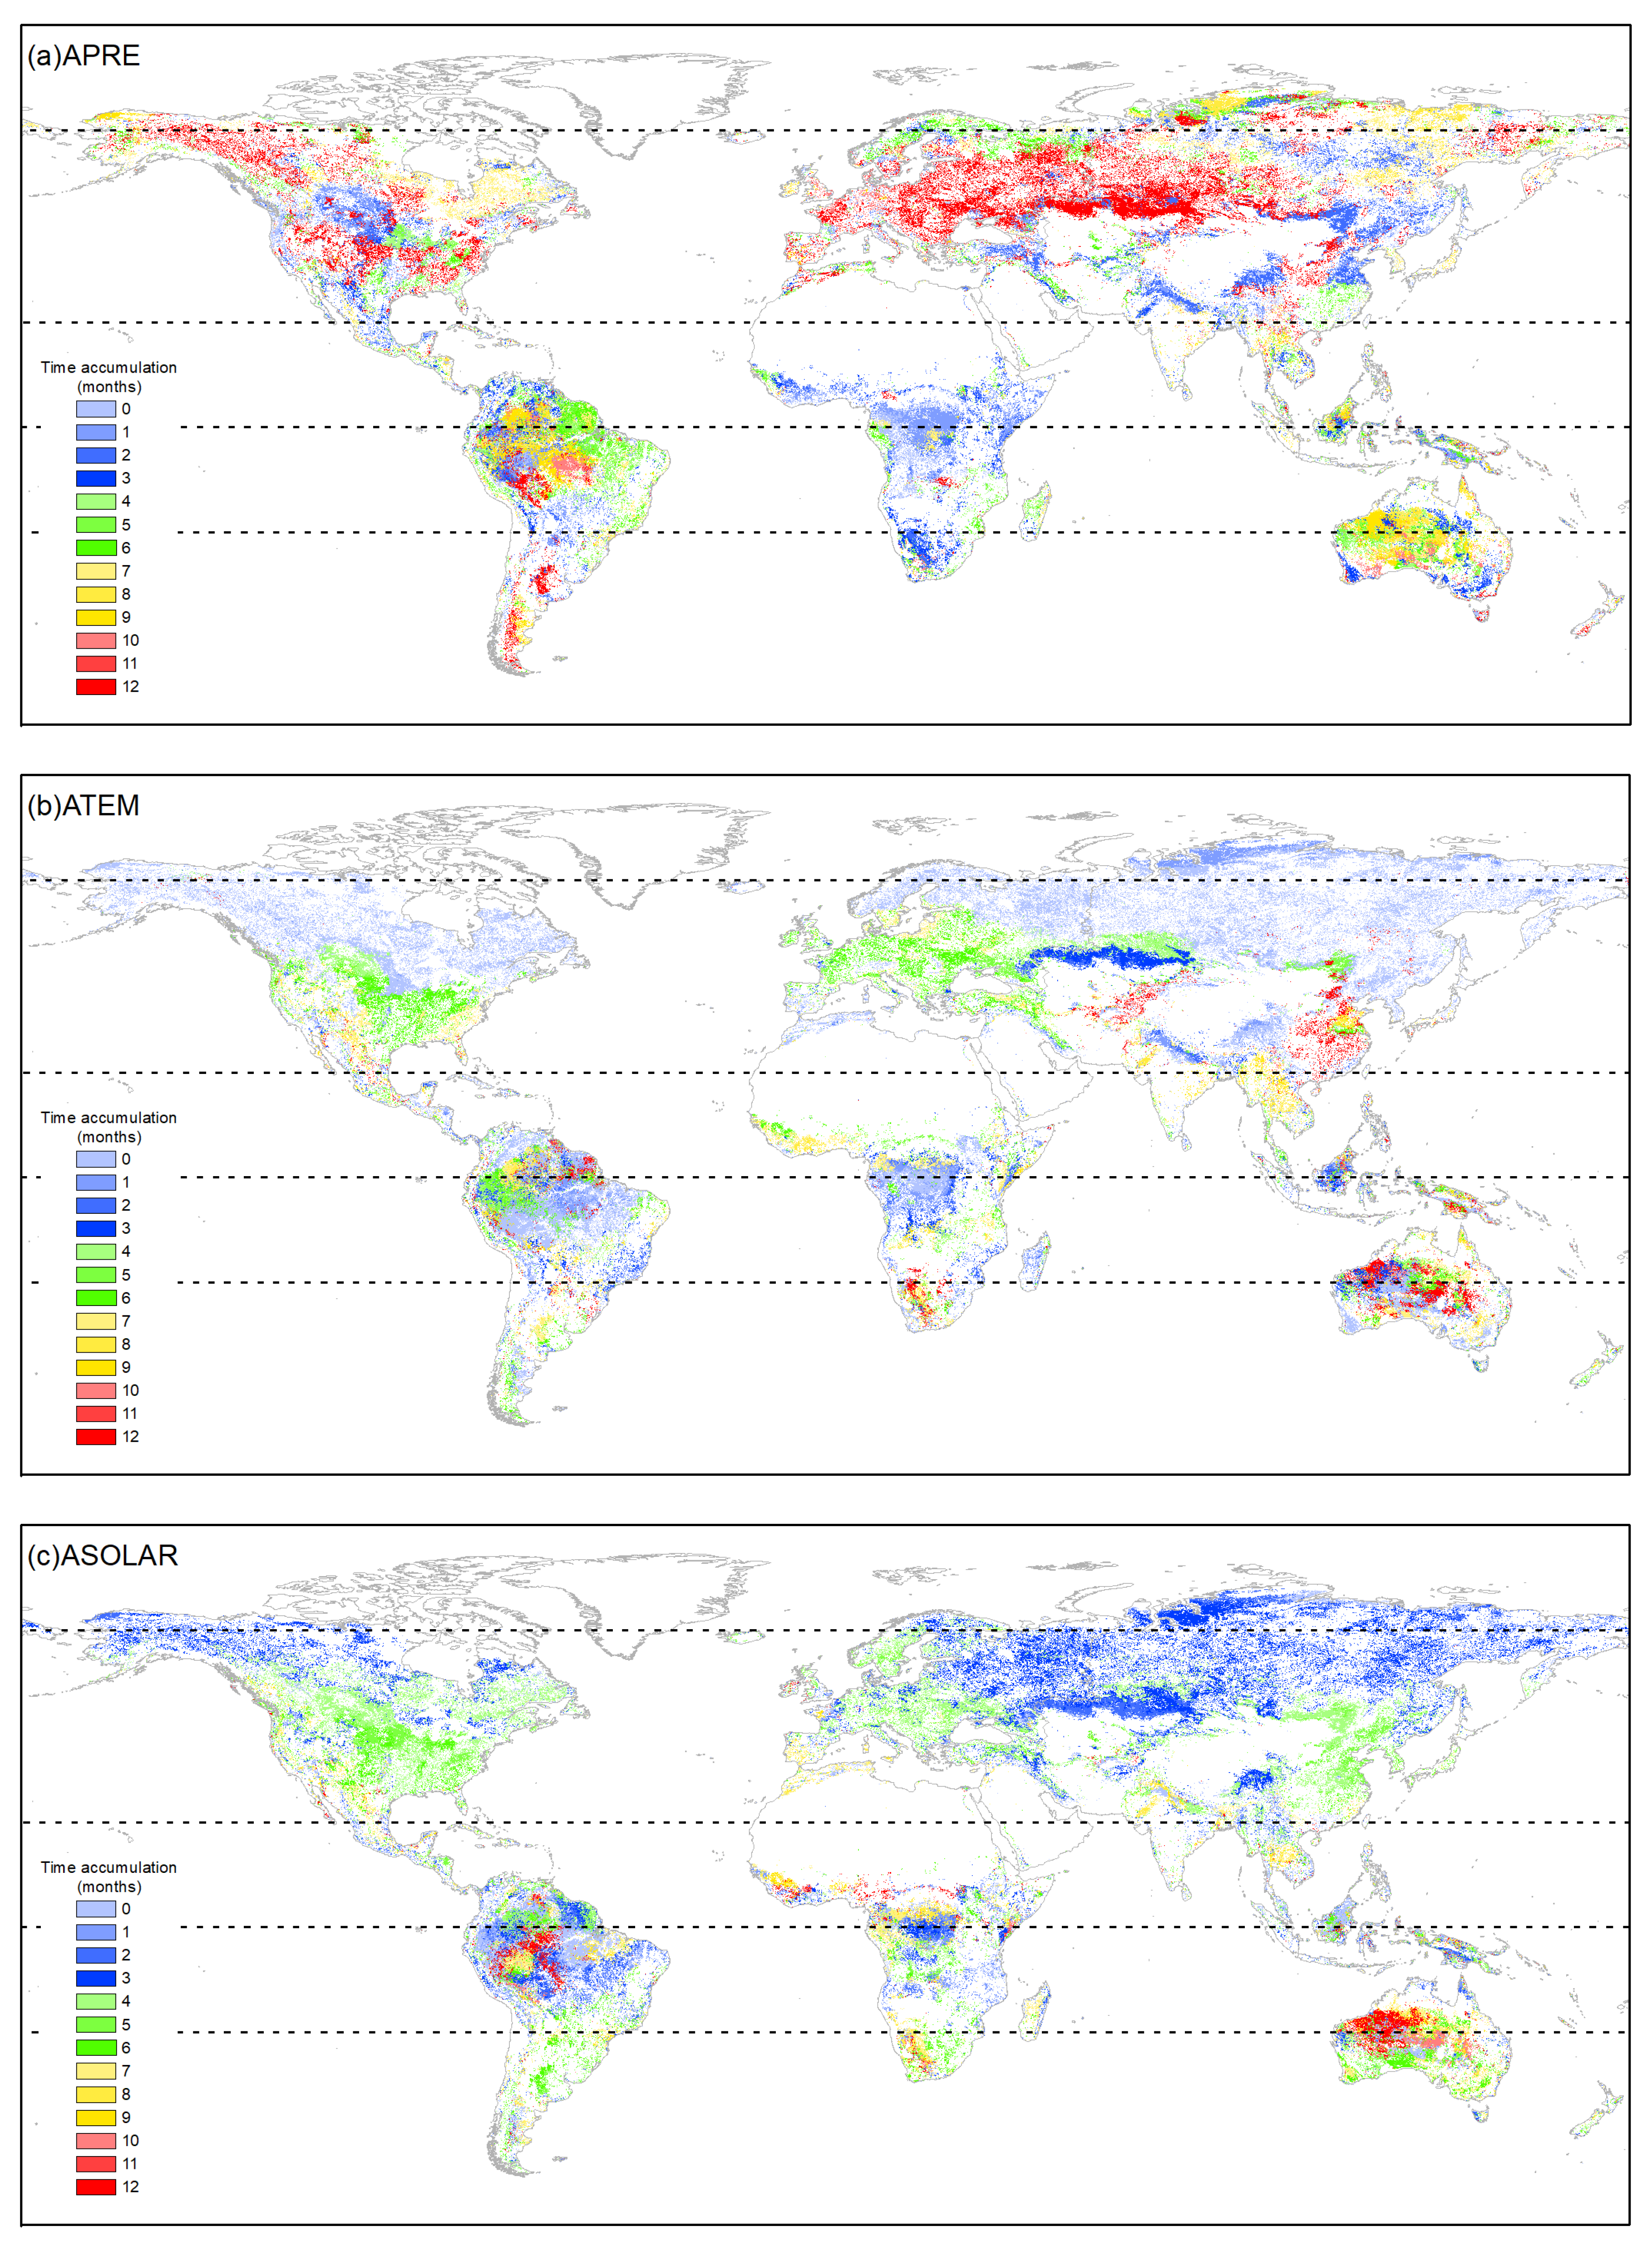
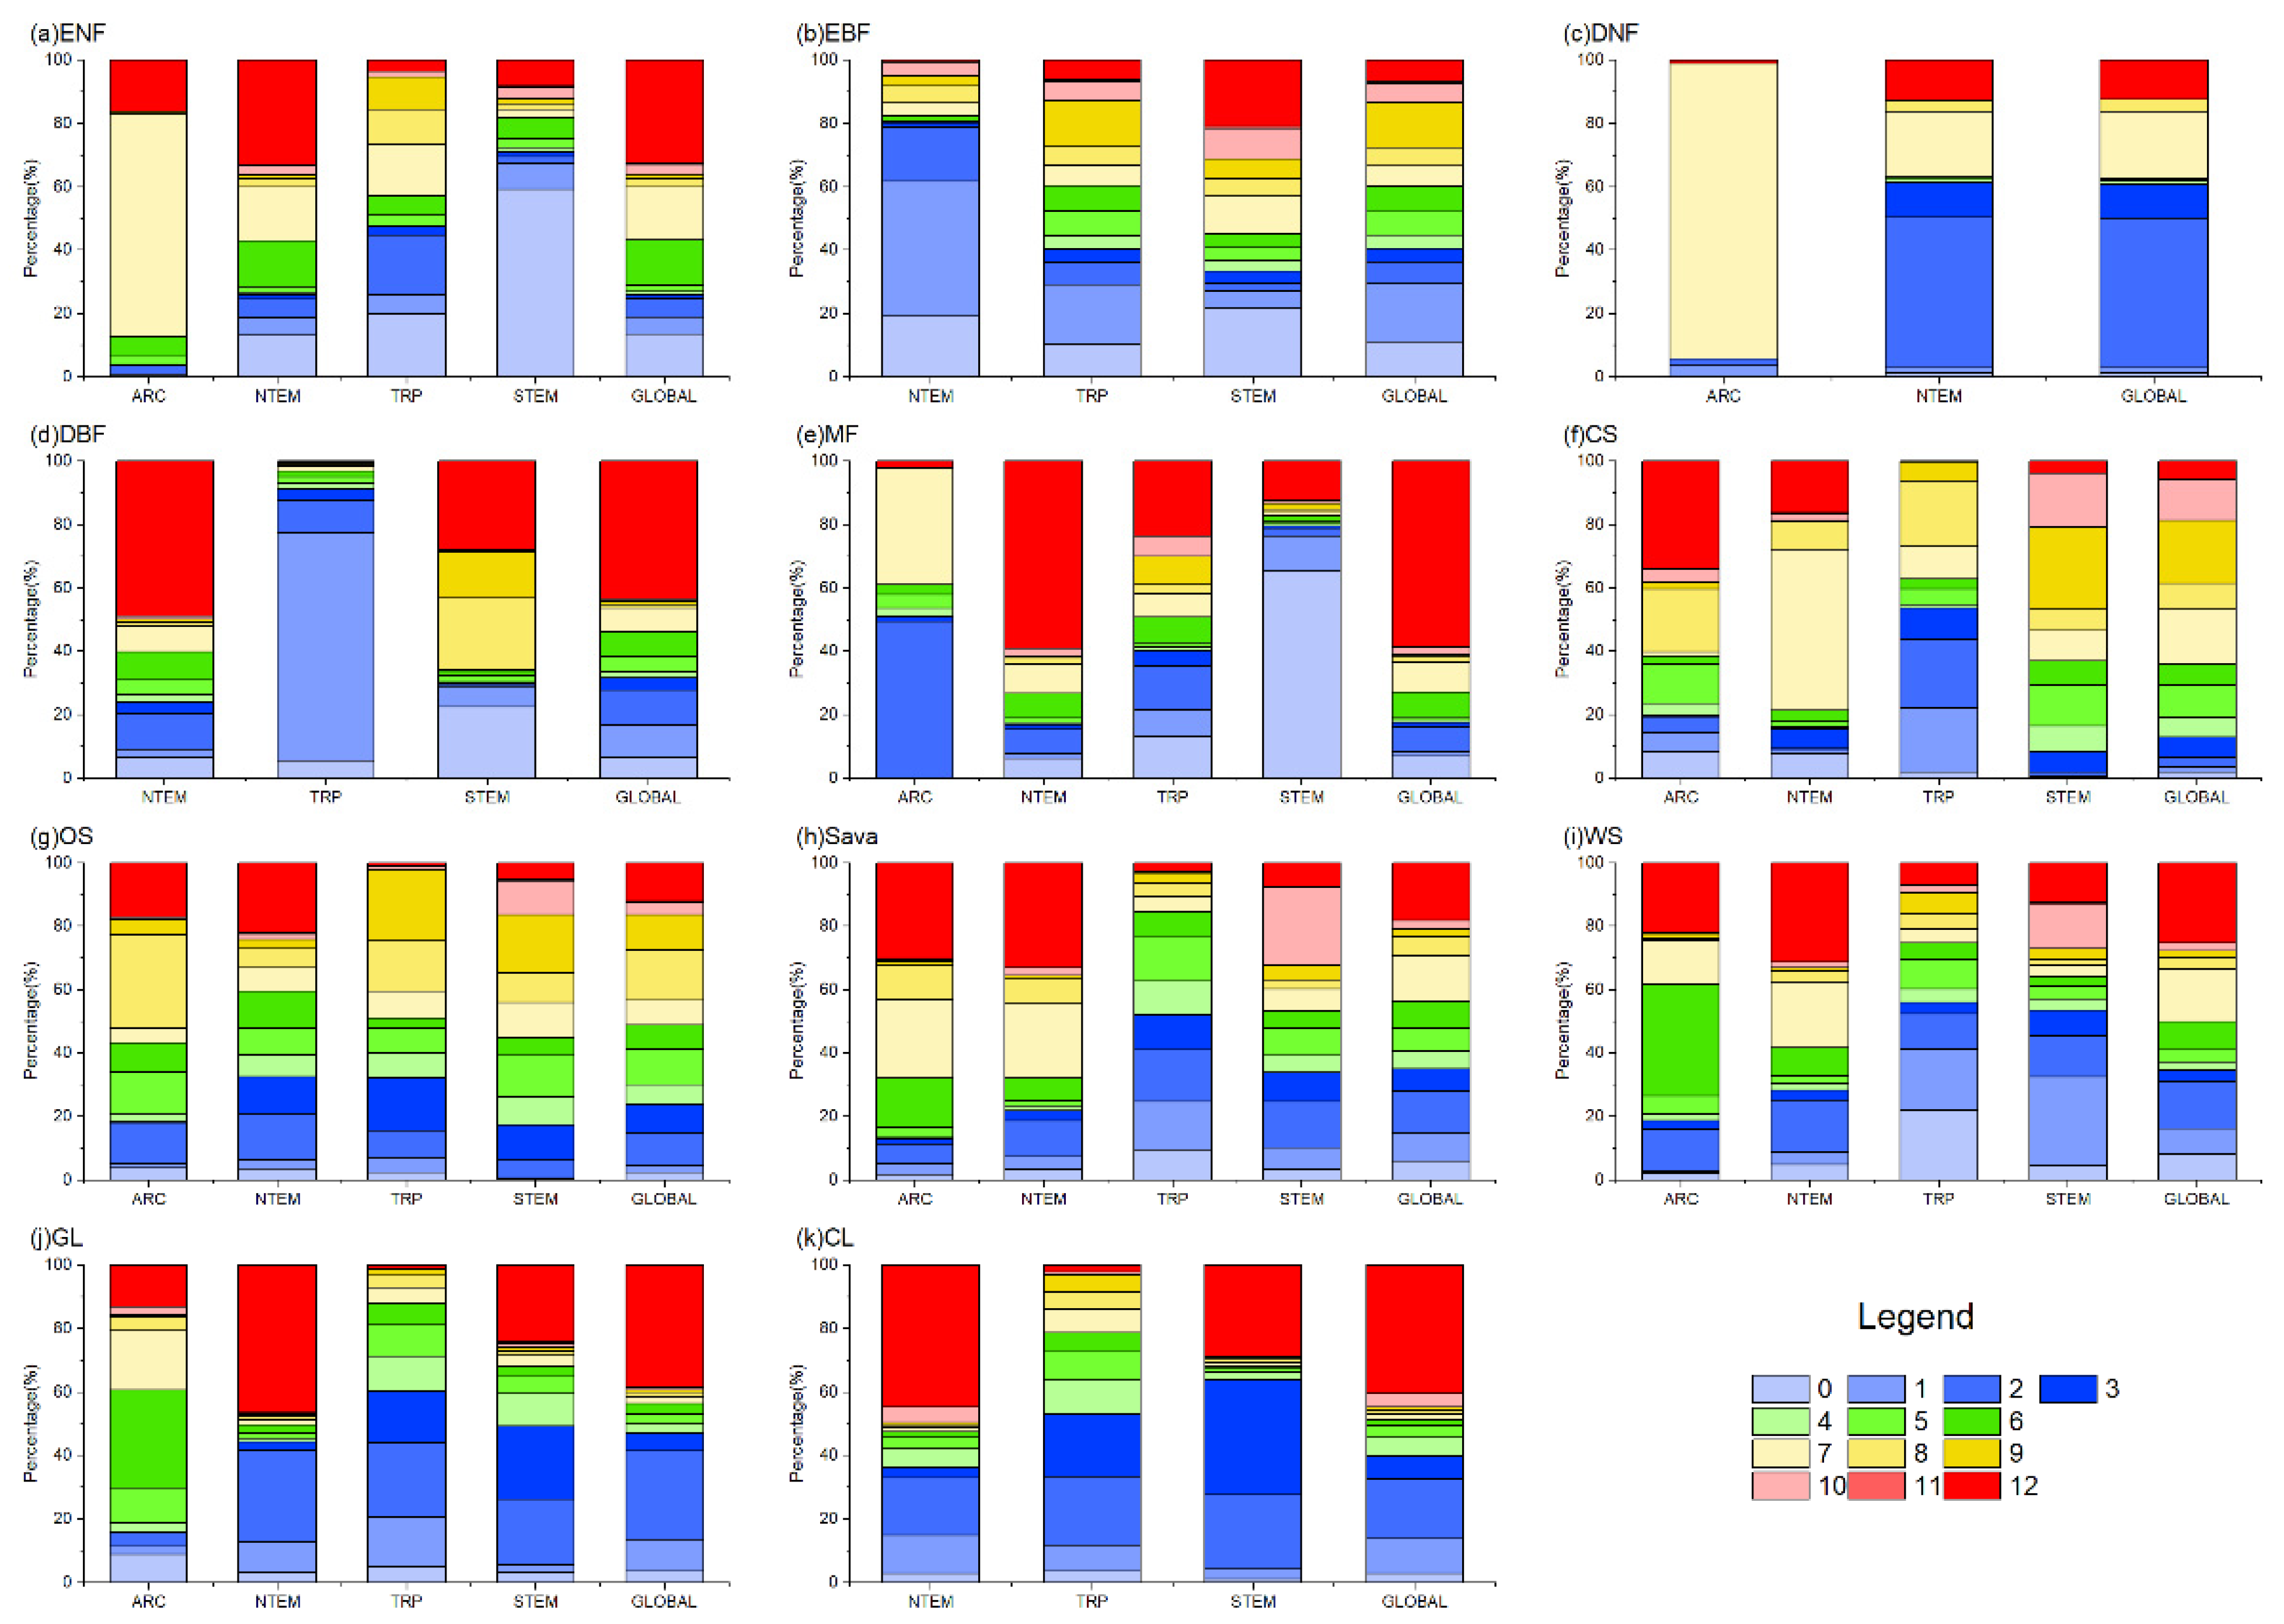
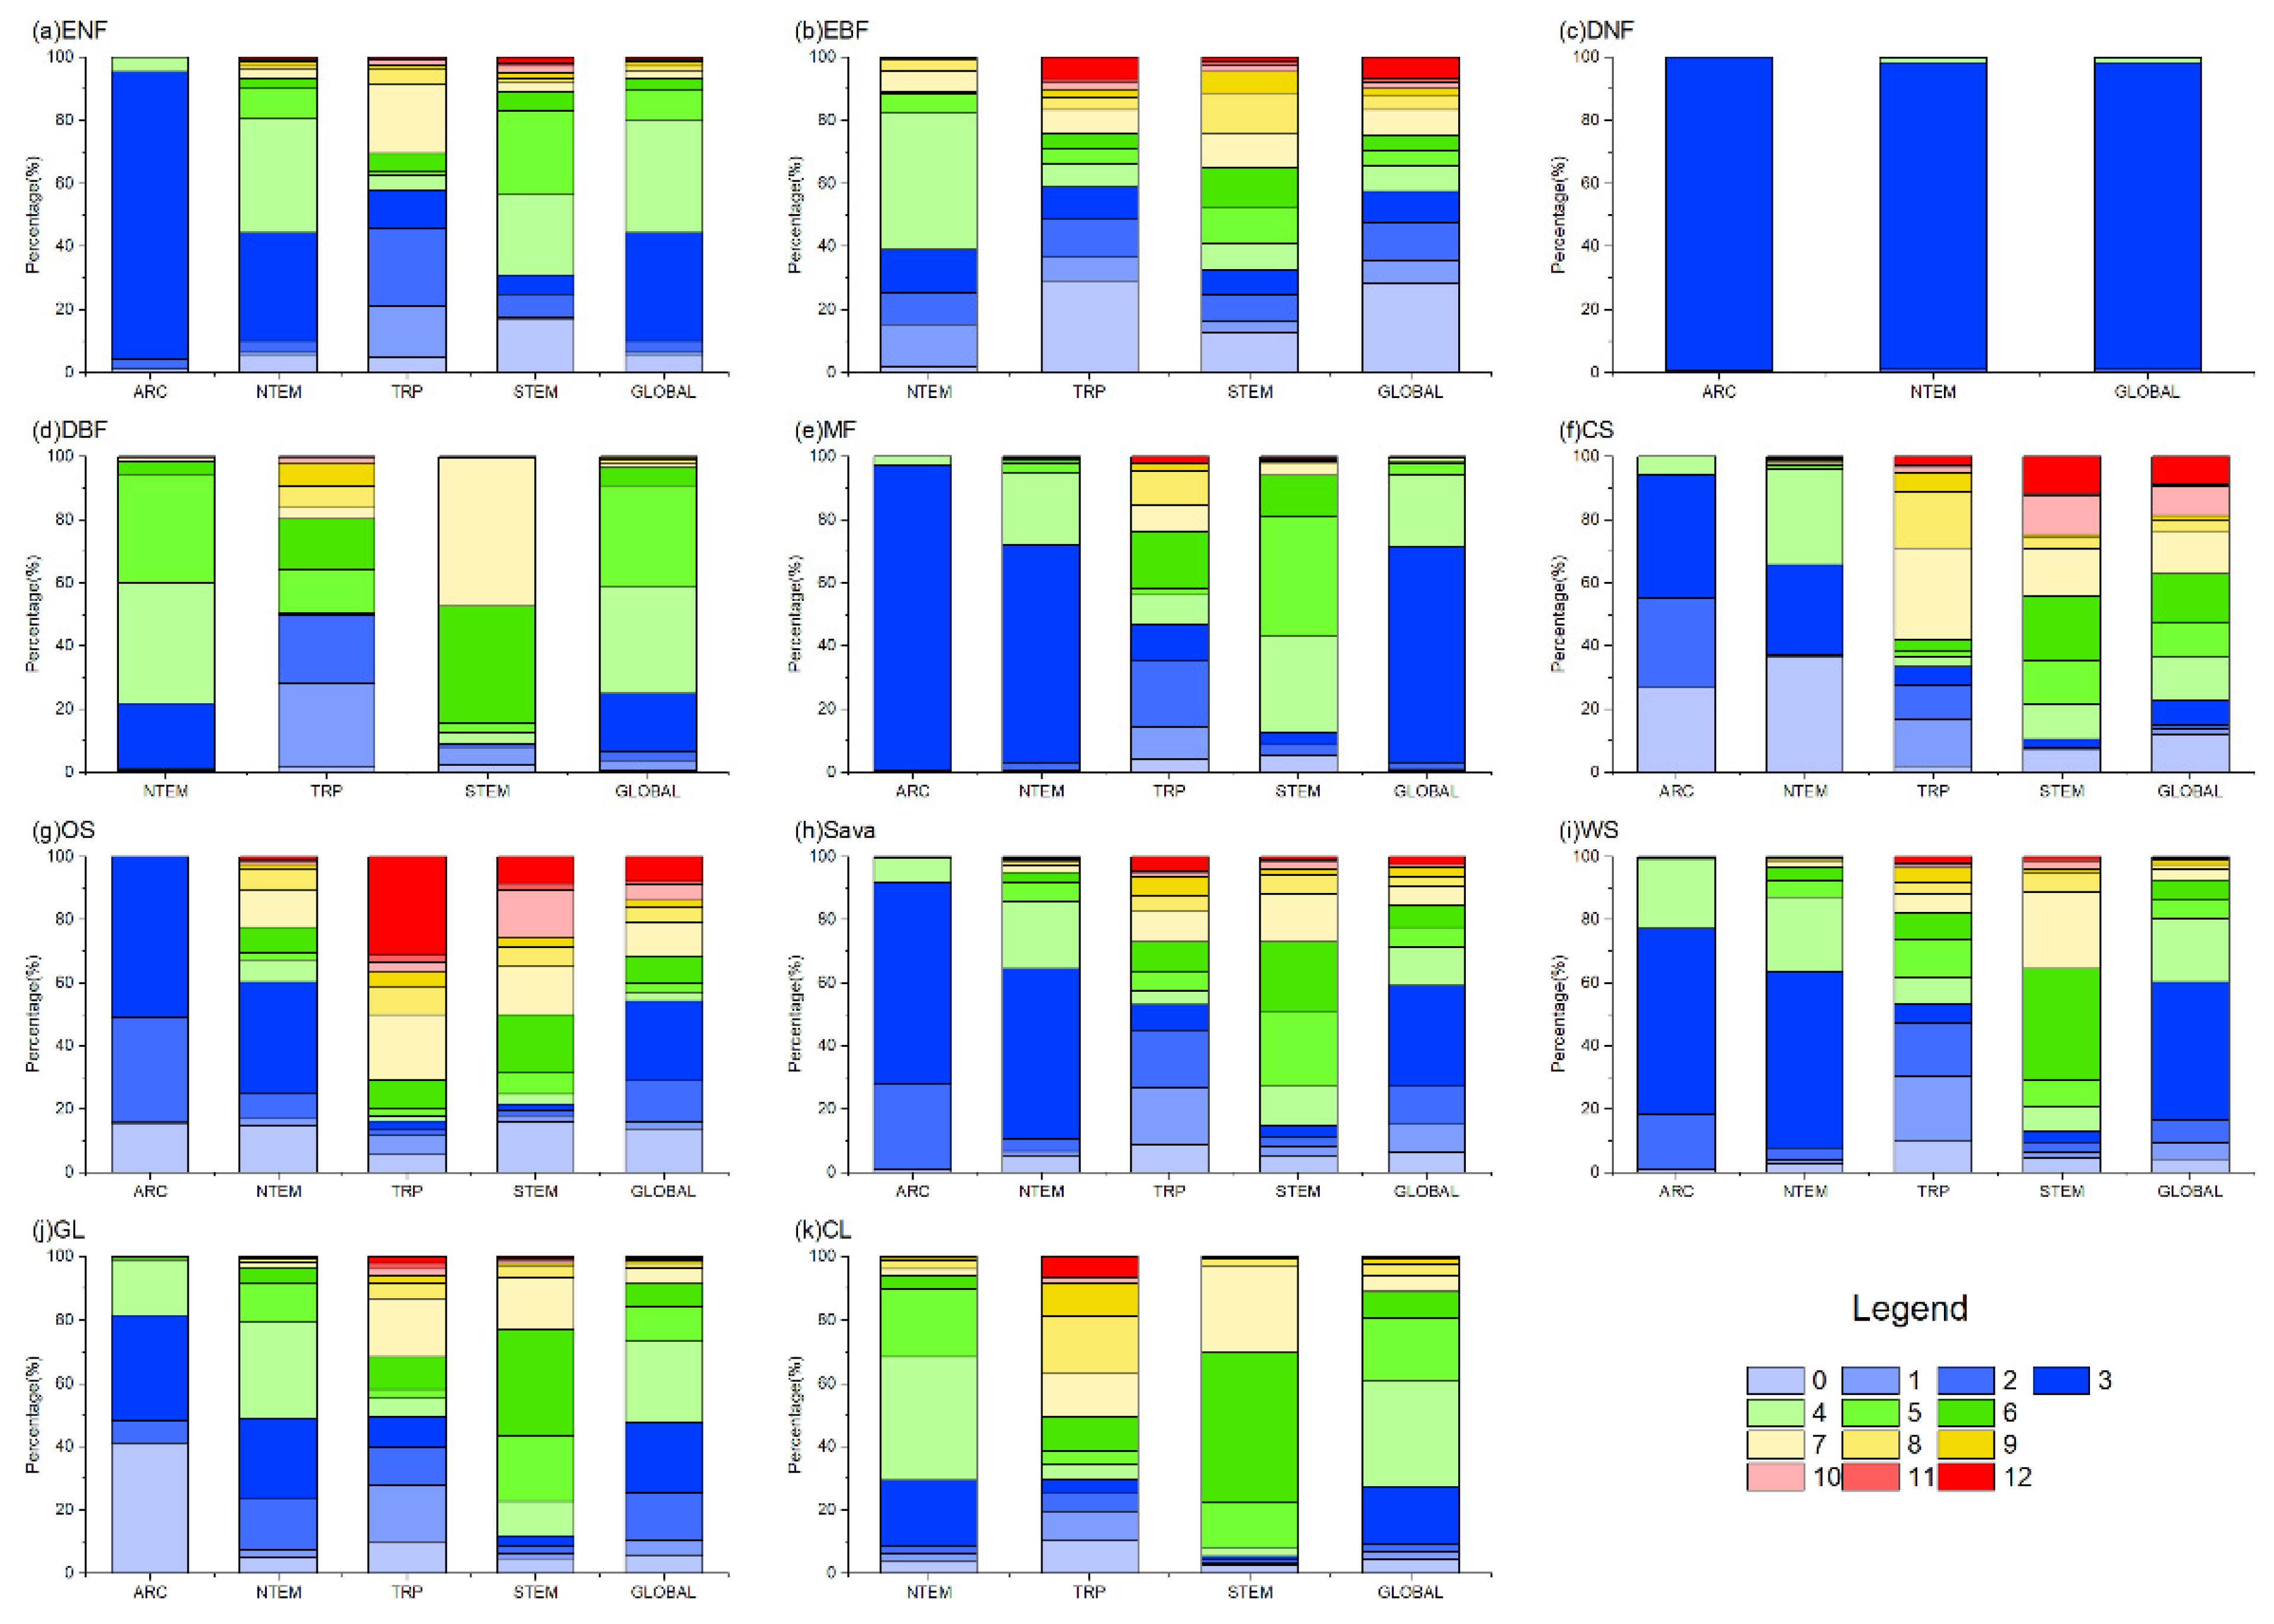
4.2. Accumulated Climatic Effect Durations
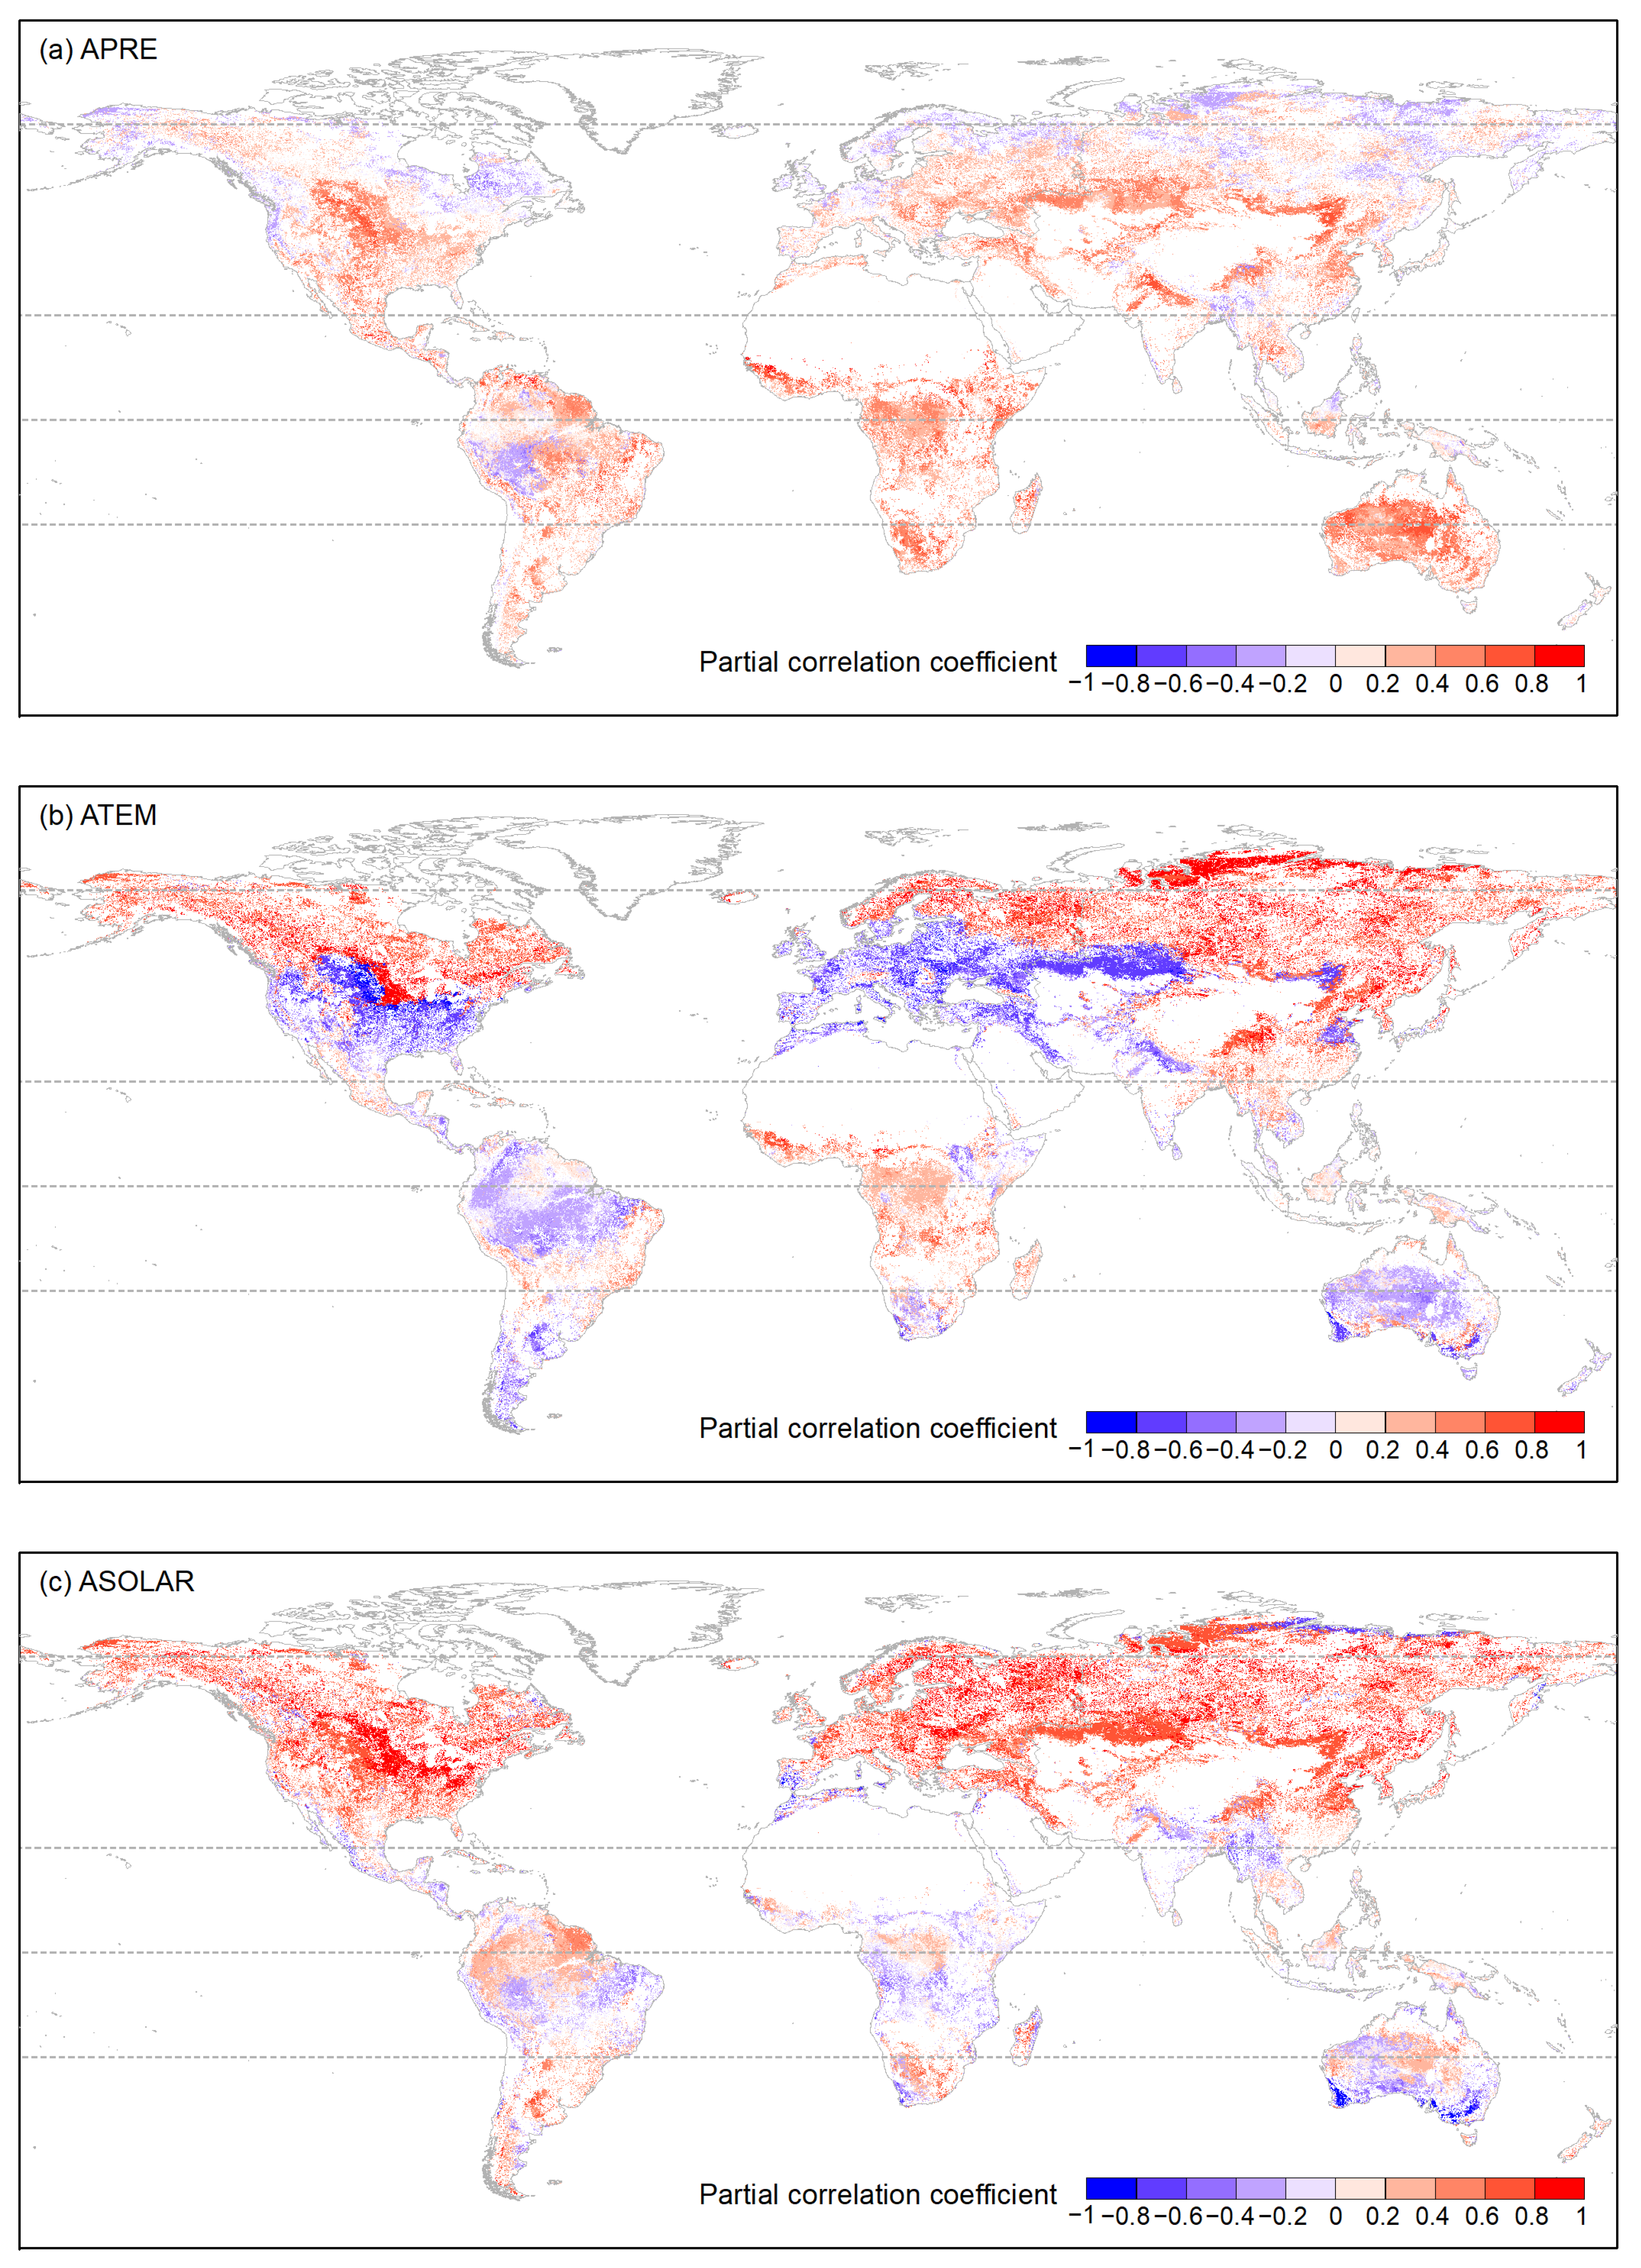
4.3. Correlations between Accumulated Climatic Factors and Vegetation Growth
5. Discussion
6. Conclusions
Author Contributions
Funding
Data Availability Statement
Acknowledgments
Conflicts of Interest
Appendix A


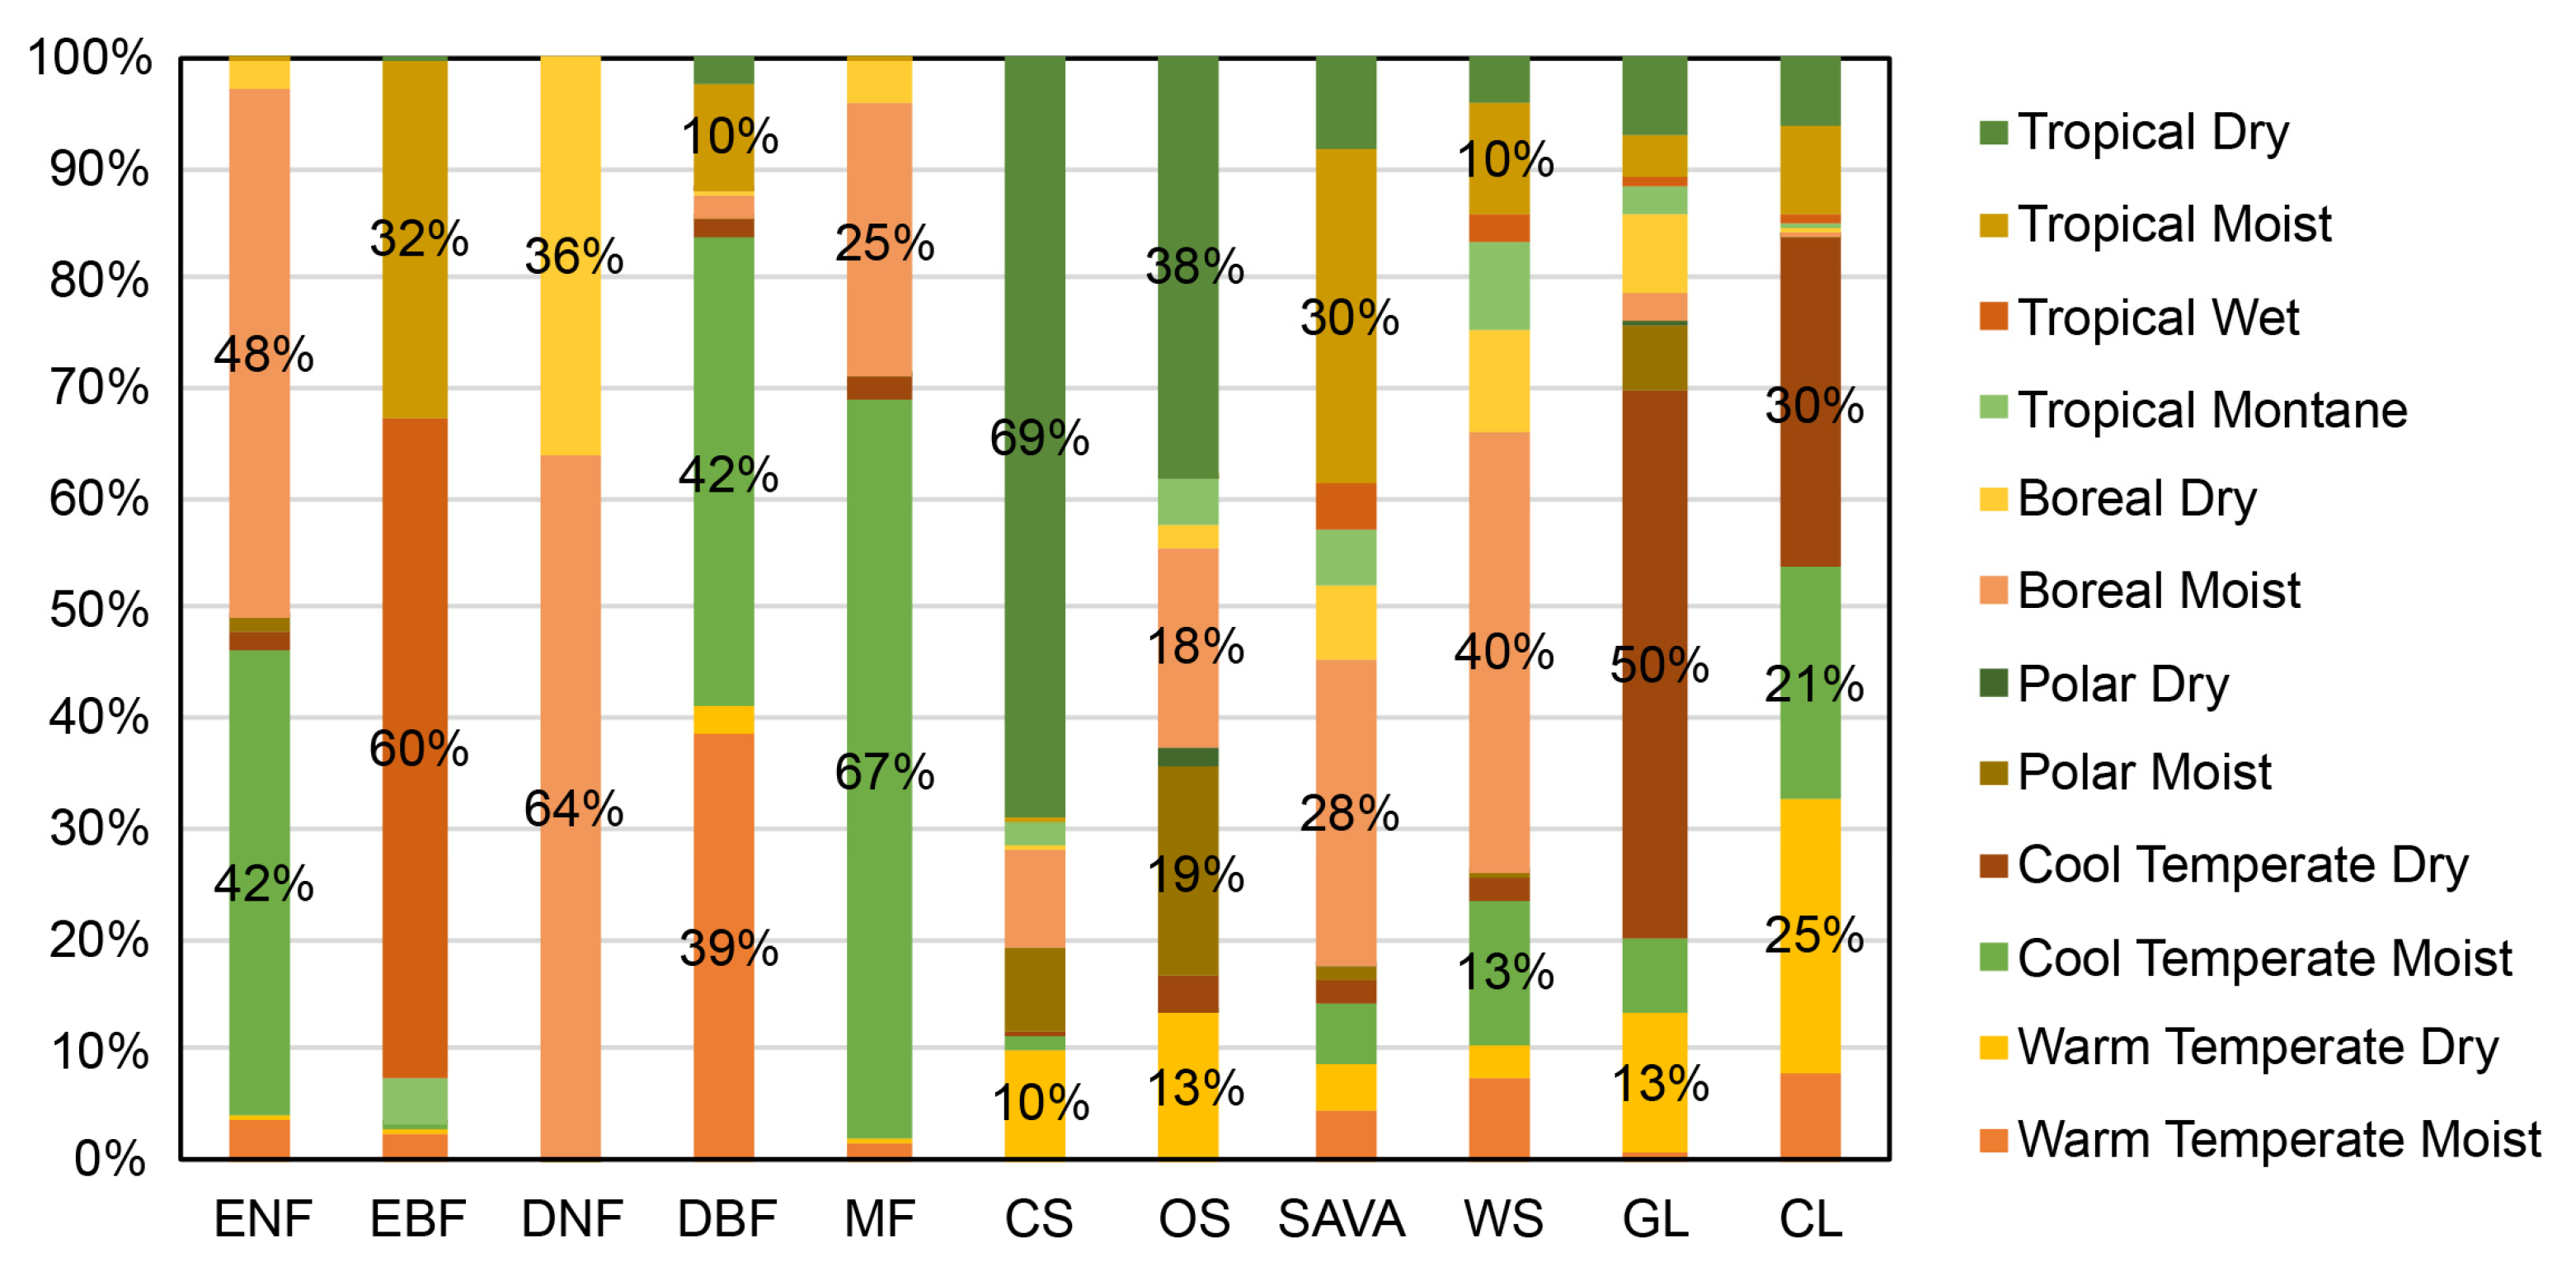
| Climate Regions | ENF | EBF | DNF | DBF | MF | CS | OS | SAVA | WS | GL |
|---|---|---|---|---|---|---|---|---|---|---|
| Warm Temperate Moist | 3.58% | 2.51% | 0.00% | 38.55% | 1.51% | 0.02% | 0.00% | 4.36% | 7.40% | 0.64% |
| Warm Temperate Dry | 0.42% | 0.43% | 0.00% | 2.58% | 0.27% | 10.08% | 13.33% | 4.22% | 2.86% | 12.62% |
| Cool Temperate Moist | 42.00% | 0.41% | 0.01% | 42.37% | 67.10% | 0.99% | 0.12% | 5.74% | 13.21% | 6.92% |
| Cool Temperate Dry | 1.89% | 0.00% | 0.00% | 1.72% | 2.13% | 0.61% | 3.12% | 2.00% | 1.86% | 49.60% |
| Polar Moist | 1.12% | 0.00% | 0.05% | 0.02% | 0.04% | 7.69% | 18.93% | 1.16% | 0.57% | 5.80% |
| Polar Dry | 0.00% | 0.00% | 0.00% | 0.00% | 0.00% | 0.00% | 1.90% | 0.14% | 0.01% | 0.57% |
| Boreal Moist | 48.18% | 0.00% | 63.71% | 2.36% | 24.73% | 8.87% | 17.91% | 27.86% | 40.07% | 2.58% |
| Boreal Dry | 2.61% | 0.00% | 36.23% | 0.13% | 4.08% | 0.04% | 2.19% | 6.63% | 9.46% | 7.11% |
| Tropical Montane | 0.03% | 4.07% | 0.00% | 0.21% | 0.01% | 2.32% | 4.32% | 4.99% | 7.83% | 2.56% |
| Tropical Wet | 0.00% | 59.91% | 0.00% | 0.17% | 0.00% | 0.00% | 0.00% | 4.14% | 2.66% | 0.70% |
| Tropical Moist | 0.16% | 32.46% | 0.00% | 9.58% | 0.12% | 0.20% | 0.01% | 30.42% | 10.13% | 3.71% |
| Tropical Dry | 0.00% | 0.21% | 0.00% | 2.31% | 0.00% | 69.19% | 38.17% | 8.34% | 3.95% | 7.19% |
| Biomes | APRE | ATEM | ASOLAR | ||||||
|---|---|---|---|---|---|---|---|---|---|
| Time Accumulation | Climate Zones | Percentage | Time Accumulation | Climate Zones | Percentage | Time Accumulation | Climate Zones | Percentage | |
| ENF | 12 | 7 | 18.58% | 0 | 7 | 46.48% | 3 | 7 | 24.55% |
| 7 | 7 | 11.51% | 0 | 3 | 27.52% | 4 | 7 | 17.83% | |
| 12 | 3 | 11.09% | 7 | 3 | 5.00% | 4 | 3 | 15.23% | |
| 0 | 3 | 8.86% | 6 | 3 | 4.31% | 5 | 3 | 8.17% | |
| 6 | 7 | 8.24% | 0 | 8 | 2.43% | 3 | 3 | 6.99% | |
| 6 | 3 | 5.52% | 1 | 3 | 1.19% | 0 | 3 | 2.97% | |
| 7 | 3 | 4.55% | 5 | 3 | 1.12% | 2 | 7 | 2.83% | |
| 1 | 3 | 3.32% | 0 | 4 | 1.06% | 6 | 3 | 2.18% | |
| 2 | 7 | 2.86% | 0 | 0 | 0.96% | 7 | 3 | 2.14% | |
| 2 | 3 | 2.26% | 0 | 5 | 0.89% | 3 | 8 | 1.72% | |
| EBF | 9 | 10 | 10.86% | 0 | 10 | 19.09% | 0 | 10 | 19.95% |
| 1 | 11 | 10.41% | 0 | 11 | 14.67% | 3 | 10 | 6.15% | |
| 1 | 10 | 7.01% | 1 | 10 | 8.01% | 2 | 11 | 5.71% | |
| 6 | 10 | 5.41% | 1 | 11 | 6.90% | 0 | 11 | 5.69% | |
| 0 | 10 | 5.07% | 5 | 10 | 5.58% | 2 | 10 | 5.57% | |
| 5 | 10 | 4.83% | 6 | 10 | 4.37% | 4 | 10 | 5.42% | |
| 10 | 10 | 4.71% | 7 | 10 | 4.06% | 12 | 10 | 5.01% | |
| 8 | 10 | 4.32% | 2 | 10 | 3.62% | 1 | 10 | 3.86% | |
| 0 | 11 | 4.10% | 12 | 10 | 3.33% | 7 | 11 | 3.80% | |
| 2 | 10 | 4.09% | 4 | 10 | 2.88% | 7 | 10 | 3.48% | |
| DNF | 2 | 7 | 35.10% | 0 | 7 | 62.40% | 3 | 7 | 61.57% |
| 2 | 8 | 12.12% | 0 | 8 | 36.17% | 3 | 8 | 35.50% | |
| 7 | 8 | 11.87% | 12 | 7 | 1.23% | 4 | 7 | 1.13% | |
| 12 | 7 | 10.54% | 0 | 5 | 0.05% | 2 | 7 | 0.69% | |
| 7 | 7 | 9.36% | 12 | 8 | 0.05% | 4 | 8 | 0.49% | |
| 3 | 8 | 6.84% | 5 | 7 | 0.03% | 0 | 7 | 0.22% | |
| 3 | 7 | 3.97% | 4 | 7 | 0.03% | 2 | 8 | 0.21% | |
| 8 | 7 | 2.08% | 0 | 0 | 0.02% | 9 | 7 | 0.10% | |
| 12 | 8 | 1.92% | 1 | 7 | 0.02% | 3 | 5 | 0.05% | |
| 8 | 8 | 1.54% | 0 | 3 | 0.01% | 3 | 0 | 0.01% | |
| DBF | 12 | 1 | 22.93% | 0 | 3 | 29.25% | 5 | 1 | 21.41% |
| 12 | 3 | 15.98% | 6 | 1 | 26.05% | 4 | 3 | 17.19% | |
| 2 | 3 | 7.49% | 7 | 1 | 8.93% | 3 | 3 | 15.17% | |
| 1 | 11 | 6.52% | 6 | 3 | 5.53% | 4 | 1 | 13.67% | |
| 6 | 1 | 6.37% | 7 | 3 | 5.36% | 5 | 3 | 7.20% | |
| 0 | 3 | 5.01% | 8 | 11 | 2.62% | 1 | 11 | 2.64% | |
| 7 | 3 | 4.68% | 0 | 7 | 2.18% | 6 | 1 | 2.39% | |
| 5 | 1 | 3.32% | 3 | 11 | 2.17% | 2 | 11 | 2.13% | |
| 3 | 3 | 3.18% | 0 | 1 | 1.66% | 3 | 7 | 1.29% | |
| 12 | 2 | 1.72% | 0 | 0 | 1.31% | 5 | 2 | 1.24% | |
| MF | 12 | 3 | 41.80% | 0 | 3 | 55.77% | 3 | 3 | 44.82% |
| 12 | 7 | 11.61% | 0 | 7 | 24.14% | 3 | 7 | 18.89% | |
| 7 | 3 | 6.04% | 6 | 3 | 6.56% | 4 | 3 | 16.63% | |
| 6 | 3 | 5.40% | 0 | 8 | 4.00% | 4 | 7 | 4.09% | |
| 0 | 3 | 5.09% | 7 | 3 | 2.99% | 3 | 8 | 2.85% | |
| 2 | 7 | 4.37% | 0 | 4 | 1.83% | 5 | 3 | 2.61% | |
| 7 | 7 | 2.81% | 0 | 0 | 0.50% | 3 | 4 | 1.51% | |
| 2 | 3 | 2.79% | 6 | 1 | 0.46% | 2 | 7 | 1.25% | |
| 12 | 8 | 2.46% | 5 | 3 | 0.43% | 4 | 8 | 0.84% | |
| 10 | 3 | 1.77% | 7 | 1 | 0.33% | 6 | 3 | 0.62% | |
| CS | 9 | 12 | 19.17% | 0 | 12 | 25.29% | 6 | 12 | 13.12% |
| 10 | 12 | 9.83% | 12 | 12 | 16.26% | 5 | 12 | 9.33% | |
| 5 | 12 | 9.19% | 0 | 7 | 7.22% | 10 | 12 | 9.01% | |
| 7 | 12 | 7.39% | 0 | 5 | 6.53% | 7 | 12 | 8.75% | |
| 8 | 12 | 5.88% | 4 | 12 | 5.36% | 12 | 12 | 8.57% | |
| 7 | 7 | 5.78% | 8 | 12 | 4.64% | 4 | 12 | 7.81% | |
| 6 | 12 | 5.37% | 7 | 12 | 4.27% | 0 | 7 | 4.43% | |
| 4 | 12 | 5.04% | 3 | 12 | 3.68% | 0 | 12 | 3.78% | |
| 7 | 5 | 2.84% | 0 | 2 | 2.62% | 4 | 5 | 3.29% | |
| 3 | 12 | 2.55% | 7 | 2 | 2.31% | 7 | 2 | 3.07% | |
| OS | 9 | 12 | 8.11% | 0 | 7 | 14.68% | 3 | 7 | 12.24% |
| 8 | 5 | 5.13% | 0 | 5 | 10.35% | 3 | 5 | 9.07% | |
| 12 | 7 | 4.84% | 0 | 12 | 8.55% | 12 | 12 | 7.53% | |
| 8 | 12 | 4.82% | 1 | 5 | 8.27% | 2 | 5 | 7.04% | |
| 5 | 12 | 4.80% | 12 | 12 | 7.86% | 7 | 12 | 6.02% | |
| 3 | 12 | 4.37% | 0 | 2 | 5.00% | 6 | 12 | 5.06% | |
| 7 | 12 | 4.23% | 7 | 12 | 3.49% | 0 | 12 | 4.66% | |
| 8 | 7 | 3.59% | 3 | 12 | 3.47% | 10 | 12 | 4.51% | |
| 4 | 12 | 3.57% | 1 | 7 | 3.06% | 2 | 7 | 3.01% | |
| 10 | 12 | 2.72% | 7 | 2 | 2.31% | 8 | 12 | 2.78% | |
| Sava | 7 | 7 | 10.09% | 0 | 7 | 27.11% | 3 | 7 | 19.42% |
| 12 | 7 | 6.67% | 0 | 3 | 2.88% | 2 | 11 | 5.72% | |
| 1 | 11 | 5.56% | 0 | 8 | 6.38% | 4 | 7 | 5.23% | |
| 2 | 11 | 4.80% | 6 | 1 | 1.47% | 3 | 8 | 4.87% | |
| 5 | 11 | 4.17% | 3 | 9 | 0.75% | 1 | 11 | 4.46% | |
| 12 | 8 | 3.36% | 0 | 11 | 7.79% | 6 | 11 | 3.31% | |
| 2 | 7 | 3.28% | 7 | 1 | 0.41% | 7 | 11 | 2.92% | |
| 4 | 11 | 2.97% | 2 | 11 | 2.75% | 3 | 11 | 2.57% | |
| 6 | 11 | 2.69% | 12 | 1 | 0.75% | 0 | 11 | 2.32% | |
| 0 | 11 | 2.67% | 4 | 9 | 0.58% | 9 | 11 | 2.20% | |
| WS | 7 | 7 | 11.53% | 0 | 7 | 38.95% | 3 | 7 | 28.37% |
| 12 | 7 | 9.28% | 0 | 3 | 9.85% | 4 | 7 | 8.88% | |
| 2 | 7 | 8.01% | 0 | 8 | 9.07% | 3 | 8 | 7.36% | |
| 12 | 3 | 4.99% | 6 | 1 | 2.12% | 3 | 3 | 5.31% | |
| 6 | 7 | 4.81% | 3 | 9 | 1.93% | 4 | 3 | 4.92% | |
| 12 | 8 | 4.14% | 0 | 11 | 1.70% | 1 | 9 | 2.25% | |
| 0 | 9 | 3.10% | 7 | 1 | 1.63% | 6 | 1 | 1.88% | |
| 12 | 1 | 2.53% | 2 | 11 | 1.46% | 5 | 1 | 1.80% | |
| 1 | 11 | 2.21% | 12 | 1 | 1.40% | 4 | 1 | 1.62% | |
| 2 | 8 | 1.85% | 4 | 9 | 1.39% | 2 | 7 | 1.55% | |
| GL | 12 | 4 | 27.98% | 3 | 4 | 10.99% | 4 | 4 | 13.73% |
| 2 | 4 | 12.70% | 4 | 4 | 10.97% | 3 | 4 | 11.99% | |
| 1 | 4 | 5.54% | 0 | 4 | 7.34% | 2 | 4 | 11.38% | |
| 12 | 8 | 3.40% | 6 | 4 | 5.73% | 5 | 4 | 6.47% | |
| 2 | 8 | 3.30% | 5 | 4 | 5.23% | 4 | 8 | 4.37% | |
| 2 | 5 | 3.17% | 0 | 8 | 4.91% | 3 | 5 | 2.93% | |
| 12 | 2 | 3.14% | 0 | 5 | 3.70% | 6 | 2 | 2.85% | |
| 2 | 2 | 2.76% | 6 | 2 | 3.53% | 5 | 2 | 2.31% | |
| 2 | 12 | 2.40% | 2 | 4 | 2.82% | 6 | 4 | 2.07% | |
| 1 | 12 | 1.87% | 0 | 3 | 2.51% | 4 | 3 | 2.06% | |
| CL | 12 | 4 | 16.54% | 0 | 4 | 12.77% | 4 | 4 | 15.87% |
| 12 | 3 | 11.54% | 6 | 3 | 8.76% | 3 | 3 | 7.85% | |
| 12 | 2 | 8.19% | 0 | 3 | 7.58% | 3 | 4 | 7.23% | |
| 2 | 2 | 5.99% | 6 | 4 | 5.47% | 4 | 3 | 6.51% | |
| 1 | 4 | 5.09% | 0 | 2 | 5.46% | 4 | 2 | 6.42% | |
| 2 | 4 | 4.87% | 4 | 4 | 5.10% | 5 | 2 | 5.67% | |
| 3 | 2 | 3.38% | 5 | 4 | 4.59% | 5 | 4 | 4.95% | |
| 12 | 1 | 3.07% | 6 | 2 | 4.54% | 5 | 3 | 4.82% | |
| 2 | 12 | 2.69% | 6 | 1 | 4.44% | 6 | 2 | 4.09% | |
| 1 | 2 | 2.67% | 5 | 2 | 3.57% | 5 | 1 | 2.93% | |
References
- Buitenwerf, R.; Rose, L.; Higgins, S.I. Three decades of multi-dimensional change in global leaf phenology. Nat. Clim. Chang. 2015, 5, 364–368. [Google Scholar] [CrossRef]
- Peñuelas, J.; Filella, I. Responses to a Warming World. Science 2001, 294, 793–795. [Google Scholar] [CrossRef] [PubMed]
- Zhang, G.; Zhang, Y.; Dong, J.; Xiao, X. Green-up dates in the Tibetan Plateau have continuously advanced from 1982 to 2011. Proc. Natl. Acad. Sci. USA 2013, 110, 4309–4314. [Google Scholar] [CrossRef] [PubMed]
- Nemani, R.R.; Keeling, C.D.; Hashimoto, H.; Jolly, W.M.; Piper, S.C.; Tucker, C.J.; Myneni, R.B.; Running, S.W. Climate-Driven Increases in Global Terrestrial Net Primary Production from 1982 to 1999. Science 2003, 300, 1560–1563. [Google Scholar] [CrossRef]
- Ostberg, S.; Lucht, W.; Schaphoff, S.; Gerten, D. Critical impacts of global warming on land ecosystems. Earth Syst. Dynam. 2013, 4, 347–357. [Google Scholar] [CrossRef]
- Ciais, P.; Reichstein, M.; Viovy, N.; Granier, A.; Ogée, J.; Allard, V.; Aubinet, M.; Buchmann, N.; Bernhofer, C.; Carrara, A.; et al. Europe-wide reduction in primary productivity caused by the heat and drought in 2003. Nature 2005, 437, 529–533. [Google Scholar] [CrossRef]
- Gatti, L.V.; Gloor, M.; Miller, J.B.; Doughty, C.E.; Malhi, Y.; Domingues, L.G.; Basso, L.S.; Martinewski, A.; Correia, C.S.C.; Borges, V.F.; et al. Drought sensitivity of Amazonian carbon balance revealed by atmospheric measurements. Nature 2014, 506, 76–80. [Google Scholar] [CrossRef]
- Zhao, M.; Running, S.W. Drought-Induced Reduction in Global Terrestrial Net Primary Production from 2000 Through 2009. Science 2010, 329, 940–943. [Google Scholar] [CrossRef]
- de Jong, R.; Schaepman, M.E.; Furrer, R.; de Bruin, S.; Verburg, P.H. Spatial relationship between climatologies and changes in global vegetation activity. Glob. Chang. Biol. 2013, 19, 1953–1964. [Google Scholar] [CrossRef]
- Woodward, F.I.; Lomas, M.R.; Kelly, C.K. Global climate and the distribution of plant biomes. Philos. Trans. R. Soc. London Ser. B Biol. Sci. 2004, 359, 1465–1476. [Google Scholar] [CrossRef]
- Fu, G.; Sun, W.; Li, S.; Zhang, J.; Yu, C.; Shen, Z. Modeling Aboveground Biomass Using MODIS Images and Climatic Data in Grasslands on the Tibetan Plateau. J. Resour. Ecol. 2017, 8, 42–49. [Google Scholar] [CrossRef]
- Garbulsky, M.F.; Peñuelas, J.; Papale, D.; Ardö, J.; Goulden, M.L.; Kiely, G.; Richardson, A.D.; Rotenberg, E.; Veenendaal, E.M.; Filella, I. Patterns and controls of the variability of radiation use efficiency and primary productivity across terrestrial ecosystems. Glob. Ecol. Biogeogr. 2010, 19, 253–267. [Google Scholar] [CrossRef]
- Musau, J.; Patil, S.; Sheffield, J.; Marshall, M. Spatio-temporal vegetation dynamics and relationship with climate over East Africa. Hydrol. Earth Syst. Sci. Discuss. 2016, 2016, 1–30. [Google Scholar] [CrossRef]
- Zhu, L.; Southworth, J. Disentangling the Relationships between Net Primary Production and Precipitation in Southern Africa Savannas Using Satellite Observations from 1982 to 2010. Remote Sens. 2013, 5, 3803–3825. [Google Scholar] [CrossRef]
- Wu, D.; Zhao, X.; Liang, S.; Zhou, T.; Huang, K.; Tang, B.; Zhao, W. Time-lag effects of global vegetation responses to climate change. Glob. Chang. Biol. 2015, 21, 3520–3531. [Google Scholar] [CrossRef]
- Xu, G.; Zhang, H.; Chen, B.; Zhang, H.; Innes, J.L.; Wang, G.; Yan, J.; Zheng, Y.; Zhu, Z.; Myneni, R.B. Changes in Vegetation Growth Dynamics and Relations with Climate over China’s Landmass from 1982 to 2011. Remote Sens. 2014, 6, 3263–3283. [Google Scholar] [CrossRef]
- Zhao, W.; Zhao, X.; Zhou, T.; Wu, D.; Tang, B.; Wei, H. Climatic factors driving vegetation declines in the 2005 and 2010 Amazon droughts. PLoS ONE 2017, 12, e0175379. [Google Scholar] [CrossRef]
- Papagiannopoulou, C.; Miralles, D.G.; Dorigo, W.A.; Verhoest, N.E.C.; Depoorter, M.; Waegeman, W. Vegetation anomalies caused by antecedent precipitation in most of the world. Environ. Res. Lett. 2017, 12, 074016. [Google Scholar] [CrossRef]
- Sherry, R.A.; Weng, E.; Arnone Iii, J.A.; Johnson, D.W.; Schimel, D.S.; Verburg, P.S.; Wallace, L.L.; Luo, Y. Lagged effects of experimental warming and doubled precipitation on annual and seasonal aboveground biomass production in a tallgrass prairie. Glob. Chang. Biol. 2008, 14, 2923–2936. [Google Scholar] [CrossRef]
- Kuzyakov, Y.; Gavrichkova, O. REVIEW: Time lag between photosynthesis and carbon dioxide efflux from soil: A review of mechanisms and controls. Glob. Chang. Biol. 2010, 16, 3386–3406. [Google Scholar] [CrossRef]
- Braswell, B.H.; Schimel, D.S.; Linder, E.; Moore, B. The Response of Global Terrestrial Ecosystems to Interannual Temperature Variability. Science 1997, 278, 870–873. [Google Scholar] [CrossRef]
- VukiĆEviĆ, T.; Braswell, B.H.; Schimel, D. A diagnostic study of temperature controls on global terrestrial carbon exchange. Tellus B 2001, 53, 150–170. [Google Scholar] [CrossRef]
- Zhang, T.; Yang, S.; Guo, R.; Guo, J. Correction: Warming and Nitrogen Addition Alter Photosynthetic Pigments, Sugars and Nutrients in a Temperate Meadow Ecosystem. PLoS ONE 2016, 11, e0158249. [Google Scholar] [CrossRef]
- Vicente-Serrano, S.M.; Gouveia, C.; Camarero, J.J.; Beguería, S.; Trigo, R.; López-Moreno, J.I.; Azorín-Molina, C.; Pasho, E.; Lorenzo-Lacruz, J.; Revuelto, J.; et al. Response of vegetation to drought time-scales across global land biomes. Proc. Natl. Acad. Sci. USA 2013, 110, 52–57. [Google Scholar] [CrossRef]
- Gunderson, C.A.; Norby, R.J.; Wullschleger, S.D. Acclimation of photosynthesis and respiration to simulated climatic warming in northern and southern populations of Acer saccharum: Laboratory and field evidence. Tree Physiol. 2000, 20, 87–96. [Google Scholar] [CrossRef]
- Slot, M.; Kitajima, K. General patterns of acclimation of leaf respiration to elevated temperatures across biomes and plant types. Oecologia 2015, 177, 885–900. [Google Scholar] [CrossRef]
- Yamori, W.; Hikosaka, K.; Way, D.A. Temperature response of photosynthesis in C3, C4, and CAM plants: Temperature acclimation and temperature adaptation. Photosynth. Res. 2014, 119, 101–117. [Google Scholar] [CrossRef] [PubMed]
- Wen, Y.; Liu, X.; Xin, Q.; Wu, J.; Xu, X.; Pei, F.; Li, X.; Du, G.; Cai, Y.; Lin, K.; et al. Cumulative Effects of Climatic Factors on Terrestrial Vegetation Growth. J. Geophys. Res. Biogeosci. 2019, 124, 789–806. [Google Scholar] [CrossRef]
- Shi, S.; Wang, P.; Zhang, Y.; Yu, J. Cumulative and time-lag effects of the main climate factors on natural vegetation across Siberia. Ecol. Indic. 2021, 133, 108446. [Google Scholar] [CrossRef]
- Sun, Q.; Liu, C.; Chen, T.; Zhang, A. A Weighted-Time-Lag Method to Detect Lag Vegetation Response to Climate Variation: A Case Study in Loess Plateau, China, 1982–2013. Remote Sens. 2021, 13, 923. [Google Scholar] [CrossRef]
- Wei, X.; He, W.; Zhou, Y.; Ju, W.; Xiao, J.; Li, X.; Liu, Y.; Xu, S.; Bi, W.; Zhang, X.; et al. Global assessment of lagged and cumulative effects of drought on grassland gross primary production. Ecol. Indic. 2022, 136, 108646. [Google Scholar] [CrossRef]
- Wu, C.; Wang, T. Evaluating Cumulative Drought Effect on Global Vegetation Photosynthesis Using Numerous GPP Products. Front. Environ. Sci. 2022, 10, 908875. [Google Scholar] [CrossRef]
- Yuan, Y.; Bao, A.; Jiapaer, G.; Jiang, L.; De Maeyer, P. Phenology-based seasonal terrestrial vegetation growth response to climate variability with consideration of cumulative effect and biological carryover. Sci. Total Environ. 2022, 817, 152805. [Google Scholar] [CrossRef]
- Zhao, A.; Yu, Q.; Feng, L.; Zhang, A.; Pei, T. Evaluating the cumulative and time-lag effects of drought on grassland vegetation: A case study in the Chinese Loess Plateau. J. Environ. Manag. 2020, 261, 110214. [Google Scholar] [CrossRef]
- Liu, H.; Zhang, A.; Liu, C.; Zhao, Y.; Zhao, A.; Wang, D. Analysis of the time-lag effects of climate factors on grassland productivity in Inner Mongolia. Glob. Ecol. Conserv. 2021, 30, e01751. [Google Scholar] [CrossRef]
- Peng, S.; Piao, S.; Ciais, P.; Myneni, R.B.; Chen, A.; Chevallier, F.; Dolman, A.J.; Janssens, I.A.; Peñuelas, J.; Zhang, G.; et al. Asymmetric effects of daytime and night-time warming on Northern Hemisphere vegetation. Nature 2013, 501, 88–92. [Google Scholar] [CrossRef]
- Piao, S.; Tan, J.; Chen, A.; Fu, Y.H.; Ciais, P.; Liu, Q.; Janssens, I.A.; Vicca, S.; Zeng, Z.; Jeong, S.-J.; et al. Leaf onset in the northern hemisphere triggered by daytime temperature. Nat. Commun. 2015, 6, 6911. [Google Scholar] [CrossRef]
- Tan, J.; Piao, S.; Chen, A.; Zeng, Z.; Ciais, P.; Janssens, I.A.; Mao, J.; Myneni, R.B.; Peng, S.; Peñuelas, J.; et al. Seasonally different response of photosynthetic activity to daytime and night-time warming in the Northern Hemisphere. Glob. Chang. Biol. 2015, 21, 377–387. [Google Scholar] [CrossRef]
- Piao, S.; Friedlingstein, P.; Ciais, P.; Viovy, N.; Demarty, J. Growing season extension and its impact on terrestrial carbon cycle in the Northern Hemisphere over the past 2 decades. Glob. Biogeochem. Cycles 2007, 21, GB3018. [Google Scholar] [CrossRef]
- Harris, I.; Jones, P.D.; Osborn, T.J.; Lister, D.H. Updated high-resolution grids of monthly climatic observations—The CRU TS3.10 Dataset. Int. J. Climatol. 2014, 34, 623–642. [Google Scholar] [CrossRef]
- Stackhouse Jr, P.; Gupta, S.; Cox, S.; Mikovitz, J.C.; Zhang, T.; Chiacchio, M. 12-year surface radiation budget data set. GEWEX News 2004, 14, 10–12. [Google Scholar]
- Müller Schmied, H.; Müller, R.; Sanchez-Lorenzo, A.; Ahrens, B.; Wild, M. Evaluation of Radiation Components in a Global Freshwater Model with Station-Based Observations. Water 2016, 8, 450. [Google Scholar] [CrossRef]
- Sheffield, J.; Wood, E.F.; Roderick, M.L. Little change in global drought over the past 60 years. Nature 2012, 491, 435–438. [Google Scholar] [CrossRef]
- Wu, X.; Liu, H.; Li, X.; Liang, E.; Beck, P.S.A.; Huang, Y. Seasonal divergence in the interannual responses of Northern Hemisphere vegetation activity to variations in diurnal climate. Sci. Rep. 2016, 6, 19000. [Google Scholar] [CrossRef] [PubMed]
- De Fries, R.S.; Hansen, M.; Townshend, J.R.G.; Sohlberg, R. Global land cover classifications at 8 km spatial resolution: The use of training data derived from Landsat imagery in decision tree classifiers. Int. J. Remote Sens. 1998, 19, 3141–3168. [Google Scholar] [CrossRef]
- Barnes, M.L.; Moran, M.S.; Scott, R.L.; Kolb, T.E.; Ponce-Campos, G.E.; Moore, D.J.P.; Ross, M.A.; Mitra, B.; Dore, S. Vegetation productivity responds to sub-annual climate conditions across semiarid biomes. Ecosphere 2016, 7, e01339. [Google Scholar] [CrossRef]
- Wen, Y.; Liu, X.; Du, G. Nonuniform Time-Lag Effects of Asymmetric Warming on Net Primary Productivity across Global Terrestrial Biomes. Earth Interact. 2018, 22, 1–26. [Google Scholar] [CrossRef]
- Ding, Y.; Li, Z.; Peng, S. Global analysis of time-lag and -accumulation effects of climate on vegetation growth. Int. J. Appl. Earth Obs. Geoinf. 2020, 92, 102179. [Google Scholar] [CrossRef]
- Aubin, I.; Munson, A.D.; Cardou, F.; Burton, P.J.; Isabel, N.; Pedlar, J.H.; Paquette, A.; Taylor, A.R.; Delagrange, S.; Kebli, H.; et al. Traits to stay, traits to move: A review of functional traits to assess sensitivity and adaptive capacity of temperate and boreal trees to climate change. Environ. Rev. 2016, 24, 164–186. [Google Scholar] [CrossRef]
- Anderegg, L.D.L.; HilleRisLambers, J. Drought stress limits the geographic ranges of two tree species via different physiological mechanisms. Glob. Chang. Biol. 2016, 22, 1029–1045. [Google Scholar] [CrossRef]
- Mayoral, C.; Pardos, M.; Sánchez-González, M.; Brendel, O.; Pita, P. Ecological implications of different water use strategies in three coexisting mediterranean tree species. For. Ecol. Manag. 2016, 382, 76–87. [Google Scholar] [CrossRef]
- Pardos, M.; del Río, M.; Pretzsch, H.; Jactel, H.; Bielak, K.; Bravo, F.; Brazaitis, G.; Defossez, E.; Engel, M.; Godvod, K.; et al. The greater resilience of mixed forests to drought mainly depends on their composition: Analysis along a climate gradient across Europe. For. Ecol. Manag. 2021, 481, 118687. [Google Scholar] [CrossRef]
- Liu, Y.; Liu, R.; Pisek, J.; Chen, J.M. Separating overstory and understory leaf area indices for global needleleaf and deciduous broadleaf forests by fusion of MODIS and MISR data. Biogeosciences 2017, 14, 1093–1110. [Google Scholar] [CrossRef]
- Ershadi, A.; McCabe, M.F.; Evans, J.P.; Wood, E.F. Impact of model structure and parameterization on Penman–Monteith type evaporation models. J. Hydrol. 2015, 525, 521–535. [Google Scholar] [CrossRef]
- Gang, C.; Zhou, W.; Wang, Z.; Chen, Y.; Li, J.; Chen, J.; Qi, J.; Odeh, I.; Groisman, P.Y. Comparative Assessment of Grassland NPP Dynamics in Response to Climate Change in China, North America, Europe and Australia from 1981 to 2010. J. Agron. Crop Sci. 2015, 201, 57–68. [Google Scholar] [CrossRef]
- Aouissi, J.; Benabdallah, S.; Lili Chabaâne, Z.; Cudennec, C. Evaluation of potential evapotranspiration assessment methods for hydrological modelling with SWAT—Application in data-scarce rural Tunisia. Agric. Water Manag. 2016, 174, 39–51. [Google Scholar] [CrossRef]
- Liu, N.; Shi, Y.; Ding, Y.; Liu, L.; Peng, S. Temporal effects of climatic factors on vegetation phenology on the Loess Plateau, China. J. Plant Ecol. 2023, 16, rtac063. [Google Scholar] [CrossRef]
- Shi, C.; Sun, G.; Zhang, H.; Xiao, B.; Ze, B.; Zhang, N.; Wu, N. Effects of Warming on Chlorophyll Degradation and Carbohydrate Accumulation of Alpine Herbaceous Species during Plant Senescence on the Tibetan Plateau. PLoS ONE 2014, 9, e107874. [Google Scholar] [CrossRef]
- Fracheboud, Y.; Luquez, V.; Björkén, L.; Sjödin, A.; Tuominen, H.; Jansson, S. The Control of Autumn Senescence in European Aspen. Plant Physiol. 2009, 149, 1982–1991. [Google Scholar] [CrossRef]
- Ke, Y.; Leung, L.R.; Huang, M.; Coleman, A.M.; Li, H.; Wigmosta, M.S. Development of high resolution land surface parameters for the Community Land Model. Geosci. Model Dev. 2012, 5, 1341–1362. [Google Scholar] [CrossRef]
- Kim, J.-H.; Moon, Y.R.; Wi, S.G.; Kim, J.-S.; Lee, M.H.; Chung, B.Y. Differential Radiation Sensitivities of Arabidopsis Plants at Various Developmental Stages. In Photosynthesis. Energy from the Sun: Proceedings of the 14th International Congress on Photosynthesis, Glasgow, UK, 22–27 July 2007; Springer: Dordrecht, The Netherlands, 2008; pp. 1491–1495. [Google Scholar]
- He, P.; Osaki, M.; Takebe, M.; Shinano, T.; Wasaki, J. Endogenous hormones and expression of senescence-related genes in different senescent types of maize. J. Exp. Bot. 2005, 56, 1117–1128. [Google Scholar] [CrossRef] [PubMed]
- Liu, Q.; Fu, Y.H.; Zeng, Z.; Huang, M.; Li, X.; Piao, S. Temperature, precipitation, and insolation effects on autumn vegetation phenology in temperate China. Glob. Chang. Biol. 2016, 22, 644–655. [Google Scholar] [CrossRef] [PubMed]
- Gepstein, S.; Thimann, K.V. Changes in the abscisic acid content of oat leaves during senescence. Proc. Natl. Acad. Sci. USA 1980, 77, 2050–2053. [Google Scholar] [CrossRef] [PubMed]
- Chen, X.; Ciais, P.; Maignan, F.; Zhang, Y.; Bastos, A.; Liu, L.; Bacour, C.; Fan, L.; Gentine, P.; Goll, D.; et al. Vapor Pressure Deficit and Sunlight Explain Seasonality of Leaf Phenology and Photosynthesis Across Amazonian Evergreen Broadleaved Forest. Glob. Biogeochem. Cycles 2021, 35, e2020GB006893. [Google Scholar] [CrossRef]
- Zhang, H.; Yuan, W.; Dong, W.; Liu, S. Seasonal patterns of litterfall in forest ecosystem worldwide. Ecol. Complex. 2014, 20, 240–247. [Google Scholar] [CrossRef]
- Weng, E.; Farrior, C.E.; Dybzinski, R.; Pacala, S.W. Predicting vegetation type through physiological and environmental interactions with leaf traits: Evergreen and deciduous forests in an earth system modeling framework. Glob. Chang. Biol. 2017, 23, 2482–2498. [Google Scholar] [CrossRef]
- Loidi, J.; Navarro-Sánchez, G.; Vynokurov, D. Climatic definitions of the world’s terrestrial biomes. Veg. Classif. Surv. 2022, 3, 231–271. [Google Scholar] [CrossRef]
- Lehmann, C.E.R.; Archibald, S.A.; Hoffmann, W.A.; Bond, W.J. Deciphering the distribution of the savanna biome. New Phytol. 2011, 191, 197–209. [Google Scholar] [CrossRef]
- Shi, X.; Wang, W.; Shi, W. Progress on quantitative assessment of the impacts of climate change and human activities on cropland change. J. Geogr. Sci. 2016, 26, 339–354. [Google Scholar] [CrossRef]
- Frisvold, G.B.; Konyar, K. Climate Change Mitigation Policies: Implications for Agriculture and Water Resources. J. Contemp. Water Res. Educ. 2013, 151, 27–42. [Google Scholar] [CrossRef]
- Chen, Q.; Yang, L.E.; Luo, J.; Liu, F.; Zhang, Y.; Zhou, Q.; Guo, R.; Gu, X. The 300 years cropland changes reflecting climate impacts and social resilience at the Yellow River–Huangshui River Valley, China. Environ. Res. Lett. 2021, 16, 065006. [Google Scholar] [CrossRef]
- Mueller, N.D.; Butler, E.E.; McKinnon, K.A.; Rhines, A.; Tingley, M.; Holbrook, N.M.; Huybers, P. Cooling of US Midwest summer temperature extremes from cropland intensification. Nat. Clim. Chang. 2016, 6, 317–322. [Google Scholar] [CrossRef]
- Reinermann, S.; Gessner, U.; Asam, S.; Kuenzer, C.; Dech, S. The Effect of Droughts on Vegetation Condition in Germany: An Analysis Based on Two Decades of Satellite Earth Observation Time Series and Crop Yield Statistics. Remote Sens. 2019, 11, 1783. [Google Scholar] [CrossRef]
- Jafari, R.; Lewis, M.M.; Ostendorf, B. Evaluation of vegetation indices for assessing vegetation cover in southern arid lands in South Australia. Rangel. J. 2007, 29, 39–49. [Google Scholar] [CrossRef]
- Leprieur, C.; Kerr, Y.H.; Mastorchio, S.; Meunier, J.C. Monitoring vegetation cover across semi-arid regions: Comparison of remote observations from various scales. Int. J. Remote Sens. 2000, 21, 281–300. [Google Scholar] [CrossRef]
- Brantley, S.T.; Zinnert, J.C.; Young, D.R. Application of hyperspectral vegetation indices to detect variations in high leaf area index temperate shrub thicket canopies. Remote Sens. Environ. 2011, 115, 514–523. [Google Scholar] [CrossRef]
- Zhang, Y.; Tian, Y.; Knyazikhin, Y.; Martonchik, J.V.; Diner, D.J.; Leroy, M.; Myneni, R.B.; Sensing, R. Prototyping of MISR LAI and FPAR algorithm with POLDER data over Africa. IEEE Trans. Geosci. Remote Sens. 2000, 38, 2402–2418. [Google Scholar] [CrossRef]


Disclaimer/Publisher’s Note: The statements, opinions and data contained in all publications are solely those of the individual author(s) and contributor(s) and not of MDPI and/or the editor(s). MDPI and/or the editor(s) disclaim responsibility for any injury to people or property resulting from any ideas, methods, instructions or products referred to in the content. |
© 2024 by the authors. Licensee MDPI, Basel, Switzerland. This article is an open access article distributed under the terms and conditions of the Creative Commons Attribution (CC BY) license (https://creativecommons.org/licenses/by/4.0/).
Share and Cite
Du, G.; Yan, S.; Chen, H.; Yang, J.; Wen, Y. Intra-Annual Cumulative Effects and Mechanisms of Climatic Factors on Global Vegetation Biomes’ Growth. Remote Sens. 2024, 16, 779. https://doi.org/10.3390/rs16050779
Du G, Yan S, Chen H, Yang J, Wen Y. Intra-Annual Cumulative Effects and Mechanisms of Climatic Factors on Global Vegetation Biomes’ Growth. Remote Sensing. 2024; 16(5):779. https://doi.org/10.3390/rs16050779
Chicago/Turabian StyleDu, Guoming, Shouhong Yan, Hang Chen, Jian Yang, and Youyue Wen. 2024. "Intra-Annual Cumulative Effects and Mechanisms of Climatic Factors on Global Vegetation Biomes’ Growth" Remote Sensing 16, no. 5: 779. https://doi.org/10.3390/rs16050779
APA StyleDu, G., Yan, S., Chen, H., Yang, J., & Wen, Y. (2024). Intra-Annual Cumulative Effects and Mechanisms of Climatic Factors on Global Vegetation Biomes’ Growth. Remote Sensing, 16(5), 779. https://doi.org/10.3390/rs16050779