Abstract
Flash droughts, a type of extreme event characterized by the sudden onset and rapid intensification of drought conditions with severe impacts on ecosystems, have become more frequent in recent years due to global warming. The drought index is an effective way to monitor drought and mitigate its negative impact on human production and life. This study presents a new flash drought identification and monitoring method based on the evapotranspiration-based drought index, i.e., the evaporative stress percentile (ESP). This ESP-based method considers both the rate of the rapid intensification and each phase of flash drought development, which allows it to be used quantitative assessment of flash drought characteristics including detailed information on the onset, development, termination, and intensity. The ESP is evaluated using the soil moisture percentile (SMP) derived from the GLDAS-Noah soil moisture data. The results show that there was good agreement between the ESP and SMP across most of China, with correlation coefficient values above 0.8 and MAE values below 10 percentile/week. The ESP was then used to identify flash droughts in China and compared with the Precipitation Anomaly Percentage (PAP) and the SMP for three cases of typical flash drought events in three different regions and years with different land covers. It demonstrates the robustness of the ESP for detecting flash droughts in different geographical regions, for different land cover types, and for different climatic characteristics. This method is applied to characterize historical flash droughts in 1979–2018 in China, and the results show that flash droughts in China occur most frequently in the transitional climate zone between humid and arid regions in Northern China. This study contributes to a better understanding of flash drought development and supports to decision-makers in providing early warnings for flash droughts.
1. Introduction
Traditionally, drought has been viewed as a slowly evolving natural phenomenon and categorized into meteorological, hydrological, agricultural, and economic droughts. However, in the context of global warming, the likelihood of droughts coinciding with heat waves has significantly increased, triggering a type of rapid-onset drought known as flash drought [1,2,3]. Although there is no consensus on a quantitative definition of flash drought, flash drought is considered to be caused by precipitation deficits while accompanied by abnormally high air temperatures, low humidity, strong solar radiation, and, sometimes, strong winds. These abnormal weather conditions intensify the depletion of soil moisture through rapid soil evaporation and plant transpiration, having an extreme impact on crop growth and ecosystems [4,5,6,7]. Such droughts are most likely to occur in the Northern Hemisphere, especially in humid regions, and have significant environmental and social impacts [8,9,10]. For example, the 2010 summer flash drought in western Russia resulted in a 70% decrease in local wheat production that year, the 2017 flash drought in the Central United States (US) resulted in agricultural losses of more than $2.6 billion dollars, the 2018 flash drought in Queensland, Australia, resulted in high livestock mortality, and the 2022 flash drought that occurred in the Yangtze River Basin resulted in billions of dollars in economic losses. In recent decades, the frequency and intensity of flash droughts, especially severe droughts, have increased significantly in China [11,12,13,14]. The Yangtze River Basin has experienced three severe droughts in the past decade, specifically in 2013, 2019 and 2022, with negative impacts on local people’s livelihoods and socioeconomic development [10,15]. China covers a vast area with significant climatic disparities in different geographical regions. Investigating the characteristics of flash droughts can contribute to improving our understanding of the causal mechanisms of flash droughts. As a result, effective detection and monitoring of flash droughts can help to reduce associated economic and agricultural losses.
Unlike slowly developing droughts, flash droughts are difficult to identify and monitor using commonly used drought indices due to their rapid onset [16]. Based on previous studies, among the many methods used to identify and monitor flash droughts, two main types of methods were more commonly used. One type of the method uses root-zone soil moisture to identify flash droughts [17,18,19,20,21]. Flash drought is characterized by a rapid decline in the root-zone soil moisture. Ford and Labosier [21] used the weekly soil moisture percentile (SMP) of root-zone (top 40 cm) soil moisture from the Oklahoma Mesonet observations to identify flash droughts in the eastern United States. Yuan, et al. [22] further improved a flash drought identification method based on the SMP and applied it to study the characteristics of flash droughts over China in the past few decades and future projections using gridded data from meteorological observation stations and model output at a 0.5° spatial resolution. Otkin, et al. [23] proposed a flash drought intensity index (FDII) that accounts for both the rapid rate of drought intensification and the resulting severity and applied it to investigate flash drought across the Unites States during 1979–2017 using soil moisture data from the 0–40 cm layer with 0.125° spatial resolution from the Noah land surface model sourced from the North American Land Data Assimilation System (NLDAS).
The second type of method is to use evapotranspiration-based (ET-based) drought indices [16,24,25,26,27,28,29,30]. Flash droughts are often accompanied by higher air temperatures, lower air humidity (i.e., strong atmospheric demand), and stronger solar radiation, leading to increased evapotranspiration that can rapidly exacerbate soil moisture deficits. Therefore, the ET-based drought indices, which are in conjunction with both available soil water and available energy and atmospheric water demand conditions, have been considered as good candidates to assess the rapid responses of ecosystems to moisture stress. The satellite-derived evaporative stress index (ESI) [31] has been successfully used to monitor flash drought events across the United States [16]. Christian, et al. [24] proposed a method to identify flash drought based on the standardized evaporative stress ratio (SESR) and the change in SESR between pentads using data from the National Centers for Environmental Prediction North American Regional Reanalysis (NCEP NARR). They used four criteria based on SESR to quantitatively identify flash droughts in the United States, two of which focused on the rapid intensification of flash drought, and the other focused on the drought impact on vegetation. The SERS is similar to the ESI except for using every pentad temporal step instead of a weekly interval. Pendergrass et al. [30] proposed the evaporative demand drought index (EDDI) to identify flash droughts. But, the EDDI focuses on evaporative demand and could not reflect the actual ecosystem drought conditions.
In addition to timely information for early warning, it is important to know where flash drought impacts occur so that more accurate information can be delivered to local agencies, stakeholders, and farms. Previous studies using root-zone soil moisture for flash drought identification mostly used either station data or data from LSM model output at a rather coarse spatial resolution (e.g., 0.125° to 0.5°), which is too coarse to capture the spatial detail and heterogeneity of flash droughts. Widely used satellite observations are promising as they provide higher spatial resolution data at large scales but only provide near-surface soil moisture retrievals, which is not considered a good indicator for flash drought monitoring. In addition, the deepest layer of soil moisture observations or modeling results in most datasets reached only 1 m, which may be too shallow for ecosystems with much deeper roots. Evapotranspiration integrates the soil water and land surface energy availability, atmospheric water demand, and wind speed, and plant transpiration is regulated by the available water in the soil as long as the plant root can reach it. The deviation in the actual ET from the potential ET is considered a good indicator to evaluate the impact of water stress on ecosystems. In recent decades, a large number of satellite observation-based regional/global-scale evapotranspiration data products are emerging at much higher spatial resolutions (e.g., up to 1 km or even higher) [32,33,34] than the reanalysis data or the LSM outputs. Therefore, high-spatial-resolution and global-scale ET data are more readily available than root-zone soil moisture data and hold great promise for flash drought monitoring.
In the previous studies, most of the methods using an ET-based indicator were developed by using standardized anomalies to indicate the deviation in the current status from the historical normal condition [24,31], while the methods based on root-zone soil moisture mostly used percentiles to indicate the abnormal water stress conditions [20,21]. The percentiles (of either the root-zone soil moisture or ET and its other forms) measure the probability distribution, which indicates not only the deviation from the historical normal but also the probability of a certain degree of deviation, which can be associated with drought severity. Also, percentiles are easier to use and interpret because they are more intuitive and explicit. In addition, previous studies of ET-based drought indices emphasize the rapid intensification process of flash droughts but often neglect the persistence and recovery phases of flash droughts [35]. The phases, i.e., onset, persistence, and recovery, collectively have severe adverse impacts on the terrestrial ecosystem. Therefore, a complete and detailed definition of the phases of flash drought development helps to effectively assess the duration, intensity, and severity of flash droughts. Therefore, in this study, we proposed an index called the evaporative stress percentile (ESP) based on the percentile of the ratio of actual to potential ET for identifying flash droughts, and we will use the ESP to set up a framework to identify the onset, persistence, and recovery of a flash drought event. This work is considered to be a preliminary evaluation of the proposed indicator, i.e., the ESP, which can be further applied to ET data derived from satellite observations in the next step of our research.
The objectives of this study are as follows: (1) to propose a new ET-based drought index, the ESP, which can explicitly consider both the magnitude of the rapid intensification and phases of flash droughts to effectively assess the characteristics of flash droughts; (2) to evaluate the performance of the ESP by comparing it with SMP based on the GLDAS-Noah dataset and other drought indices; and (3) to apply the ESP-based framework to analyze the characteristics of historical flash droughts that occurred in China. The new ET-based drought index ESP can provide more detailed information about flash droughts, such as their onset, development and termination, and intensity, to decision-makers and stakeholders for timely drought early warning and drought mitigation.
2. Methods
This study proposed a new flash drought indicator, the evaporative stress percentile (ESP), based on the ratio of the actual evapotranspiration (AET) to potential evapotranspiration (PET) to identify and monitor the flash drought. The ratio of AET/PET is known as the evaporative stress index (ESI) or evaporative fraction (EF) and reflects the water availability of the ecosystem. In this study, the evapotranspiration and potential evapotranspiration data were taken from the GLDAS Noah datasets, which uses the land surface model Noah to simulate atmospheric and land surface variables. The framework of the new flash drought identification methodology consisted of the following three parts: (1) the construction of the weekly ESP; (2) the construction of the flash drought identification criteria; and (3) the identification of the flash drought development phases.
We used the same GLADAS-Noah dataset to estimate the weekly soil moisture percentile (SMP), then used it to evaluate the proposed ESP. This eliminated the inconsistency caused by using different data. The weekly Precipitation Anomaly Percentage (PAP) are used to verify the capacity of the ESP to detect flash droughts. The weekly NVAI (Normalized Vegetation Anomaly Index) is used for further comparison. The specific procedure of the proposed method is presented below.
2.1. A New Flash Drought Identification Method
2.1.1. Evaporative Stress Percentile (ESP)
The basis of the flash drought identification method proposed in this study was based on the evaporative stress ratio (ESR), which is expressed as the evaporative fraction as follows:
where is the actual evapotranspiration from the land surface, constrained by soil water availability, in addition to the available energy, air temperature, wind speed, and atmospheric water vapor demand conditions. is the potential evaporation, an important indicator of atmospheric evaporative demand that plays a key role in the evolution of droughts [36]. The ESR expresses the physical relationship between the AET and PET in terms of water-limited and energy-limited conditions, as shown in Figure 1a, following the method of Pendergrass et al. [30]. The energy-limited condition refers to the conditions where the water supply exceeds the evaporative demand of the atmosphere and evaporation is primarily controlled by available energy. The water-limited condition represents conditions where water supply from the land surface is insufficient. With sufficient soil moisture, increasing atmospheric evaporative demand leads to an increase in the AET, which can rapidly deplete soil moisture. Subsequently, if the soil water supply is insufficient (corresponding to the water-limited condition), the AET will rapidly decrease, even though the meteorological conditions continue to increase the atmospheric evaporative demand. Meanwhile, the sensible heat flux increases, which can promote the increase in air temperature and vapor pressure deficit, and, thus, the atmospheric evaporative demand increases even more [37,38]. As the drought developed, the ESR approached zero due to the decrease in soil moisture, and the vegetation water stress was exacerbated. A low ESR represents a large deviation in the actual ET from its potential values, indicating that the land surface may be experiencing drought conditions.
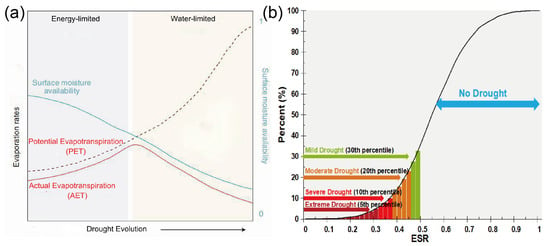
Figure 1.
(a) Illustration of the PET and AET evolution from an energy-limited state to a water-limited state (reproduced from Pendergrass et al. [30]). (b) Illustration of the ESP values corresponding to drought severity.
Although the ESR can represent the response of soil moisture to the drying process, it is not a practical indicator for quantifying drought because a quantitative criterion is needed to characterize the drought. To overcome this problem, we proposed using the evaporative stress percentile (ESP)—the percentile of ESR of a period (e.g., weekly) over the historical record of ESR in the same period in each pixel—to detect drought. The ESP describes how the condition of a location in a given period of a given year compares to the historical condition of the same period at the same location. The ESP was calculated using the cumulative distribution function of ESR (Figure 1b). The ESP value could be related to the severity of the drought: the lower the ESP, the drier the condition compared to the historical record. A very low ESP is associated with the most severe drought, and if the ESP is greater than the 30th percentile, water stress is considered absent. In this study, a seven-day period was used to construct the ESP. Five levels of ESP values were classified according to different drought conditions, as shown in Table 1.

Table 1.
Classification of the drought index (ESP) values corresponding to drought severity.
2.1.2. Flash Drought Identification Criteria
While there is currently no consensus in the scientific community on a definition of flash drought, it is generally agreed that any definition of flash drought should take into account both the rapid rate of intensification and the severity of the drought before it can be called a drought [30,39]. Consequently, three criteria were established based on the weekly ESP to identify a flash drought event as follows:
- (1)
- Onset: the ESP declines from above the 40th percentile to below the 20th percentile with an average decline rate of no less than the 6.5 percentile/week.
Most researchers agreed that the definition of flash drought should explicitly emphasize the rate of intensification (RI) [6]. Many past studies used the rate of percentile decline to identify the onset of drought [12,19,20,22]. We followed the method of Qing, et al. [12] by using a criterion for the change in the ESP of no less than 6.5 percentile/week to identify the onset of flash drought.
- (2)
- Termination: the flash drought ends when the ESP value rises above the 20th percentile and persists for at least two weeks.
This criterion explicitly defines the end of flash droughts. Although the recovery threshold can range from the 20th to the 30th percentile, the 20th percentile is chosen to exclude drought events with mild effects on vegetation [22]. The constraint of two-week persistence above the 20th percentile was used to ensure that the flash drought was fully alleviated.
- (3)
- Duration: flash droughts should last for at least 3 weeks.
Essentially, this criterion required that the ESP value remain below the 20th percentile for at least 3 weeks. Short-term dry spells that were too short to have an impact on the ecosystem were excluded by Criterion 3. The cumulative impacts of flash droughts on the ecosystem were related to the characteristics of flash droughts, including severity and duration. Flash droughts with longer durations would have more severe impacts on the terrestrial ecosystems [40,41]. We believe that a minimum average duration of 3 weeks is an appropriate requirement, as shown in other studies [42], although the impact of drought may vary due to differences in drought tolerance across regions.
According to the three criteria defined above, we classified the evolution of a flash drought event into three stages (Figure 2): the flash drought onset development duration (FDOD), the flash drought persistence duration (FDPD), and the flash drought recovering duration (FDRD). During the FDOD, the soil water condition was drying, and the ESP decreased from above the 40th percentile (at ) to below the 20th percentile (at ) with an average decline rate of no less than 6.5 percentile/week. The time is the onset of the flash drought where the ESP falls below the 20th percentile. The FDOD was a critical period used for distinguishing flash droughts from conventional droughts (which tend to develop slowly). During the FDPD, the ESP continued to fall from below the 20th percentile (at ) to the point (i.e., the most severe period of a flash drought at which the ESP reached its minimum value). During the FDRD (between and ), the drought condition was alleviated, and the ESP returned to above the 20th percentile at , where the flash drought ended.
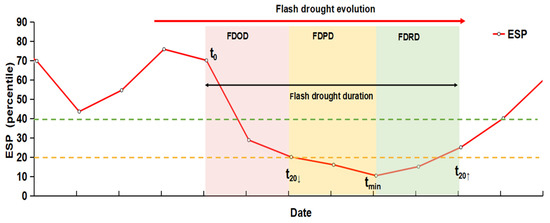
Figure 2.
A schematic illustration of a flash drought development based on the ESP (FDOD: flash drought onset development duration; FDPD: flash drought persistence duration; FDRD: flash drought recovering duration).
2.2. Flash Drought Characteristics by the ESP
In this study, we investigated the spatiotemporal characteristics (frequency, average duration, and average intensification rate) of flash droughts in China during the growing season (March–September) in 1979–2018 based on the ESP calculated using the GLDAS-Noah dataset. The average duration and intensification rate of flash droughts in each grid cell were obtained by taking the simple arithmetic mean of the duration and intensification rate of historical flash drought events in 1979–2018. The frequency, duration, and rate intensification of flash droughts were defined as follows:
- The frequency of flash drought: the total number of flash drought events in the selected study period.
- The duration of flash drought: the number of days from the rapid onset of the ESP decline to recovery, i.e., in Figure 2.
- The rate of intensification (RI): the average rate of decline in the ESP during the FDOD, which is a critical characteristic for distinguishing flash droughts from conventional droughts. The rate of intensification (RI) (percentile/week) of a flash drought event is calculated as follows:where is the onset time of the FDOD, is the termination time of the FDOD, and is the length of time (i.e., number of days) of the FDOD.
2.3. Compared with Other Drought Indices
Drought indices are commonly used to monitor the evolution of droughts. By comparing the ESP with various existing drought indices, we can comprehensively evaluate the performance of the newly proposed index ESP in terms of identifying and monitoring flash droughts.
The soil moisture percentile (SMP) was introduced by Ford and Labosier [21] to identify and monitor flash droughts. It states that a flash drought event occurs when the root-zone (top 40 cm) soil moisture drops from the above 40th percentile to below the 20th percentile in less than 20 days. In this study, we evaluated the performance of the ESP for identifying and monitoring flash droughts by comparing it to the SMP using the 0–40 cm soil moisture data from the GLDAS-Noah dataset.
The Precipitation Anomaly Percentage (PAP) is a traditional drought-monitoring index that reflects the degree of deviation in the accumulated precipitation in a given period () from the historical mean precipitation for the same period (). In this study, we evaluated the performance of the ESP in response to the precipitation anomaly conditions for flash drought events by comparing it with the PAP based on the precipitation data sourced from the China Meteorological Forcing Dataset (CMFD). A 7-day period was used to construct the PAP. The PAP was calculated as follows:
Vegetation health responds to drought conditions, which can be expressed by vegetation index-based drought indicators. The Normalized Vegetation Anomaly Index (NVAI) evaluates the current NDVI relative to the mean values of the same historical period, which is defined as follows [43]:
where , , , and are the NDVI, multi-year average, multi-year maximum, and multi-year minimum NDVI, respectively, for a given period and pixel. The NVAI ranged from −1 to 1 and characterizes changes in vegetation conditions from extremely poor (−1) to favorable (1). In this study, a 7-day period was used to construct the NVAI.
2.4. Accuracy Assessment
The ESP was quantitatively evaluated via comparison with the SMP calculated using the GLDAS-Noah dataset during the March–September periods for 1979–2018. Multiple metrics were applied to evaluate the performances of the ESP for capturing dry and wet variations. These evaluation metrics include the correlation coefficient (R) and the mean absolute error (MAE), which are expressed as follows:
where is the estimates, is the reference values, is the mean estimates, is the mean reference values, and is the number of samples. In this study, the weekly ESP values calculated using the GLDAS-Noah dataset during the March–September periods for 1979–2018 were considered to be the estimates, while the weekly SMP values calculated using the 0–40 cm soil moisture of the GLDAS-Noah dataset during the same period were considered to be the references. The larger the values of R and the closer the MAE was to zero, the closer the estimates were to the reference values, reflecting the high reliability of the estimates.
3. Materials and Study Area
3.1. Datasets
3.1.1. GLDAS-Noah Dataset
The Global Land Data Assimilation System (GLDAS) developed by combining simulation models with observations provides a series of land surface state (e.g., soil moisture and surface temperature) and flux (e.g., evaporation and sensible heat flux) products on the global scale [44]. The GLDAS Noah dataset has been used in many studies for flash drought analysis [2,12,15,45]. The GLDASv2.0 dataset covers the period from 1948 to 1999, and the v2.1 dataset covers the period from 2000 to the present, with spatial resolutions of 0.25° × 0.25° and temporal resolutions of 3 h. Specifically, we used the GLDASv2.0/Noah datasets for 1979–1999 and GLDASv2.1/Noah datasets for 2000–2018 to perform the flash drought analysis. The biases between the GLDASv2.0 and GLDASv2.1 datasets were corrected by using the cumulative distribution frequency (CDF) matching approach [46] at grid scale.
In this study, we calculated the daily ESR based on three-hourly GLDAS-Noah ET and PET data. The daily ESR was aggregated to a weekly average, and then the weekly ESR percentile (ESP) values for 1979–2018 were calculated to identify past flash droughts.
The three-hourly GLDAS-Noah soil moisture at depths of 0–40 cm was aggregated to weekly averages, and then weekly soil moisture percentile for 1979–2018 were calculated to evaluate the performance of the ESP.
3.1.2. China Meteorological Forcing Dataset
The China Meteorological Forcing Dataset (CMFD) was used to evaluate the atmospheric conditions during flash drought events. The CMFD was the first high-spatial–temporal-resolution gridded near-surface meteorological dataset in China, developed by the Institute of Tibetan Plateau Research, Chinese Academy of Sciences (http://data.tpdc.ac.cn/en/data/8028b944-daaa-4511-8769-965612652c49/, accessed on 1 January 2021) [47,48]. The CMFD provides meteorological data, including the air temperature, specific humidity, wind speed at 10 m, downward shortwave radiation, surface pressure, and precipitation rate. We used water vapor deficit (VPD), other than specific humidity, to describe the atmospheric water demand in this study. VPD was calculated from air temperature, specific humidity, and surface pressure data, as shown below:
where is the saturated vapor pressure (hPa), is the actual vapor pressure (hPa), is the air temperature (°C), is the specific humidity (g/kg), and is the surface pressure (hPa).
The CMFD covers both all of China and a long time period (1979–2018), with spatial and temporal resolutions of 0.1° × 0.1° and 1 day, respectively. In this study, the CMFD dataset was resampled to the same spatial resolution (0.25° × 0.25°) as the GLDAS Noah dataset. Then, the seven-day mean anomalies of climatic factors (i.e., air temperature, vapor pressure deficit, wind speed, and downward shortwave radiation) were calculated using the CMFD data for the period 1979–2018. The weekly PAP was calculated using the CMFD precipitation data to evaluate the performance of the ESP.
3.1.3. MODIS NDVI Data
The daily NDVI was obtained from the MODIS Terra Daily NDVI dataset (MOD09GA_006_NDVI) derived from the Google Earth Engine (GEE) platform (https://developers.google.com/earth-engine/datasets/catalog/MODIS_MOD09GA_006_NDVI, accessed on 1 January 2021). It was calculated based on the red and near-infrared band of the MOD09GA surface reflectance product. In this study, we first used the daily NDVI from 2001 to 2018. The weekly NDVI composites were obtained using the seven-day maximum value composite (MVC), and the iHANTS (improved Harmonic Analysis of Time Series) method [49,50] was applied to further remove the influence of clouds in the seven-day NDVI time series.
3.1.4. Land Use and Land Cover Data
In this study, the land use and land cover information derived from the GlobeLand30 land cover dataset (https://shop.geospatial.com/publication/XV1CCGGP7TGJ44PGKT0RJ15V47/GlobeLand30-30-m-Global-Land-Cover, accessed on 1 January 2021, recently released by the National Geomatics Center of China (NGCC)) was used as additional information for the analysis of the historical flash droughts in China. The GlobeLand30 dataset provides land cover mapping at a spatial resolution at 30 m for the years 2000 and 2010, and it has a higher classification accuracy than the MCD12C1 in China [51,52,53]. In this study, the GlobeLand30 land cover dataset was resampled to the same spatial resolution (0.25° × 0.25°) as the GLDAS Noah dataset using the majority resampling method, which calculated the fractions of land cover classes in each 0.25° pixel using the 30 m resolution data and assigned the land cover class according to the maximum fraction of land cover class for that 0.25° pixel.
3.1.5. The Global Aridity Index Database
The Global Aridity Index database provides an annual average figure for the aridity index (AI) for the period 1970–2000, with a spatial resolution of 1 km (https://doi.org/10.6084/m9.figshare.7504448.v5, accessed on 1 January 2021) [54]. The aridity index (AI) was calculated as the ratio of mean annual precipitation to PET based on the Worlclim version 2.1 climatological dataset. In this study, the mean annual AI was resampled to the same spatial resolution (0.25° × 0.25°) as the GLDAS Noah dataset. The climatic zones of China were classified using the AI values according to UNEP [55] classifications: (1) hyper-arid (AI < 0.05), (2) arid zone (0.05 ≤ AI < 0.2), (3) semi-arid zone (0.2 ≤ AI < 0.5), (4) sub-humid zone (0.5 ≤ AI < 0.65), and (5) humid zone (AI ≥ 0.65) (Figure 3a). The areas with an AI below 0.2 were masked for analysis in this study because the climate of these areas is inherently arid or hyper-arid and a flash drought is unlikely to occur.
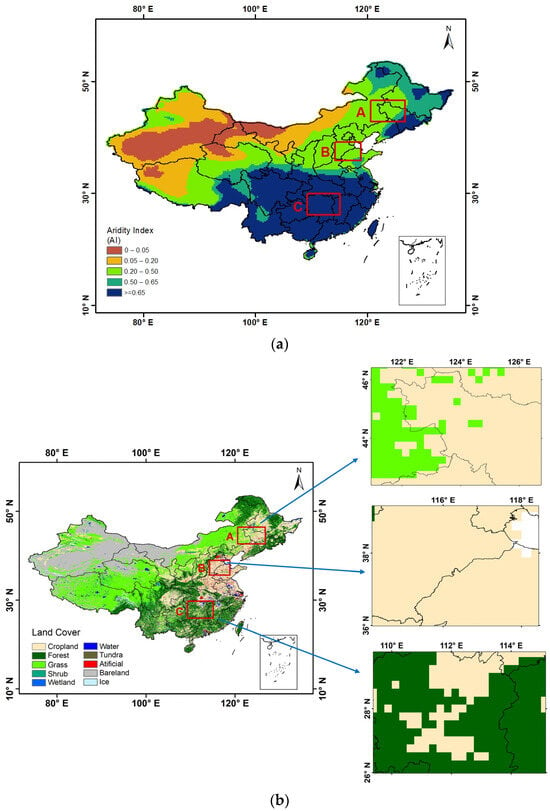
Figure 3.
(a) The spatial distribution of the mean annual aridity index during the period 1979–2018 in China, as derived from the GLDAS global aridity index dataset. (b) The spatial distribution of land use types in China and case study areas (regions A, B and C) (the LULC map is from 2010).
3.2. Study Area
Covering an area of approximately 9.6 million km2, China has a complex topography and climate. To further demonstrate the performance of the ESP for flash drought monitoring, case studies were conducted in China on a regional scale, including western Jilin province (Region A), southern Hebei province (Region B), and northern Hunan province (Region C), as shown in Figure 3b and Table 2. Western Jilin province (Region A) has a sub-humid and semi-arid climate with land use characterized by a mixture of grassland and cropland. Southern Hebei province (Region B) has a semi-arid climate with land cover dominated by cropland. Northern Hunan province (Region C) has a humid climate with land use characterized by a mixture of forest and cropland. These regions were strategically selected owing to their importance for diversity in climate feature and land cover types. Flash droughts occurred in these three regions and caused significant crop yield losses in 2010 in southern Hebei province, in 2013 in northern Hunan province, and in 2015 in western Jilin province. These flash drought events occurred in the growing season but had distinct durations and intensities.

Table 2.
Main climatic and socioeconomic characteristics of the study areas in China.
The frequencies, average durations, and average intensification rates of flash droughts in China during the growing season (March–September) for 1979–2018 were then analyzed using the ESP.
4. Results
4.1. Evaluation of the ESP against SMP
In this section, the weekly ESP and weekly SMP are calculated for the growing season (March–September) for the period 1979–2018 using the GLDAS Noah dataset. Figure 4a,b show the spatial distribution of the correlation coefficients and mean absolute error (MAE) between the weekly ESP and the weekly SMP for the growing season (March–September) for the period 1979–2018 in China, respectively. For most of China, there was good agreement between the ESP and SMP, with correlation coefficient values being above 0.8 and MAE values below the 10.0 percentile/week. This indicates that the ESP has good performance in terms of capturing dry and wet variations during the growing season, which is generally consistent with the SMP. The weaker correlations were mainly distributed in the southwestern part of China, including Qinghai province, northern and eastern parts of the Tibet Autonomous Region, and the western part of Sichuan province.
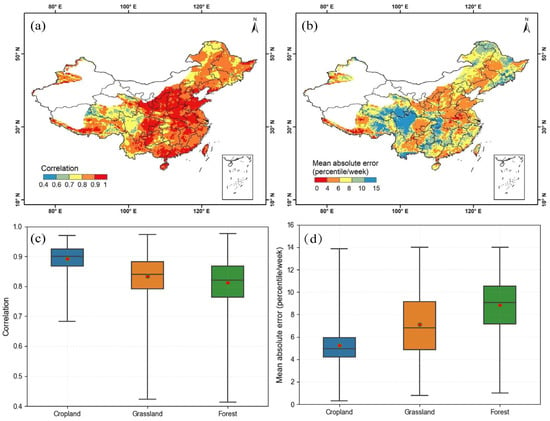
Figure 4.
Spatial patterns of (a) correlation coefficients and (b) mean absolute errors between the weekly ESP and the weekly SMP derived from the GLDAS-Noah dataset for China in the growing season (March–September) during the period 1979–2018 (areas with an annual mean aridity index smaller than 0.2 are masked). The boxplots are (c) correlation coefficients and (d) mean absolute errors between the weekly ESP and SMP for land cover types (cropland, grassland, and forest) in China in the same period (the red dot is the mean value).
Figure 4c,d further show the boxplots of R and MAE between the ESP and the SMP across vegetation types (cropland, grassland, and forest) in China during the growing season (March–September) for the period 1979–2018. On average, the best correlation occurred in cropland (0.89), followed by grassland (0.84) and forest (0.81). The lowest MAE was observed in cropland (5.4 percentile/week), followed by grassland (7.1 percentile/week) and forest (8.8 percentile/week).
Figure 5 shows the mean absolute error (MAE) between the weekly ESP and weekly SMP at different drought severities (as defined in Table 1) during the growing season (March–September) for the period 1979–2018. The MAE between the SMP and ESP decreased with the increase in drought severity. Under extreme and severe drought conditions, the ESP value was close to the SMP value.
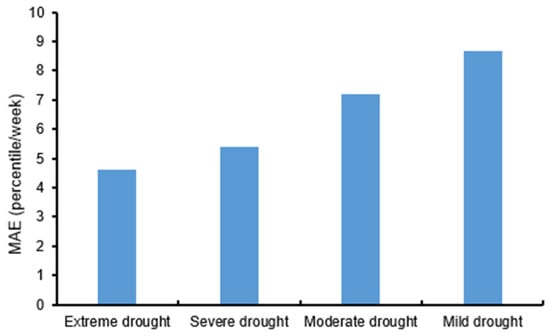
Figure 5.
Mean absolute error (MAE) between the weekly ESP and SMP at different drought severities calculated using the GLDAS-Noah dataset in the growing season (March–September) during the period 1979–2018.
4.2. Performance of the ESP in Monitoring Flash Droughts
In this section, three flash drought events that occurred in three regions of China with different land cover and climatic characteristics were selected as case studies to verify the performance of the developed ESP for flash drought identification and monitoring. The ESP was further evaluated against the other drought indices (PAP, SMP, and NVAI). The weekly PAP was derived from the CMFD precipitation dataset, and the weekly NVAI was calculated using the MODIS NDVI dataset; these datasets were described in Section 3.1.
4.2.1. Identification of Flash Drought Events in Different Climatic Regions in China Using the ESP
Flash droughts that occurred in Hebei province in 2010, Hunan province in 2013, and Jilin province in 2015 were selected as case studies to verify the performance of the ESP for flash drought monitoring against the SMP and PAP. The three flash droughts occurred in different climate regions and varied in their severity and duration.
Figure 6 shows the spatial evolution of a flash drought in Jilin province and the northeastern part of the Inner Mongolia Autonomous Region (Region A in Figure 3b) from 15 April to 6 May 2015. The ESP shows that the drought in this region started on 22 April. On 29 April, the drought intensity increased rapidly, as shown by the SMP and ESP for areas such as most of Jilin province (Figure 6). Subsequently, low values of ESP, SMP, and negative PAP in the most regions of Jilin province indicated that extreme drought developed in Jilin province on 6 May.
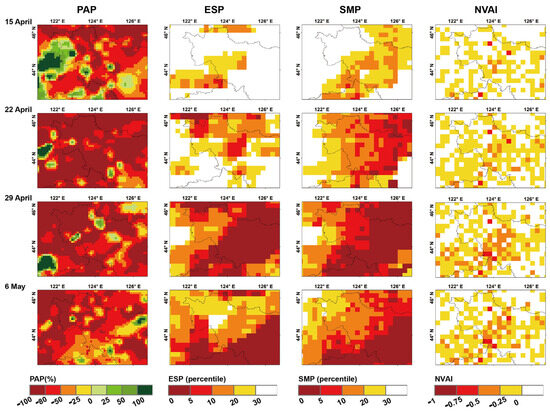
Figure 6.
Spatial distribution of the PAP, ESP, SMP, and NVAI in Jilin province from 15 April to 6 May 2015.
Figure 7 shows the spatial evolution of a flash drought in southern Hebei province (Region B in Figure 3b) from 24 June to 15 July 2010. On 1 July, all indices (the PAP, SMP, and ESP) indicated that the drought had spread to most of southern Hebei province. On July 8, the drought became much more severe. On 15 July, the drought remained in a severe state.
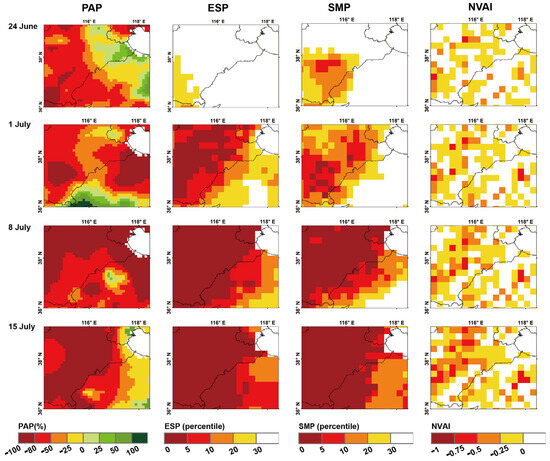
Figure 7.
Spatial patterns of the PAP, ESP, SMP, and NVAI in Hebei province from 24 June to 15 July 2010.
Figure 8 shows the spatial evolution of a flash drought in northern Hunan province (Region C in Figure 3b) from 3 June to 24 June 2013. All the indices indicated that the dry conditions prevailed in most of Hunan and Jiangxi provinces on 10 June. On 17 June, all indices indicated that drought conditions became worse due to significantly below-average rainfall, and on 24 June 2013, abnormally dry conditions extended to all of Hunan and Jiangxi provinces.
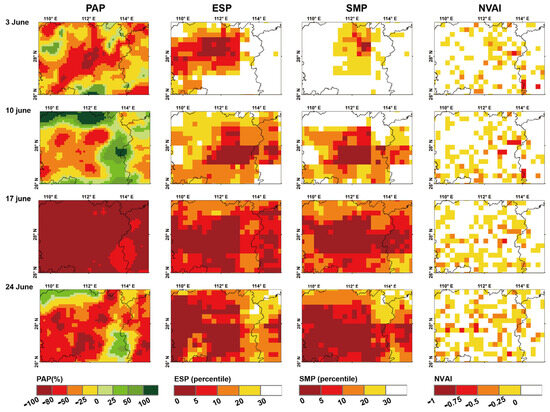
Figure 8.
Spatial patterns of the PAP, ESP, SMP, and NVAI in Hunan province from 3 June to 24 June 2013.
For the three typical flash droughts, the ESP generally shows spatial consistency with the SMP. It was found that the drought affected areas monitored by the ESP, SMP, and PAP were similar, and the change in drought intensity was essentially synchronized. We do not necessarily expect perfect agreement between these indices because antecedent moisture status and different land cover will influence the performances of these indices.
4.2.2. Temporal Evolution and Associated Meteorological Conditions
To better understand the characteristics of flash droughts, the development of the three flash droughts (in 2015 in Jilin, in 2010 in Hebei, and in 2013 in Hunan) was analyzed by plotting the time series of ESP, SMP, and meteorological conditions. Meteorological factors were considered important for driving flash drought onset and influencing the drought’s evolution. The anomalies of meteorological variables every seven-day period, i.e., air temperature, wind speed, vapor pressure deficit (VPD), and downward shortwave radiation, were computed by using the CMFD data to evaluate the atmospheric conditions during the three flash droughts.
The 2015 drought event in Jilin province had a superflash evolution characterized by a rapid decline in the ESP and SMP, and the short course lasted for 28 days (Figure 9a). In two weeks (two 7-day periods), under persistent precipitation deficit, the ESP dropped from about the 70th percentile to below the 20th percentile, with an RI of about 29 percentile/week (Figure 9a, FDOD period). The ESP remained below the 20th percentile for about one week (FDPD period) and then rose again to above the 30th percentile in about one week. The abnormally high shortwave radiation, air temperature, and VPD accompanied the onset of the flash drought and persisted until the end of the drought event (Figure 9b). Such climatic conditions contributed to increased atmospheric water demand, as indicated by high VPD. As a result, the combination of reduced precipitation and enhanced atmospheric demand led to a sharp decline in soil moisture via strong evapotranspiration during the FDOD. The flash drought ended immediately after a series of rainfall events since 13 May.
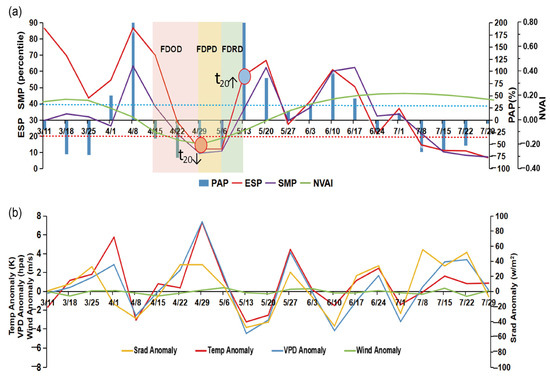
Figure 9.
Drought in western Jilin province in 2015: (a) temporal evolution of the PAP, ESP, SMP, and NVAI; (b) time series of 7-day air temperature, wind speed, VPD, and downward shortwave radiation anomalies.
The 2010 flash drought event in Hebei province occurred during a prolonged slow drought process (Figure 10a). The abnormally high solar radiation and atmospheric water demand stimulated the further rapid decrease in the ESP, with an RI of about 45 percentile/week (Figure 10b). The drought condition persisted for more than 4 weeks, accompanied by moderately high solar radiation and very high atmospheric water demand, and it took about 2 weeks to recover to the normal condition. The duration (63 days), especially the FDPD and FDRD, of the 2010 Hebei flash drought was much longer than that of the 2015 Jilin flash drought, and continuous precipitation events did not immediately alleviate the drought conditions due to a prolonged water deficit that lasted for more than 2 months.
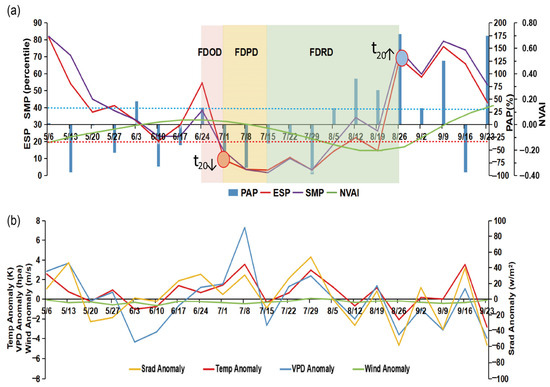
Figure 10.
Drought in southern Hebei province in 2010: (a) temporal evolution of the PAP, ESP, SMP, and NVAI; (b) time series of 7-day anomalies related to air temperature, wind speed, VPD, and downward shortwave radiation.
The 2013 flash drought event in Hunan province was characterized by a longer duration (98 days), a relatively slower onset, and lower intensification (RI of about 11 percentile/week) (Figure 11a). The solar radiation was significantly above the historical mean conditions, primarily contributing to lowering the ESP. In addition to the rainfall deficit, persistent intense solar radiation and very high atmospheric water demand combined to exacerbate drought severity (Figure 11b). In fact, the 2013 Hunan drought began as a flash drought but eventually evolved into a creeping process.
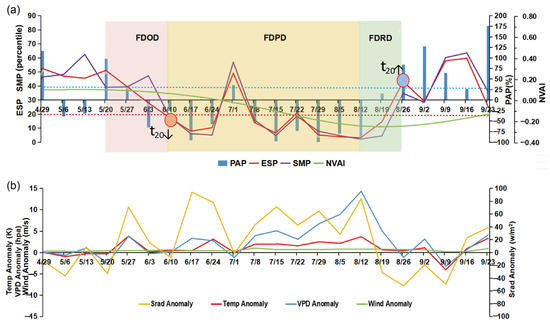
Figure 11.
For drought in northern Hunan province in 2013: (a) temporal evolution of the PAP, ESP, SMP, and NVAI; (b) time series of 7-day anomalies related to air temperature, wind speed, VPD, and downward shortwave radiation.
The three case studies shown above indicate that meteorological conditions could play an important role in the development of flash droughts, which is consistent with the findings of previous studies [21,29]. In general, during the FDOD, the ESP and SMP experienced a rapid decline, which was accompanied by abnormally high air temperature, strong solar radiation, and high VPD. Combined with precipitation shortage, these climatic conditions increased the atmospheric demand for water and resulted in a sharp decline in soil moisture during the FDOD. This phenomenon is consistent with findings from the United States provided by Ford and Labosier [21], where the onset phase of flash drought was closely related to precipitation deficit, strong solar radiation, abnormally high temperatures, and low VPD. It should be noted that the 2010 Hebei flash drought was unique among the three cases, as it was driven by prevailing water deficit (negative precipitation anomaly), stronger solar radiation, high air temperature, and greater atmospheric demand (low VPD) two weeks before the flash drought onset, and such distorted meteorological conditions were further aggravated, leading to flash drought onset with the largest RI among the three cases. Wang and Yuan [56] classified flash drought into two categories according to their different mechanisms: one is high-temperature-driven droughts, thereby causing increased ET, while the other is water-deficit-driven droughts, leading to reduced ET. They found that the second type of flash drought event tends to occur in semi-arid regions such as Northern China. Climatic systems and atmospheric circulation may strongly influence the local meteorological conditions and contribute to flash drought occurrence and development. Yuan, et al. [10] argued that the stable West Pacific Subtropical High (WPSH) shifted the main rain belt to Northern China in the summer of 2013 while creating conditions for drought and heat waves in Southern China. The ESP decreased continuously during the FDPD. Under low-soil-moisture conditions, rising evaporative demand due to the persistence of high solar radiation, high temperature, and high VPD further exacerbated vegetation water stress. Liu, et al. [20] argued that as meteorological conditions persistently deteriorated, the flash drought might evolve into a more prolonged drought, which is similar to the case of the 2013 Hunan flash drought that eventually evolved into a long-term drought under persistent meteorological anomalies. During the FDRD, the decreases in air temperature and solar radiation, along with a decrease in VPD, reduced atmospheric evaporation demand, thereby minimizing soil moisture loss. It is undeniable that the arrival of rainfall is the main factor in alleviating drought conditions. However, the recovery of other meteorological conditions also contributed to mitigating the impacts of flash droughts. We found that there were no strong winds during the FDOD during the 2010 Hebei and 2013 Hunan flash drought events, contrary to previous findings [16]. This study found that wind was not strongly associated with flash drought development, which is in accordance with the results of Li, et al. [26].
In addition to the meteorological conditions that dominated the development of flash drought, land cover types also played a role. With a similar course of precipitation deficit for the 2010 Hebei and 2013 Hunan drought events, the 2010 Hebei drought had a more rapid onset than the 2013 Hunan drought event, which may be attributed to the fact that forest (the Hunan case) is more drought-resistant than crops (Hebei case).
4.3. Comparison with the Vegetation Index-Based Drought Index
As mentioned in Otkin et al. [23], vegetation indices are less able to detect incipient plant stress in the early stages of drought development because the signal becomes strong after significant damage to the vegetation has already occurred. This is also evident in our cases. As with many drought indices based on remotely sensed observations of greenness, the NVAI derived from remote sensing NDVI data was used to analyze the impact of drought on vegetation health [43,57]. Based on the spatial distribution maps (Figure 6, Figure 7 and Figure 8), the magnitude of negative NVAI and its spatial spread areas are much smaller during the earlier stages of droughts compared to the ESP for all three flash drought cases. The lower negative values of NVAI (i.e., greater drought impact on vegetation health) appeared at a much later stage but in fewer areas.
In the 2010 Hebei flash drought, the time series showed that that the ESP fell below the 20th percentile (the week of 1 July, drought onset) about 2 weeks before the NVAI became negative (Figure 9). The lowest NVAI indicates the most severe impact of the flash drought on the vegetation health condition, which occurred in the week of 12 August and, for 6 weeks, lagged the onset of the flash drought. In the case of the 2013 Hunan drought, the ESP decreased to below the 20th percentile within three weeks (onset on the week of 10 June), while the NVAI took 3 weeks to decrease to a negative value and 8 weeks to reach the worst condition (see Figure 10). These two cases indicate that the vegetation index-based drought indicator expressed by the NVAI usually has a time lag in response to the flash drought identified by the ESP. In the case of the 2015 Jilin flash drought, the vegetation responded quickly. This is because the vegetation was affected by the preceding drought before the flash drought started in the week of 29 April.
4.4. Analysis of Historical Flash Droughts in China Using an ESP-Based Approach
In this section, the new flash drought identification method developed in Section 2.1, based on the evaporative stress percentile (ESP) calculated using GLDAS-Noah dataset, was applied to analyze the characteristics (frequency, duration, and the rate of intensification) of historical flash droughts in China in the growing season (March–September) during the period 1979–2018. The specific calculation method for the frequency, duration, and rate of intensification of historical flash droughts was described in Section 2.2.
The frequency of flash droughts in China during March–September for the period 1979–2018 generally varied between 2 and 8 events per decade (Figure 12a). Spatially, flash droughts were most likely to occur in the transitional climate zone (TCZ) between humid and arid regions in Northern China, including southern Ningxia, northern Shaanxi, Shanxi, the middle eastern part of Inner Mongolia, and northern Hebei, which is consistent with previous studies carried out using SMP [11,20]. The TCZ in Northern China is highly sensitive to climate change and is a disaster-prone region, particularly in terms of drought. These regions have been identified by several studies as a hotspot for land–atmosphere coupling [58,59]. Previous studies have demonstrated that strong land–atmosphere coupling contributes to triggering the onset of flash droughts [12,24,29,60]. Under strong land–atmosphere coupling, strong sensible heat flux inhibits convective precipitation by heating the atmospheric boundary layer, which contributes to water deficit during the onset of flash droughts [60]. Meanwhile, an elevated vapor pressure deficit (VPD) accelerates the evaporation of water from the soil and vegetation, further exacerbating soil moisture loss [12]. These factors increase the likelihood of flash droughts being triggered. Several areas in the humid regions of Eastern and Southern China, including Jiangsu, Zhejiang, Fujian, Guangdong, Guangxi, Guizhou, Chongqing, and Taiwan provinces, also experienced a high frequency of flash droughts. Previous studies have proven that flash droughts tend to occur in humid regions [12,29,61]. The forested areas in northeastern Heilongjiang province and the eastern and western areas of the Tibetan Plateau are less affected by flash droughts.
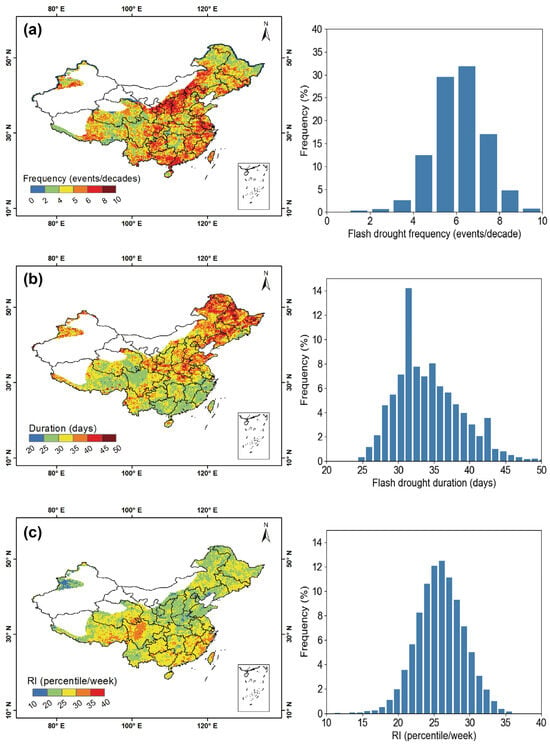
Figure 12.
Spatial distribution and histogram of the (a) frequency, (b) mean duration, and (c) mean rate of intensification (RI) of flash droughts in China based on GLDAS-Noah data during March–September for the period 1979–2018. Note: white-colored areas are regions with AI below 0.2, which were not included in this analysis.
The durations of flash droughts in China during March–September for the period 1979–2018 range from 25 to 50 days (Figure 12b), which is consistent with previous findings based on soil moisture information [22]. Prolonged flash droughts occurred in Northeastern China (Heilongjiang, Jilin, Liaoning, and eastern Inner Mongolia) and Shanxi, Shandong, and Henan provinces, which are also the country’s major agricultural regions. Although Southern China experienced more frequent flash droughts (Figure 12a), the drought persistence time is short (Figure 12b). The reason for this spatial pattern is discussed in detail in the next paragraph.
The average RI of flash droughts in China during March–September for the period 1979–2018 ranges from 15 to 35 percentile/week (Figure 12c). Higher RIs (up to the 25th percentile/week) were concentrated in the southern part of China and the east of the Qinghai–Tibet Plateau), which is consistent with the findings of Zhang, et al. [62]. In general, the southern part of China has a higher rate of intensification (RI) and shorter average duration of flash droughts of about 20–30 days (Figure 12b,c). In Southern China, which usually has dense vegetation and sufficient soil moisture, plants tend to rapidly extract water from the soil when flash drought starts, accompanied by strong solar radiation, high air temperature and high atmospheric water demand, often causing a rapid increase in ET in a short time. With the development of the drought, soil moisture decreased dramatically due to strong evapotranspiration, resulting in a sharp decrease in the ESP and a strong rate of intensification. Although most forested areas in Northeastern China experienced fewer flash drought events (i.e., 2 to 4 events/decade), these regions have longer average durations and weaker rates of intensification (Figure 12b,c). In forested regions, such as the Lesser Khingan Mountains and Greater Khingan Mountains in Northeastern China, deeper root zones can access more soil moisture in deep soil layers, thus preventing rapid increases in evaporative stress in a short period of time.
In summary, we found that flash droughts in China have regional variations in frequency, duration, and intensity, with land–atmosphere coupling and vegetation playing roles in their development [63,64]. Land–atmosphere coupling contributes to triggering the onset of flash droughts, and vegetation type influences their intensity and duration in different regions in China.
5. Discussion
5.1. Advantages of Using an ESP-Based Approach
In general, the ESP-based approach proposed in this study to identify the onset, duration, and rate of intensification of flash droughts has the following advantages. Firstly, the ESP is closely related to the soil water availability and the impact of drought on vegetation. The ESP focuses on the relative position of the evaporative stress ratio within the historical distribution by comparing the value of the evaporative stress ratio with the historical records for the same location and period. Therefore, the ESP provides an objective and consistent method for assessing drought conditions, regardless of geographic location and climatic characteristics. We selected Region B from the semi-arid climate region and Region C from the humid region (see Figure 3a for the location) to calculate the probability distribution of the ESR. Figure 13 shows the cumulative distribution function of the ESR on the DOY197 based on the GLDAS-Noah dataset for the period from 1978 to 2018 in (i) Region B in the semi-arid zone and (ii) Region C in the humid zone. The ESP was calculated using the cumulative distribution function of the ESR. We found that the absolute values and cumulative probability distribution of the ESR are significantly different in these two climate zones, but the ESP based on a percentile approach can provide an objective and consistent drought assessment for different climate zones, clearly classifying droughts into four categories (mild drought, moderate drought, severe drought, and extreme drought) (Figure 13) [3,24,28]. The percentile thresholds remain the same, regardless of regional variations, contributing to a more robust and comparable assessment of drought conditions across regions.
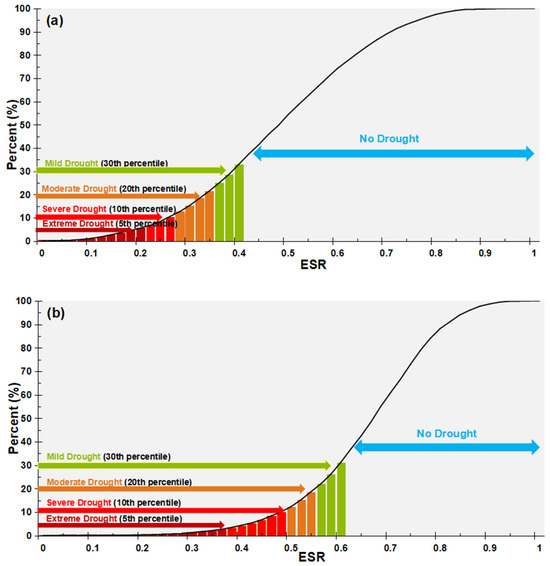
Figure 13.
The cumulative distribution function of ESR on the DOY 197 based on the GLDAS-Noah dataset for the period from 1978 to 2018 in (a) Region B in the semi-arid zone and (b) Region C in the humid zone. The exact locations of Region B and Region C are outlined in Figure 3b.
Secondly, this study clearly defines the onset, duration, and recovery phases of flash droughts based on the ESP criteria (see Figure 2). Previous ET-based indices (such as SESR and EDDI) only emphasized the rapid development phase of flash droughts but ignored the persistence and recovery phases of flash droughts [24,28,65,66]. The persistence and recovery phases of flash droughts should be considered because they have a significant impact on ecosystems [41,67]. In addition, the SMP-based method considers the flash drought to end when the SMP value rises above the 20th percentile (see Figure 14a). In this study, we defined the flash drought as ending when two criteria are met: (i) the ESP value rises above the 20th percentile; (ii) the condition above the 20th percentile persists for at least two weeks (see Figure 14b). These new criteria and definitions are more reasonable, as they ensure that the flash drought is fully mitigated, and, therefore, more conducive to quantitatively assessing the duration and intensity of flash droughts.
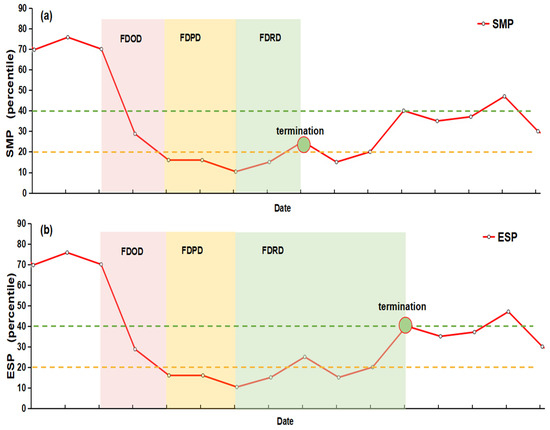
Figure 14.
Illustration of the identification of flash drought termination using different criteria: (a) results from a previous study using only the criterion of the SMP above the 20th percentile SMP; (b) results from this study when using two criteria (i.e., an ESP above the 20th percentile and persisting for at least two weeks).
Finally, the ESP is an appropriate alternative to SMP for monitoring flash droughts. The SMP based on root-zone soil moisture is a method commonly used to monitor flash drought [12,14,19,39]. However, the widely used satellite observations can only provide near-surface soil moisture retrievals. This means that we cannot directly obtain soil moisture at deeper depths from satellite observations. Although the land surface process models (LPMs) can simulate soil moisture at different soil depths, they typically have a spatial resolution of 25 km for regional and global studies, which may be too coarse to capture the detailed spatial variability in water stress conditions. With advances in satellite observations, higher spatial resolution (e.g., 1 km) evapotranspiration (ET) datasets are available for the ESP calculation. Compared to land surface process model datasets, which usually have coarser spatial resolutions, satellite-based ET products can provide more detailed and accurate information about water stress. For example, ETMonitor, a process-based model driven by multiple satellite datasets, provides the daily AET and PET at moderate spatial resolutions (1 km) [32,33,68], which can be used to calculate the ESP at a 1 km resolution for flash drought monitoring in further research.
5.2. Uncertainty and Limitations of the Current Study
There are some uncertainty issues that deserve further discussion. In Section 4.1, we examined the R and MAE between the ESP and the SMP between vegetation types (cropland, grassland, and forest). It was found that the best correlation occurred in cropland, followed by grassland and forest. The lowest MAE was observed in cropland, followed by grassland and forest. In fact, evapotranspiration and soil moisture represent different processes in the water cycle. When soil moisture is low, plants tend to close their stomata to prevent water loss, thereby reducing transpiration. A lack of water availability, i.e., lower soil moisture, will reduce the soil evaporation and plant transpiration. Therefore, evapotranspiration and soil moisture have a close relationship and influence each other. However, the relationship between evapotranspiration and soil moisture is also influenced by factors such as vegetation type, soil type, and topography [69]. Different vegetation types have different physiological characteristics and ecological functions [70,71]. A stronger relationship between the ESP and SMP in croplands may be due to the fact that crops generally have shallow root systems and are more susceptible to soil moisture stress, resulting in reduced evapotranspiration when soil water content is low in the shallow soil layers. Forests typically have deep roots (deeper than 40 cm) that absorb water from deeper soil layers and maintain high evaporation rates even if shallow soil layers are dry during drought. It should be noted that we used the top 40 cm of the soil moisture to calculate the SMP for ESP evaluation. However, some plants, especially those in forests, may have root depths deeper than 40 cm, which introduces a degree of uncertainty when using SMP as a reference to assess the ESP.
Although percentile-based methods have proven useful for drought monitoring, an important limitation is that they require a sufficiently long data record to represent the statistical distribution. In addition, the thresholds (20th percentile, 40th percentile) used in the proposed method were determined according to a previous work based on SMP for flash drought identification. The number of drought events identified using these thresholds may be overestimated in some regions where droughts have rarely occurred in the past. Li, et al. [72] pointed out that a globally uniform quantitative definition of drought thresholds based on soil moisture percentiles alone may not be sufficient. Drought thresholds may differ for different fractions of forest cover. Future research should investigate the sensitivity of the ESP thresholds in different regions to flash drought detection. In addition, it should be noted that we used the top 40 cm of soil moisture for calculating the SMP to evaluate the ESP. However, some plants may have root depths deeper than 40 cm, which introduces a degree of uncertainty when using the SMP as a reference to assess the ESP.
Another factor is that in this study, only the reanalysis dataset (GLDASv2.0/2.1) was used to track flash droughts. Although the SM and ET data from the GLDAS-Noah datasets have been shown to be reliable in many regions of China, there may still be some uncertainties in the estimates of SM and ET due to the systematic errors in the model output [45,69]. Yuan, et al. [14] investigated the global frequency of historical flash droughts based on the average results derived from several reanalysis datasets, including ERA5, GLDASv2.0/Noah, and GLDASv2.0/Catchment, to reduce the errors.
6. Conclusions
This study develops a new flash drought identification method based on the evaporative stress percentile (ESP), which explicitly considers both the rate of rapid intensification and each phase of flash droughts to quantitatively assess the characteristics of flash droughts. The ability of the ESP to identify and monitor flash droughts is evaluated via comparison with the commonly adopted methods such as the SMP, PAP, and NVAI. The spatiotemporal characteristics of historical flash droughts in China are also analyzed in detail by using the ESP-based method based on the GLDAS-Noah dataset during March–September for 1979–2018. The main conclusions of this study are as follows:
- (1)
- The ESP has a good performance in terms of capturing dry and wet variations across most of China during the growing season, which is in good agreement with the SMP. A weaker correlation is also found in some regions, such as high-altitude cold regions and forest regions.
- (2)
- Case studies successfully demonstrated the robustness of the ESP-based method for identifying flash drought events and monitoring their temporal evolution across different geographic regions, land cover types, and climate regimes. It also indicates that in addition to the precipitation deficit, other meteorological conditions, such as solar radiation, air temperature, and atmospheric water demand, play significant roles in the evolution of flash droughts. The response of the land surface to the drought is also relevant to the land cover types. Wind was not strongly associated with flash droughts.
- (3)
- By applying the ESP-based approach, the spatial distributions of the frequency, duration, and rate of intensification of historical flash droughts in China for 1979–2018 were analyzed, and the results showed that flash droughts occurred 2 to 8 times per decade and were most frequent in the transitional climate zone between humid and arid regions in Northern China. The duration of flash droughts in China for 1979–2018 ranged from 25 to 50 days, and the average rate of intensification ranged from 15 to 35 percentile/week. Forested areas experienced fewer flash droughts (i.e., 2~4 events/decade), longer average durations, and weaker rates of intensification than croplands, suggesting that forests are generally more resilient to drought.
The flash drought identification methodology presented in this study has the potential to make a significant contribution to the field of flash drought identification and monitoring. Future research will focus on the improvement and validation of the ESP method, the application of ESP derived from remote sensing ET data at higher spatial resolutions, and the exploration and quantification of the impacts and drivers of flash droughts. Attention will also be given to the development of flash drought early warning systems. Timely information and enhanced stakeholder engagement and communication can improve awareness of and preparedness for flash droughts, so that adaptation and mitigation strategies can be put in place in time to improve flash drought risk management.
Author Contributions
Conceptualization, P.L. and L.J.; methodology, P.L., L.J., J.L. and M.J.; validation, P.L., L.J., J.L. and M.J.; investigation, P.L., L.J., J.L. and M.J.; data curation, P.L., L.J. and C.Z.; writing—original draft preparation, P.L.; writing—review and editing, P.L., L.J., J.L., M.J. and C.Z.; visualization, P.L. and L.J.; supervision, L.J., J.L., M.J. and C.Z.; project administration, L.J.; funding acquisition, L.J. All authors have read and agreed to the published version of the manuscript.
Funding
This work was jointly supported by projects funded by the Open Research Program of the International Research Center of Big Data for Sustainable Development Goals (Grant No. CBAS2023ORP05), the Key Collaborative Research Program of the Alliance of International Science Organizations (Grant No. ANSO-CR-KP-2022-02), and the National Natural Science Foundation of China (NSFC) (Grant No. 42171039, 42271394).
Data Availability Statement
Data are available on request from the authors.
Conflicts of Interest
The authors declare no conflicts of interest.
References
- Mishra, V.; Aadhar, S.; Mahto, S.S. Anthropogenic warming and intraseasonal summer monsoon variability amplify the risk of future flash droughts in India. NPJ Clim. Atmos. Sci. 2021, 4, 1. [Google Scholar] [CrossRef]
- Wang, L.; Yuan, X.; Xie, Z.; Wu, P.; Li, Y. Increasing flash droughts over China during the recent global warming hiatus. Sci. Rep. 2016, 6, 30571. [Google Scholar] [CrossRef] [PubMed]
- Svoboda, M.; LeComte, D.; Hayes, M.; Heim, R.; Gleason, K.; Angel, J.; Rippey, B.; Tinker, R.; Palecki, M.; Stooksbury, D.; et al. The Drought Monitor. Bull. Am. Meteorol. Soc. 2002, 83, 1181–1190. [Google Scholar] [CrossRef]
- Koster, R.D.; Schubert, S.D.; Wang, H.; Mahanama, S.P.; DeAngelis, A.M. Flash Drought as Captured by Reanalysis Data: Disentangling the Contributions of Precipitation Deficit and Excess Evapotranspiration. J. Hydrometeorol. 2019, 20, 1241–1258. [Google Scholar] [CrossRef]
- Nguyen, H.; Wheeler, M.C.; Otkin, J.A.; Cowan, T.; Frost, A.; Stone, R. Using the evaporative stress index to monitor flash drought in Australia. Environ. Res. Lett. 2019, 14, 064016. [Google Scholar] [CrossRef]
- Otkin, J.A.; Svoboda, M.; Hunt, E.D.; Ford, T.W.; Andersoson, M.C.; Hain, C.; Basara, J.B. FLASH DROUGHTS A Review and Assessment of the Challenges Imposed by Rapid-Onset Droughts in the United States. Bull. Am. Meteorol. Soc. 2018, 99, 911–919. [Google Scholar] [CrossRef]
- Anderson, M.C.; Zolin, C.A.; Sentelhas, P.C.; Hain, C.R.; Semmens, K.; Yilmaz, M.T.; Gao, F.; Otkin, J.A.; Tetrault, R. The Evaporative Stress Index as an indicator of agricultural drought in Brazil: An assessment based on crop yield impacts. Remote Sens. Environ. 2016, 174, 82–99. [Google Scholar] [CrossRef]
- Mo, K.C.; Lettenmaier, D.P. Precipitation Deficit Flash Droughts over the United States. J. Hydrometeorol. 2016, 17, 1169–1184. [Google Scholar] [CrossRef]
- Zhang, Q.; Yao, Y.B.; Li, Y.H.; Huang, J.P.; Ma, Z.G.; Wang, Z.L.; Wang, S.P.; Wang, Y.; Zhang, Y. Causes and Changes of Drought in China: Research Progress and Prospects. J. Meteorol. Res. 2020, 34, 460–481. [Google Scholar] [CrossRef]
- Yuan, X.; Ma, Z.G.; Pan, M.; Shi, C.X. Microwave remote sensing of short-term droughts during crop growing seasons. Geophys. Res. Lett. 2015, 42, 4394–4401. [Google Scholar] [CrossRef]
- Zhang, S.Y.; Li, M.X.; Ma, Z.G.; Jian, D.N.; Lv, M.X.; Yang, Q.; Duan, Y.W.; Amin, D. The intensification of flash droughts across China from 1981 to 2021. Clim. Dyn. 2023, 62, 1233–1247. [Google Scholar] [CrossRef]
- Qing, Y.; Wang, S.; Ancell, B.C.; Yang, Z.-L. Accelerating flash droughts induced by the joint influence of soil moisture depletion and atmospheric aridity. Nat. Commun. 2022, 13, 1139. [Google Scholar] [CrossRef]
- Fu, K.Q.; Wang, K.C. Quantifying Flash Droughts Over China From 1980 to 2017. J. Geophys. Res. Atmos. 2022, 127, e2022JD037152. [Google Scholar] [CrossRef]
- Yuan, X.; Wang, Y.M.; Ji, P.; Wu, P.L.; Sheffield, J.; Otkin, J.A. A global transition to flash droughts under climate change. Science 2023, 380, 187–191. [Google Scholar] [CrossRef] [PubMed]
- Wang, Y.M.; Yuan, X. Anthropogenic Speeding Up of South China Flash Droughts as Exemplified by the 2019 Summer-Autumn Transition Season. Geophys. Res. Lett. 2021, 48, e2020GL091901. [Google Scholar] [CrossRef]
- Otkin, J.A.; Anderson, M.C.; Hain, C.; Mladenova, I.E.; Basara, J.B.; Svoboda, M. Examining Rapid Onset Drought Development Using the Thermal Infrared-Based Evaporative Stress Index. J. Hydrometeorol. 2013, 14, 1057–1074. [Google Scholar] [CrossRef]
- Mahto, S.S.; Mishra, V. Dominance of summer monsoon flash droughts in India. Environ. Res. Lett. 2020, 15, 104061. [Google Scholar] [CrossRef]
- Ford, T.W.; McRoberts, D.B.; Quiring, S.M.; Hall, R.E. On the utility of in situ soil moisture observations for flash drought early warning in Oklahoma, USA. Geophys. Res. Lett. 2015, 42, 9790–9798. [Google Scholar] [CrossRef]
- Liu, Y.; Zhu, Y.; Ren, L.L.; Otkin, J.; Hunt, E.D.; Yang, X.L.; Yuan, F.; Jiang, S.H. Two Different Methods for Flash Drought Identification: Comparison of Their Strengths and Limitations. J. Hydrometeorol. 2020, 21, 691–704. [Google Scholar] [CrossRef]
- Liu, Y.; Zhu, Y.; Zhang, L.; Ren, L.; Yuan, F.; Yang, X.; Jiang, S. Flash droughts characterization over China: From a perspective of the rapid intensification rate. Sci. Total Environ. 2020, 704, 135373. [Google Scholar] [CrossRef] [PubMed]
- Ford, T.W.; Labosier, C.F. Meteorological conditions associated with the onset of flash drought in the Eastern United States. Agric. For. Meteorol. 2017, 247, 414–423. [Google Scholar] [CrossRef]
- Yuan, X.; Wang, L.; Wu, P.; Ji, P.; Sheffield, J.; Zhang, M. Anthropogenic shift towards higher risk of flash drought over China. Nat. Commun. 2019, 10, 4661. [Google Scholar] [CrossRef] [PubMed]
- Otkin, J.A.; Zhong, Y.F.; Hunt, E.D.; Christian, J.I.; Basara, J.B.; Nguyen, H.; Wheeler, M.C.; Ford, T.W.; Hoell, A.; Svoboda, M.; et al. Development of a Flash Drought Intensity Index. Atmosphere 2021, 12, 741. [Google Scholar] [CrossRef]
- Christian, J.I.; Basara, J.B.; Otkin, J.A.; Hunt, E.D.; Wakefield, R.A.; Flanagan, P.X.; Xiao, X.M. A Methodology for Flash Drought Identification: Application of Flash Drought Frequency across the United States. J. Hydrometeorol. 2019, 20, 833–846. [Google Scholar] [CrossRef]
- Otkin, J.A.; Anderson, M.C.; Hain, C.; Svoboda, M. Examining the Relationship between Drought Development and Rapid Changes in the Evaporative Stress Index. J. Hydrometeorol. 2014, 15, 938–956. [Google Scholar] [CrossRef]
- Li, J.; Wang, Z.L.; Wu, X.S.; Chen, J.; Guo, S.L.; Zhang, Z.X. A new framework for tracking flash drought events in space and time. Catena 2020, 194, 104763. [Google Scholar] [CrossRef]
- Li, J.; Wang, Z.L.; Wu, X.S.; Xu, C.Y.; Guo, S.L.; Chen, X.H. Toward Monitoring Short-Term Droughts Using a Novel Daily Scale, Standardized Antecedent Precipitation Evapotranspiration Index. J. Hydrometeorol. 2020, 21, 891–908. [Google Scholar] [CrossRef]
- Christian, J.I.; Basara, J.B.; Otkin, J.A.; Hunt, E.D. Regional characteristics of flash droughts across the United States. Environ. Res. Commun. 2019, 1, 125004. [Google Scholar] [CrossRef]
- Christian, J.I.; Basara, J.B.; Hunt, E.D.; Otkin, J.A.; Furtado, J.C.; Mishra, V.; Xiao, X.; Randall, R.M. Global distribution, trends, and drivers of flash drought occurrence. Nat. Commun. 2021, 12, 6330. [Google Scholar] [CrossRef]
- Pendergrass, A.G.; Meehl, G.A.; Pulwarty, R.; Hobbins, M.; Hoell, A.; AghaKouchak, A.; Bonfils, C.J.W.; Gallant, A.J.E.; Hoerling, M.; Hoffmann, D.; et al. Flash droughts present a new challenge for subseasonal-to-seasonal prediction. Nat. Clim. Chang. 2020, 10, 191–199. [Google Scholar] [CrossRef]
- Anderson, M.C.; Norman, J.M.; Mecikalski, J.R.; Otkin, J.A.; Kustas, W.P. A climatological study of evapotranspiration and moisture stress across the continental United States based on thermal remote sensing: 1. Model formulation. J. Geophys. Res. Atmos. 2007, 112, D10117. [Google Scholar] [CrossRef]
- Zheng, C.L.; Jia, L.; Hu, G.C. Global land surface evapotranspiration monitoring by ETMonitor model driven by multi-source satellite earth observations. J. Hydrol. 2022, 613, 128444. [Google Scholar] [CrossRef]
- Hu, G.C.; Jia, L. Monitoring of Evapotranspiration in a Semi-Arid Inland River Basin by Combining Microwave and Optical Remote Sensing Observations. Remote Sens. 2015, 7, 3056–3087. [Google Scholar] [CrossRef]
- Mu, Q.Z.; Zhao, M.S.; Running, S.W. Improvements to a MODIS global terrestrial evapotranspiration algorithm. Remote Sens. Environ. 2011, 115, 1781–1800. [Google Scholar] [CrossRef]
- Gou, Q.; Zhu, Y.; Lü, H.; Horton, R.; Yu, X.; Zhang, H.; Wang, X.; Su, J.; Liu, E.; Ding, Z.; et al. Application of an improved spatio-temporal identification method of flash droughts. J. Hydrol. 2022, 604, 127224. [Google Scholar] [CrossRef]
- McEvoy, D.J.; Huntington, J.L.; Hobbins, M.T.; Wood, A.; Morton, C.; Anderson, M.; Hain, C. The Evaporative Demand Drought Index. Part II: CONUS-Wide Assessment against Common Drought Indicators. J. Hydrometeorol. 2016, 17, 1763–1779. [Google Scholar] [CrossRef]
- Basara, J.B.; Christian, J.I.; Wakefield, R.A.; Otkin, J.A.; Hunt, E.H.; Brown, D.P. The evolution, propagation, and spread of flash drought in the Central United States during 2012. Environ. Res. Lett. 2019, 14, 084025. [Google Scholar] [CrossRef]
- Miralles, D.G.; Gentine, P.; Seneviratne, S.I.; Teuling, A.J. Land-atmospheric feedbacks during droughts and heatwaves: State of the science and current challenges. Ann. N. Y. Acad. Sci. 2019, 1436, 19–35. [Google Scholar] [CrossRef]
- Osman, M.; Zaitchik, B.F.; Badr, H.S.; Christian, J.I.; Tadesse, T.; Otkin, J.A.; Anderson, M.C. Flash drought onset over the contiguous United States: Sensitivity of inventories and trends to quantitative definitions. Hydrol. Earth Syst. Sci. 2021, 25, 565–581. [Google Scholar] [CrossRef]
- Zhang, M.; Yuan, X. Rapid reduction in ecosystem productivity caused by flash droughts based on decade-long FLUXNET observations. Hydrol. Earth Syst. Sci. 2020, 24, 5579–5593. [Google Scholar] [CrossRef]
- Zhang, M.; Yuan, X.; Otkin, J.A. Remote sensing of the impact of flash drought events on terrestrial carbon dynamics over China. Carbon Balance Manag. 2020, 15, 20. [Google Scholar] [CrossRef] [PubMed]
- Hu, C.; Xia, J.; She, D.X.; Li, L.C.; Song, Z.H.; Hong, S. A new framework for the identification of flash drought: Multivariable and probabilistic statistic perspectives Identification of flash drought. Int. J. Clim. Climatol. 2021, 41, 5862–5878. [Google Scholar] [CrossRef]
- Jia, L.; Hu, G.; Zhou, J.; Menenti, M. Assessing the sensitivity of two new indicators of vegetation response to water availability for drought monitoring. In Land Surface Remote Sensing; SPIE: St. Bellingham, WA, USA, 2012; pp. 192–206. [Google Scholar]
- Rodell, M.; Houser, P.R.; Jambor, U.; Gottschalck, J.; Mitchell, K.; Meng, C.J.; Arsenault, K.; Cosgrove, B.; Radakovich, J.; Bosilovich, M.; et al. The global land data assimilation system. Bull. Am. Meteorol. Soc. 2004, 85, 381–394. [Google Scholar] [CrossRef]
- Gong, Z.H.; Zhu, J.; Li, T.T.; Huang, D.Q.; Chen, X.Y.; Zhang, Q. The features of regional flash droughts in four typical areas over China and the possible mechanisms. Sci. Total Environ. 2022, 827, 154217. [Google Scholar] [CrossRef] [PubMed]
- Reichle, R.H.; Koster, R.D. Bias reduction in short records of satellite soil moisture. Geophys. Res. Lett. 2004, 31, L19501. [Google Scholar] [CrossRef]
- He, J.; Yang, K.; Tang, W.; Lu, H.; Qin, J.; Chen, Y.; Li, X. The first high-resolution meteorological forcing dataset for land process studies over China. Sci. Data 2020, 7, 25. [Google Scholar] [CrossRef] [PubMed]
- Chen, Y.Y.; Yang, K.; He, J.; Qin, J.; Shi, J.C.; Du, J.Y.; He, Q. Improving land surface temperature modeling for dry land of China. J. Geophys. Res. Atmos. 2011, 116, D20104. [Google Scholar] [CrossRef]
- Zhou, J.; Jia, L.; Menenti, M. Reconstruction of global MODIS NDVI time series: Performance of Harmonic Analysis of Time Series (HANTS). Remote Sens. Environ. 2015, 163, 217–228. [Google Scholar] [CrossRef]
- Zhou, J.; Menenti, M.; Jia, L.; Gao, B.; Zhao, F.; Cui, Y.L.; Xiong, X.Q.; Liu, X.; Li, D.C. A scalable software package for time series reconstruction of remote sensing datasets on the Google Earth Engine platform. Int. J. Digit. Earth 2023, 16, 988–1007. [Google Scholar] [CrossRef]
- Chen, J.; Chen, L.J.; Chen, F.; Ban, Y.F.; Li, S.N.A.; Han, G.; Tong, X.H.; Liu, C.; Stamenova, V.; Stamenov, S. Collaborative validation of GlobeLand30: Methodology and practices. Geo-Spat. Inf. Sci. 2021, 24, 134–144. [Google Scholar] [CrossRef]
- Jingzhen, M.A.; Sun, Q.; Qiang, X.I.O. Accuracy Assessment and Comparative Analysis of GlobeLand30 Dataset in Henan Province. J. Geo-Inf. Sci. 2016, 18, 1563–1572. [Google Scholar]
- Cai, L.P.; Wang, S.S.; Jia, L.Z.; Wang, Y.J.; Wang, H.; Fan, D.L.; Zhao, L. Consistency Assessments of the Land Cover Products on the Tibetan Plateau. IEEE J. Sel. Top. Appl. Earth Obs. Remote Sens. 2022, 15, 5652–5661. [Google Scholar] [CrossRef]
- Zomer, R.J.; Xu, J.C.; Trabucco, A. Version 3 of the Global Aridity Index and Potential Evapotranspiration Database. Sci. Data 2022, 9, 409. [Google Scholar] [CrossRef] [PubMed]
- UNEP. World Atlas of Desertification; Edward Arnold: Sevenoaks, UK, 1992; p. 69. [Google Scholar]
- Wang, L.Y.; Yuan, X. Two Types of Flash Drought and Their Connections with Seasonal Drought. Adv. Atmos. Sci. 2018, 35, 1478–1490. [Google Scholar] [CrossRef]
- van Hoek, M.; Zhou, J.; Jia, L.; Lu, J.; Zheng, C.L.; Hu, G.C.; Menenti, M. A prototype web-based analysis platform for drought monitoring and early warning. Int. J. Digit. Earth 2020, 13, 817–831. [Google Scholar] [CrossRef]
- Li, M.X.; Ma, Z.G.; Gu, H.P.; Yang, Q.; Zheng, Z.Y. Production of a combined land surface data set and its use to assess land-atmosphere coupling in China. J. Geophys. Res. Atmos. 2017, 122, 948–965. [Google Scholar] [CrossRef]
- Zhang, Q.; Yue, P.; Zhang, L.; Wang, S.; Zhang, J.; Zhao, J.H.; Wang, R.Y.; Yang, F.L. Land-atmosphere interaction over the summer monsoon transition zone in China: A review and prospects. Acta Meteorol. Sin. 2019, 77, 758–773. [Google Scholar] [CrossRef]
- Wang, Y.M.; Yuan, X. Land-atmosphere coupling speeds up flash drought onset. Sci. Total Environ. 2022, 851, 158109. [Google Scholar] [CrossRef]
- Zhang, Y.Q.; You, Q.L.; Chen, C.C.; Li, X. Flash droughts in a typical humid and subtropical basin: A case study in the Gan River Basin, China. J. Hydrol. 2017, 551, 162–176. [Google Scholar] [CrossRef]
- Zhang, L.Q.; Liu, Y.; Ren, L.L.; Teuling, A.J.; Zhu, Y.; Wei, L.Y.; Zhang, L.Y.; Jiang, S.H.; Yang, X.L.; Fang, X.Q.; et al. Analysis of flash droughts in China using machine learning. Hydrol. Earth Syst. Sci. 2022, 26, 3241–3261. [Google Scholar] [CrossRef]
- Zhang, M.; Yuan, X.; Otkin, J.A.; Ji, P. Climate warming outweighs vegetation greening in intensifying flash droughts over China. Environ. Res. Lett. 2022, 17, 054041. [Google Scholar] [CrossRef]
- Chen, L.; Ford, T.W.; Yadav, P. The Role of Vegetation in Flash Drought Occurrence: A Sensitivity Study Using Community Earth System Model, Version 2. J. Hydrometeorol. 2021, 22, 845–857. [Google Scholar] [CrossRef]
- Hobbins, M.T.; Wood, A.; McEvoy, D.J.; Huntington, J.L.; Morton, C.; Anderson, M.; Hain, C. The Evaporative Demand Drought Index. Part I: Linking Drought Evolution to Variations in Evaporative Demand. J. Hydrometeorol. 2016, 17, 1745–1761. [Google Scholar] [CrossRef]
- Parker, T.; Gallant, A.; Hobbins, M.; Hoffmann, D. Flash drought in Australia and its relationship to evaporative demand. Environ. Res. Lett. 2021, 16, 064033. [Google Scholar] [CrossRef]
- Poonia, V.; Goyal, M.K.; Jha, S.; Dubey, S. Terrestrial ecosystem response to flash droughts over India. J. Hydrol. 2022, 605, 127402. [Google Scholar] [CrossRef]
- Zheng, C.L.; Jia, L.; Hu, G.C.; Lu, J. Earth Observations-Based Evapotranspiration in Northeastern Thailand. Remote Sens. 2019, 11, 138. [Google Scholar] [CrossRef]
- Mukherjee, S.; Mishra, A.K. Global Flash Drought Analysis: Uncertainties from Indicators and Datasets. Earths Future 2022, 10, e2022EF002660. [Google Scholar] [CrossRef]
- Yao, T.T.; Liu, S.X.; Hu, S.; Mo, X.G. Response of vegetation ecosystems to flash drought with solar-induced chlorophyll fluorescence over the Hai River Basin, China during 2001–2019. J. Environ. Manag. 2022, 313, 114947. [Google Scholar] [CrossRef]
- Zhao, X.; Wei, H.; Liang, S.L.; Zhou, T.; He, B.; Tang, B.J.; Wu, D.H. Responses of Natural Vegetation to Different Stages of Extreme Drought during 2009–2010 in Southwestern China. Remote Sens. 2015, 7, 14039–14054. [Google Scholar] [CrossRef]
- Li, X.; Piao, S.; Huntingford, C.; Penuelas, J.; Yang, H.; Xu, H.; Chen, A.; Friedlingstein, P.; Keenan, T.F.; Sitch, S.; et al. Global variations in critical drought thresholds that impact vegetation. Natl. Sci. Rev. 2023, 10, nwad049. [Google Scholar] [CrossRef] [PubMed]
Disclaimer/Publisher’s Note: The statements, opinions and data contained in all publications are solely those of the individual author(s) and contributor(s) and not of MDPI and/or the editor(s). MDPI and/or the editor(s) disclaim responsibility for any injury to people or property resulting from any ideas, methods, instructions or products referred to in the content. |
© 2024 by the authors. Licensee MDPI, Basel, Switzerland. This article is an open access article distributed under the terms and conditions of the Creative Commons Attribution (CC BY) license (https://creativecommons.org/licenses/by/4.0/).