Article

Application of WRF-LES on the Simulation of Seasonal Characteristics of Atmospheric Boundary Layer Structure in Taklamakan Desert

School of Atmospheric Physics, Nanjing University of Information Science & Technology, Nanjing 210044, China
*
Author to whom correspondence should be addressed.
Remote Sens. 2024, 16(3), 558; https://doi.org/10.3390/rs16030558
Submission received: 5 December 2023 / Revised: 13 January 2024 / Accepted: 23 January 2024 / Published: 31 January 2024
(This article belongs to the Special Issue Remote Sensing for High Impact Weather and Extremes)

Abstract

:
The lack of observational data in Taklamakan Desert makes it very difficult to study its unique boundary layer structure. As a common means of supplementing observational data, the mesoscale boundary layer parameterization scheme in the numerical model method is difficult to capture small-scale turbulent processes, which may lead to large deviations in simulation. In order to obtain more accurate simulation data of desert atmospheric boundary layer, nested LES into WRF (WRF-LES) was configured to simulate the seasonal variations in Taklamakan Desert. By comparing LES with the conventional boundary layer parameterization scheme, the error characteristics between the two schemes are analyzed. The results show that LES exhibits superior performance in solving key atmospheric features such as small-scale processes and low-level jet streams. The simulation results in winter and summer have great uncertainty due to the boundary condition errors, respectively. LES also shows the maximum and minimum optimization degree in summer and winter, respectively, while the simulation results in spring and autumn are relatively stable. In the analysis of turbulence parameters, there are clear seasonal differences in turbulence characteristics, and the intensity of turbulence in summer is significantly higher than that in other seasons. When turbulent activity is strong, the difference in potential temperature and horizontal wind speed simulated between the two schemes is closely related to intense turbulent kinetic energy in LES. More accurate turbulence reproduced in LES leads to the better potential temperature and horizontal wind speed simulations in summer. In addition, large-scale cloud systems can lead to considerable simulation bias. Neither scheme can accurately simulate the cloud emergence process, and large differences between the two schemes occur at this point.

1. Introduction

The Taklamakan Desert, one of the world’s largest shifting-sand deserts and an important source of dust, is a pivotal component of the global climate system. Extremely high near-surface temperatures and solar radiation, as well as unique geomorphologic features, result in an extremely deep convective planetary boundary layer (PBL), one of the deepest on Earth [1,2]. The effects of dynamic and thermal processes on the desert are transmitted through the PBL to the free atmosphere, which leads to significant impacts on the regional climate [1,3,4]. The evolution of PBL shows special patterns here and highly influenced the development of dust and sand events in East Asia [5,6]. Thus, it is critical to understand the PBL processes well in Taklamakan Desert.
Obtaining reliable meteorological data in deserts has always proven challenging due to the extreme ambient conditions. PBL measurements typically rely on sparse radiosonde observations or aircraft campaigns [7]. Researchers used data from meteorological stations around the desert or from short-term surveys to study climatic variability in the desert [8,9,10]. However, these observations do not allow for long-term, continuous tracking of diurnal variations in the PBL, making a complete understanding of the evolution of the desert PBL difficult.
As another means of studying the atmospheric processes, the developed numerical weather prediction model is well suited to fill in the observation gaps, thus gradually making it possible to obtain data on the PBL continuously, especially over the desert region. In the numerical weather prediction model, a general PBL scheme, like YSU [11], and the MYJ scheme [12], usually generally parameterize the sub-grid scale turbulence contribution on the grid point. Simulation is able to accurately reflect mesoscale processes with a kilometer-scale grid spacing. However, since the numerical prediction model with PBL scheme is unable to directly compute turbulent processes of sub-grid scale, there can be bias in its simulation of small-scale processes [2,13,14]. The parameterized approach may also be subject to erroneous estimation in such geographic areas where detection information is extremely scarce, due to its high dependence on empirical formulas. A more accurate model-based parametric method is needed to complement and improve the simulation.
The inability of mesoscale models to resolve turbulent eddies makes large eddy simulations (LESs) a popular tool for studying PBL turbulence [15,16]. LES explicitly resolves energy-containing motions responsible for turbulent transport, while approximately downscaling to 10 m scales [17,18]. However, traditional LES utilizes idealized profiles or periodic boundary conditions such as the study by Bryan et al. [19], which used LES to study the effect of resolution on the evolution of deep convective systems. Additionally, Kim and Park [20] studied the coherent structure of the near-surface layer in the strong shear convective boundary layer through LES, which limits real-world applicability.
Nesting LES within mesoscale simulations, i.e., WRF-LES, alleviates some limitations [21], delivering skillful PBL turbulence simulation [21,22]. Nevertheless, computational constraints have restricted LES studies to short timescales of hours to days. Applications have focused on specialized scenarios like wind energy prediction [23], convection simulation [17], and boundary layer of hurricane [24]. Considering the lack of long-term, continuous tracking of diurnal variations in the desert PBL, nesting LES within the mesoscale numerical weather prediction model provides a possible way to capture the PBL seasonal structure over the desert region.
In order to determine whether the LES can capture the structural characteristics of the atmospheric boundary layer in the Taklamakan Desert during the four seasons of the year, this study conducted 6 days of WRF-LES and WRF simulation experiments in each season to compare the output results of the WES-LES and WRF models with sounding observation data and the ECWMF reanalysis data (ERA5). The next section provides information on the observations and the meteorological overview of selected simulation periods and provides details of the model configuration. Section 3 provides a comparative analysis of the simulation of the two schemes (PBL and LES) and analyzes the effect of turbulence effects on the error between the two schemes in terms of the mechanism of the LES. Section 4 provides a discussion of the issues identified in the study, and finally, conclusions are provided in Section 5.

2. Materials and Methods

2.1. In-Site Observation and Reanalysis Data

To comprehensively evaluate the large eddy simulations of the desert boundary layer during different seasons, we analyzed meteorological observations from August 2021 to August 2022 at the Minfeng County Station (WMO ID 51839, 37.07 °N, 82.69 °E) in China’s Xinjiang Hotan region, and administered a string of counties based on the oases along the southern edge of the Taklamakan Desert. Measurements included air pressure, wind speed (WS), wind direction (WD), air temperature, dew point temperature (DPT), relative humidity (RH), and cloud cover, which are collected hourly. Six days in each season with clear sky, dry conditions, and moderate winds were selected to conduct simulation experiments: autumn (20–26 October 2021), winter (4–10 January 2022), spring (5–11 April 2022), and summer (2–8 July 2022). The in-site observation during the specific simulation periods is shown in Figure 1. The region is characterized by prevailing southerly winds, with almost no northerly winds throughout the year, mostly from the south-west and south-east. As can be seen from the figure, 10 m wind speeds are highest in the summer (maximum wind speed of 5.89 ms−1) and lowest in the winter (mean wind speed of 1.63 ms−1), while the spring and autumn seasons have similar wind speed characteristics with mean wind speed of 2.13 ms−1. The distribution of 2 m air temperatures is similar to that of 10 m wind speeds, with daily maximum mean temperatures approaching 40 °C in summer, and daily minimum mean temperatures as low as −20 °C in winter. The two humidity components of the region, relative humidity and water vapor pressure, are low almost all year round (mean relative humidity of 34.78% and mean water vapor pressure of 5.69 hPa), with only a slight increase in the summer months, and the region receives almost no precipitation throughout the year, due to the extreme dry conditions in desert region. At 00:00 and 12:00 UTC, soundings are conducted to observe wind speed and direction, air temperature, pressure, and relative humidity profiles every day. All observation data were converted to the coordinated universal time (UTC) for consistency with the model output.
With high spatio-temporal resolution and global data assimilation, ERA5 meets the analysis requirements and is widely used for model verification [25,26,27]. ERA5 reanalysis data were used to evaluate model performance over continuous time periods [28].

2.2. Model Configurations

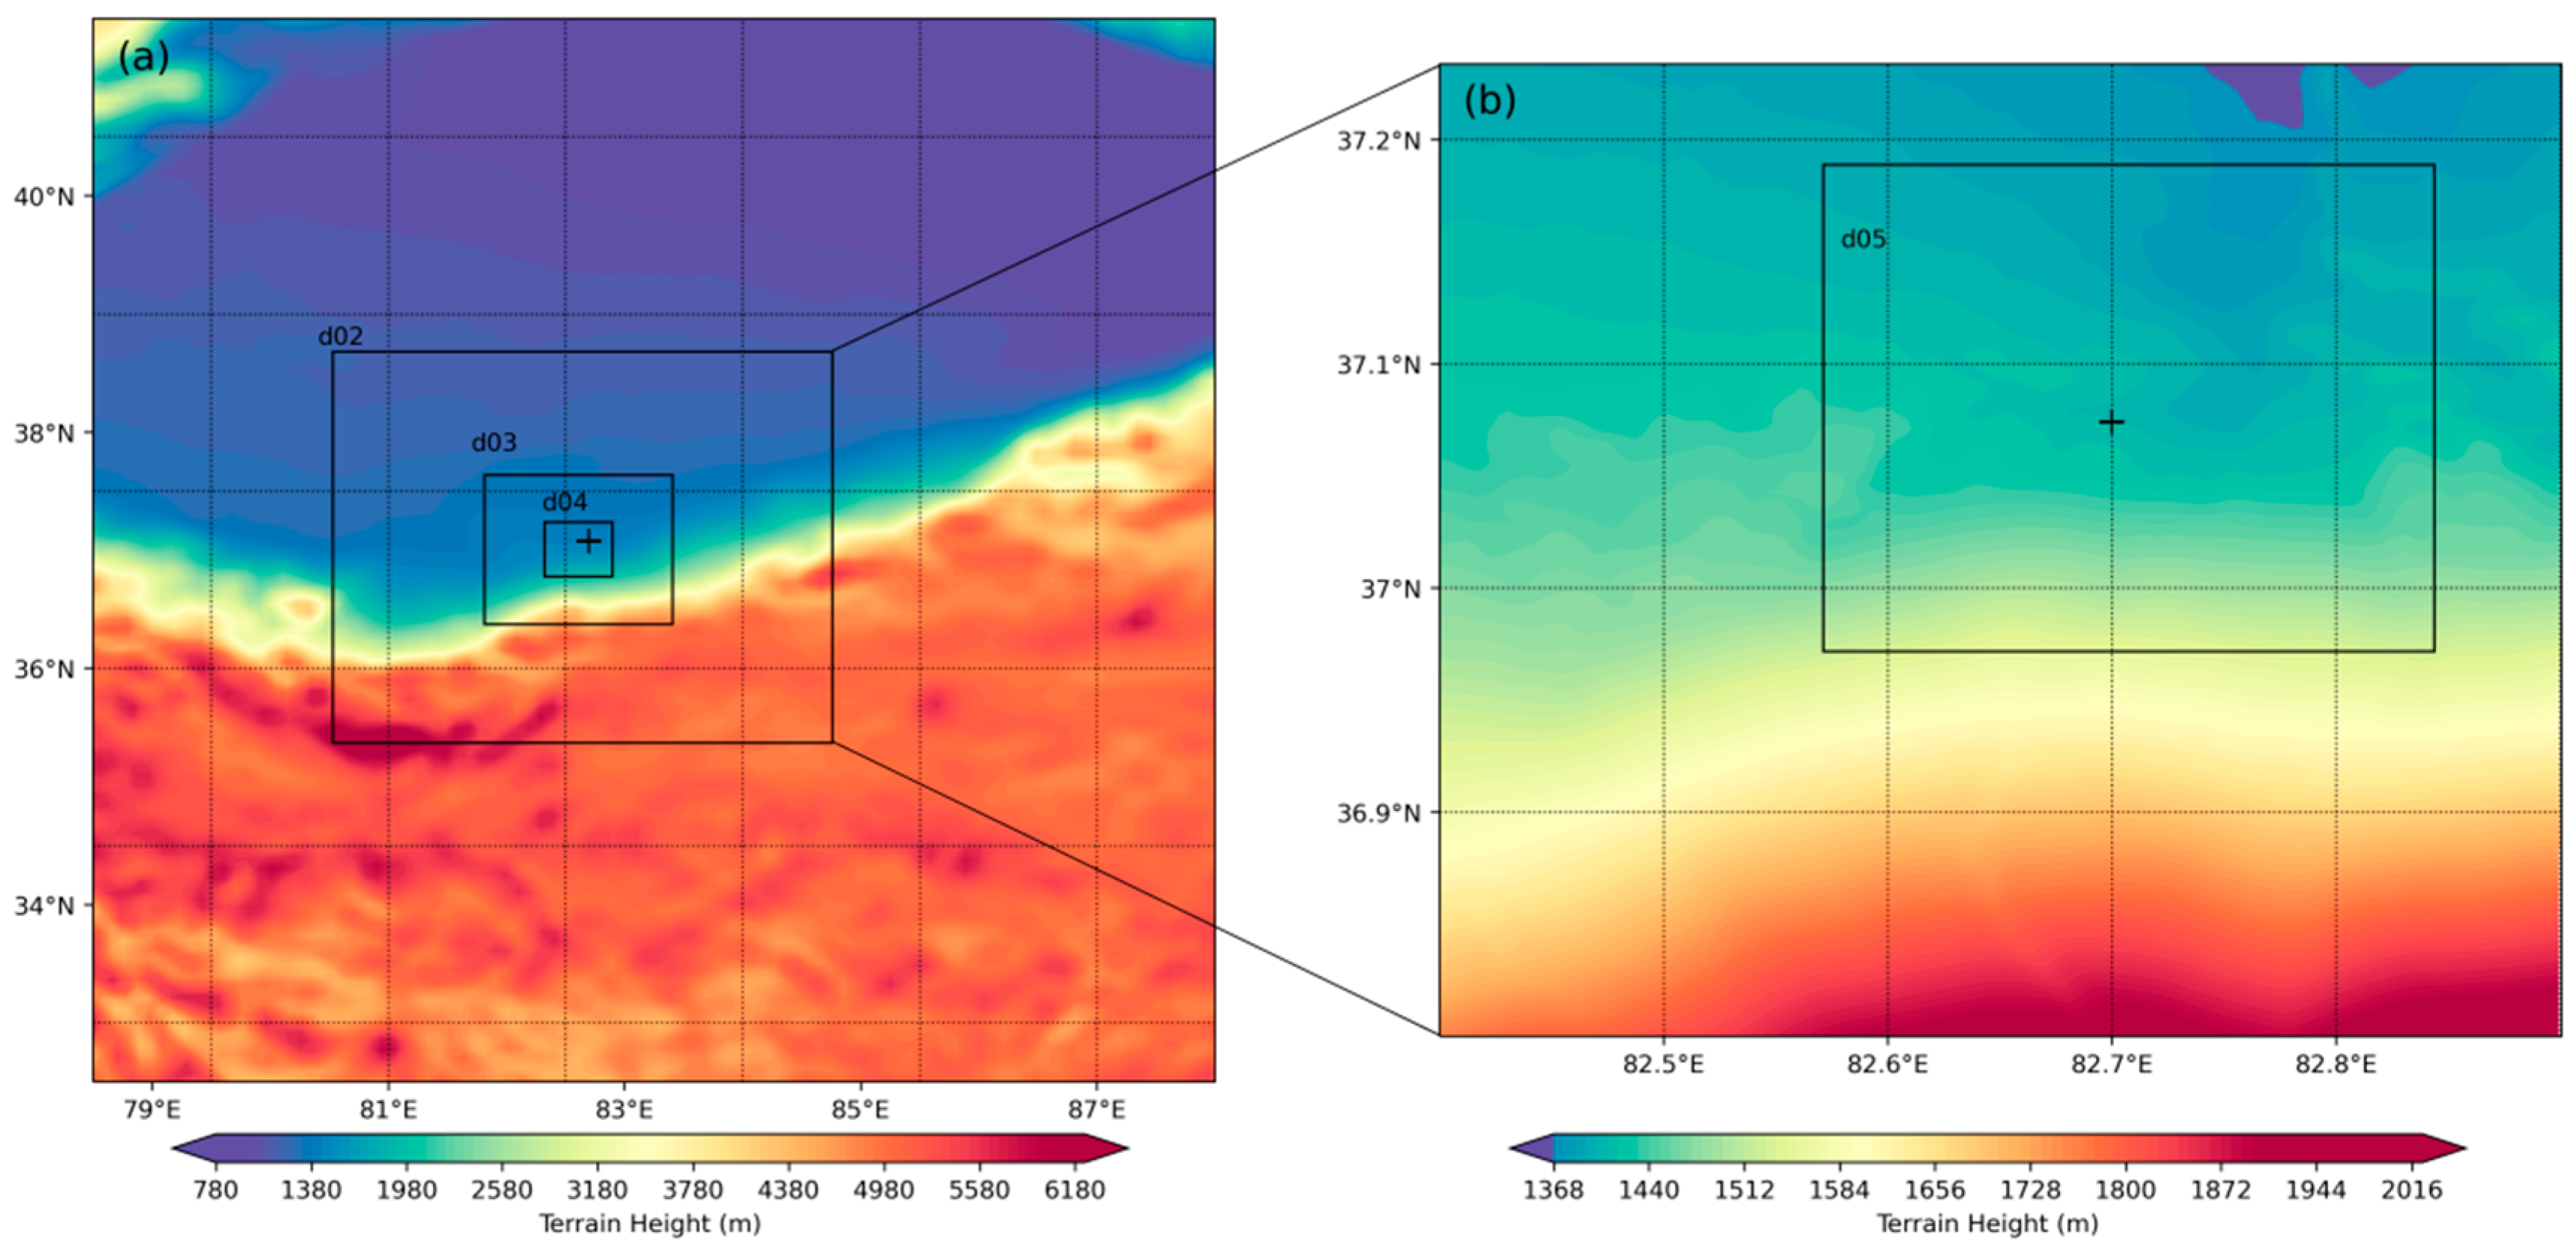
A large eddy simulation (LES) embedded in a nested WRF v4.5.1 model system was implemented in this study with five nested domains. The outer three mesoscale domains employed a conventional 1D PBL scheme to parameterize sub-grid turbulence, while the inner two domains configured with LES, in which the turbulence contribution is computed directly at high resolution. A key advantage of one-way nesting is avoiding LES interference with the mesoscale solution. Based on tests over the Gurbantunggut Desert, the non-local ACM2 PBL scheme [29] had the highest universality and was most suitable for the study of meteorological elements in the PBL of deserts [10,30,31]; therefore, it was selected in our simulation experiment. The outermost horizontal grid spacing is 9 km, and the nesting domain has a nesting ratio of 3:1. The first three domains are PBL domain and the inner two domains are LES domain. In LES domain, the PBL scheme is turned off and SGS model is used for parametric grid turbulence mixing, which means the outermost LES domain (horizontal grid spacing of 333 m) is located in the “gray area” [32]. A recently developed scale-aware 3D turbulence kinetic energy scheme was applied here for seamless gray zone scaling [33]. The new scheme combines the horizontal and vertical sub-grid turbulent mixing into a single energetically consistent framework, in contrast to the conventionally separate treatment of the vertical and horizontal mixing. The new scheme is self-adaptive to the grid-size change between the large eddy simulation (LES) and mesoscale limits of WRF-LES can explicitly resolve the most energetic turbulent eddies, while WRF-PBL with relatively coarse resolution and fully parameterized turbulence effects cannot capture microscale variabilities driven by atmospheric dynamics. The sub-grid scale (SGS) stress model of LES can provide a correct description of the energy-producing isotropic eddies within the inertial subrange of 3D turbulence. Other physics options including the Dudhia shortwave radiation [34], the rapid radiative transfer model (RRTM) longwave radiation scheme [35], single-moment 6-Class (WSM6) microphysics scheme [36], Noah MP land surface model [37], and revised MM5 surface scheme [38] are used in this study. Initial and boundary conditions were prescribed from 3-hourly 0.25°× 0.25° NCEP FNL analyses. The 16-category MODIS land cover data at 500 m resolution were implemented [39]. A total of 81 vertical levels were configured with 34 levels resolving the PBL. Further configuration details are provided in Table 1. The simulated domain is situated in northwest China’s Xinjiang region, and the nested grid configurations were shown in Figure 2. Notably, extreme elevation changes occur near the southern Tian Shan Mountains. Care was taken to position the third PBL domain boundary along this complex topography, preventing the inner two high-resolution LES domains from spanning the mountains. The Minfeng County station was centrally located within the innermost D05 domain to avoid lateral boundary effects. Each season’s simulation is divided into three segments of 60 h each, with the first 12 h of the simulation serving as the spin-up. For instance, for the autumn simulation, the simulation period for each segment will be: 19 October 2021 at 12:00 UTC to 22 October 2021 at 00:00 UTC, and 21 October 2021 at 12:00 UTC to 24 October 2021 at 00:00 UTC, 23 October 2021 at 12:00 UTC to 26 October 2021 at 00:00 UTC.

2.3. Turbulence Extracting Method

For the LES domain, there is no specific scheme to output the turbulent flow field. Traditional filtering methods use spatial averaging to filter out turbulent fields, which may cause information loss.
As an alternative, Li and Pu [40] implemented Gaussian filtering to treat the LES instantaneous field instead of the ordinary domain averaging method and controlled the filtering result by changing the standard deviation. Therefore, we use the 2D Gaussian filter to smooth the simulation results and subtract the filtered results from the original field to obtain turbulent fields. The equation for the Gaussian filter is defined as:
G ( x , y ) = 1 2 π σ 2 e x p ( x 2 + y 2 2 π σ 2 ) ,
where x and y are the grids in the x and y directions. To better compare with the results in domain 3, the bandwidth, which indicates the filter region, was set at 10 × 10 for domain 5, with a Gaussian function standard deviation of 10. Only grids with a distance of less than 1 km were considered to smooth the grid data. For variables such as u, v, w, t, and q, the two-dimensional Gaussian filter was used for smoothing, and then the turbulence field was produced by subtracting the smoothed field.

3. Results

3.1. Surface Meteorological Elements

Surface conditions profoundly influence PBL characteristics [41]. Inaccuracies in simulated surface fields can propagate into PBL processes aloft. The in-site surface meteorological observation was compared with the results of the WRF-LES output in this section.
To evaluate model performance, we compared 2 m air temperatures in innermost mesoscale D03 (WRF with PBL scheme, refer to PBL domain thereafter) and innermost D05 (LES, refer to LES domain thereafter) against station observations (Figure 3). In simulations across four seasons (autumn to summer), the determination coefficients (R2) for PBL and LES schemes were 0.52, 0.82, 0.92, and 0.79, and 0.80, 0.84, 0.93, and 0.83, respectively. The highest R2 value was observed in spring, while the lowest was in autumn. The largest discrepancy between PBL and LES schemes occurred in autumn, with a difference of up to 0.28. In contrast, the smallest difference was in spring, at only 0.01. These fitting coefficients indicate that both the PBL and LES schemes are able to simulate the temperature variables accurately, while the larger R2 exhibited in the LES simulation indicates that the LES scheme provides more accurate simulation results compared to the PBL scheme. According to the distribution of the scatter, except for spring, simulations in all seasons showed significant negative biases in the low-temperature range (bounded by the median temperature), particularly in autumn.
In summer, besides the negative bias in the lower temperature range, there were notable positive biases observed in other temperature ranges. The fitted straight line is mostly below the standard line. At the same time, except for summer, the slope of all fitted straight lines is less than 1, which suggests that the simulation results for the other three seasons are dominated by negative bias. Of note, the R2 values for the LES scheme vary in line with the value of the PBL scheme. Although the LES shows better performance than the PBL scheme, the trend of the LES and PBL results indicates that the LES performance remains strongly dependent on the mesoscale parent domain results.
We also assessed the simulated values of the 10 m wind speed for both schemes across the four seasons. The simulation results and the mean bias of both schemes across the four seasons are presented in Figure 4 and Table 2. The average 10 m wind speed from observations for the four seasons was 1.90, 1.43, 2.10, and 2.13 ms−1, respectively. As can be seen in Figure 4, the wind speed in winter is significantly lower than in other seasons. The average wind speed is highest in summer, while the actual wind speed has a sudden increase in spring and autumn during the simulation period, which causes the average wind speed in these two seasons to be higher. Compared to the mesoscale simulation, the LES domain demonstrated reduced biases in all seasons, with lowering errors by 14.2%, 30.8%, 17%, and 27.3% for autumn, winter, spring, and summer, respectively. The reason for the lower optimization of the error in autumn is the larger error that occurs on the last three days of the simulation in autumn. Excluding the effect of the last three days, the reduction in error would be 18.1% (mean errors of 1.82 and 1.49 ms−1 for PBL and LES, respectively). The causes of large errors in the last three days will be discussed in Section 3.4.2. The performance of PBL and LES domains was comparable in spring and autumn, while both of them exhibited the best and worst matches in winter and summer, respectively. Talbot et al. [22] demonstrated the feasibility of LES nested within mesoscale models, finding the LES domain sensitive to initial surface conditions and mesoscale forcing. Accurate mesoscale simulations are therefore critical in WRF-LES simulation. Therefore, the relatively high and low winds in PBL domain in summer and winter likely cause larger mesoscale background errors and propagate into the LES domain. Additionally, the LES scheme analyzes smaller scale turbulence, and the improved energy cascade delivered more realistic surface wind estimates. In both PBL and LES schemes, simulated and observed wind speeds showed good agreement over the first three seasons, accurately capturing wind evolution with low bias. As shown in Figure 4c, the LES scheme initially and ultimately performed well but significantly overestimated wind speed values in the middle of the simulation period in summer. It is noted that during the period of significant overestimation in the LES scheme, the simulated values for the PBL scheme are also high, though the LES scheme gives more reasonable estimates. The concomitant manifestations of both suggest that errors from the mesoscale have a great influence on the simulation results of LES. Compared to the mesoscale, the LES wind speed simulation consistently improved but not enough to compensate for larger forcing biases in the summer mesoscale winds.

3.2. Sounding Profiles

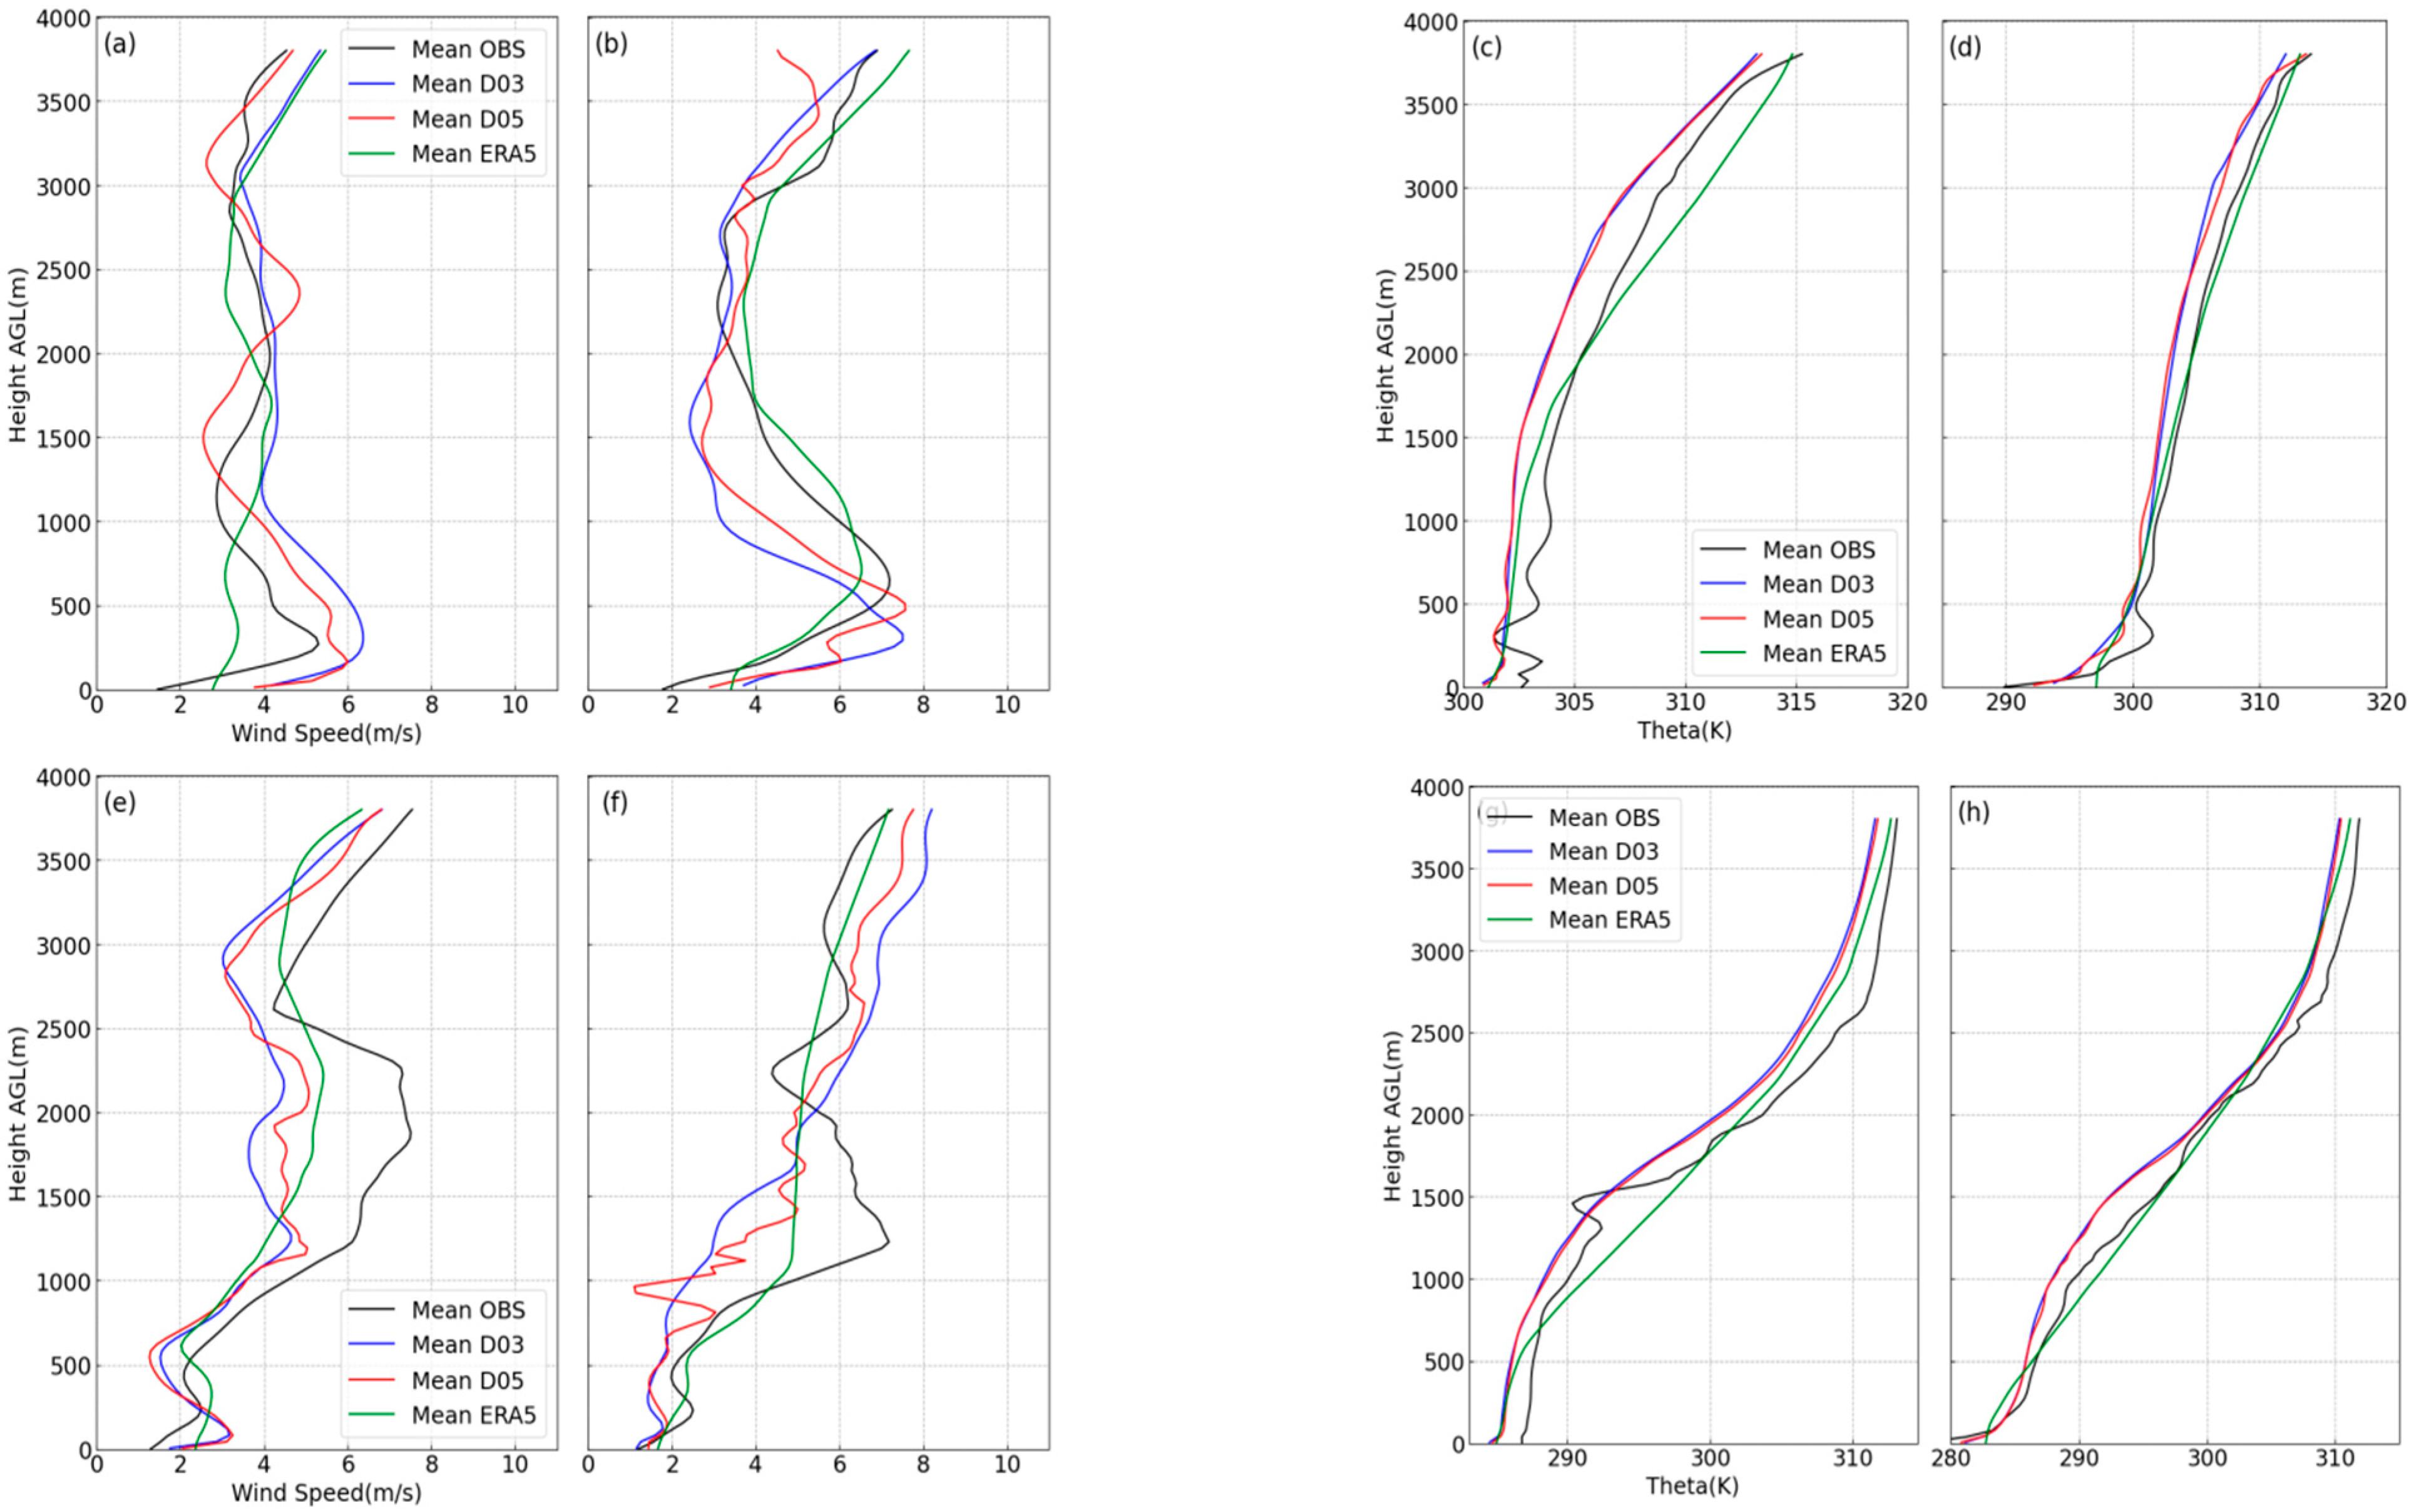
To explore the simulation error at each season, we compared the 6-day average profile between observations and simulations, as shown in Figure 5. Since the ERA5 grid point is close to the experimental point, the ERA5 profile data were also included in the comparison (Figure 5). For potential temperature, significant discrepancies of the simulation of PBL and LES domains only occurred in the evening in spring and summer, with maximum mean biases between the two schemes being about 1.1 K and 1.8 K in these two seasons, respectively. Profiles showed a super-adiabatic surface layer characteristic of convective conditions only in the evening of these two seasons, as well. In contrast, the minimal difference was between the simulation of LES and PBL domains in early morning in all seasons and all day in autumn and winter. During this time, the vertical diffusion effect mainly comes from the mesoscale and the turbulence is weak, while the gradient diffusion scheme (i.e., ACM2) in PBL domain can capture the temperature variation well. Further mechanism details will be discussed in Section 3.4. Above the PBL, the simulation of PBL and LES domains performed similarly. For wind speed, the PBL domain consistently overestimated jet stream height and intensity in all seasons. The jet stream occurred below 1 km in spring, summer, and autumn, and at around 1–2.5 km in winter. The LES resolves the jet structure better in nearly all cases with an error of less than 3 ms−1. Although the strong mesoscale influence causing LES overestimated the jet in spring and summer evenings, the LES domain simulation remained closer to sounding data than that in PBL simulation. Although missing fine-scale wind fluctuations, ERA5 profiles were comparable or even superior to the LES simulation in some instances with an error of up to 2.54 ms−1 which is smaller than that in the LES simulation, demonstrating their suitability for verifying wind speed and potential temperature simulations. Accordingly, ERA5 was used in the following discussion to comprehensively evaluate the simulation of PBL and LES domains.
The wind speed simulation values of the PBL and LES domains in the spring and summer evenings have large errors with the observed values, especially in the lower levels below 1 km. On the one hand, the similar behavior of the PBL and LES domains suggests that the boundary conditions provided by FNL data at this time have larger errors. On the other hand, the stronger atmospheric exchange in the lower layers leads to a larger error distribution [42]. Both domains perform better in winter. Of note, the LES, PBL domain, and ERA5 have similar performance, where the boundary conditions do not show a drastic change in wind speeds at this location, and the stronger non-local processes leading to this jet stream have prevented the model from judging the drastic change in wind speeds at this location.
Vertical profile comparisons for all times are shown in the Supplementary Material. Figure S1 shows the comparison of profiles during the autumn simulation, where (a)–(f) are comparisons at 12:00 UTC and (g)–(m) are at 00:00 UTC. Figures S2–S4 are similar to Figure S1, but for profiles in winter, spring, and summer, respectively.

3.3. Simulation Error

In Section 3.1 and Section 3.2, we found significant differences in simulation error, especially for temperature variables between PBL and LES domains at different times, which are mainly manifested as small errors in early morning and large errors in the evening. Therefore, to avoid error bias caused by different times, we use the time 12:00 UTC as the boundary separating nighttime and daytime. We interpolated the temperature and horizontal wind speed data into the data at the pressure layers of ERA5, and compared the ERA5 data with the PBL and LES results (Figure 6).
For simulations of horizontal wind speed, the LES consistently outperformed the mesoscale PBL scheme, exhibiting smaller total error means around 1.03 ms−1 in daytime and 1.64 ms−1 at night. Tighter total error distributions with standard deviation of 2.85 in daytime and 2.30 at night are shown, as well. The PBL and LES domains show maximum errors of −2.6 (−2.2) ms−1 in daytime and −5.82 (−4.44) ms−1 at night in summer, while minimum errors of −0.14 (0.04) ms−1 and −1.48 (−0.34) ms−1 in winter, respectively. The errors of LES compared to PBL were respectively reduced by 15.4% in daytime and 23.7% at night in summer, while 71.4% in daytime and 77.0% at night in winter. The performance of PBL and LES domains is similar in spring and autumn, which shows an error close to −1 ms−1 in both daytime and nighttime. The lower and more concentrated winter winds result in smaller errors, while higher and more discrete summer winds lead to larger errors. The diurnal variation in wind speed error does not have a significant seasonal pattern. In this experiment, the performance of PBL and LES domains during the day was better than that at night.
Compared to the daytime simulation, both of the schemes underestimate the horizontal wind speed more at night, especially in spring and summer.
The performance of potential temperature simulation is quite different from that of horizontal wind speed simulation. Both PBL and LES schemes generate the worst result in winter and the best simulation results in spring. The PBL and LES simulations in autumn and summer behave similarly with mean absolute error of −4.06 (−3.92) and −3.62 (−3.47) K in daytime, and −4.65 (−3.60) and −2.82 (−1.25) K at night, respectively. The two periods of greatest error reduction for LES compared to PBL were winter daytimes and summer nights, which reached 31.5% and 55.7%, respectively. The error distribution of both schemes in summer is more discrete with larger error standard deviation of 4.46 (PBL) and 4.23 (LES) in daytime, while 3.77 (PBL) and 3.51 (LES) at night. The simulations, including PBL and LES domains, at almost all times show negative bias, especially in winter. The simulated values of downward longwave radiation in northwestern China are usually low, and the excessive non-local mixing in the ACM2 scheme will lead to negative deviations in local temperatures [43]. The addition of LES can better alleviate this phenomenon with good consistency and less error in spring and autumn. Critically, although LES shows better results overall compared to the PBL domain with the average error reduced by 20.14% in potential temperature and 36.06% in wind speed, the error performance is still similar to that in the PBL domain with similar error magnitude between the two domains (less than 3 K for potential temperature and 2 ms−1 for wind speed). Since the PBL domain provides boundary and initial conditions for the LES domain, a more reasonable physical process obtained in the LES cannot fully counteract the errors from the inaccuracy of boundary condition provided by NCEP FNL data.

3.4. Mechanism of Improved Simulation in LES

The main difference in mechanism between the LES and PBL schemes is that LES can explicitly resolve the most energetic turbulent eddies in the cascade transport of turbulent energy through numerical calculations. Combined with the smaller error at night when the turbulence is weak and the large error during the day when the turbulence is strong, previous studies usually concluded that the possible reason for the simulation error is the inaccurate intensity of turbulence in WRF model [44]. In order to quantify this property more specifically, we subtracted the simulated value of the corresponding LES domain from the simulated value of the PBL domain to represent the difference between the two schemes.
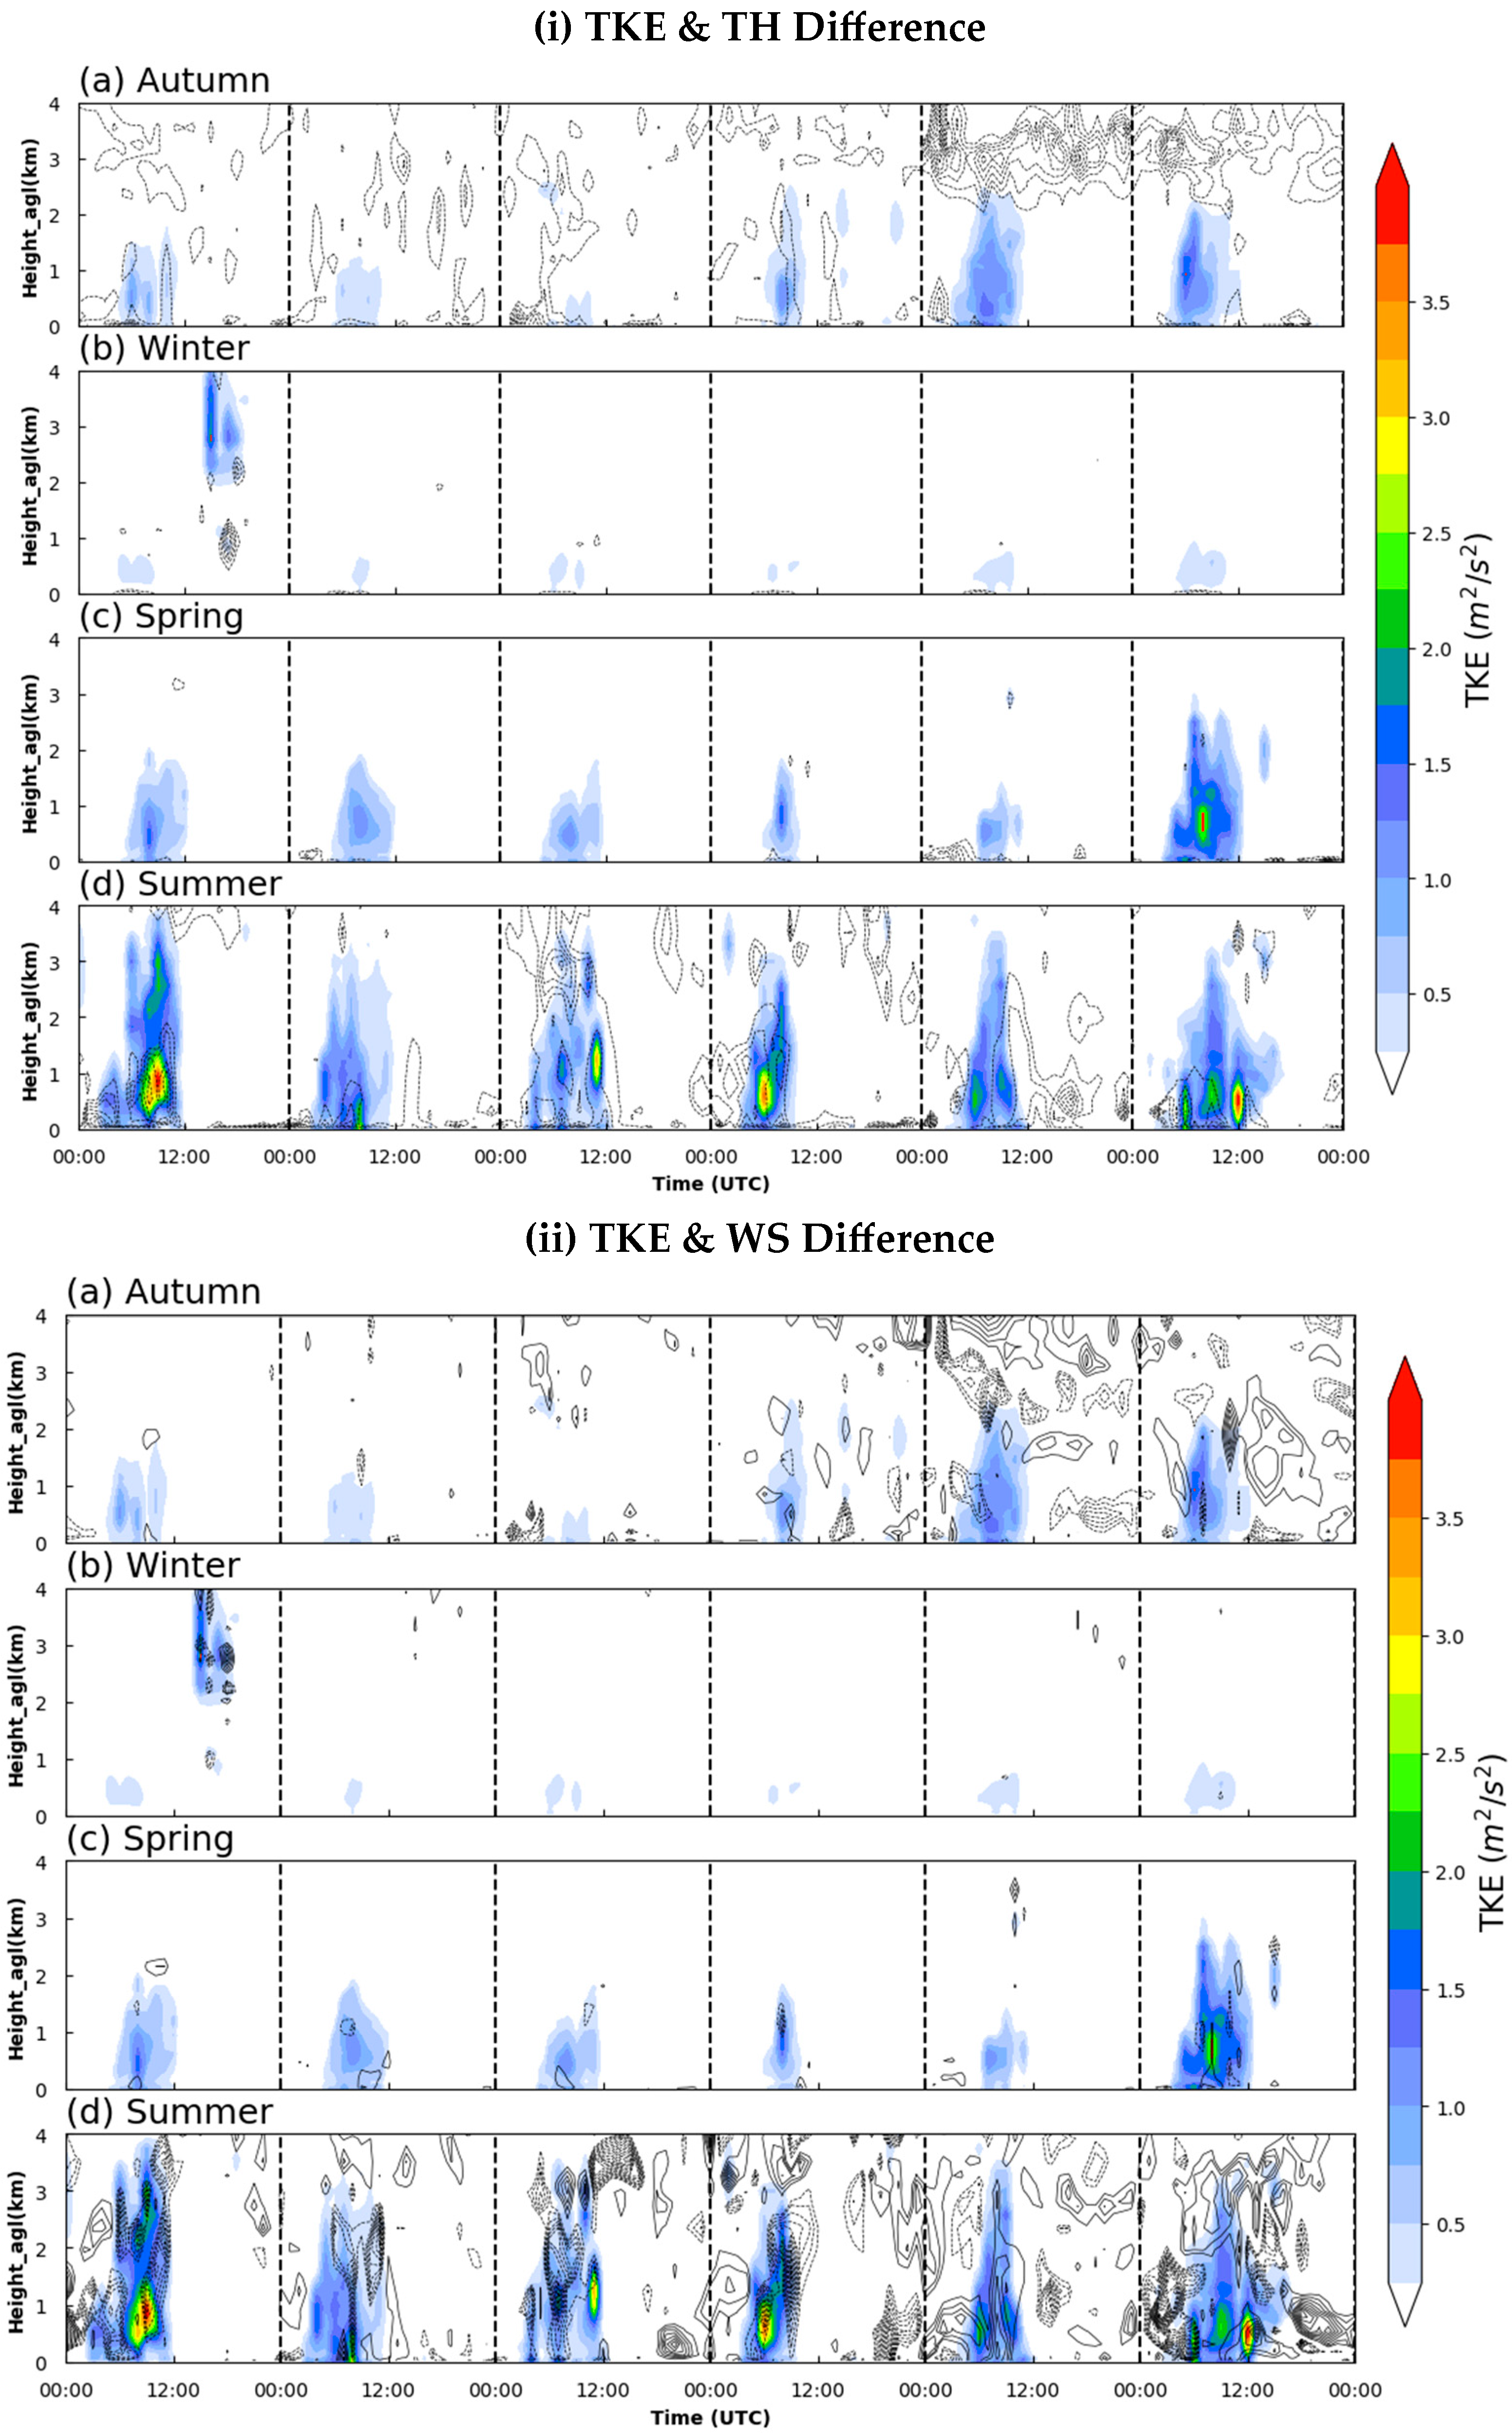
Figure 7 shows the difference between PBL and LES in the two variables: potential temperature (Figure 7i) and horizontal wind speed (Figure 7ii). There is a very clear difference between summer and the other three seasons. For potential temperature, the difference between PBL and LES fluctuates at around 0 K in most times of spring, autumn, and winter. While the simulated values of these three seasons differ greatly in a few other times, such as the last two days of autumn and the first day of winter (Figure 7(ia–ic)). There is also a consistent daytime negative difference near the surface in spring. For horizontal wind speed, wind discrepancies aligned with temperature in autumn and winter, and there is a clear difference in wind speed in daytime in spring, which is mainly concentrated near the surface. In contrast to the potential temperature difference, the difference in wind speed does not show a large isolated positive or negative deviation. The smaller positive and negative deviation areas are adjacent to each other, associated with the performance of wind shear (when a high value of wind shear occurs in a certain layer, the wind shear in the adjacent layer will show the opposite low value). In contrast, summer showed substantial differences for both variables across all times. In terms of temperature difference, there is a relatively clear negative deviation area before 12:00 UTC per day during the summer simulation period. This characteristic is not clear in the difference in wind speed during the summer period, but the error distribution still presents a distinct region.
During most of the time in all seasons, the difference between the PBL domain and the LES domain fluctuates at around 0 K (potential temperature) and 0 ms−1 (wind speed), indicating that the LES domain and the PBL domain have high similarity in general. However, the potential temperature in the PBL domain is lower than that in the LES domain during most of the time, which is similar to the error performance in potential temperature in Figure 6. The simulated potential temperature simulation from two domains often underestimates the actual temperature, especially during the daytime. The LES scheme corrects the negative bias of the PBL domain, as the simulated values in the LES domain are higher than those in the PBL domain during most of the time. In contrast to the systematic temperature discrepancies, wind differences showed greater complexity. To further assess the effect of turbulence on error performance, we will next examine the distribution of turbulence parameters.

3.4.1. TKE

Turbulent kinetic energy (TKE) is an important parameter in the PBL. The following section discusses the TKE in LES to explore the impact of more accurate LES simulated turbulence on the wind speed and air temperature simulation. The resolved TKE is calculated according to the wind fluctuation of the average wind in the filter region:
T K E = 1 2 ( u 2 ¯ + v 2 ¯ + w 2 ¯ ) ,
where u , v , and w are the fluctuations of the wind vector, which are obtained by filtering the original velocity field with a 2D Gaussian filter, as described in Equation (1). The budget equation of TKE describes the generation and extinction of turbulence. The revenue and expenditure equation is as follows:
e ¯ t + u ¯ · e ¯ = S + B + T + D ,
where S and B are shear production and buoyancy production, respectively. They are defined as:
S = u w ¯ d u ¯ d z v w ¯ d v ¯ d z ,
and
B = g θ v ¯ w θ v ¯ ,
where θ v is the virtual potential temperature. In the following, we refer to the terms S and B as shear terms and buoyancy terms. The T term (turbulent transport term) does not produce turbulent kinetic energy, and the D term is the dissipation of turbulent kinetic energy by molecular viscosity, which is associated with the previous kinetic energy generation term. The two terms are not discussed here.
Figure 8 presents the TKE profile evolution in LES, showing distinct seasonal variability akin to the error analyses above. The TKE is weakest in winter while strongest in summer, with intensity peaks of 1.84 and 4.03 m2 s−2, respectively. The TKE intensity is similar in spring and autumn, only slightly higher in spring. Intense TKE is mainly concentrated near the surface during the daytime (02:00 UTC–12:00 UTC), which is consistent with our previous inferences about the evolution of the PBL. That is, the development of PBL leads to a dramatic increase in TKE near the surface. On the first day of winter simulation, more intense TKE (maximum of 1.84 m2 s−2) was produced in the middle and upper layers (2–4 km) rather than near the surface after 12:00 UTC. The TKE budget will be further analyzed in the following content according to the budget Equation (3).
It is noted that the evolution of TKE is similar to the difference pattern of PBL and LES domains to a certain extent, especially in spring, summer, and winter simulation. This implies that discrepancies between the LES and PBL domains are strongly associated with TKE intensity. For instance, the intense TKE almost covers the same region with larger potential temperature difference (whether positive or negative) between the PBL and LES domains. Similarly, the region with larger wind speed difference in winter and spring matched intense TKE areas. In autumn, the simulation difference in two models (potential temperature difference and wind speed difference) does not seem to be affected by intense TKE, with the potential temperature and wind speed difference basically maintaining a low level. The difference distribution is very decentralized with no distinct distribution features in autumn.
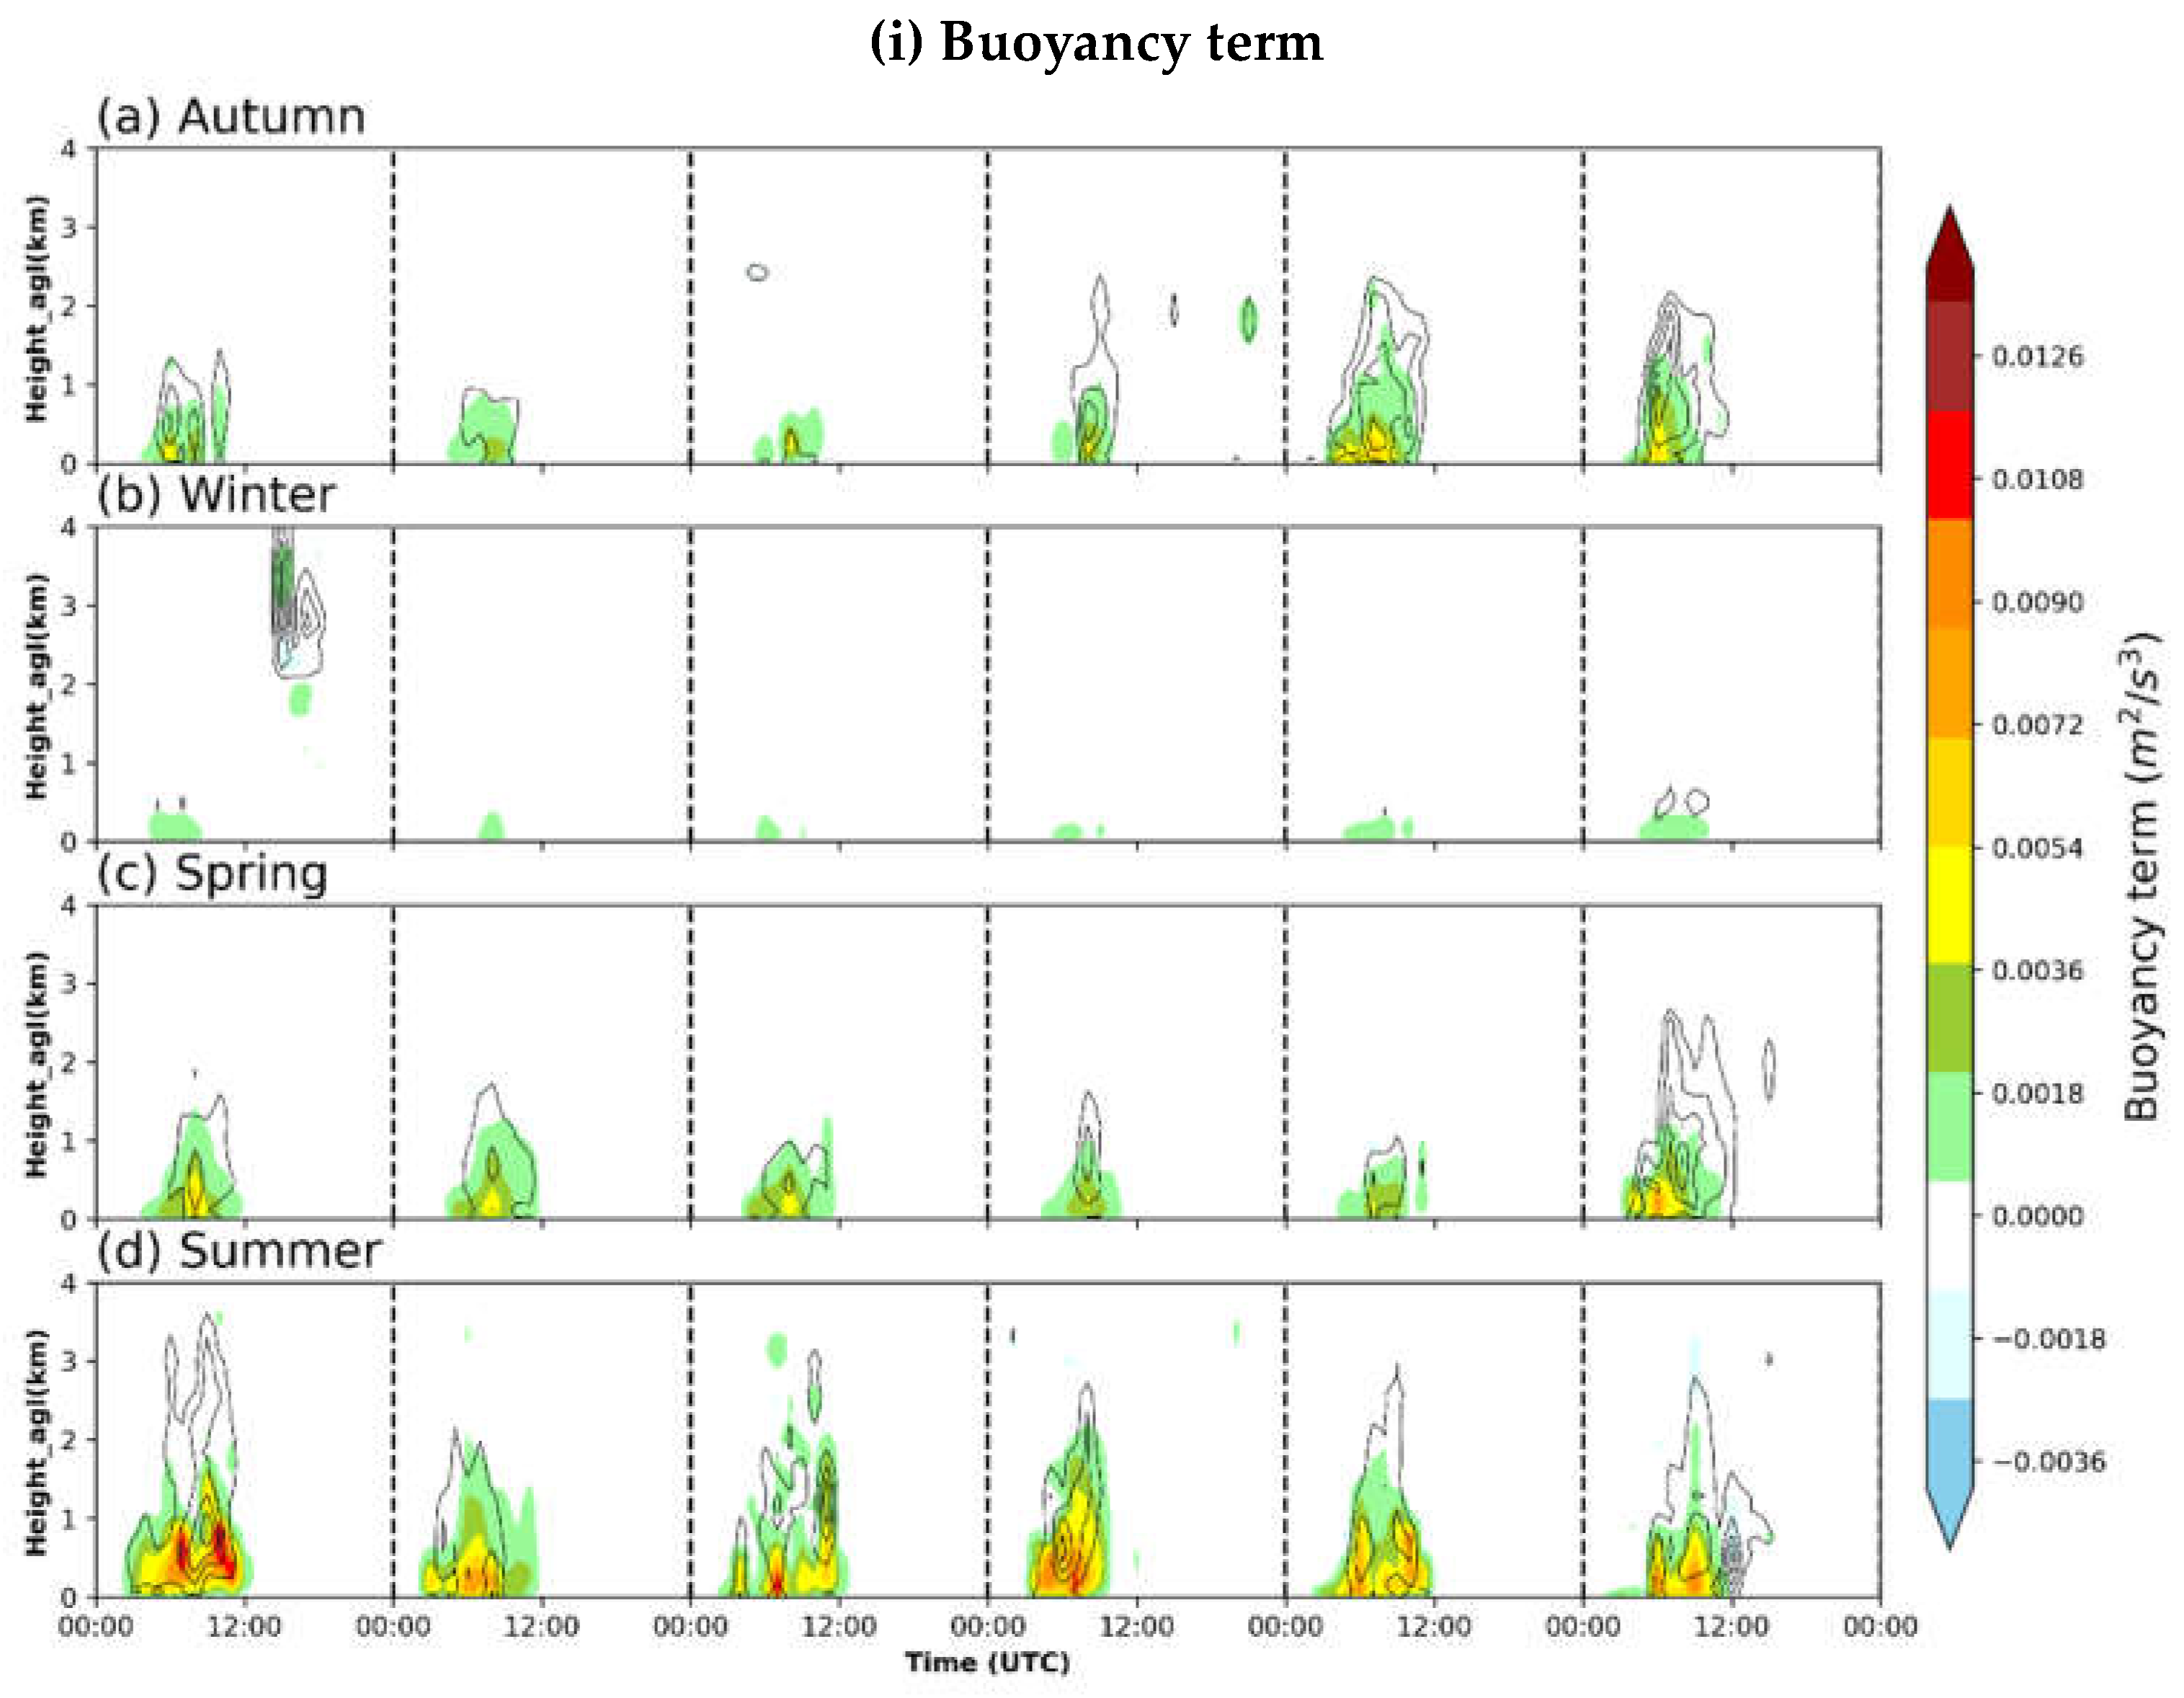
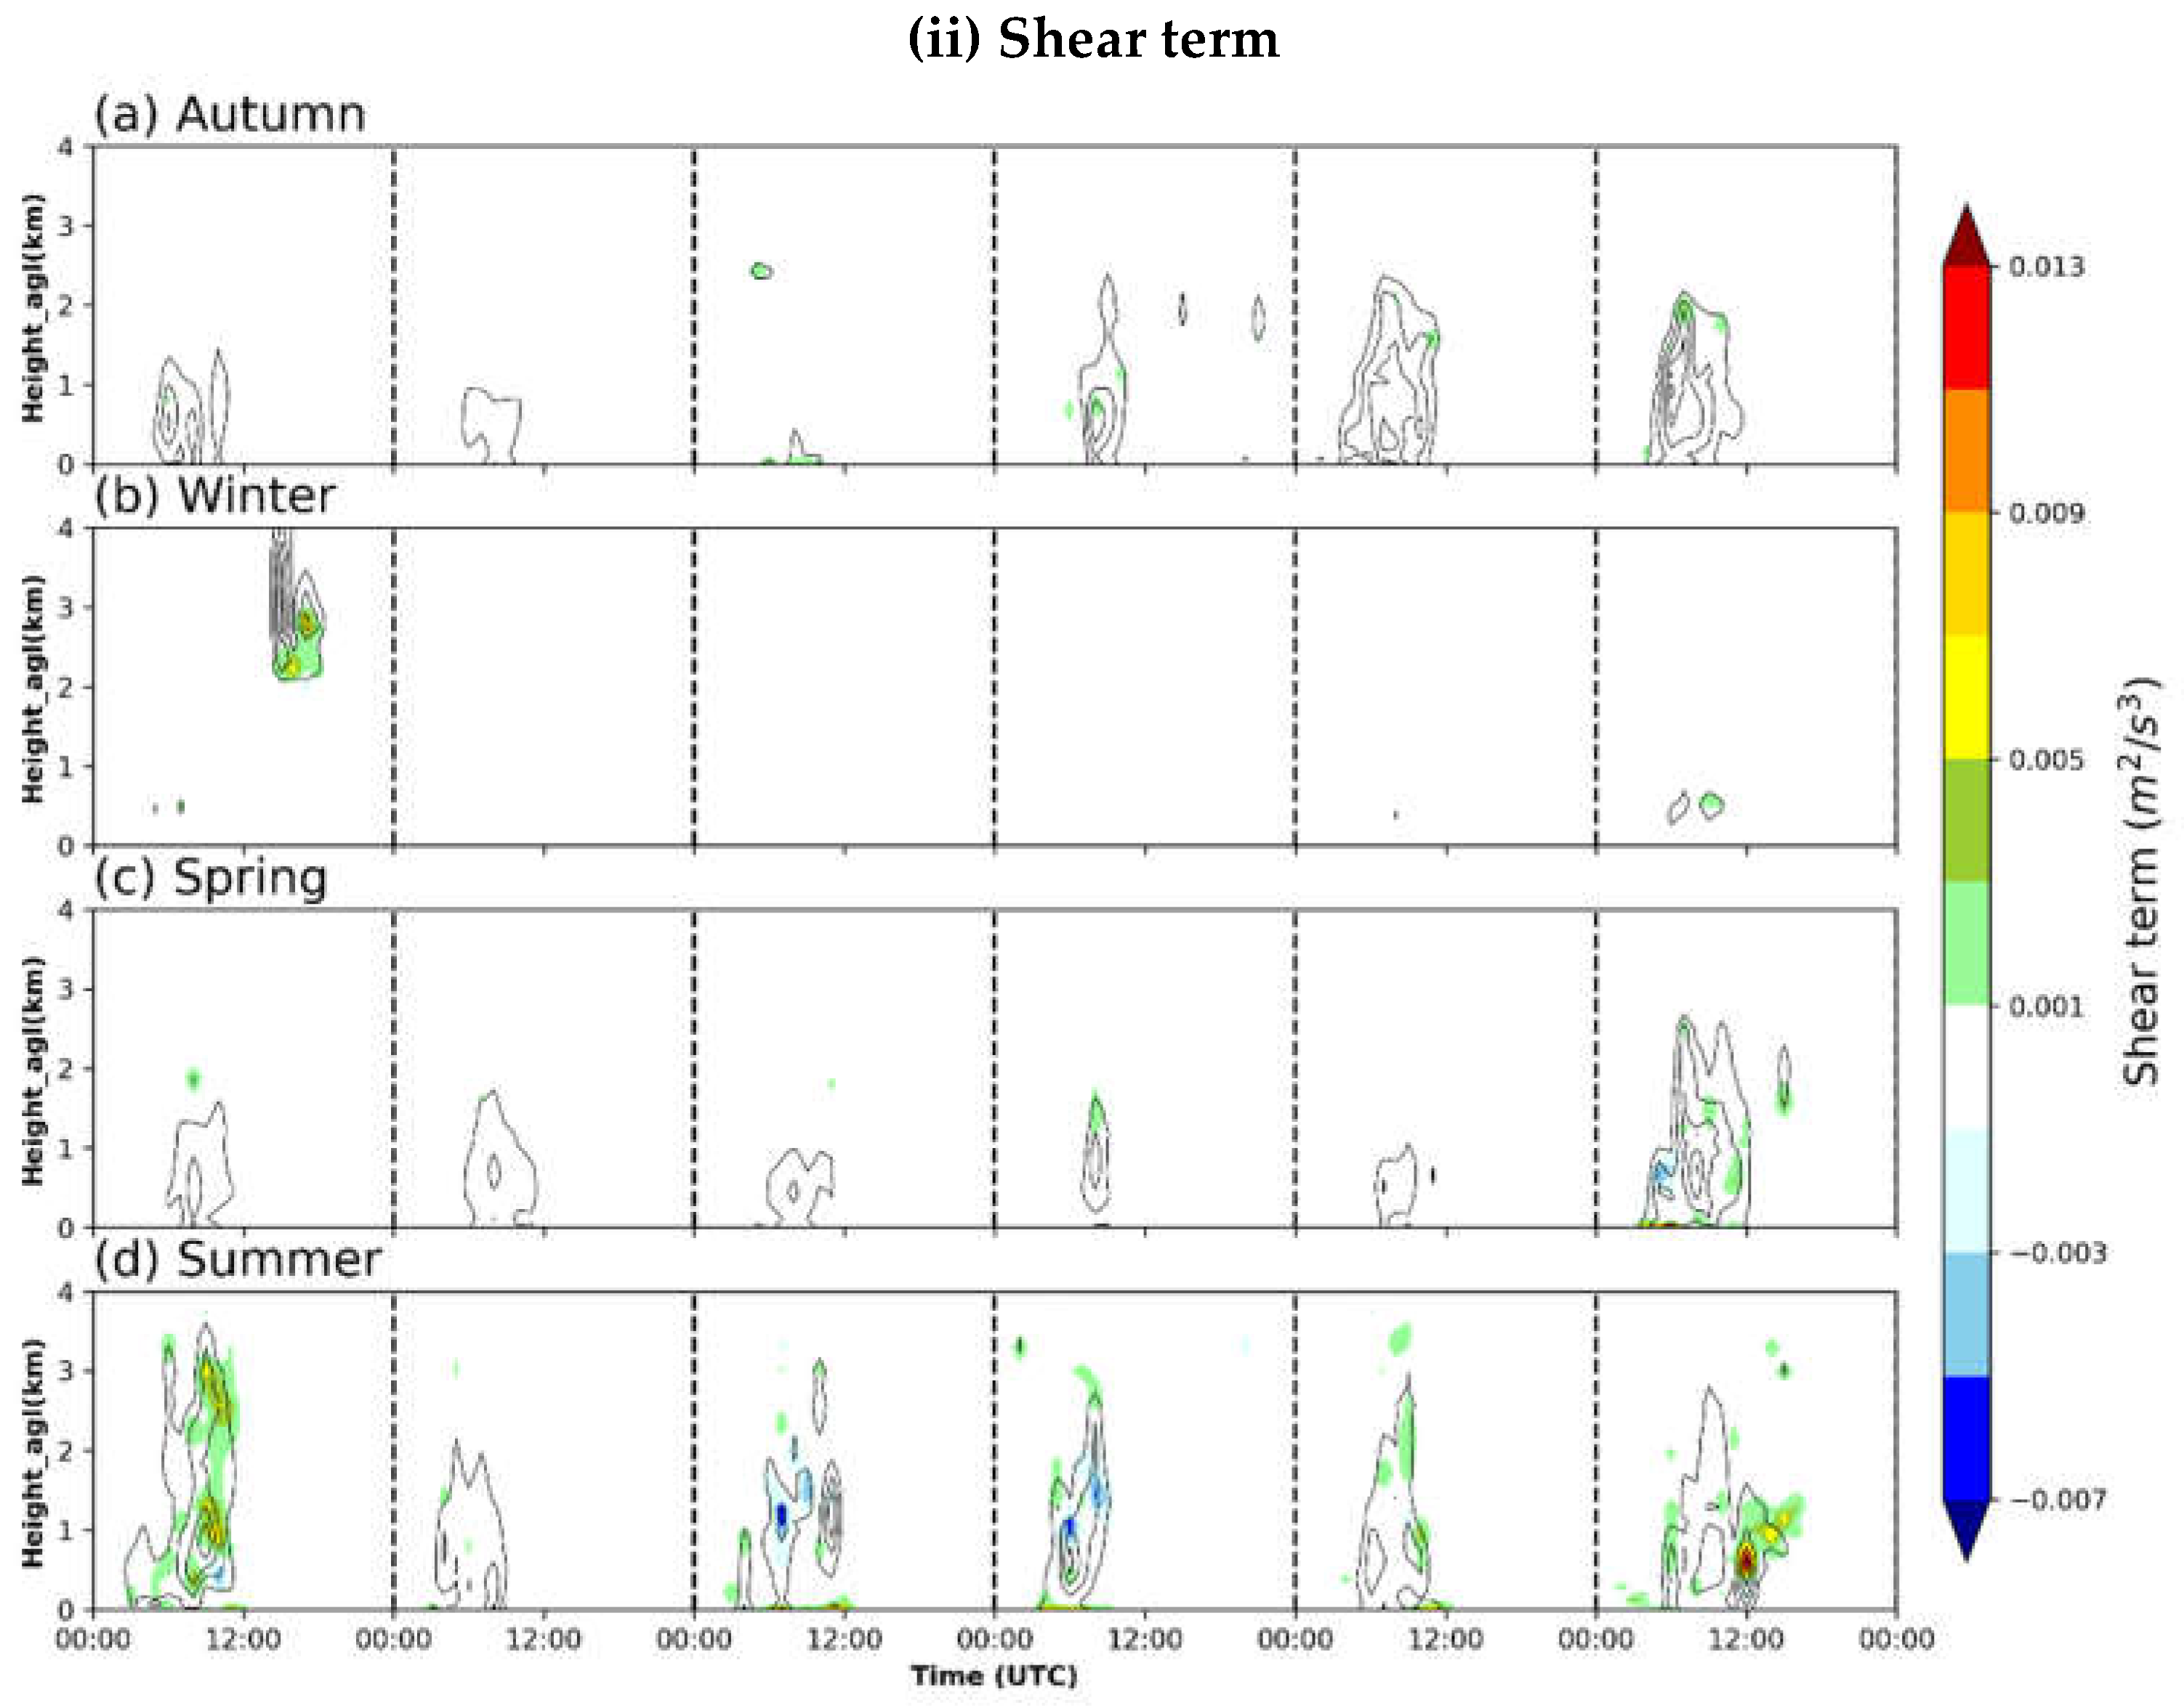
Figure 9 shows the contribution of the buoyancy term (Figure 9i) and shear term (Figure 9ii) to TKE through the budget Equation (3). It can be seen that the distribution of buoyancy terms is basically consistent with that of intense TKE (Figure 8), and almost all of them make positive contributions to TKE. The strength of the buoyancy term in winter is much smaller than that in the other three seasons with maximum of around 1.84 m2 s−2. The distribution of intense TKE (>0.3 m2 s−2) is also the smallest in winter simulation, and can only reach a height of about 300–400 m. It is worth noting that the TKE anomaly on the first day of winter is also reflected in the buoyancy term. For the high-intensity TKE (up to 1.84 m2 s2) generated during 15:00 UTC-18:00 UTC at a height of 2–3 km (Figure 8(ib)) on the first day of winter, the buoyancy term here has a large negative region with weak positive values scattered around it. For the TKE generated there, the negative buoyancy term mainly inhibits the development of turbulence. The large negative buoyancy region also leads to the weak positive buoyancy compensation in the adjacent region. Compared with the distribution of TKE, the distribution of buoyancy term is closer to the distribution of temperature difference, especially in summer simulation, which means that a more accurate buoyancy force in LES leads to larger potential temperature difference between the PBL and LES domains.
For the shear term, its intensity and distribution range are relatively small compared with that of the buoyancy term. Most of the time, the shear term floats around the value of 0.003~0.006 m2 s−3, which is more common in autumn, winter, and spring. When shear and buoyancy terms show a positive contribution, there is a significant increase in TKE in the region, such as the high TKE region on the first day of summer in Figure 8(id). For weaker turbulence, the shear term’s contribution is also weak and usually at around 0. The anomaly on the first day of winter is well explained by the shear term: the shear term has a high positive contribution to the TKE in this area, while the buoyancy term appears negative, cancelling out part of the positive contribution of the shear term.
Combining the two terms of the TKE budget equation, the high-value region of turbulent kinetic energy is very similar to the region of large difference between the two domains, especially the difference in potential temperature simulation. The weak turbulent kinetic energy causes the wrong simulation of the PBL domain to a great extent, which is mainly manifested in the underestimation of temperature and the poor estimation of the range of horizontal wind speed in this experiment. When strong turbulent kinetic energy should be presented but is not, the PBL domain tends to underestimate the temperature of the desert PBL and misestimate the detailed characteristics of the horizontal wind field. However, neither TKE nor the distribution of its budget terms can explain the difference in the latter three days of the autumn simulation period above 2 km.

3.4.2. Cloud

The previous results show that the large errors occurring at heights above 2 km on the last three days of autumn are not related to thermal and dynamical turbulence processes. To further explore the possible causes, we analyzed the cloud processes at that time (Figure 10) since the cloud/fog process may also be different in PBL and LES domains [45].
The spatio-temporal distribution of relative humidity (RH) shows that a large range of high RH value area appears in the last three days of autumn (Figure 10c). This process is captured by both the LES and PBL domains (Figure 10a,b). Meanwhile, the cloud liquid water content (CLWC) data provided by ERA5 showed (Figure 10d) that a large range of cloud (CLWC > 0.01 g·kg−1) appeared at this time. The cover range of the cloud bodies is very consistent with the simulation difference performance (potential temperature and wind speed) in autumn. According to the RH in ERA5, during the last three days, oversaturated areas appeared at the height of around 2 km on the first and third days, and a high value of liquid water content appeared in the corresponding position from CLWC chart, with a maximum value of 0.087 g·kg−1.
Compared with Figure 10a,b, the relative humidity simulated by LES and PBL domains is different. It is noticed that the difference in region is very consistent with the region of the difference in wind speed and temperature between the domains. During the latter three days, the first day of LES showed two smaller independent oversaturated regions, while the PBL domain showed a contiguous range of larger oversaturated regions. On the second day, the two domains began to show a big difference, the RH in LES decreased significantly. There was an 80% RH area at the height of 2.5 km and a dry area of 20~40% RH appeared above. PBL still showed a wide range of near saturated air and did not show the significant dry zone seen in LES. The dry zone that appeared in the LES on the second day extended until 12:00 UTC on the third day, after which the high relative humidity zone reappeared. On the fourth and fifth days, the PBL domain showed a large area with high RH, and a large oversaturation air appeared at corresponding locations of the dry air in LES domain. Compared with the RH in ERA5, PBL overestimated the oversaturation of the first two days, especially on the second day, whereas ERA5 did not show a clear large-scale oversaturated region. The RH distribution in the PBL domain was very consistent with ERA5 on the third day simulation. The LES domain misestimated the humidity conditions on the latter two days, incorrectly giving a large dry region, and did not show the corresponding oversaturation region on the third day.
The PBL and LES domains cannot give a reasonable simulation value when there is a large cloud body in the simulation period. The influence of cloud on the simulation is mainly reflected in the poor estimation of its evolution process, rather than the direct influence brought by the high value of cloud water. It can be found that although the difference in the area is distributed in the cloud, the high value area of the difference generally does not coincide with the high value area of CLWC (Figure 10d). Incorrect estimates of cloud evolution can lead to large deviations in the simulation of meteorological elements, such as temperature, humidity, and wind speed.

4. Discussion

This paper studies the performance of WRF-LES in simulating desert boundary layers. During the research process, we found that the boundary condition error of NCEP’s FNL reanalysis data used in this experiment seems to cause deviations in the simulation results, such as wind speed simulation in summer, which will severely limit the performance of LES. We hope to use different initial and boundary conditions in future studies to quantify their impact on LES performance.
At the same time, the limited sounding observation data limit our further research on the boundary layer and its turbulence characteristics (only at 00:00 UTC and 12:00 UTC). In future work, we hope to obtain more intensive sounding data to conduct this study in depth.

5. Conclusions

In this paper, in order to compare the seasonal differences in the simulation performance of the WRF-LES and the WRF-PBL in the Xinjiang desert region, we conducted one-way nested simulations for a total of 24 days out of 6 days of a representative month in each season. Both the conventional PBL scheme (ACM2) and the LES scheme well simulate the wind, temperature, and humidity characteristics at the surface and the pressure levels. The LES simulates the wind fluctuations better than the PBL and gives more reasonable temperature values with higher R2 of 0.80, 0.84, 0.93, 0.83 and lowering errors in wind speed by 14.2% (18.1% after excluding the effect of cloud), 30.8%, 17%, and 27.3% for autumn, winter, spring, and summer, respectively. However, some poor boundary conditions provided to the LES by the PBL domain affect the simulation performance of the LES.
In the simulated spatio-temporal variations, both LES and PBL domains exhibit cold deviations in temperature. The deviations in winter and summer are the largest of the four seasons due to the influence of the boundary conditions, which offer the most opportunity for the LES to improve the simulation compared to the PBL. For the horizontal wind speed simulations, the simulation performance is also strongly influenced by the seasonal atmospheric background. With the largest and smallest mean winds in summer and winter, the worst and best simulation performance was conducted, with mean errors of 0.04 and −4.44 ms−1, respectively. Compared to PBL, the optimized performance of LES is 20.14% and 36.06% in potential temperature and wind speed, respectively. In spring and autumn, both simulations of wind speed and temperature show a near stable performance for both schemes, and the differences between the PBL and LES domains are smaller.
In order to measure the turbulence effect on the LES and PBL simulation, we introduce the TKE and its budget equation to analyze its error performance. The results show that in the desert region, the TKE generation and cancellation are generally between 02:00 UTC and 12:00 UTC in a day, and the buoyancy term is the main contributor to the TKE. TKE is strongest in the summer and weakest in the winter with intensity peaks of 1.84 and 4.03 m2s−2, respectively. For the TKE anomalies caused by winter nighttime jet streams, the shear term is the main contributor. The simulation difference in wind speed and potential temperature in PBL and LES is highly correlated with different TKE simulations in the two domains. In the case of strong TKE in summer, the differences in variables between the two domains were almost identical with the distribution of strong TKE. When a large cloud body occurred in the simulation area, neither LES nor PBL domain can accurately simulate the cloud evolution process and its impact on meteorological elements, resulting in large errors.
Our study found a seasonal feature in the optimality of LES compared to PBL in simulations in the desert region of Xinjiang, and this feature is highly correlated with accurate turbulence simulation. Future work could aim to establish this correlation as a statistical relationship and further model it to improve the PBL parameterization scheme.

Supplementary Materials

The following supporting information can be downloaded at: https://www.mdpi.com/article/10.3390/rs16030558/s1. Figure S1: The comparison of profiles during the autumn simulation, where (a)–(f) are comparisons at 12:00 UTC and (g)–(m) are at 00:00 UTC. Figure S2–S4 are similar to Figure S1, but for profiles in winter, spring, and summer, respectively.

Author Contributions

Conceptualization, X.X. and Z.G.; methodology, X.L.; software, X.X.; validation, X.X., Z.G. and Y.Z.; formal analysis, X.X. and X.L.; data curation, X.X.; writing—original draft preparation, X.X.; writing—review and editing, X.L., Y.Z. and J.S.; visualization, X.X.; supervision, X.L. and Z.G. All authors have read and agreed to the published version of the manuscript.

Funding

This research received no external funding.

Data Availability Statement

The NCEP FNL Analysis data were freely downloaded from https://rda.ucar.edu/datasets/ds083.3/, accessed on 25 July 2023. The ERA5 reanalysis data can be downloaded from https://cds.climate.copernicus.eu/cdsapp#!/dataset/reanalysis-era5-pressure-levels, accessed on 25 July 2023. The simulation and measurements data are available upon request to [email protected].

Acknowledgments

Special thanks to Ming Guan for the technical support in this article.

Conflicts of Interest

The authors declare no conflicts of interest.

References

  1. Wang, M.; Wei, W.; He, Q.; Yang, Y.; Fan, L.; Zhang, J. Summer atmospheric boundary layer structure in the hinterland of Taklimakan Desert, China. J. Arid. Land 2016, 8, 846–860. [Google Scholar] [CrossRef]
  2. Xu, H.; Wang, Y.; Wang, M. The performance of a scale-aware nonlocal PBL scheme for the subkilometer simulation of a deep CBL over the Taklimakan desert. Adv. Meteorol. 2018, 2018, 8759594. [Google Scholar] [CrossRef]
  3. Huang, J.; Wang, T.; Wang, W.; Li, Z.; Yan, H. Climate effects of dust aerosols over East Asian arid and semiarid regions. J. Geophys. Res. Atmos. 2014, 119, 11–398. [Google Scholar] [CrossRef]
  4. Yang, F.; Huang, J.; Zhou, C.; Yang, X.; Ali, M.; Li, C.; Pan, H.; Huo, W.; Yu, H.; Liu, X. Taklimakan desert carbon-sink decreases under climate change. Sci. Bull. 2020, 65, 431–433. [Google Scholar] [CrossRef] [PubMed]
  5. Fan, J.; Yue, X.; Sun, Q.; Wang, S. Case study of dust event sources from the Gobi and Taklamakan deserts: An investigation of the horizontal evolution and topographical effect using numerical modeling and remote sensing. J. Environ. Sci. 2017, 56, 62–70. [Google Scholar] [CrossRef]
  6. Meng, L.; Yang, X.; Zhao, T.; He, Q.; Lu, H.; Mamtimin, A.; Huo, W.; Yang, F.; Liu, C. Modeling study on three-dimensional distribution of dust aerosols during a dust storm over the Tarim Basin, Northwest China. Atmos. Res. 2019, 218, 285–295. [Google Scholar] [CrossRef]
  7. Lothon, M.; Lohou, F.; Pino, D.; Couvreux, F.; Pardyjak, E.; Reuder, J.; Vilà-Guerau de Arellano, J.; Durand, P.; Hartogensis, O.; Legain, D. The BLLAST field experiment: Boundary-layer late afternoon and sunset turbulence. Atmos. Chem. Phys. 2014, 14, 10931–10960. [Google Scholar] [CrossRef]
  8. Jiangang, L.; Yinhuan, A.; Zhaoguo, L.; Mamtimin, A. Characteristics of atmospheric boundary layer over the Badain Jaran desert in summer. J. Desert Res. 2014, 34, 488–497. [Google Scholar] [CrossRef]
  9. Takemi, T. Structure and evolution of a severe squall line over the arid region in northwest China. Mon. Weather Rev. 1999, 127, 1301–1309. [Google Scholar] [CrossRef]
  10. Liu, J.; Liu, W.; Long, X.-E.; Chen, Y.; Huang, T.; Huo, J.; Duan, L.; Wang, X. Effects of nitrogen addition on C: N: P stoichiometry in moss crust-soil continuum in the N-limited Gurbantünggüt Desert, Northwest China. Eur. J. Soil Biol. 2020, 98, 103174. [Google Scholar] [CrossRef]
  11. Hong, S.-Y.; Pan, H.-L. Nonlocal boundary layer vertical diffusion in a medium-range forecast model. Mon. Weather Rev. 1996, 124, 2322–2339. [Google Scholar] [CrossRef]
  12. Mellor, G.L.; Yamada, T. Development of a turbulence closure model for geophysical fluid problems. Rev. Geophys. 1982, 20, 851–875. [Google Scholar] [CrossRef]
  13. Shin, H.H.; Dudhia, J. Evaluation of PBL parameterizations in WRF at subkilometer grid spacings: Turbulence statistics in the dry convective boundary layer. Mon. Weather Rev. 2016, 144, 1161–1177. [Google Scholar] [CrossRef]
  14. Jia, W.; Zhang, X. The role of the planetary boundary layer parameterization schemes on the meteorological and aerosol pollution simulations: A review. Atmos. Res. 2020, 239, 104890. [Google Scholar] [CrossRef]
  15. Letzel, M.O.; Krane, M.; Raasch, S. High resolution urban large-eddy simulation studies from street canyon to neighbourhood scale. Atmos. Environ. 2008, 42, 8770–8784. [Google Scholar] [CrossRef]
  16. Schmidt, H.; Schumann, U. Coherent structure of the convective boundary layer derived from large-eddy simulations. J. Fluid Mech. 1989, 200, 511–562. [Google Scholar] [CrossRef]
  17. Heath, N.K.; Fuelberg, H.E.; Tanelli, S.; Turk, F.J.; Lawson, R.P.; Woods, S.; Freeman, S. WRF nested large-eddy simulations of deep convection during SEAC4RS. J. Geophys. Res. Atmos. 2017, 122, 3953–3974. [Google Scholar] [CrossRef]
  18. Wu, L.; Liu, Q.; Li, Y. Tornado-scale vortices in the tropical cyclone boundary layer: Numerical simulation with the WRF–LES framework. Atmos. Chem. Phys. 2019, 19, 2477–2487. [Google Scholar] [CrossRef]
  19. Bryan, G.H.; Wyngaard, J.C.; Fritsch, J.M. Resolution requirements for the simulation of deep moist convection. Mon. Weather Rev. 2003, 131, 2394–2416. [Google Scholar] [CrossRef]
  20. Kim, S.-W.; Park, S.-U. Coherent structures near the surface in a strongly sheared convective boundary layer generated by large-eddy simulation. Bound. Layer Meteorol. 2003, 106, 35–60. [Google Scholar] [CrossRef]
  21. Moeng, C.; Dudhia, J.; Klemp, J.; Sullivan, P. Examining two-way grid nesting for large eddy simulation of the PBL using the WRF model. Mon. Weather Rev. 2007, 135, 2295–2311. [Google Scholar] [CrossRef]
  22. Talbot, C.; Bou-Zeid, E.; Smith, J. Nested mesoscale large-eddy simulations with WRF: Performance in real test cases. J. Hydrometeorol. 2012, 13, 1421–1441. [Google Scholar] [CrossRef]
  23. Liu, Y.; Warner, T.; Liu, Y.; Vincent, C.; Wu, W.; Mahoney, B.; Swerdlin, S.; Parks, K.; Boehnert, J. Simultaneous nested modeling from the synoptic scale to the LES scale for wind energy applications. J. Wind. Eng. Ind. Aerodyn. 2011, 99, 308–319. [Google Scholar] [CrossRef]
  24. Green, B.W.; Zhang, F. Numerical simulations of h urricane k atrina (2005) in the turbulent gray zone. J. Adv. Model. Earth Syst. 2015, 7, 142–161. [Google Scholar] [CrossRef]
  25. Deng, X.; He, D.; Zhang, G.; Zhu, S.; Dai, R.; Jin, X.; Fu, W.; Shen, W.; Chen, J.; Fan, Y. Comparison of horizontal wind observed by wind profiler radars with ERA5 reanalysis data in Anhui, China. Theor. Appl. Climatol. 2022, 150, 1745–1760. [Google Scholar] [CrossRef]
  26. Lv, Y.; Guo, J.; Li, J.; Cao, L.; Chen, T.; Wang, D.; Chen, D.; Han, Y.; Guo, X.; Xu, H. Spatiotemporal characteristics of atmospheric turbulence over China estimated using operational high-resolution soundings. Environ. Res. Lett. 2021, 16, 054050. [Google Scholar] [CrossRef]
  27. Miao, Y.; Liu, S.; Guo, J.; Huang, S.; Yan, Y.; Lou, M. Unraveling the relationships between boundary layer height and PM2.5 pollution in China based on four-year radiosonde measurements. Environ. Pollut. 2018, 243, 1186–1195. [Google Scholar] [CrossRef] [PubMed]
  28. Hersbach, H.; Bell, B.; Berrisford, P.; Biavati, G.; Horányi, A.; Muñoz Sabater, J.; Nicolas, J.; Peubey, C.; Radu, R.; Rozum, I.; et al. ERA5 Hourly Data on Pressure Levels from 1940 to Present. Copernicus Climate Change Service (C3S) Climate Data Store (CDS). 2023. Available online: https://doi.org/10.24381/cds.bd0915c6 (accessed on 30 August 2023).
  29. Pleim, J.E. A combined local and nonlocal closure model for the atmospheric boundary layer. Part I: Model description and testing. J. Appl. Meteorol. Climatol. 2007, 46, 1383–1395. [Google Scholar] [CrossRef]
  30. Wang, Y.; Sayit, H.; Mamtimin, A.; Zhu, J.; Zhou, C.; Huo, W.; Yang, F.; Yang, X.; Gao, J.; Zhao, X. Evaluation of five planetary boundary layer schemes in WRF over China’s largest semi-fixed desert. Atmos. Res. 2021, 256, 105567. [Google Scholar] [CrossRef]
  31. Meng, L.; Zhao, T.; Yang, X.; Liu, C.; He, Q.; Duan, J.X. An assessment of atmospheric boundary layer schemes over the Taklimakan Desert hinterland. J. Meteorol. Sci. 2018, 38, 157–166. [Google Scholar]
  32. Wyngaard, J.C. Toward numerical modeling in the “Terra Incognita”. J. Atmos. Sci. 2004, 61, 1816–1826. [Google Scholar] [CrossRef]
  33. Zhang, X.; Bao, J.-W.; Chen, B.; Grell, E.D. A three-dimensional scale-adaptive turbulent kinetic energy scheme in the WRF-ARW model. Mon. Weather Rev. 2018, 146, 2023–2045. [Google Scholar] [CrossRef]
  34. Dudhia, J. Numerical study of convection observed during the winter monsoon experiment using a mesoscale two-dimensional model. J. Atmos. Sci. 1989, 46, 3077–3107. [Google Scholar] [CrossRef]
  35. Mlawer, E.J.; Taubman, S.J.; Brown, P.D.; Iacono, M.J.; Clough, S.A. Radiative transfer for inhomogeneous atmospheres: RRTM, a validated correlated-k model for the longwave. J. Geophys. Res. Atmos. 1997, 102, 16663–16682. [Google Scholar] [CrossRef]
  36. Hong, S.-Y.; Lim, J.-O.J. The WRF single-moment 6-class microphysics scheme (WSM6). Asia-Pac. J. Atmos. Sci. 2006, 42, 129–151. [Google Scholar]
  37. Chen, F.; Dudhia, J. Coupling an advanced land surface–hydrology model with the Penn State–NCAR MM5 modeling system. Part I: Model implementation and sensitivity. Mon. Weather Rev. 2001, 129, 569–585. [Google Scholar] [CrossRef]
  38. Jiménez, P.A.; Dudhia, J.; González-Rouco, J.F.; Navarro, J.; Montávez, J.P.; García-Bustamante, E. A revised scheme for the WRF surface layer formulation. Mon. Weather Rev. 2012, 140, 898–918. [Google Scholar] [CrossRef]
  39. Friedl, M.A.; McIver, D.K.; Hodges, J.C.; Zhang, X.Y.; Muchoney, D.; Strahler, A.H.; Woodcock, C.E.; Gopal, S.; Schneider, A.; Cooper, A. Global land cover mapping from MODIS: Algorithms and early results. Remote Sens. Environ. 2002, 83, 287–302. [Google Scholar] [CrossRef]
  40. Li, X.; Pu, Z. Vertical eddy diffusivity parameterization based on a large-eddy simulation and its impact on prediction of hurricane landfall. Geophys. Res. Lett. 2021, 48, e2020GL090703. [Google Scholar] [CrossRef]
  41. Stull, R.B. An Introduction to Boundary Layer Meteorology; Springer Science & Business Media: Berlin/Heidelberg, Germany, 1988; Volume 13. [Google Scholar]
  42. Liu, Y.; Liu, Y.; Muñoz-Esparza, D.; Hu, F.; Yan, C.; Miao, S. Simulation of flow fields in complex terrain with WRF-LES: Sensitivity assessment of different PBL treatments. J. Appl. Meteorol. Climatol. 2020, 59, 1481–1501. [Google Scholar] [CrossRef]
  43. Lujun, X.U.; Huizhi, L.I.U.; Xiangde, X.U.; Qun, D.; Lei, W. Evaluation of the WRF model to simulate atmospheric boundary layer over Nagqu area in the Tibetan Plateau. Acta Meteorol. Sin. 2018, 76, 955–967. [Google Scholar] [CrossRef]
  44. Cui, C.; Bao, Y.; Yuan, C.; Li, Z.; Zong, C. Comparison of the performances between the WRF and WRF-LES models in radiation fog—A case study. Atmos. Res. 2019, 226, 76–86. [Google Scholar] [CrossRef]
  45. Li, X.; Pu, Z. Turbulence Effects on the Formation of Cold Fog over Complex Terrain with Large-Eddy Simulation. Geophys. Res. Lett. 2022, 49, e2022GL098792. [Google Scholar] [CrossRef]
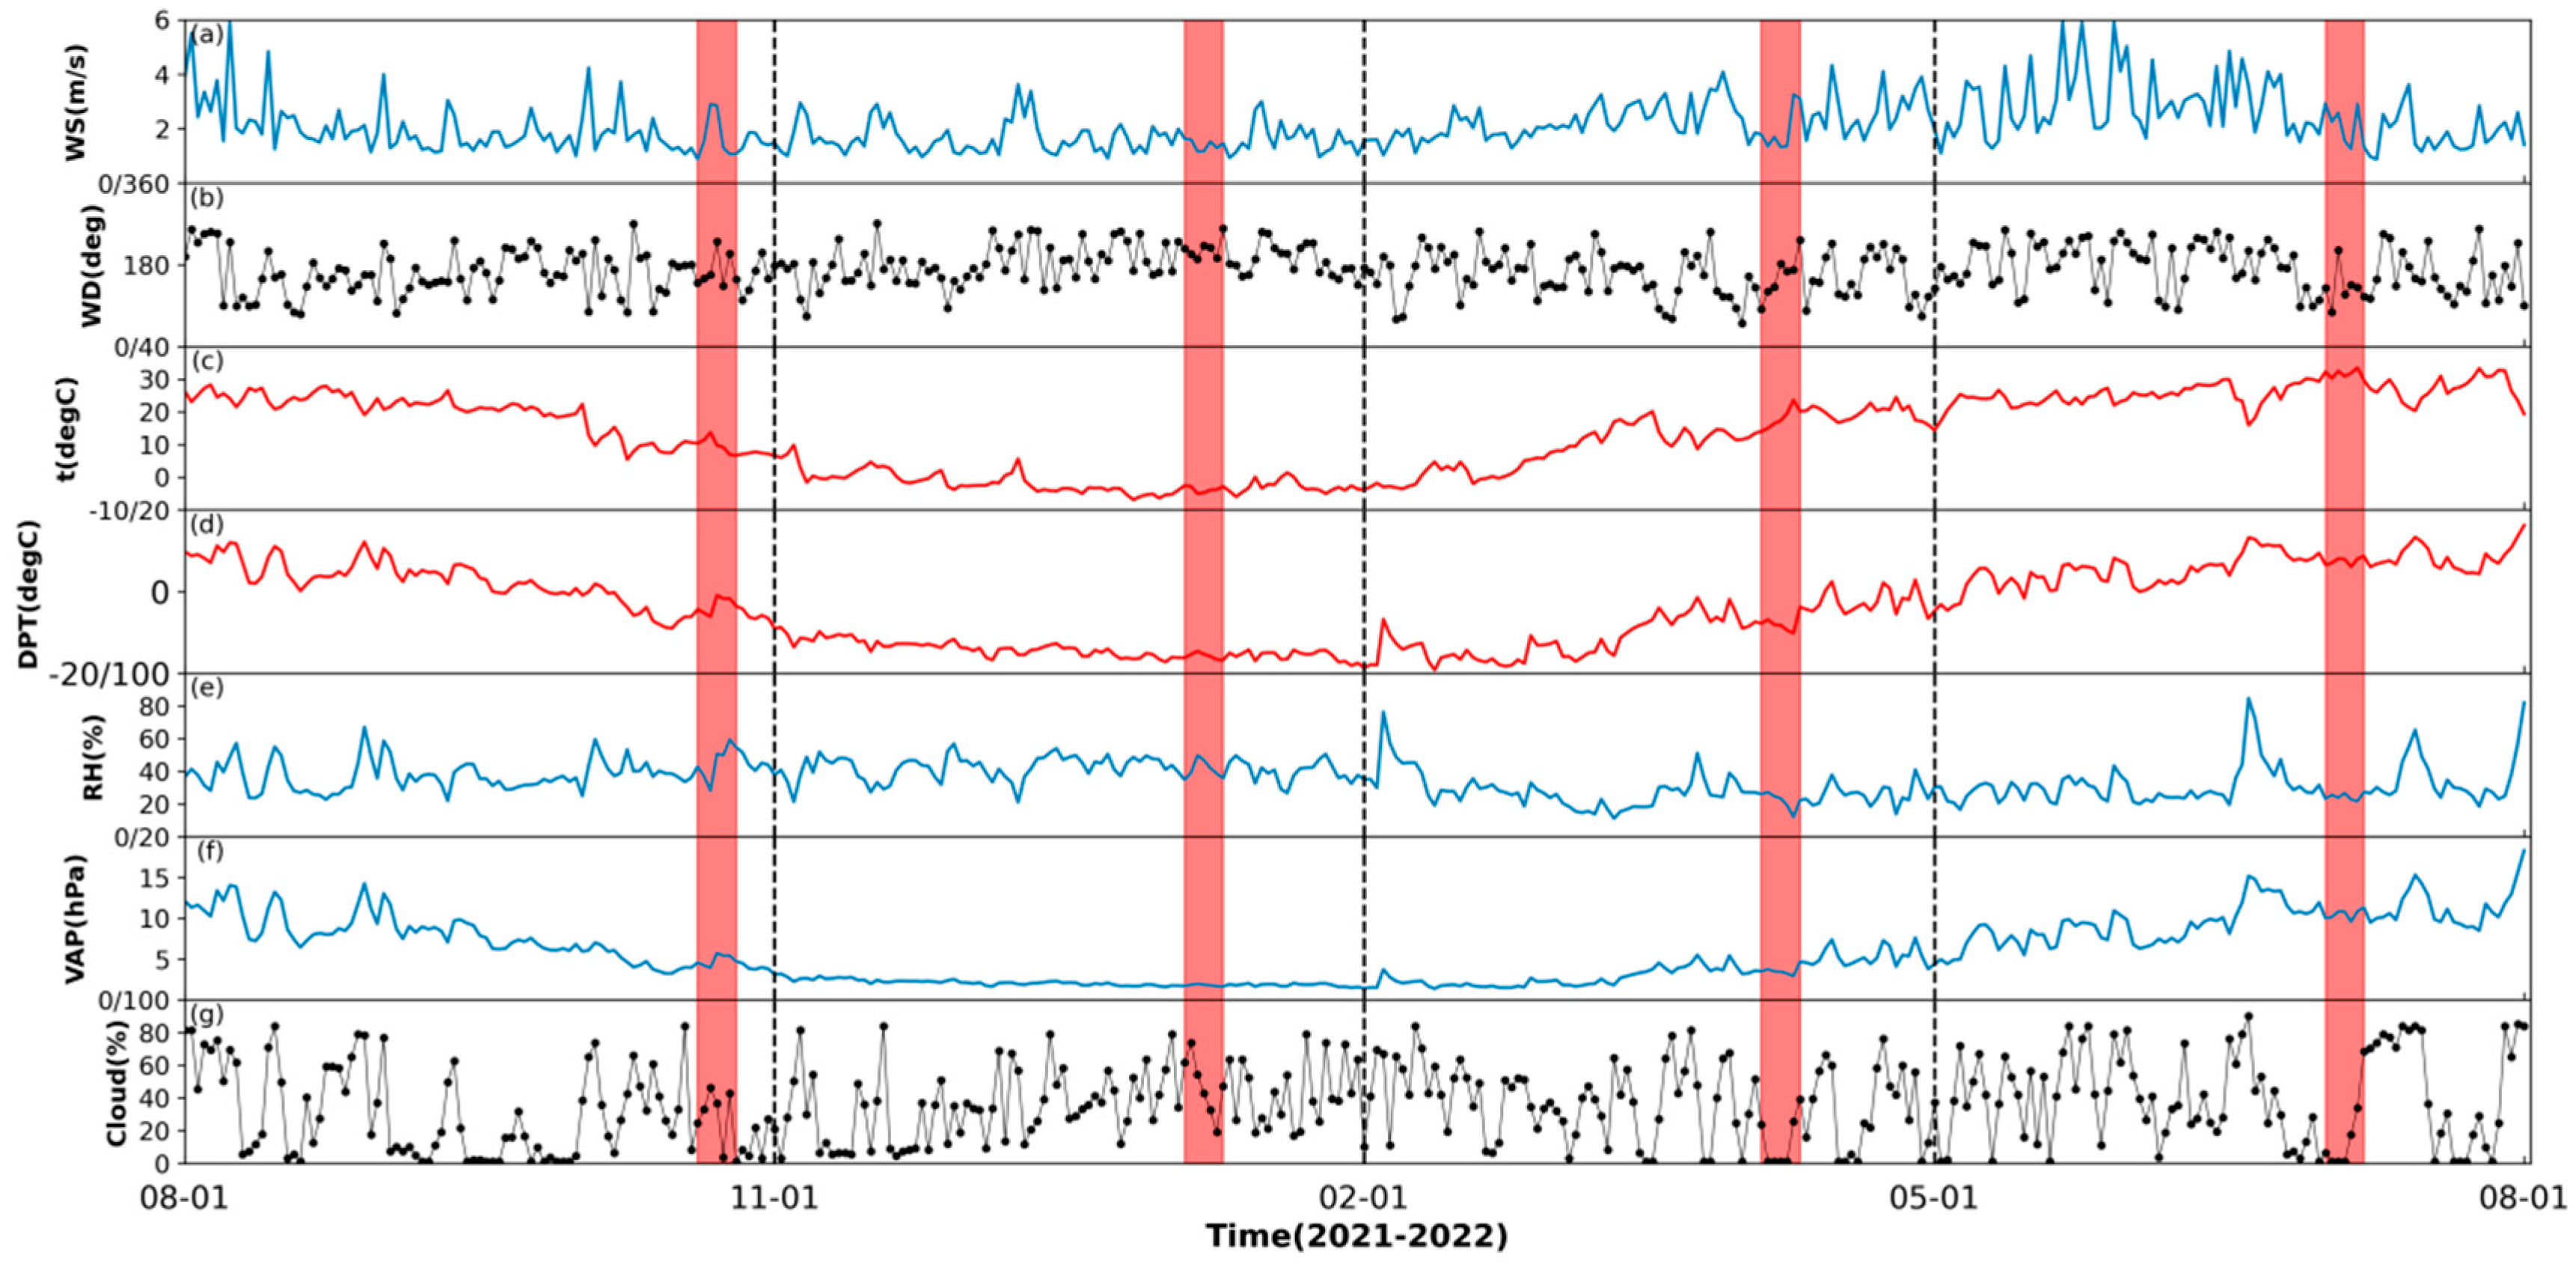
Figure 1. Annual daily average ground observation data of (a) 10 m wind speed, (b) 10 m wind direction, (c) 2 m air temperature, (d) 2 m dew point temperature, (e) 2 m relative humidity, (f) 2 m water vapor pressure, and (g) cloud cover at the Minfeng Meteorological Station from August 2021 to August 2022. The dashed line separates the season: autumn (August–November 2021), winter (November 2021–February 2022), spring (February–May 2022), and summer (May–August 2022), and the red shaded area denotes the date periods of simulation at each season.
Remotesensing 16 00558 g001
Figure 2. (a) Domain configuration of WRF model, (b) enlarged map of D04 and D05. Sign “+” stands for the location of Minfeng Meteorological Station (51839).
Remotesensing 16 00558 g002
Figure 3. Scatter plots of observed and simulated ground temperature at 2 m for four seasons. The dashed line in the figure represents the standard straight line y = x, while the red and blue lines represent the fitted lines in the LES and PBL domains, respectively.
Remotesensing 16 00558 g003
Figure 4. Time series of simulated and observed surface wind speed at 10 m in four seasons.
Remotesensing 16 00558 g004
Figure 5. Six day average profile comparison, each row from top to bottom represents autumn (ad), winter (eh), spring (il), and summer (mp), respectively, the left two columns (a,b,e,f,i,j,m,n) are the horizontal wind speed, the right two columns (c,d,g,h,k,l,o,p) are the potential temperature, the first column (a,c,e,g,i,k,m,o) of each variable is 12:00 UTC, and the second column (b,d,f,h,j,l,o,p) is 00:00 UTC.
Remotesensing 16 00558 g005aRemotesensing 16 00558 g005b
Figure 6. (a) Wind speed and (b) potential temperature error performance on all pressure levels within each season. The error value is obtained by subtracting the ERA5 data from the simulated value. In each cell separated by dashed lines, the box with the blue frame represents PBL domain and the red represents LES domain. The triangles in the boxes are the error median, and the horizontal lines are the error mean.
Remotesensing 16 00558 g006
Figure 7. The (i) potential temperature difference and (ii) horizontal wind speed difference obtained by subtracting the LES results from PBL in (a) autumn, (b) winter, (c) spring, and (d) summer. Positive and negative values are distinguished by solid lines and dotted lines, respectively.
Remotesensing 16 00558 g007
Figure 8. The TKE evolution from LES domain in (a) autumn, (b) winter, (c) spring, and (d) summer. (i) Added the contour of potential temperature difference of less than -1 K, and (ii) added the contour of wind speed difference of less than −2 ms−1 and greater than 2 ms−1.
Remotesensing 16 00558 g008
Figure 9. Similar to Figure 8, but with the distribution of (i) buoyancy and (ii) shear terms. The black line is the TKE contour.
Remotesensing 16 00558 g009aRemotesensing 16 00558 g009b
Figure 10. (a) Relative humidity in D05, (b) in D03, and (c) of ERA5. (d) The cloud liquid water content of ERA5. The contours are part of the potential temperature difference of less than −1 K.
Remotesensing 16 00558 g010
Table 1. All of the configuration information used in the WRF-LES model.
D01D02D03D04D05
Grids119 × 119120 × 120138 × 138150 × 150213 × 213
∆x(m)900030001000333111
Z_vert8181818181
Time_step9311/31/9
Bl_pblACM2ACM2ACM2NoneNone
SGSNoneNoneNoneSMS-3D-TKESMS-3D-TKE
MicrophysicsWSM6WSM6WSM6WSM6WSM6
Ra_lwRRTMRRTMRRTMRRTMRRTM
Ra_swDuhiaDuhiaDuhiaDuhiaDuhia
Cu_physicsKain-FritschNoneNoneNoneNone
Surface layerRevised_MM5Revised_MM5Revised_MM5Revised_MM5Revised_MM5
Land surfaceNoahNoahNoahNoahNoah
Table 2. Mean bias (m/s) of simulated surface wind speed at 10 m in four seasons.
AutumnWinterSpringSummer
LES−1.69−0.36−1.46−1.97
PBL−1.97−0.52−1.76−2.71
Disclaimer/Publisher’s Note: The statements, opinions and data contained in all publications are solely those of the individual author(s) and contributor(s) and not of MDPI and/or the editor(s). MDPI and/or the editor(s) disclaim responsibility for any injury to people or property resulting from any ideas, methods, instructions or products referred to in the content.