Abstract
An investigation of the Magdalenian occupation at Étiolles-Les Coudray (France) was conducted using geophysical methods. Based on ground-penetrating radar (GPR), electrical resistivity tomography (ERT), electromagnetic induction (EMI), and stratigraphic information, we present a reconstruction of the main sediment interfaces carrying the Magdalenian occupation. Étiolles-Les Coudray is one of the most important open-air campsites in the Paris Basin, where consecutive settlements distributed along the Hauldres stream were preserved by silts. The geoarchaeological goals were, in particular, the reconstruction of the ancient environment in which hunter–gatherers settled, providing spatialized known stratigraphies able to find an echo in the Seine Valley. Moreover, a focus on the capability of geophysical methods to detect archaeological features is also presented and discussed. We observed that the major reflections in the GPR records were generated from interfaces that have grain size variation: (1) the bottom of the Holocene colluvium and (2) the bottom of the upper Late Glacial silt. EMI and ERT show a very clear horizon associated with the upper Late Glacial silt, in some places even more clearly defined than with GPR. We confirmed the presence of a channel along the slope, placed under Locus 1, and a second channel of the same type globally following the paleotopography of Locus 2. We created a thickness map of the “beige sandy silt” and hypothesized a high probability of good preservation conditions of Magdalenian evidence. Finally, the detection of several localized diffraction hyperbolas in the GPR record offers the possibility to obtain the ground truth of the geophysical results in the near future and verify the nature (archaeological or geological) of these features.
1. Introduction
Mapping past hunter–gatherer landscapes remains a long-standing challenge in archaeology, primarily due to the nature of their transient and often non-permanent settlements. Over the past decades, many prospection techniques have been developed, aiming to detect the subtle and often dispersed clues—such as temporary campsites—that characterize these nomadic lifestyles. These techniques strive to navigate the inherent scale and uncertainty of such elusive evidence, which is markedly different from the more permanent and easily identifiable remains found in settled civilizations [1]. Mapping traces of prehistoric hunter–gatherers, such as temporary fireplaces or flint accumulations, is still under debate. Site conditions and the geological nature of the subsurface affect the ability to detect elusive evidence. Recently, well-structured and integrated approaches have shown how accounting for the limitations of non-invasive survey methods, as well as for the complexities of prehistoric records, supports detailed paleoenvironmental reconstructions and can provide site-specific insight into cultural activities [2,3,4]. Ground-penetrating radar (GPR) plays a central role in geoarchaeology for reconstructing past landscapes, such as ancient lake shorelines or paleochannels, which were preferential areas for human occupation [4,5,6,7,8]. Integrating geophysical prospecting with coring investigations can help to solve these detection issues and improve the interpretation of each method [9,10]. Electromagnetic induction (EMI) and ERT (electrical resistivity tomography) are often applied in conjunction with GPR [11,12,13]. The use of these methods is increasing in archaeological contexts, but they are well known for the identification of geological sediments. The literature shows several attempts to detect and recognize prehistoric hearths using GPR and magnetics [14,15,16]. In those examples, the features were located mainly within house structures, which clearly restricts the detection area. Ref. [17] shows the efficiency of GPR in detecting features such as a hearth structure made of boulders, cobbles, and abundant charcoal, characterized by hyperbolic reflections and areas with high amplitudes 0.3 m depth, while [18] presents the complexity of detecting Mesolithic fireplaces only consisting of a birch bark mat without the presence of stones. Several modeling approaches have also been carried out with the aim of understanding whether these features are detectable or not [19]; in particular, [20] displays examples of pattern recognition of modeled hearths on a sandbox, reproducing the features as they appear at the Paleolithic site of Verberie.
Étiolles-Les Coudray has yielded the longest Magdalenian sequence in the Paris Basin so far, with the oldest occupations dating to before the Bölling according to 14C dates, while the more recent dates fall within the Bölling episode ([21] Figure 2; Table 1). Consecutive settlements distributed along the Hauldres stream, slightly upstream from its point of confluence with the Seine (Figure 1a), were preserved via silts deposited by recurring slow onset floods, leaving the artifacts in place and the archaeological levels well separated from one another. Étiolles has also always been interpreted as a habitat site located very close to a flint source privileged for understanding in great detail the concepts of Magdalenian knapping techniques [22]. Archaeological evidence at Étiolles-Les Coudray displays the usage of circles of stones (of about 1.0–1.5 m diameter) circling the hearths [21,23], sometimes also recycled from one occupation to the next [21].
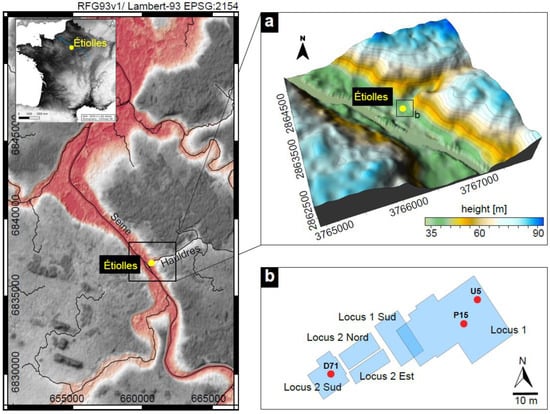
Figure 1.
DEM, including the position of the site (yellow dot). Basemap: European Digital Elevation Model (EU-DEM), version 1.1: (a) 3D visualization of the landscape surrounding Étiolles-Les Coudray; (b) Archaeological excavations displaying the location of the main Magdalenian campsites (red dots; following [21]).
Geoarchaeological investigations at Étiolles aim to understand the complex site formation processes at this location where the Hauldres stream flows into the river Seine and to reconstruct the way Magdalenian hunter–gatherers occupied this place over the course of several centuries. In this context of confluence, the stratigraphies are complex and difficult to understand by the sole use of auger soundings. The use of GPR and other geophysical methods make it possible to calibrate the visible features with the evidence found in the stratigraphy and thus help to reconstruct the synchronous topographies of the Magdalenian occupations. Both archaeological and geological questions were addressed by the geophysical measurements at Étiolles. On the entire surface of the site, the presence of boundaries between archaeological layers, solid archaeological features, such as fireplaces with rock constructions, and geological layers comprising large flint blocks (cf. [24]) were to be tested. In addition to this general endeavor, specific research questions were defined for different areas of the site.
First, the area of focus for future excavations needed to be assessed for the extent of known archaeological levels: Locus 2 Est is planned to be extended toward Locus 1 Sud (Figure 1b) and in the direction of the Hauldres stream. In that same area, the attested presence of Magdalenian occupation levels makes it possible to test the pertinence of geophysical methods for the detection of archaeological features from the Paleolithic.
The goals of the geophysical analysis were therefore as follows:
- Mapping the main sediment interfaces carrying the Magdalenian occupations (colluvium and Late Glacial silts) in order to carry out the following:
- (a)
- Reconstruct the ancient environment where hunter–gatherers settled;
- (b)
- Provide spatialized known stratigraphies able to find an echo elsewhere in the Seine Valley;
- Recognizing possible archaeological features associated with Magdalenian occupations (e.g., fireplaces) using geophysical methods.
After introducing the archaeological and geological background of the investigated area, we present the geophysical investigation at Étiolles-Les Coudray, comparing the results with the archaeological excavations. In the last section, we present a 3D reconstruction of the surveyed area integrated with the Magdalenian occupation.
2. The Magdalenian Occupations at Étiolles-Les Coudray
Étiolles-Les Coudray is one of the most important open-air Magdalenian campsites in the Paris Basin. The excavation and study of open-air sites have greatly contributed to a deeper understanding of the day-to-day life of Upper Paleolithic hunter–gatherers. The very first excavation, which took place in 1972, quickly revealed very well-preserved habitat structures. More than thirty occupational units have been unearthed thus far in two large excavation units: Locus 1 excavated from 1972 to 1994 and Locus 2 excavated from 1995 in three sub-units (Figure 1b). Both Locus 1 and Locus 2 comprise nine archaeological levels [25], and the stratigraphic relationship between these two units represents one of the research goals of the ongoing excavations. The Magdalenian dwelling structures are generally very well preserved, but the preservation of faunal remains differs between Locus 1 with unfavorable taphonomic conditions and Locus 2, which offers the opportunity to investigate economic aspects based on the fauna.
Each of the excavation portions of the camps contained one or two tents with additional hearths located in the open air, slightly further away. The largest campsite excavated comprises two habitations, U5 and P15, as well as four outdoor hearths [26]. It was set up on the inside of the meander of an ancient water channel, possibly the ancient bed of the Ru des Hauldres. The main habitation, U5, was slightly elevated and located on a large, flat area. This unit consists of a tent with solid construction features (a reconstruction is depicted in Figure 2a) and an outdoor space with flint knapping spots and waste disposal areas. Its neighbor, P15, was located at the top of the bank. The outdoor hearths lay on the slope alongside the water channel. It is not known whether it contained flowing water or was dry at the time the site was occupied.
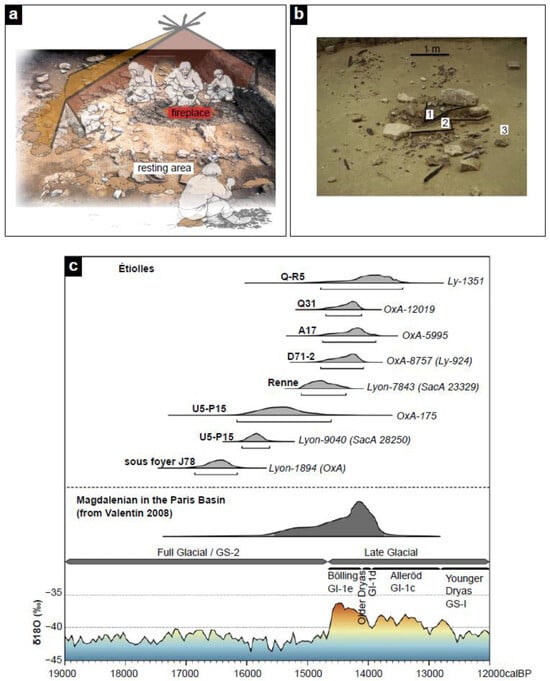
Figure 2.
Magdalenian occupation at Étiolles-Les Coudray; (a) reconstruction area of the inside of structure U5 (source: https://archeologie.culture.gouv.fr/etiolles/en/habitations-0, accessed on 20 June 2023); (b) three superimposed habitations at Étiolles (units D71) with the same fireplace (1: upper level; 2: intermediary level; 3: lower level) (photo: ARPE, following [27]): (c) selected calibrated radiocarbon dates of different levels at Étiolles-Les Coudray compared to group calibration of radiocarbon dates for the regional Magdalenian and NGRIP oxygen isotope curve (blue: cold and dry climate, red: warm and moist climate; [21] Figure 2).
The fact that the Magdalenians repeatedly returned to the site indicates that it was a traditional stopping point during their travels. The thickness of the sterile layers between the Magdalenian levels varies, making it difficult to determine how regular these occupations were. The D71 units, excavated in the 1990s and the 2000s in Locus 2, provide exceptional evidence of a short lapse of time between each occupation [21]. A thin layer of sterile silts separates three levels, indicating at least one flooding event between each occupation, and yet the Magdalenians settled at the exact same spot each time, reusing the same central fire structure and organizing their activities around it (Figure 2b). The D71 units show exceptionally well-preserved artifacts and have yielded evidence of varied activities conducted in the space surrounding the main hearth, including symbolic ones, as represented by an engraved limestone fragment [23] and some shell ornaments [28].
According to radiocarbon dates, Étiolles-Les Coudray was the Magdalenian site in the Paris Basin that was visited for the longest time [21]. The U5/P15 campsite represents the oldest occupation situated before the onset of the Late Glacial, while the other radiocarbon-dated levels of Locus 1 and the D71-2 unit originate from Greenland Interstadial 1e (Figure 2c).
3. Environmental Context
Étiolles-Les Coudray is located on the banks of the Seine, not far from the center of the Paris basin.
During the Late Glacial, the environment surrounding the confluence between the Seine and the Ru des Hauldres stream was very changeable, and the Ru des Hauldres stream was much more dynamic than during the Sub-Atlantic. These conditions were favorable for the deposition of large quantities of sediments (silt and sand) during flooding and for the preservation of the Étiolles site. Silt and sand were deposited regularly during what was probably seasonal flooding, thus preserving the remains of successive camps. The Magdalenians settled on new surfaces created by deposits of alluvium. This combination of regular climate-related flooding and the Magdalenians’ nomadic lifestyle led to camp remains being superposed in layers in the stratigraphy [25].
Due to the confluence context, site formation processes were many fold, and the resulting stratigraphy is complex. Stratigraphic investigations at Étiolles-Les Coudray have accompanied the excavations for decades and have been supplemented by manual geological augering. Annie Roblin-Jouve worked on the stratigraphy of Locus 1 and Locus 2 Sud and Nord (see [25]). Christine Chaussé has continued her work on Locus 2 Nord, and Valentina Villa investigates the archaeological profiles of Locus 1 Sud. As part of the geoarchaeological approach, Yann Le Jeune started expanding the stratigraphic record in 2015 [24] with manual and later mechanical (BRGM) auger in 2017 (Figure 3b) and used the acquired data and Magdalenian isochrone layers for the creation of a paleotopographic model of Locus 1 and Locus 2 (Figure 3c; following [24]). The most recent part of this investigation focused on the south sector of Locus 2 Est in June 2023.
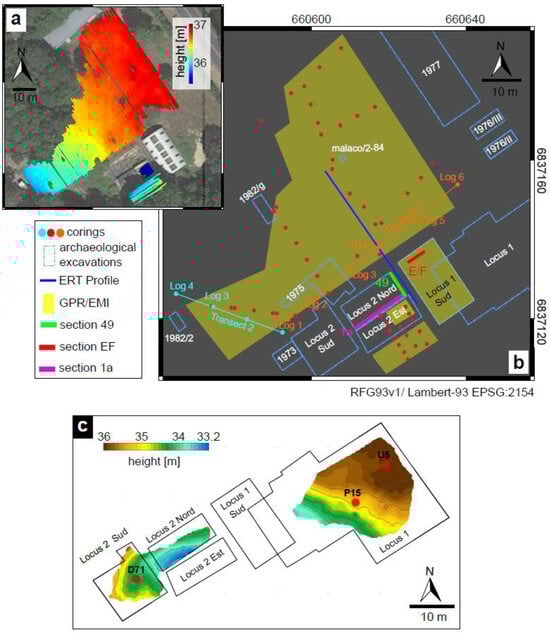
Figure 3.
(a) Étiolles-Les Coudray: topography of the investigated area. Basemap: Google Earth; (b) Étiolles-Les Coudray: location of corings (following [24]), archaeological excavations and areas investigated via GPR, EMI, and ERT; (c) paleotopography of Locus 1 and Locus 2 where habitations U5, P15, and D71 are located (following [21,24]).
The aim of the augering, in combination with the creation of a geographic information system, was to develop a first geoarchaeological model in order to understand the conservation potential of the archaeological signal at Étiolles-Les Coudray. The results can be summarized as follows:
- -
- A channel along the slope, filled with gravel and layered loamy sand, placed under Locus 1 (1 and 2 in Figure 4);
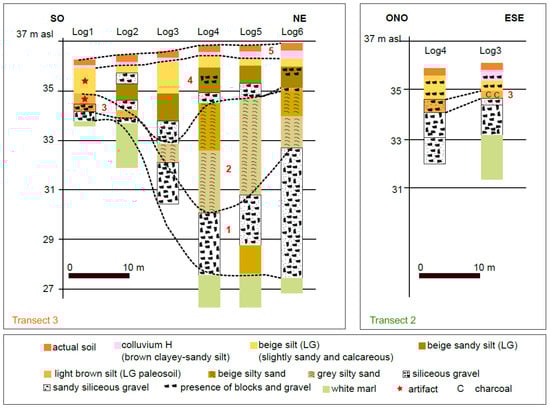 Figure 4. Transect 3 (left) and Transect 2 (right) presenting the following sequences: 1—gravels; 2—sandy silts and bedded silty sands;3—traces of pedogenesis; 4—calcareous sandy silts (facies associated with the remains excavated at Étiolles); 5—Holocene colluvium and actual soil, (following [24]). The location of the transects are reported in Figure 3.
 - -
- A second channel of the same type globally following the paleotopography of Locus 2, the northwest shore of which we cannot perceive (4 in Figure 4);
- -
- A paleosoil associated with charcoal, which was radiocarbon dated to the late Alleröd (KIA-55501: Pinus sp., 10,915 ± 45 BP, δ13C: −24.0± 0.3‰), is present in a high position on the edge of this channel (3 in Figure 4).
The Magdalenian settlement layers were preserved in calcareous silt deposits attributable to the Bölling. The transition from the sequence of gravel to silty sands, to sandy silts, and finally to calcareous silts would mean a drop in energy of the floods of the Seine in connection with climate change from the beginning of the end of the Last Glacial and deglaciation. The traces of pedogenesis observed along the edge of the channel (Figure 4) would constitute the accumulation of the slight traces of pedogenesis already observed within the deposits of Locus 2 Nord and Sud and could reflect the presence of a stable surface not covered by floods during the Bölling. This paleosoil would be favorable to the conservation of accumulated archaeological remains in contrast to the occupational levels of Locus 2, which, located within the channel, would be well separated and preserved by silt deposits. These two contexts would then constitute two archetypes reflecting two types of surfaces with potential for the preservation of a very different archaeological signal for the same period on the same site.
We can therefore focus on two sequences:
- -
- Colluvium of the Holocene (mainly Subatlantic [29]);
- -
- Calcareous sandy silts (facies associated with the remains excavated at Étiolles), usually more silty at the top and more sandy at the bottom, and locally presenting levels of blocks and gravels.
The colluvium (Supplementary Material Figure S1) appears globally thin (less than a meter) and smooths the topography inherited from the end of the Late Glacial. A deeper zone is observed around the localization of the malacological sounding of 1984 (Figure 3b). This trend is well documented by the logs of 2015. The thickness of this colluvium is also greater toward Locus 2 Sud, probably related to the filling of an inherited depression of the Late Glacial. It is interesting to note the thinness of this colluvium towards the slope (northeast) but also toward the Seine (to the west).
Late Glacial silts are less well documented due to a smaller number of logs (Supplementary Material Figure S2). We noticed a clear basin around Locus 2 (base at 33.6). It could correspond to the offset of the old channel and its filling. The sequence becomes weaker in the southwest, marking a clear and perennial bank of the channel, whereas toward the north, the thicknesses, as well as the altitudes of the base of the units (between 34.5 and 35), appear more regular. The topography of the base of this silty sequence can be related to the orientations described by some of the paleogeography of Locus 1 and 2 (Figure 3c).
4. Methods
4.1. Ground-Penetrating Radar (GPR) Surveys
GPR is a non-invasive geophysical technique that detects dielectric discontinuities in the shallow subsurface. The GPR system consists of an antenna emitting an electromagnetic wave and a second antenna receiving the reflected wave. This wave is partly reflected at interfaces in the subsurface, which makes it possible to detect sediment boundaries in the form of reflection horizons or isolated objects in the form of diffraction hyperbola [30]. The propagation of a radar signal depends on the relative dielectric permittivity (εr), which controls the propagation velocity and reflection strengths, and the electrical conductivity (σ) that causes the signal attenuation. High water content and clay sediment, for instance, strongly attenuate the radar signal and reduce the depth of investigation [30]. The depth range of the transmitted electromagnetic wave is dependent on such factors as lithology and water saturation [31]. Measurements and the interpretation of results are sometimes difficult due to the occurrence of deposits (silt and clay), which cause attenuation of the radar signal [32,33]. Other factors limiting the depth range and resolution and causing diffractions are the rough surface of the research area, vegetation cover, and groundwater level, as well as surface and subsurface infrastructure [33,34]. Penetration depth and resolution are also influenced by the GPR antenna frequency. Low-frequency antennas are favorable for greater penetration but result in a decrease in vertical resolution, which is approximately defined as a quarter of the GPR wavelength [30]. This means that the lower stratification can only be poorly imaged compared to the upper stratification.
At Étiolles, a GSSI antenna (SIR-4000) operating at 200 MHz center frequency and equipped with a prism for total station positioning was used on the entire prospection surface to measure parallel profiles oriented on the section axis of the excavation measuring grid at a distance of 0.60 m (yellow polygons in Figure 3b). The data were subsequently processed using a self-developed program called MultichannelGPR (v1.2.4.). MultichannelGPR is a collection of MATLAB® scripts for processing GPR data and is available upon request [35]. GPR processing comprised standard steps in which theparameters were manually adjusted to the datasets, such as DCremoval, time zero correction, band pass filtering (passband 50–400 MHz, chosen based on visual inspecting of radargrams during testing of frequency bands, see amplitude spectrum in Supplementary Materials S3), wave number highpass (with 0.11/m cutoff wave number) to filter out horizontal reflections, and a custom gain function (with five gain points (−20, 0, 15, 20, and 20 dB) distributed linearly along the time range of 80 ns). The velocity of the radar wave for the time-to-depth conversion was estimated to be 0.075 ± 0.005 m/ns using the hyperbola fitting function and the migration test tool of the program. We used a constant velocity as the velocity variations over the area were neglectable. The time-to-depth conversion was carried out by additionally taking the topography into account and shifting the GPR traces according to the topography. Georeferenced radargrams (vertical profiles), as well as depth slices (amplitude maps) of 0.1 m thickness, were created by summing the absolute amplitudes in these depth intervals, linear interpolated between the grid cells of size 0.05 m × 0.05 m and imported into QGIS (QGIS.org,v3.30; accessed on 22 December 2023) for archaeological interpretation.
Finally, the reflection horizons were picked using both MultichannelGPR (v1.2.4.) and the Kingdom IHS® Software 2018, which are able to display GPR data together with stratigraphic information. The picked reflectors from the vertical radar profiles were interpolated to create contour maps of each interface to derive the stratigraphy in 3D. The grid was generated using Surfer 16® by Golden Software Inc. The interpretation includes existing stratigraphic information from excavations and corings (cf. [24]).
4.2. Electromagnetic Induction (EMI)
The EMI system uses a transmitter coil creating a primary magnetic field, which penetrates the soil where induced eddy currents in the conductive soil create a secondary magnetic field, and a receiver coil measuring both the primary and the secondary magnetic fields. Hence, variations in the apparent conductivity can be visualized. EMI was applied using a CMD Mini-Explorer (GF Instruments, Brno, Czech Republic) in all zones except for Locus 1 Sud because the metal roof (hangar) would have disturbed the signals. Parallel profiles to the GPR profiles were measured at 1 m distances, and the distances between the transmitter and the receivers were 0.32, 0.71, and 1.18 m.
The dataset was measured in HCP mode, with a sampling interval of 0.1 s. Acquisition was carried out in continuous mode, meaning that the device was moved along the profile continuously while measuring GPS position and data. Some perpendicular crossing tracks were used to derive the instrument drift. An RTK-GPS (Stonex S9i GNSS) was connected to the device using a fixed fiberglass rod at a distance of 2 m from the coils, minimizing the influence of the electronics on the data. Furthermore, the handheld control device was connected via Bluetooth and carried by a second person a few meters away for the same reason. Processing the data included the following steps: (a) correcting RTK-GPS positions for each individual coil pair center offset, (b) drift correction of the data (following [36]), and (c) gridding the data using a grid increment of 1.0 m and a 2D median image filter over 3 × 3 bins on all resulting maps.
Beyond EMI mapping, we performed 1D conductivity inversions on the whole area for each grid cell of 1 m × 1 m that were subsequently stitched together. Inversion was carried out using a 1D stochastic optimization approach that combines dimension-adapting Reversible Jump Markov Chain Monte Carlo (MCMC) with Artificial Bee Colony (ABC) optimization [37]. Several solution models of simplified model geometry and a variable number of model knots were found by the code for each 1D inversion. These models were re-sampled in 0.05 m depth steps and used to calculate an average solution model. These mean 1D models for each cell were stitched together in a 3D cube and, together with their variances and covariances, are also presented in the images in this paper. All 1D inversions are independent of one another and performed with the following parameters: the minimum and maximum number of model knots were 2 and 4, respectively; bee hive size was set to 400 and maximum iterations to 200; and the number of best models used to calculate the average solution model and (co-)variances was 50. Forward modeling during the inversion processes was performed using the Low Induction Number (LIN) solution as introduced by the authors of [38].
4.3. Electrical Resistivity Tomography(ERT)
Geoelectrics measures soil resistivity, which depends on moisture and temperature. The basic principle of geoelectric methods is to measure the apparent electric resistivity of the subsurface using a four-electrode array. Four electrodes are placed along the profile, the current is applied to the two outer ones, and the voltage between the two inner ones is measured. In the case of a geoelectric profiling technique (ERT), measurements are performed automatically along a profile with equidistantly spaced electrodes. Apparent resistivity readings are taken all along the profile, beginning with the smallest electrode spacing. Electrode spacing and thus penetration depth increase during the survey until the maximum spacing is reached, which provides the deepest resistivity information [39]. Zones of different resistivity are an indication of different compositions of the subsurface, including a variation of the water and clay content. Geoelectric data is always analyzed in a tomographic inversion process, leading to images of the subsurface in terms of specific electric resistivity (electric resistivity tomography (ERT)). To improve the results, a comparison with stratigraphic information is needed.
At Étiolles, this method was applied to obtain a model of the subsurface, which can be combined with stratigraphic observations inferred from the corings and the archaeological trench (blue line in Figure 3b). The measurements were performed along profile 49 and its extension toward the building with a RESECS (GeoServe) using 48 electrodes at a distance of 1 m, measuring in Wenner-alpha and dipole–dipole configurations. The inversion was carried out using the BERT software (Boundless Electrical Resistivity Tomography, [40], v2.2), a finite element (FE) inversion software. The model of the subsurface is made of triangular cells that are small at the surface and become larger with depth, indicating a decrease in the structural resolution of ERT. A regularization parameter of λ = 20 was applied in the inversion, which was selected based on the L-curve method [41,42]. We chose 1 m electrode distance because we aimed to localize the silty sand and gravel depositions. The thickness of these deposits is locally more than1 m; therefore, the resolution of ERT fits with the field conditions.
5. Results
5.1. Ground-Penetrating Radar (GPR) Surveys
5.1.1. General Surface
After processing the GPR data, we picked the main horizons, comparing each radargram with the stratigraphy from the corings. Although some of them were not exactly located along a GPR profile, this information was still helpful in understanding the nature of the main GPR interfaces. As a first overview, we present the GPR depth slices that were corrected for local topography.
On the investigated surface, different high reflectivity areas can be observed in the GPR depth slices at different elevations. At 36.7–36.8 m asl, a zone with high reflectivity appears in front of Locus 1 Sud, where it continues down to an elevation of 34.8 m asl and toward the entrance of the parcel (Feature A in Figure 5a–d). At an elevation of 36.2–36.3 m asl, a modern installation running through the entire surface is visible as a linear feature (Feature B in Figure 5b,c). There is also a high degree of reflectivity approximately on the northeastern side of the area, continuing down to 35.8 m asl (Feature C in Figure 5b,c). Further GPR reflectors appear at an elevation of 36.1–36.2 m asl, halfway between Locus 2 Nord and the edge of the investigated surface (Feature D in Figure 5b,c). The corresponding reflectors are clearly visible in the radargram of profile 41 (green square in Figure 6), but no coring is so far available for ground truthing. The presence of several hyperbolas is also recorded in the colluvium layer. A clear, high reflectivity area can be observed at elevations of 35.50–35.60 m asl in the southwestern corner of the measured area (Feature E in Figure 5d). Profile 77 in Figure 6 indicates a sort of depression correlated to a former channel. The presence of blocks in the uppermost layer is recorded and can contribute to the creation of discontinuous reflectors within the sediments. At 35.50–35.6 m asl, a high reflectivity area is reported on the eastern sector of the investigated surface (black dashed line in Figure 5d). The combination of the GPR profiles and the coring results obtained by [15] makes it possible to correlate some of the layer boundaries observed in the corings and the reflection horizons. One example of this potential correlation is profile 29, where the above-mentioned area (black dashed line in Figure 5d) suggests that it can be associated with the thickening of block and gravel. Another example is profile 115, where the interface between Late Glacial silt and the underlying siliceous gravel, observed in Log 2 of the manual transect 2 of 2015, appears as a reflection horizon (Figure 6).
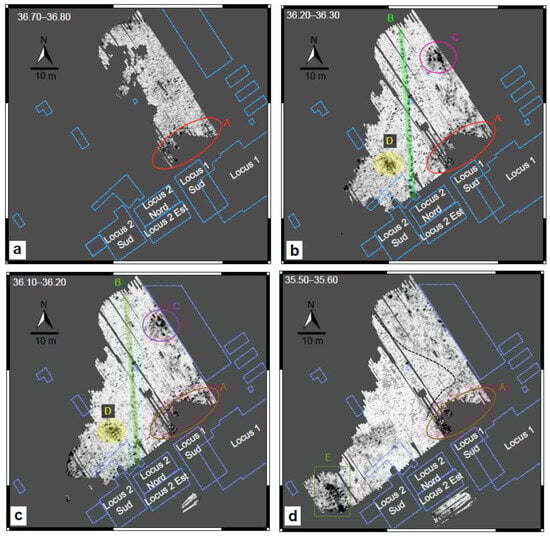
Figure 5.
GPR depth slices corrected for the local topography (a–d). The locations of the former excavations are depicted using light blue lines, while the described GPR features are displayed with letters (A-E). The dashed black line indicates a high reflectivity area probably connected to the presence of blocks and gravel.
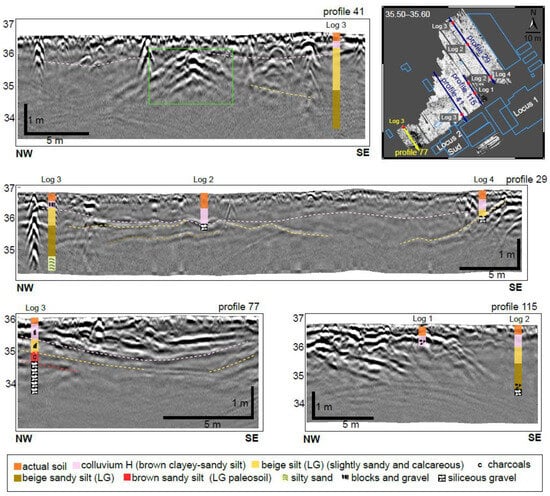
Figure 6.
GPR vertical profiles (with topography correction) together with the stratigraphy (legend in the bottom) [24]. LG: Late Glacial and H: Holocene.
The main sediment transitions that were clearly detected with GPR and corings are the bottom of the actual soil and the bottom of the Holocene colluvium (brown clayey–sandy silt, pink dashed line in Figure 6). Locally, small concentrations of hyperbolas define large, isolated reflectors (probably stones) correlated to this layer. Furthermore, the siliceous gravel accumulation is a clear interface, too; the GPR record delivers defined reflectors corresponding to the position of these deposits. However, deeper sediments, such as the beige Late Glacial silts, are less detectable and easy to follow through the profiles without the stratigraphic information.
In order to estimate the vertical resolution of the GPR survey, we examined the combination of stratigraphic columns and depth-converted radargrams. Given a radiated center frequency of 200 MHz and an average wave velocity of ~0.075 m/ns, the dominant wavelength is ~0.35 m, which shifts toward0.50 m at deeper levels due to the absorption of high frequencies. Using the quarter-wavelength criterion, the resolution limit can be estimated at 8 to 12 cm layer thickness, which matches the visual appearance of the GPR section. Maximum amplitude values are visible from the top of the section up to about 0.5 m depth (profile 29, Figure 6); below this limit, the amplitude decreases. Locally, where the gravel accumulation is present, the amplitudes are higher due to the contact with sandy silts and up to a depth of ~1/1.5 m (profile 115, Figure 6). Between 0.5 m and 1.5 m, the amplitude decreases, indicating lower contrast and attenuation of the radar waves due to the presence of silty sediment, which is dominant in the subsurface.
In summary, we can correlate the observed amplitude changes between the following major units: the Holocene colluvium (brown clayey–sandy silt) and the siliceous gravel deposition. Distinguishing between the different Late Glacial silty sediments is challenging without the stratigraphical records. The interface between the calcareous beige silt and the sandy beige silt is not visible throughout all the profiles. The amplitude of the reflection depends on the reflection coefficient, which is related to the contrast in dielectric permittivity. Typically, the values of relative dielectric permittivity are around 4–6for silty/clayey (dry) soils and 3–6 for sandy (dry) soils [43], which makes the detection of the different silty deposits difficult. Locally, the change in grain shape and grain type produces reflections, but is still not in the complete record. In conclusion, considering these conditions, GPR is able to detect the Holocene colluvial horizon and, only partially, the Late Glacial silts, making the detection of the archaeologically interesting layer challenging. It is therefore not possible to map the complete sequence of Late Glacial silty sediments with GPR. Moreover, clayey sediments affect the depth of penetration of GPR as well, which appears to be less than 2.5 m for the presented data and is therefore not enough to detect deeper archaeological interfaces.
5.1.2. Excavations
Extension of Locus 2 Est
This section focuses on a comparison between the corings and the GPR record performed between Locus 2 Est and its southernmost sector. The geophysical measurements carried out at Locus 2 Est were made~0.5 m below the ground level because of the archaeological work in this area (this is visible in the Topography map in Figure 3a). The archaeological Section 1a (Figure 7) on the southern sector of Locus 2 Nord is used for a context interpretation of the GPR profiles. The depth slices of the area between Locus 2 Est and the forest show high reflectivity values in the southwestern portion of the investigated sector.
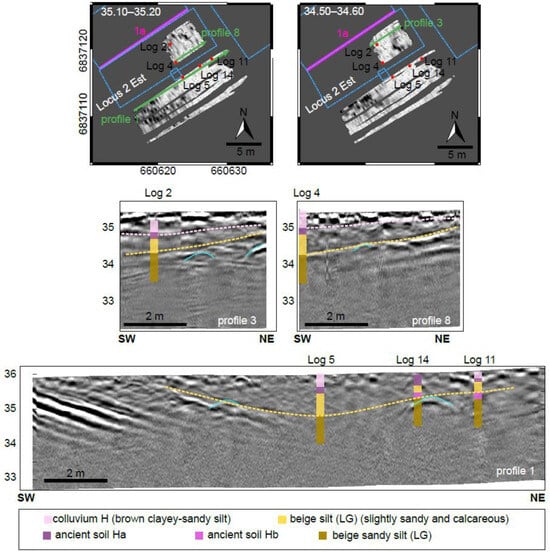
Figure 7.
(top): GPR depth slices of the investigated areas between Locus 2 Est and the southernmost part of the area with the location of the archaeological Section 1a ([25], Figure 12) and the corings undertaken in July 2023. (Bottom): comparison between the GPR profiles and the corings. LG: Late Glacial and H: Holocene.
The GPR profiles indeed show reflection horizons in the same position as the stratified silt and gravel layers in Locus 2 Nord and Est inclined towardthe northeast (profile 1 in Figure 7 bottom). The archaeological Section 1a ([25], Figure 12) is reported in the Supplementary Materials (S4) for comparison. The horizons below the coarser sediments are difficult to recognize, and the archaeological levels are not detectable. In the extension area of the present excavation surface of Locus 2 Est toward Locus 1 Sud, the GPR profiles 3 and 8 show reflection horizons that are correlated to the transition between the beige calcareous silt and the beige sandy silt. The increasing amount of sand makes it easier to separate those sediments. In association with the described layers, we notice the presence of isolated reflectors (hyperbolas), although they do not form a very clear pattern. The nature of these features is therefore a matter for further investigation. The uppermost ~0.5 m of the ground was removed during the archaeological excavations, and this improved the depth of penetration of GPR, which, in this case, was able to reach the archaeologically interesting layers.
Locus 1 Sud
The GPR survey at Locus 1 Sud was performed in the area of former excavations with the aim of understanding the deeper stratigraphy and the extension of deepening sand layering. In the profiles situated on or close to the edge toward Locus 2 Nord, reflection horizons at a depth of about 1 m are visible, which present the same inclination as the bedded silty sands in profile 49 of Locus 2 Nord (cf. [44], Figure 1b). Thus, they could represent the interface between these silty sands and the underlying sands observed in Coupe49 (profile 8 in Figure 8a). In profile 17 (Figure 8b), oriented orthogonally to the previous ones, reflection horizons seem to match the interface described above, showing an upward orientation that could correlate with a slope toward the river Seine. These layers (Figure 8b) are reminiscent of the slope of the geological layers observed in profiles E/F and R (cf. [45], Figures 1 and 2). The horizon corresponding to the sand transition was selected to provide a preliminary extension through Locus 1 Sud. Figure 8b shows that this interface presents a deeper part in the southwestern edge of Locus 1 Sud. Several hyperbolas without an organized distribution were detected, which could make a correlation with archaeological artifacts possible. Further investigations are therefore needed to understand the nature of these isolated reflectors.
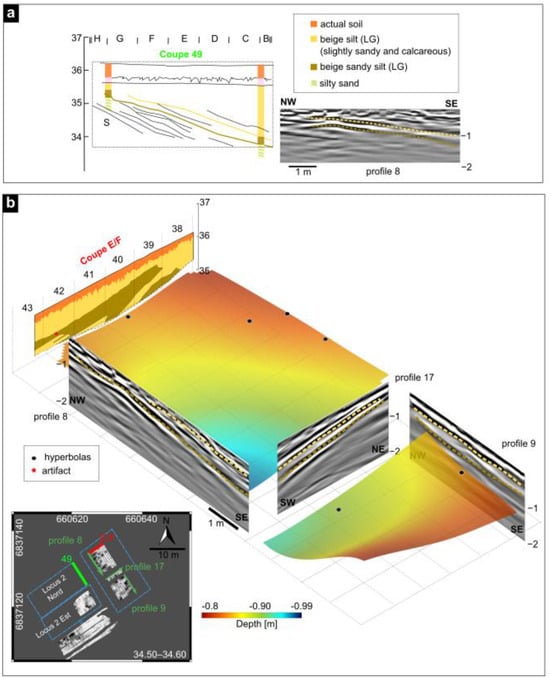
Figure 8.
Geophysical investigation at Locus 1 Sud; (a) archaeological Section Coupe49 compared with GPR profile 8; (b) 3D visualization of the picked interface and radargrams as well as archaeological section E/F for comparison.
5.2. EMI and Electrical Resistivity Tomography (ERT)
5.2.1. Electromagnetic Induction (EMI)
Figure 9a–c show the results of the EMI survey with respect to the apparent conductivity (σa)of the three different coil separations. Figure 9a refers to a depth of about 0.25–0.5 m and shows three different clusters of low conductivity zones (A,B,C). Figure 9b refers to a depth of about 0.5–1.00 m where clusters A and B seem to connect (black dashed line), and Figure 9c displays a depth of about 0.90–1.80 m in which a low conductivity area in the southwestern sector is clearly visible.
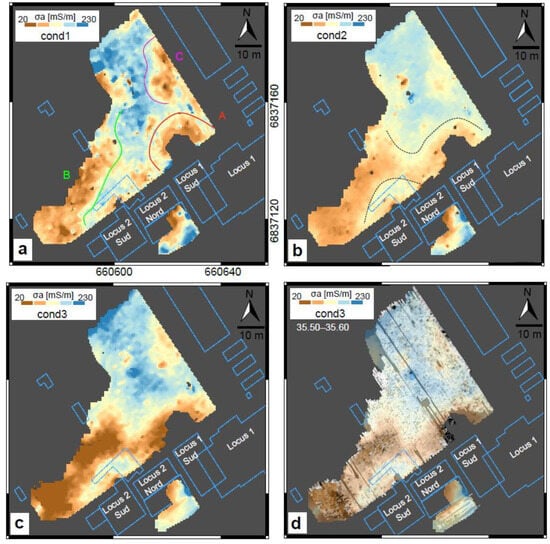
Figure 9.
Apparent conductivities of the three coil separations of a CMD Mini-Explorer (a–c); (d): comparison between EMI cond 3 and the GPR depth slice at 35.50–35.60 m asl. The described featurea are displayed with letters (A–C).
The general trend is that low values of apparent conductivity are visible in the northeastern and southwestern sectors of the investigated area. The comparison with the GPR depth slices (Figure 9d) provides a good match between the low conductivities and the high reflectivity areas (A and C in Figure 5), connecting these features to sandy sediments. Moreover, the low conductivity area on the southwesternmost corner seems to include the features D and E (Figure 5) visible in the GPR record. Regarding the investigation at Locus 2 Est and the southernmost sector, the low values of σa are located in the northwestern corner of the excavation. A comparison with the stratigraphy is presented in the following section.
5.2.2. Electrical Resistivity Tomography (ERT)
The geoelectric survey at Étiolles delivered the corresponding 2D resistivity tomography displayed in Figure 10a together with the GPR profile at the same location. The correlation with the coring results makes it possible to identify the interface between Late Glacial calcareous silt and the underlying beige sandy Late Glacial silt observed in profile 22. The presence of blocks and the siliceous gravel interface are clear in the GPR profile and in the ERT with a high resistivity area. The pseudosection shows rms residuals of 3% after four iterations with a minimum resistivity value of~16 Ωm, mainly at the top of the profile. Maximum values of ~120 Ωm are found at the middle of the profile at a depth of, more or less, 1 m as a localized high resistivity area in front of Locus 1 Sud. Validation of the ERT survey with the coring results confirms that this high resistivity area is due to the presence of sandy sediments and gravel accumulation.
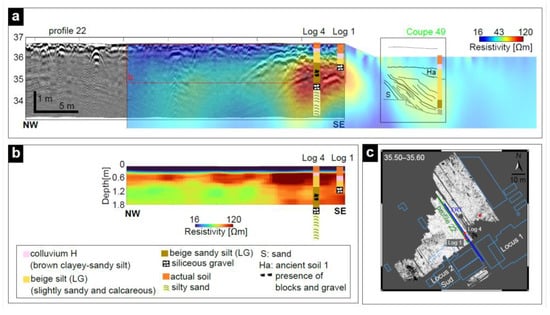
Figure 10.
(a) Comparison between the GPR profile and ERT. The stratigraphy and the archaeological section (Coupe49, [46]) are also displayed along the surveys. LG: Late Glacial and H: Holocene; (b) zoom on the inverted EMI profile at the same location as the ERT and GPR profiles presented in (a). (c) location of the GPR and ERT Profiles together with a GPR depth slice at 35.50–35.60 asl.
We also compared the ERT to the archaeological section (coupe 49) at Locus 2 Nord to understand the development of stratigraphy. While GPR profile 22 shows different reflectors with south-to-north orientations (upward), the archaeological section displays the sandy sediment with a downward tendency (north-to-south orientation). The slightly high resistivity area correlated with the location of the former excavation can be explained by taking into account the air in the soil disturbed by the archaeological work, which changes the properties of the soil in the vicinity of the trenches. The high resistivity values seem to be concentrated in one location, and the presence of blocks and gravels enables a clear detection of the ancient basin. Furthermore, Figure 10b displays the EMI profile at the same position as the ERT and GPR profiles described above. The presence of a high resistivity area is confirmed, in particular in association with blocks and gravels in the stratigraphy. At this point, other interesting aspects are to be considered. The EMI results show an upper layer with low resistivity values of <~16 Ωm (inferred from ERT as well) correlated with the upper actual soil and the colluvium (in agreement with ERT and GPR). In this profile, an internal high resistivity layer is also visible and associated with the Late Glacial beige silt, which is slightly visible in the ERT profile and is represented locally with a very weak reflector in the GPR record. The depth of investigation regarding EMI is about 2 m, which is comparable with GPR; it does not offer the possibility to map the bottom of the entire Late Glacial silt either.
5.3. Landscape Development and Magdalenian Occupation as Derived from the Geophysical Investigation
We carried out aninterpretation of the geophysical and geoarchaeological record using the Kingdom Software 2018and MultichannelGPR ( v1.2.4. ) at the same time. These programs are, among others, able to visualize the GPR profiles and compare them with the stratigraphy from the corings. The time-to-depth conversion of the two main interfaces was conducted using the velocity values presented in Section 5.1, with the aim of creating 2D maps showing the bottom of each layer. Finally, the interpolation between the profiles was carried out, thus enabling the creation of the 2D contour maps shown in Figure 11.
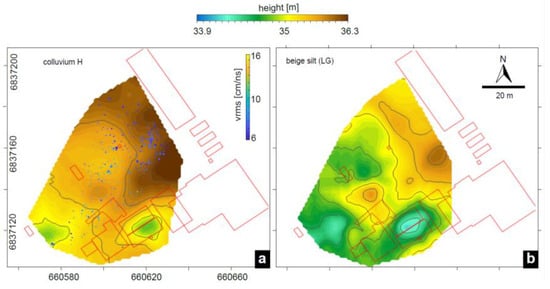
Figure 11.
Contour maps of the main investigated sediments. The red boxes represent the former archaeological excavations. (a) Contour maps of the Holocene colluvium together with the diffraction hyperbolas detected in association with this layer; (b) contour map of the Late Glacial beige silt; the location of the excavations is also reported.
The interesting transition that appeared more visible in the dataset was the bottom of the Holocene colluvium, frequently associated with several diffraction hyperbolas highlighting the presence of some isolated reflectors (Figure 11a). A cluster of several hyperbolas is located on the northeastern corner of the investigated area, which probably defines a local block concentration coming from the slope deposits (northeastern sector of the investigated area). Other single reflectors are visible in the area, mostly in the north, but so far, no pattern is visible that can connect them to archaeological features. The diffraction hyperbolas observed in different locations may represent, at least in the northeastern part of the investigated surface, large flint blocks that were deposited as detritus of the Champigny limestone (cf. [24], Figure 13). The second interesting deposit thatis essential for archaeological preservation is the Late Glacial silt, which hosts the Magdalenian occupation. The granulometry of this deposit is variable because the amount of sand increases with depth. Locally, the detection of this silt sediment was possible because of the increase in sand, and it was possible to detect the interface between beige slightly sandy and beige sandy silt sediments. It was not possible to follow the bottom of the total Late Glacial loam due to the low depth of penetration of GPR. However, we can create a contour map of the beige, slightly sandy silt and get an idea of the landscape development (Figure 11b). The slope sediments are concentrated on the eastern side of the parcel, and they probably continue in the center of the area, defining a sort of isolated hill (profile 41, Figure 6). The stratigraphic information was helpful to detect this reflector via the simultaneous survey and visualization of the picked horizons, and the stratigraphy made it possible to locate the bottom where the GPR information was weaker. The location of the paleochannel at Locus 2 is confirmed by the geophysical investigation and displayed in Figure 11b.
Comparing the calculated contour maps with the paleosurfaces carrying the archaeological evidence (U5/P15 and D71 in Figure 3), we can assume that the slope of those horizons is consistent with the geophysical data. D71, within Locus 2, sits at the bottom of a natural depression. The contour map of the beige silt displays the slope at Locus 2, which indicates that the natural depression is confirmed. The domestic units of Locus 1, on the other hand, are aligned along the upper edge of a depression. The slope at Locus 1 Sud, investigated using geophysical methods, reflects the same behavior as the deeper paleosurface hosting the U5/P15 occupation. To enable a more detailed overview of the landscape evolution, a 3D model was created and merged with archaeological information. Figure 12a–d show a 3D reconstruction of the main interfaces, including the time sequence of deposition/occupation. The oldest occupation considered in this study (there are indeed two older settlement units: Q-R 5 and niv. Inf, see [25], Figure 4) belongs to the campsite U5/P15 at Locus 1, whose paleotopography is clearly determined with a steep slope (Figure 12c). At a later date, the Magdalenians built a camp at Locus 2 at the bottom of a depression (Figure 12d). These occupations are all located on the Late Glacial silt (sandy silt) at a depth that could not be reached by means of geophysical investigation but only via archaeological excavations. The layer above the occupations is still Late Glacial beige silt but with a low amount of sand, and its paleotopography is displayed in Figure 12a. The slope identified at Locus 1 Sud is consistent with the behavior of the paleosurface carrying U5/P15. We also note that at Locus 2 Est, the slope has a north–south orientation delimiting the channel. An interesting archaeological paleosol was recognized at the edge of the slope on a higher elevation. The deposition of the colluvium (Figure 12b) follows the paleotopography of the area and is still consistent with the slopes described above.
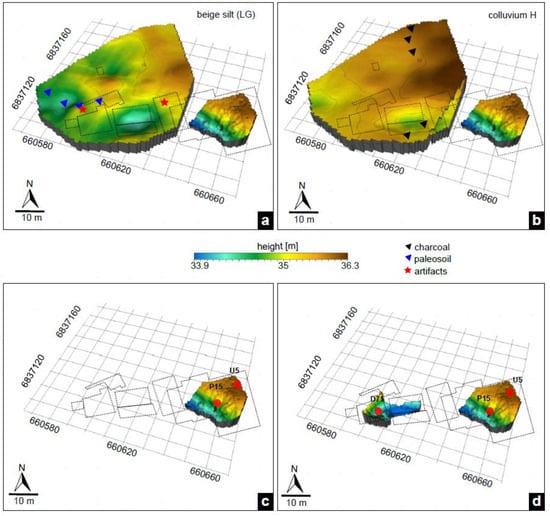
Figure 12.
Three-dimensional reconstruction of the main interfaces investigated with geophysical methods. The dotted black boxes represent the former archeological excavations. (a) 3D reconstruction of the beige silt interface; (b) 3D reconstruction of the Holocene colluvium interface; (c) Paleosurface hosting the Magdalenian occupation U5/P15; (d) paleosurface hosting the Magdalenian occupation D71.
Although the geophysical investigation did not deliver the bottom of all the interesting deposits due to a lack of signal penetration, the two paleosurfaces produced by combining known stratigraphies and GPR offer new insight into the topographies inherited from ancient alluvial morphogenesis and their Holocene erosion. From the comparison of the three subsurfaces presented in Figure 12, we can assume that the general sedimentary context is based on a significant filling leading to a gradual softening of the slopes expressed by recent Late Glacial alluvial deposits; the morphology of the surroundings of Locus 2 is that of a closed basin with an axis that was oriented west–southwest/east–northeast. It was already present in the modeling associated with level D71 and could reflect the presence of an earlier paleochannel. The modeled paleosurfaces highlight paleo-reliefs that are unknown, such as the small hill north of Locus 2 South and the presence of two basins located, respectively, to the north and to the southwest of this particular feature. These depressions are very interesting because they can indicate, such as for Locus 2, sectors with high Late Glacial sedimentation and therefore have the potential for effective identification of archaeological remains.
6. Discussion
In this paper, we present the results of a spatial landscape evolution based on a multi-method geophysical survey and coring analysis at Étiolles-Les Coudray. The results enable the reconstruction of different sediment deposits that are correlated to the Magdalenian occupation. The derived 3D model shows the location of former basins and channels where hunter–gatherers decided to settle. Apart from methodical details, we see a general confirmation of the model in the agreement between the spatio-temporal sediment deposition and the geological features mapped during the archaeological research. As described in Section 3, the model presented here can be used as a tool for determining layer thickness, which is connected to the preservation conditions in the investigated area.
The described model suggests that the mapped basin was not influenced by erosion; its shape is indeed confirmed by this investigation. Figure 13a presents a comparison with the 3D EMI inversion and the calculated contour map of the colluvium. It is noticeable how the low conductive area in the EMI results mainly follows the slope of the superimposed sediment.
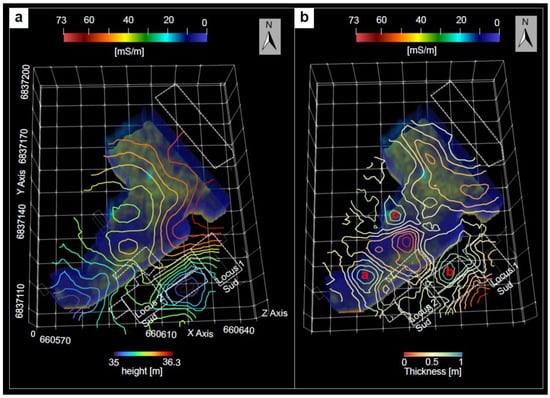
Figure 13.
(a) Three-dimensional EMI inversion results together with the calculated contour map of the colluvium; (b) 3D EMI inversion results together with a thickness calculation of the upper Late Glacial silt inferred from GPR reflectors. Letters a-c represent the areas with the higher deposition rate.
Figure 13b shows the calculated thickness of the Late Glacial silt (slightly sandy) inferred from the GPR investigation together with the 3D EMI inversion. If we compare the two different methods, we notice that there is a difference between them. The EMI seems to concentrate the thicker volume of the Late Glacial loam in the southwestern sector of the area (depicted in dark blue), while GPR pinpoints the higher deposition rate in different sectors (indicated by a, b, and c in Figure 13b). A is located on the southwesternmost corner and presents a thickness of about 0.85 m; area c is almost in the middle of the area (with a thickness of about 0.80 m), and b is at the location of Locus 2 Nord, where EMI was not measured. Between a and c, GPR indicates a thin layer of about 0.20 m, which seems to be in disagreement with EMI. But this may also be caused by the lower vertical resolution of the EMI results compared to GPR. At this location, GPR shows a sort of isolated hill (profile 41, Figure 6) whose nature has not been investigated so far but was probably formed by an accumulation of slope deposits. The EMI profile reported in Figure 10b shows that this method is sensitive to the presence of large blocks in the stratigraphy which might also be a reason for the discrepancy between the methods. Moreover, moisture and different soil parameters play a role in the interpretation of the EMI dataset. Nevertheless, our proposed thickness calculation can be used as a starting point for planning future excavation trenches, in particular for ground truthing, both geophysical methods. This procedure is very important for archaeological research because where the sediment presents a higher deposition rate, we can then assume that the preservation conditions are higher. The bottom of the upper Late Glacial silt is clearly defined in the EMI investigation but is not always clearly visible in the GPR record, which makes the joint application of both methods necessary. Unfortunately, neither GPR nor EMI were able to detect the bottom of the entire Late Glacial silt sequence, which would have been the most precise calculation of the deposition rate of the entire archaeological sequence. Field conditions and stratigraphy can affect the depth of investigation; therefore, a comparison of these methods is presented. However, we see the combination of geophysical surveying and drilling as an essential part of the chosen methodology because the corings themselves do not provide enough information regarding the paleoenvironment. The areas in which the thickness of the upper beige Late Glacial loam is higher indeed correspond to Locus 2 and the northern sector, where several charcoal findings have been found.
This joint investigation allowed us to understand that the slope toward the Ru des Hauldres stream known from Locus 2 Nord seems to continue into Locus 1 Sud. At the same time, the perpendicular slope known from Locus 1 Sud and Locus 1 in general seems to continue in the subsurface of Locus 1 Sud. The paleotopography observed thus far in the excavated area of Locus 2 Est—presenting a slope toward the northeast—seems to continue in the direction of the Hauldres stream, at least until the forest.
Additionally, Locus 2 is located downstream from Locus 1 and is therefore closer to the confluence between the Seine and the Hauldres stream ([25], Figure 3). Given D71′s situation, it would then have acted as a sediment trap, meaning that any single flood would have deposited more sediment there than in Locus 1.
Thus far, the geophysical measurements have mostly provided information on geological and topographic aspects. The evidence of clear archaeological features is unfortunately not provided by the geophysical record. We pinpointed some isolated reflectors located in both archaeological trenches and sediment depositions that are suitable for a future ground truthing of the geophysical signature. In order to detect archaeological objects and occupation layers, it would also be appropriate to repeat the GPR measurements with a 400 MHz antenna, which provides higher resolution but less depth of penetration. Interesting sectors therefore have to be chosen in a way that will yield more information for detecting archaeological features. Even if the current results have not delivered the location of archaeological remains due to the possible confusion with blocks associated with slope deposits, the perspective for detecting these features should not be abandoned because the flint accumulations or fireplaces have the potential to be detected by GPR. In order to map the deeper layers and, in particular, the bottom of the Late Glacial loam, measurements with low-frequency antennas (80 MHz) would offer the opportunity to improve the depth of penetration of GPR. The geological environment in the Paris basin, where other Magdalenian sites have been identified, such as Marsangy, Verberie, and Pincevent, presents archaeological preservation in loam sediments. The presented study can indeed improve our knowledge about the preservation conditions of Magdalenian campsites, finding a methodology and patterns that will be transferred to other areas and sites.
7. Conclusions
To study the landscape development at Étiolles-Les Coudray, we derived a 3D reconstruction of the major stratigraphic units that host the Magdalenian occupation. Our investigation was based on combining an areal GPR and EMI survey and ERT profiling with geoarchaeological information from exemplary corings. In this approach, GPR was used to detect and trace sediment interfaces in terms of dielectric permittivity all over the area, whereas the drill cores served to identify the units lithologically and to assess the spatial resolution of the GPR depth sections. We observed that the major reflections in the GPR records were generated from interfaces that have grain size variation. The two described interfaces are therefore as follows:
- -
- The bottom of the Holocene colluvium that separates clayey–sandy silt from the beige, slightly sandy silt;
- -
- The bottom of the beige, slightly sandy silt (upper Late Glacial sandy silts), in which the amount of sand increases with depth. This interface is associated with one of the latest Magdalenian levels.
Considering EMI, we concluded that the depth of investigation is comparable to GPR, and it does not provide further information but seems to be more sensitive to a higher concentration of blocks and gravels, which affect the conductivity distribution. Nevertheless, future in situ measurements are needed to understand the difference observed between the two geophysical methods.
GPR, EMI, and ERT were not able to define the bottom of the complete Late Glacial silt sequence due to the sedimentological nature of the site and the resulting limited penetration depth. However, EMI shows a very clear horizon associated with the upper Late Glacial silt, in some places even more clearly defined than with GPR. A preliminary calculation of its thickness provides a glimpse of the alluvial sediments deposited by the Seine. Based on the 3D stratigraphic model of the main interfaces at Étiolles-Les Coudray, we have come to the following conclusions:
- -
- We confirmed the presence of a channel along the slope, placed under Locus 1 and a second channel of the same type globally following the paleotopography of Locus 2.
- -
- We created a thickness map of the beige sandy silt in which we can discuss the deposition rate of the layer and hypothesize a high probability of good preservation conditions of Magdalenian evidence.
Although the modeling of the Holocene colluvium base cannot be used in terms of paleotopography for the Magdalenian period due to the associated erosion phenomena, this does not hold true for the modeling of the Late Glacial beige silts, which allows us to approximate a topographic surface that the last Magdalenians of Étiolles might have known. This will lead to future reflections on the establishment of temporary camps at Étiolles and associated landscapes.
Supplementary Materials
The following supporting information can be downloaded at https://www.mdpi.com/article/10.3390/rs16030519/s1. Figure S1: Thickness of the Holocene colluvium (contour lines at 20 cm) (following [24]); Figure S2: Thickness of the Late Glacial silts sequence (contour lines at 20 cm) (following [24]); Figure S3: Amplitude spectrum of profile 47. The colored curves are the spectra of each trace, and the thick black is for a mean trace; Figure S4: Archaeological Section 1a following [25].
Author Contributions
E.C. was responsible for the conceptualization of the study, analysis/interpretation of the data, and writing the manuscript; D.W., Y.L.J. and M.-J.W. assisted with the conceptualization of the study and revised the paper; T.W. developed the utilized software; B.V. and W.R. were responsible for funding acquisition, project supervision, and manuscript revision; N.P. and M.Z. were responsible for measuring in the field; O.B.-L., E.C.-L., L.M., V.V., Y.L.J. and M.-J.W. were responsible for manuscript revision. All authors have read and agreed to the published version of the manuscript.
Funding
This research is part of the Collaborative Research Center 1266, funded by the Deutsche Forschungsgemeinschaft (DFG, German Research Foundation- grant 290391021-SFB 1266).
Data Availability Statement
Data are available upon request from the corresponding author. The data are not yet publicly available due to needs for further research.
Acknowledgments
We would like to thank the students who helped during fieldwork: Soudabeh Jahani and Judith Freienstein. Moreover, we would like to thank Kathrin Bennet for language revision.
Conflicts of Interest
The authors declare no conflicts of interest.
References
- Leckebusch, J. Ground-penetrating Radar: A ModernThree-dimensional Prospection Method. Archaeol. Prospect. 2003, 10, 213–240. [Google Scholar] [CrossRef]
- Bates, M.R.; Bates, C.R.; Whittaker, J.E. Mixed method approaches to the investigation and mapping of buried Quaternary deposits: Examples from southern England. Archaeol. Prospect. 2007, 14, 104–129. [Google Scholar] [CrossRef]
- Verhegge, J.; Delvoie, S. Direct push, in situ video imaging of buried prehistoric landscapes in soft soils: First results in the polders, coversands, and loess belt of Belgium. Geomorphology 2021, 373, 107483. [Google Scholar] [CrossRef]
- Corradini, E.; Wilken, D.; Zanon, M.; Groß, D.; Lübke, H.; Panning, D.; Dörfler, W.; Rusch, K.; Mecking, R.; Erkul, E.; et al. Reconstructing the palaeoenvironment at the early Mesolithic site of Lake Duvensee: Ground-penetrating radar and geoarchaeology for 3D facies mapping. Holocene 2020, 30, 820–833. [Google Scholar] [CrossRef]
- Howard, A.J.; Macklin, M.G. A generic geomorphological approach to archaeological interpretation and prospection in British river valleys: A guide for archaeologists investigating Holocene landscapes. Antiquity 1999, 73, 527–541. [Google Scholar] [CrossRef]
- Bonnamour, L. Archéologie de la Saône: 150 ans de Recherche; Éditions Errance: Paris, France, 2000. [Google Scholar]
- Menotti, F. Wetland Archaeology and Beyond: Theory and Practice; Oxford University Press: Oxford, UK, 2012. [Google Scholar]
- Corradini, E.; Dreibrodt, S.; Lübke, H.; Schmölcke, U.; Wieckowska-Lüth, M.; Wunderlich, T.; Wilken, D.; Brozio, J.P.; Rabbel, W. A Day at the Bog: Preliminary Interpretation of Prehistoric Human Occupation at Ancient Lake Duvensee (Germany) by GPR Structures. Remote Sens. 2023, 15, 3647. [Google Scholar] [CrossRef]
- Tol, G.; de Haas, T.; Sevink, J.; Schepers, M.; Ullrich, B.; de Neef, W. “There’s more than meets the eye”: Developing an integrated archaeological approach to reconstruct human–environment dynamics in the Pontine marshes (Lazio, Central Italy). Geoarchaeology 2021, 36, 109–129. [Google Scholar] [CrossRef]
- Barbieri, A.; Leven, C.; Toffolo, M.B.; Hodgins, G.W.L.; Kind, C.J.; Conard, N.J.; Miller, C.E. Bridging prehistoric caves with buried landscapes in the Swabian Jura (southwestern Germany). Quat. Internat. 2018, 485, 23–43. [Google Scholar] [CrossRef]
- Vella, M.A.; Sarris, A. Geophysical survey in archaeological context: A review from Cyprus. Archaeol. Prospec. 2022, 29, 417–450. [Google Scholar] [CrossRef]
- Capizzi, P.; Cosentino, P.L.; Fiandaca, G.; Martorana, R.; Messina, P.; Vassallo, S. Geophysical investigations at the Himera archaeological site, northern Sicily. Near Surf. Geophys. 2007, 5, 417–426. [Google Scholar] [CrossRef]
- Rosado-Fuentes, A.; Arciniega-Ceballos, A.; Hernández-Quintero, E.; Arango-Galván, C.; Salas-Corrales, J.L.; Mendo-Pérez, G. Geophysical characterization, design and construction of the Teoloyucan Geophysical Test Site for archaeological and engineering applications, Central Mexico. J. Appl. Geophys. 2021, 194, 104459. [Google Scholar] [CrossRef]
- Jones, G.; Munson, G. Geophysical survey as an approach to the ephemeral campsite problem: Case studies from the northern plains. Plains Anthropol. 2005, 50, 31–43. [Google Scholar] [CrossRef]
- Urban, T.M.; Vella, C.; Bocancea, E.; Tuttle, C.A.; Alcock, S.E. A geophysical investigation of a newly discovered Early Bronze Age Site near Petra, Jordan. J. Archaeol. Sci. 2014, 42, 260–272. [Google Scholar] [CrossRef]
- Urban, T.M.; Rasic, J.T.; Alix, C.; Anderson, D.D.; Chisholm, L.; Jacob, R.W.; Manning, S.W.; Mason, O.K.; Tremayne, A.H.; Vinson, D. Magnetic detection of archaeological hearths in Alaska: A tool for investigating the full span of human presence at the gateway to North america. Quat. Sci. Rev. 2019, 211, 73–92. [Google Scholar] [CrossRef]
- Porsani, J.L.; de Matos Jangelme, G.; Kipnis, R. GPR survey at Lapa do Santo archaeological site, Lagoa Santa karstic region, Minas Gerais state, Brazil. J. Archaeol. Sci. 2010, 37, 1141–1148. [Google Scholar] [CrossRef]
- Corradini, E.; Groß, D.; Wunderlich, T.; Lübke, H.; Wilken, D.; Erkul, E.; Schmölcke, U.; Rabbel, W. Finding Mesolithic Sites: A Multichannel Ground-Penetrating Radar (GPR) Investigation at the Ancient Lake Duvensee. Remote Sens. 2022, 14, 781. [Google Scholar] [CrossRef]
- Ryazantsev, P.; Tarasov, A.; Potakhin, M. Archaeological prospection of a prehistoric lithic workshop site using ground penetrating radar with a high-frequency antenna unit. Archaeol. Prospect. 2023, 30, 341–355. [Google Scholar] [CrossRef]
- Thompson, J.R. Views to the Past: Faunal and Geophysical Analysis of the Open-Air upper Paleolithic Site of Verberie. Ph.D. Thesis, The University of Iowa, Iowa City, IA, USA, 2011. [Google Scholar]
- Caron-Laviolette, E.; Bignon-Lau, O.; Olive, M. (Re)occupation: Following a Magdalenian group through three successive occupations at Étiolles. Quat. Int. 2018, 498, 12–29. [Google Scholar] [CrossRef]
- Pigeot, N. Magdaléniens d’Étiolles. Économie de Débitage et Organisation Spatiale; XVème supplément à Gallia-Préhistoire; Éditions du CNRS: Paris, France, 1987. [Google Scholar]
- Fritz, C.; Tosello, G. Exceptional evidence of palaeolithic art in the Paris Basin. The engraved pebble of Étiolles (Essonne). Bull. Société Préhistorique Française 2011, 108, 27–48. [Google Scholar] [CrossRef]
- Le Jeune, Y. Études géo-archéologiques. Bilan 2017–2019. In Étiolles, Rapport de Synthèse 2017–2019; Valentin, B., Ed.; UMR 7041: Nanterre, France, 2019; pp. 55–67. [Google Scholar]
- Roblin-Jouve, A.; Olive, M.; Rodriguez, P.; Bignon-Lau, O.; Chaussé, C.; Dumarçay, G.; Le Jeune, Y.; Leroyer, C.; Thiébault, S.; Wattez, J. Les limons fluviatiles du site magdalénien d’Étiolles (Essonne, France). Bilan des recherches sur le contexte physique et naturel des occupations humaines à Étiolles. Rev. Archéologique D’île-De-Fr. 2016, 9, 7–58. [Google Scholar]
- Olive, M.; Pigeot, N.; Bignon-Lau, O. Un campement magdalénien à Étiolles (Essonne). Des activités à la microsociologie d’un habitat. Gall. Préhistoire 2019, 59, 47–108. [Google Scholar] [CrossRef]
- Debout, G.; Olive, M.; Bignon, O.; Bodu, P.; Chehmana, L.; Valentin, B. The Magdalenian in the Paris Basin: New results. Quat. Int. 2012, 272–273, 176–190. [Google Scholar] [CrossRef]
- Taborin, Y. Les Magdaléniens d’Étiolles et leurs coquillages. In Étiolles. Rapport triennal 2004–2006; Olive, M., Ed.; Service régional d’archéologie d’Île-de-France: Paris, France, 2006; pp. 66–67. [Google Scholar]
- Pastre, J.-F.; Leroyer, C.; Limondin-Lozouët, N.; Antoine, P.; Chaussé, C.; Gauthier, A.; Granai, S.; Le Jeune, Y.; Wuscher, P. Chapitre VI. L’Holocène du Bassin parisien (France): Apports de l’étude géoécologique et géoarchéologique des fonds de vallée. In La Géoarchéologie Française au XXIe Siècle; Carcaud, N., Arnaud-Fassetta, G., Eds.; CNRS Éditions: Paris, France, 2015; pp. 89–106. ISBN 9782271129932. Available online: http://books.openedition.org/editionscnrs/21984 (accessed on 20 December 2023). [CrossRef]
- Davis, J.L.; Annan, A.P. Ground-penetrating radar for high-resolution mapping of soil and rock stratigraphy. Geophys. Prospect. 1989, 3, 531–551. [Google Scholar]
- Annan, A.P. Electromagnetic Principles of Ground Penetrating Radar. In Ground Penetrating Radar: Theory and Applications; Jol, H.M., Ed.; Elsevier: Amsterdam, The Netherlands, 2009; pp. 3–40. [Google Scholar]
- Bowling, J.C.; Harry, D.L.; Rodriguez, A.B.; Zheng, C. Integrated geophysical and geological investigation of a heterogeneous fluvial aquifer in Columbus Mississippi. J. Appl. Geophys. 2007, 62, 58–73. [Google Scholar] [CrossRef]
- Neal, A. Ground-penetrating radar and its use in sedimentology: Principles, problems and progress. Earth-Sci. Rev. 2004, 27, 261–330. [Google Scholar] [CrossRef]
- Bano, M.; Marquis, G.; Niviere, B.; Maurin, J.C.; Cushing, M. Investigating alluvial and tectonic features with ground-penetrating radar and analyzing diffractions patterns. J. Appl. Geophys. 2000, 43, 33–41. [Google Scholar] [CrossRef]
- Wunderlich, T. MultichannelGPR: A New MATLAB-Tool for the processing of GPR Data. Archeo Sci. Rev. D’archéométrie 2021, 45, 279–283. [Google Scholar] [CrossRef]
- De Smedt, P.; Delefortrie, S.; Wyffels, F. Identifying and removing micro-drift in ground-based electromagnetic induction data. Appl. Geophys. 2016, 131, 14–22. [Google Scholar] [CrossRef]
- Wilken, D.; Mercker, M.; Fischer, P.; Vött, A.; Erkul, E.; Corradini, E.; Pickartz, N. Artificial Bee Colony Algorithm with adaptive parameter space dimension: A Promising Tool for Geophysical (EMI) Inversion. Remote Sens. 2024, 16, 470. [Google Scholar] [CrossRef]
- McNeill, J.D. Electromagnetic Terrain Conductivity Measurement at Low Induction Numbers; Technical Note TN-6; Geonics Ltd.: Mississauga, ON, Canada, 1980. [Google Scholar]
- Loke, M.H. Tutorial: 2D and 3D Electrical Imaging Surveys. 2016. Available online: www.geotomosoft.com (accessed on 20 June 2023).
- Günter, T.; Rücker, C. A general approach for introducing information into inversion and examples from dc resistivity inversion: 10th Annual european Meeting of Environmental and Engineering Geophysics, EAGE extended Abstract P039. 2006. Available online: https://www.earthdoc.org/content/papers/10.3997/2214-4609.201402682 (accessed on 12 May 2023).
- Loke, M.H.; Acworth, I.; Dahlin, T. A comparison of smooth and block inversion methods in 2D electrical imaging surveys. Explor. Geophys. 2003, 34, 182–187. [Google Scholar] [CrossRef]
- Hansen, P.C.; O’Leary, D.P. The use of the L-curve in the regularization of discrete ill-posed problems. SIAM J. Sci. Comput. 1993, 14, 1487–1503. [Google Scholar] [CrossRef]
- Conyers, L.B. Ground-Penetrating Radar for Archaeology, 3rd ed.; Altamira Press: Lanham, MD, USA, 2003; Rowman and Littlefield. [Google Scholar]
- Chaussé, C. Approche Morphosédimentaire et Chronostratigraphique du Locus 2-nord à Étiolles. In Étiolles, Rapport de Synthèse 2017–2019; Valentin, B., Ed.; UMR 7041: Nanterre, France, 2019; pp. 69–79. [Google Scholar]
- Villa, V. Étude Stratigraphique des Successions Sédimentaires Dans le Locus 1-sud. In Étiolles, Rapport de Synthèse 2017–2019; Valentin, B., Ed.; UMR 7041: Nanterre, France, 2019; pp. 83–86. [Google Scholar]
- Chaussé, C. Reprise de la Stratigraphie d’Etiolles (91), Locus 2 Nord. In Étiolles, Rapport 2015; Olive, M., Christensen, M., Eds.; UMR 7041: Nanterre, France, 2015; pp. 30–32. [Google Scholar]
Disclaimer/Publisher’s Note: The statements, opinions and data contained in all publications are solely those of the individual author(s) and contributor(s) and not of MDPI and/or the editor(s). MDPI and/or the editor(s) disclaim responsibility for any injury to people or property resulting from any ideas, methods, instructions or products referred to in the content. |
© 2024 by the authors. Licensee MDPI, Basel, Switzerland. This article is an open access article distributed under the terms and conditions of the Creative Commons Attribution (CC BY) license (https://creativecommons.org/licenses/by/4.0/).