
Measuring Dam Deformation of Long-Distance Water Transfer Using Multi-Temporal Synthetic Aperture Radar Interferometry: A Case Study in South-to-North Water Diversion Project, China


Abstract
1. Introduction
2. Study Area and Datasets
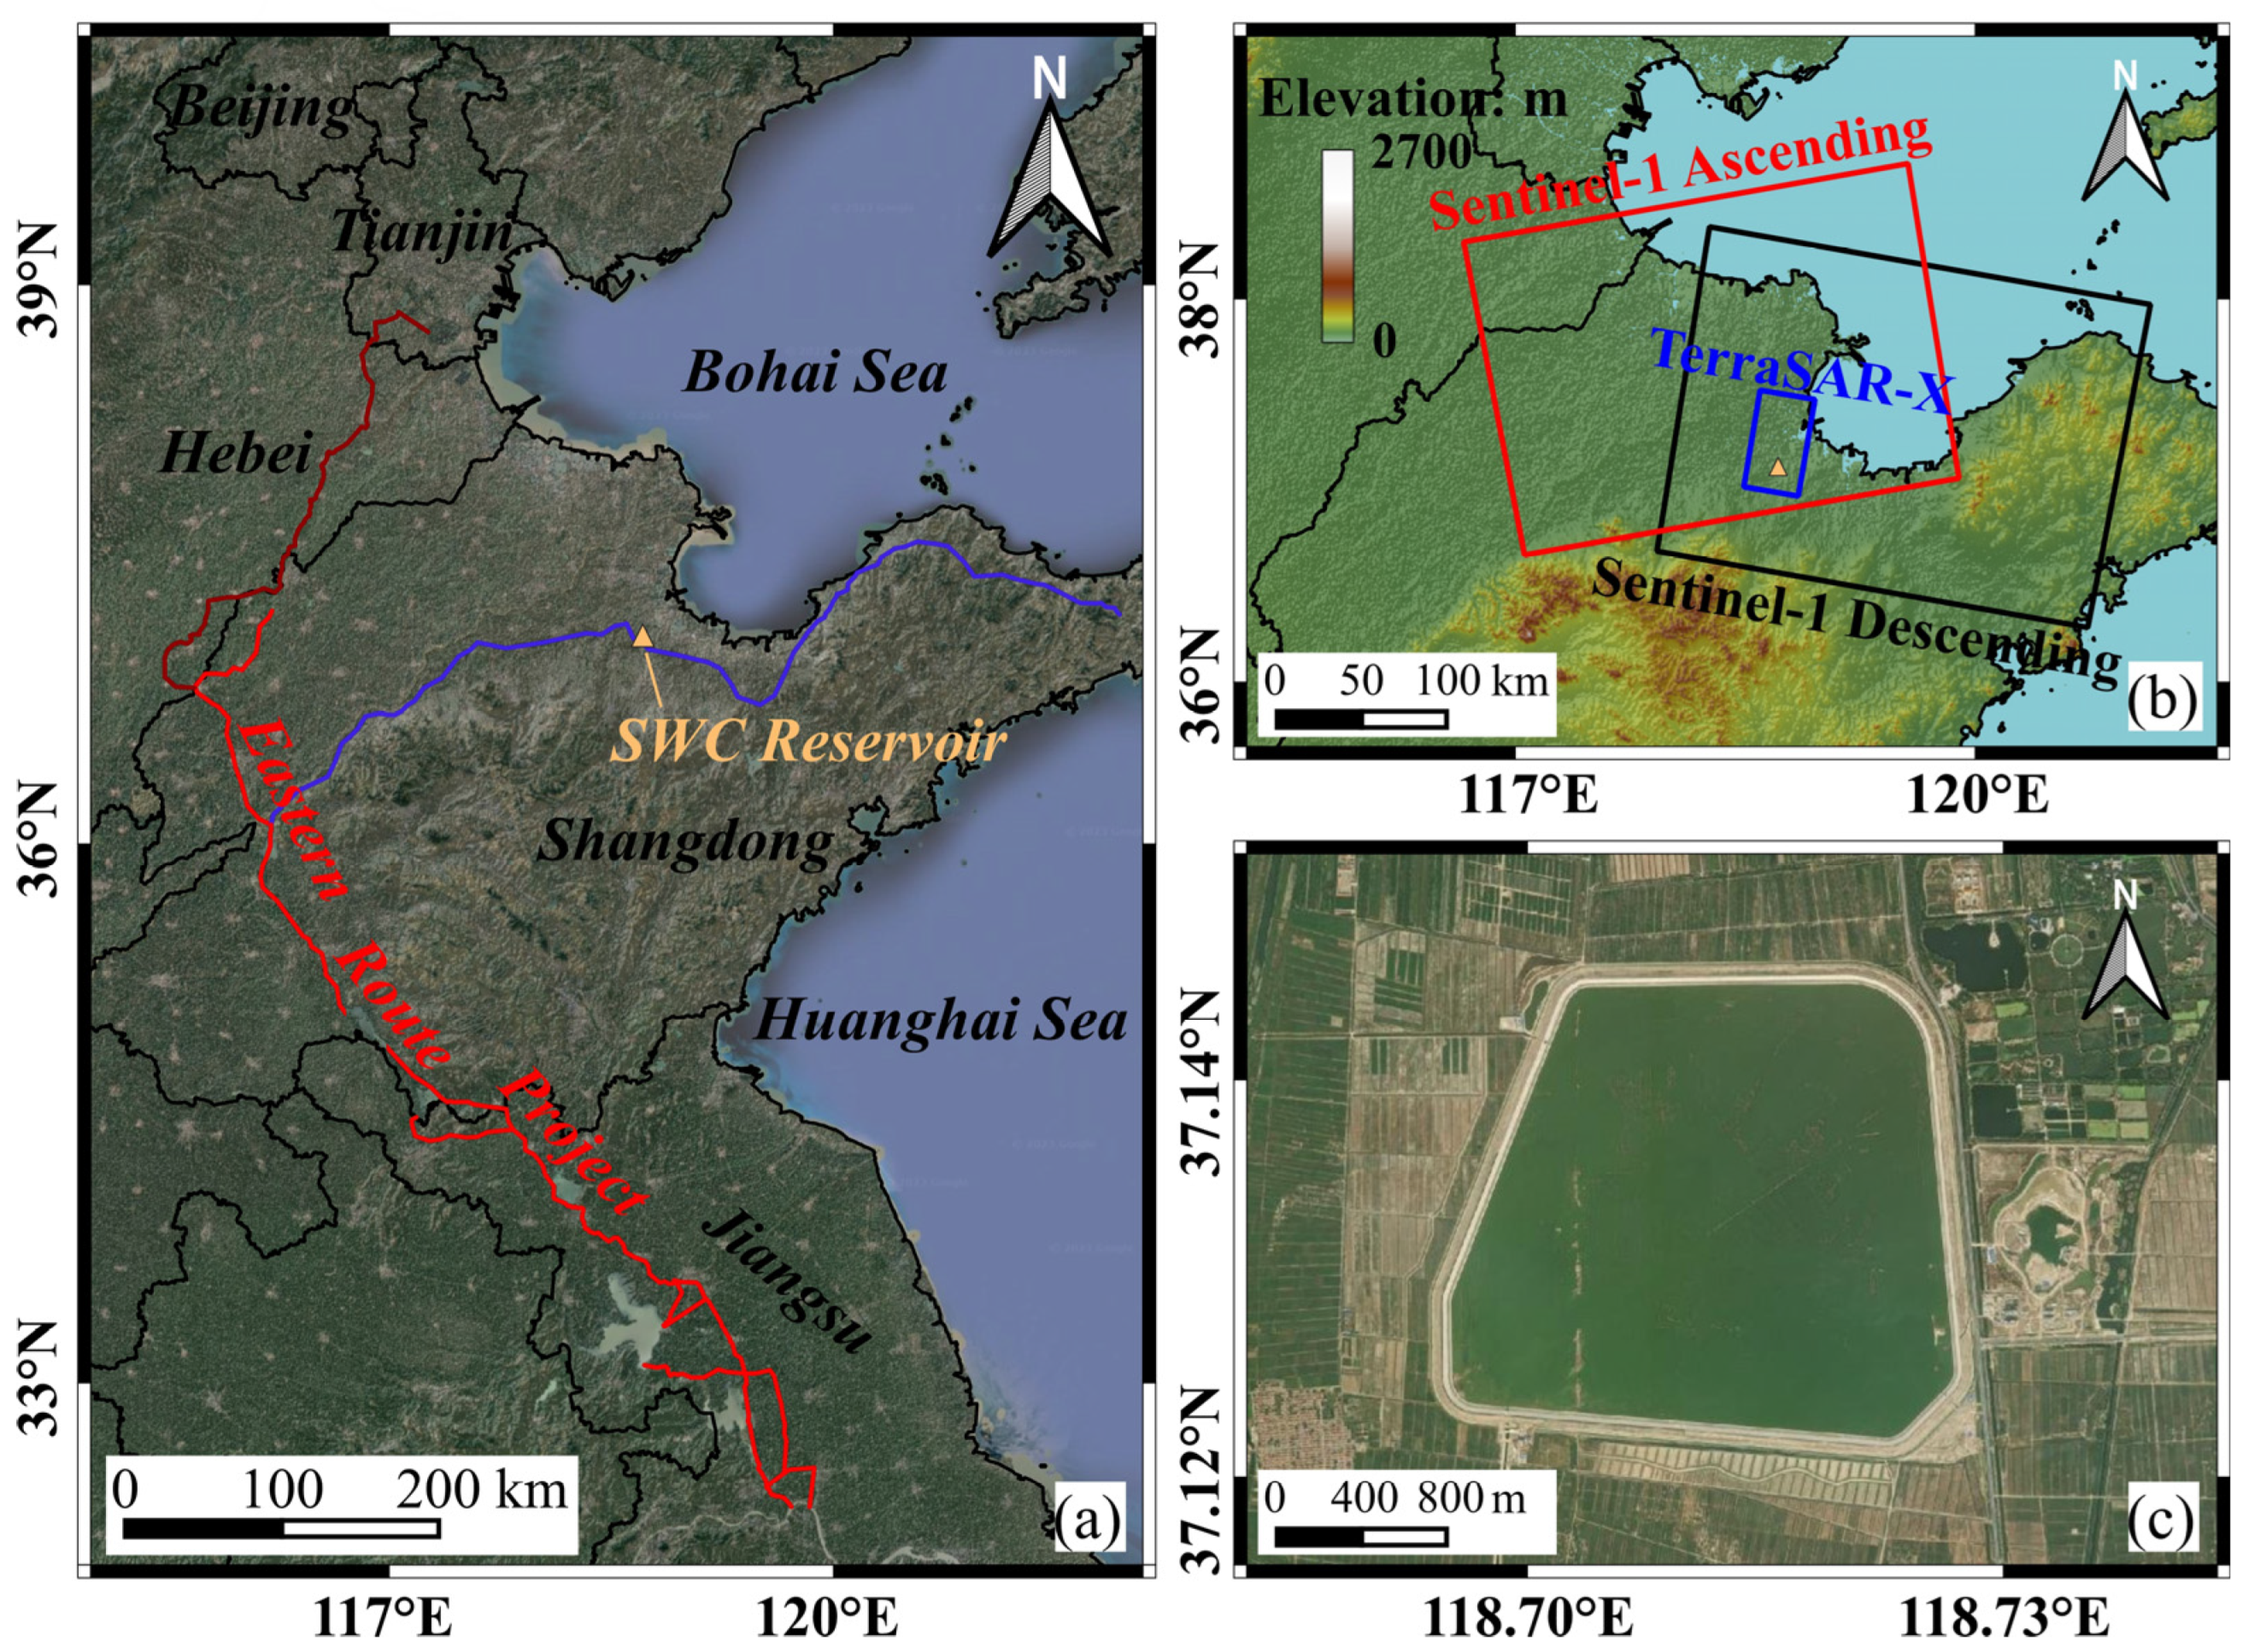
2.1. Study Area
2.2. Datasets
3. InSAR Data Processing
3.1. Pre-Processing
3.2. Time Series InSAR Processing
3.3. Two-Dimensional Deformation Decomposition
4. Results
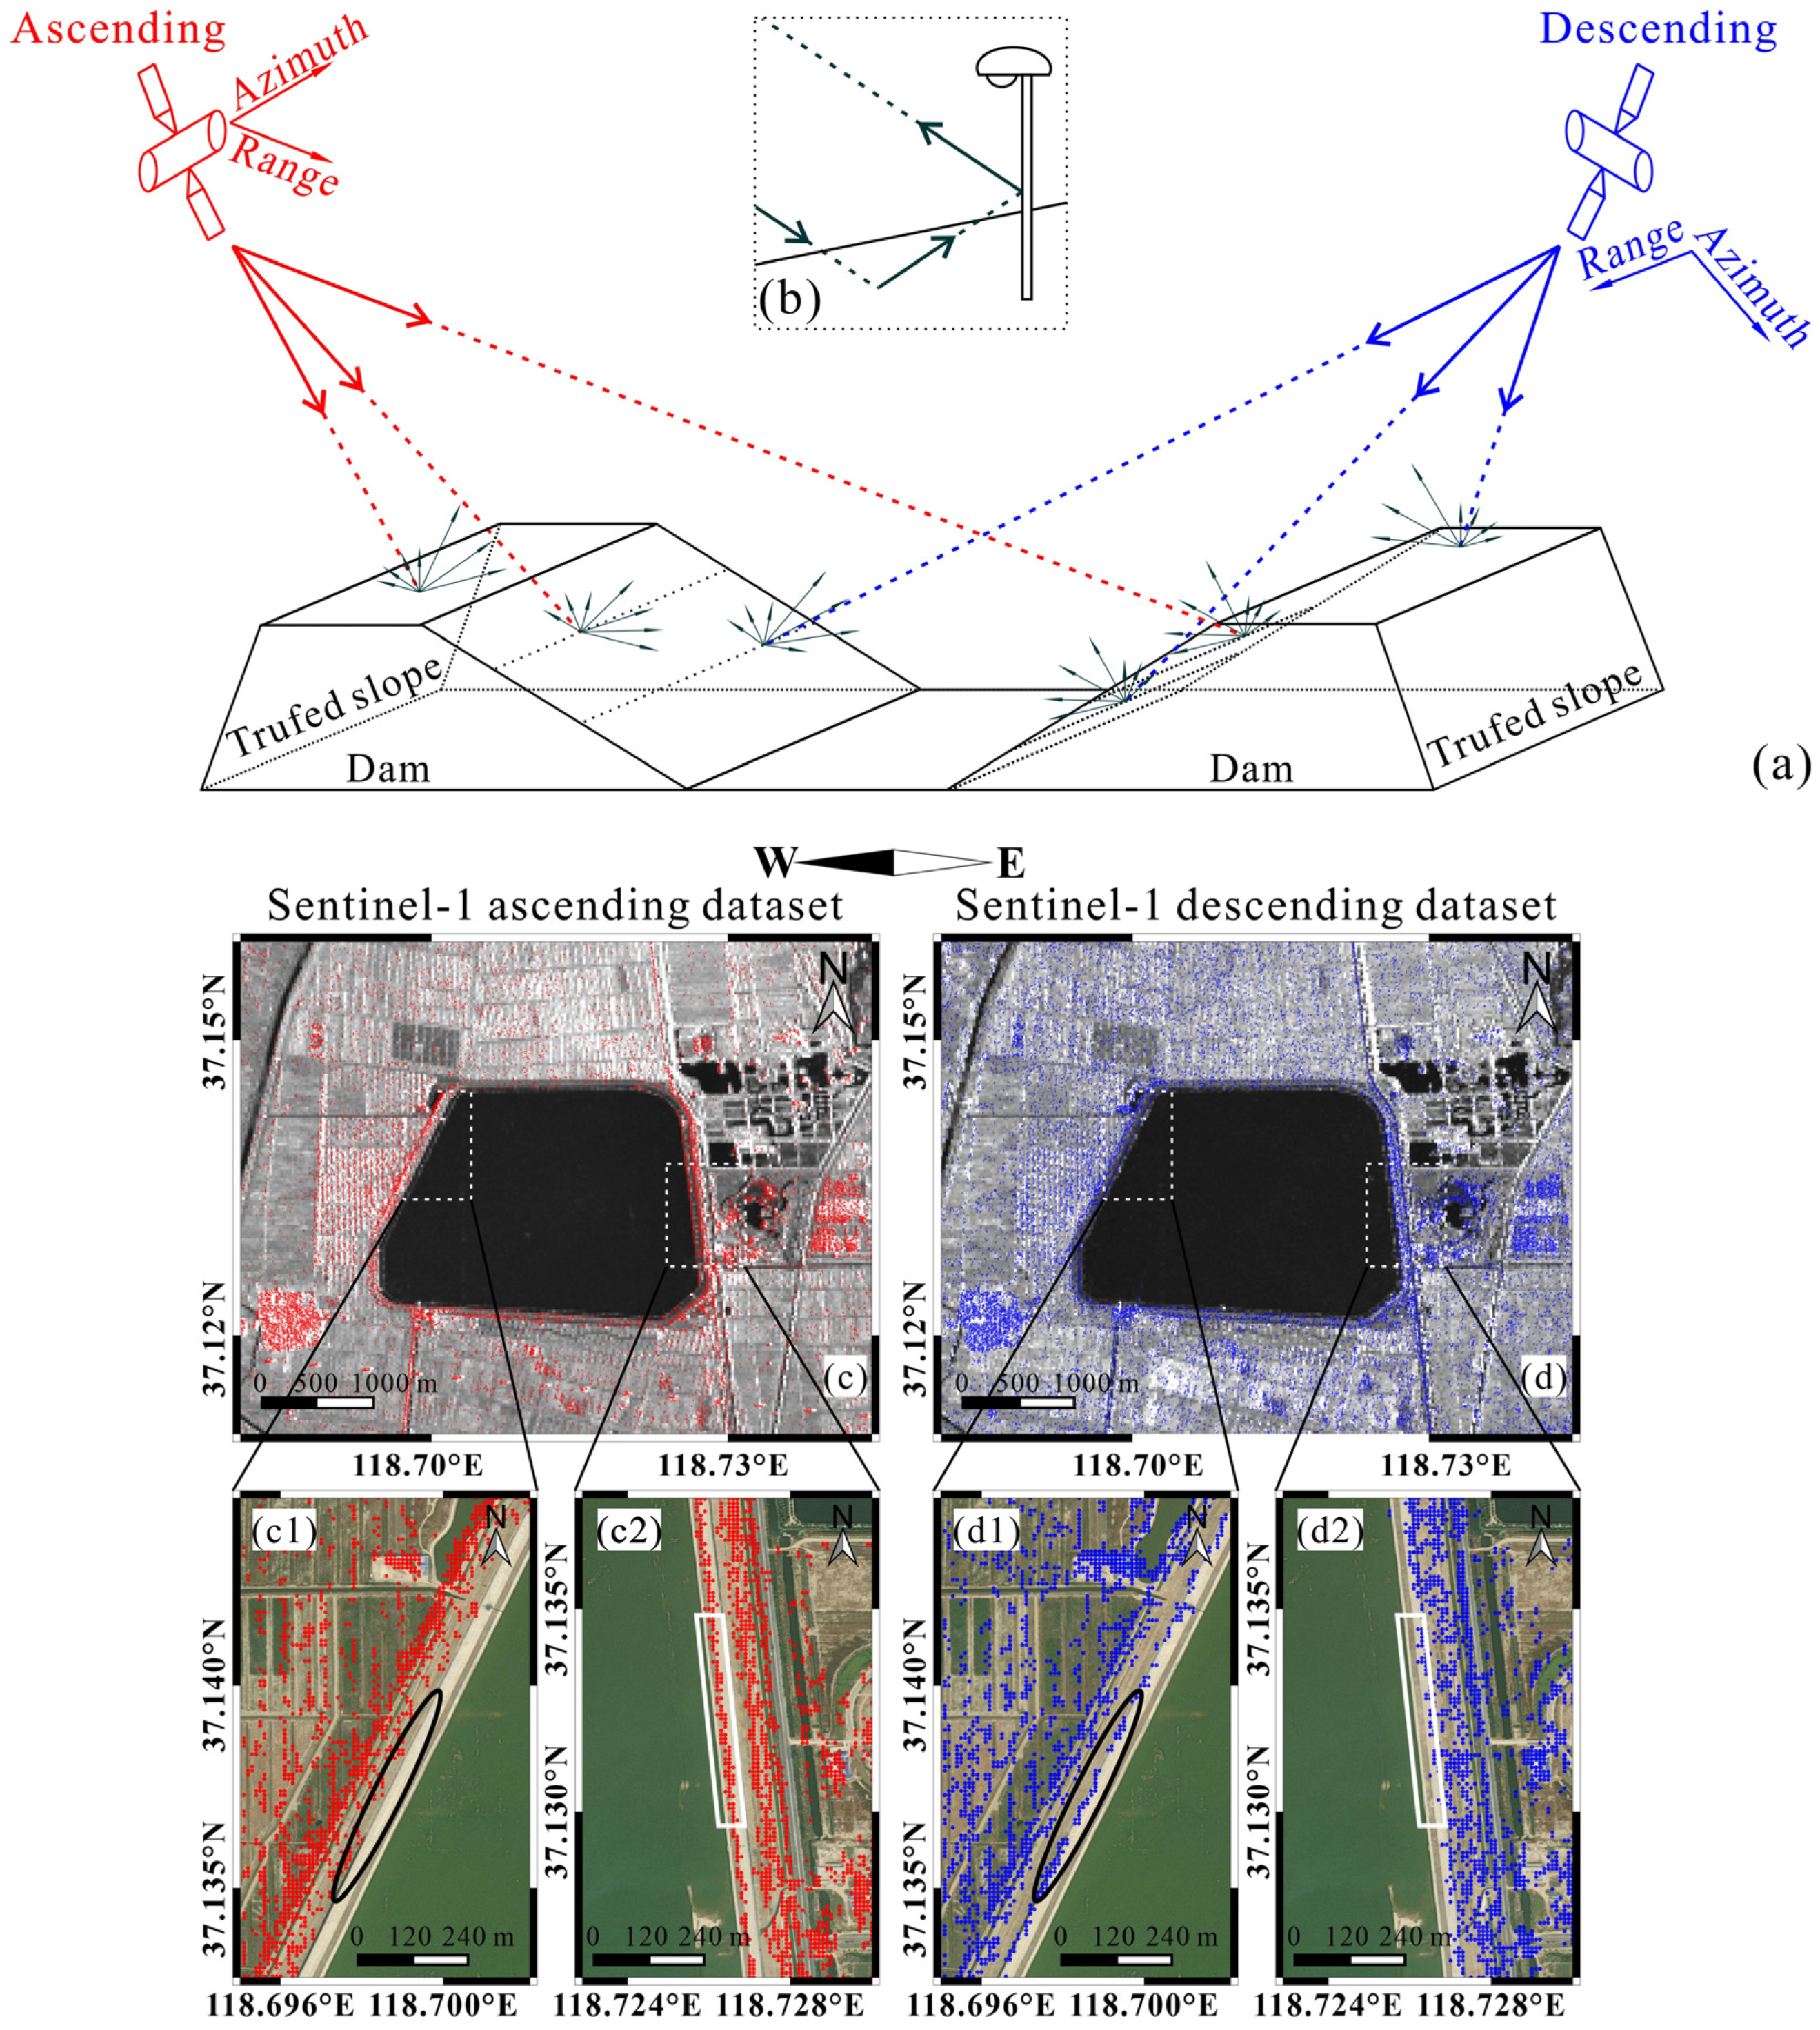
4.1. Imaging Geometry Analysis
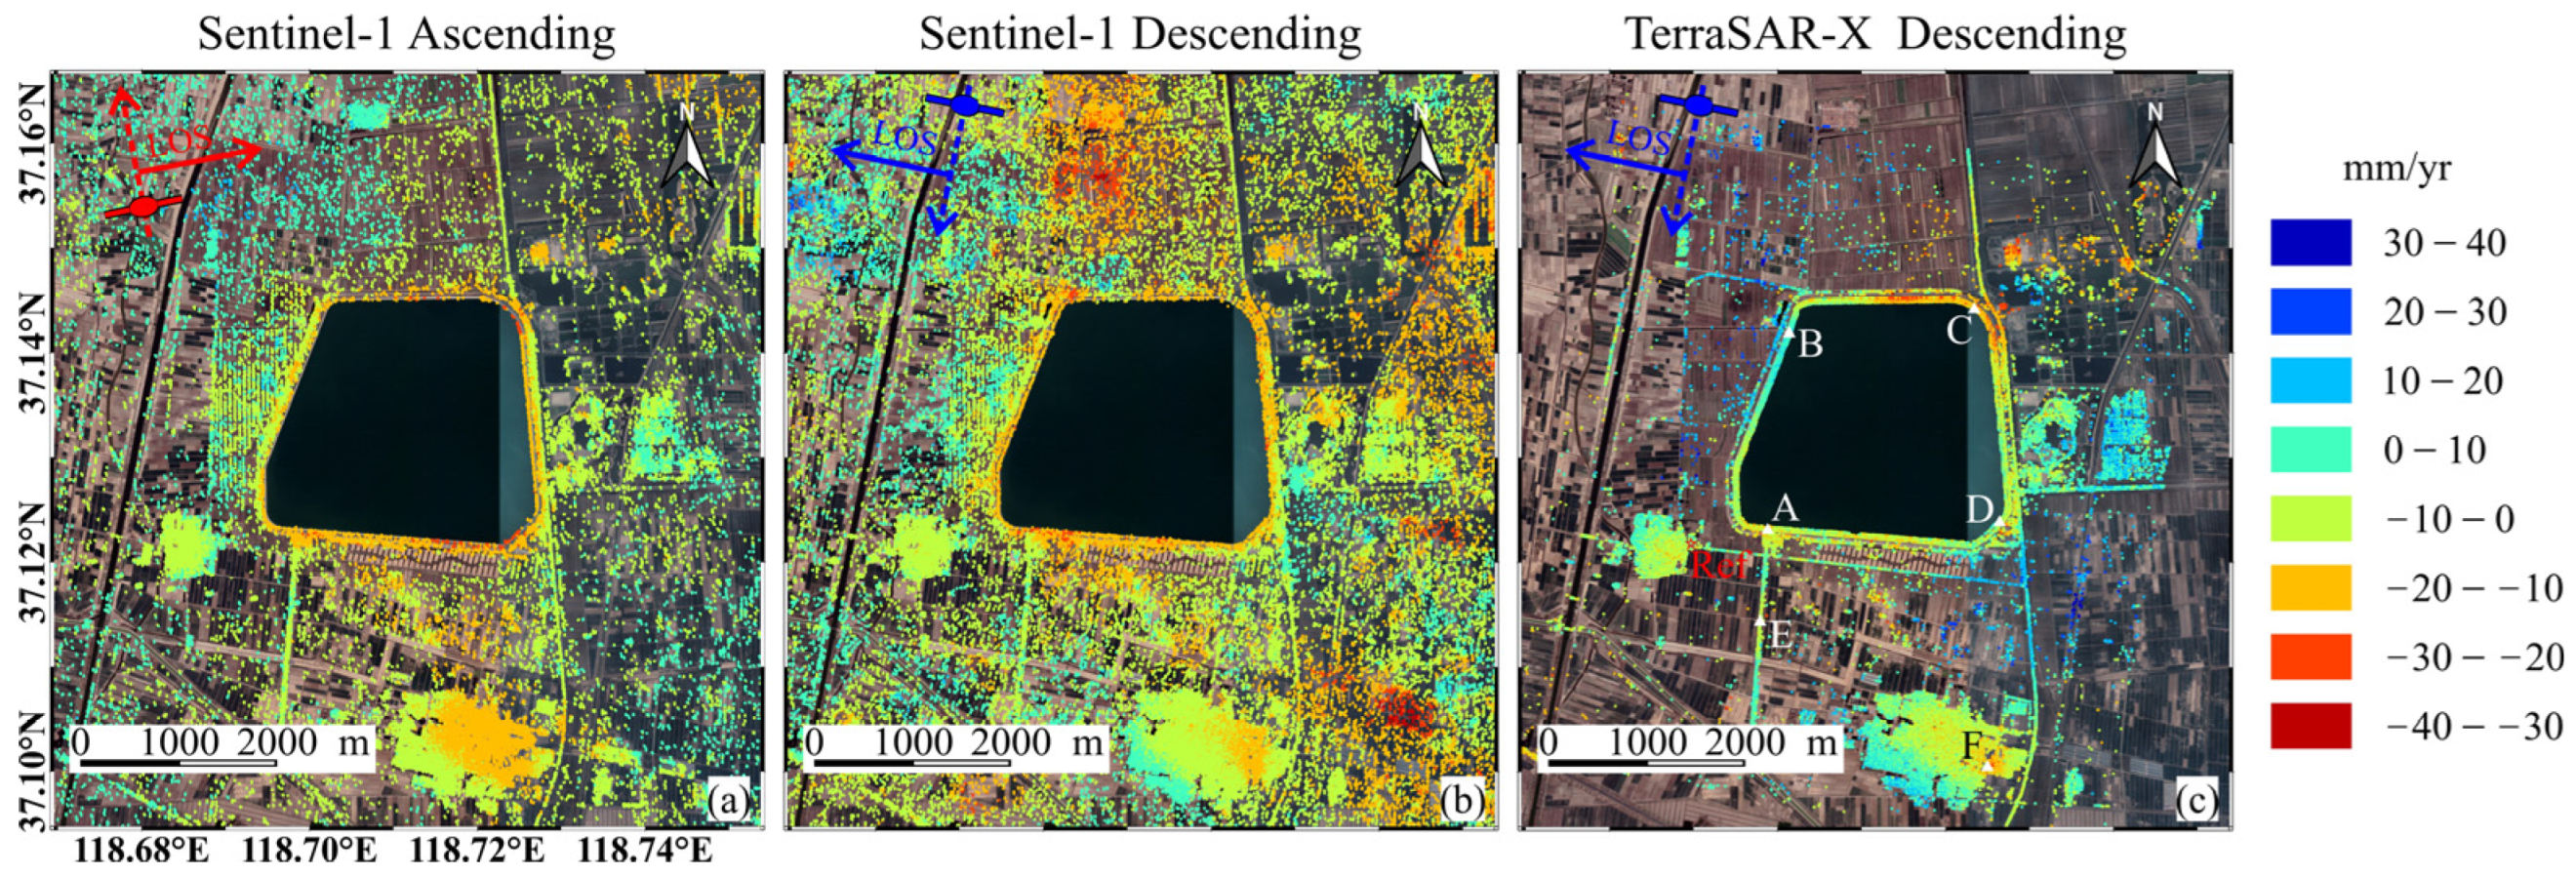
4.2. InSAR Deformation Results
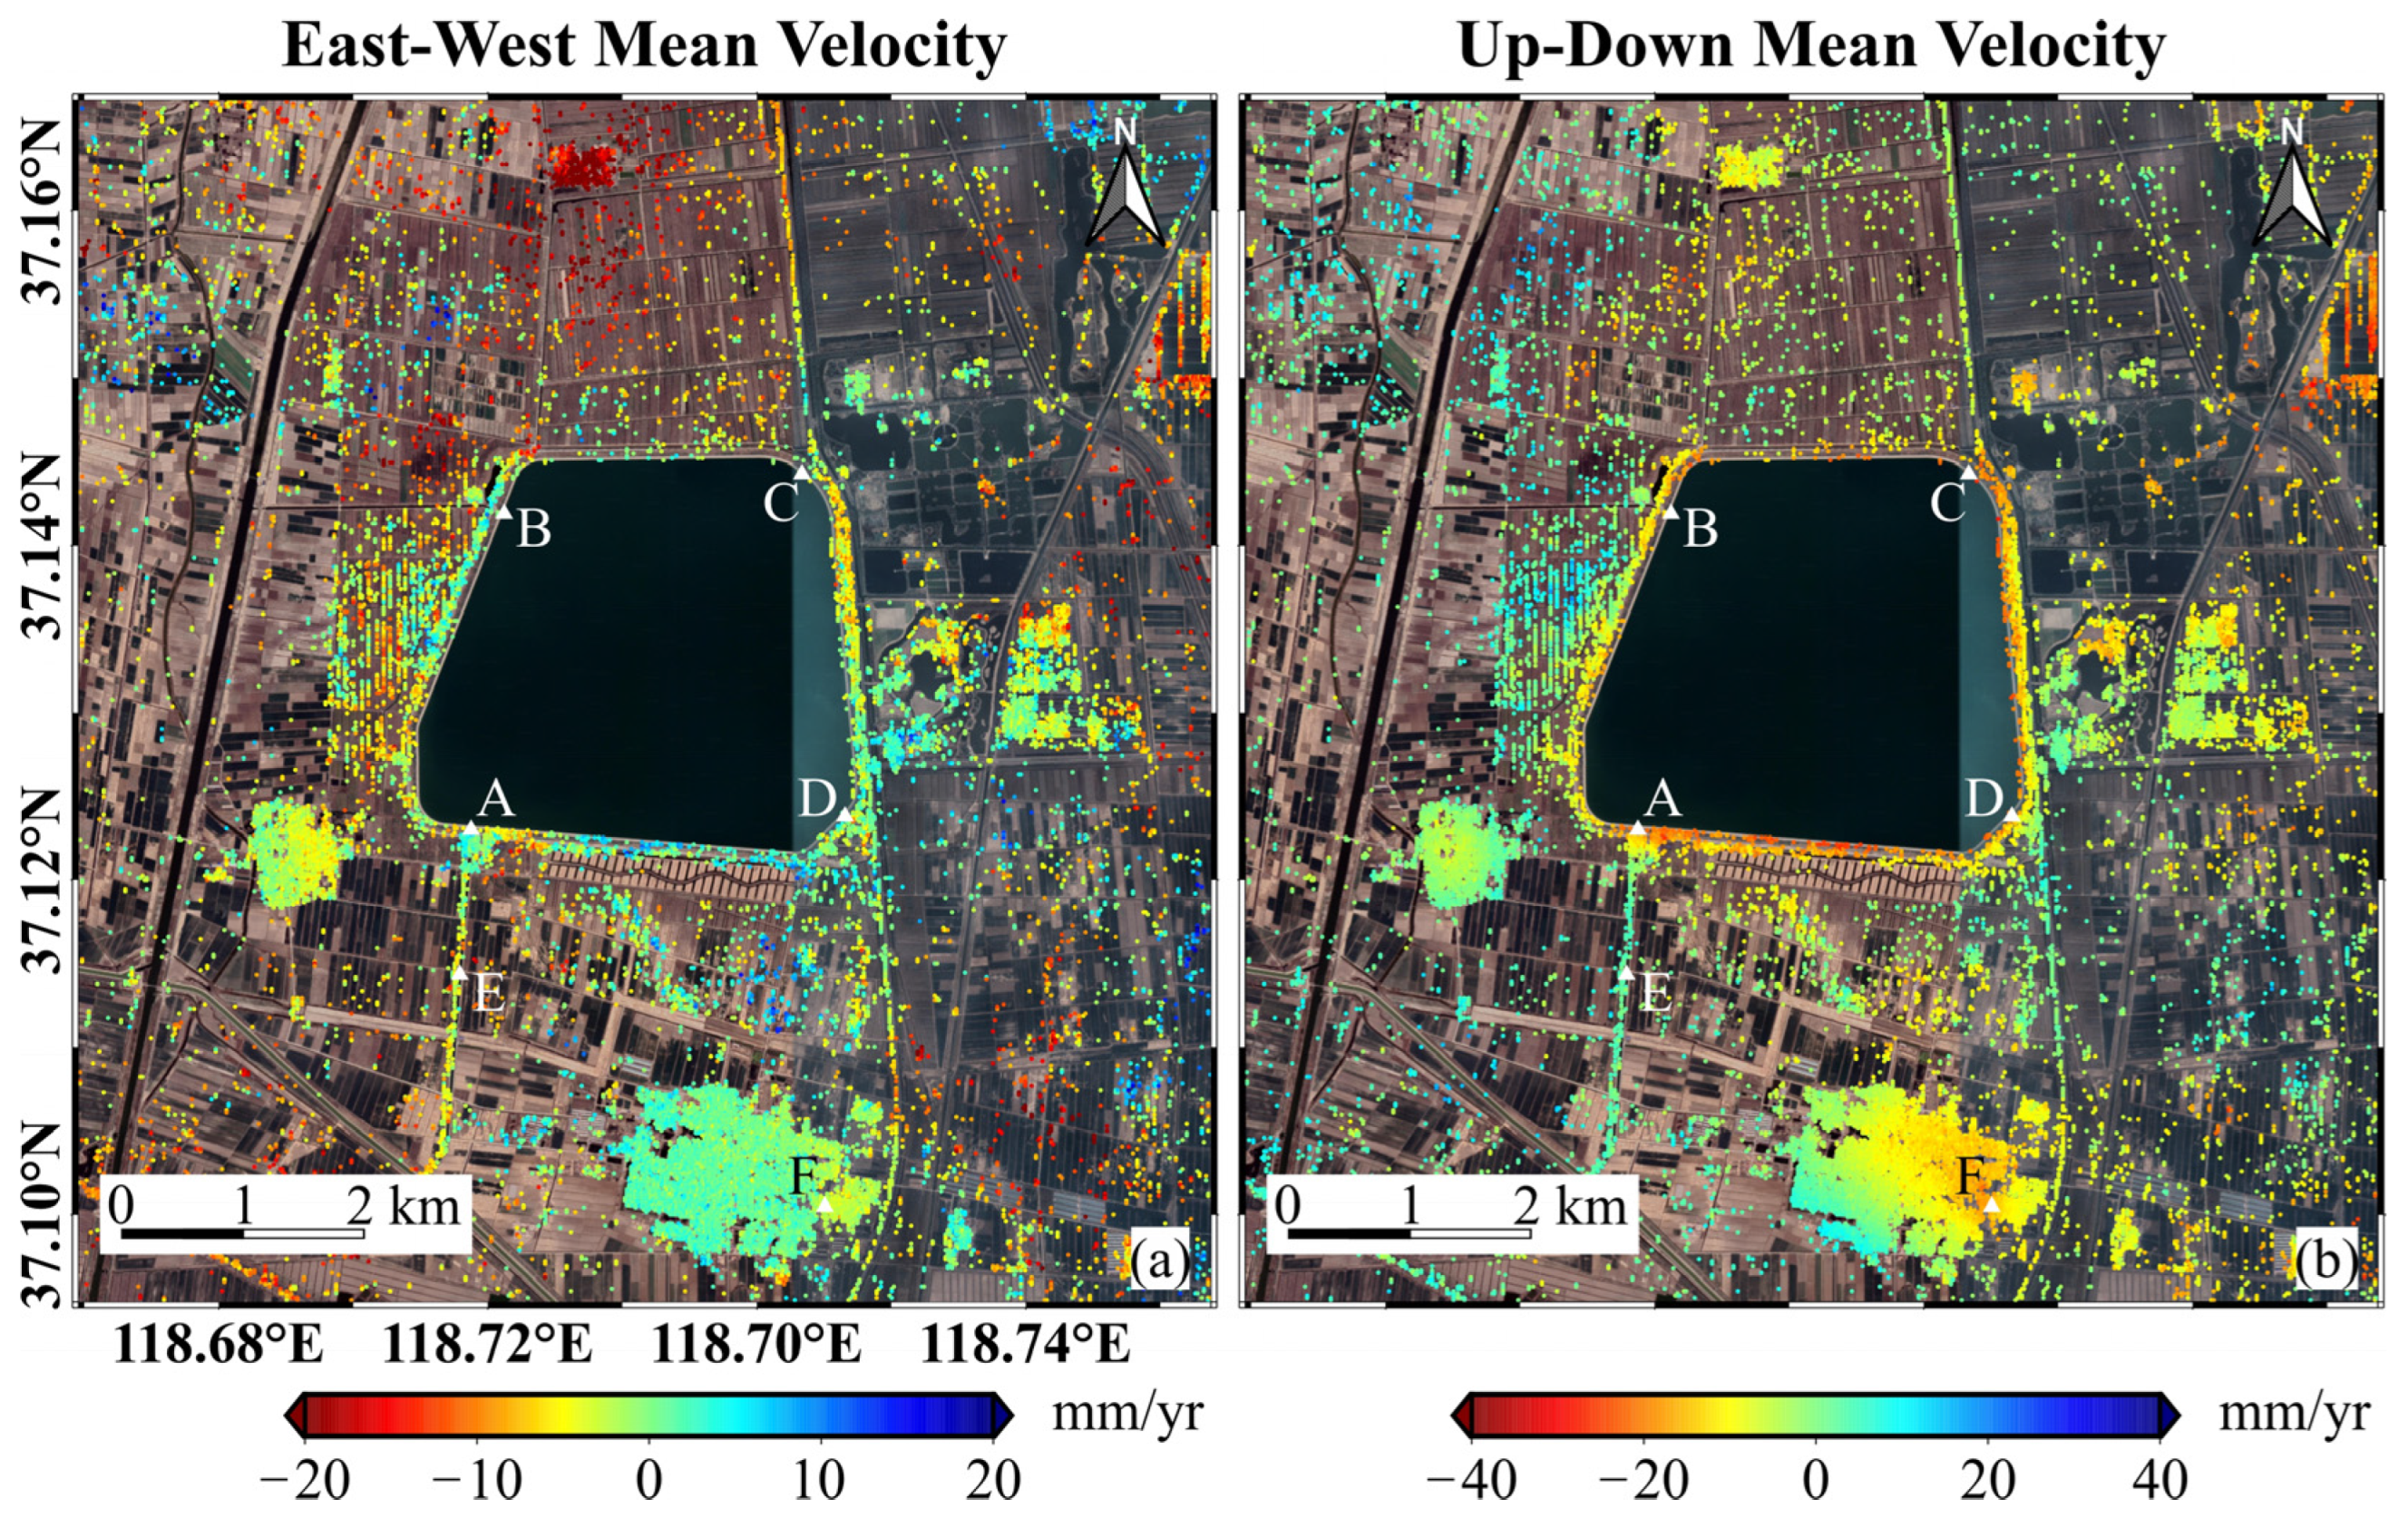
4.3. Two-Dimensional Deformation
4.4. Correlation Analysis of InSAR Datasets
4.5. GNSS Validation
5. Discussion
5.1. Influence of Water Level Changes on Deformation
5.2. Autumn Flood in 2021
6. Conclusions
- (1)
- Over a seven-year monitoring period, the SWC Dam experienced settlement, with a cumulative maximum subsidence of ~160 mm occurring at the northeast corner of the embankment. The eastern and southern sections of the embankment dam have undergone substantial subsidence rates, while the northwestern side displays the least deformation. The deformation varied across different sections of the embankment dam, but the gradient was relatively minor due to the dam’s considerable length.
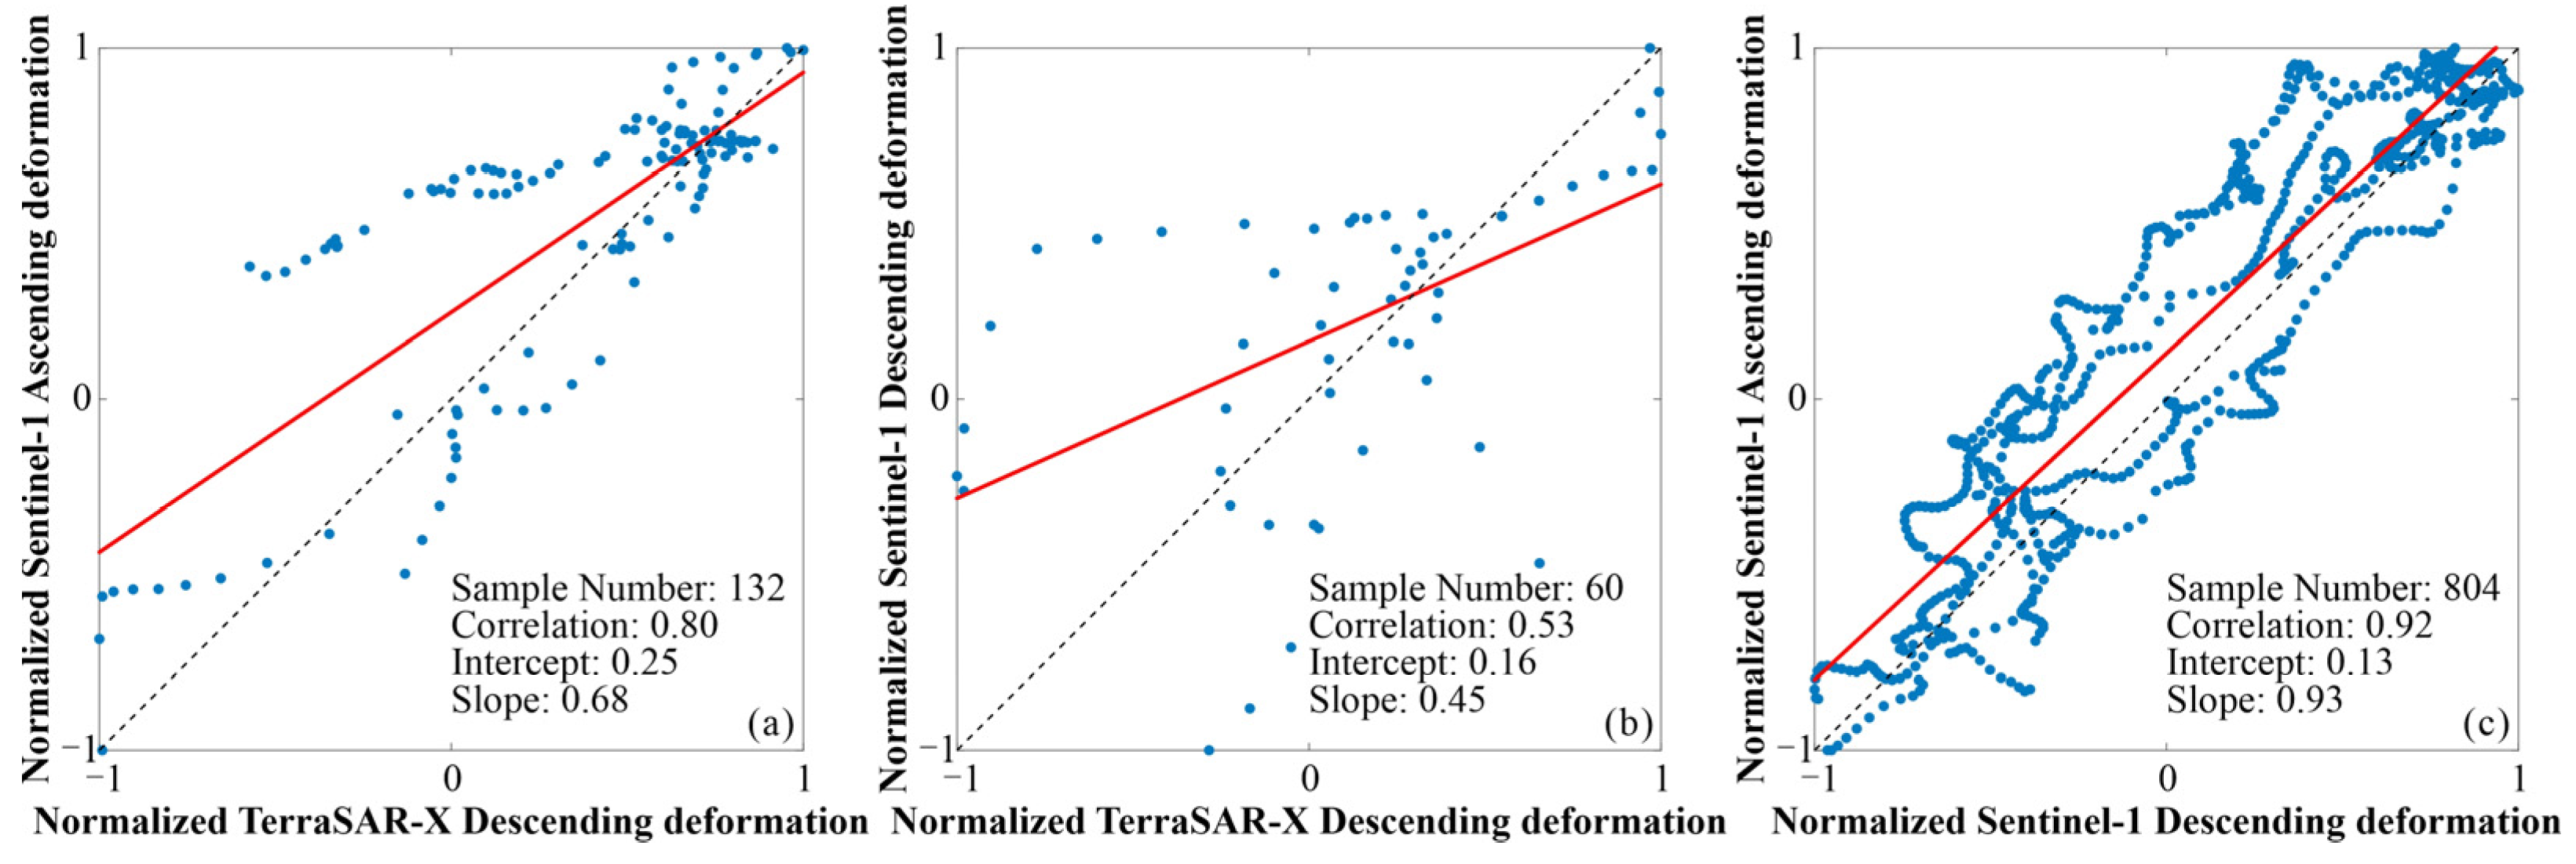
- (2)
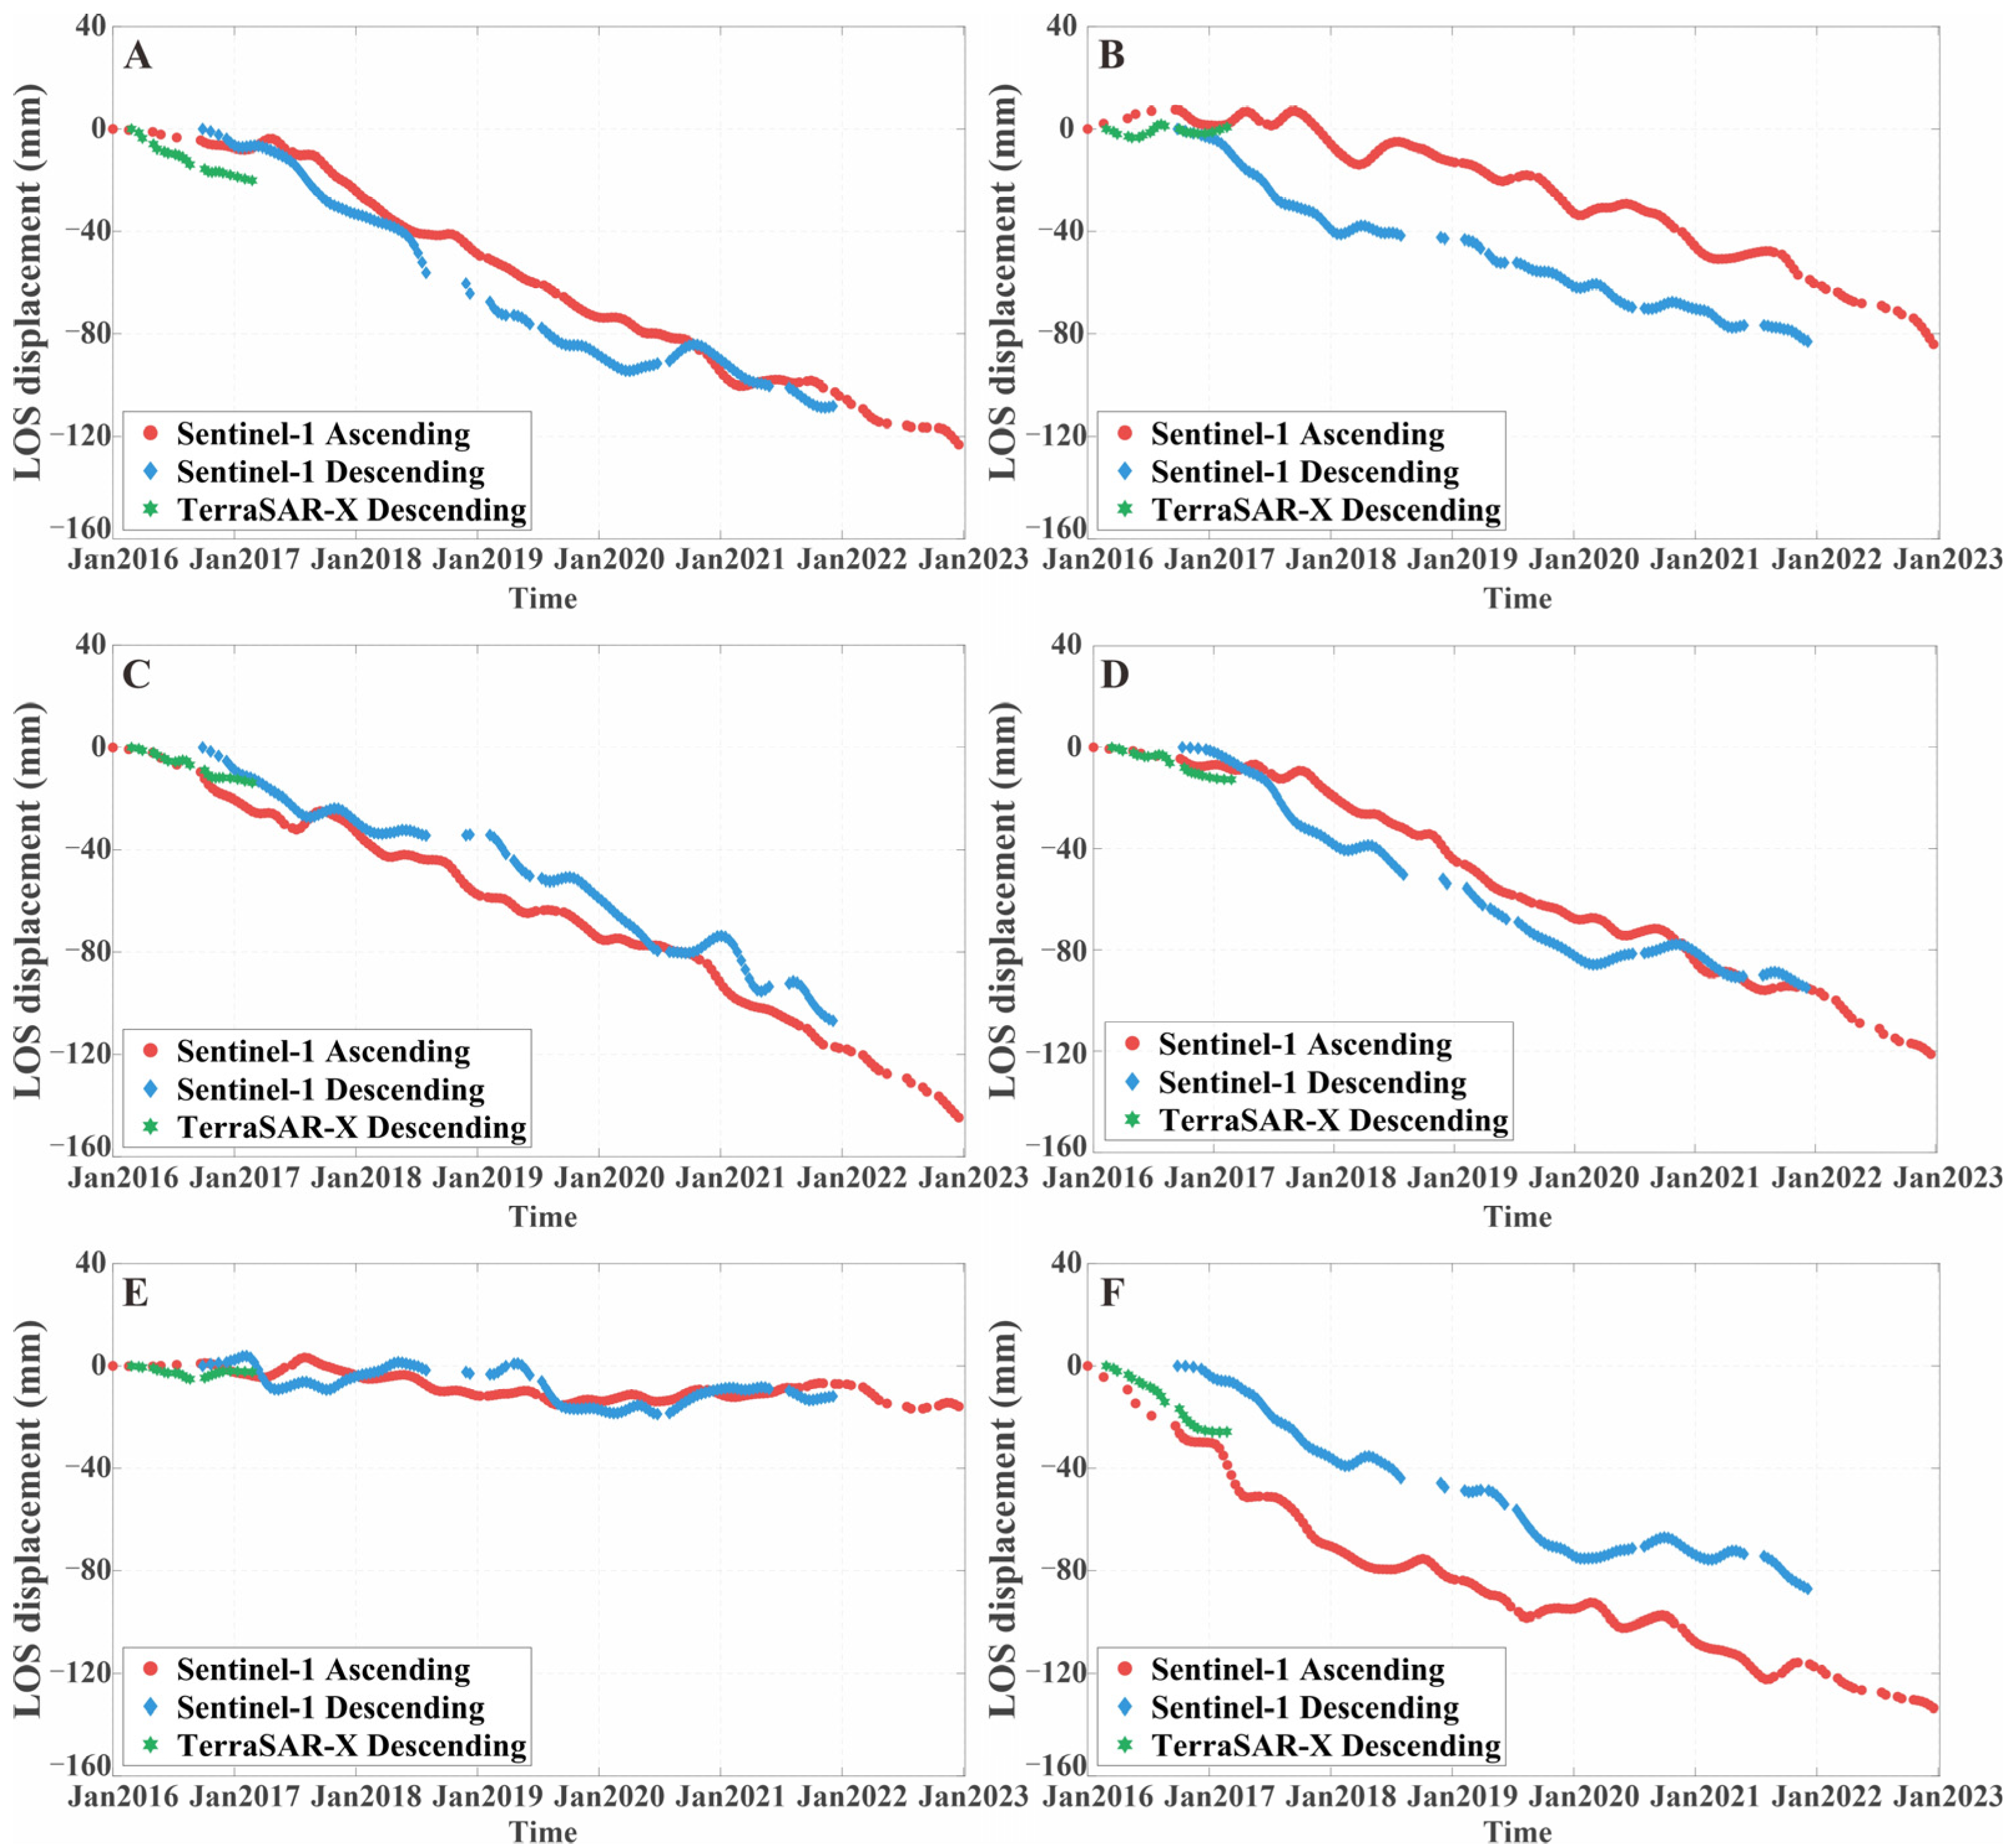
- The InSAR time series results from Sentinel-1 ascending, Sentinel-1 descending, and TerraSAR-X descending datasets exhibited a high consistency. The strongest correlation was observed between the Sentinel-1 ascending and descending datasets, reaching 0.92. The second-best correlation was between the Sentinel-1 ascending and TerraSAR-X results at 0.80, while the descending datasets of Sentinel-1 and TerraSAR-X displayed the weakest correlation at 0.53.
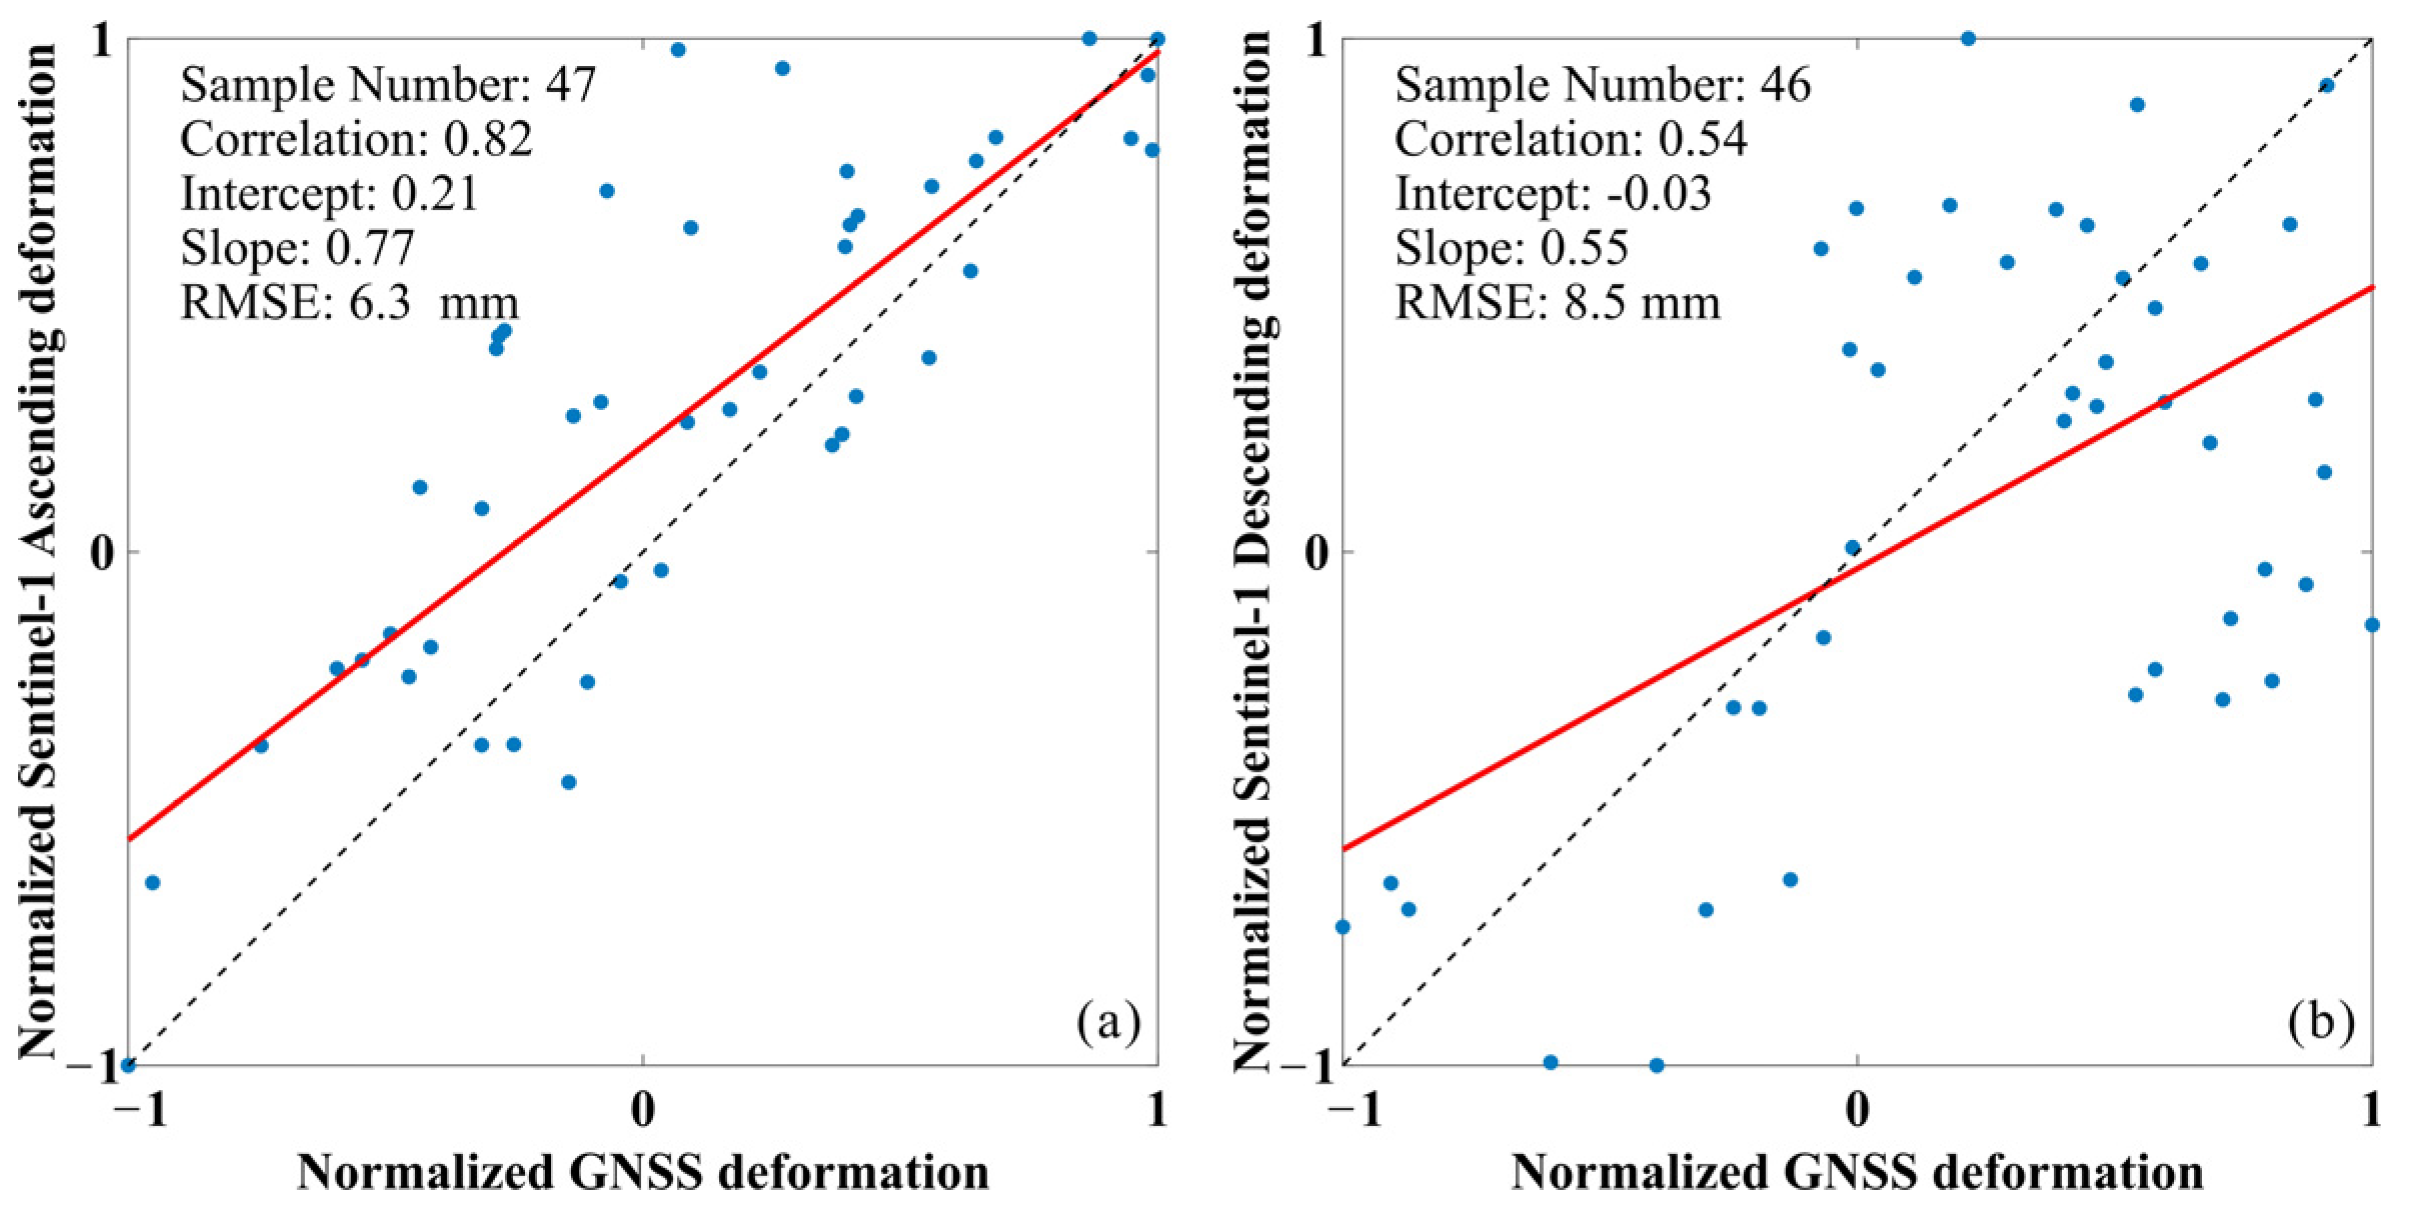
- (3)
- GNSS observations at three monitoring sites on the SWC Dam were used to validate the accuracy of InSAR results. The accuracy of Sentinel-1 InSAR time series displacements in the line-of-sight direction was determined to be 6.3 mm for the ascending path data and 8.5 mm for the descending path data.
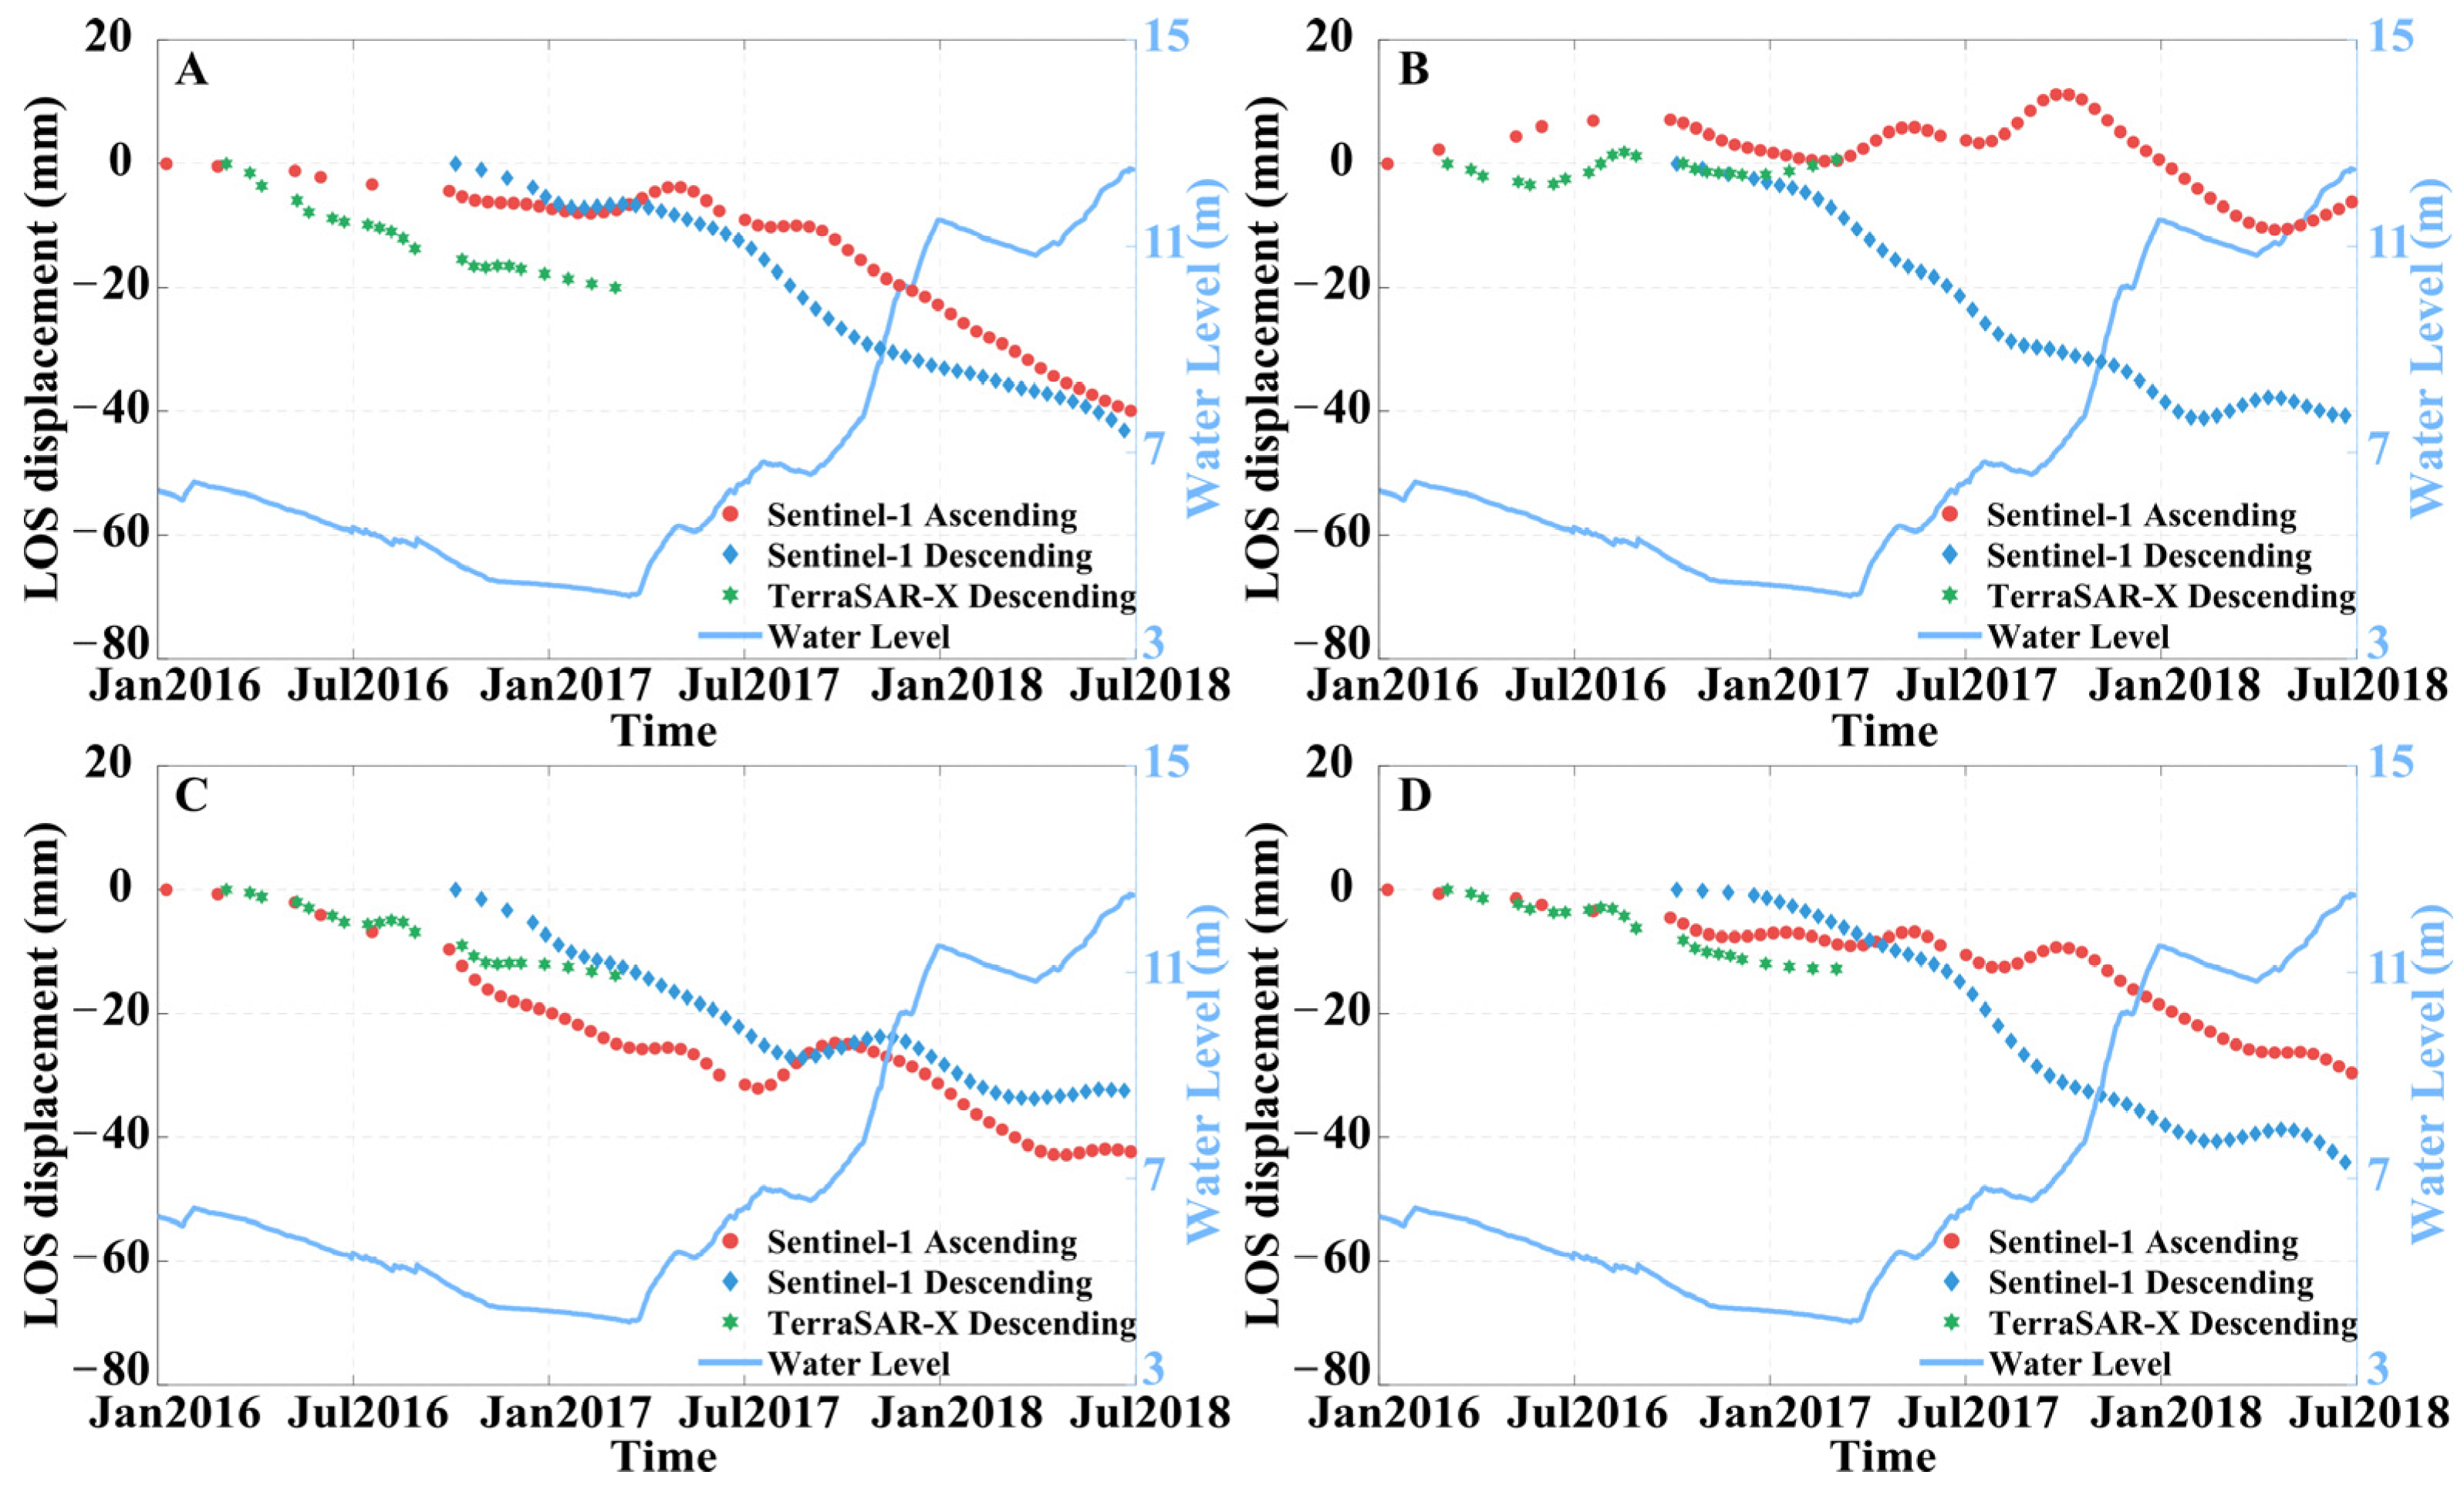
- (4)
- The deformation of the earth-rock dam is influenced by various factors. A comparison of the InSAR deformation time series with reservoir water levels revealed that while water level changes did impact deformation, consolidation settlement remained the controlling factor during the monitoring period. The SWC Dam is still in the primary consolidation stage.
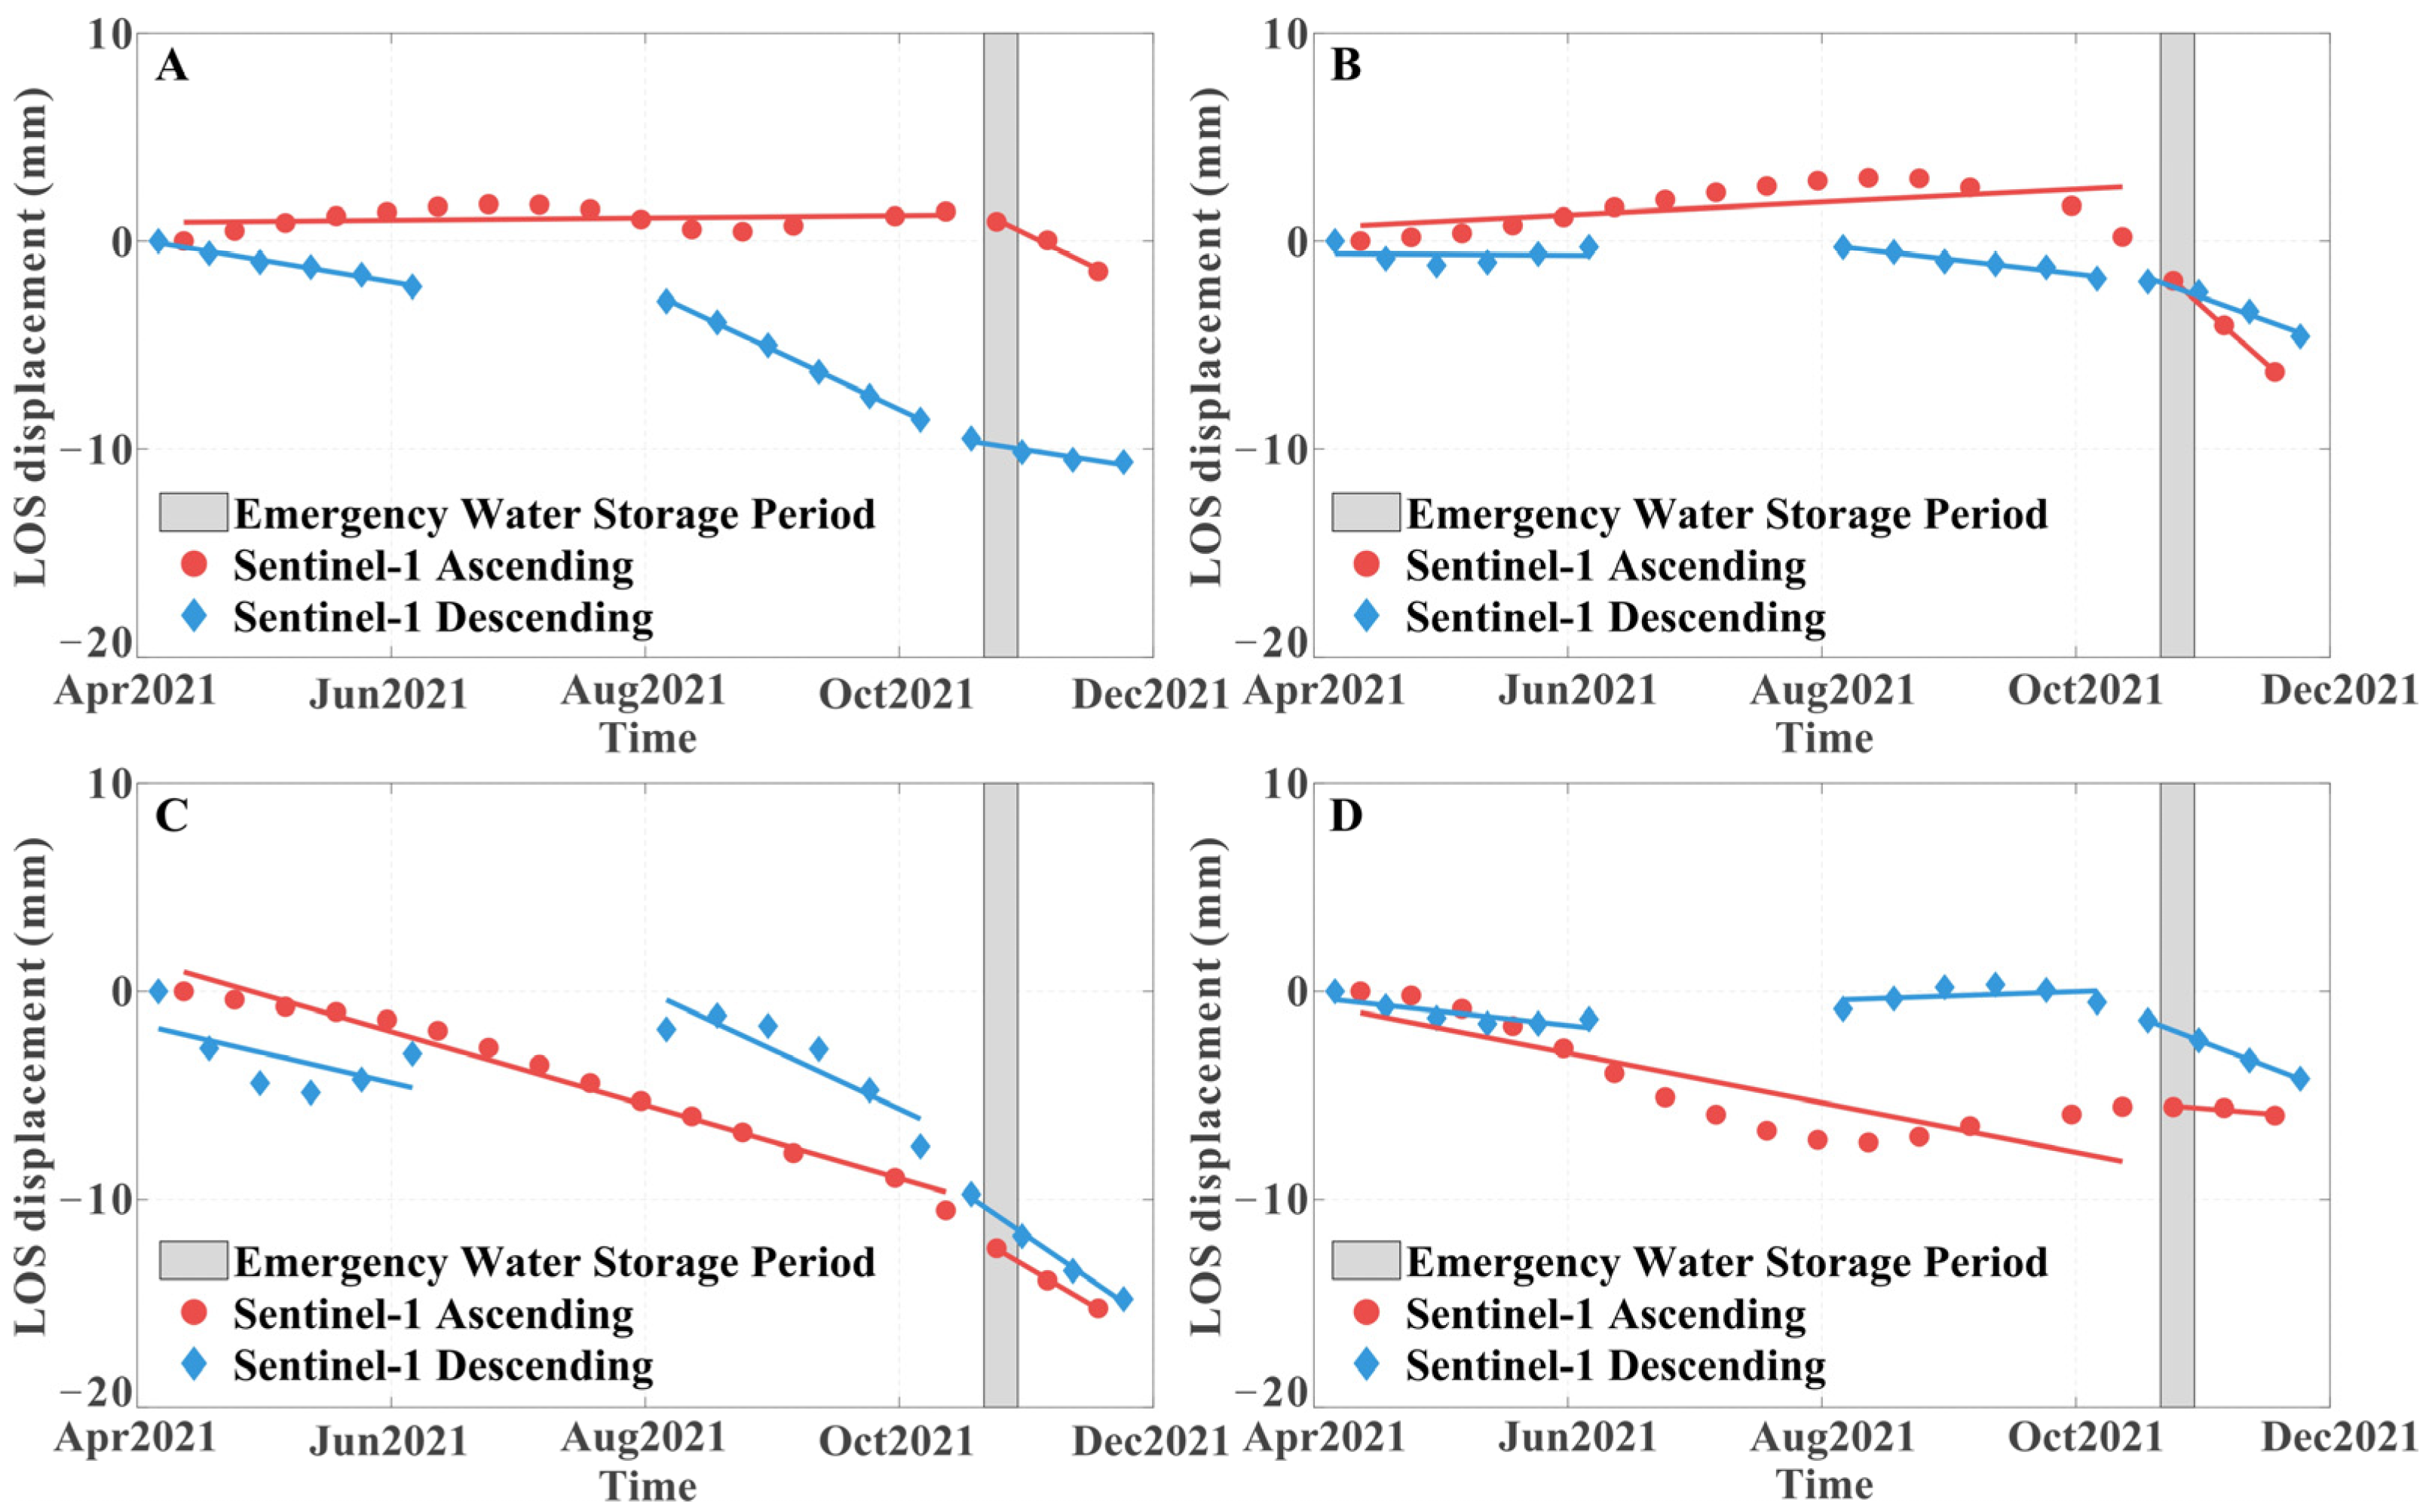
- (5)
- During the severe autumn floods in 2021, the InSAR results for the SWC Reservoir Dam showed minor changes in the deformation rate before and after emergency water storage. The potential deployment of increasingly dense satellite constellation missions holds promise for enhanced emergency monitoring capabilities.
Author Contributions
Funding
Data Availability Statement
Acknowledgments
Conflicts of Interest
References
- Braga, B. Water is a prerequisite for all development. UN Chron. 2018, 55, 41–43. [Google Scholar] [CrossRef]
- State Water Project. Available online: https://water.ca.gov/programs/state-water-project (accessed on 13 December 2023).
- Zhao, Z.-Y.; Zuo, J.; Zillante, G. Transformation of water resource management: A case study of the South-to-North Water Diversion project. J. Clean. Prod. 2017, 163, 136–145. [Google Scholar] [CrossRef]
- Biggs, J.; Wright, T.J. How satellite InSAR has grown from opportunistic science to routine monitoring over the last decade. Nat. Commun. 2020, 11, 3863. [Google Scholar] [CrossRef]
- Berardino, P.; Fornaro, G.; Lanari, R.; Sansosti, E. A new algorithm for surface deformation monitoring based on small baseline differential SAR interferograms. IEEE Trans. Geosci. Remote Sens. 2002, 40, 2375–2383. [Google Scholar] [CrossRef]
- Ferretti, A.; Fumagalli, A.; Novali, F.; Prati, C.; Rocca, F.; Rucci, A. A New Algorithm for Processing Interferometric Data-Stacks: SqueeSAR. IEEE Trans. Geosci. Remote Sens. 2011, 49, 3460–3470. [Google Scholar] [CrossRef]
- Hooper, A. A multi-temporal InSAR method incorporating both persistent scatterer and small baseline approaches. Geophys. Res. Lett. 2008, 35, 4654. [Google Scholar] [CrossRef]
- Lanari, R.; Mora, O.; Manunta, M.; Mallorquí, J.J.; Berardino, P.; Sansosti, E. A small-baseline approach for investigating deformations on full-resolution differential SAR interferograms. IEEE Trans. Geosci. Remote Sens. 2004, 42, 1377–1386. [Google Scholar] [CrossRef]
- Song, C.; Yu, C.; Li, Z.; Utili, S.; Frattini, P.; Crosta, G.; Peng, J. Triggering and recovery of earthquake accelerated landslides in Central Italy revealed by satellite radar observations. Nat. Commun. 2022, 13, 7278. [Google Scholar] [CrossRef]
- Shi, G.; Ma, P.; Hu, X.; Huang, B.; Lin, H. Surface response and subsurface features during the restriction of groundwater exploitation in Suzhou (China) inferred from decadal SAR interferometry. Remote Sens. Environ. 2021, 256, 112327. [Google Scholar] [CrossRef]
- Cigna, F.; Tapete, D. Urban growth and land subsidence: Multi-decadal investigation using human settlement data and satellite InSAR in Morelia, Mexico. Sci. Total Environ. 2022, 811, 152211. [Google Scholar] [CrossRef]
- Xiao, R.; Yu, C.; Li, Z.; He, X. Statistical assessment metrics for InSAR atmospheric correction: Applications to generic atmospheric correction online service for InSAR (GACOS) in Eastern China. Int. J. Appl. Earth Obs. Geoinf. 2021, 96, 102289. [Google Scholar] [CrossRef]
- Tomás, R.; Díaz, E.; Szeibert, W.; Liu, X.; Lopez-Sanchez, J.M.; Zhao, C. Geomorphological characterization, remote sensing monitoring, and modeling of a slow-moving landslide in Alcoy (Southern Spain). Landslides 2023, 20, 1293–1301. [Google Scholar] [CrossRef]
- Xiao, R.; Yu, C.; Li, Z.; Jiang, M.; He, X. InSAR stacking with atmospheric correction for rapid geohazard detection: Applications to ground subsidence and landslides in China. Int. J. Appl. Earth Obs. Geoinf. 2022, 115, 103082. [Google Scholar] [CrossRef]
- Modeste, G.; Doubre, C.; Masson, F. Time evolution of mining-related residual subsidence monitored over a 24-year period using InSAR in southern Alsace, France. Int. J. Appl. Earth Obs. Geoinf. 2021, 102, 102392. [Google Scholar] [CrossRef]
- Wang, G.; Li, P.; Li, Z.; Liang, C.; Wang, H. Coastal subsidence detection and characterization caused by brine mining over the Yellow River Delta using time series InSAR and PCA. Int. J. Appl. Earth Obs. Geoinf. 2022, 114, 103077. [Google Scholar] [CrossRef]
- Hanssen, R.F.; Van Leijen, F.J. Monitoring water defense structures using radar interferometry. In Proceedings of the 2008 IEEE Radar Conference, Rome, Italy, 26–30 May 2008; pp. 1–4. [Google Scholar]
- Liao, M.; Tang, J.; Wang, T.; Balz, T.; Zhang, L. Landslide monitoring with high-resolution SAR data in the Three Gorges region. Sci. China Earth Sci. 2012, 55, 590–601. [Google Scholar] [CrossRef]
- Voege, M.; Frauenfelder, R.; Larsen, Y. Displacement monitoring at Svartevatn dam with interferometric SAR. In Proceedings of the 2012 IEEE International Geoscience and Remote Sensing Symposium, Munich, Germany, 22–27 July 2012; pp. 3895–3898. [Google Scholar]
- Milillo, P.; Bürgmann, R.; Lundgren, P.; Salzer, J.; Perissin, D.; Fielding, E.; Biondi, F.; Milillo, G. Space geodetic monitoring of engineered structures: The ongoing destabilization of the Mosul dam, Iraq. Sci. Rep. 2016, 6, 37408. [Google Scholar] [CrossRef]
- Emadali, L.; Motagh, M.; Haghighi, M.H. Characterizing post-construction settlement of the Masjed-Soleyman embankment dam, Southwest Iran, using TerraSAR-X SpotLight radar imagery. Eng. Struct. 2017, 143, 261–273. [Google Scholar] [CrossRef]
- Al-Husseinawi, Y.; Li, Z.; Clarke, P.; Edwards, S. Evaluation of the stability of the Darbandikhan Dam after the 12 November 2017 Mw 7.3 Sarpol-e Zahab (Iran–Iraq border) earthquake. Remote Sens. 2018, 10, 1426. [Google Scholar] [CrossRef]
- Li, T.; Motagh, M.; Wang, M.; Zhang, W.; Gong, C.; Xiong, X.; He, J.; Chen, L.; Liu, J. Earth and rock-filled dam monitoring by high-resolution X-band interferometry: Gongming dam case study. Remote Sens. 2019, 11, 246. [Google Scholar] [CrossRef]
- Xie, L.; Xu, W.; Ding, X. Precursory motion and deformation mechanism of the 2018 Xe Pian-Xe Namnoy dam Collapse, Laos: Insights from satellite radar interferometry. Int. J. Appl. Earth Obs. Geoinf. 2022, 109, 102797. [Google Scholar] [CrossRef]
- Xiao, R.; Jiang, M.; Li, Z.; He, X. New insights into the 2020 Sardoba dam failure in Uzbekistan from Earth observation. Int. J. Appl. Earth Obs. Geoinf. 2022, 107, 102705. [Google Scholar] [CrossRef]
- Mishra, V.; Jain, K. Satellite based assessment of artificial reservoir induced landslides in data scarce environment: A case study of Baglihar reservoir in India. J. Appl. Geophys. 2022, 205, 104754. [Google Scholar] [CrossRef]
- Zhu, Y.; Yao, X.; Yao, L.; Zhou, Z.; Ren, K.; Li, L.; Yao, C.; Gu, Z. Identifying the mechanism of toppling deformation by InSAR: A case study in Xiluodu reservoir, Jinsha river. Landslides 2022, 19, 2311–2327. [Google Scholar] [CrossRef]
- Li, L.; Wen, B.; Yao, X.; Zhou, Z.; Zhu, Y. InSAR-based method for monitoring the long-time evolutions and spatial-temporal distributions of unstable slopes with the impact of water-level fluctuation: A case study in the Xiluodu reservoir. Remote Sens. Environ. 2023, 295, 113686. [Google Scholar] [CrossRef]
- China’s Mega Water Diversion Project Benefits over 150 mln People. Available online: http://en.people.cn/n3/2023/0515/c90000-20018237.html (accessed on 14 October 2023).
- Rogers, S.; Chen, D.; Jiang, H.; Rutherfurd, I.; Wang, M.; Webber, M.; Crow-Miller, B.; Barnett, J.; Finlayson, B.; Jiang, M. An integrated assessment of China’s South—North water transfer project. Geogr. Res. 2020, 58, 49–63. [Google Scholar] [CrossRef]
- Long, D.; Yang, W.T.; Scanlon, B.R.; Zhao, J.S.; Liu, D.G.; Burek, P.; Pan, Y.; You, L.Z.; Wada, Y. South-to-North Water Diversion stabilizing Beijing’s groundwater levels. Nat. Commun. 2020, 11, 1–10. [Google Scholar] [CrossRef]
- Yan, H.; Lin, Y.; Chen, Q.; Zhang, J.; He, S.; Feng, T.; Wang, Z.; Chen, C.; Ding, J. A Review of the Eco-Environmental Impacts of the South-to-North Water Diversion: Implications for Interbasin Water Transfers. Engineering 2023, in press. [CrossRef]
- Copernicus DEM. 2021. Available online: https://spacedata.copernicus.eu/en/web/guest/collections/copernicus-digital-elevation-model (accessed on 29 August 2023).
- Hooper, A.; Segall, P.; Zebker, H. Persistent scatterer interferometric synthetic aperture radar for crustal deformation analysis, with application to Volcán Alcedo, Galápagos. J. Geophys. Res. Solid Earth 2007, 112, 4763. [Google Scholar] [CrossRef]
- Jiang, M. Sentinel-1 TOPS co-registration over low-coherence areas and its application to velocity estimation using the all pairs shortest path algorithm. J. Geod. 2020, 94, 1–15. [Google Scholar] [CrossRef]
- Eineder, M.; Hubig, M.; Milcke, B. Unwrapping large interferograms using the minimum cost flow algorithm. In Proceedings of the IGARSS’98. Sensing and Managing the Environment. 1998 IEEE International Geoscience and Remote Sensing, Symposium Proceedings (Cat. No. 98CH36174), Seattle, WA, USA, 6–10 July 1998; pp. 83–87. [Google Scholar]
- Morishita, Y.; Lazecky, M.; Wright, T.J.; Weiss, J.R.; Elliott, J.R.; Hooper, A. LiCSBAS: An open-source InSAR time series analysis package integrated with the LiCSAR automated Sentinel-1 InSAR processor. Remote Sens. 2020, 12, 424. [Google Scholar] [CrossRef]
- Chen, C.W.; Zebker, H.A. Phase unwrapping for large SAR interferograms: Statistical segmentation and generalized network models. IEEE Trans. Geosci. Remote Sens. 2002, 40, 1709–1719. [Google Scholar] [CrossRef]
- Wright, T.J.; Parsons, B.E.; Lu, Z. Toward mapping surface deformation in three dimensions using InSAR. Geophys. Res. Lett. 2004, 31, 169–178. [Google Scholar] [CrossRef]
- Qu, X.; Shi, L.; Qu, X.; Qiu, M.; Gao, W.; Wang, J. Evaluation of Groundwater Resources and Exploitation Potential: A Case from Weifang City of Shandong Province in China. ACS Omega 2021, 6, 10592–10606. [Google Scholar] [CrossRef] [PubMed]
- Li, F.; Sun, Q.; Wang, W.; Qu, S.; Ni, L.; Wang, C. Changes of virtual water trade based on input-output model in Shandong Province and environment response in representative region. In Proceedings of the IOP Conference Series: Earth and Environmental Science, Guiyang, China, 14–16 June 2019; p. 052059. [Google Scholar]
- Wang, K.; Chen, H.; Fu, S.; Li, F.; Wu, Z.; Xu, D. Analysis of exploitation control in typical groundwater over-exploited area in North China Plain. Hydrol. Sci. J. 2021, 66, 851–861. [Google Scholar] [CrossRef]
- DS-13(9)-17; Design Standards No. 13 Embankment Dams, Chapter 9: Static Deformation Analysis Phase 4 (Final). U.S. Department of the Interior, Bureau of Reclamation: Denver, CO, USA, 2011.
- Xiao, R.; Shi, H.; He, X.; Li, Z.; Jia, D.; Yang, Z. Deformation monitoring of reservoir dams using GNSS: An application to south-to-north water diversion project, China. IEEE Access 2019, 7, 54981–54992. [Google Scholar] [CrossRef]
- Cigna, F.; Ramírez, R.E.; Tapete, D. Accuracy of Sentinel-1 PSI and SBAS InSAR Displacement Velocities against GNSS and Geodetic Leveling Monitoring Data. Remote Sens. 2021, 13, 4800. [Google Scholar] [CrossRef]
- Manunta, M.; De Luca, C.; Zinno, I.; Casu, F.; Manzo, M.; Bonano, M.; Fusco, A.; Pepe, A.; Onorato, G.; Berardino, P. The Parallel SBAS Approach for Sentinel-1 Interferometric Wide Swath Deformation Time-Series Generation: Algorithm Description and Products Quality Assessment. IEEE Trans. Geosci. Remote. Sens. 2019, 57, 6259–6281. [Google Scholar] [CrossRef]
- Fell, R.; MacGregor, P.; Stapledon, D.; Bell, G.; Foster, M. Geotechnical Engineering of Dams, 2nd ed.; CRC Press: London, UK, 2014. [Google Scholar]

| Items | Parameters | ||
|---|---|---|---|
| Platform | Sentinel-1 | TerraSAR-X | |
| Orbit direction | Ascending | Descending | Descending |
| Mode | Interferometric wide | Interferometric wide | StripMap |
| Heading angle | −13.24 | 193.22 | 192.23 |
| Incidence angle | 39.17 | 43.92 | 40.99 |
| Revisit period | 12 days | 12 days | 11 days |
| Time interval | From 9 January 2016 to 27 December 2022 | From 5 October 2016 to 14 December 2021 | From 6 March 2016 to 4 March 2017 |
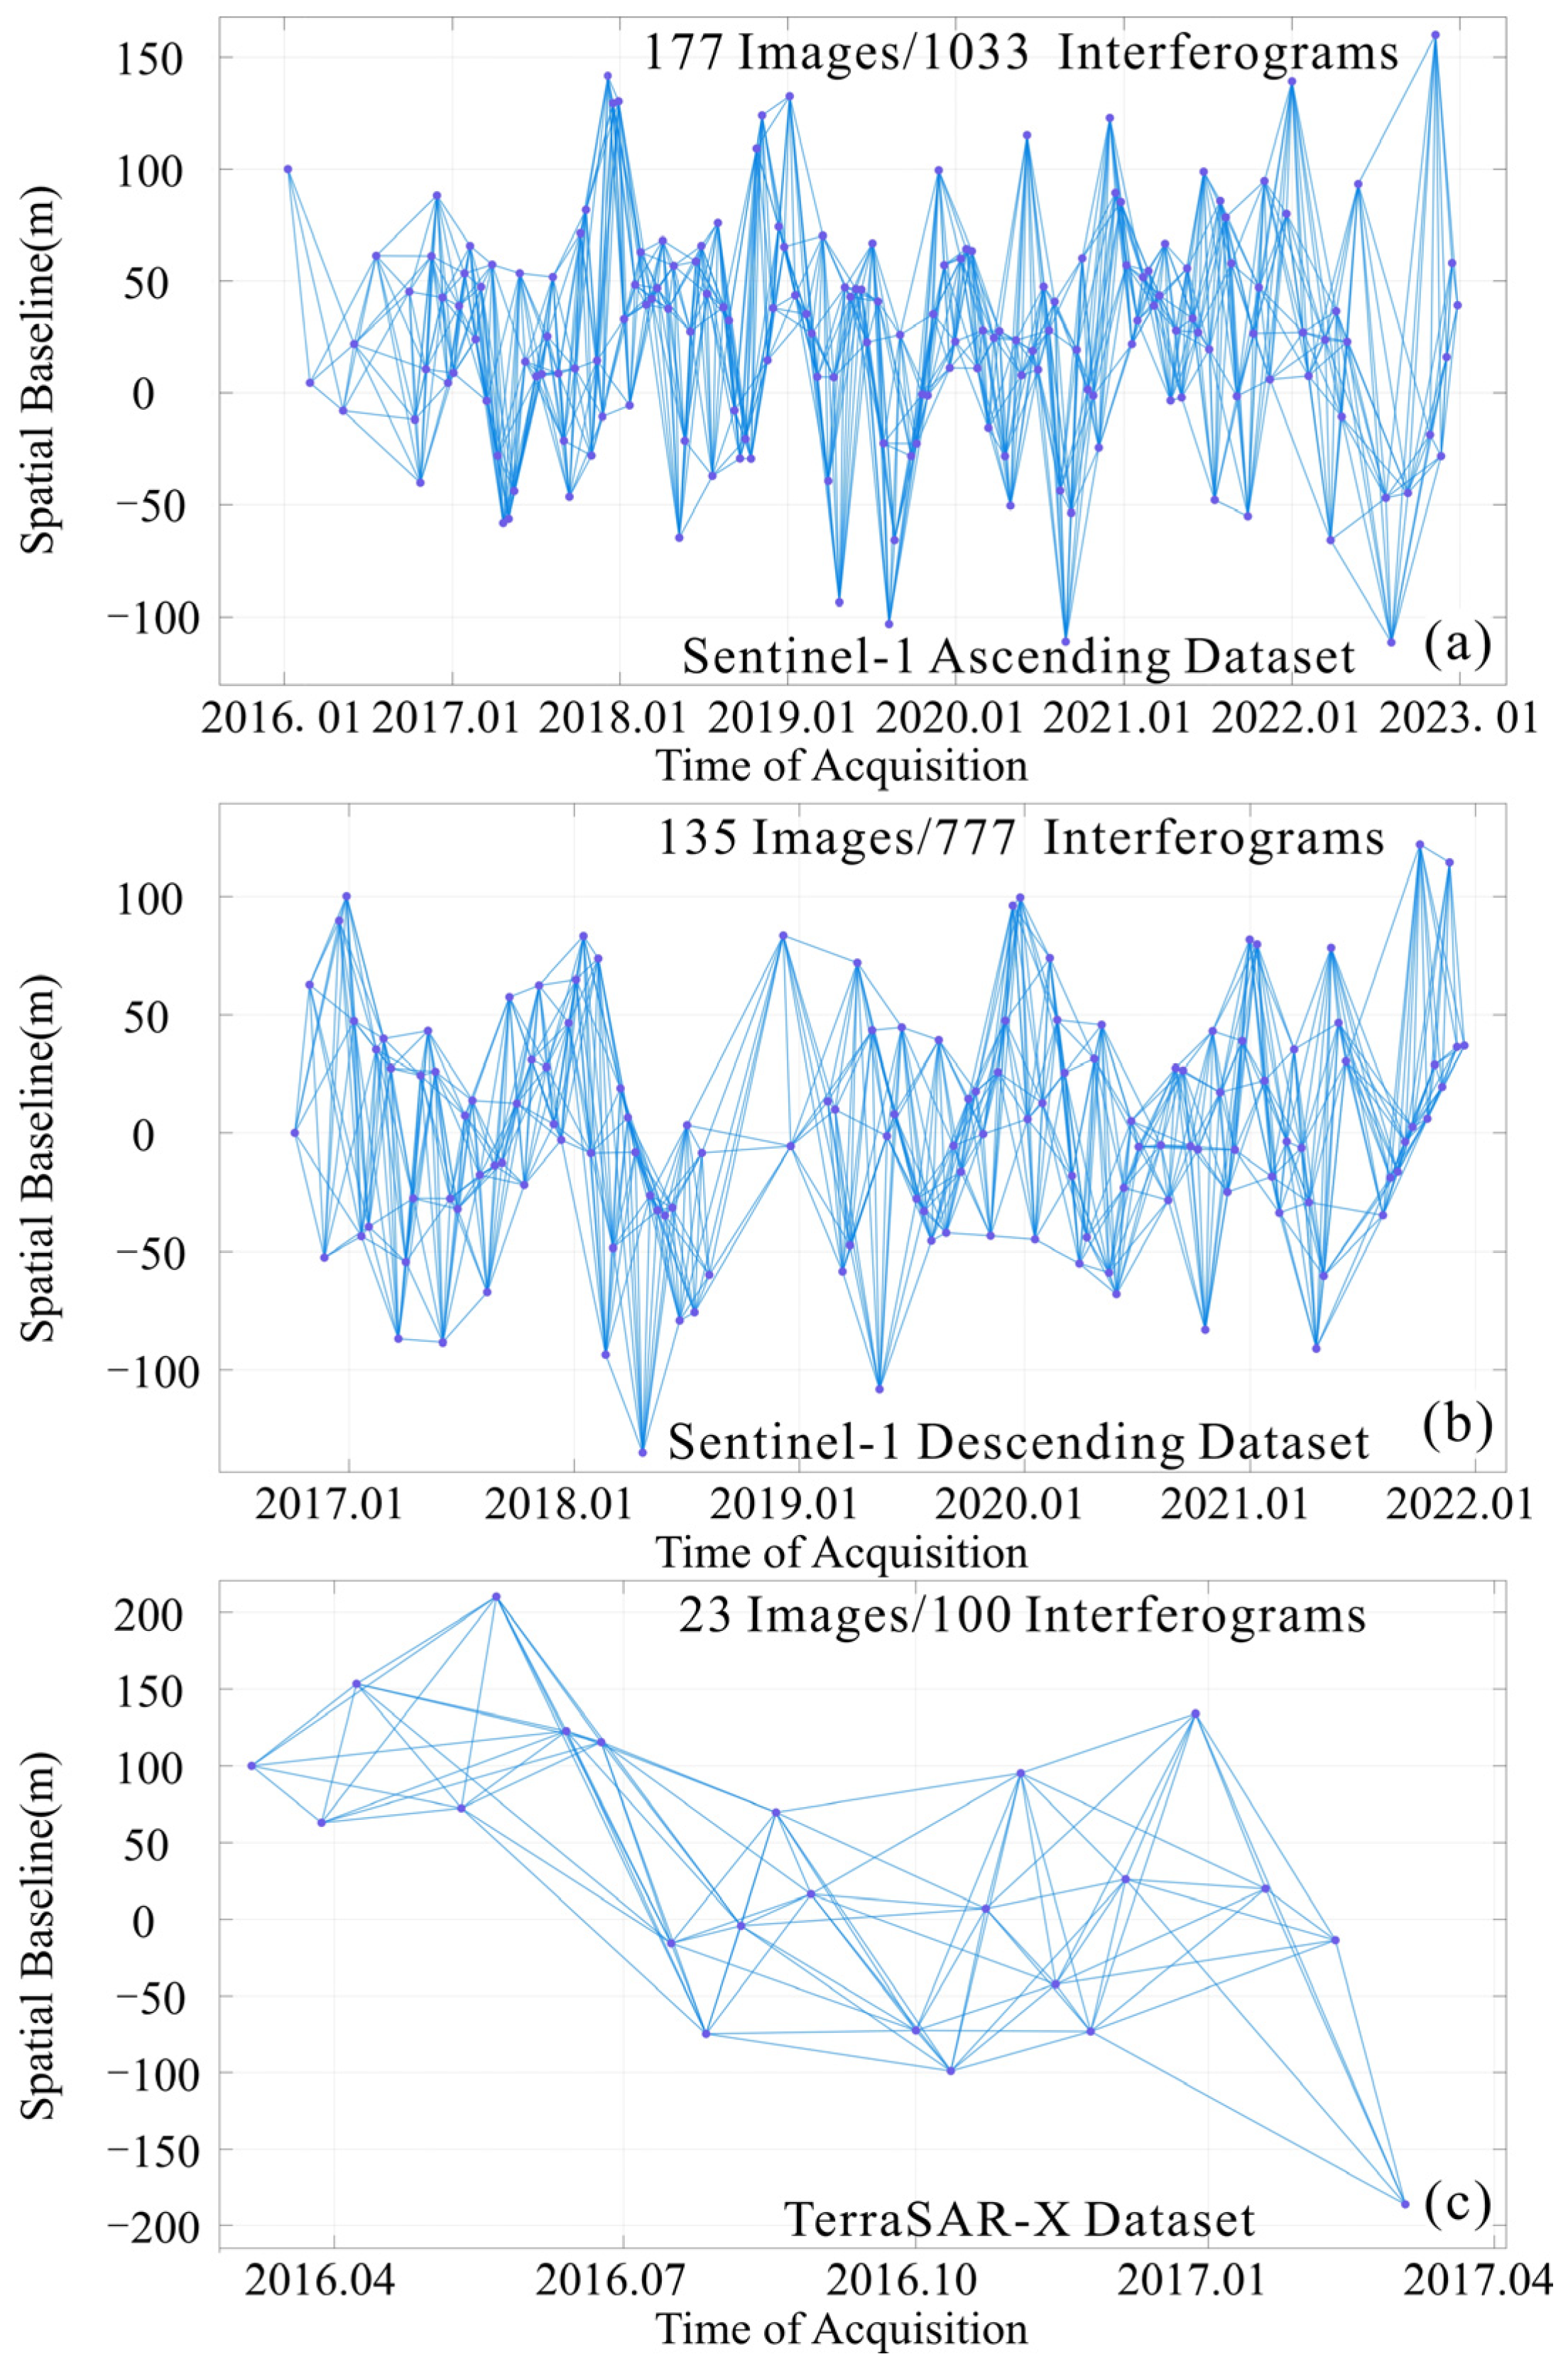
| Number of images | 177 | 135 | 23 |
| Time span | 7 years | 6.3 years | 1 year |
Disclaimer/Publisher’s Note: The statements, opinions and data contained in all publications are solely those of the individual author(s) and contributor(s) and not of MDPI and/or the editor(s). MDPI and/or the editor(s) disclaim responsibility for any injury to people or property resulting from any ideas, methods, instructions or products referred to in the content. |
© 2024 by the authors. Licensee MDPI, Basel, Switzerland. This article is an open access article distributed under the terms and conditions of the Creative Commons Attribution (CC BY) license (https://creativecommons.org/licenses/by/4.0/).
Share and Cite
Xiao, R.; Gao, X.; Wang, X.; Yuan, S.; Wu, Z.; He, X. Measuring Dam Deformation of Long-Distance Water Transfer Using Multi-Temporal Synthetic Aperture Radar Interferometry: A Case Study in South-to-North Water Diversion Project, China. Remote Sens. 2024, 16, 365. https://doi.org/10.3390/rs16020365
Xiao R, Gao X, Wang X, Yuan S, Wu Z, He X. Measuring Dam Deformation of Long-Distance Water Transfer Using Multi-Temporal Synthetic Aperture Radar Interferometry: A Case Study in South-to-North Water Diversion Project, China. Remote Sensing. 2024; 16(2):365. https://doi.org/10.3390/rs16020365
Chicago/Turabian StyleXiao, Ruya, Xiaoyuan Gao, Xun Wang, Shanshui Yuan, Zhou Wu, and Xiufeng He. 2024. "Measuring Dam Deformation of Long-Distance Water Transfer Using Multi-Temporal Synthetic Aperture Radar Interferometry: A Case Study in South-to-North Water Diversion Project, China" Remote Sensing 16, no. 2: 365. https://doi.org/10.3390/rs16020365
APA StyleXiao, R., Gao, X., Wang, X., Yuan, S., Wu, Z., & He, X. (2024). Measuring Dam Deformation of Long-Distance Water Transfer Using Multi-Temporal Synthetic Aperture Radar Interferometry: A Case Study in South-to-North Water Diversion Project, China. Remote Sensing, 16(2), 365. https://doi.org/10.3390/rs16020365