Article

Detection of the Infection Stage of Pine Wilt Disease and Spread Distance Using Monthly UAV-Based Imagery and a Deep Learning Approach

1
State Key Laboratory of Subtropical Silviculture, Zhejiang A & F University, Hangzhou 311300, China
2
Key Laboratory of Carbon Cycling in Forest Ecosystems and Carbon Sequestration of Zhejiang Province, Zhejiang A & F University, Hangzhou 311300, China
3
School of Environmental and Resources Science, Zhejiang A & F University, Hangzhou 311300, China
*
Author to whom correspondence should be addressed.
Remote Sens. 2024, 16(2), 364; https://doi.org/10.3390/rs16020364
Submission received: 13 November 2023 / Revised: 12 January 2024 / Accepted: 15 January 2024 / Published: 16 January 2024
(This article belongs to the Section Forest Remote Sensing)

Abstract

:
Pine wood nematode (PWN) is an invasive species which causes pine wilt disease (PWD), posing a significant threat to coniferous forests globally. Despite its destructive nature, strategies for the management of PWD spread lack a comprehensive understanding of the occurrence pattern of PWNs. This study investigates the outbreak timing and spread distances of PWD on a monthly scale. Two regions (A and B) in southeastern China, characterized by varying mixed ratios of coniferous and broadleaf trees, were examined. Infected trees were classified into early, middle, late, and dead stages. Monthly unmanned aerial vehicle (UAV) RGB data covering one year and three deep learning algorithms (i.e., Faster R-CNN, YOLOv5, and YOLOv8) were employed to identify the stress stages and positions of the trees. Further, each month, newly infected trees were recorded to calculate spread distances from the location of surrounding trees. The results indicate that the YOLOv5 model achieved the highest accuracy (mean average precision (mAP) = 0.58, F1 = 0.63), followed by Faster R-CNN (mAP = 0.55, F1 = 0.58) and YOLOv8 (mAP = 0.57, F1 = 0.61). Two PWD outbreak periods occurred between September–October and February of the following year, with early and middle-stage outbreaks in August and September and late and dead-tree outbreaks occurring between October and February of the following year. Over one year, the nearest spread distance for PWD-infected trees averaged 12.54 m (median: 9.24 m) for region A in September and 13.14 m (median: 10.26 m) for region B in October. This study concludes that February through August represents the optimal period for PWD control. Additionally, mixed conifer–broadleaf forests with a higher proportion of broadleaf trees prove beneficial in mitigating PWD outbreaks and reducing the number of infected trees. This work demonstrates the effectiveness of integrating monthly UAV-based imagery and deep learning algorithms for monitoring PWD outbreak times and spread distances, offering technical support for forest pest prevention and management.

1. Introduction

Pine wood nematodes (PWNs, Bursaphelenchus xylophilus) are worms of the genus Umbrella Slider in the family Slideraceae.; they are transmitted via the pine ink aspen, and they are primarily parasitic on the vast majority of pine plants in the Pinaceae family, including horsetail pine, black pine, and red pine [1]. By invading the bast and xylem of the pine tree, the pine wood nematode destroys the tree’s conductive tissues, resulting in the tree’s inability to properly absorb water and nutrients, causing the tree to wither and die rapidly. Recognized as pine wilt disease (PWD), this disease is extremely destructive and highly transmissible [2,3,4,5]. PWD has become prevalent in numerous countries worldwide, encompassing the United States, Canada, Mexico, South Korea, Japan, Portugal, Spain, and China, among others [6,7]. Within China, the disease has spread across several provinces, including Jiangsu, Zhejiang, and Jiangxi. In recent years, pine wilt disease has spread widely in southeastern China, causing the death of more than 10 million pine trees and damage to 1.5 million hectares of pine forests [8,9]. It is difficult to rapidly and comprehensively detect the location and spread direction of infected trees through traditional ground survey methods. Therefore, there is an urgent need to develop an effective and feasible approach to monitoring and controlling the outbreak of PWD.
Unmanned aerial vehicle (UAV)-based remote sensing has been widely used in monitoring PWD in recent years [10,11,12]. UAV technology, with its advantages of flexibility, portability, speed, and efficiency, can be equipped with multisensors for remote sensing data collection. These sensors, including multispectral, hyperspectral, and LiDAR, are commonly used to detect forest stress at the tree level [13,14,15]. Hyperspectral sensors with very high spectral resolution can accurately characterize physiological and biochemical changes in tree crowns [16,17,18,19]. To achieve monitoring, sensitive spectral bands and vegetation indices are usually used to evaluate the severity of infection in trees [20,21,22]. To improve model generalization in PWD detection, Li et al. (2022a) proposed a single-class classification approach (OCC) using the spatial–spectral features of hyperspectral data to achieve fine pixel-level PWD detection results [6]. However, hyperspectral-data-based analysis methods require spectral downscaling, sensitive band selection, and modeling to eliminate the information redundancy of hyperspectral images [23,24,25].
Compared to optical imagery, LiDAR (light detection and ranging) data can accurately obtain the three-dimensional structural information of tree crowns, which is more advantageous for monitoring defoliation symptoms [13,26,27,28]. However, LiDAR point clouds perform poorly in detecting canopy discoloration symptoms due to the inaccuracy of the reflection information response to physiological and biochemical changes in tree damage [29,30,31]. To integrate the advantages of hyperspectral and LiDAR sensors, Yu et al. [31] adopted a random forest algorithm to classify different stages of PWD based on combined metrics between UAV-based hyperspectral imagery and LiDAR point cloud data. Their results suggested that the data fusion approach can help improve prediction accuracy for different infection stages of PWD. However, the high cost of hyperspectral sensors and LIDAR sensors and the complexity of the data processing and analysis process have limited their widespread use and promotion [32,33,34].
Currently, deep learning algorithms such as convolutional neural networks (CNNs) are widely applied in UAV multispectral or RGB data analysis for forest health monitoring as they can accurately achieve the automated object detection and segmentation of damaged trees [35,36,37,38]. As shown by Yu et al. [39], object detection algorithms such as Faster R-CNN and YOLOv4 have been successfully used to detect different stages of PWD infection and the location of infected trees. Furthermore, removing interference from broad-leaved trees through UAV-based image classification helps improve recognition accuracy. In addition, some studies adopted semantic segmentation algorithms (e.g., U-Net and SCANet) to automatically delineate the boundary of a damaged tree crown [40]. Notably, the segmentation of overlapping tree crowns presents a significant challenge when working in denser forest environments. Most research studies have predominantly concentrated on late-stage infected and deceased trees, primarily relying on easily observable visual symptoms assessed through the analysis of single or multiple temporal UAV images. However, few studies have considered a priori information about PWD spatial distribution, host landscape connectivity, and dispersal mechanisms. Compared to semantic segmentation algorithms, an object detection method would be more suitable for analyzing the dispersal mechanisms (e.g., the spread distance) of PWD infection [6,8,39]. To our knowledge, a continuous time series analysis has not been used for monitoring PWD and its evolution process [41,42,43,44,45].
This article aims to explore the time series occurrence patterns and spread distance of PWD at different stages using continuous monthly UAV-based imagery. The main objectives of this study are (1) to compare the recognition accuracy of three deep learning object-detection algorithms, Faster R-CNN, YOLOv5, and YOLOv8; (2) to understand the pattern of variation in the number of newly infected trees and the spread distance at different stages of PWD infection over one year; and (3) to determine the optimal period for PWD control.

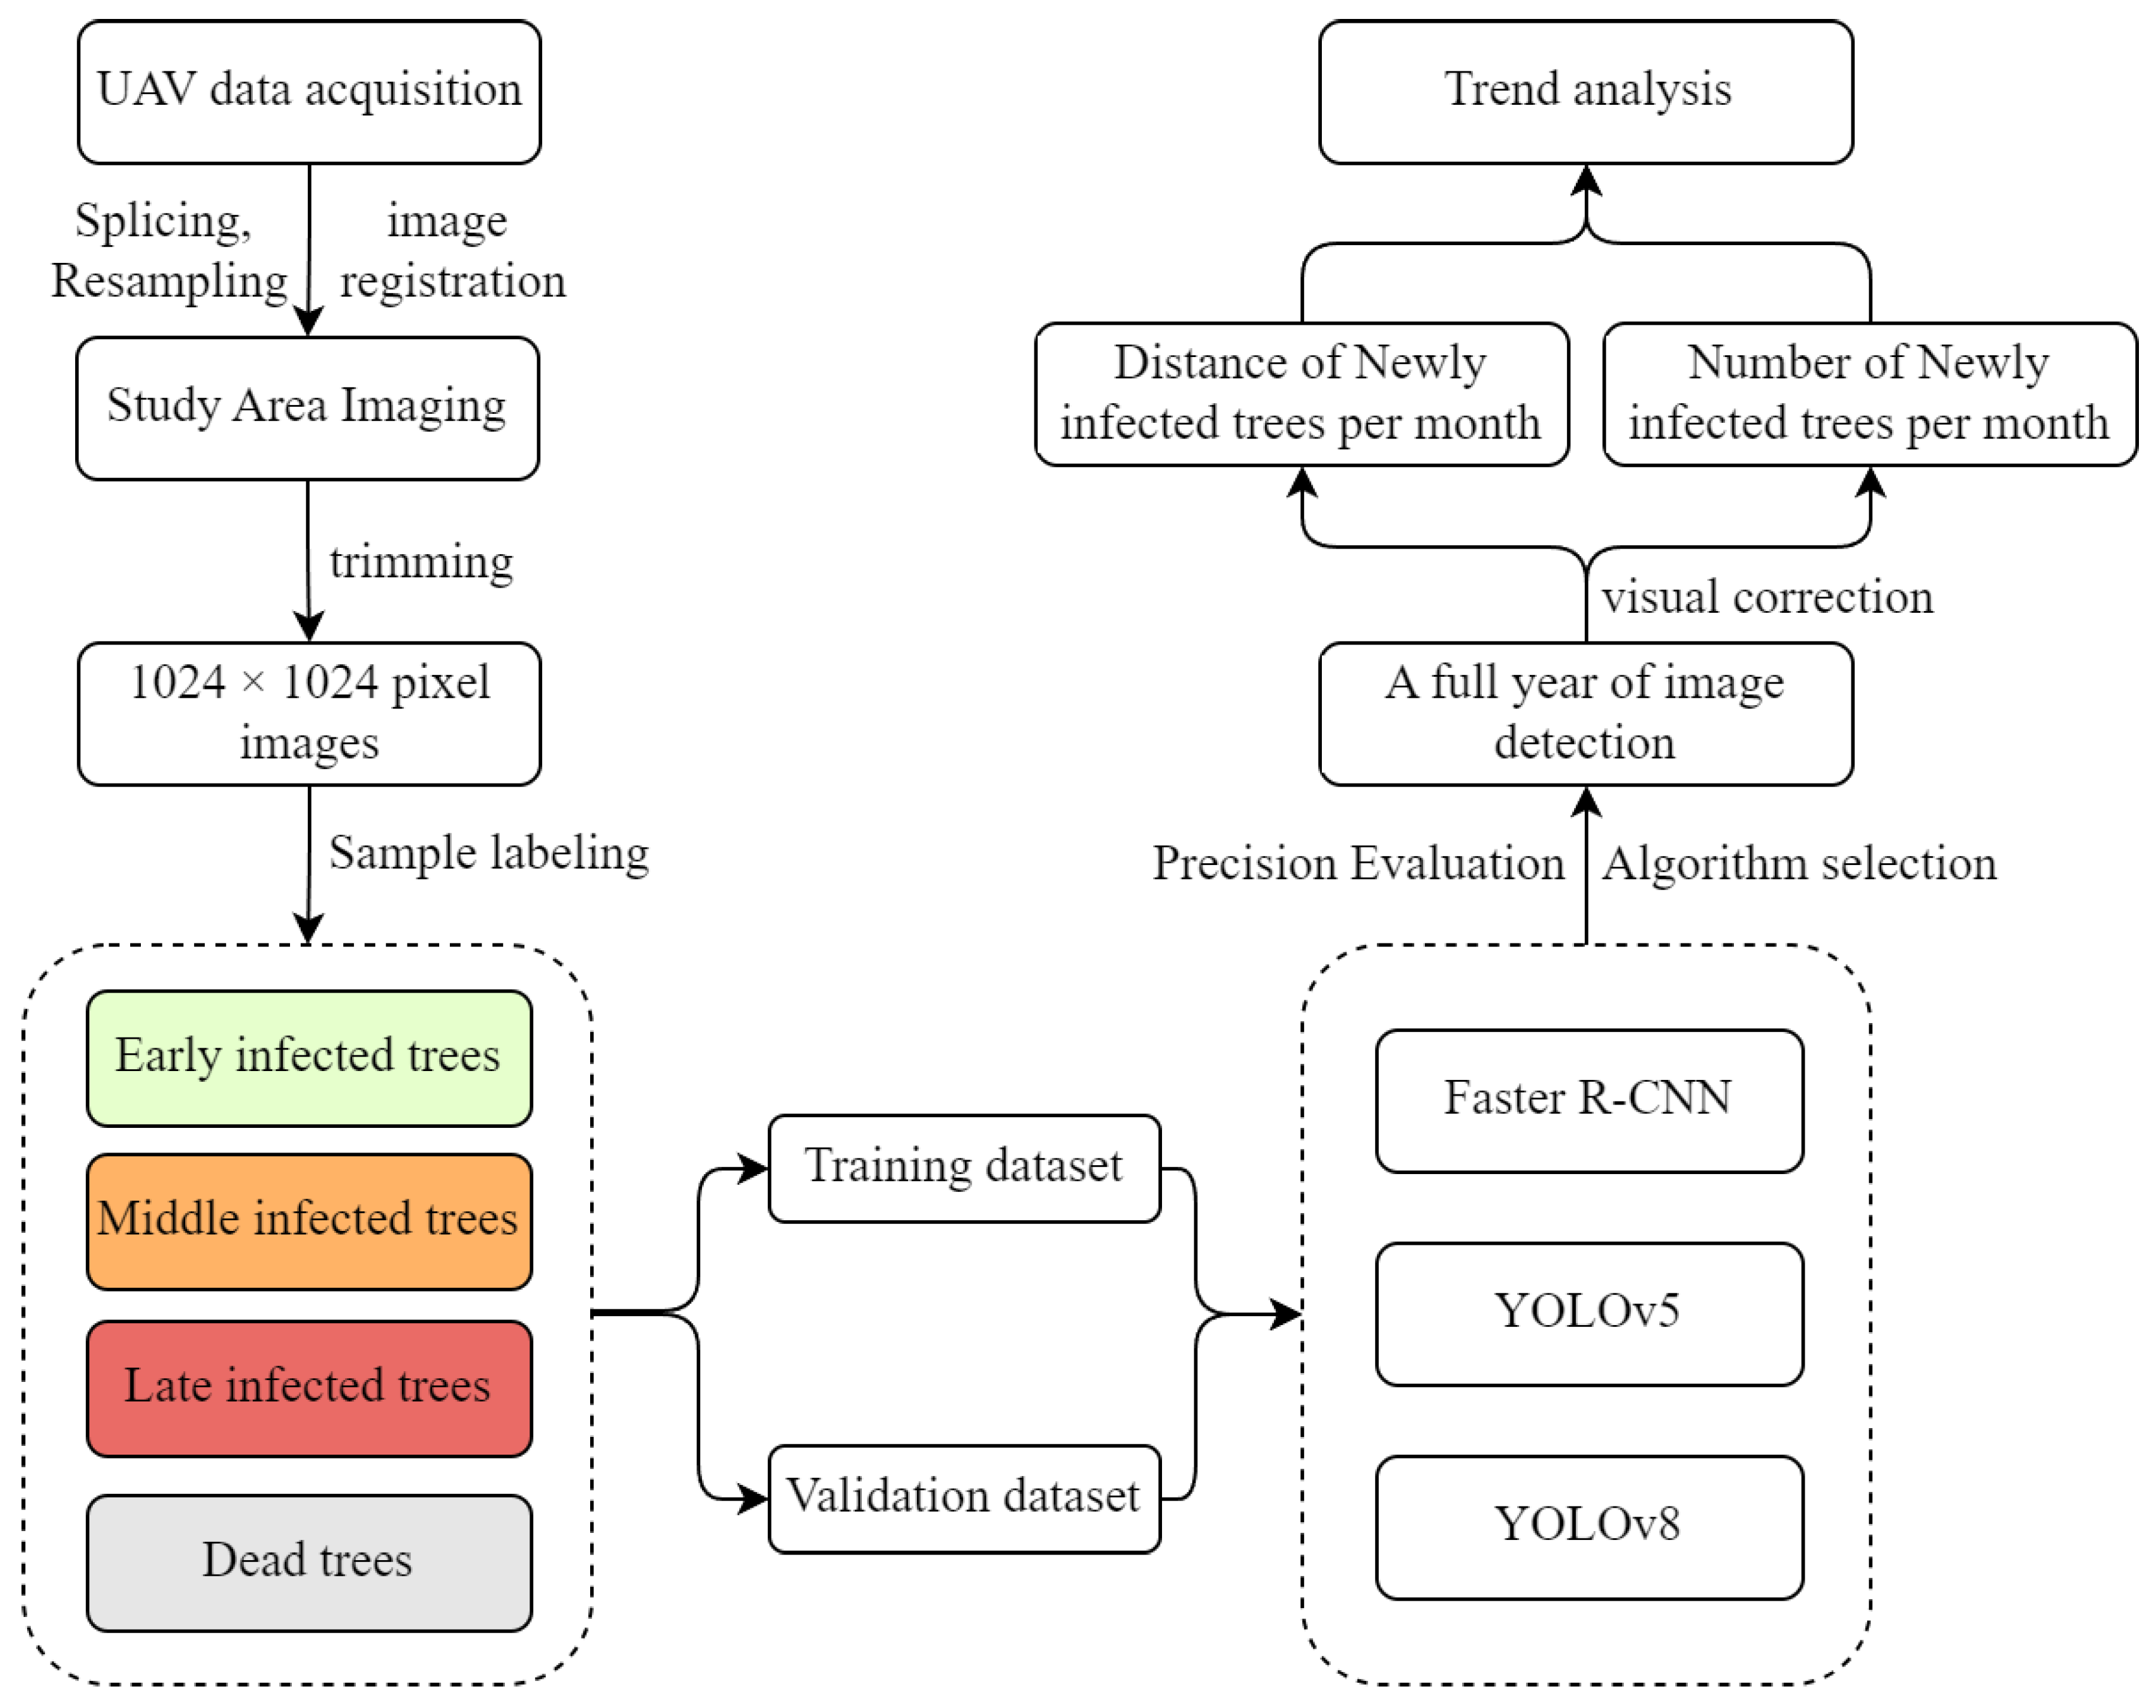
2. Materials and Methods

2.1. Study Area

The study site (Figure 1) is located in Xijing Mountain, Lin’an District, Hangzhou City, Zhejiang Province, East China, with a geographic location of 29°56′~30°23′N and 118°51′~119°52′E. The study region belongs to the Tianmu Mountain system in western Zhejiang Province, which is characterized by low hills and wide valleys and has a subtropical monsoon climate, 98% vegetation coverage, more than 500 species of trees, and an average annual precipitation and temperature of 1100–1600 mm and 14 °C. The main tree species include Pinus massoniana Lamb., Schima superba Gardner and Champ., and bamboo. Two regions (A and B) of mixed forests with areas of 29.91 ha and 28.15 ha, respectively, were selected.

2.2. Dataset Collection and Preprocessing

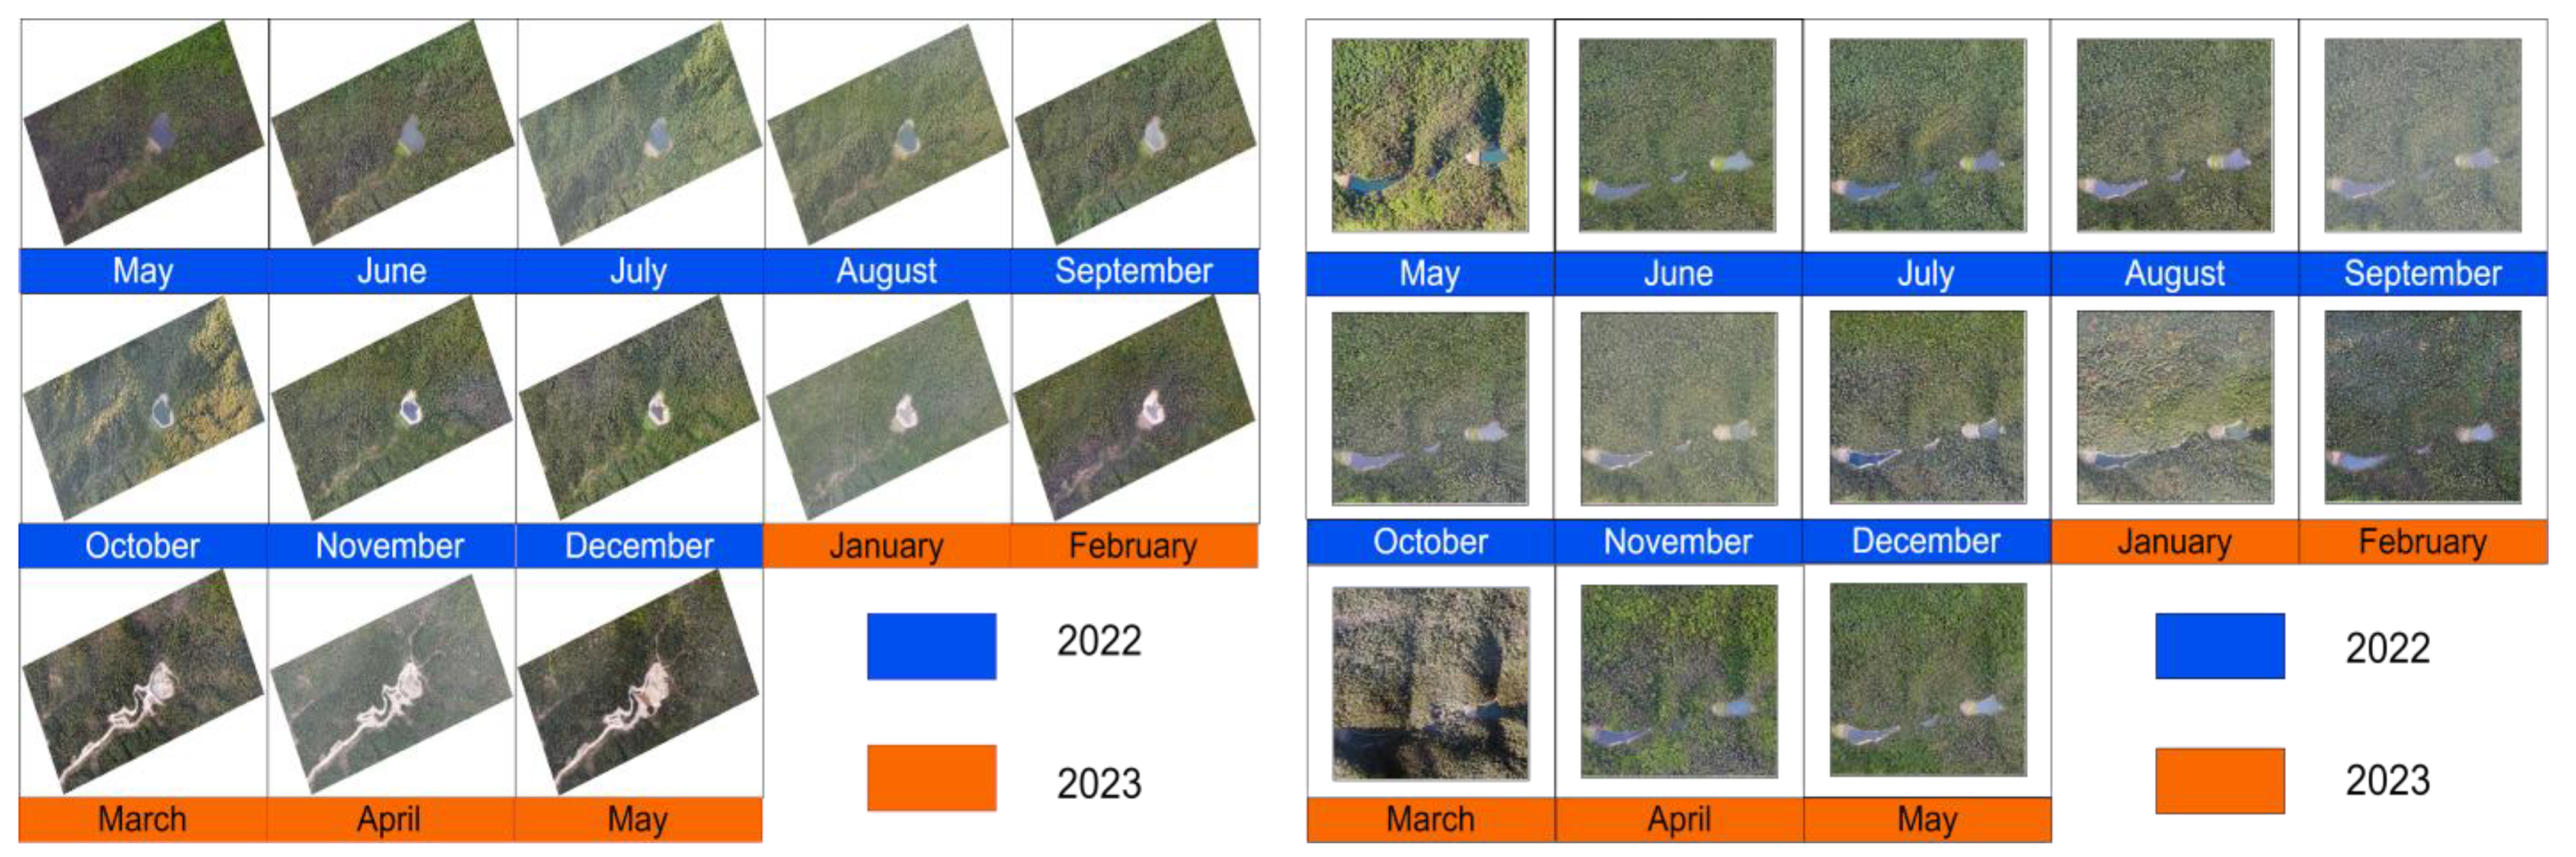
2.2.1. UAV-Based Imagery Acquisition

UAV-based RGB images were acquired using a DJI Mavic Air 2 platform from 1 May 2022 to 26 May 2023, with an interval of one month for each sample plot. This sensor has 48 million pixels and supports 48-megapixel photography with up to ten kilometers of mapping distance. The main parameters of the UAV sensor and environmental settings are shown in Table 1. To avoid overexposure due to direct sunlight and the effects of canopy shadows, overcast days with stable weather conditions were selected for UAV observations from 13:00 to 15:00. During the flight campaign, the overlap of both forward and sideways directions was set to 80% at a flight altitude of 300 m above the ground, with a flight speed of 9 m/s, and viewing angle of −90°. Finally, a total of 2703 pictures were collected over one year for the two sample plots. UAV-based imagery of the two areas is shown in Figure 2.

2.2.2. UAV-Based Imagery Preprocessing

The UAV-based RGB images acquired over one year were mosaiced using Agisoft PhotoScan Professional software (version 1.4.3) for each region. The spatial resolution of the monthly mosaic imagery was produced to 9 cm, and the coordinate system was defined to be the UTM projected coordinate system (UTM, Zone 50 North, WGS-84). To reduce geometric relative error between different monthly mosaic images, image-to-image registration was carried out employing the ENVI 5.3 software, resulting in high geometric matching accuracy with an error of less than one pixel.

2.2.3. Land Cover Classification

The discolored foliage of broadleaf trees in autumn and winter can easily interfere with the detection of infected trees (especially for red attack and dead trees) [39]. To this end, the land cover types of the images acquired in September were classified into needleleaf trees, broadleaf trees, water, and bare ground using a random forest (RF) algorithm. First, 100 points for each class were randomly selected and determined via visual inspection. Subsequently, all points were randomly divided into two datasets, i.e., a training dataset (accounting for 70%, comprising 280 samples) and a test dataset (accounting for 30%, comprising 120 samples). Furthermore, post-classification methods including majority–minority, clump class, and sieve class analyses were applied to remove the small patches to improve the classification accuracy. The classification accuracy of the RF model was assessed using the producer’s accuracy (PA), omission error (OE), user’s accuracy (UA), commission error (CE), overall accuracy (OA), and the kappa coefficient. Finally, the classified image was used to mask broadleaf trees for each monthly image.

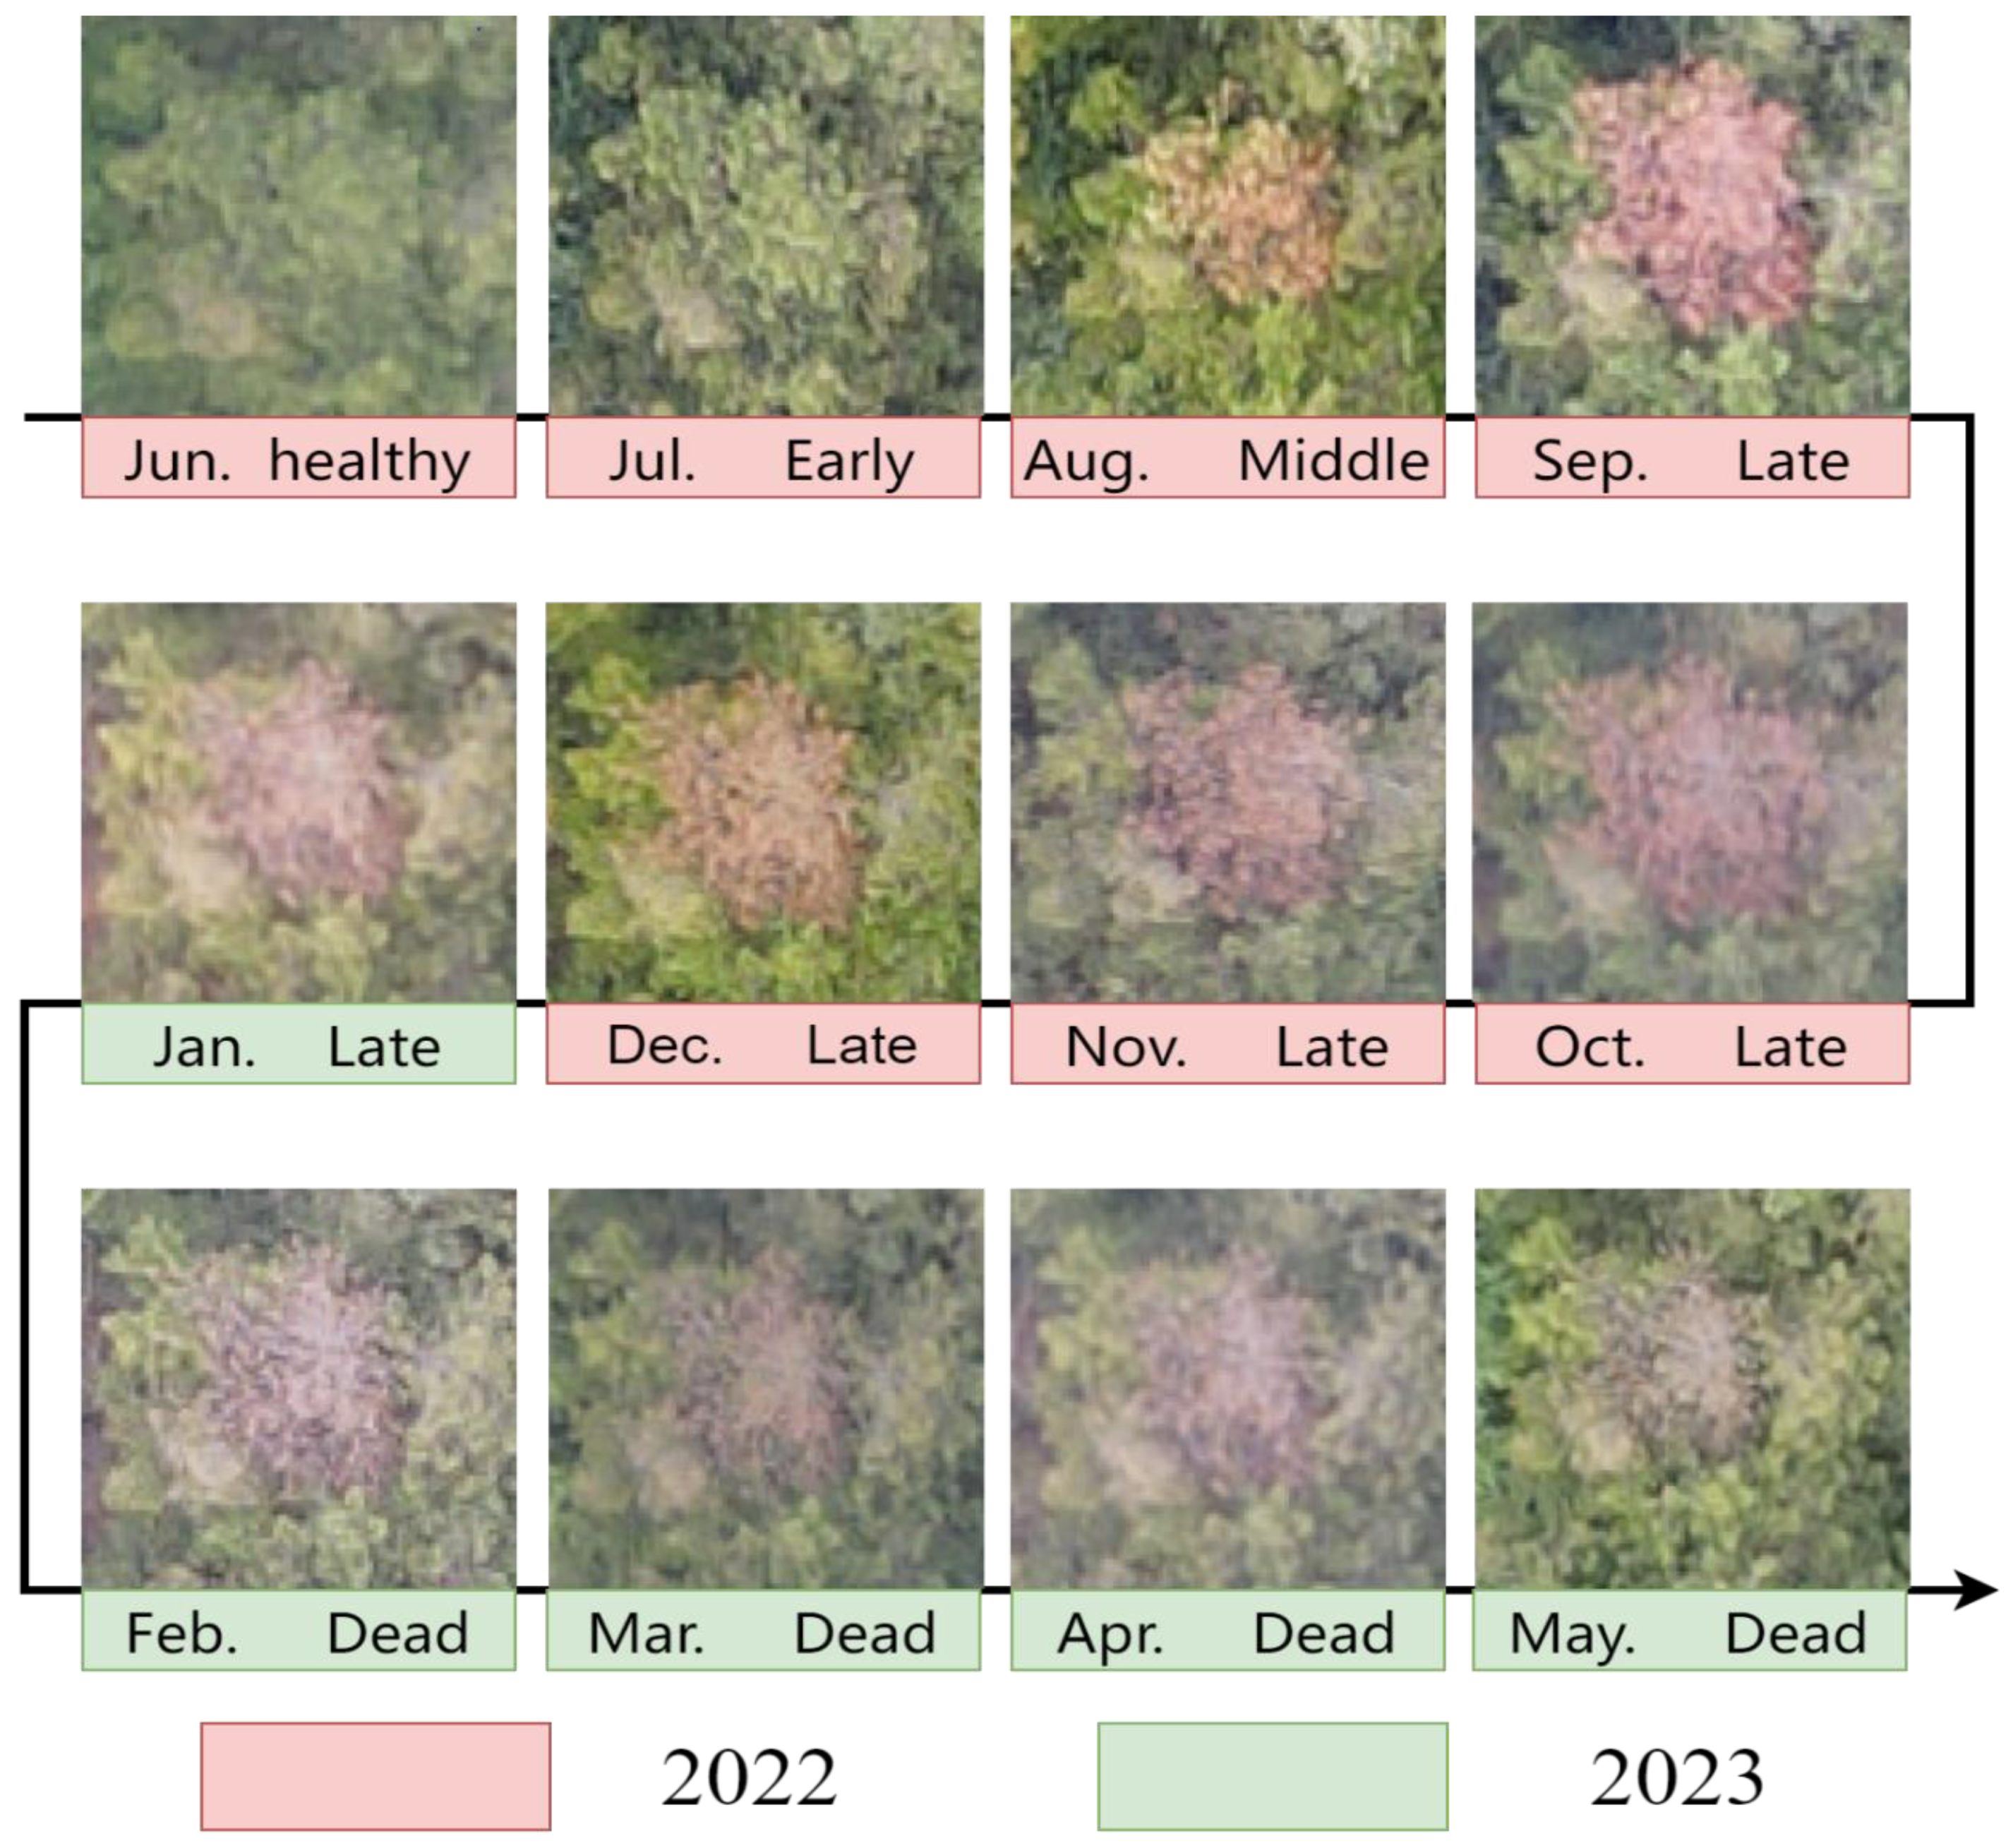
2.2.4. Image Labeling

The processed images were clipped into several sub-images with a size of 1024 × 1024 pixels. All sub-images were manually labeled using LableImg software (version 1.8.6). According to previous related studies [46,47], PWD infection was categorized into four stages (Figure 3): early stage, middle stage, late stage, and dead stage. Each stage was determined via a visual observation of the UAV images and field. Trees with needles that had begun to fade and turn yellow were labeled as belonging to the early stage. A mixture of yellow and red needles within tree crowns was identified as the middle stage. The late stage was determined to be when all needles in a tree crown were turning red. The dead stage was indicated by needles turning gray in color or when most of the needles were falling off. We randomly selected 80% of all labels for model training (early stage, 826; middle stage, 796; late stage: 844; and dead stage, 838), reserving the remainder for testing (early stage, 206; middle stage, 199; late stage, 211; and dead stage, 217) and maintaining the 1:1 ratio between the different stages of PWD infection from the original dataset using a balancing technique.

2.3. Deep Learning Algorithms

In this study, three deep learning algorithms, Faster Region-Based Convolutional Network (Faster R-CNN), You Only Look Once (YOLO) version 5 (YOLOv5), and YOLO version 8 (YOLO v8), were used for detecting different infection stages of PWD. Faster R-CNN is a classical two-stage target detection model, a well-developed and faster algorithm for target detection. The ResNet-50 network structure was used for this model training study. Faster R-CNN first uses input image features to generate a pre-selected box that is likely to contain an object and then performs background and object classification [48]. YOLOv5 is a single-stage target detection model that does not generate pre-selected boxes and extracts features directly in the network to predict the classification and location of an object [49]. The lightweight network structure of YOLOv5 was used in this study. The smaller network volume of YOLOv5 results in a fast speed in both training and detection, and it has been widely applied to real-time detection and detection using large volumes of data. YOLOv8 is currently the latest version. YOLOv8 adopts a more complex network architecture relative to YOLOv5, including multiple residual units and multiple branches, improving the C3 module into a C2f module in Backbone and PAN-FPN and replacing the anchor-based method with an anchor-free method.
Before model training, the iteration period was set to 300 epochs, the batch size was set to 16, and the threshold of Non-Maximum Suppression (NMS) was 0.7. The models were implemented using the Windows 10 operating system, 32 G of RAM, an Intel(R) Core (TM) i9-10900k [email protected] GHz(China), and an NVIDIA GeForce RTX 2060 GPU(ASUS, Shenzhen, China) for training and prediction. The overall workflow for this study is shown in Figure 4.

2.4. Accuracy Assessment Metric

To assess the performance and accuracy of the three models for the prediction of different stages of PWD infection, five metrics, Precision (P), Recall (R), F1 score, average precision (AP), and mean average precision (mAP) were selected.
P = T P T P + F P
R = T P T P + F N
F 1 = 2 P · R P + R
A P = 0 1 P ( R ) d R
m A P = 1 K i = 0 K A P i
where TP is the number of positive samples predicted by the model to be positive categories, FP is the number of negative samples predicted by the model to be positive categories, and FN is the number of positive samples predicted by the model to be negative categories; K is the number of categories predicted, and AP is the average precision of each category. In addition, the model parameters (Params), training time, and testing time were included to assess the performance of the three models.

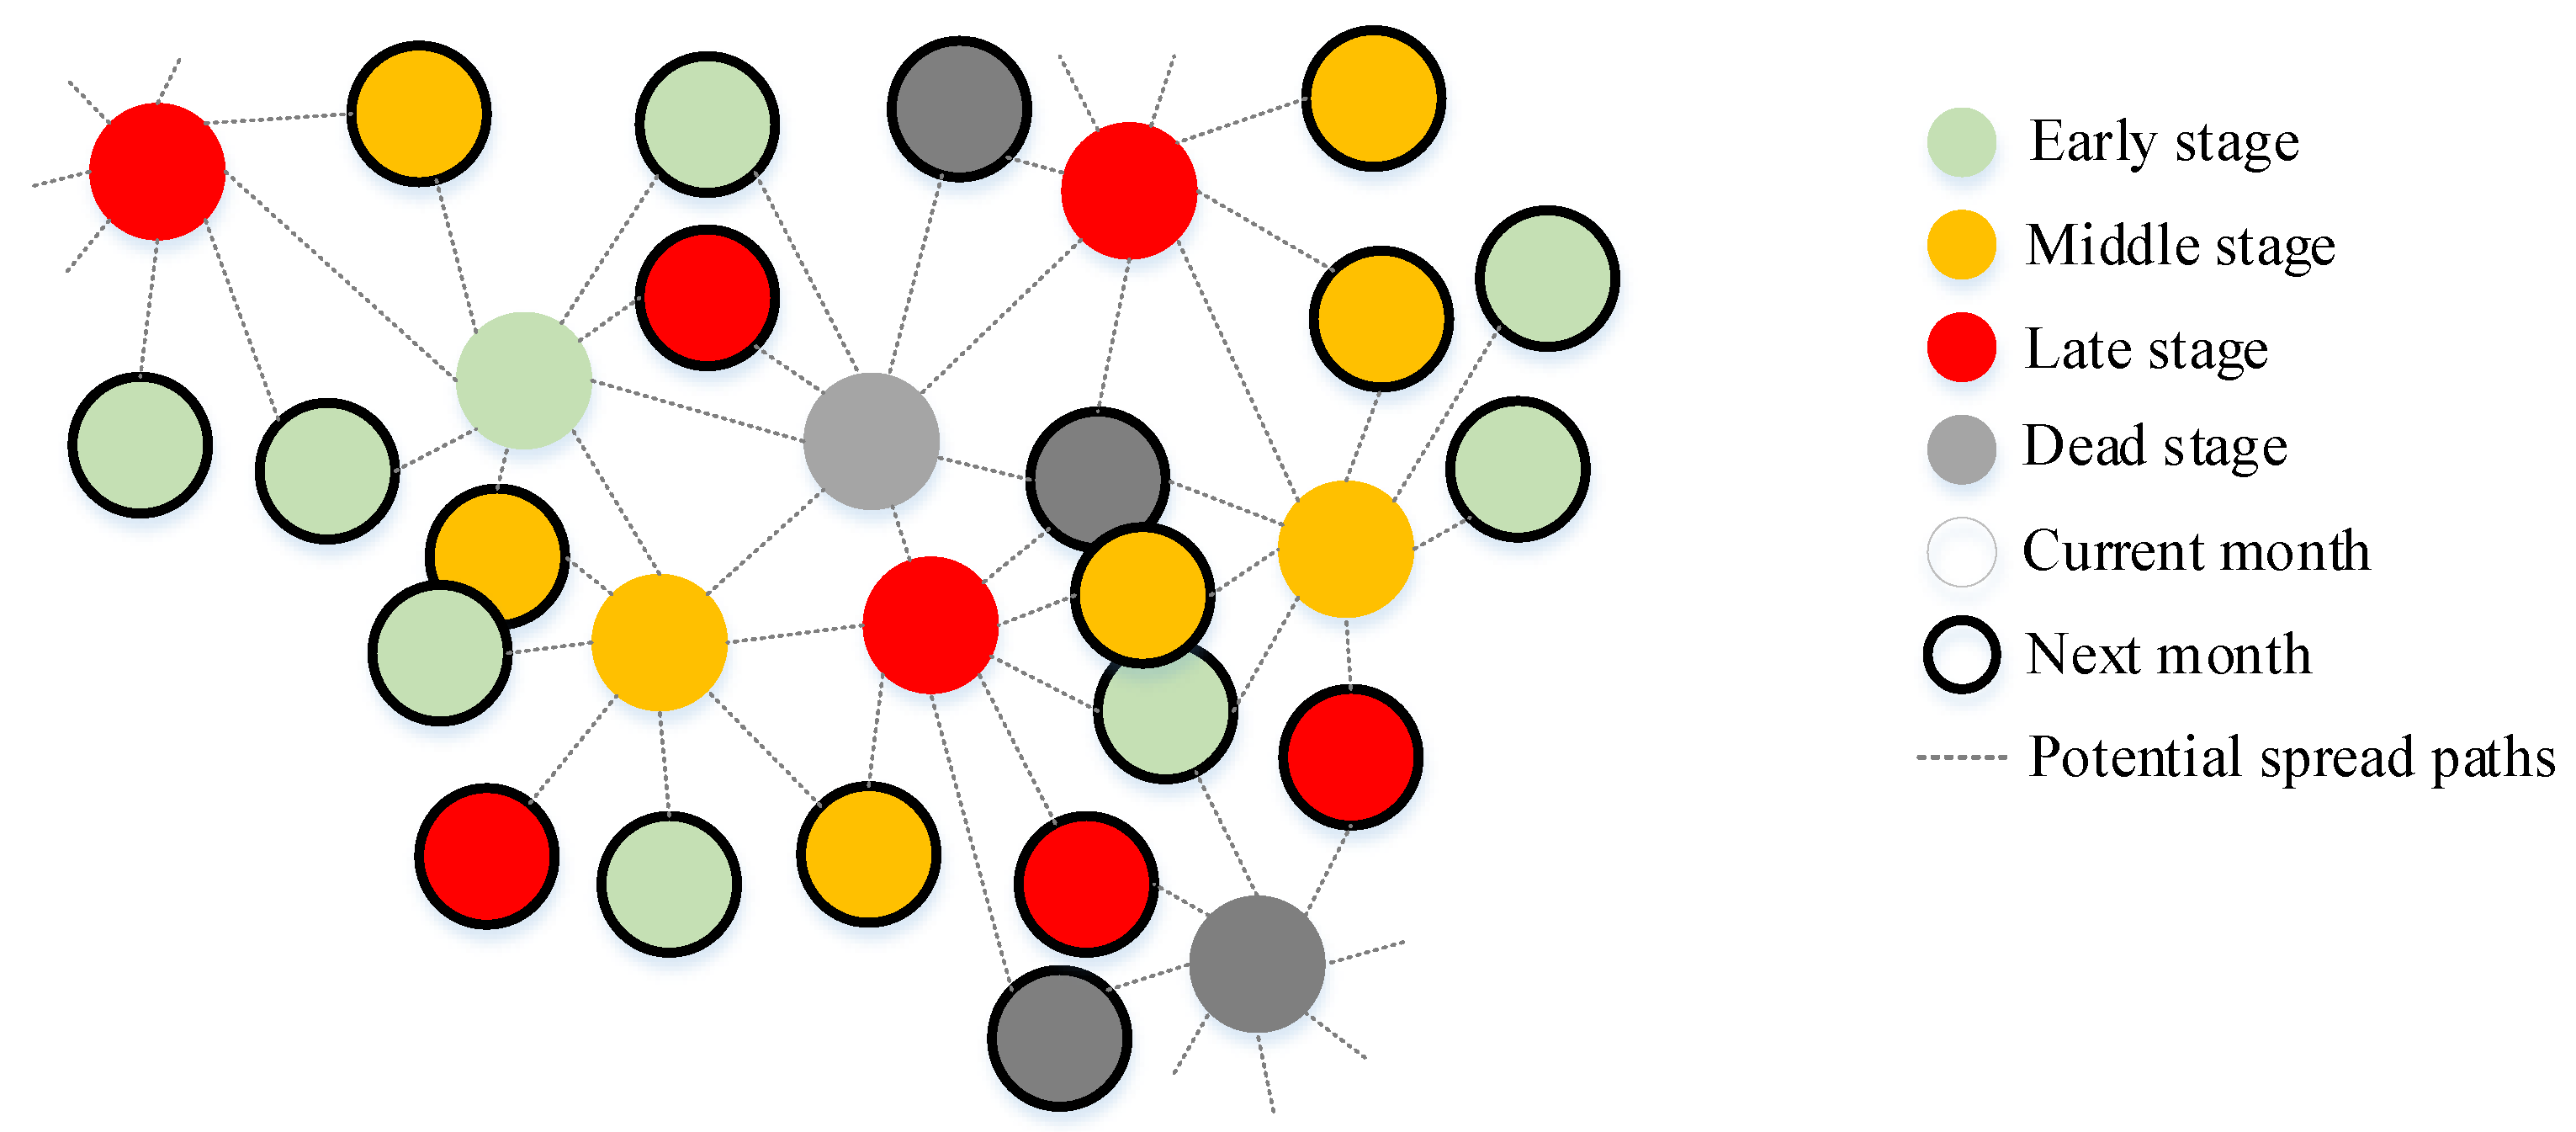
2.5. The Number of Newly Infected Trees and Spread Distance in Different Months

The infection stage of infected trees and corresponding tree locations for each month were predicted using the best performance of between Faster R-CNN, YOLOv5, and YOLOv8. Due to the possibility of misjudging or missing the infection stage of the trees in the detection results, we manually corrected it through visual interpretation. The number and coordinates of newly infected trees at different infection stages of each month will be recorded. In this study, we hypothesized that PWD infection was an individual distance-dependent spread processes between the pathogen and its host population. Therefore, each infected tree was considered a pathogen. The infected trees were connected with surrounding eight trees to form a spatial spread network (Figure 5). The nearest distance between infected trees of current month and newly infected trees of next month was regarded as the spread distance of PWD. We calculated the spread distance of all of the newly infected trees in two regions for each month. The median and mean values of the spread distance of all infected trees for each month represented the highest probability spread distance in the entire region. Here, a closer spread distance of individual trees obtained from regional statistics indicates a more pronounced clustering effect of PWD infection.

3. Results

3.1. Accuracy of Land Cover Classification Using UAV-Based Imagery

The classification accuracy of the RF model is shown in Table 2. Overall, good accuracy in mapping land cover types from UAV-based imagery was achieved, with OA values of 89.95% and 92.44% and kappa coefficients of 0.86 and 0.89 for region A and region B, respectively. Among the different land cover types, the RF model performs well when classifying water, bare ground, and broadleaf trees, with both PA and UA exceeding 85% for the two regions (Table 3). Although the needleleaf tree classification accuracy was relatively low compared to the other land cover types, it does not affect the further detection of infection stages. Classification maps of the two regions are shown in Figure 6. In this context, the proportions of needleleaf and broadleaf trees in Region A are 20.49% and 76.70%, respectively, while in Region B, the proportions of needleleaf and broadleaf trees are 17.51% and 79.24%.

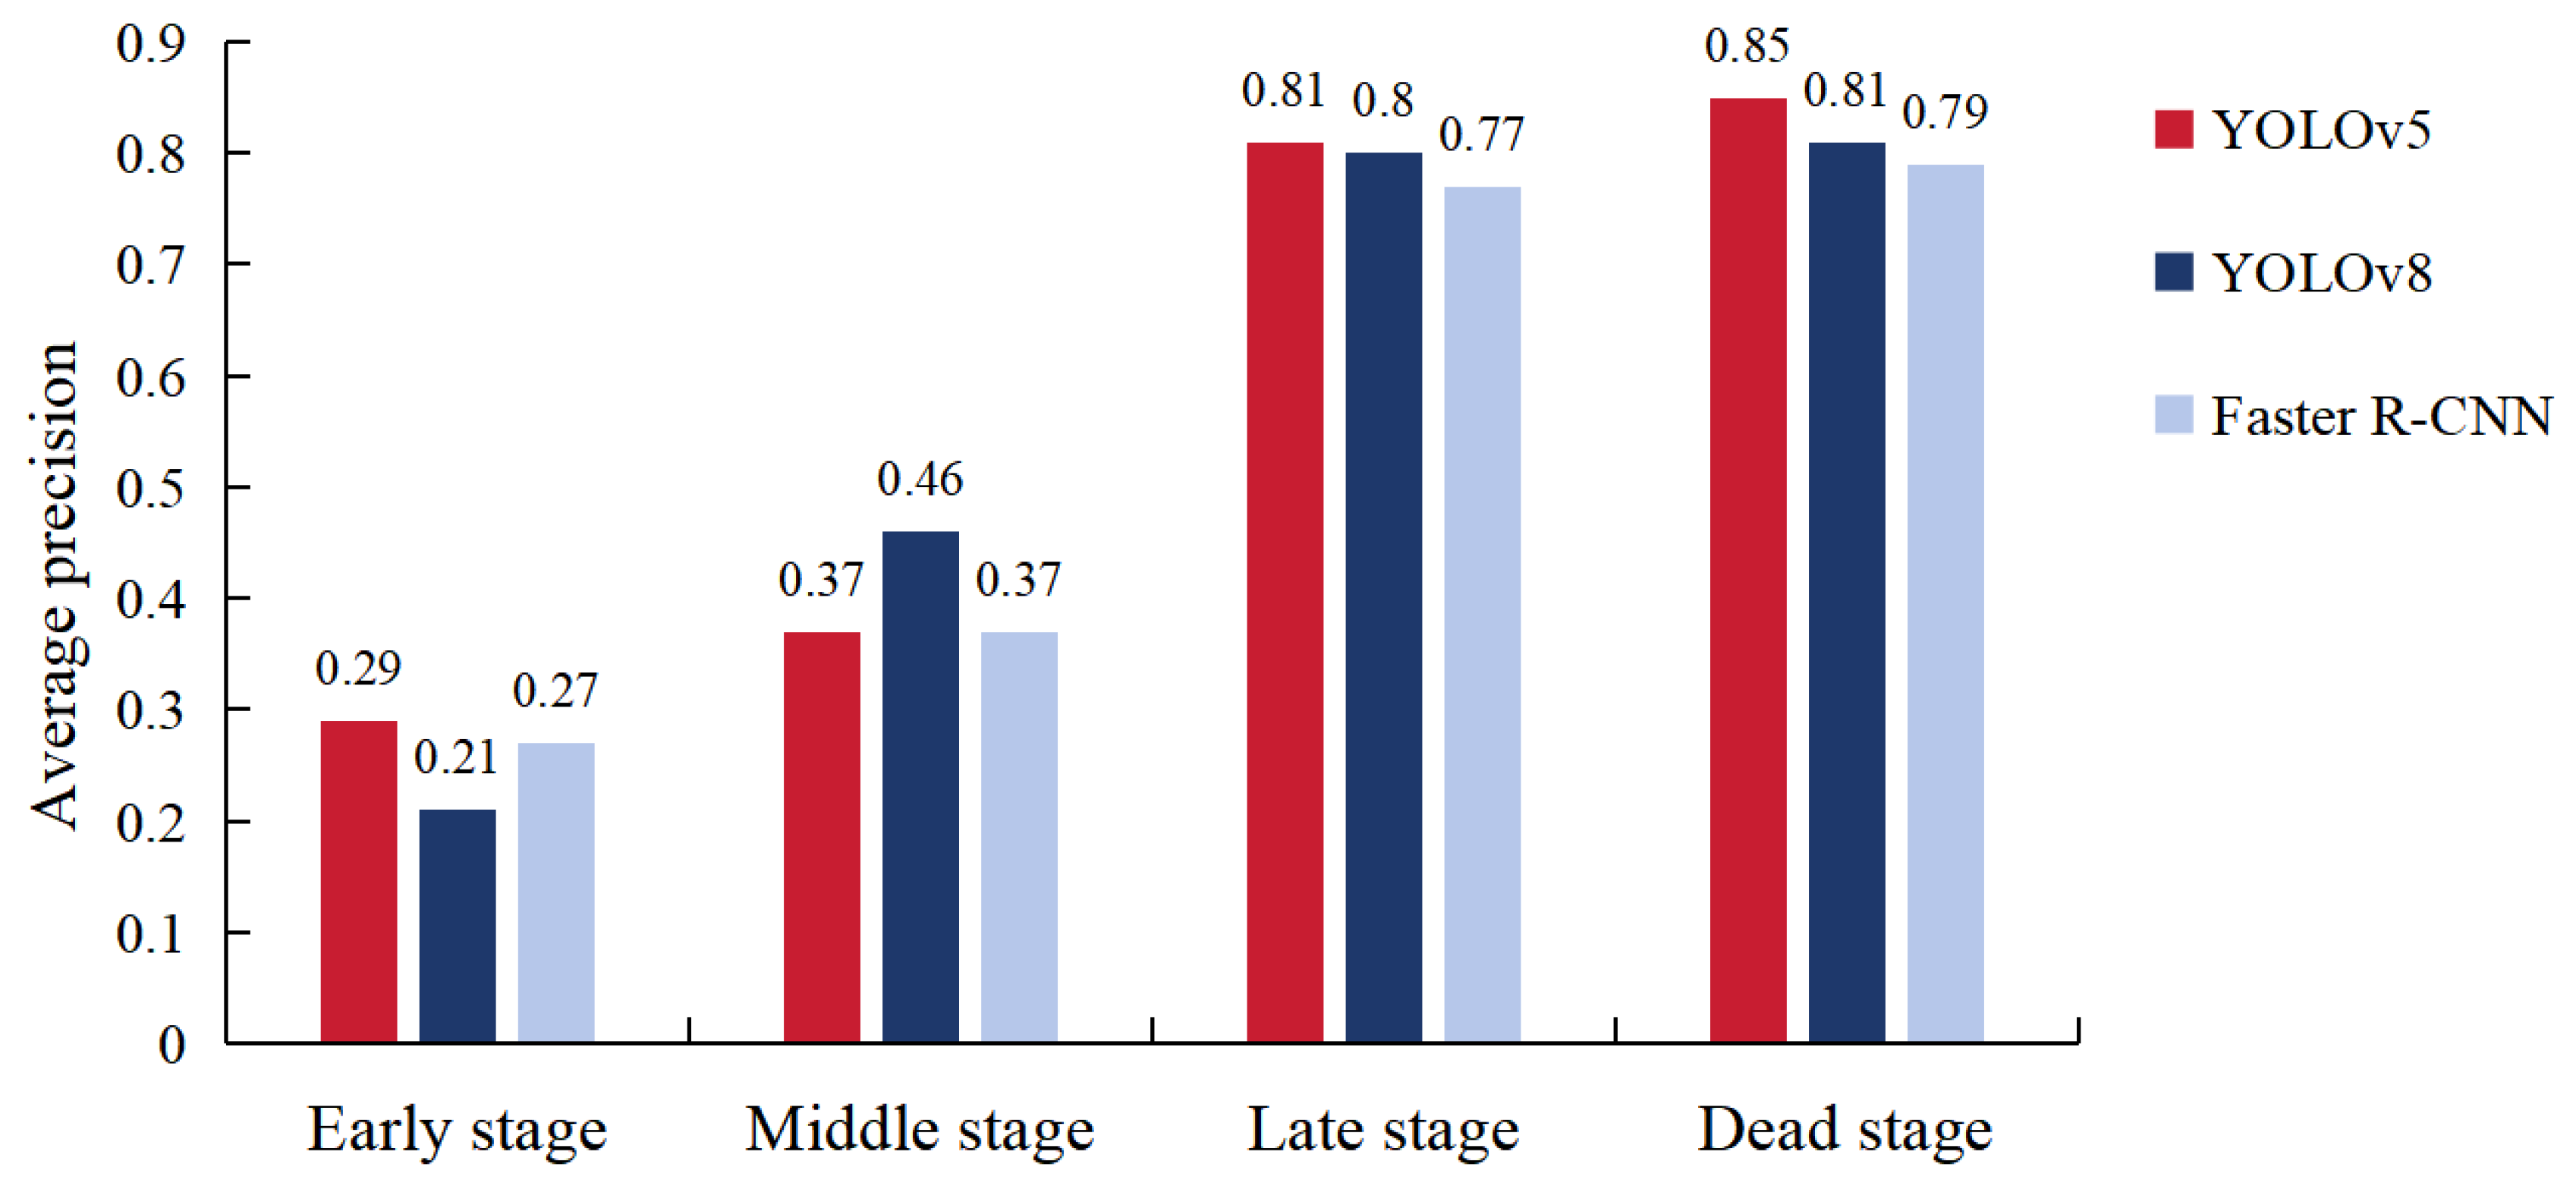
3.2. Accuracy of Tree Infection Stage Prediction with Deep Learning

The quantitative accuracy assessment results of the three different deep learning models are shown in Table 4. The Params of Faster R-CNN are greater than those of YOLOv5 and YOLOv8, and both its training and testing times are the longest. Compared to Faster R-CNN, YOLOv8 obtained better accuracy for the values of P, R, F1, and mAP. Moreover, the training time efficiency of YOLO v8 was much higher than that of Faster R-CNN. YOLOv5 demonstrated the best performance in tree infection stage prediction, reaching 0.68, 0.59, 0.63, and 0.58 for P, R, F1, and mAP, respectively. To further compare the detection accuracy of three deep learning models, the average precision values for the different stages of tree infection are shown in Figure 7. Among the three target detection algorithms, YOLOv5 demonstrated the best results, with average precision values of 0.29, 0.37, 0.81, and 0.85 for the four stages, respectively. YOLOv8 has the highest prediction accuracy in the middle stage, reaching the lowest value when detecting the early stage. Overall, all models showed good performance in the prediction of the late and dead stages (>0.77), while a relatively low level of accuracy (<0.50) was obtained for the detection of infected trees in the early and middle stages.

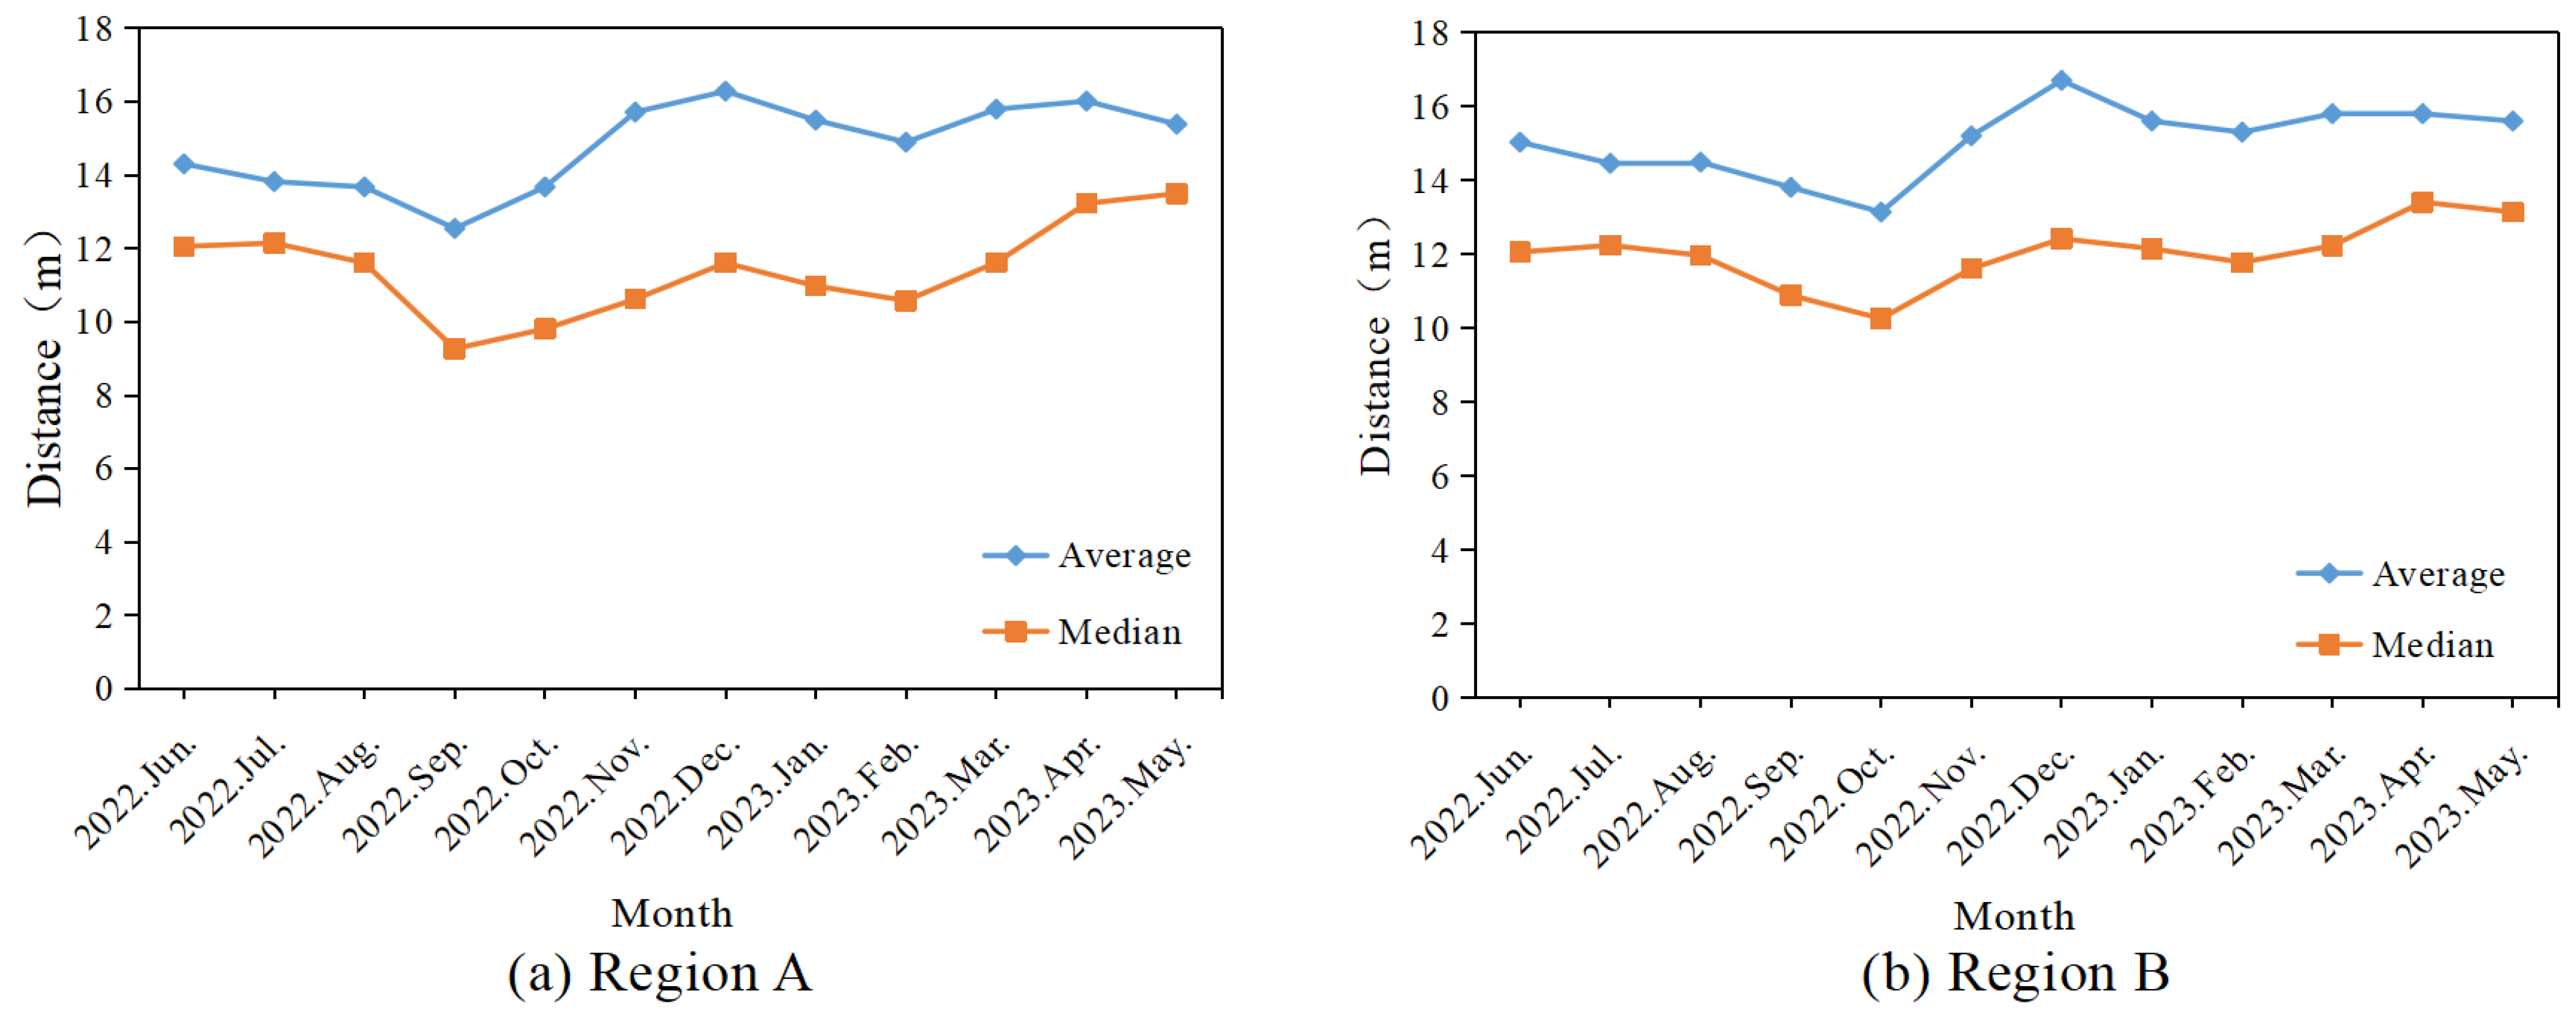
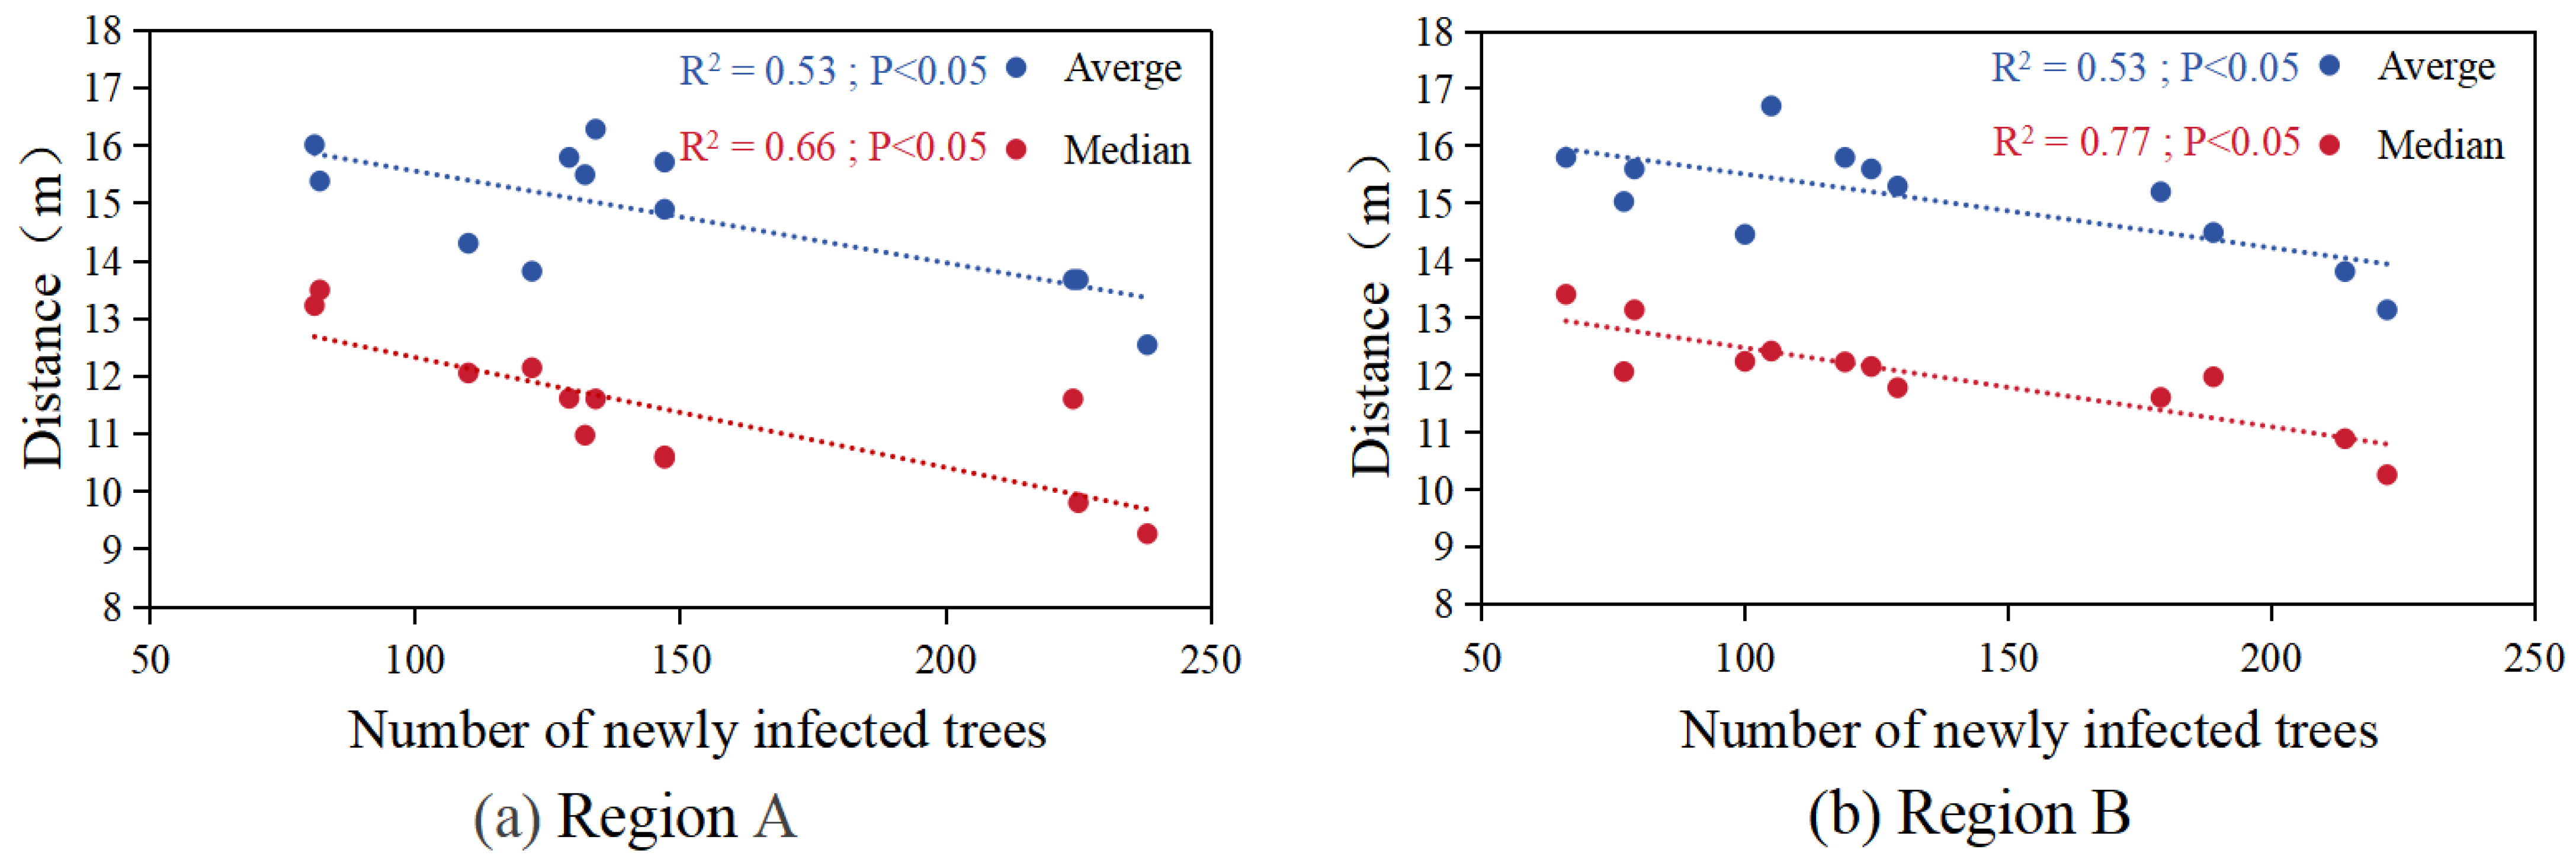
3.3. Trends in the Number of Newly Infected Trees and Spread Distance at the Monthly Level

A comparison between YOLOv5 and manual corrections in the performance of PWD detection was showed in Table 5. For both the early and middle stage, the number of infected trees was overestimated by YOLOv5 detection for two regions. However, the detection results of late and dead stages between YOLOv5 and manual corrections was closed. Meanwhile, it was found that YOLOv5 overestimates the monitoring results for early and middle stages in most months (especially for July to October), while the detection results for late and dead tree stages are relatively close (Figure 8).
From the time series, after manual corrections, the change in the total number of all new infected trees for the two regions showed a bimodal distribution. The first peak of PWD infection in region A, with a lower percentage (76.70%) of broadleaf trees, occurred one month later than in region B, which has a higher proportion (79.24%) of needleleaf trees, with the total number of newly infected trees being 238 and 222, respectively. The second peak of PWD infection for both region A and region B occurred in February. The lowest number of newly infected trees for all regions occurred in April, with 81 and 66 trees, respectively. In addition, we found that the outbreak of the early stage occurred in August, and the outbreak of the middle stage in region A (August) was one month earlier than in region B (September). Furthermore, the highest numbers of late- and dead-stage PWD-infected trees occurred in October and February of the next year, respectively.
Figure 9 shows the trend in monthly level time-series changes in the median and mean values of the spread distance between infected trees based on the detection results of manual correction. For both region A and region B, the spread distance showed a trend of first decreasing, then increasing, then decreasing, and then increasing from 2022 June to 2023 May. The nearest spread distance of infected trees for region A occurred in September, with mean and median values of 12.54 m and 9.27 m, respectively, while the nearest spread distance between infected trees for region B occurred in October, with mean and median values of 13.14 m and 10.26 m, respectively. In addition, the relationship between the spread distance of infected trees and the number of newly infected trees in the two regions over one year (Figure 10) showed a significant negative correlation (R2 > 0.51 and p value < 0.05).

4. Discussion

Using UAV RGB imagery, the performance of object-detection algorithms (YOLOv5, YOLOv8, and Faster R-CNN) has been shown to make a difference in detecting PWD infection at the canopy level. In terms of overall accuracy, it was observed that YOLOv5 surpassed the performance of both YOLOv8 and Faster R-CNN. Faster R-CNN is a two-stage object-detection algorithm that tends to miss some targets or generate excessive unnecessary candidate boxes in complex forest scenes, thereby impacting its final detection performance. Additionally, the backbone network based on ResNet-50 leads to a deeper structure and a larger number of parameters, increasing the model’s complexity and computation cost (Table 4), resulting in slower convergence. YOLOv5 adopts a single-stage and end-to-end detection framework with a simplified and efficient network structure, offering advantages in detecting PWD at the canopy level [50,51,52,53,54]. YOLOv8, which has a similar framework, adopts a more complex C2f structure, but its accuracy is slightly lower than YOLOv5 (Table 4 and Figure 7). These results indicate that lightweight networks were more effective in PWN detection.
The results of the three models all showed that the detection of late-stage (77–81%) and dead (79–85%) trees is more accurate than in the early stage (21–29%) and middle stage (37–46%). The late and dead stages had better identification accuracy due to the obvious differences (with visual symptoms) in the characteristics of infected tree crowns between the late and dead stages and other stages. Regarding the middle stage, infected trees with a mixture of green and red needles were easily misidentified as late-stage trees and healthy trees, resulting in a lower detection accuracy [55]. The lowest accuracy in the early stage was obtained due to the similar spectral characteristics of infected tree crowns and healthy tree crowns, which has been demonstrated by previous studies [54,56]. In addition, topographic relief causes differences in the spatial resolution of tree crowns across the entire scene, resulting in uncertainty in the model’s extraction of tree crown features at different stages, which will affect the accuracy of PWD detection. It is worth noting that different seasons and weather conditions can cause significant differences in the brightness of tree canopy images at the same stage, leading to misjudgments and omissions. Therefore, strict weather control and image brightness correction need to be considered in future research.
Increasing spectral band information is expected to improve detection accuracy for the early and middle stages. Leaf biochemical contents (e.g., chlorophyll and water contents) in the early and middle stages exhibit significant differences compared to leaf biochemical contents in later stages, with distinct variations observed in the red region, red edge positions (REPs), and the short-wave infrared region (SWIR) spectral bands [31,56]. In particular, REPs and the SWIR were important sensitive bands to distinguish healthy trees from trees in the early stage of PWD infection [56]. Therefore, UAV hyperspectral imagery with over a hundred narrow bands has more potential for early and accurate detection than RGB and multispectral data [55,56,57,58,59]. In addition, specific network structures need to be optimized to improve detection accuracy based on the characteristics of infected trees [52,60,61,62,63]. In future studies, a combination of hyperspectral data and an optimized network structure would be considered for detecting the different stages of PWD infection.
In this study, we first culled broadleaf trees and other features to ensure the accuracy of the detection and to minimize the interference caused by non-pine-tree image features. In most previous studies, the exclusion of other features was not carried out, which may reduce accuracy during the detection process, as many previous studies have shown [10,52]. Broadleaf trees, bare ground, and other factors were misclassified, resulting in reduced accuracy, which was somewhat improved after masking [39].
The trend in the number of newly infected trees over one year for the mixed forests was evaluated. The results showed that there were two outbreak periods (September and February of the following year) in one year for the total number of newly infected trees. There are two main reasons for the outbreaks of PWD: (1) August is the period for outbreaks in early- and mid-stage trees (Figure 6), which explains the outbreaks of infected trees in the later stage between September and October; and (2) a substantial surge in the number of deceased trees observed in the following February was attributed to the accumulation of infected trees, with an approximate six-month interval between the early stage and the dead-stage of PWD infection (Figure 11). Furthermore, August is a critical period for the early detection of PWD, and a study by Wu et al. (2023) showed similar conclusions [64]. It should be noted that the outbreak time of PWD is closely related to the lifecycle of the insect vector (in this study area, it is Monochamus alternatus) [65]. The first-generation emergence period of Monochamus alternatus occurred from July to August, and the second-generation emergence period occurred from February to April. During this period, infected insect vectors carrying PWN feed on pine trees, causing the tree to become infected and eventually die. Therefore, the large-scale reproduction of vector insects will cause the outbreak of PWD. In addition, climate has been found to play a crucial role in the development of PWN [65]. The initial outbreak period exhibited a higher incidence compared to the subsequent outbreak phase, primarily attributable to more favorable temperature and humidity conditions for the proliferation of vector insects occurring between July and August.
The time series trends in the spread distance of PWD for the two regions exhibited a general consistency. Notably, the spread distance of the PWD pathogen was found to be primarily influenced by tree age and tree species composition, as highlighted in previous studies [66,67]. The vector insects tend to feed on the weak growth ability of young and old trees. When an infected tree is in the late stage, there is a high probability that the infection will spread to nearby pine trees. Therefore, the spread speed in forest areas with a high density of pine trees would be faster than in forests dominated by broadleaf tree species. In the study region, needleleaf trees were of middle and mature age, and it is worth mentioning that some studies have indicated that the risk of infection in mature stands is significantly higher when compared to younger and middle-aged stands [68,69]. Compared to region B (17.51%), region A (20.49%) has a higher proportion of needleleaf trees, resulting in an outbreak of PWD that occurred one month earlier. In addition, terrain (especially for a sunny slope) and monsoon (the direction of the wind) can also affect the migration direction and speed of vector insects, thereby altering the spread distance of PWD [50]. In the future, a comprehensive analysis of the various factors driving PWD outbreaks characterized by different climatic conditions, tree age structure, and tree species composition will be evaluated.

5. Conclusions

This study demonstrates the effectiveness of object-detection models (Faster R-CNN, YOLOv5, and YOLOv8) in detecting the PWD infection stage and spread distance using the monthly level UAV imagery. Notably, the models exhibited significantly higher detection accuracy in the late and dead stages (AP > 0.77) compared to the early and middle stages (AP < 0.50). Our results show that early-stage outbreaks occur in August and late-stage outbreaks manifest in September and October. Furthermore, a higher proportion of broad-leaved trees in the forest can help inhibit the speed and spread distance of PWD infection. In the future, the advanced hyperspectral and lidar data will be considered to improve the detection accuracy of the early stage and deepen the understanding of the mechanisms governing the spread of PWD infection.

Author Contributions

Writing—original draft, data curation, methodology, software, validation, visualization, C.T.; writing—review and editing, conceptualization, funding acquisition, supervision, project administration, Q.L.; writing—review and editing, data curation, H.D.; data curation, C.C.; data curation, M.H.; data curation, J.C.; data curation, Z.H.; data curation, Y.X. All authors have read and agreed to the published version of the manuscript.

Funding

This work was supported by the National Natural Science Foundation of China (32301586), Natural Science Foundation of Zhejiang province (LQ22C160006), Research Development Fund of Zhejiang A & F University (2020FR087), National Natural Science Foundation (32171785), and the Leading Goose Project of Science Technology Department of Zhejiang Province (2023C02035).

Data Availability Statement

The data presented in this study are available in article.

Acknowledgments

We are grateful for the support of the forestry management department in Lin’an District.

Conflicts of Interest

The authors declare no conflict of interest.

References

  1. Wang, W.; Zhu, Q.; He, G.; Liu, X.; Peng, W.; Cai, Y. Impacts of climate change on pine wilt disease outbreaks and associated carbon stock losses. Agric. For. Meteorol. 2023, 334, 109426. [Google Scholar] [CrossRef]
  2. Ye, W.; Lao, J.; Liu, Y.; Chang, C.-C.; Zhang, Z.; Li, H.; Zhou, H. Pine pest detection using remote sensing satellite images combined with a multi-scale attention-UNet model. Ecol. Inform. 2022, 72, 101906. [Google Scholar] [CrossRef]
  3. Kim, B.-N.; Kim, J.H.; Ahn, J.-Y.; Kim, S.; Cho, B.-K.; Kim, Y.-H.; Min, J. A short review of the pinewood nematode, Bursaphelenchus xylophilus. Toxicol. Environ. Health Sci. 2020, 12, 297–304. [Google Scholar] [CrossRef]
  4. Ye, J. Epidemic status of pine wilt disease in China and its prevention and control techniques and counter measures. Sci. Silvae Sin. 2019, 55, 1–10. [Google Scholar]
  5. Hirata, A.; Nakamura, K.; Nakao, K.; Kominami, Y.; Tanaka, N.; Ohashi, H.; Takano, K.T.; Takeuchi, W.; Matsui, T. Potential distribution of pine wilt disease under future climate change scenarios. PLoS ONE 2017, 12, e0182837. [Google Scholar] [CrossRef] [PubMed]
  6. Li, J.; Wang, X.; Zhao, H.; Hu, X.; Zhong, Y. Detecting pine wilt disease at the pixel level from high spatial and spectral resolution UAV-borne imagery in complex forest landscapes using deep one-class classification. Int. J. Appl. Earth Obs. Geoinf. 2022, 112, 102947. [Google Scholar] [CrossRef]
  7. Zhu, X.; Wang, R.; Shi, W.; Yu, Q.; Li, X.; Chen, X. Automatic Detection and Classification of Dead Nematode-Infested Pine Wood in Stages Based on YOLO v4 and GoogLeNet. Forests 2023, 14, 601. [Google Scholar] [CrossRef]
  8. Hao, Z.; Huang, J.; Li, X.; Sun, H.; Fang, G. A multi-point aggregation trend of the outbreak of pine wilt disease in China over the past 20 years. For. Ecol. Manag. 2022, 505, 119890. [Google Scholar] [CrossRef]
  9. Chen, Y.; Zhou, Y.; Song, H.; Wang, Y.; Xu, Z.; LI, X. National Occurrence of Major Forestry Pests in 2022 and Trend Forecast in 2023. For. Pest Dis. 2023, 42, 51–54. [Google Scholar] [CrossRef]
  10. Oide, A.H.; Nagasaka, Y.; Tanaka, K. Performance of machine learning algorithms for detecting pine wilt disease infection using visible color imagery by UAV remote sensing. Remote Sens. Appl. Soc. Environ. 2022, 28, 100869. [Google Scholar] [CrossRef]
  11. Li, M.; Li, H.; Ding, X.; Wang, L.; Wang, X.; Chen, F. The Detection of Pine Wilt Disease: A Literature Review. Int. J. Mol. Sci. 2022, 23, 10797. [Google Scholar] [CrossRef]
  12. Duarte, A.; Borralho, N.; Cabral, P.; Caetano, M. Recent Advances in Forest Insect Pests and Diseases Monitoring Using UAV-Based Data: A Systematic Review. Forests 2022, 13, 911. [Google Scholar] [CrossRef]
  13. Meng, R.; Dennison, P.E.; Zhao, F.; Shendryk, I.; Rickert, A.; Hanavan, R.P.; Cook, B.D.; Serbin, S.P. Mapping canopy defoliation by herbivorous insects at the individual tree level using bi-temporal airborne imaging spectroscopy and LiDAR measurements. Remote Sens. Environ. 2018, 215, 170–183. [Google Scholar] [CrossRef]
  14. Onojeghuo, A.O.; Onojeghuo, A.R. Object-based habitat mapping using very high spatial resolution multispectral and hyperspectral imagery with LiDAR data. Int. J. Appl. Earth Obs. Geoinf. 2017, 59, 79–91. [Google Scholar] [CrossRef]
  15. Qin, H.; Zhou, W.; Yao, Y.; Wang, W. Individual tree segmentation and tree species classification in subtropical broadleaf forests using UAV-based LiDAR, hyperspectral, and ultrahigh-resolution RGB data. Remote Sens. Environ. 2022, 280, 113143. [Google Scholar] [CrossRef]
  16. Chen, L.; Wu, J.; Xie, Y.; Chen, E.; Zhang, X. Discriminative feature constraints via supervised contrastive learning for few-shot forest tree species classification using airborne hyperspectral images. Remote Sens. Environ. 2023, 295, 113710. [Google Scholar] [CrossRef]
  17. Watt, M.S.; Poblete, T.; de Silva, D.; Estarija, H.J.C.; Hartley, R.J.L.; Leonardo, E.M.C.; Massam, P.; Buddenbaum, H.; Zarco-Tejada, P.J. Prediction of the severity of Dothistroma needle blight in radiata pine using plant based traits and narrow band indices derived from UAV hyperspectral imagery. Agric. For. Meteorol. 2023, 330, 109294. [Google Scholar] [CrossRef]
  18. Zhao, X.; Qi, J.; Xu, H.; Yu, Z.; Yuan, L.; Chen, Y.; Huang, H. Evaluating the potential of airborne hyperspectral LiDAR for assessing forest insects and diseases with 3D Radiative Transfer Modeling. Remote Sens. Environ. 2023, 297, 113759. [Google Scholar] [CrossRef]
  19. Kuswidiyanto, L.W.; Wang, P.; Noh, H.-H.; Jung, H.-Y.; Jung, D.-H.; Han, X. Airborne hyperspectral imaging for early diagnosis of kimchi cabbage downy mildew using 3D-ResNet and leaf segmentation. Comput. Electron. Agric. 2023, 214, 108312. [Google Scholar] [CrossRef]
  20. Smigaj, M.; Gaulton, R.; Suárez, J.C.; Barr, S.L. Combined use of spectral and structural characteristics for improved red band needle blight detection in pine plantation stands. For. Ecol. Manag. 2019, 434, 213–223. [Google Scholar] [CrossRef]
  21. Meng, R.; Gao, R.; Zhao, F.; Huang, C.; Sun, R.; Lv, Z.; Huang, Z. Landsat-based monitoring of southern pine beetle infestation severity and severity change in a temperate mixed forest. Remote Sens. Environ. 2022, 269, 112847. [Google Scholar] [CrossRef]
  22. Reid, A.M.; Chapman, W.K.; Prescott, C.E.; Nijland, W. Using excess greenness and green chromatic coordinate colour indices from aerial images to assess lodgepole pine vigour, mortality and disease occurrence. For. Ecol. Manag. 2016, 374, 146–153. [Google Scholar] [CrossRef]
  23. Cozzolino, D.; Williams, P.J.; Hoffman, L.C. An overview of pre-processing methods available for hyperspectral imaging applications. Microchem. J. 2023, 193, 109129. [Google Scholar] [CrossRef]
  24. Jaiswal, G.; Rani, R.; Mangotra, H.; Sharma, A. Integration of hyperspectral imaging and autoencoders: Benefits, applications, hyperparameter tunning and challenges. Comput. Sci. Rev. 2023, 50, 100584. [Google Scholar] [CrossRef]
  25. Diao, Z.; Guo, P.; Zhang, B.; Yan, J.; He, Z.; Zhao, S.; Zhao, C.; Zhang, J. Spatial-spectral attention-enhanced Res-3D-OctConv for corn and weed identification utilizing hyperspectral imaging and deep learning. Comput. Electron. Agric. 2023, 212, 108092. [Google Scholar] [CrossRef]
  26. Vastaranta, M.; Kantola, T.; Lyytikäinen-Saarenmaa, P.; Holopainen, M.; Kankare, V.; Wulder, M.A.; Hyyppä, J.; Hyyppä, H. Area-Based Mapping of Defoliation of Scots Pine Stands Using Airborne Scanning LiDAR. Remote Sens. 2013, 5, 1220–1234. [Google Scholar] [CrossRef]
  27. Dalagnol, R.; Phillips, O.L.; Gloor, E.; Galvão, L.S.; Wagner, F.H.; Locks, C.J.; Aragão, L.E.O.C. Quantifying Canopy Tree Loss and Gap Recovery in Tropical Forests under Low-Intensity Logging Using VHR Satellite Imagery and Airborne LiDAR. Remote Sens. 2019, 11, 817. [Google Scholar] [CrossRef]
  28. Huo, L.; Zhang, X. A new method of equiangular sectorial voxelization of single-scan terrestrial laser scanning data and its applications in forest defoliation estimation. ISPRS J. Photogramm. Remote Sens. 2019, 151, 302–312. [Google Scholar] [CrossRef]
  29. Bright, B.C.; Hudak, A.T.; McGaughey, R.; Andersen, H.-E.; Negrón, J. Predicting live and dead tree basal area of bark beetle affected forests from discrete-return lidar. Can. J. Remote Sens. 2013, 39, S99–S111. [Google Scholar] [CrossRef]
  30. Bright, B.C.; Hudak, A.T.; Kennedy, R.E.; Meddens, A.J. Landsat time series and lidar as predictors of live and dead basal area across five bark beetle-affected forests. IEEE J. Sel. Top. Appl. Earth Obs. Remote Sens. 2014, 7, 3440–3452. [Google Scholar] [CrossRef]
  31. Yu, R.; Luo, Y.; Zhou, Q.; Zhang, X.; Wu, D.; Ren, L. A machine learning algorithm to detect pine wilt disease using UAV-based hyperspectral imagery and LiDAR data at the tree level. Int. J. Appl. Earth Obs. Geoinf. 2021, 101, 102363. [Google Scholar] [CrossRef]
  32. Liu, B.; Yu, X.C.; Yu, A.Z.; Zhang, P.Q.; Wan, G. Spectral-spatial classification of hyperspectral imagery based on recurrent neural networks. Remote Sens. Lett. 2018, 9, 1118–1127. [Google Scholar] [CrossRef]
  33. Park, H.L.; Park, W.Y.; Park, H.C.; Choi, S.K.; Choi, J.W.; Im, H.R. Dimensionality Reduction Methods Analysis of Hyperspectral Imagery for Unsupervised Change Detection of Multi-sensor Images. J. Korean Assoc. Geogr. Inf. Stud. 2019, 22, 1–11. [Google Scholar] [CrossRef]
  34. Lee, K.W.; Park, J.K. Comparison of UAV Image and UAV LiDAR for Construction of 3D Geospatial Information. Sens. Mater. 2019, 31, 3327–3334. [Google Scholar] [CrossRef]
  35. Fu, B.; He, X.; Yao, H.; Liang, Y.; Deng, T.; He, H.; Fan, D.; Lan, G.; He, W. Comparison of RFE-DL and stacking ensemble learning algorithms for classifying mangrove species on UAV multispectral images. Int. J. Appl. Earth Obs. Geoinf. 2022, 112, 102890. [Google Scholar] [CrossRef]
  36. Osco, L.P.; Arruda, M.d.S.d.; Marcato Junior, J.; da Silva, N.B.; Ramos, A.P.M.; Moryia, É.A.S.; Imai, N.N.; Pereira, D.R.; Creste, J.E.; Matsubara, E.T.; et al. A convolutional neural network approach for counting and geolocating citrus-trees in UAV multispectral imagery. ISPRS J. Photogramm. Remote Sens. 2020, 160, 97–106. [Google Scholar] [CrossRef]
  37. Eon-taek, L.; Do, M. Pine Wilt Disease Detection Based on Deep Learning Using an Unmanned Aerial Vehicle. KSCE J. Civ. Environ. Eng. Res. 2021, 41, 317–325. [Google Scholar] [CrossRef]
  38. Zhangruirui, Z.; Youjie, Y.; Kim, B.; Sun, J.; Lee, J. Searching the Damaged Pine Trees from Wilt Disease Based on Deep Learning. Smart Media J. 2020, 9, 46–51. [Google Scholar] [CrossRef]
  39. Yu, R.; Luo, Y.; Zhou, Q.; Zhang, X.; Wu, D.; Ren, L. Early detection of pine wilt disease using deep learning algorithms and UAV-based multispectral imagery. For. Ecol. Manag. 2021, 497, 119493. [Google Scholar] [CrossRef]
  40. Qin, J.; Wang, B.; Wu, Y.; Lu, Q.; Zhu, H. Identifying Pine Wood Nematode Disease Using UAV Images and Deep Learning Algorithms. Remote Sens. 2021, 13, 162. [Google Scholar] [CrossRef]
  41. Zhang, P.; Wang, Z.; Rao, Y.; Zheng, J.; Zhang, N.; Wang, D.; Zhu, J.; Fang, Y.; Gao, X. Identification of Pine Wilt Disease Infected Wood Using UAV RGB Imagery and Improved YOLOv5 Models Integrated with Attention Mechanisms. Forests 2023, 14, 588. [Google Scholar] [CrossRef]
  42. Qin, B.; Sun, F.; Shen, W.; Dong, B.; Ma, S.; Huo, X.; Lan, P. Deep Learning-Based Pine Nematode Trees&rsquo; Identification Using Multispectral and Visible UAV Imagery. Drones 2023, 7, 183. [Google Scholar] [CrossRef]
  43. Deng, X.; Tong, Z.; Lan, Y.; Huang, Z. Detection and Location of Dead Trees with Pine Wilt Disease Based on Deep Learning and UAV Remote Sensing. AgriEngineering 2020, 2, 294–307. [Google Scholar] [CrossRef]
  44. Zhang, S.; Huang, H.; Huang, Y.; Cheng, D.; Huang, J. A GA and SVM Classification Model for Pine Wilt Disease Detection Using UAV-Based Hyperspectral Imagery. Appl. Sci. 2022, 12, 6676. [Google Scholar] [CrossRef]
  45. Lee, S.; Park, S.; Baek, G.; Kim, H.; Wook, L.C. Detection of Damaged Pine Tree by the Pine Wilt Disease Using UAV Image. Korean J. Remote Sens. 2019, 35, 359–373. [Google Scholar] [CrossRef]
  46. Zhou, Y.; Liu, W.; Bi, H.; Chen, R.; Zong, S.; Luo, Y. A Detection Method for Individual Infected Pine Trees with Pine Wilt Disease Based on Deep Learning. Forests 2022, 13, 1880. [Google Scholar] [CrossRef]
  47. Li, N.; Huo, L.; Zhang, X. Classification of pine wilt disease at different infection stages by diagnostic hyperspectral bands. Ecol. Indic. 2022, 142, 109198. [Google Scholar] [CrossRef]
  48. Ren, S.; He, K.; Girshick, R.; Sun, J. Faster R-CNN: Towards Real-Time Object Detection with Region Proposal Networks. IEEE Trans. Pattern Anal. Mach. Intell. 2017, 39, 1137–1149. [Google Scholar] [CrossRef] [PubMed]
  49. Qi, D.; Tan, W.; Yao, Q.; Liu, J. YOLO5Face: Why Reinventing a Face Detector. In Proceedings of the European Conference on Computer Vision, Virtual, 11–17 October 2021. [Google Scholar]
  50. Zhou, Z.M.; Yang, X.T. Pine wilt disease detection in UAV-CAPTURED images. Int. J. Robot. Autom. 2022, 37, 37–43. [Google Scholar] [CrossRef]
  51. Chen, Y.; Yan, E.; Jiang, J.; Zhang, G.; Mo, D. An efficient approach to monitoring pine wilt disease severity based on random sampling plots and UAV imagery. Ecol. Indic. 2023, 156, 111215. [Google Scholar] [CrossRef]
  52. Hu, G.; Yao, P.; Wan, M.; Bao, W.; Zeng, W. Detection and classification of diseased pine trees with different levels of severity from UAV remote sensing images. Ecol. Inform. 2022, 72, 101844. [Google Scholar] [CrossRef]
  53. Sun, Z.; Ibrayim, M.; Hamdulla, A. Detection of Pine Wilt Nematode from Drone Images Using UAV. Sensors 2022, 22, 4704. [Google Scholar] [CrossRef]
  54. Wang, G.; Zhao, H.; Chang, Q.; Lyu, S.; Liu, B.; Wang, C.; Feng, W. Detection Method of Infected Wood on Digital Orthophoto Map&ndash;Digital Surface Model Fusion Network. Remote Sens. 2023, 15, 4295. [Google Scholar]
  55. Yu, R.; Luo, Y.; Li, H.; Yang, L.; Huang, H.; Yu, L.; Ren, L. Three-Dimensional Convolutional Neural Network Model for Early Detection of Pine Wilt Disease Using UAV-Based Hyperspectral Images. Remote Sens. 2021, 13, 4065. [Google Scholar] [CrossRef]
  56. Wu, B.; Liang, A.; Zhang, H.; Zhu, T.; Zou, Z.; Yang, D.; Tang, W.; Li, J.; Su, J. Application of conventional UAV-based high-throughput object detection to the early diagnosis of pine wilt disease by deep learning. For. Ecol. Manag. 2021, 486, 118986. [Google Scholar] [CrossRef]
  57. Yu, R.; Ren, L.; Luo, Y. Early detection of pine wilt disease in Pinus tabuliformis in North China using a field portable spectrometer and UAV-based hyperspectral imagery. For. Ecosyst. 2021, 8, 44. [Google Scholar] [CrossRef]
  58. Ni, A.; Yang, D.; Cheng, H.; Ye, J. Preliminary Study on Early Diagnosis and Rehabilitation Treatment of Pine Wood Nematode Disease Based on Partial Symptoms. Forests 2023, 14, 657. [Google Scholar] [CrossRef]
  59. Liu, F.; Zhang, M.; Hu, J.; Pan, M.; Shen, L.; Ye, J.; Tan, J. Early Diagnosis of Pine Wilt Disease in Pinus thunbergii Based on Chlorophyll Fluorescence Parameters. Forests 2023, 14, 154. [Google Scholar] [CrossRef]
  60. Huang, J.; Lu, X.; Chen, L.; Sun, H.; Wang, S.; Fang, G. Accurate Identification of Pine Wood Nematode Disease with a Deep Convolution Neural Network. Remote Sens. 2022, 14, 913. [Google Scholar] [CrossRef]
  61. Liming, H.; Yixiang, W.; Qi, X.; Qinghua, L. Recognition of abnormally discolored trees caused by pine wilt disease using YOLO algorithm and UAV images. Trans. Chin. Soc. Agric. Eng. 2021, 37, 197–203. [Google Scholar]
  62. Kim, S.H.; Wook, K.K.; Hyun, K.J. A Study on Orthogonal Image Detection Precision Improvement Using Data of Dead Pine Trees Extracted by Period Based on U-Net model. J. Korean Soc. Surv. Geod. Photogramm. Cartogr. 2022, 40, 251–260. [Google Scholar]
  63. Kim, S.H.; Wook, K.K. Orthophoto Imagery Comparison Analysis of U-NET Model and Mask R-CNN Model for Pine Wilt Disease Detection. J. Korean Soc. Cadastre 2022, 38, 53–62. [Google Scholar]
  64. Wu, D.; Yu, L.; Yu, R.; Zhou, Q.; Li, J.; Zhang, X.; Ren, L.; Luo, Y. Detection of the Monitoring Window for Pine Wilt Disease Using Multi-Temporal UAV-Based Multispectral Imagery and Machine Learning Algorithms. Remote Sens. 2023, 15, 444. [Google Scholar] [CrossRef]
  65. Jung, J.-M.; Yoon, S.; Hwang, J.; Park, Y.; Lee, W.-H. Analysis of the spread distance of pine wilt disease based on a high volume of spatiotemporal data recording of infected trees. For. Ecol. Manag. 2024, 553, 121612. [Google Scholar] [CrossRef]
  66. Han, X.; Li, Y.; Huang, W.; Wang, R.; Hu, X.; Liang, G.; Huang, S.; Lian, C.; Zhang, F.; Wu, S. Landscapes drive the dispersal of Monochamus alternatus, vector of the pinewood nematode, revealed by whole-genome resequencing. For. Ecol. Manag. 2023, 529, 120682. [Google Scholar] [CrossRef]
  67. Cheng, Y.; Liang, J.; Xie, X.; Zhang, X. Effect of Plant Diversity on the Occurrence of Diplodia Tip Blight in Natural Secondary Japanese Red Pine Forests. Forests 2021, 12, 1083. [Google Scholar] [CrossRef]
  68. Park, Y.-S.; Chung, Y.-J.; Moon, Y.-S. Hazard ratings of pine forests to a pine wilt disease at two spatial scales (individual trees and stands) using self-organizing map and random forest. Ecol. Inform. 2013, 13, 40–46. [Google Scholar] [CrossRef]
  69. Setiawan, N.N.; Vanhellemont, M.; Baeten, L.; Dillen, M.; Verheyen, K. The effects of local neighbourhood diversity on pest and disease damage of trees in a young experimental forest. For. Ecol. Manag. 2014, 334, 1–9. [Google Scholar] [CrossRef]
Figure 1. Study area location and field plots.
Remotesensing 16 00364 g001
Figure 2. UAV-based imagery was collected between May 2022 and May 2023.
Remotesensing 16 00364 g002
Figure 3. Diagram showing examples of different stages of PWD infection.
Remotesensing 16 00364 g003
Figure 4. The workflow used in this study.
Remotesensing 16 00364 g004
Figure 5. A spatial spread network of PWD infection.
Remotesensing 16 00364 g005
Figure 6. Classification maps for the two regions.
Remotesensing 16 00364 g006
Figure 7. The average precision of different infection stages using three deep learning models.
Remotesensing 16 00364 g007
Figure 8. Time series trends in the number of newly infected trees at different stages of PWD infection.
Remotesensing 16 00364 g008
Figure 9. Time series trends in the spread distance of PWD infection in the two regions.
Remotesensing 16 00364 g009
Figure 10. Relationship between the number of new PWD infections and spread distance in the two regions.
Remotesensing 16 00364 g010
Figure 11. The process of a tree from health to death from June 2022 to May 2023.
Remotesensing 16 00364 g011
Table 1. The general parameters of the DJI Mavic Air 2 and environmental settings.
ParametersValues
Weight0.57 kg
Pixels8000 × 6000
Aperturef/2.8
Flight altitude300 m
Flight speed9 m/s
Viewing angle−90°
Across-track overlap80%
Along-track overlap80%
Table 2. Overall accuracy and kappa coefficient values for two regions.
RegionRegion ARegion B
Overall Accuracy (OA)89.95%92.44%
Kappa Coefficient0.860.89
Table 3. Accuracy of land cover type classification for two regions.
Land Cover TypesPA (%)UA (%)CE (%)OE (%)
Region ARegion BRegion ARegion BRegion ARegion BRegion ARegion B
Bare ground91.3796.1992.4791.897.538.118.633.81
Water96.9999.4098.0599.711.950.293.010.60
Needleleaf trees86.9187.1485.7887.4814.2212.5213.0912.86
Broadleaf trees90.0691.3291.3995.168.614.849.948.68
Table 4. The detection results of three deep learning models.
ModelsYOLOv5YOLOv8Faster R-CNN
P0.680.640.63
R0.590.580.54
F10.630.610.58
mAP0.580.570.55
Params/M14.4622.04100.1
Training time/h6.627.8313.42
Testing time/s15.622.1177.7
Table 5. The detection results using YOLOv5 and manual corrections for each stage of PWD infection.
Land Cover TypesEarly StageMiddle StageLate StageDead Stage
Region ARegion BRegion ARegion BRegion ARegion BRegion ARegion B
YOLOv51023801761604789636631562
Manual labeling219275292274685554575500
Disclaimer/Publisher’s Note: The statements, opinions and data contained in all publications are solely those of the individual author(s) and contributor(s) and not of MDPI and/or the editor(s). MDPI and/or the editor(s) disclaim responsibility for any injury to people or property resulting from any ideas, methods, instructions or products referred to in the content.

