Article

Near-Complete Sampling of Forest Structure from High-Density Drone Lidar Demonstrated by Ray Tracing

1
Department of Ecology, Evolution and Organismal Biology, Brown University, Providence, RI 02912, USA
2
Institute at Brown for Environment and Society, Brown University, Providence, RI 02912, USA
3
Department of Forest Ecology, The Silva Tarouca Research Institute, 60200 Brno, Czech Republic
4
Environmental Sciences Division, Oak Ridge National Laboratory, Oak Ridge, TN 37830, USA
*
Author to whom correspondence should be addressed.
Remote Sens. 2024, 16(15), 2774; https://doi.org/10.3390/rs16152774
Submission received: 3 June 2024 / Revised: 14 July 2024 / Accepted: 19 July 2024 / Published: 29 July 2024
(This article belongs to the Section Forest Remote Sensing)

Abstract

:
Drone lidar has the potential to provide detailed measurements of vertical forest structure throughout large areas, but a systematic evaluation of unsampled forest structure in comparison to independent reference data has not been performed. Here, we used ray tracing on a high-resolution voxel grid to quantify sampling variation in a temperate mountain forest in the southwest Czech Republic. We decoupled the impact of pulse density and scan-angle range on the likelihood of generating a return using spatially and temporally coincident TLS data. We show three ways that a return can fail to be generated in the presence of vegetation: first, voxels could be searched without producing a return, even when vegetation is present; second, voxels could be shadowed (occluded) by other material in the beam path, preventing a pulse from searching a given voxel; and third, some voxels were unsearched because no pulse was fired in that direction. We found that all three types existed, and that the proportion of each of them varied with pulse density and scan-angle range throughout the canopy height profile. Across the entire data set, 98.1% of voxels known to contain vegetation from a combination of coincident drone lidar and TLS data were searched by high-density drone lidar, and 81.8% of voxels that were occupied by vegetation generated at least one return. By decoupling the impacts of pulse density and scan angle range, we found that sampling completeness was more sensitive to pulse density than to scan-angle range. There are important differences in the causes of sampling variation that change with pulse density, scan-angle range, and canopy height. Our findings demonstrate the value of ray tracing to quantifying sampling completeness in drone lidar.

1. Introduction

Forests are important terrestrial ecosystems covering 31% of the terrestrial land surface and accounting for 75% of terrestrial gross primary production [1,2,3]. Lidar observations of forests are essential for deriving key traits (e.g., leaf area index), depicting tree morphology, and monitoring spatiotemporal changes [4,5,6,7,8,9,10,11,12]. Detailed lidar observations can also serve as independent estimates to calibrate and validate global data products from spaceborne lidar and radar missions [13,14,15,16,17]. The application of lidar observations in these studies has advanced our understanding of the functioning of forest ecosystems and their roles in the carbon and water cycles under changing climates [18,19,20].
Terrestrial laser scanning (TLS), with its high point density, captures forest structure in great detail [21,22,23]. It is therefore promising for accurately estimating aboveground biomass based on structural metrics such as diameter at breast height (DBH), various crown dimensions, and wood volume on as fine a level as the individual tree [24,25,26,27,28,29]. Ground-based scanning tends to prevent laser pulses from reaching canopy tops, especially during leaf-on seasons in dense forests [15,30]. Multiple scans from different locations can reduce occlusion, but the data acquisition for large areas can be labor-intensive and time-consuming and requires careful planning [31]. Some regions may be inaccessible for acquiring extra scans, and scans may be influenced by wind effects [32]. Airborne laser scanning (ALS) generates more detailed measurements at upper canopies than at lower canopies [30,33], usually with much lower point density compared with TLS [34]. ALS observations or products are essential for scaling between field measurements and satellite data products [35,36,37]. Personal laser scanning (PLS), such as backpack and handheld laser scanning [38,39,40], has become popular due to its lower costs and greater mobility in comparison to TLS [41]. However, it is still used mostly within small areas, since large-area mapping with the system is labor-intensive, and most regions remain inaccessible. Mobile laser scanning (MLS), such as car-based systems or lidar onboard all-terrain vehicles [42], can map larger areas with less labor than PLS [43] but has limited applications in forests [39,44].
High-density drone lidar can produce point clouds with sampling densities that are orders of magnitude greater than traditional ALS [22,45,46,47,48,49] and can scan regions that are inaccessible on the ground [50,51]. Typical point densities for ALS, drone lidar, and TLS vary over about five orders of magnitude, with ALS sensors in the 1–100 points/m2 range, drone lidar in the 1000–10,000 points/m2 range, and TLS sensors producing point densities close to 10,000 points/m2. These numbers depend on flight altitude and scanner configuration [30,45,47,52,53]. Because sampling densities and scan-angle ranges are greater, drone lidar may be able to resolve understory structure that traditional ALS cannot. Overlapping flight lines from ALS or drones, analogous to multiple TLS scans from different locations, can significantly increase the observed canopy volume due to greater scan-angle ranges and pulse densities [6,45,49,52]. However, it remains unknown how scan-angle ranges and pulse densities interact to influence the sampling properties of lidar data from airborne sensors throughout the canopy height profile. Airborne sensors tend to acquire relatively few returns near the ground, but it remains unclear whether measurement characteristics can be modified to produce a more complete sample within the canopy volume. For example, footprint size and pulse energy have an influence on canopy penetration and the distribution of returns [54]. Scan-angle range can impact metrics of canopy and understory volume [55].
Ray tracing in voxel space, originally used for radiative transfer modeling in three dimensions [56,57,58,59,60], is widely used to analyze TLS data [61,62,63,64,65,66,67,68]. Several studies have applied ray tracing to ALS or drone lidar data [55,69,70,71]. Here we use the term to describe the process of tracing the trajectories of individual returns [49,52], which is different from the ray-tracing used to simulate the pulse energy transfer in DART or Helios++ [72,73,74]. When employed, ray-tracing tracks the path of each laser pulse as it travels through voxels [75]. A return is generated when a laser pulse is reflected by vegetation or other material. In forests, voxels that contain a return are known to be occupied by vegetation. However, voxels that do not contain a return may be unoccupied and therefore, no return can be generated, or they can be occupied but not detected. Voxels that are occupied and not detected can exist in a lidar data set for a variety of reasons: they can be unsearched by laser pulses, for example, because pulse density is insufficient, occluded due to the presence of other occupied voxels within the beam path, or searched but not detected. A voxel can be searched and not detected when a laser pulse passes through empty space within an occupied voxel, or not enough laser energy is reflected to be recognized as a discrete return by post-processing algorithms.
We define sampling completeness, p , as the number of detected voxels divided by the number of voxels that are occupied. Sampling completeness is a ratio between 0 and 1:
p = n d e t e c t e d n o c c u p i e d
Its complement, sampling incompleteness, is 1 p . Sampling incompleteness can be represented by different types of undetected voxels. Most existing studies have used detected voxels to evaluate sampling completeness or quantified occluded volume to investigate sampling incompleteness [49,52,64,76], and few studies have investigated the voxels that were unsearched by laser pulses [67]. However, occluded and unsearched voxels are not the only kind of voxels that do not trigger a return. Existing ALS or drone lidar studies that employ ray tracing do not provide a comprehensive understanding of how the proportions of various kinds of undetected voxels vary under different sampling conditions throughout the canopy height profile.
Here, we used ray tracing to quantify sampling completeness using data from high-density drone lidar in a temperate mountain forest in the southwest Czech Republic. By using ultra-high-density measurements collected under a wide scan-angle range, we generated simulated datasets using subsampling to evaluate the consequences of different pulse densities and scan-angle ranges on sampling completeness. We benchmarked understory-to-near-ground measurements from drone lidar using TLS data that were collected on the same day. Using a combination of drone lidar and TLS data provided a high-quality reference to assess the sampling completeness of drone lidar. A previous study demonstrated that the combination of TLS and drone lidar reduced occlusion to 2% in a temperate mixed beech forest and a tropical rainforest in Borneo [76].
The objectives of our study were to (1) investigate whether sampling completeness was more sensitive to pulse density than to scan-angle range; (2) quantify how different types of undetected voxels covaried with pulse density and scan-angle range; (3) quantify how sampling completeness varied from the canopy top to the ground; and (4) identify what kinds of undetected voxels were responsible for unsampled forest structure.

2. Materials and Methods

2.1. Drone Lidar

We collected lidar data over a temperate mountain forest in the southern Czech Republic using a high-density drone [45]. The site contained the Zofin forest dynamics plot, a 25 ha permanent-inventory plot in which all free-standing woody plants with DBH greater than 1 cm have been mapped and monitored since 2012 [77,78]. The forest is dominated by old-growth European beech (Fagus sylvatica) and Norway spruce (Picea abies), with occasional silver fir (Abies alba) [78,79]. Field inventory data were used to select locations for this analysis and not in later analyses (Table 1).
Data were collected using a RIEGL VUX-1 laser scanner coupled to an Oxford Technical Solutions (OxTS) Survey + 2 GPS-IMU. The VUX-1 could record up to 500,000 measurements per second at a wavelength of 1550 nm. The sensor recorded the return time of emitted laser pulses and processed the recorded waveform to identify discrete reflective surfaces (returns) within every emitted laser pulse. All returns were included in later analyses. The OxTS GPS-IMU was a survey-grade instrument designed for aerial mapping applications. The nominal roll and pitch accuracy were 0.03°, and the nominal heading accuracy in dual-antenna mode was 0.05°. The standard deviation of roll and pitch angles were 0.942° and 0.791°, respectively, indicating that stability of the aircraft during flight had minimal impact on our analysis. During flight operations, we collected an independent Global Navigation Satellite System (GNSS) data stream using a Novatel FlexPak 6 Triple Frequency + L-band GNSS receiver. We used this data stream to differentially correct the OxTS GPS-IMU measurements in post processing. A previous analysis demonstrated that post-processed range accuracy was less than 5 cm (one sigma) on a heterogeneous target (a fallen dead tree) [45].
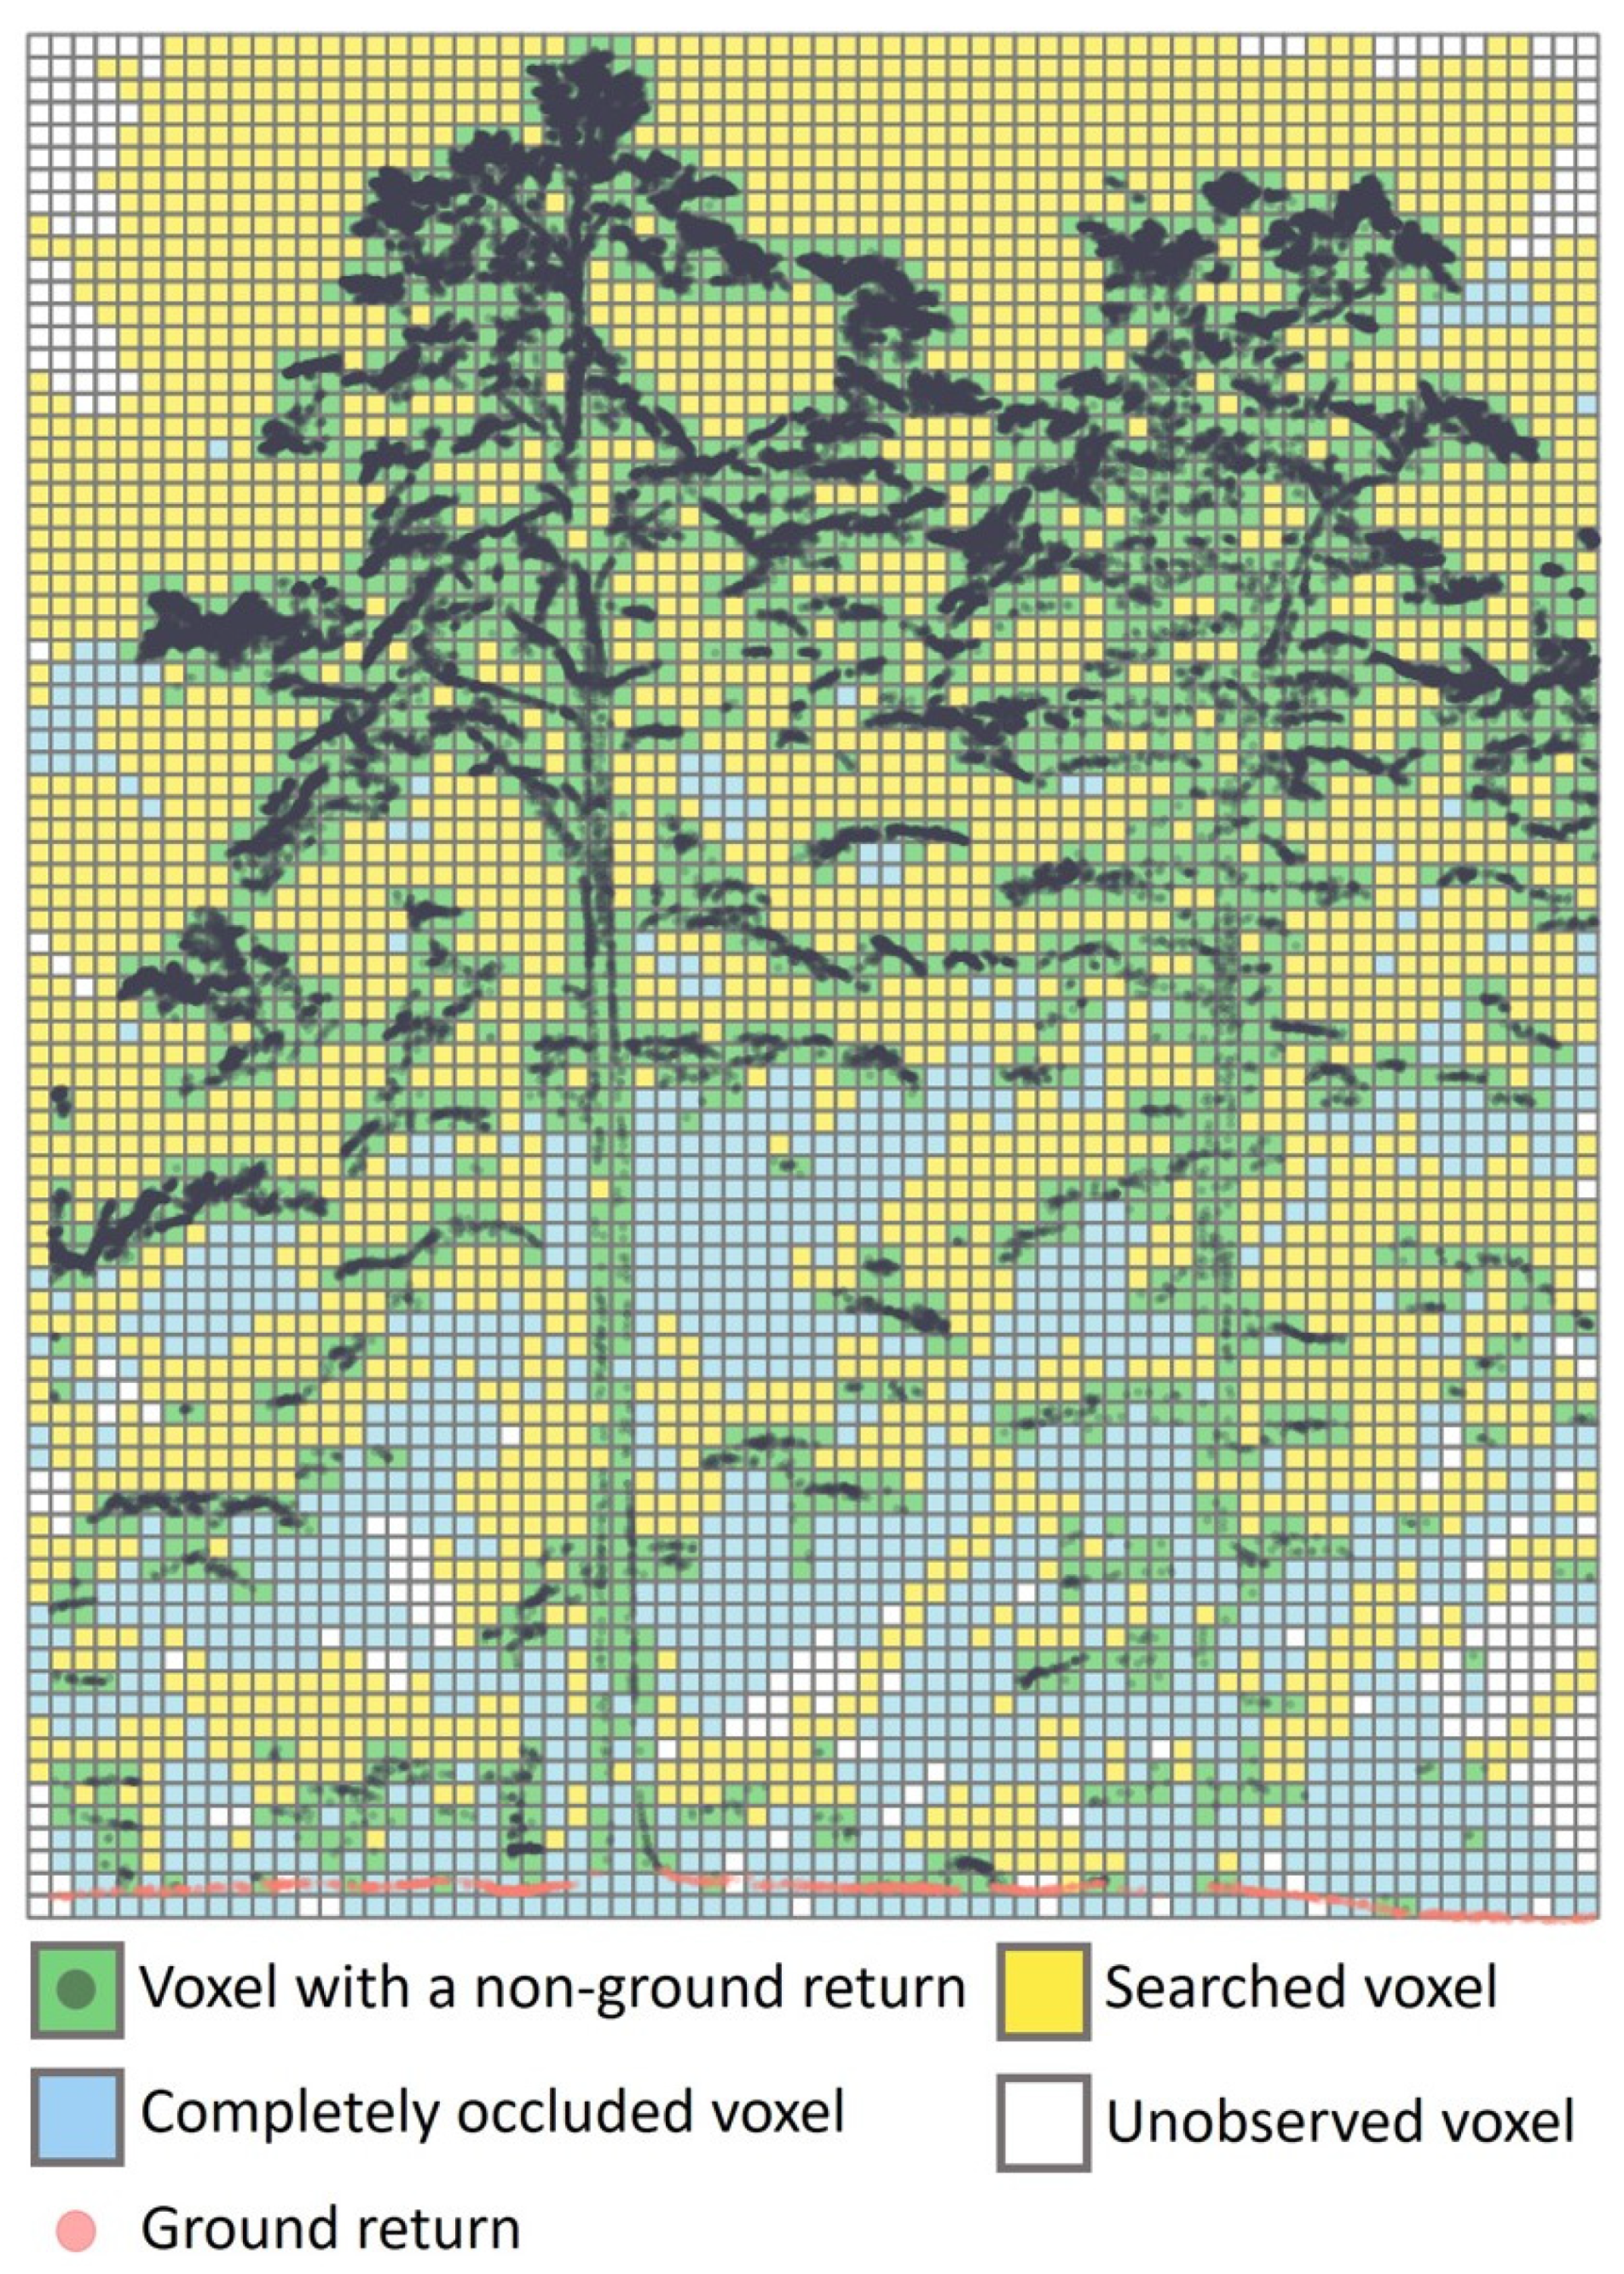
The data were collected in two sets of orthogonal flight lines on 6 June 2018 under leaf-on conditions. There were 45 flight lines in the NW–SE direction, and 45 flight lines in the NE–SW direction (Figure 1A). We used two sets of flight lines over the same area to ensure high-density point coverage of stem and branch structure. The nominal flight altitude was 110 m above ground, and the nominal flight speed was 6 m/s. The maximum scan-angle range was ±60°. Mean point density in the leaf-on point cloud was 2166 points/m2. We classified ground returns within the calibrated and georeferenced point cloud using a progressive morphological filter [80] and excluded ground returns from the subsequent analyses (Figure 2).

2.2. Terrestrial Laser Scanning

We collected TLS data within a 1 ha area at 22 scanning positions using a Leica P20 ScanStation on 6 June 2018 (Figure 1B). All TLS data were co-registered using ground-based reflective targets. The mean absolute co-registration error was 1 mm [81]. We classified ground returns in the calibrated and georeferenced point cloud using the terrain-from-octree algorithm in 3D Forest [82]. We then manually co-registered TLS data to the drone lidar point cloud. To estimate the registration error between TLS and drone lidar data, we measured the distance between 20 pairs of TLS and drone lidar points in each of the four 100 m2 plots (80 pairs in total) and calculated the arithmetic mean. The mean distance was 0.25 m, and the standard deviation was 0.2 m.

2.3. Ray Tracing and Voxel-Traversal

We assessed the impact of pulse density and scan-angle range on detected and different types of undetected voxels, using a grid with 0.5 m voxels. For each voxel, we determined whether the voxel was occupied by vegetation or not, based on the union of the TLS and drone lidar points. Occupied voxels were voxels containing at least one return from TLS or drone lidar data. Part of our analysis was to investigate under what pulse density and scan-angle range the occupied voxels would be detected by simulating different pulse densities and scan-angle ranges. Our analysis identified three types of undetected voxels (Figure 3). First, we describe the reconstruction of pulse trajectories and the determination of different undetected voxels with ray tracing. In Section 2.4, we then document how different pulse densities and scan-angle ranges were simulated.

2.3.1. Reconstruction of Pulse Trajectories

We considered pulse trajectories as line segments with a starting point and an ending point. The location of the ending point was determined by the coordinates of a lidar return. To denote the starting point, we used the aircraft location at the time a return was recorded. For each recorded return, we determined the aircraft’s location in latitude (Y), longitude (X), and elevation (Z) using linear interpolation of the 100 Hz GPS trajectory. After determining starting points of the pulse trajectories, we identified multiple returns associated with the same pulse using the recorded return number and the GPS time.

2.3.2. Voxel Traversal

We calculated the searching distances of the pulse trajectories within each voxel to identify different types of undetected voxels. Before calculating the searching distances, we determined the intersection points of each pulse trajectory with each voxel, based on Equations (2)–(4). First, we assessed whether the pulse was parallel to any plane of a voxel using
u · n p 0 ,
where u represents the direction vector of a pulse trajectory, and n p represents the normal vector of a plane coinciding with one of the six voxel surfaces. When the dot product of the two vectors was equal to 0, the pulse was parallel to the plane of the voxel and could not intersect that plane. The purpose of this parallel detection step was to refine the search scope, ensuring that only pulses likely to intersect with a voxel plane were considered in the subsequent analyses.
When the pulse was not parallel to a voxel plane, a line (not a line segment) sharing the same direction as the pulse trajectory intersected the infinite plane that coincided with the voxel plane. The intersection point between the line and the infinite plane is denoted by P . Solving for P requires the distance from the aircraft location, u 0 , to P , denoted using the scalar t . We solve for P and t using Equations (3) and (4):
P = u 0 + t · u ,
( P P 0 ) · n p = 0 ,
where P 0 represents a random point on the plane. Only one random point is sufficient to solve for P and t . We used one vertex of the plane as the random point because coordinates of the vertices of the voxel planes were known from voxelization.
After determining all intersection points based on the line and the infinite planes of a voxel, we excluded intersection points outside the voxel. Each voxel had at most two intersection points. We denominated the distances from the aircraft location to the intersection points Dmin and Dmax according to the relative quantity of the distances, where Dmin represented the distance from the starting point of the pulse trajectory to the entry point into the voxel, and Dmax represented the distance to the departure point. The distance from the aircraft location to the lidar return point was D. If, for a given voxel, D < Dmin or D > Dmax, the lidar return was generated in a different voxel.
The searched distance of a pulse trajectory concerning a given voxel was calculated under four scenarios (Figure 3A). In scenario #1 (Figure 3A: c, d, g, h), there were no intersection points for a given voxel, meaning that the searched distance of pulses inside the voxel was 0 because the laser was not fired in the direction of the voxel. In scenario #2 (Figure 3A: f, i), D < Dmin. Here, the searched distance within the voxel was 0 because the lidar return was triggered in a voxel closer to the sensor along the beam path. Scenario #3 (Figure 3A: e) illustrated a searched voxel where Dmin < D < Dmax. Here the searched distance was D − Dmin and a lidar return was generated inside the voxel. Lastly, in scenario #4 (Figure 3A: a, b), D > Dmax, representing a voxel searched without producing a lidar return. The searched distance was Dmax − Dmin. The total distance searched for a given voxel was the sum of the searched distances produced by all pulse trajectories within the voxel.
When a voxel could have been traversed by a pulse but was not due to interception by other material along the beam path, this voxel was an occluded voxel. Voxels could be partially occluded or completely occluded. A voxel was partially occluded when non-occluded pulses also traversed it. A voxel was completely occluded when it was never traversed by a pulse, despite individual pulses being fired in the direction of the voxel.

2.4. Quantifying Sampling Completeness under Simulated Conditions

We quantified sampling completeness and the proportions of three types of undetected voxels (Figure 3B; undetected and searched voxels, undetected and unobserved voxels, and undetected and completely occluded voxels) under simulated pulse densities and scan-angle ranges. Sampling completeness was quantified using the proportion of occupied voxels that were detected. The proportions of each type of undetected voxel were the ratios of those voxels relative to the total number of occupied voxels. Sampling completeness was quantified in both a 1 ha plot and four 100 m2 plots, while proportions of different types of undetected voxels were quantified in the 100 m2 plots (Figure 1C, Table 1). Note that for the 100 m2 plots, only returns within each plot were considered. The undetected voxels were studied only in the 100 m2 plots because the three types of undetected voxels needed to be determined by tracing pulse trajectories at each pulse density and scan-angle range, which was computationally demanding for the 1 ha plot.
To quantify sampling completeness, we simulated different conditions by changing pulse density and scan-angle range. We considered pulse densities of 1 pulse/m2, 10 pulses/m2, 50 pulses/m2, 100 pulses/m2, 200 pulses/m2, 300 pulses/m2, 400 pulses/m2, 500 pulses/m2, 1000 pulses/m2, and 1500 pulses/m2. The nominal scan-angle range in our data was ±60°. We therefore considered scan-angle ranges of ±5° to ±60° in increments of ±5° (±5°, ±10°, ±15°, ±20°, ±25°, ±30°, ±35°, ±40°, ±45°, ±50°, ±55°, ±60°). For example, a scan-angle range of ±5° meant that the observations were acquired within a scan-angle range of −5° to 5°; a scan-angle range of ±30° meant that the observations were acquired within a scan-angle range of −30° to 30°. For each combination of pulse density and scan-angle range, we excluded returns outside the specific scan-angle range, randomly sampled pulses from drone lidar according to a certain pulse density, identified voxel types according to the sampled pulse trajectories and relevant returns, and calculated proportions of different types of voxels. Note that we examined multiple returns when sampling pulses, because sampling the pulse trajectory of any return sampled all returns associated with that pulse. We repeated this process 10 times for each combination of pulse density and scan-angle range. The proportions were the arithmetic mean over these 10 simulations. Each combination of pulse density and scan-angle range was generated within tiles to reduce computation time, and results from tiles were then aggregated to derive results. Each tile in the 1 ha plot was 50 m2, and each tile in a 100 m2 plot was 4 m2. Note that in the simulations based on tiles, the number of pulses under a simulated scan-angle range might be smaller than the pulse density to be simulated. Thus, there were missing simulated combinations for certain scan-angle ranges and pulse densities. We used linear regression to quantitatively assess the contribution of pulse density and scan-angle range to sampling completeness. The proportion of detected voxels was the response variable, and predictor variables were pulse density and scan-angle range. We compared three models: (1) a pulse density model; (2) a scan-angle range model; (3) a model including both pulse density and scan-angle range.
Although our flight plan was designed to minimize sampling variation from different observation angles, the observation angle may have an impact on sampling completeness. Therefore, we sampled combinations of four azimuth-angle ranges crossed by pulse density. The azimuth angle of each pulse was defined as the angle from 0° to the projected pulse trajectory on the horizontal plane. We considered four azimuth-angle ranges: 0°–90°, 90°–180°, 180°–270°, and 270°–360°.
To gain a deeper understanding of the sampling capability of the high-density drone lidar, we investigated voxels at different heights by quantifying the different types of voxels throughout the canopy height profile. We obtained the ground elevation beneath each voxel using a digital terrain model (DTM) generated from ground returns. The aboveground height for each voxel was calculated by subtracting the ground elevation from the voxel elevation. We classified voxels based on their heights above ground. Voxel heights above ground used in this study ranged from 0 to 46 m, with increments of 0.5 m (e.g., 0 refers to the 0–0.5 m height class, 0.5 refers to the 0.5–1 m height class, and so forth). For each height increment, we quantified proportions of detected and different undetected voxels in the 100 m2 plots under each combination of simulated pulse density and scan-angle range.

3. Results

Results from all four 100 m2 plots were broadly consistent, so we report results from Plot 1 in the main text. Summaries for the remaining plots are in Appendix A.

3.1. Sampling Completeness under Different Pulse Densities and Scan-Angle Ranges

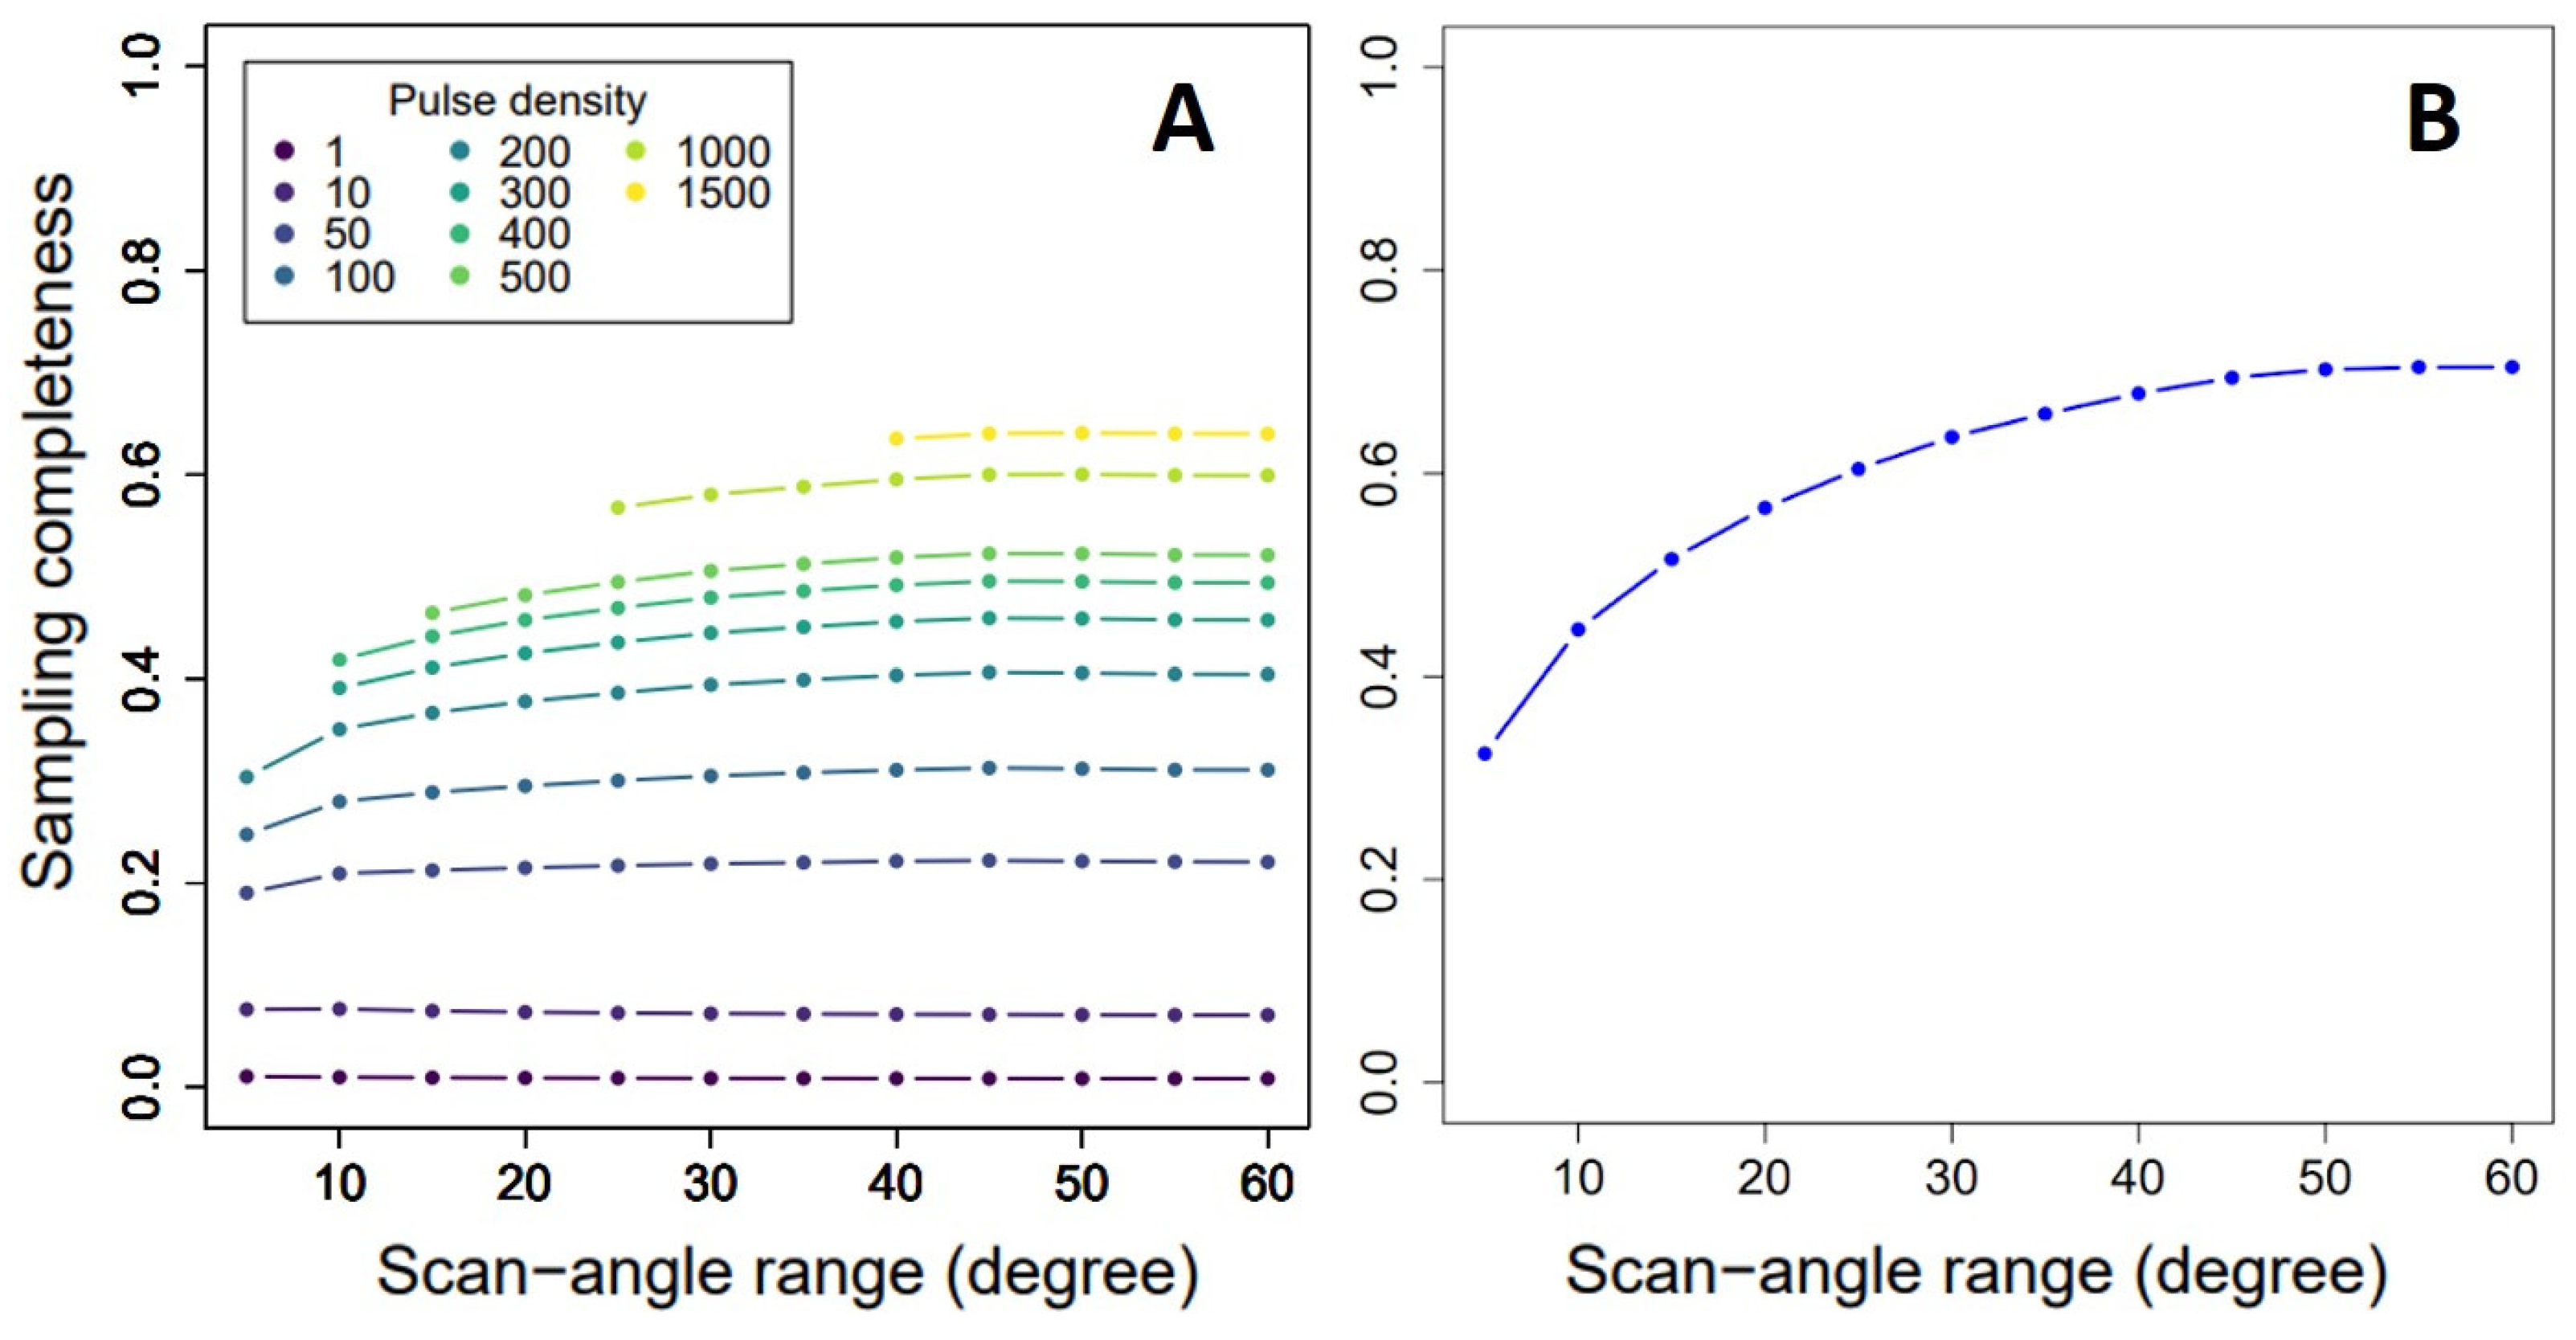
Sampling completeness was more sensitive to pulse density than to scan-angle range (Figure 4). Although a strong relationship existed between sampling completeness and scan-angle range (Figure 4B), decoupling scan-angle range from pulse density revealed that most of the variation in sampling completeness was driven by pulse density (Figure 4A). For example, even with a scan-angle range as large as ±60°, a pulse density smaller than 100 pulses/m2 could not achieve sampling completeness > 30% (Figure 4A). Results from the linear regression showed that pulse density explained about ten times more variation in sampling completeness than scan-angle range (R2 = 0.650 for pulse density and 0.061 for scan-angle range; Table A1). All regressions were statistically significant (p < 0.001 for models with both variables in combination and for the model with pulse density, and p = 0.011 for the model with scan-angle range). Including both pulse density and scan-angle range did not meaningfully increase the amount of variance explained (R2 = 0.652).

3.2. Undetected Voxels under Different Pulse Densities and Scan-Angle Ranges

Combining data from drone lidar and TLS, we identified 12,823 occupied voxels in the 100 m2 study area (plot 1). Before subsampling to limit pulse density and scan-angle range, the drone lidar searched 12,577 of the occupied voxels (98.1%) and detected 10,486 of the occupied voxels (81.8%), while 2091 of the searched voxels (16.6%) remained undetected. There were no undetected and unobserved voxels in the original data, meaning that all the undetected and unsearched voxels were unsearched due to occlusion, and were therefore regarded as undetected and completely occluded voxels.
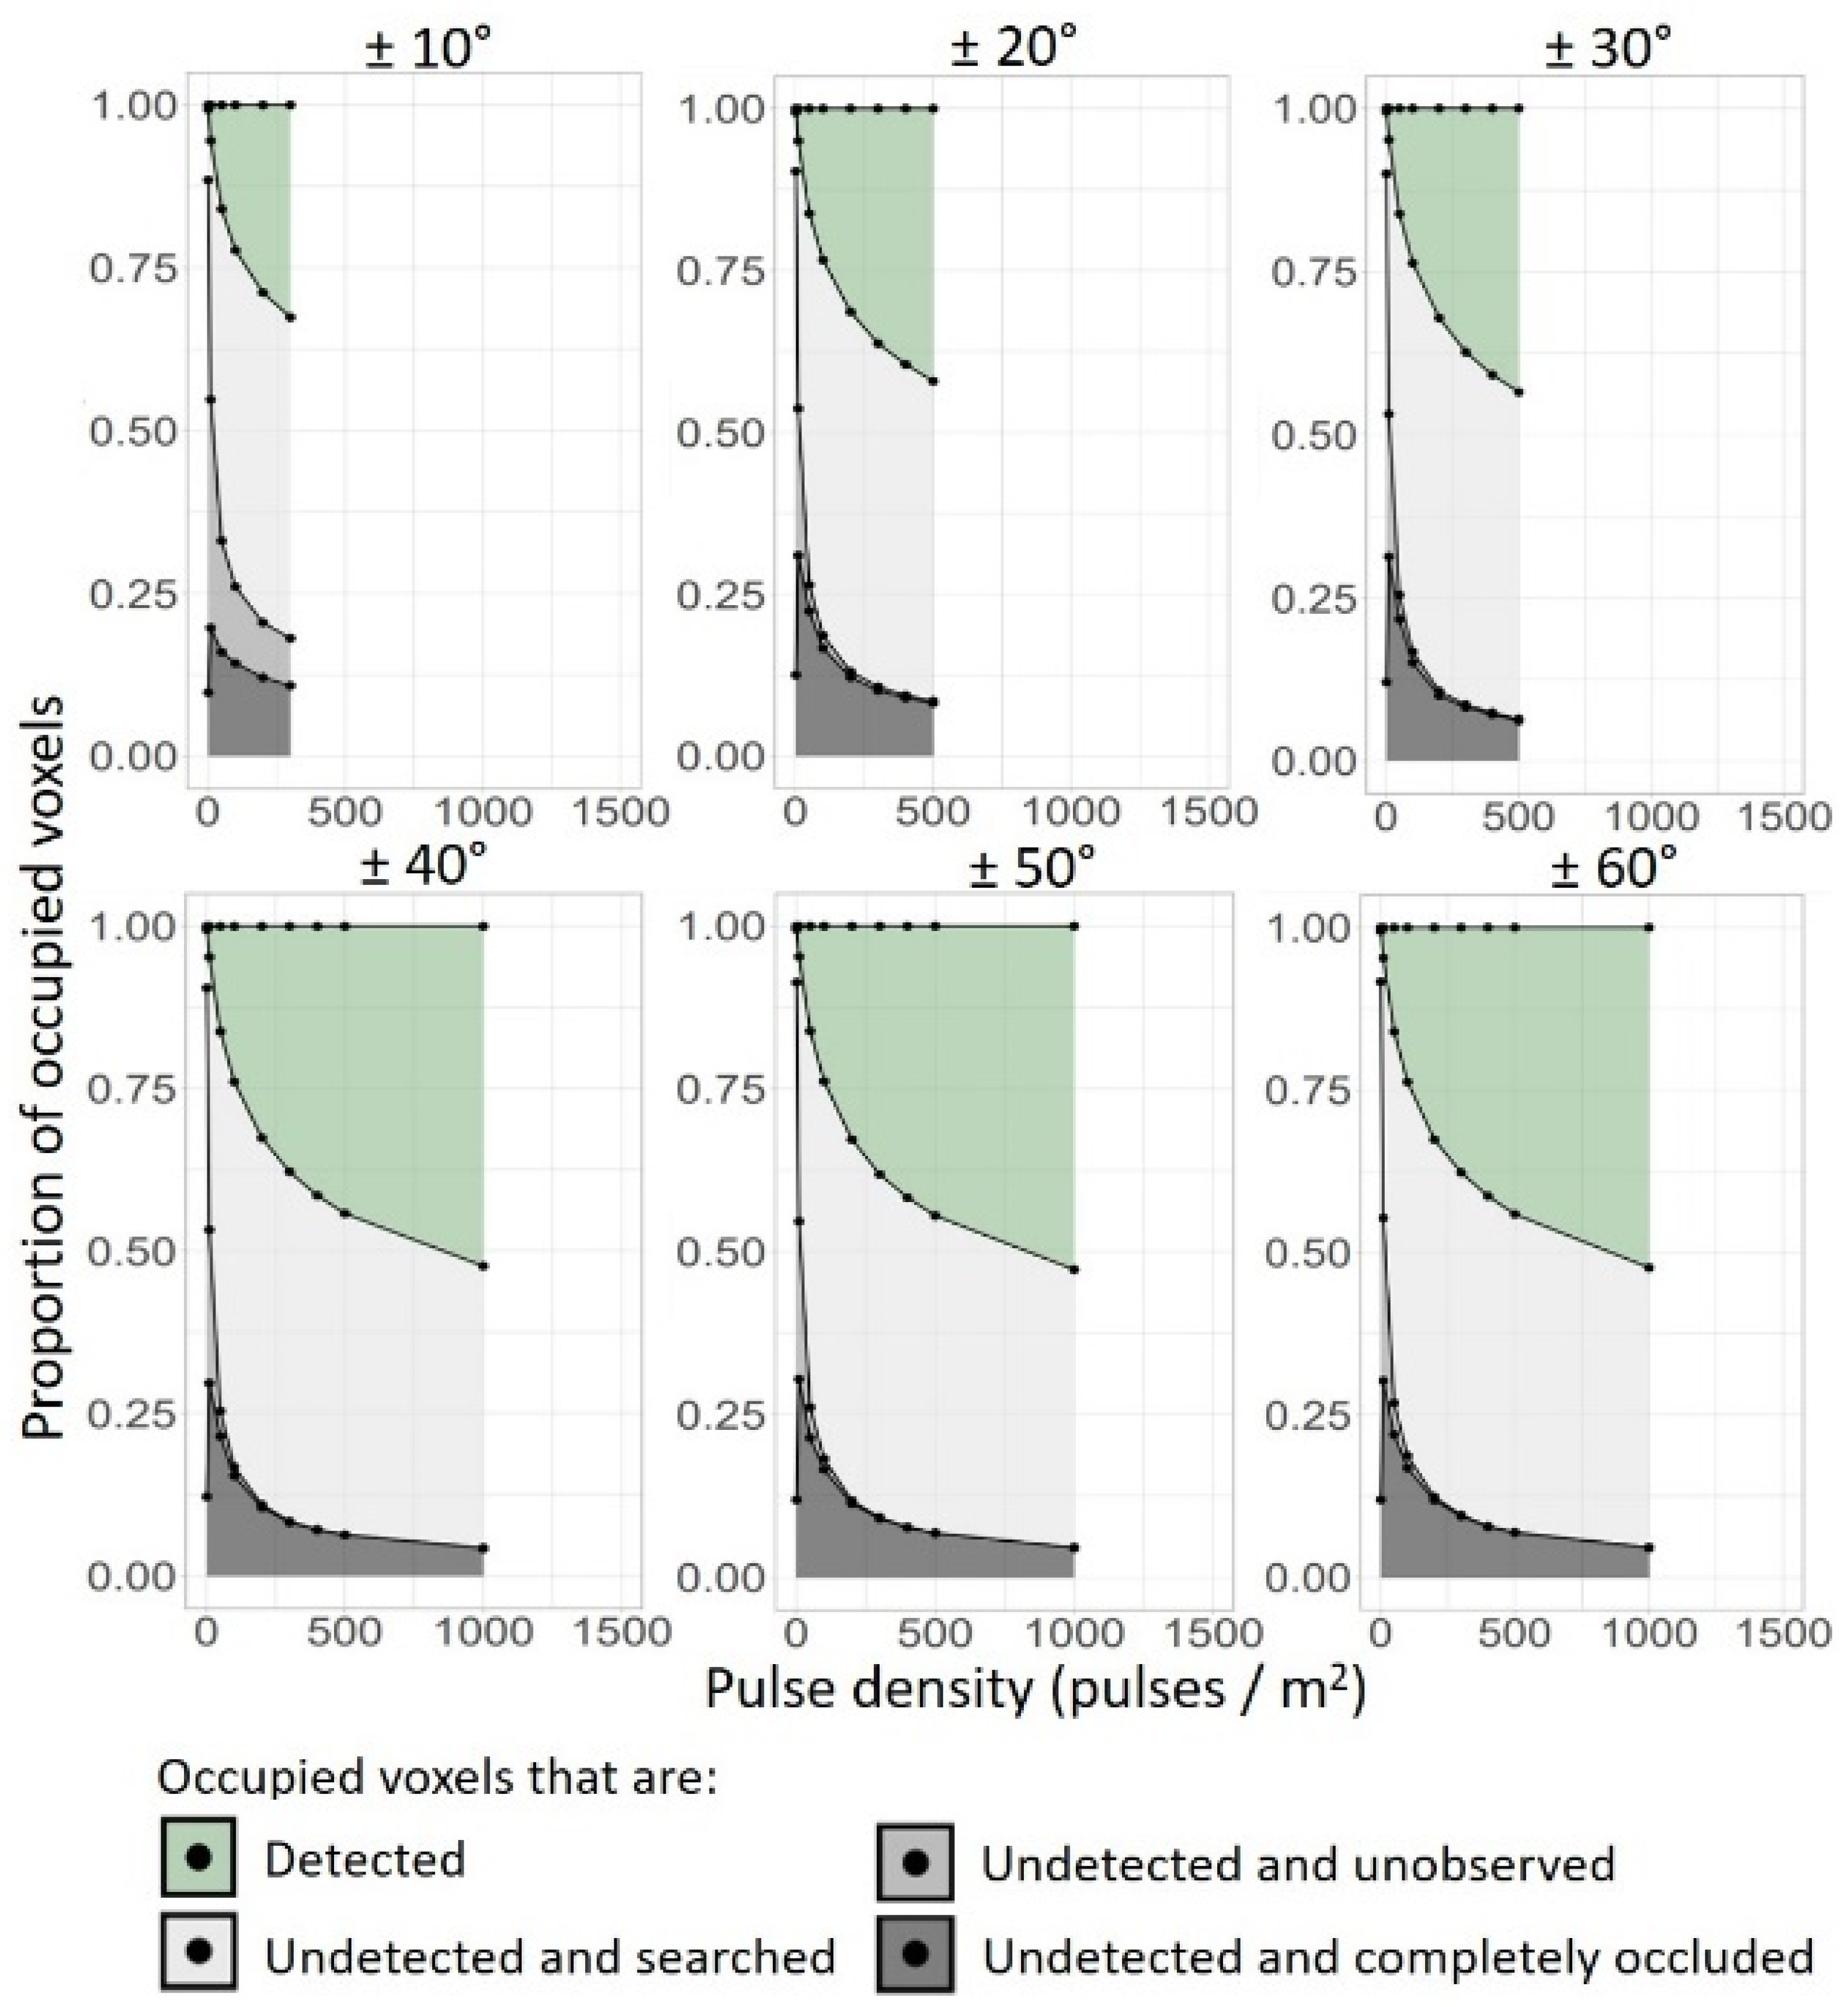
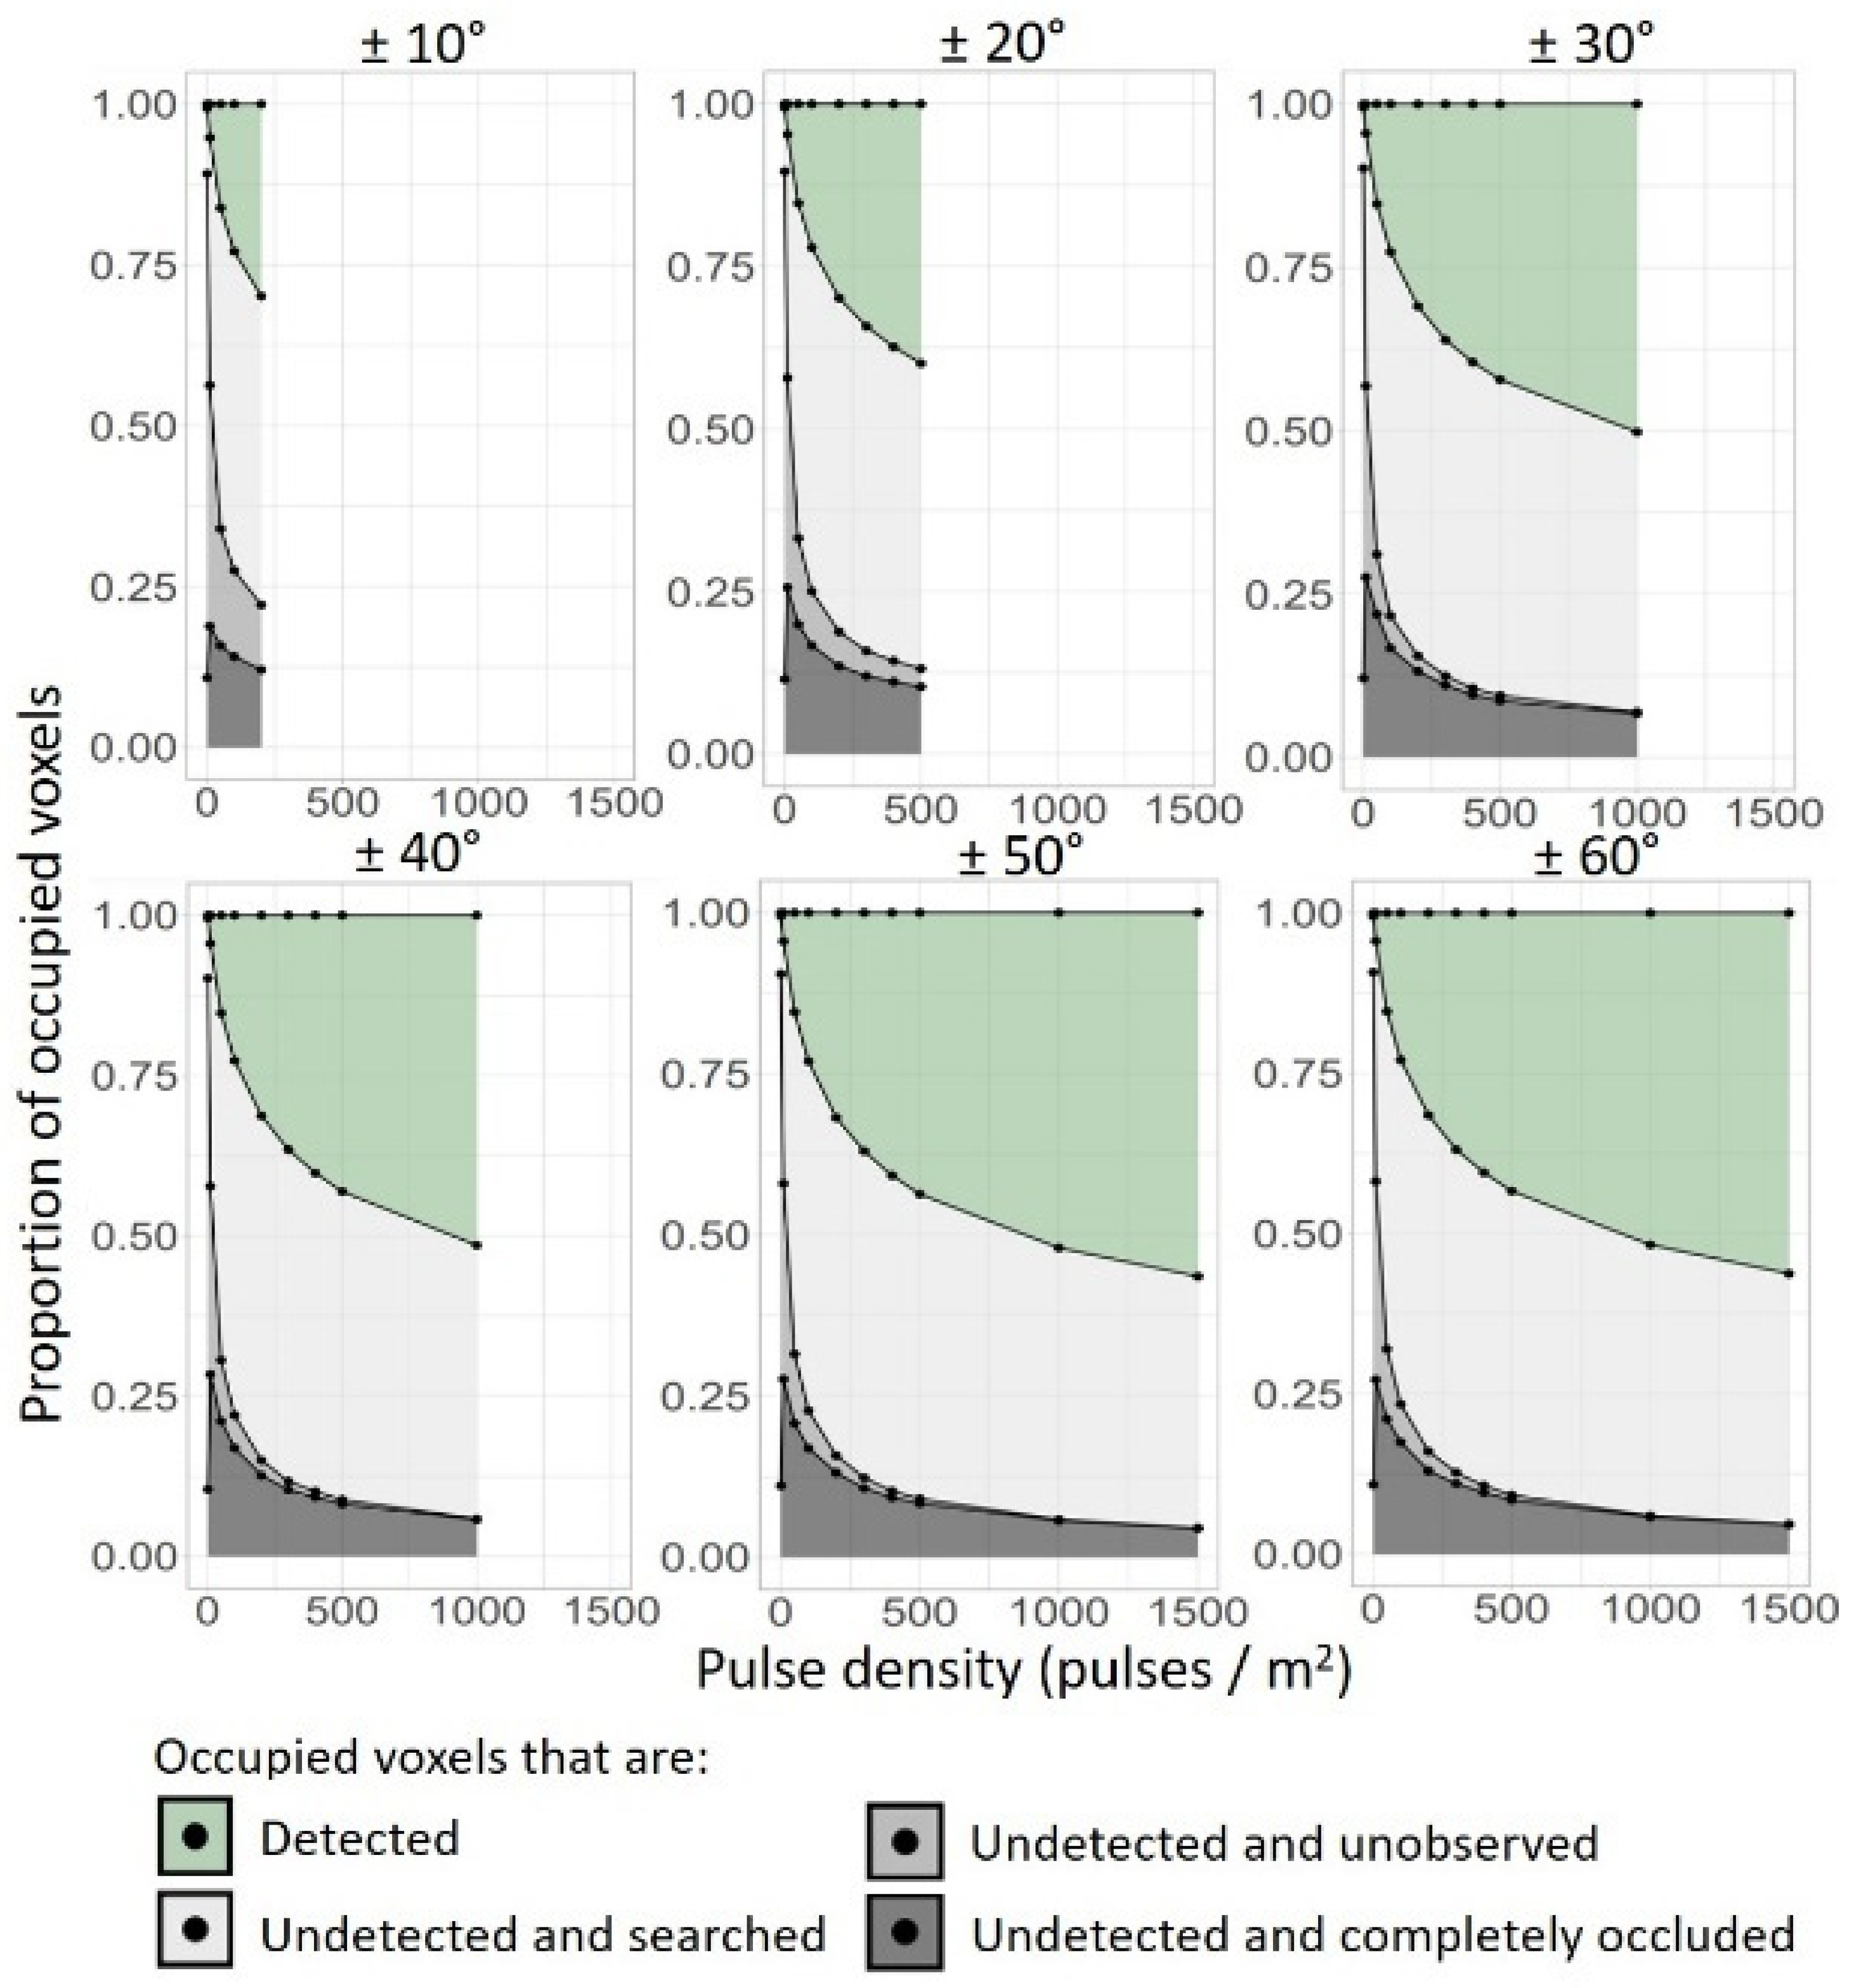
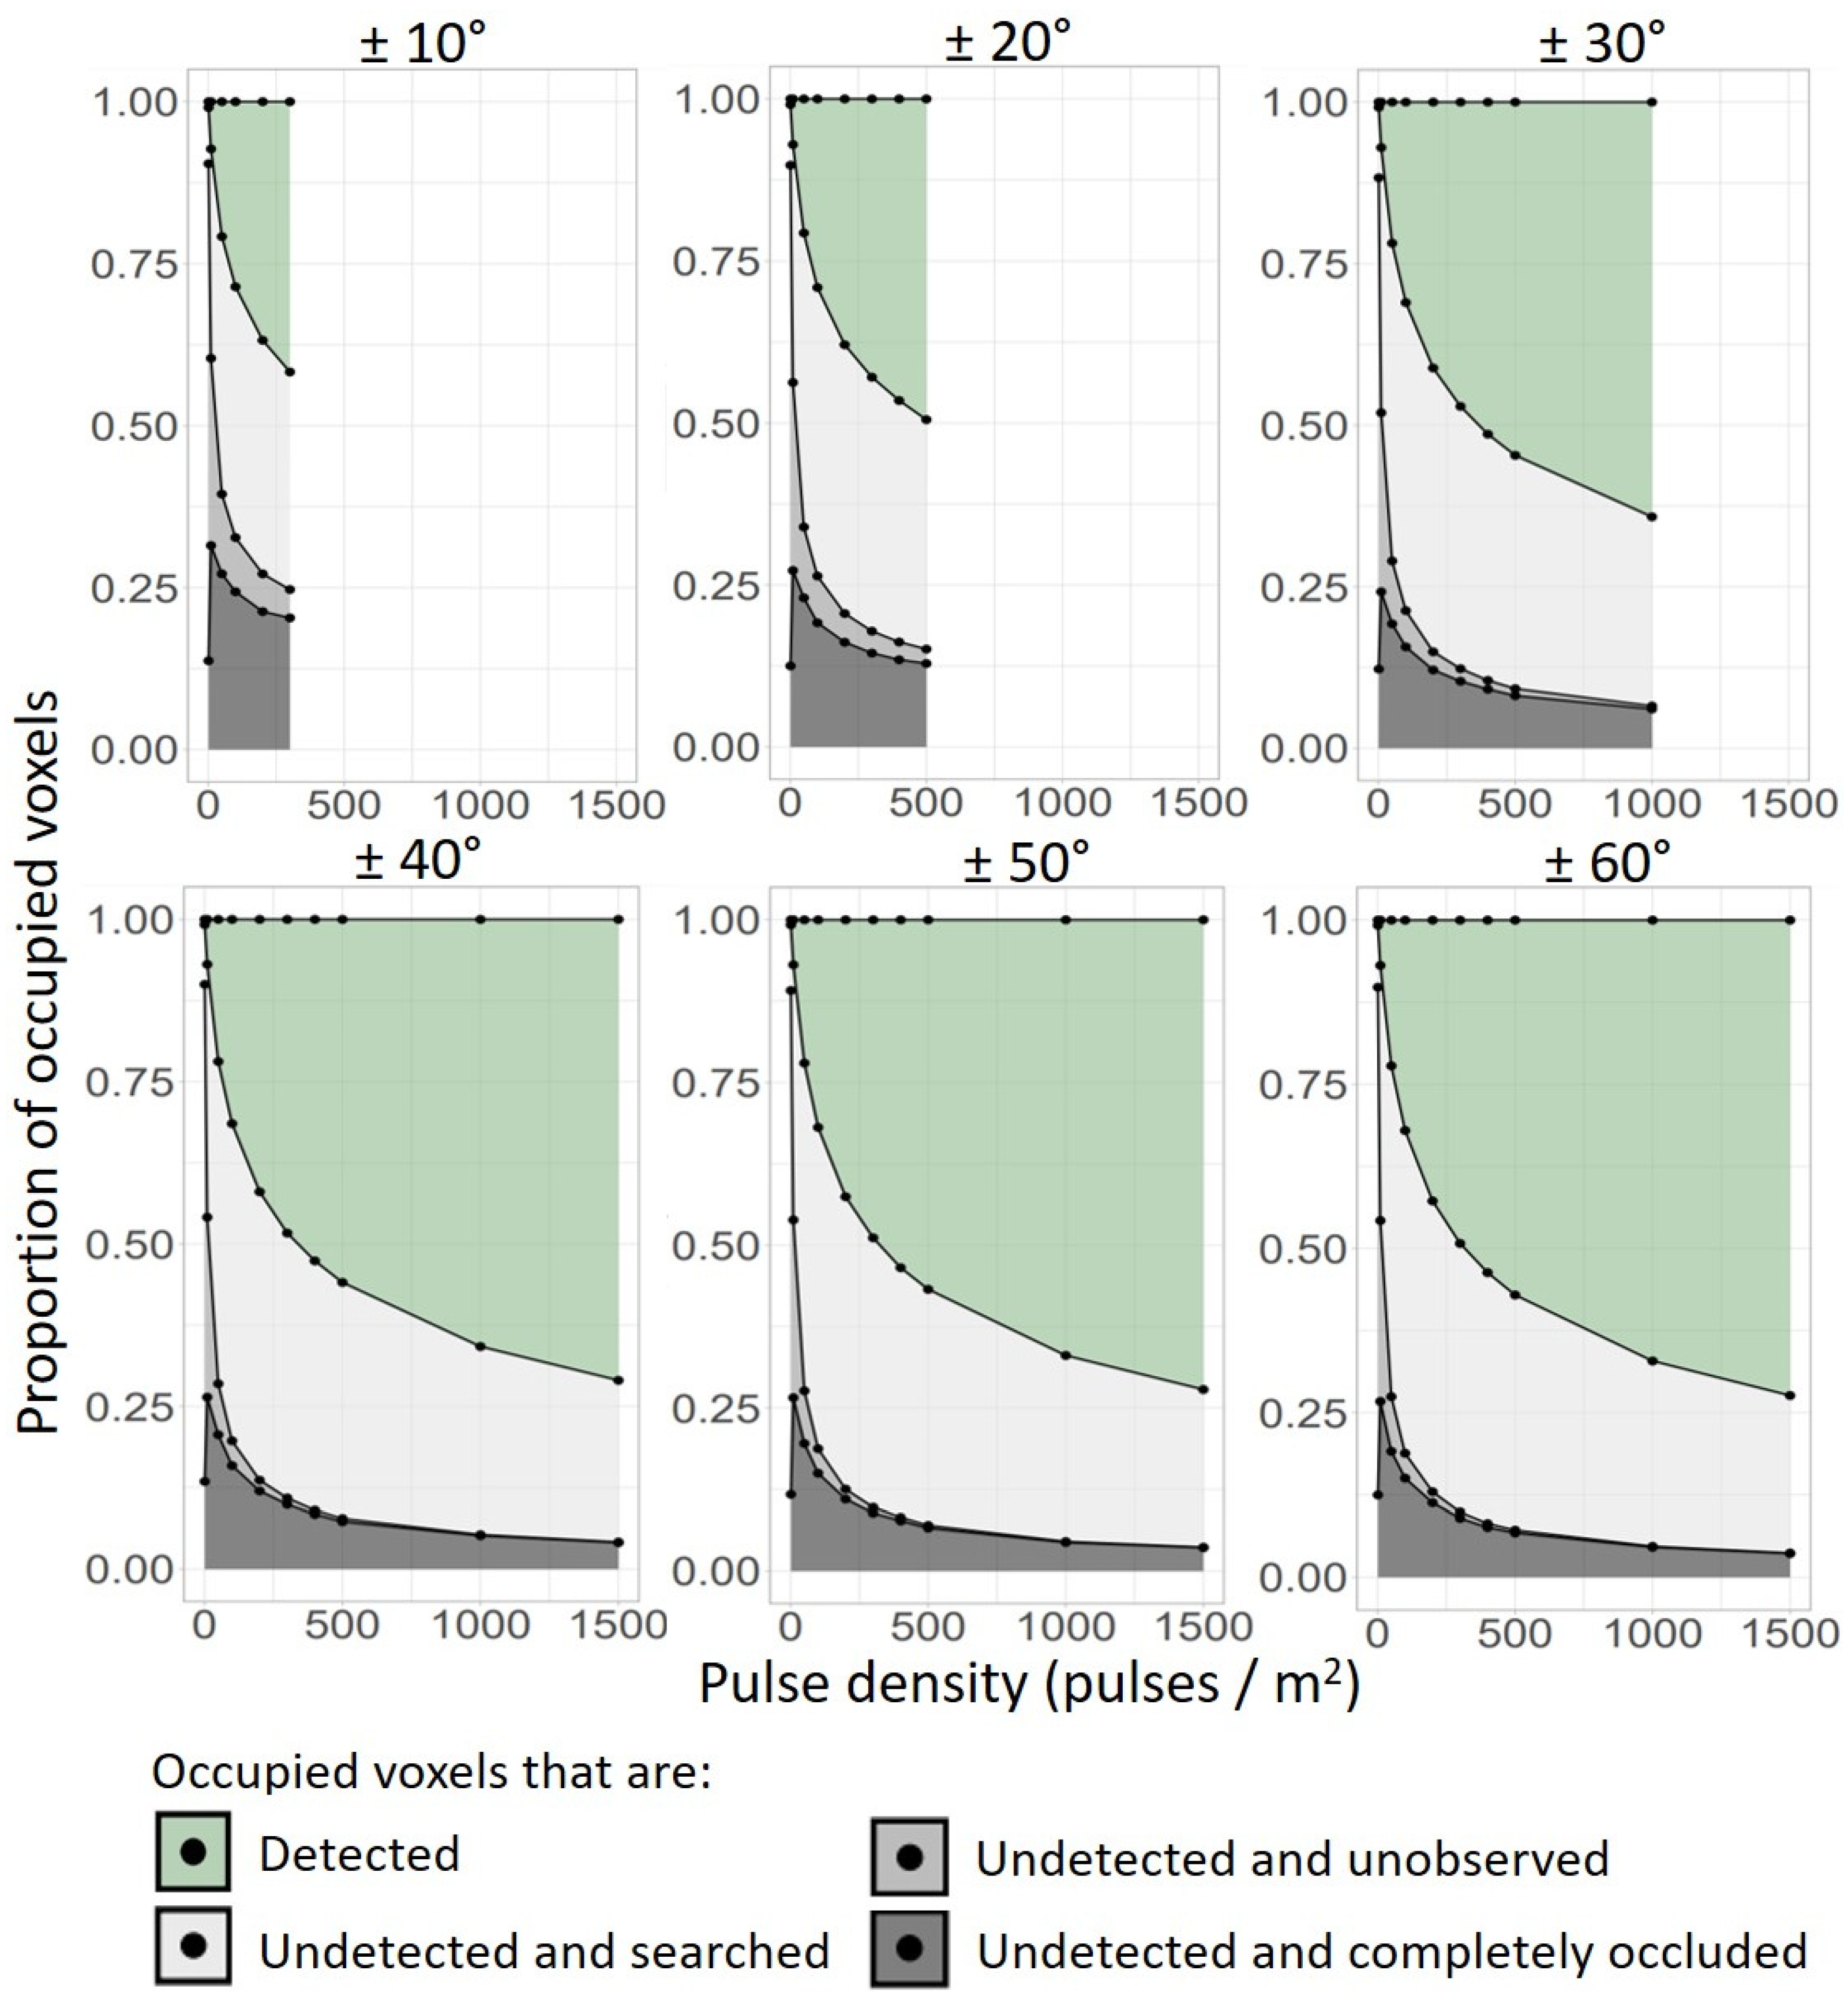
When the pulse density and the scan-angle range were at their maximum subsampled value (1500 pulses/m2, ±60°), 3065 (23.9%), 10 (0.1%), and 465 (3.6%) undetected voxels were identified as undetected and searched, undetected and unobserved, and undetected and completely occluded, respectively (Figure 5). However, when we simulated smaller pulse densities and narrower scan-angle ranges, proportions of different undetected voxels varied substantially (Figure 5 and Figure 6). For example, with a scan-angle range of ±10° and a pulse density of 1 pulse/m2, the proportions of undetected and searched, undetected and unobserved, and undetected and completely occluded voxels were 8.7%, 76.7%, and 13.7%, respectively (Figure 5). At 300 pulses/m2 with the same scan-angle range, these values changed to 33.6%, 4.4%, and 20.3%. Holding the pulse density at 300 pulses/m2 and increasing the scan-angle range to ±60° resulted in values of 40.9%, 0.9%, and 9.0%, respectively (Figure 5).
The types of undetected voxels depended strongly on pulse density and weakly on scan-angle range (Figure 5 and Figure 6). Increasing pulse density or scan-angle range always reduced the proportion of undetected and unsearched or more specifically, undetected and unobserved voxels (Figure 6A,C). However, this was not always the case for undetected and searched voxels or undetected and completely occluded voxels; whether the numbers of these two types of undetected voxels decreased or increased depended on the pulse density and the scan-angle range. As the pulse density increased, the numbers of undetected and searched voxels and undetected and completely occluded voxels first increased and then decreased. For example, the proportion of undetected and searched voxels increased when the pulse density increased from 1 to 50 pulses m2 (Figure 6B), as it did for undetected and completely occluded voxels when the pulse density increased from 1 to 10 pulses/m2 (Figure 6D). When the scan-angle range increased, the proportion of undetected and searched voxels increased (Figure 6B), while the proportions of the other three types of voxels decreased (Figure 6A,C,D). For all three types of undetected voxels, when the pulse density was as low as 1 pulse/m2, the scan-angle range had little impact.

3.3. Vertical Variability of Proportions of Different Types of Voxels

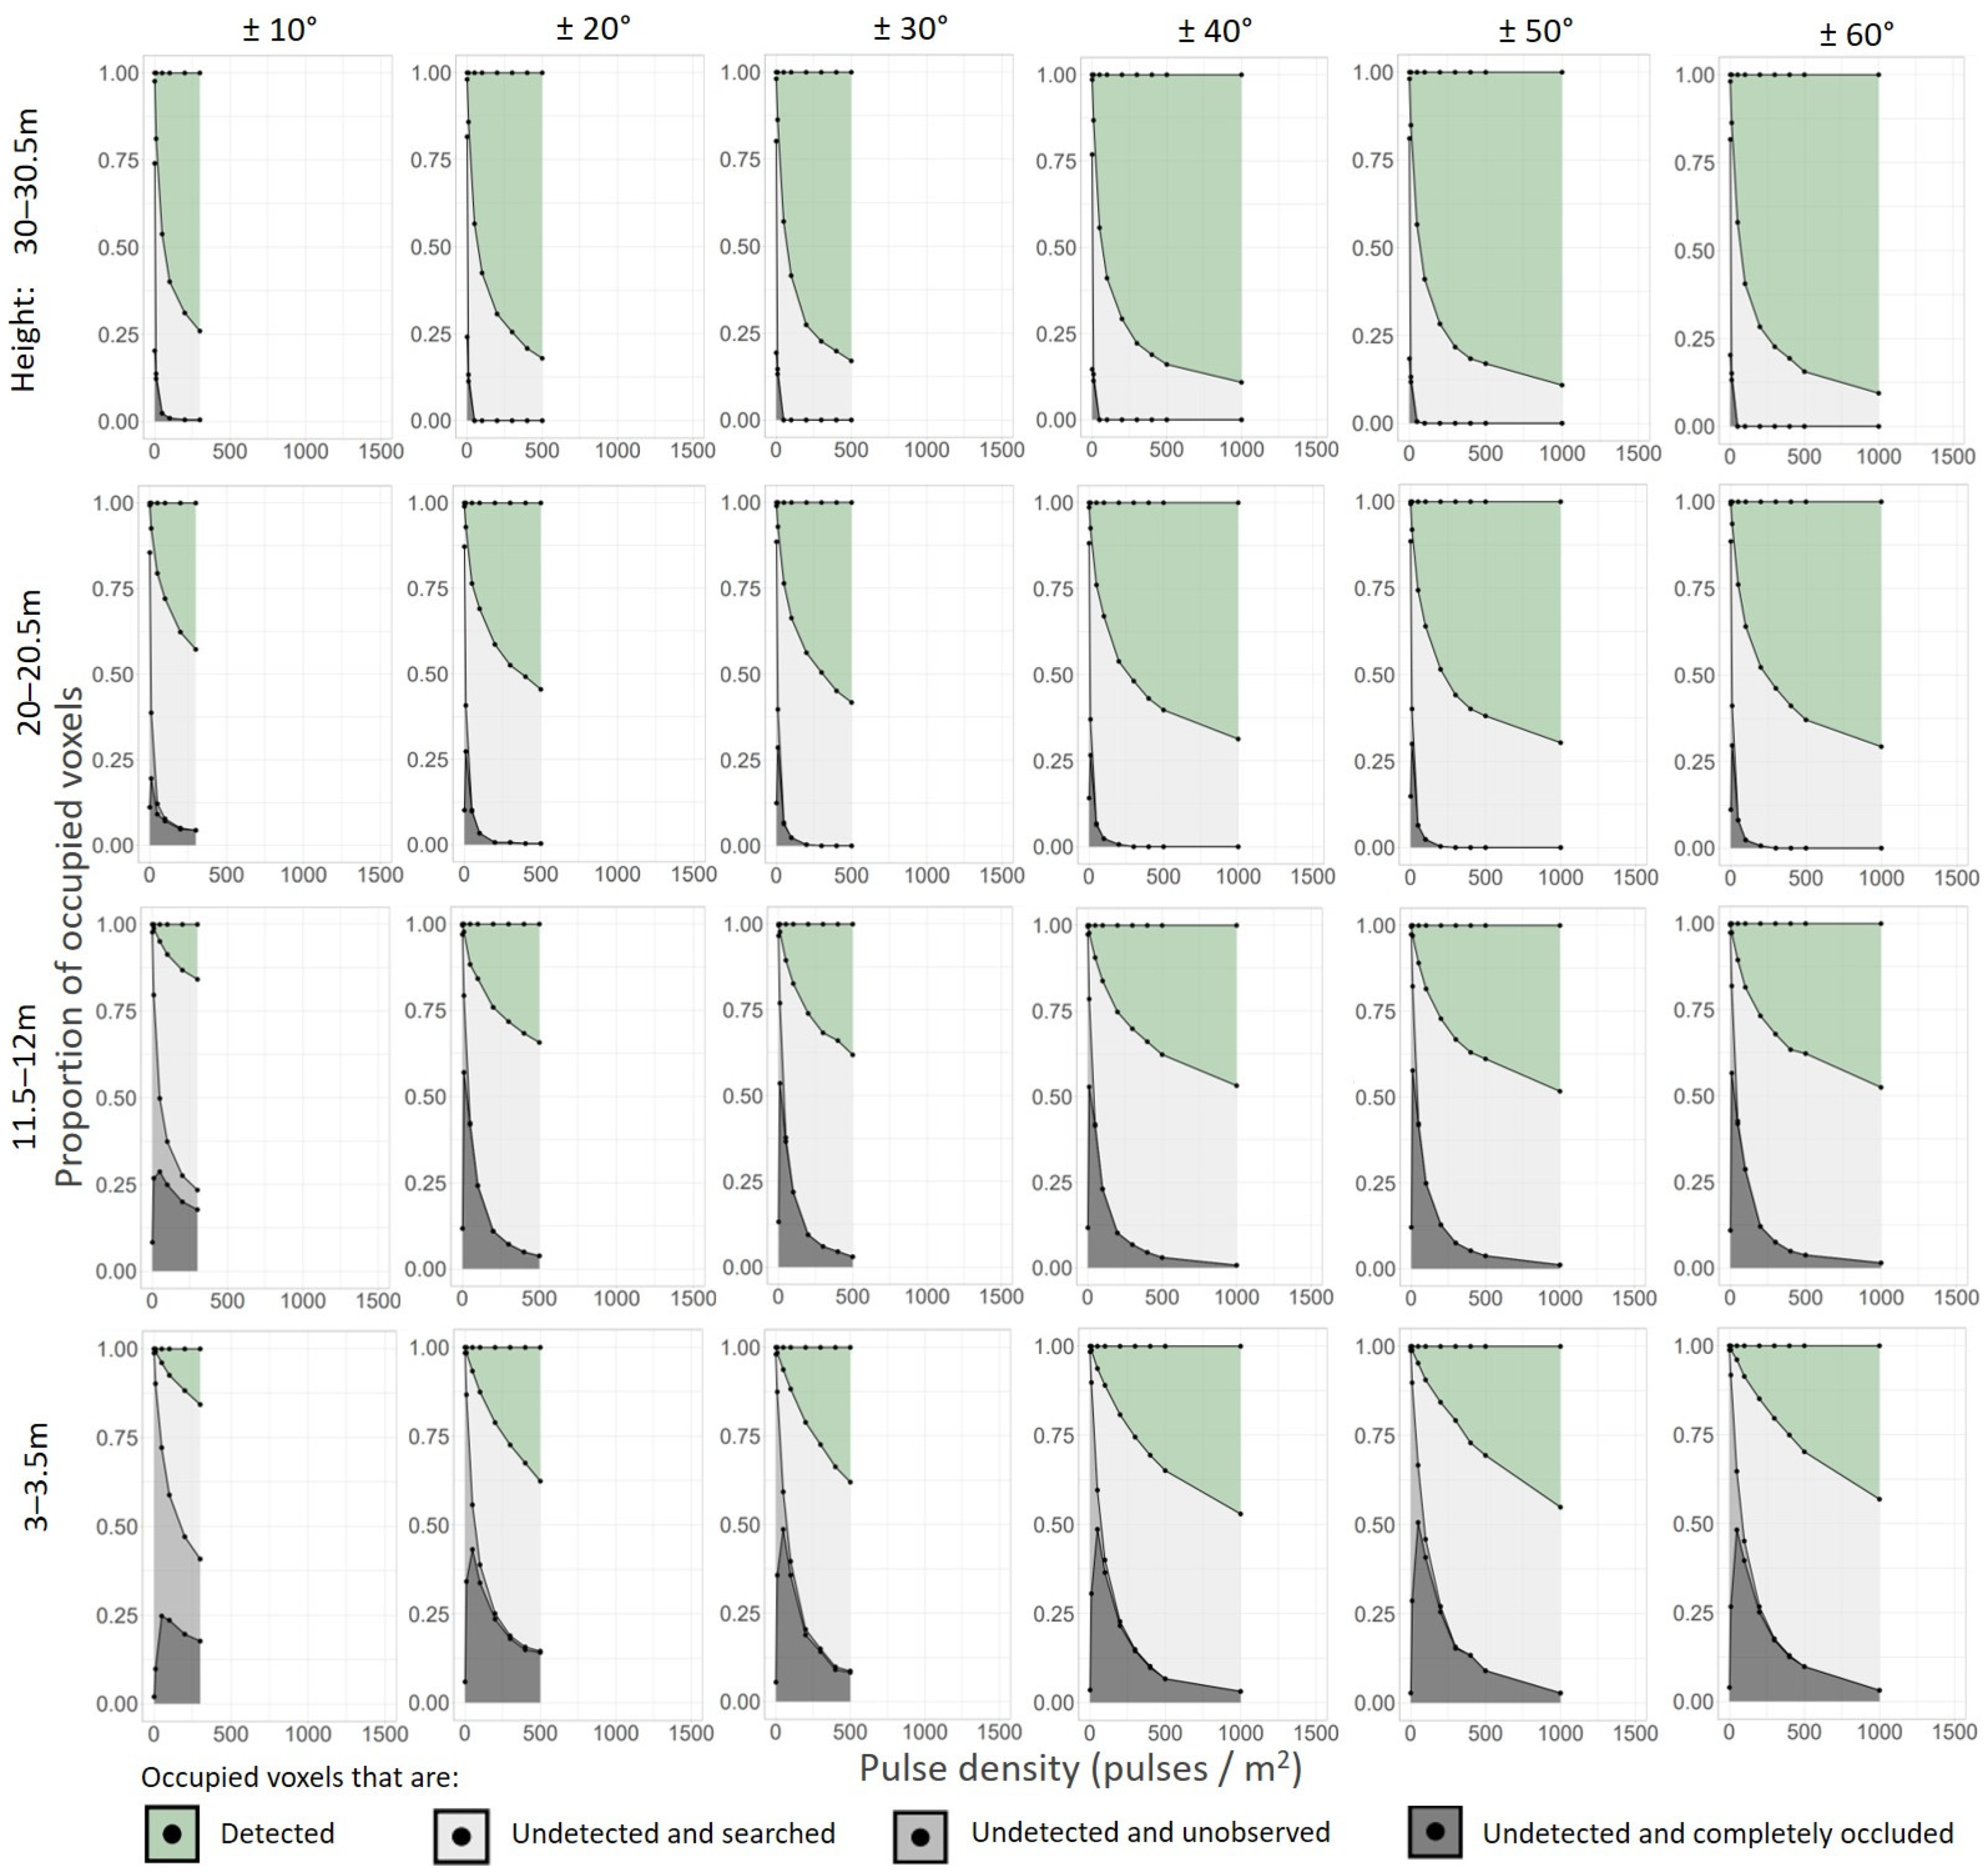
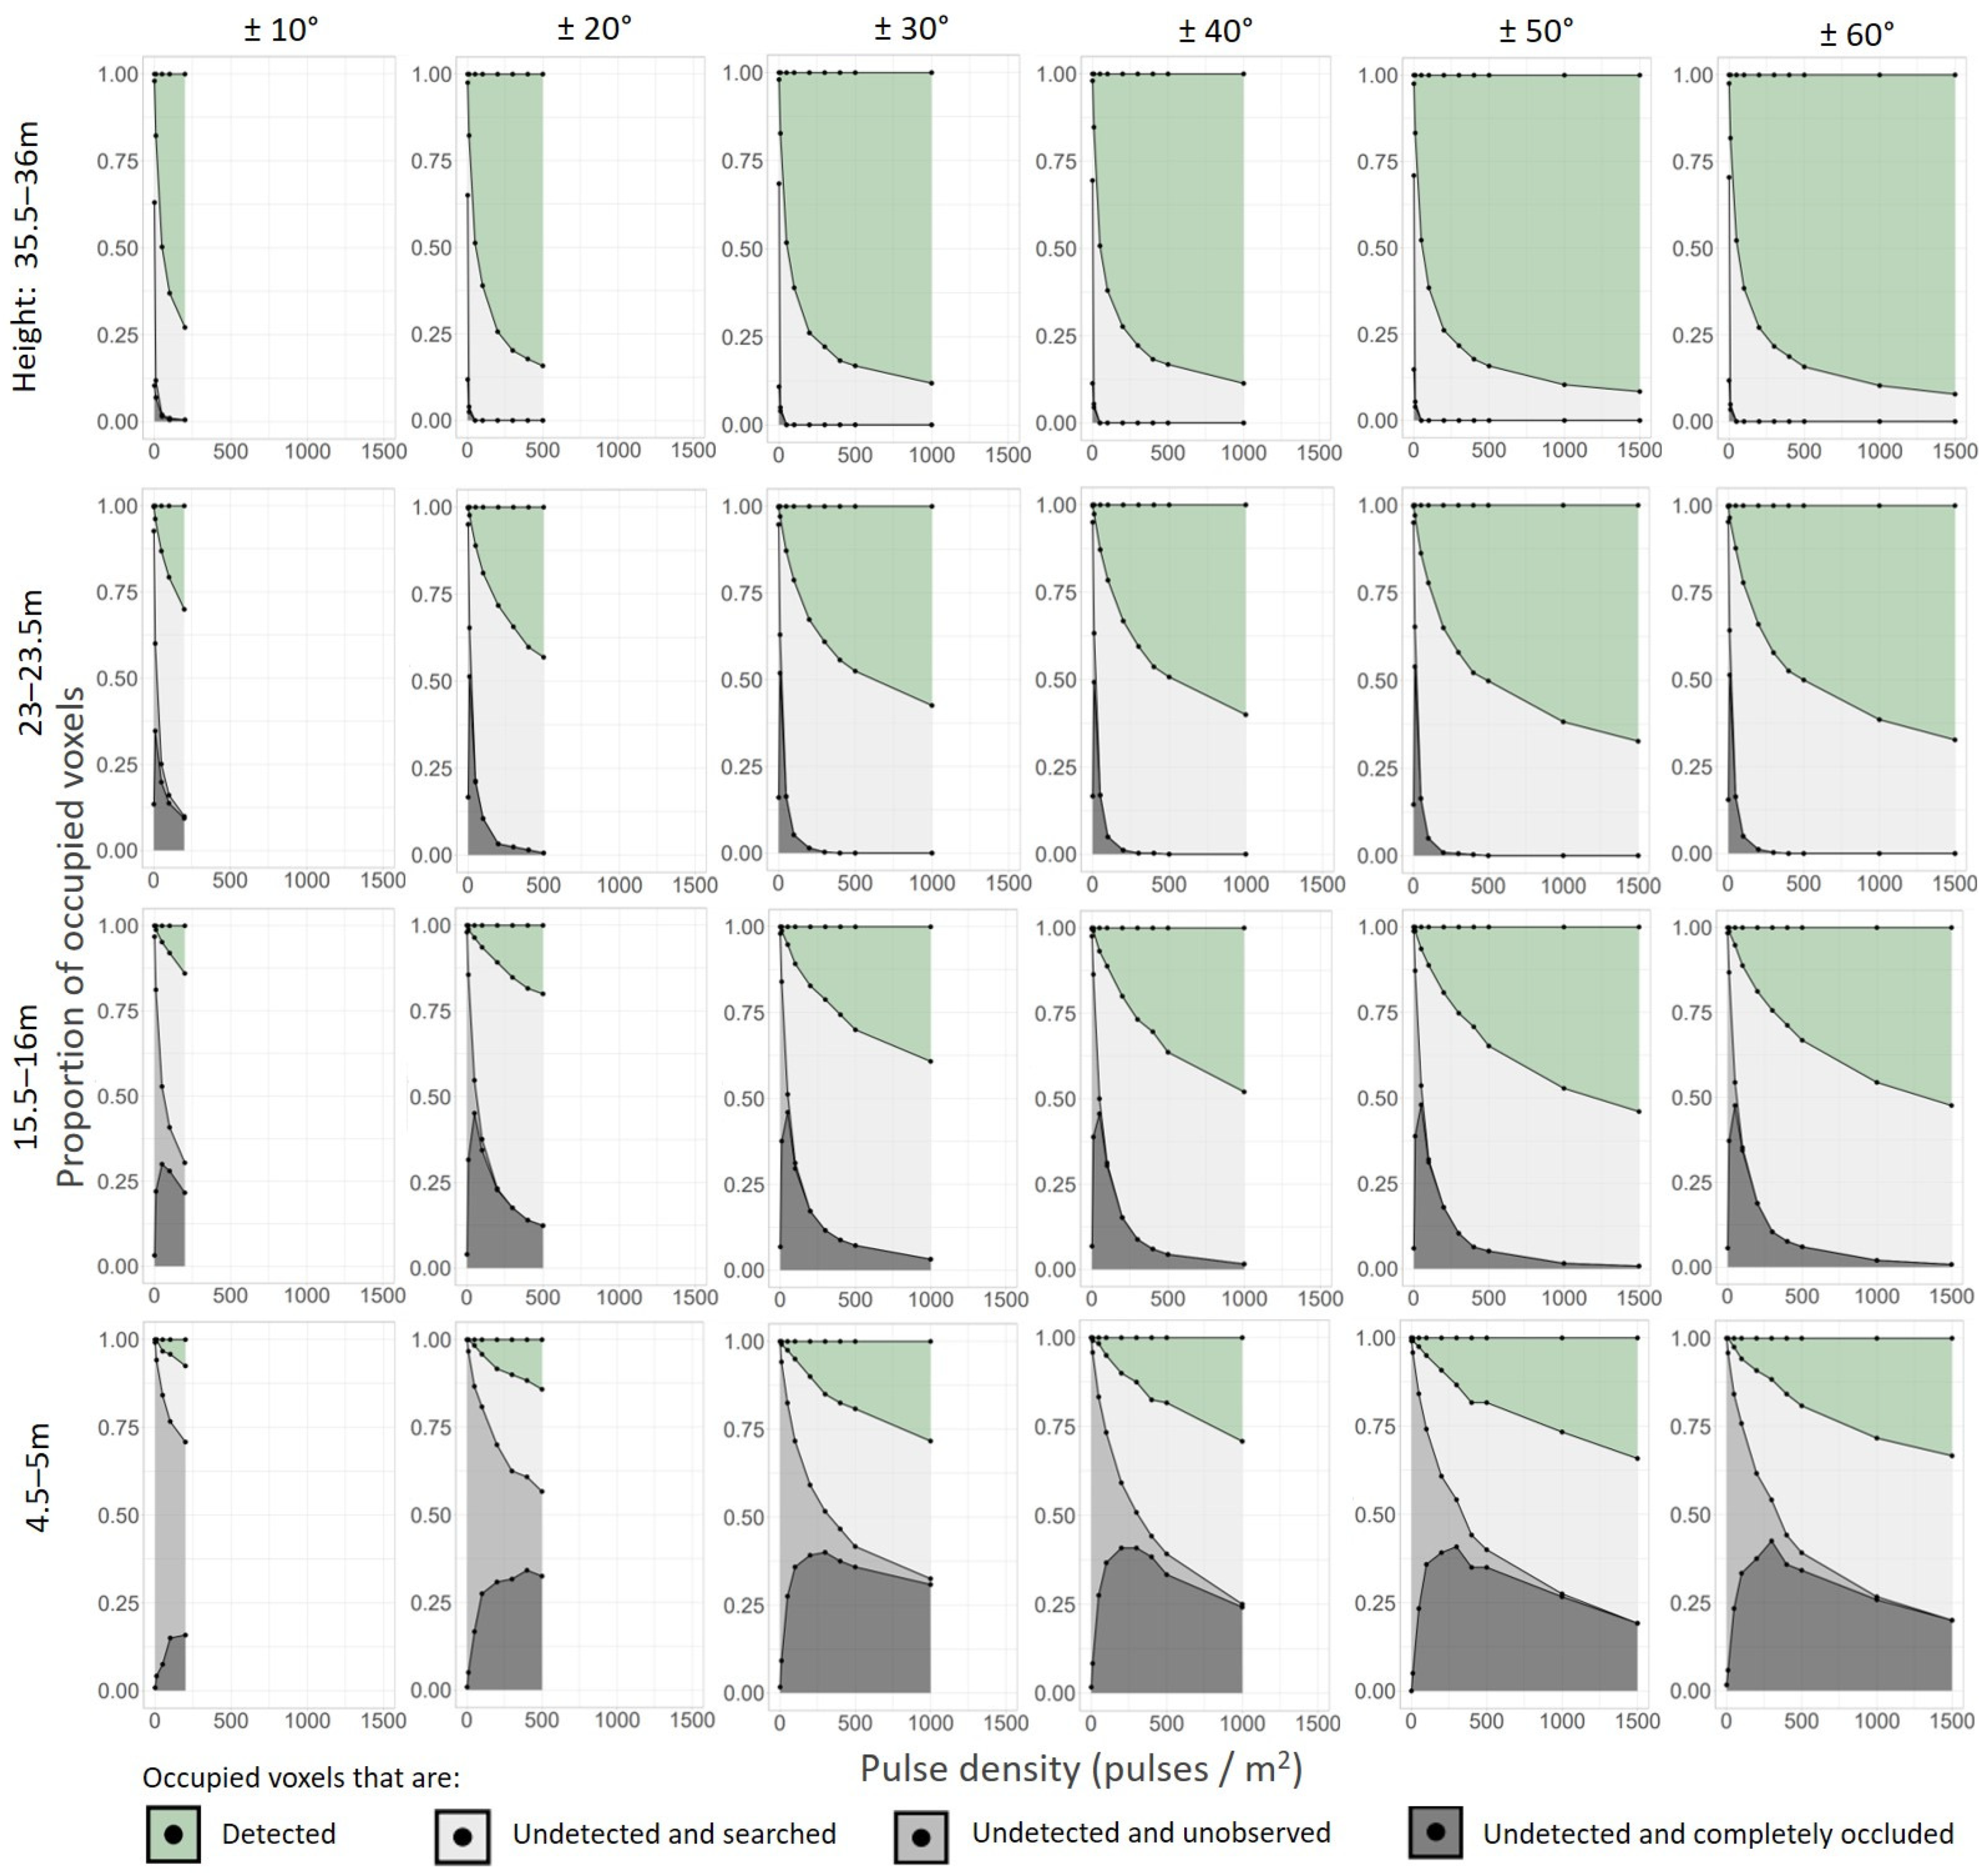
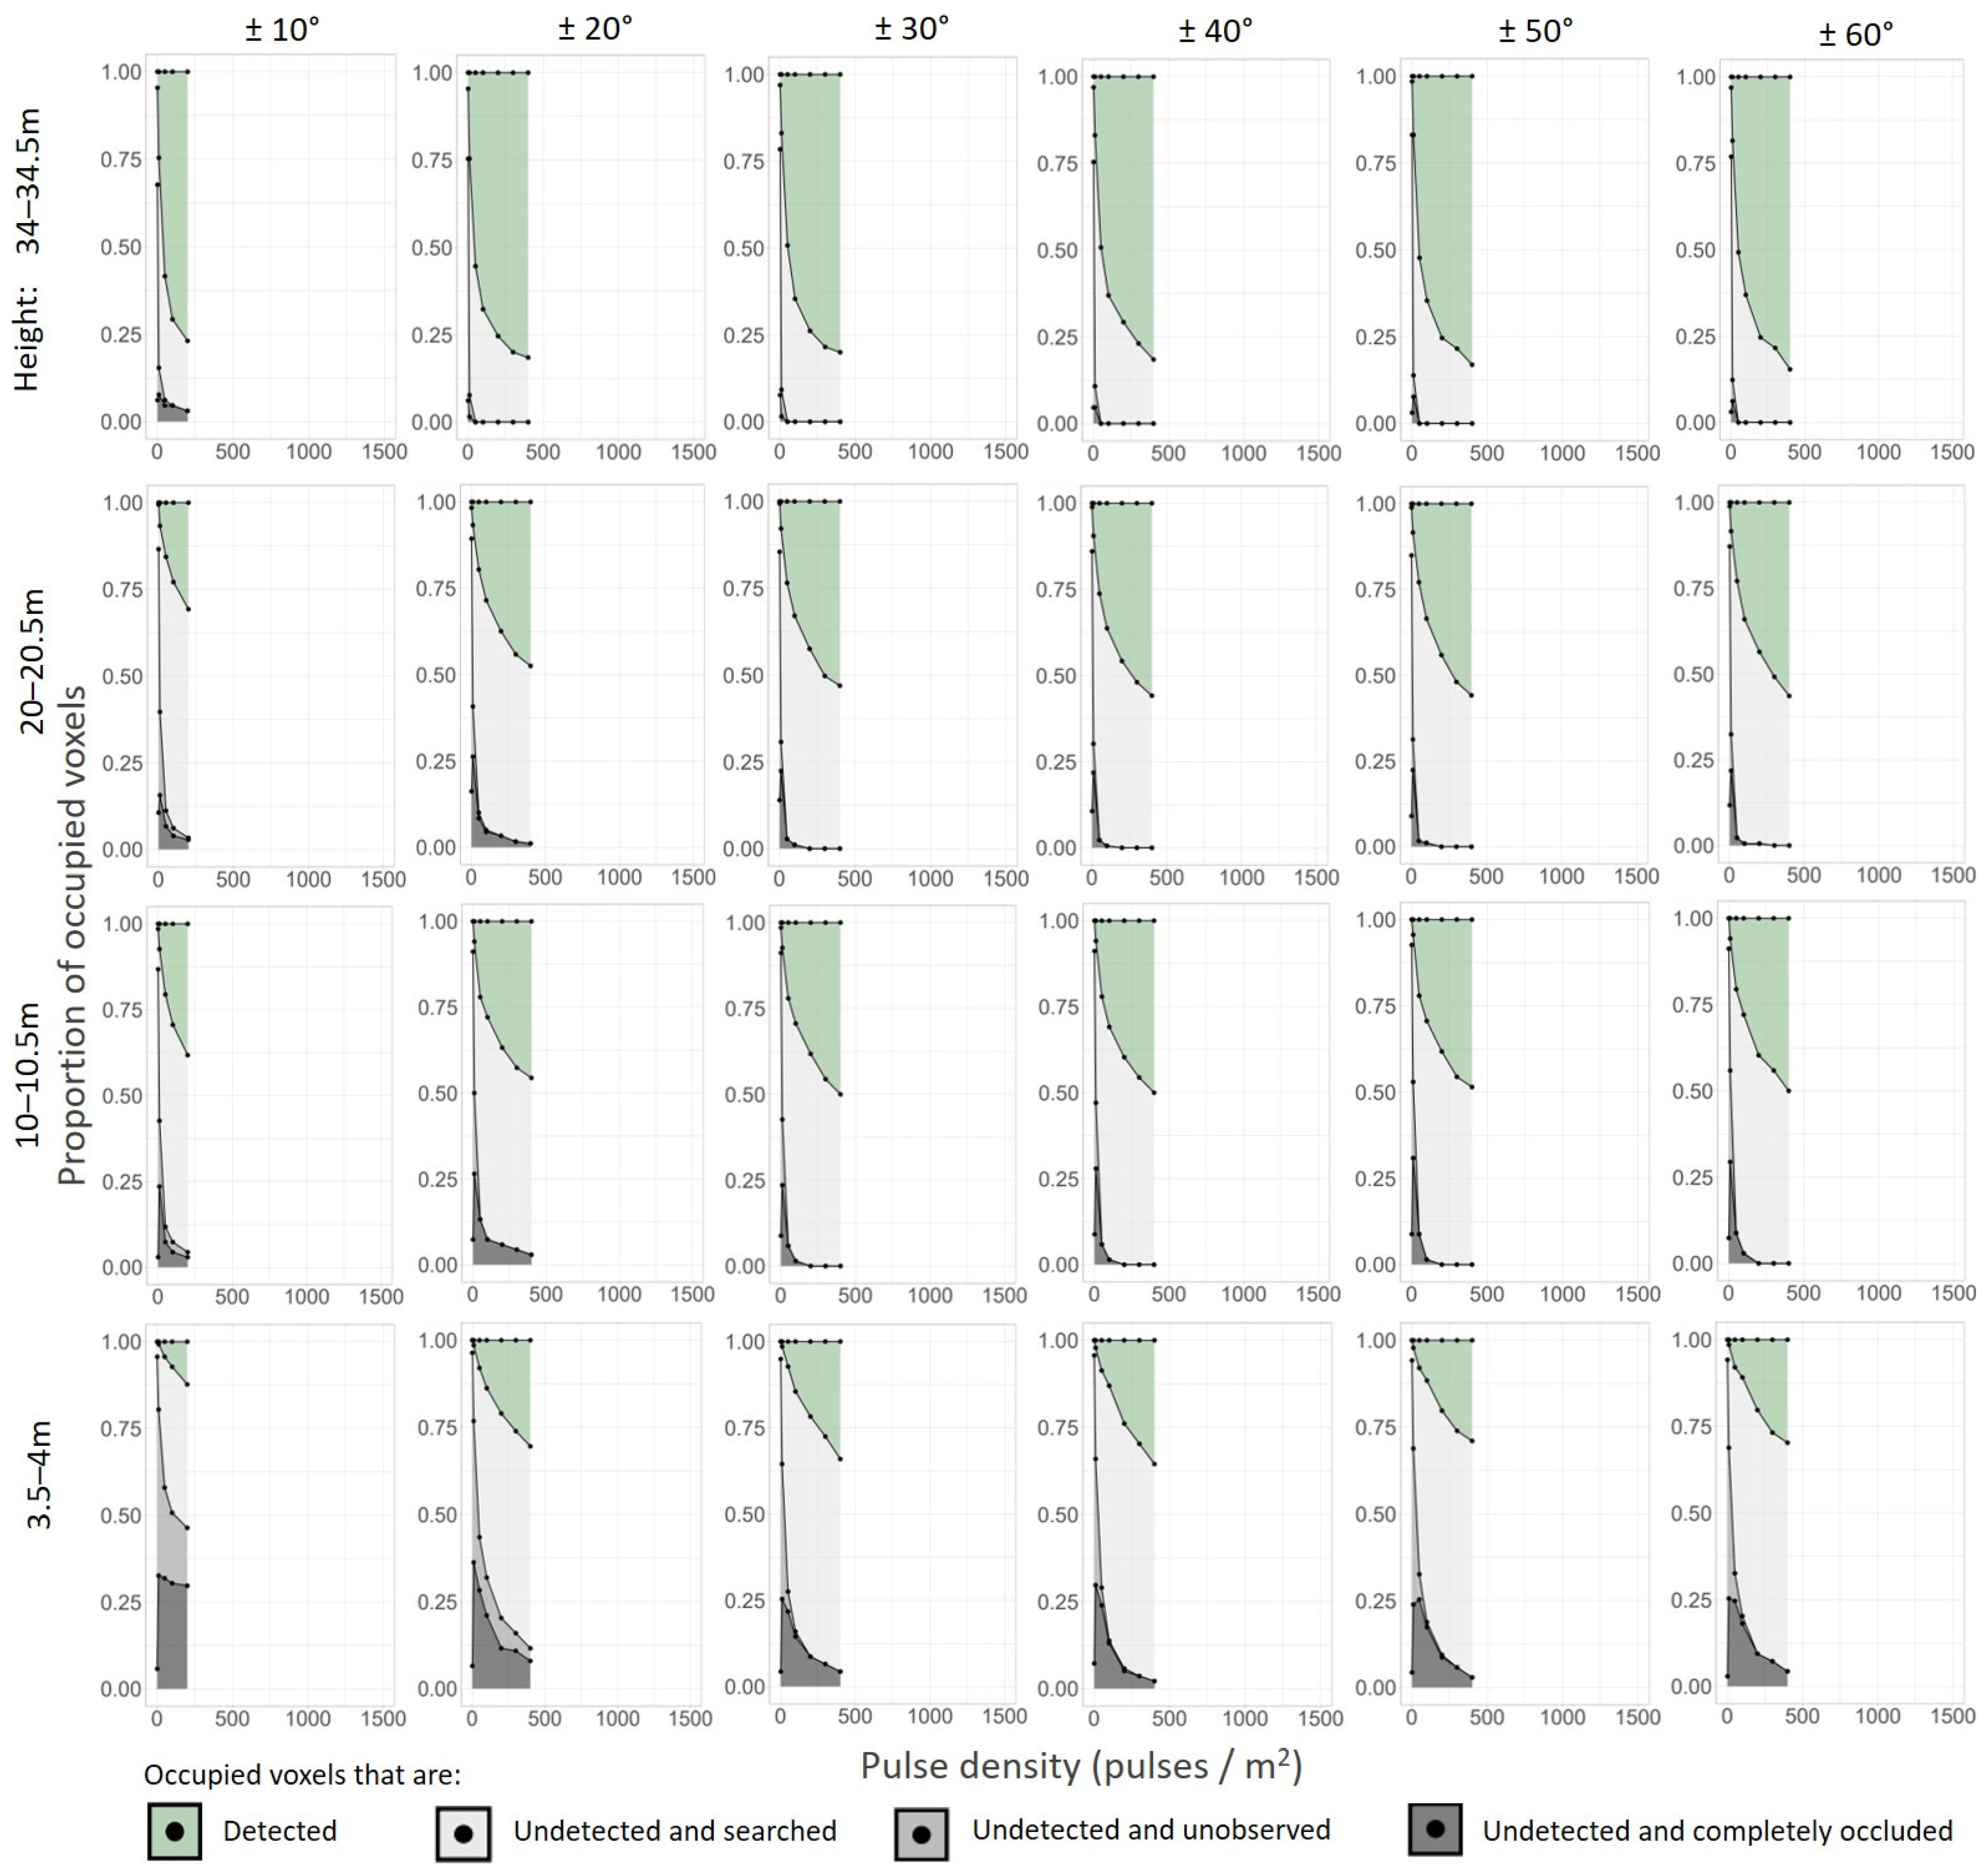
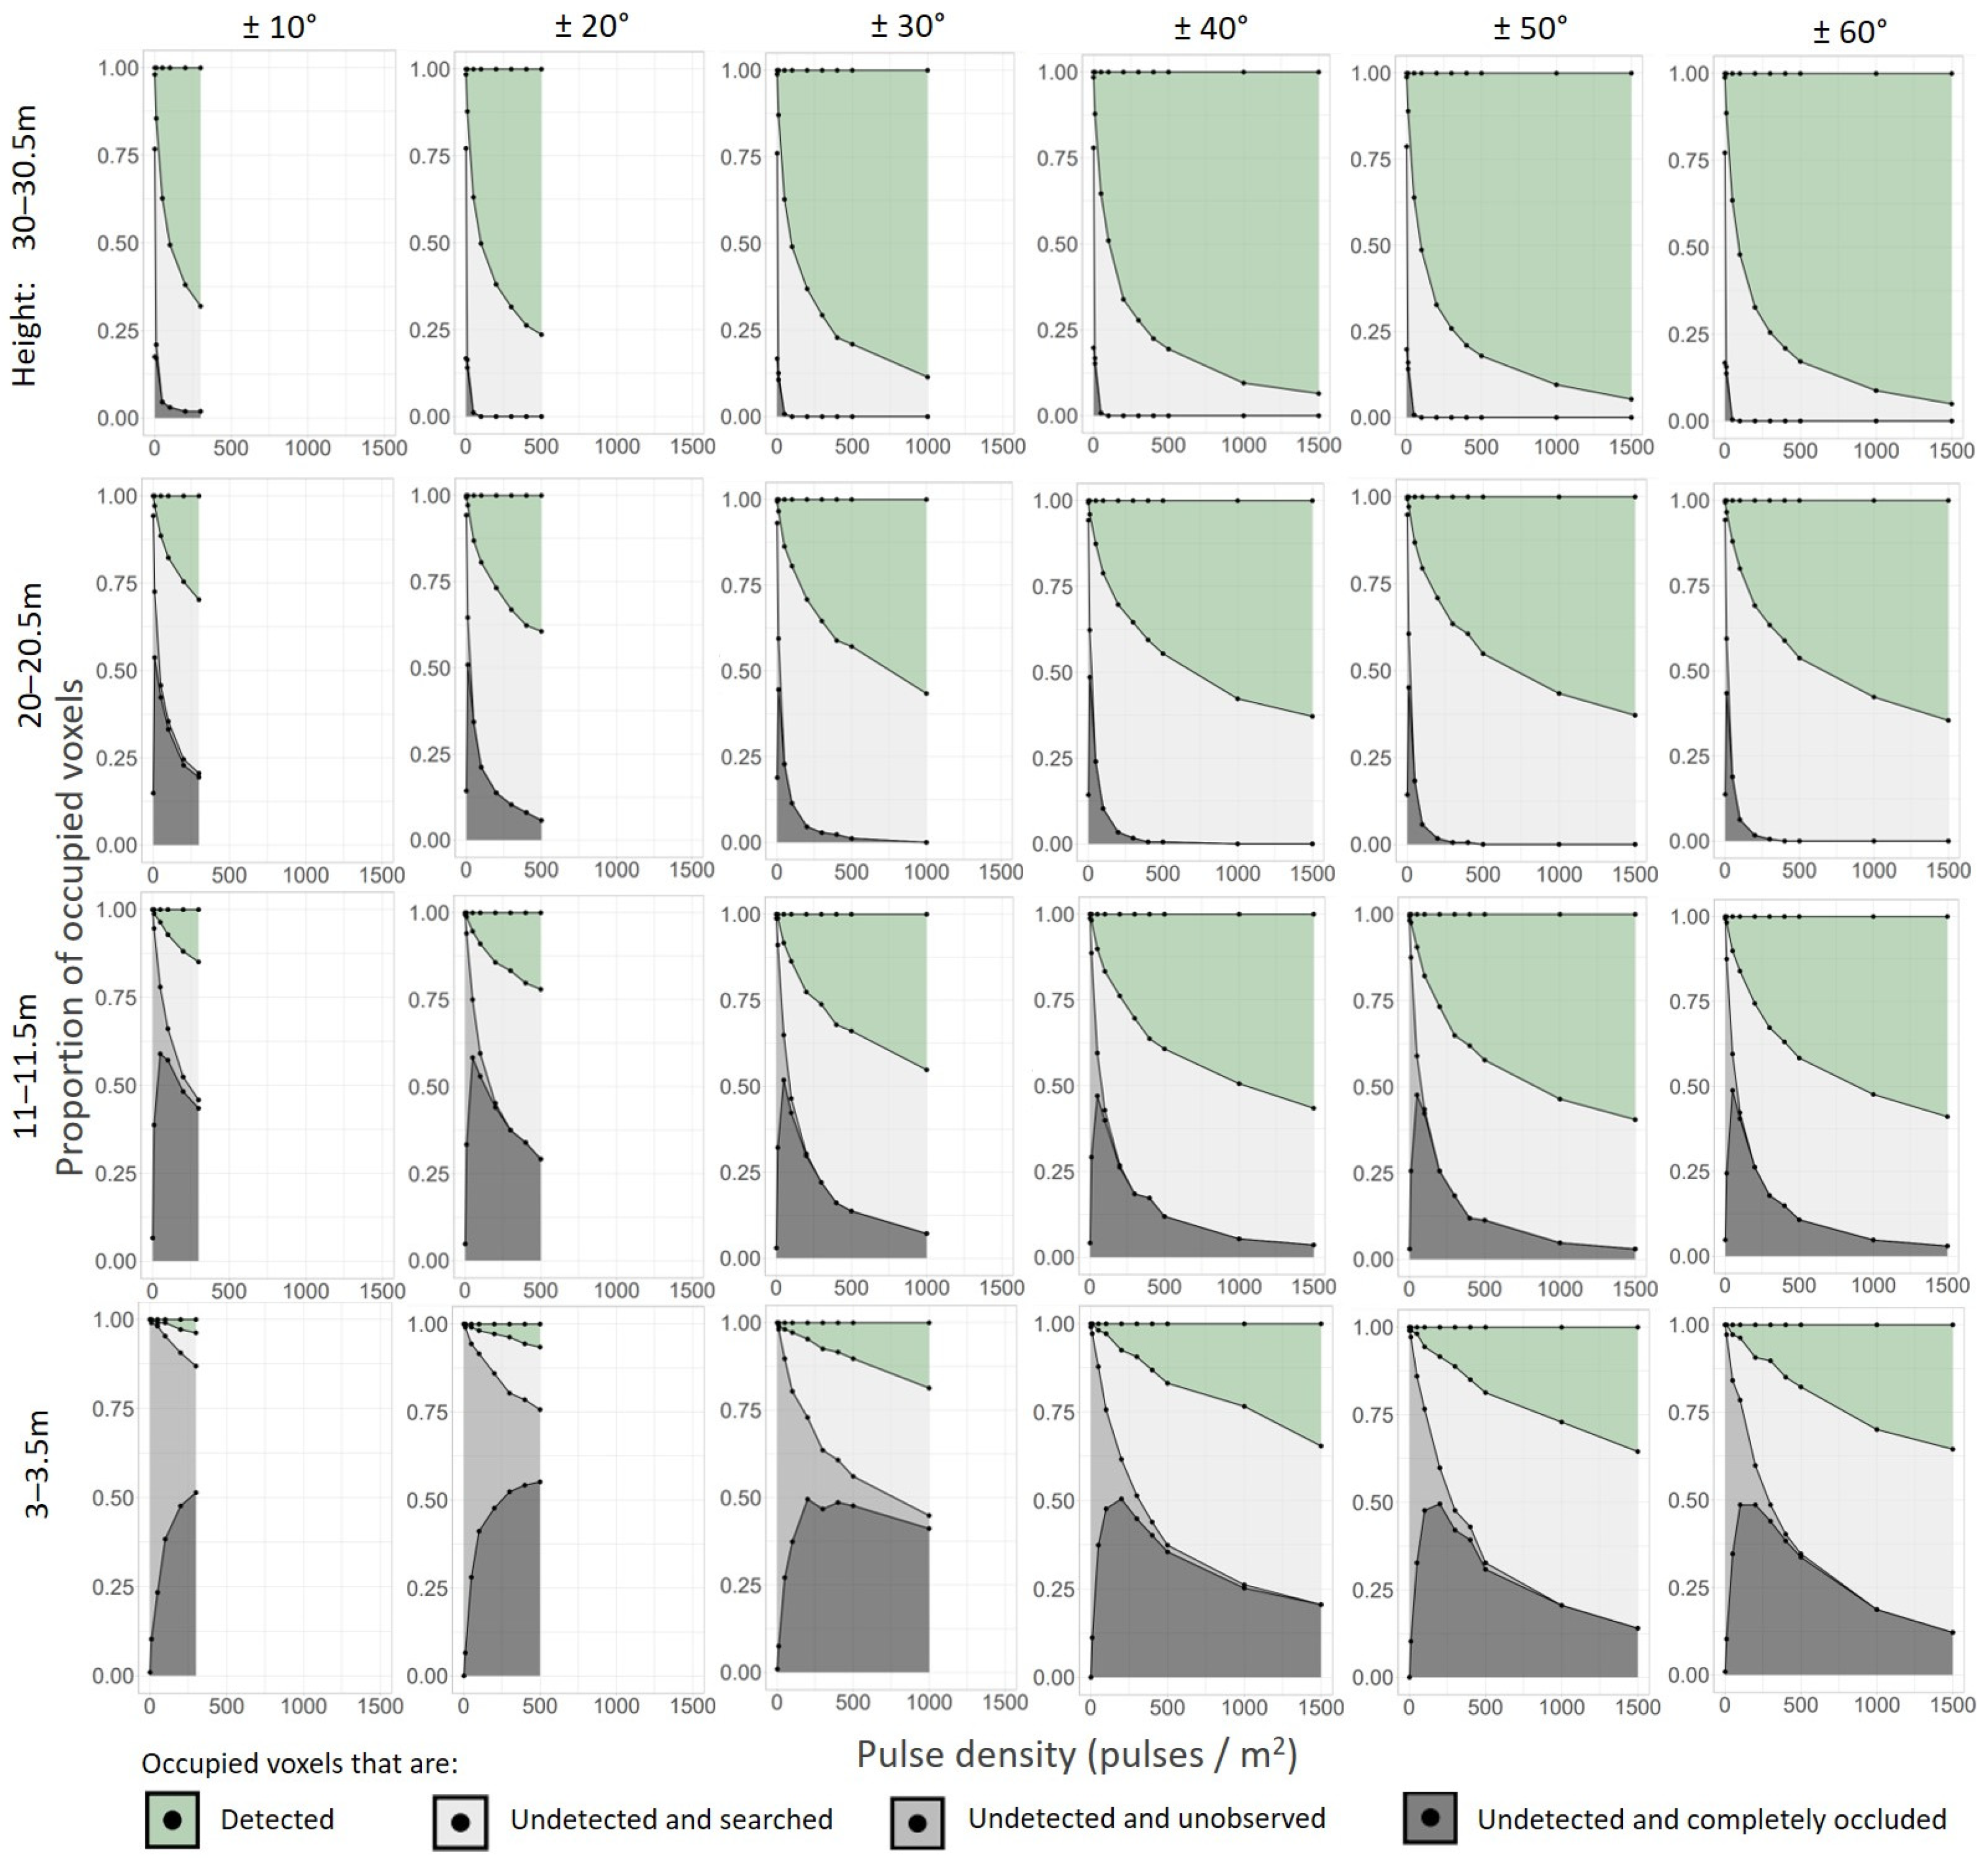
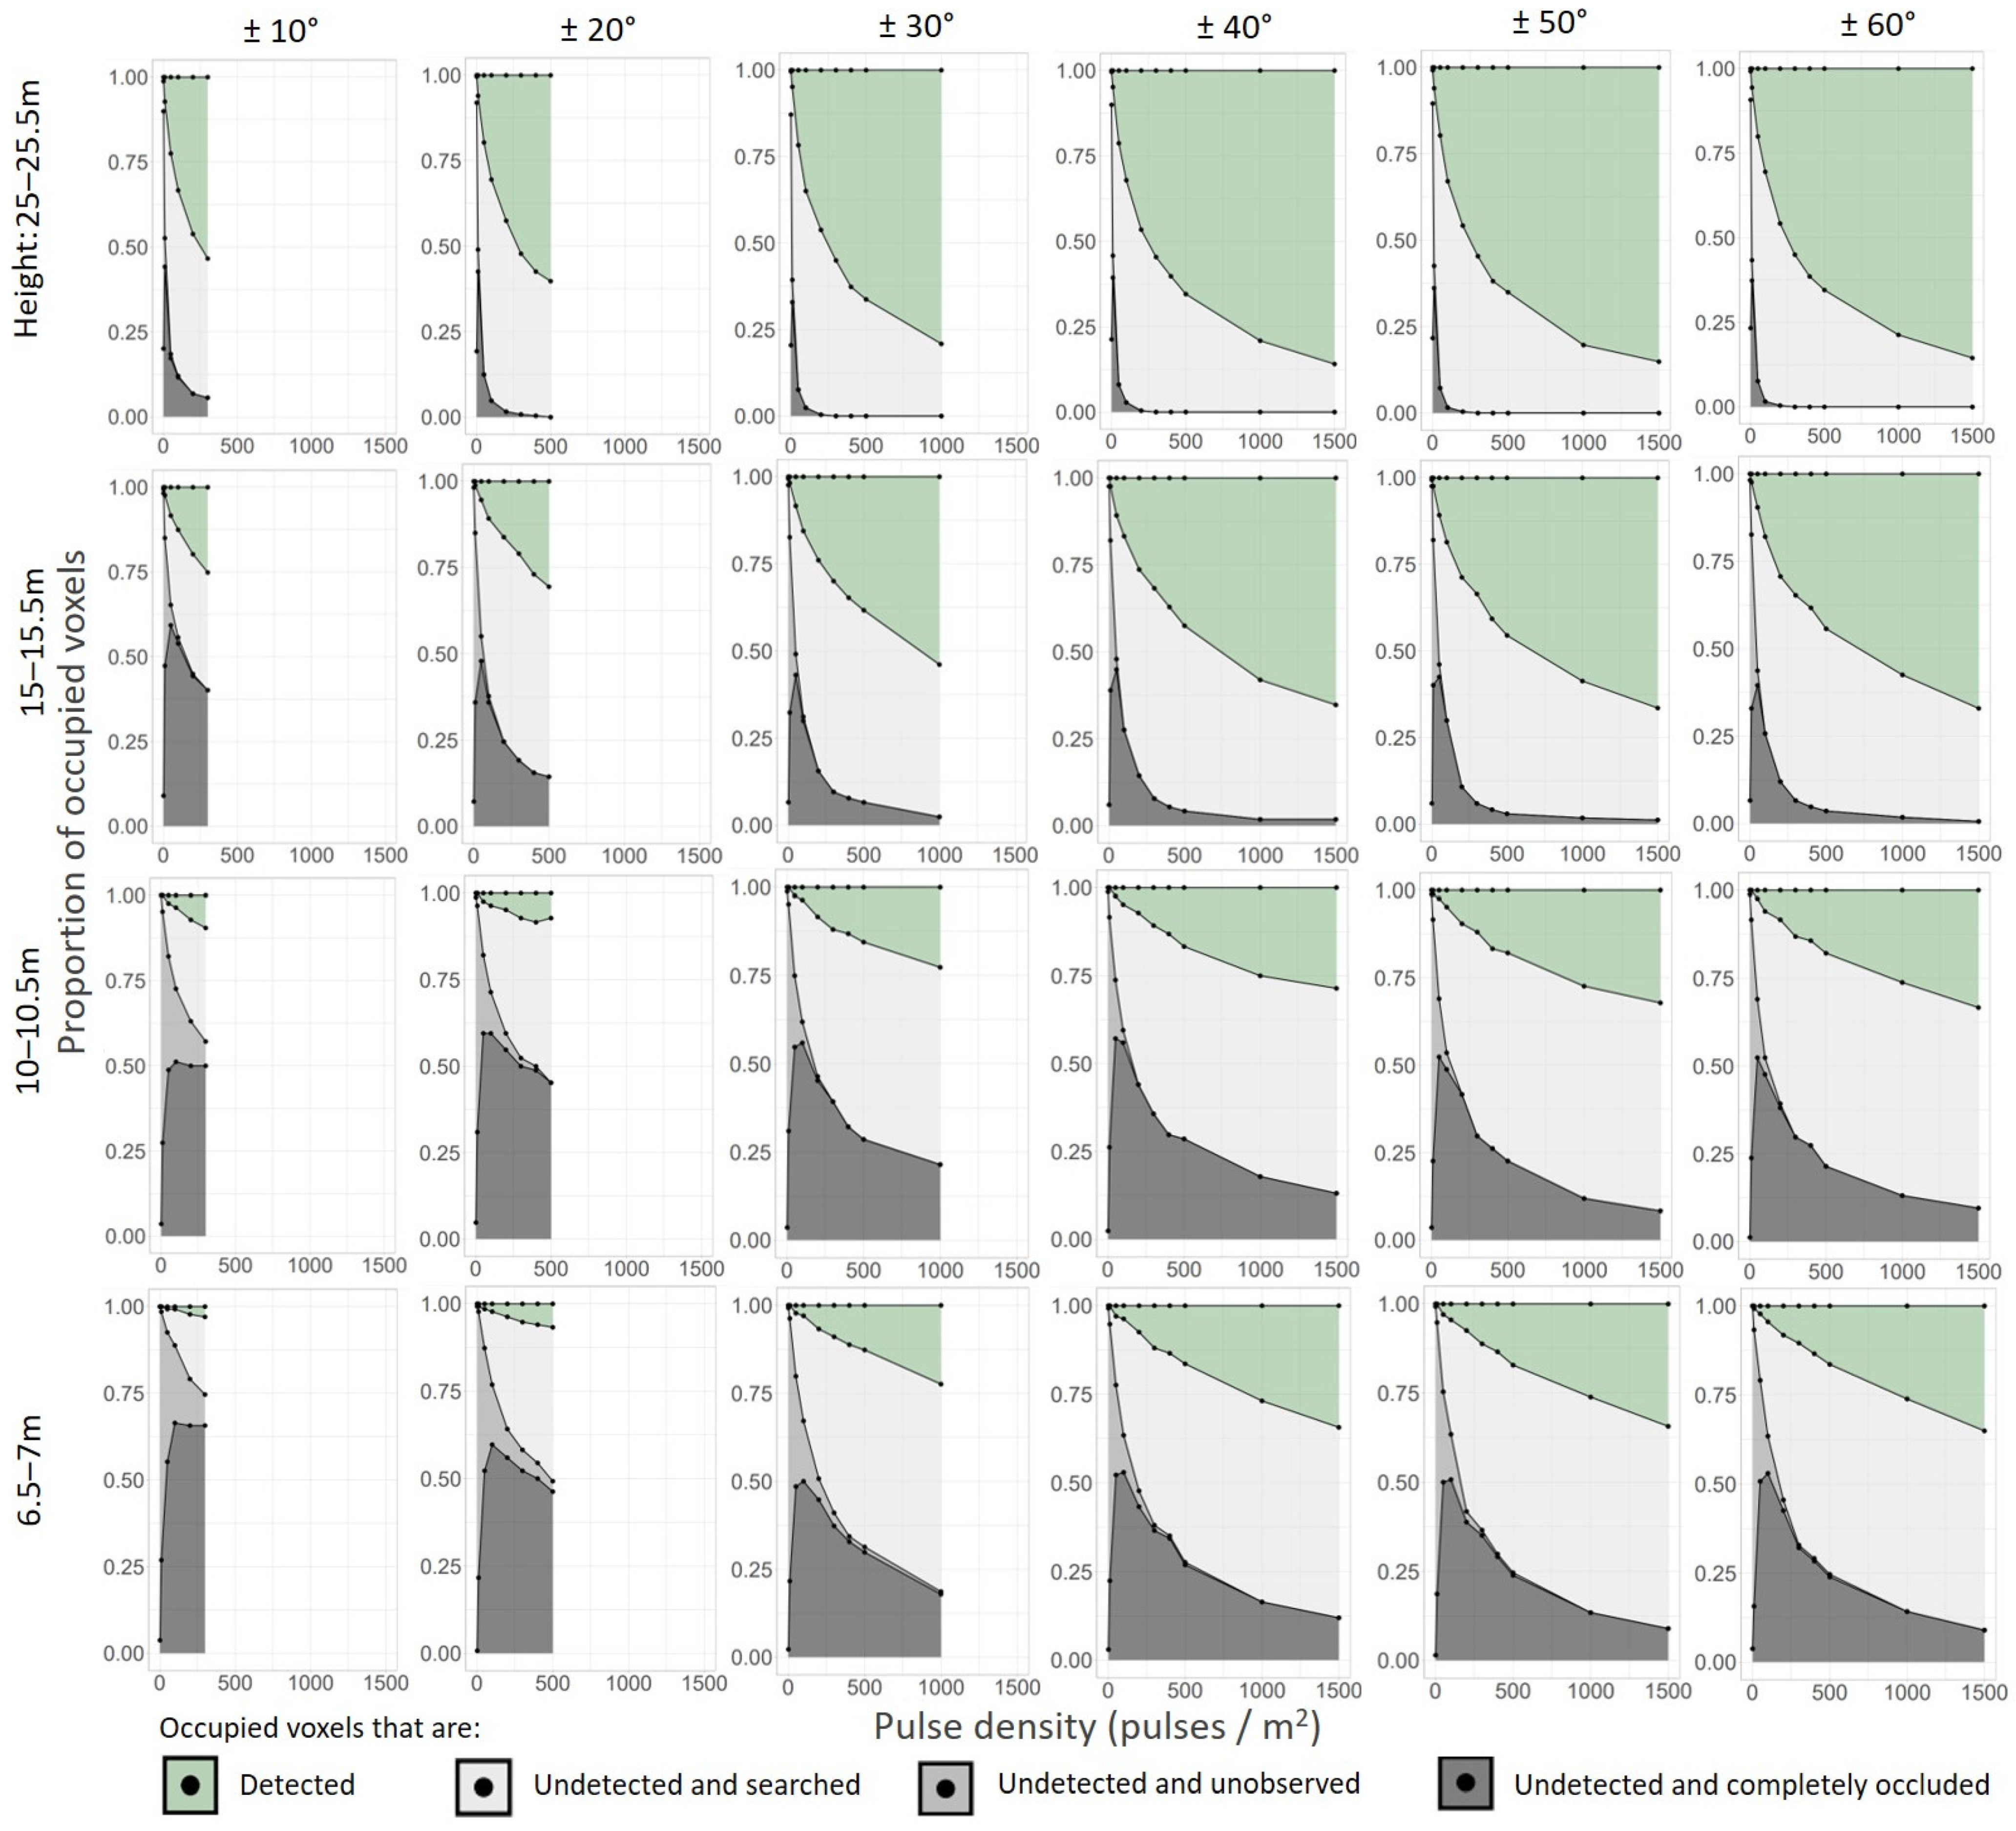
High-density drone lidar detected voxels throughout the canopy height profile. There was a greater likelihood of detection near the top of the canopy (Figure 7 and Figure 8). For example, at 30–30.5 m above ground, 91.3% of occupied voxels were detected when the pulse density was 1000 pulses / m2 and the scan-angle range was ±60°. These percentages decreased to 57.7%, 52.4%, and 29.9% at 20–20.5 m, 11–11.5 m, and 3–3.5 m above ground, respectively (Figure 7). In general, almost no voxels were undetected and completely occluded near the top of the canopy. Both types of undetected and unsearched voxels (i.e., undetected and unobserved voxels and undetected and completely occluded voxels) were more common at lower heights and at narrower scan-angle ranges. For example, in the upper canopy (30–30.5 m in Figure 7), there were no undetected and completely occluded voxels and all voxels were searched when the scan-angle range exceeded ±20° and the pulse density was greater than 100 pulses/m2. At 10–11.5 m above ground, some voxels were consistently occluded, regardless of the scan-angle range and the pulse density (Figure 7 and Figure 8).
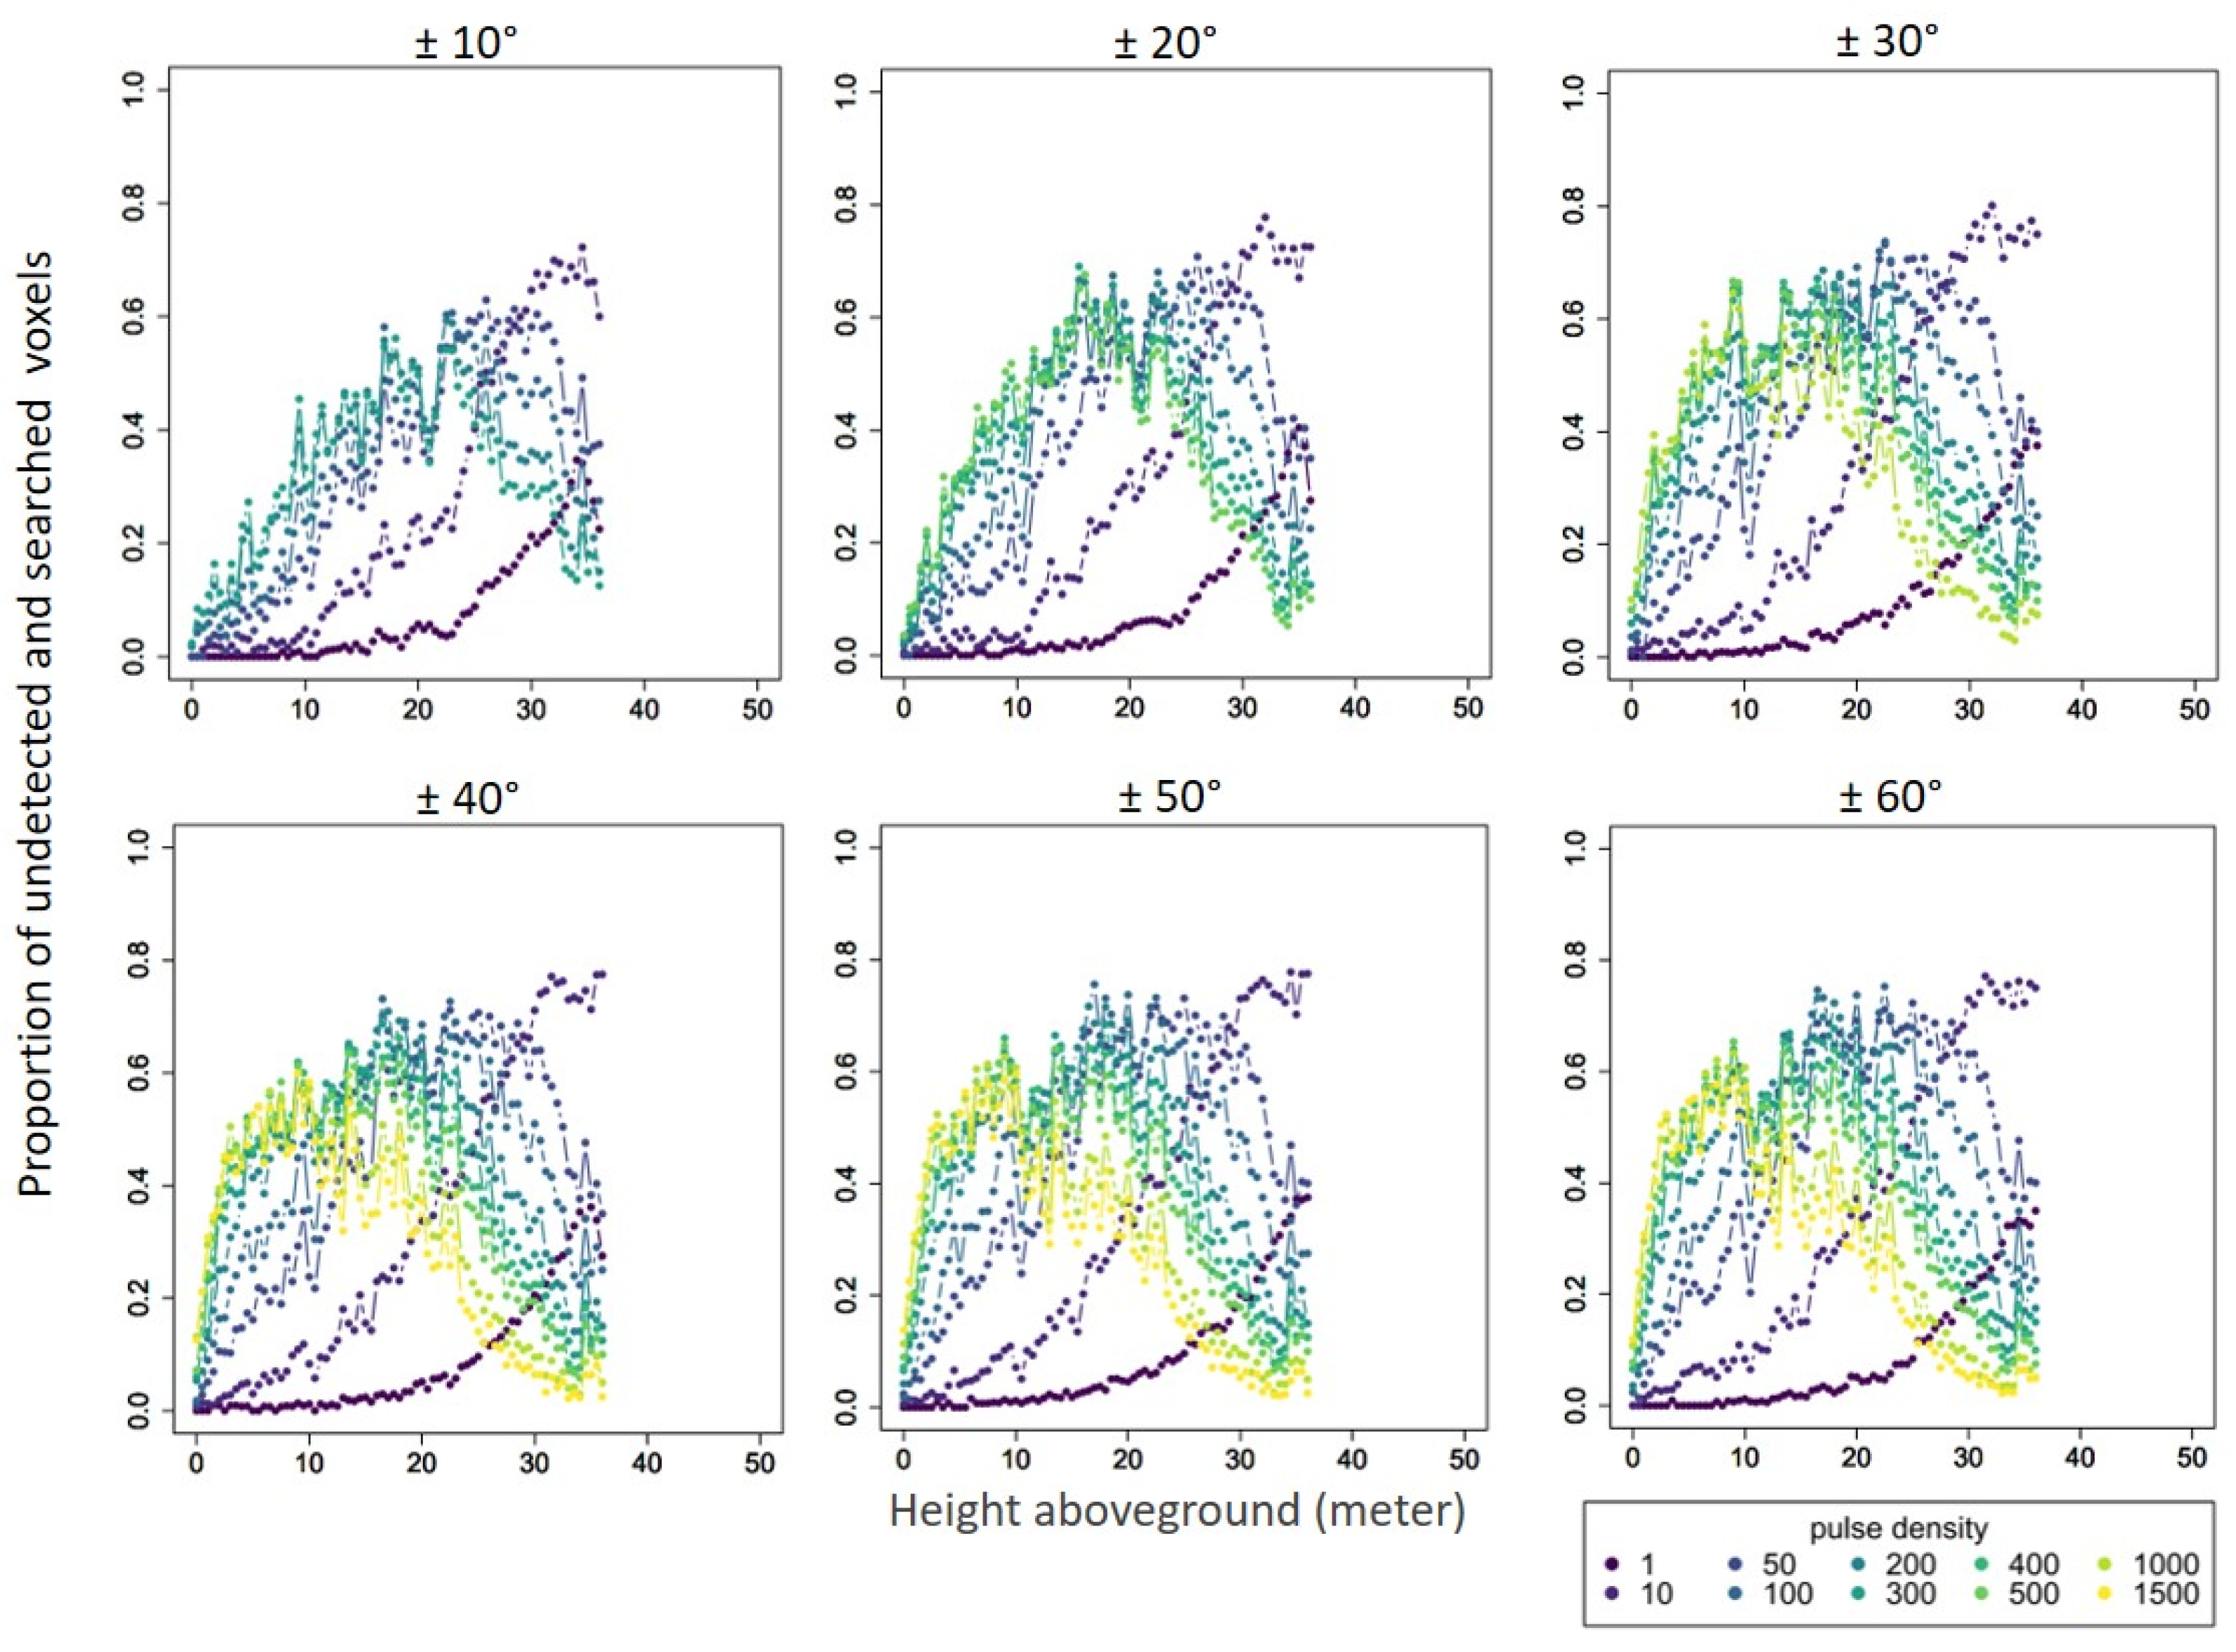
At different heights, the proportion of undetected voxels varied with pulse densities and scan-angle ranges differently (Figure 7). For example, undetected and unobserved voxels decreased as the pulse density increased at both lower and higher heights. However, undetected and searched voxels increased with pulse density at lower heights (e.g., scan-angle range ±20°, heights 3–3.5 m, Figure 7 and Figure 9) and decreased with pulse density at higher heights (e.g., scan-angle range ±20°, heights 30–30.5 m, Figure 7 and Figure 9). At lower heights (Figure 7: 3–3.5 m, 11–11.5 m), undetected and completely occluded voxels first increased then decreased as the pulse density increased at most scan-angle ranges, while at higher heights they decreased with increasing pulse density (Figure 10).
The types of undetected voxels that were mainly responsible for unsampled forest structure changed with pulse density and height above ground. Closer to the ground (3–3.5 m and 11–11.5 m in Figure 7), undetected voxels were mostly completely occluded. As pulse density increased, undetected voxels were more likely to have been searched but undetected. For example, at 11–11.5 m above ground, when the pulse density was 100 pulses/m2 and the scan-angle range was ±10°, 66% of the occupied voxels were undetected and unsearched (8.9% were undetected and unobserved, and 57.1% were undetected and completely occluded), 26.8% were undetected and searched, and the detected voxels accounted for 7.2%. At the same height, when the pulse density was 1500 pulses/m2 and the scan-angle range was ±60°, the proportion of undetected and searched voxels increased to 38.1%. Closer to the canopy (20–20.5 m and 30–30.5 m in Figure 7), the proportion of undetected and searched voxels was greater than that of undetected and completely occluded voxels at most of the pulse densities examined. There were undetected and searched voxels even at a high pulse density of 1500 pulses/m2 (Figure 7).

4. Discussion

4.1. Sampling Completeness under Different Pulse Densities and Scan-Angle Ranges

Our study showed that the scan-angle range had a limited impact on sampling completeness after it was decoupled from pulse density (Figure 4). We quantified the impact of pulse density and scan-angle range on sampling completeness and found that sampling completeness was more sensitive to pulse density than to scan-angle range. Increasing the pulse density increased the percentage of occupied voxels that were detected among all pulse densities examined, but increasing the scan-angle range did not necessarily increase sampling completeness. Thus, pulse density is the main driver of sampling completeness in high-density lidar data, no matter how large the scan-angle range is.
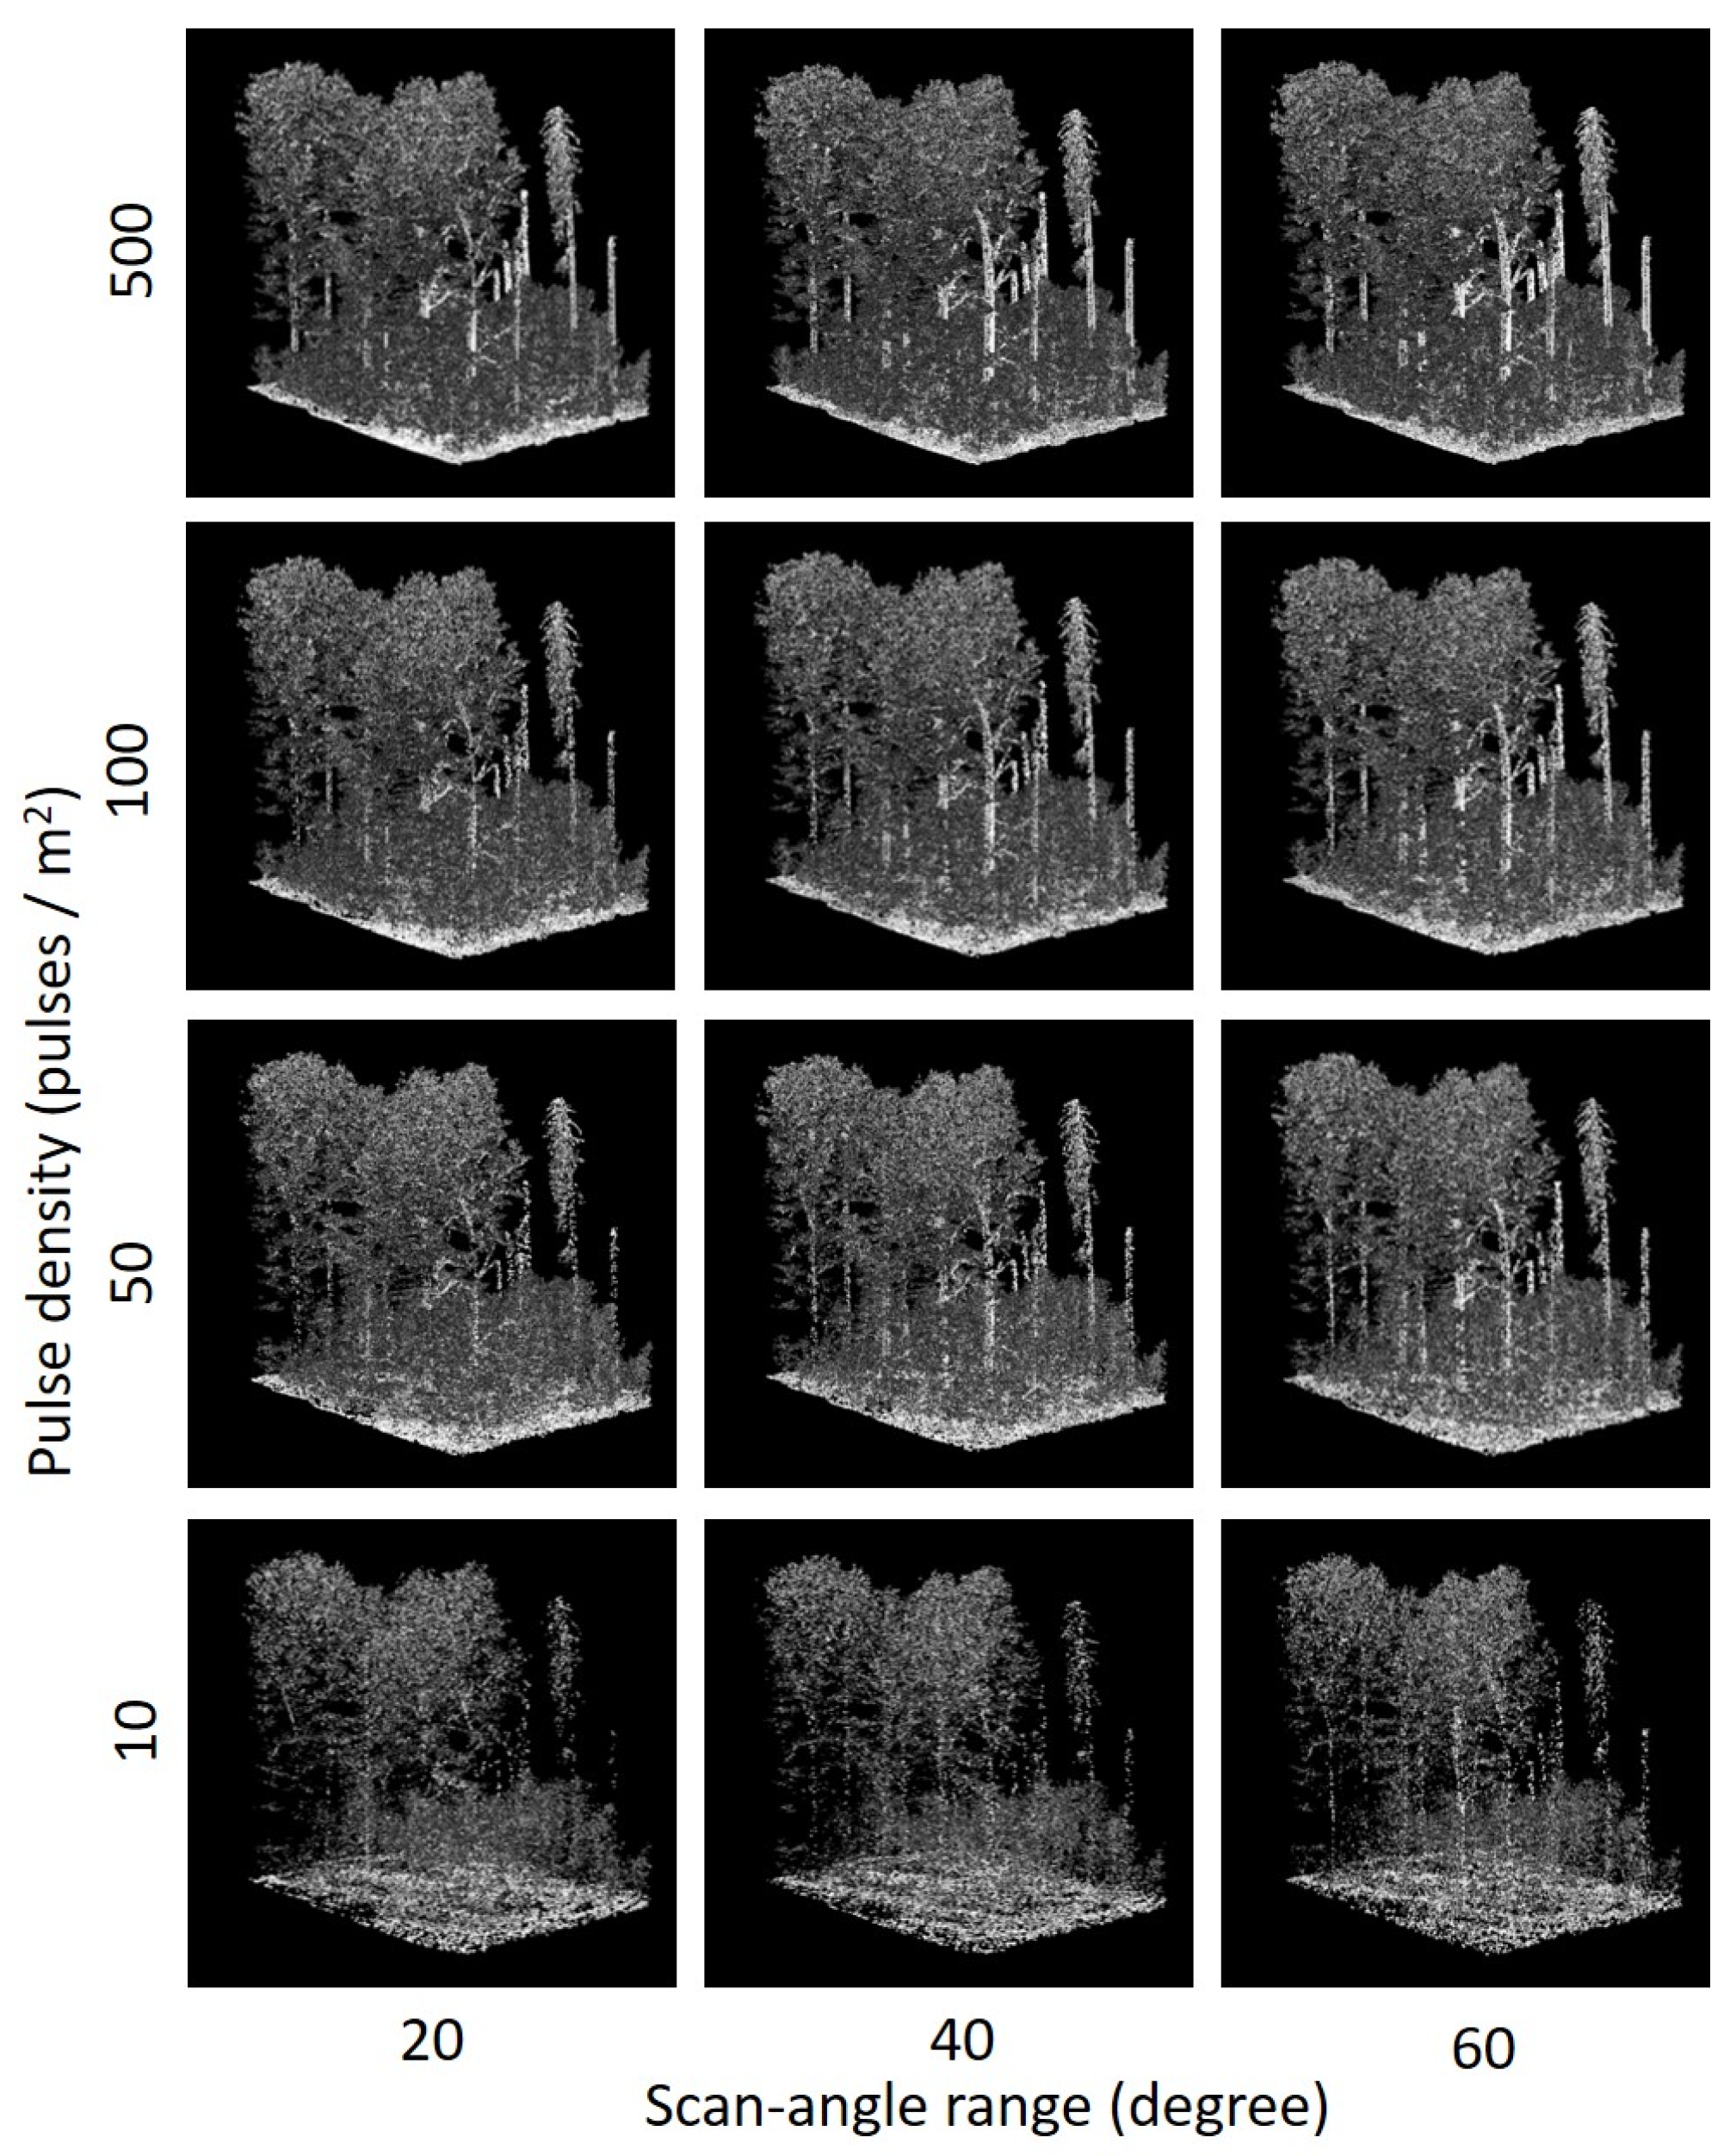
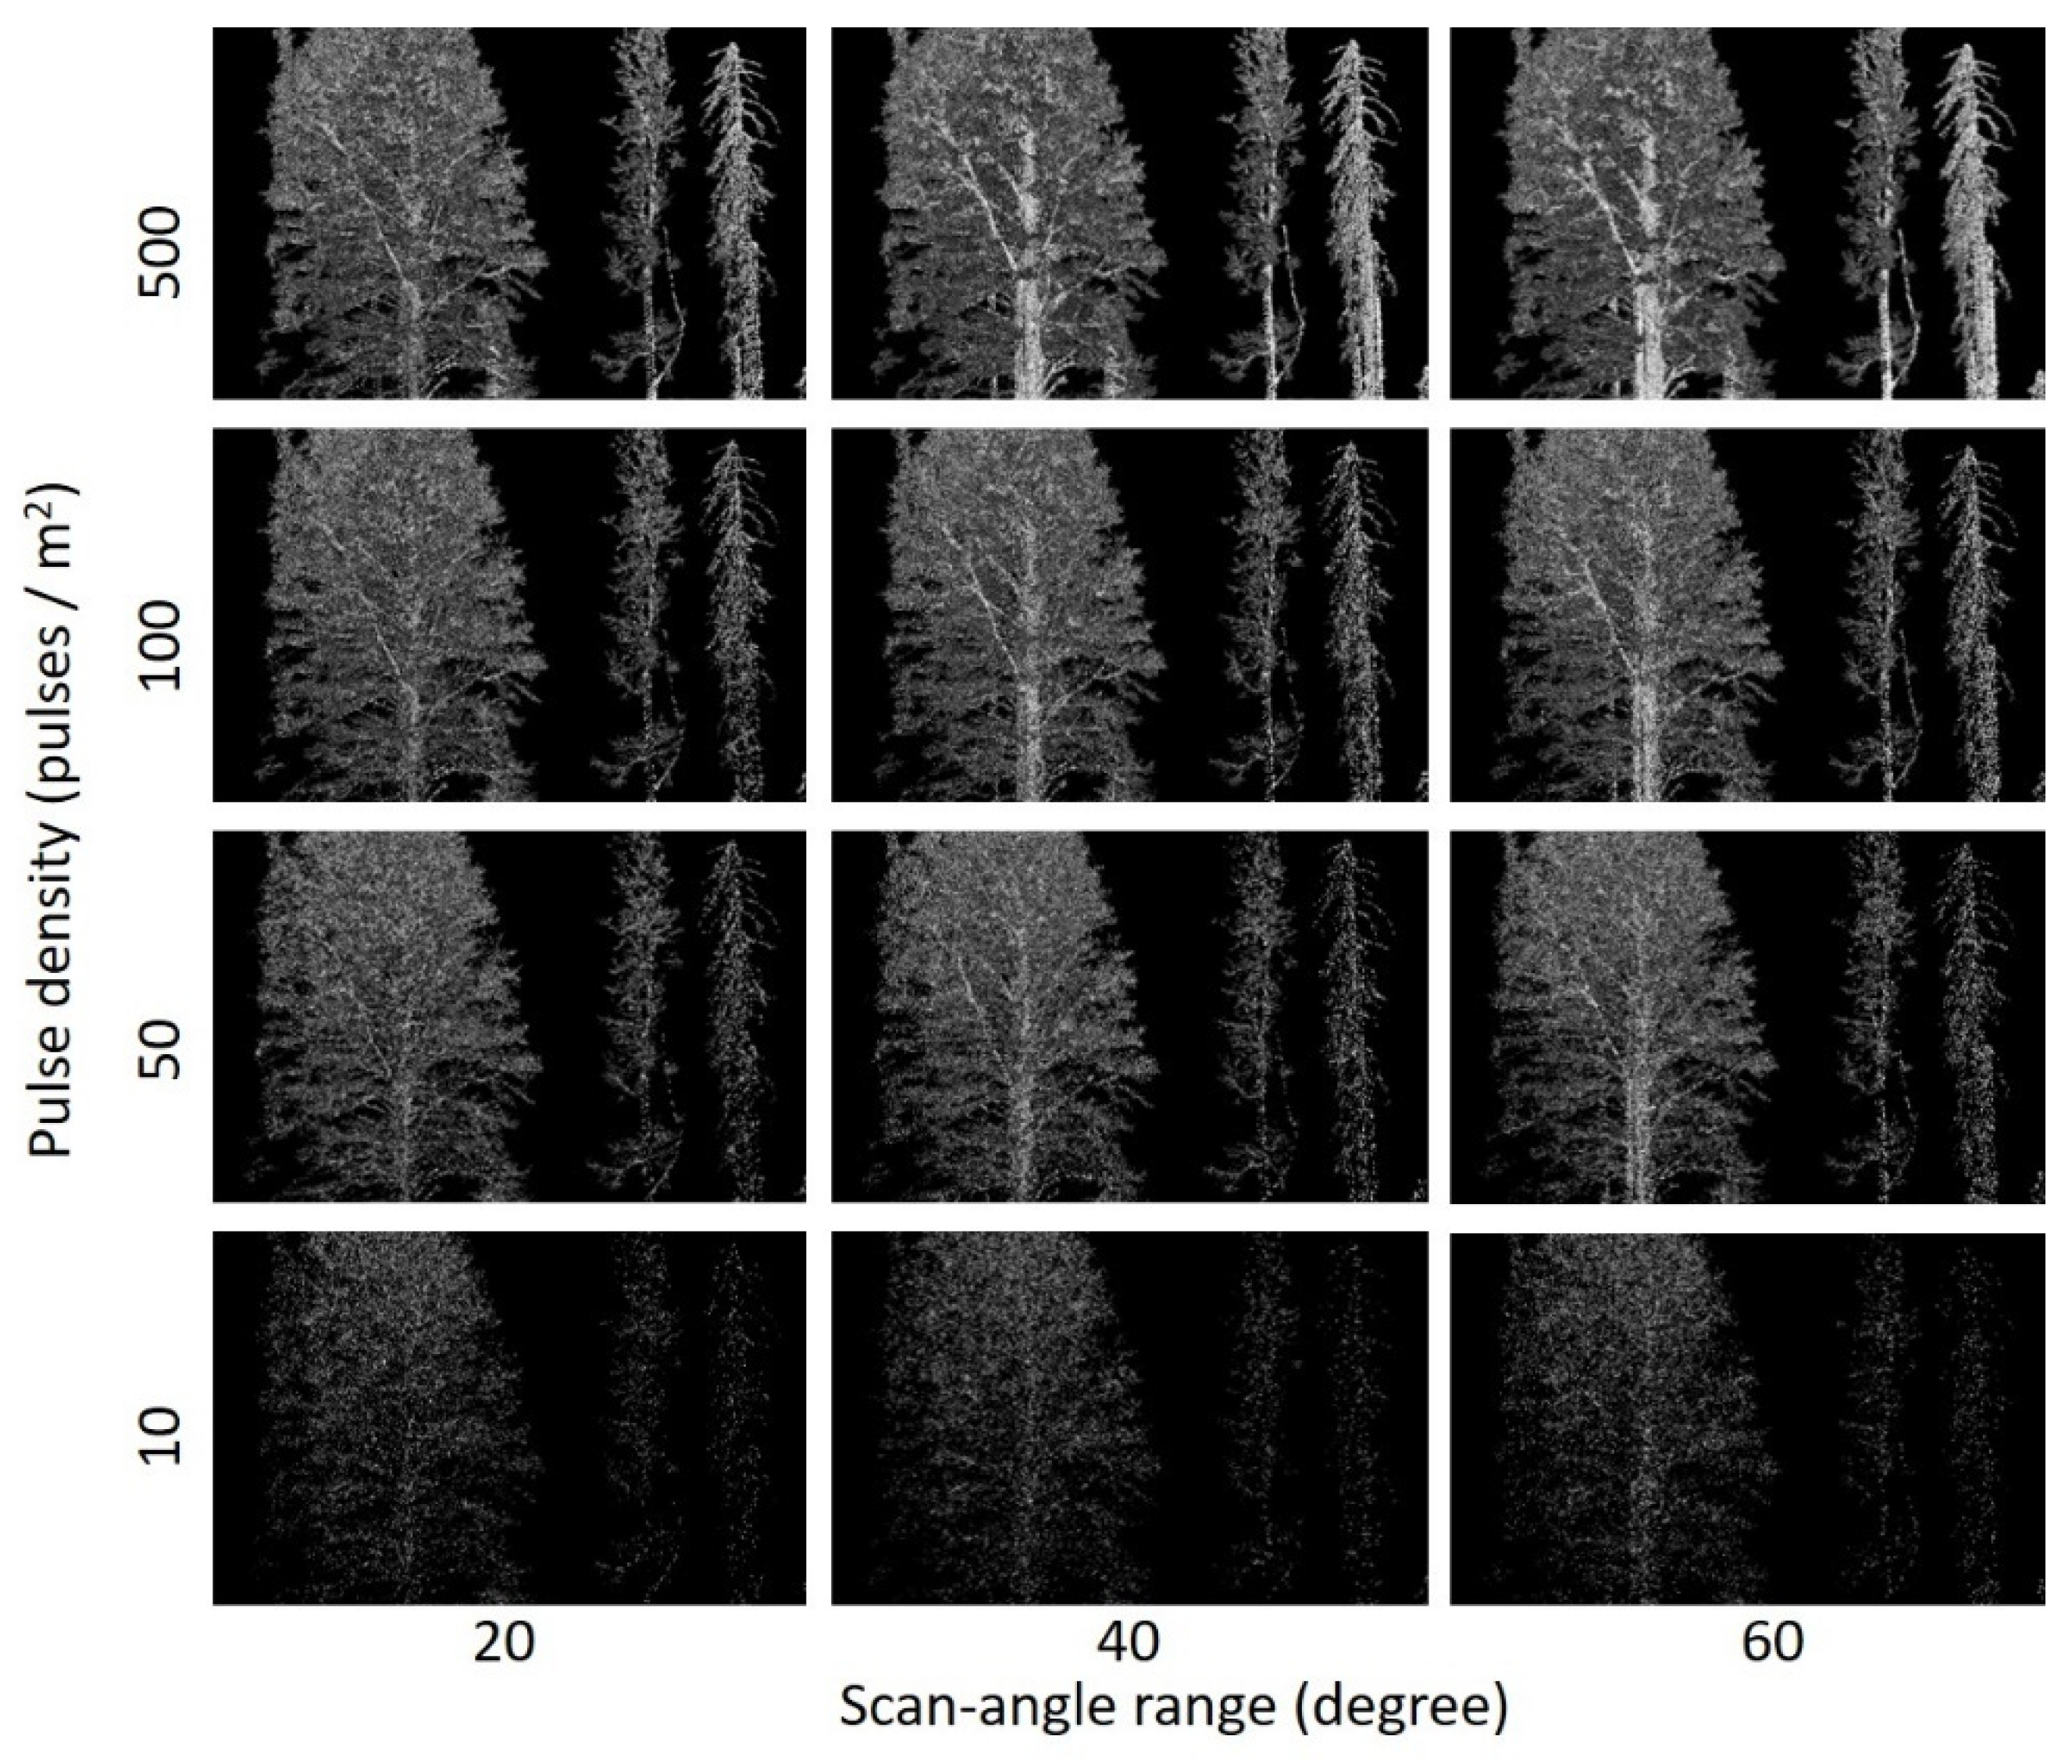
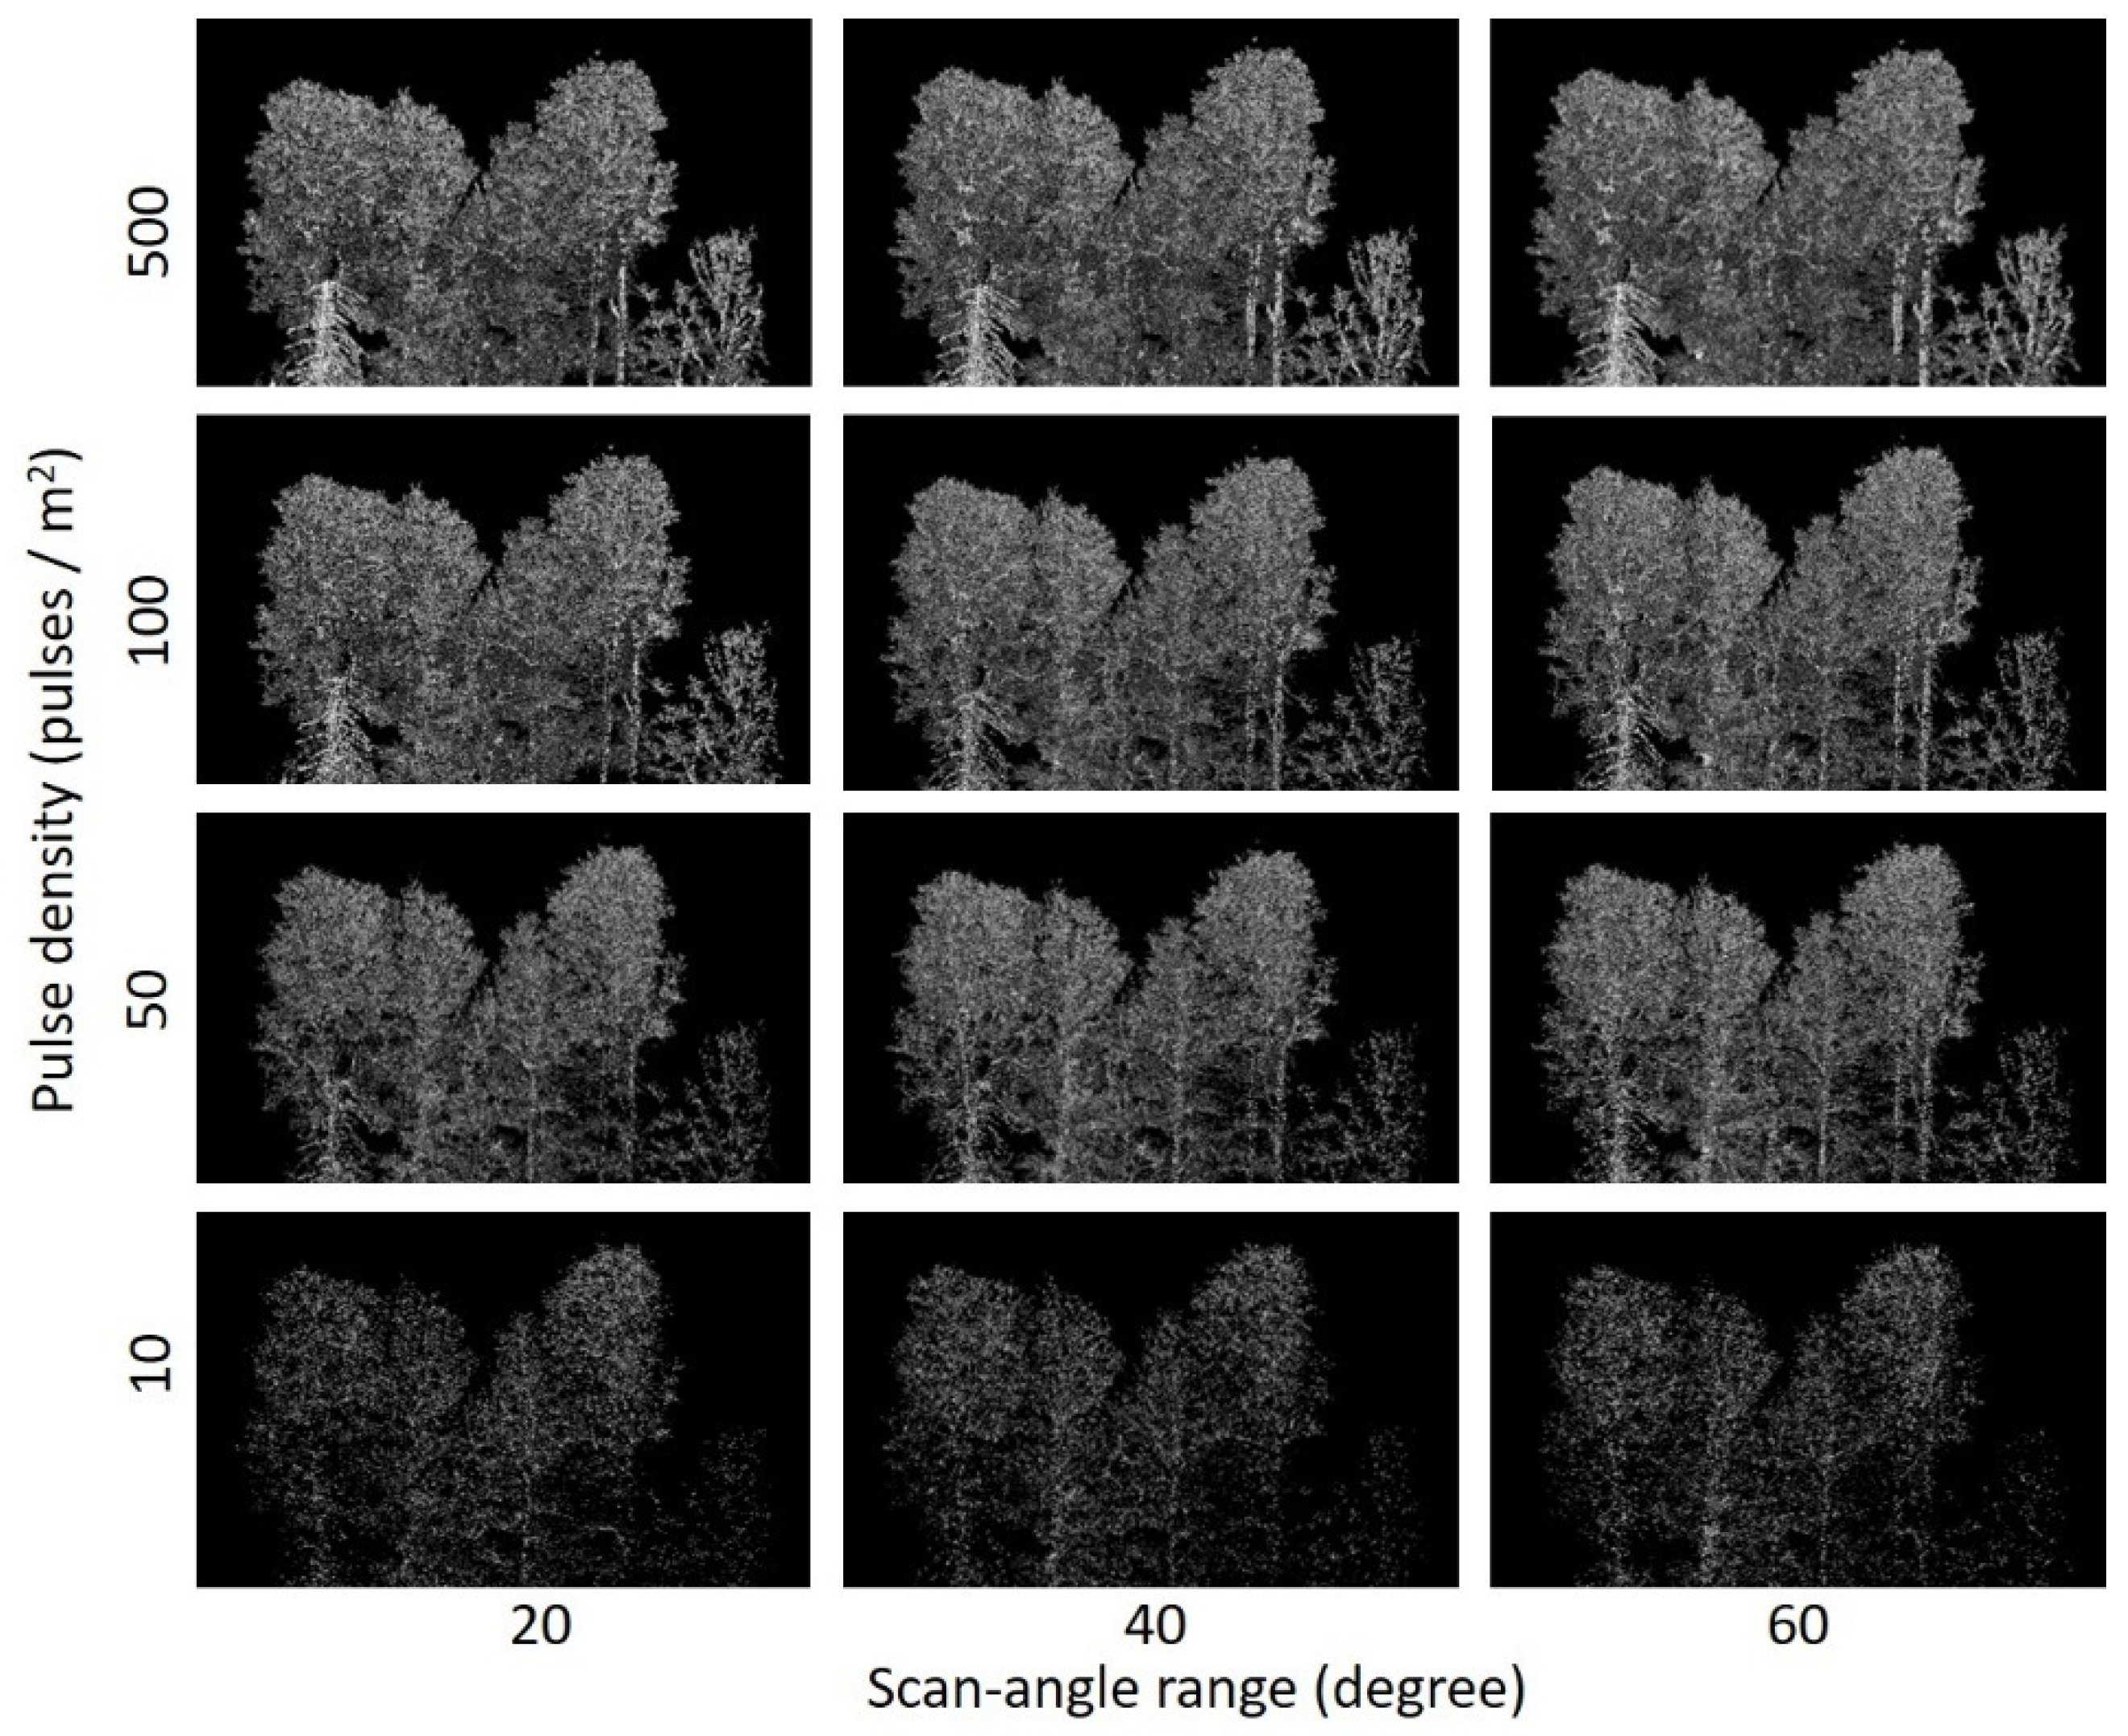
Although scan-angle range was less important than pulse density for sampling completeness, some voxels were more likely to be observed at wide scan-angle ranges, including voxels occupied by vertical stems (Figure A1, Figure A2 and Figure A3). This finding aligns with previous studies that have demonstrated the importance of a wide scan-angle range or multiple viewing angles in generating stem returns [30,45,55,83]. In contrast to previous studies, this study extends insight into scan-angle range by investigating when the impact of scan-angle range plateaued before and after it was decoupled from pulse density (Figure 4).

4.2. Undetected Voxels under Different Pulse Densities and Scan-Angle Ranges

We observed that undetected voxels exhibited patterns of distinct covariation with pulse density and scan-angle range. Undetected and searched voxels or undetected and completely occluded voxels did not necessarily decrease with greater pulse densities or scan-angle ranges, whereas undetected and unobserved voxels consistently decreased as the pulse density increased. Whether the former two types of undetected voxels decreased or increased with greater pulse densities depended on the specific pulse density and scan-angle range. As the pulse density increased, voxels that were undetected and searched or that were undetected and completely occluded first increased and then decreased (Figure 5 and Figure 6).
This study demonstrated that the undetected and searched voxels were the most common type of undetected voxels under the investigated voxel size (0.5 m), even under the largest possible pulse density and scan-angle range, followed by undetected and completely occluded voxels and undetected and unobserved voxels (Figure 5, when the scan-angle range was ±60°). The existence of undetected and searched voxels underscores that space searched by pulses in the absence of a return is not necessarily unoccupied. The proportion of undetected and searched voxels was negatively related to pulse density (Figure 5 and Figure 6B). This was probably caused by insufficient searching distance within the voxel, although it could also have been linked to voxel size, the number of pulses, and the distribution of vegetation in the voxel. The existence of such voxels could also depend on the amount of vegetation in comparison to other factors (i.e., footprint size and laser power). If there is too little vegetation inside a voxel, the reflected pulse might be insufficient to trigger a return, especially when footprint size is large relative to the amount of vegetation in the voxel. Future work should investigate the relationship between sampling completeness and search effort, including whether the relationship changes in response to voxel size and laser power.
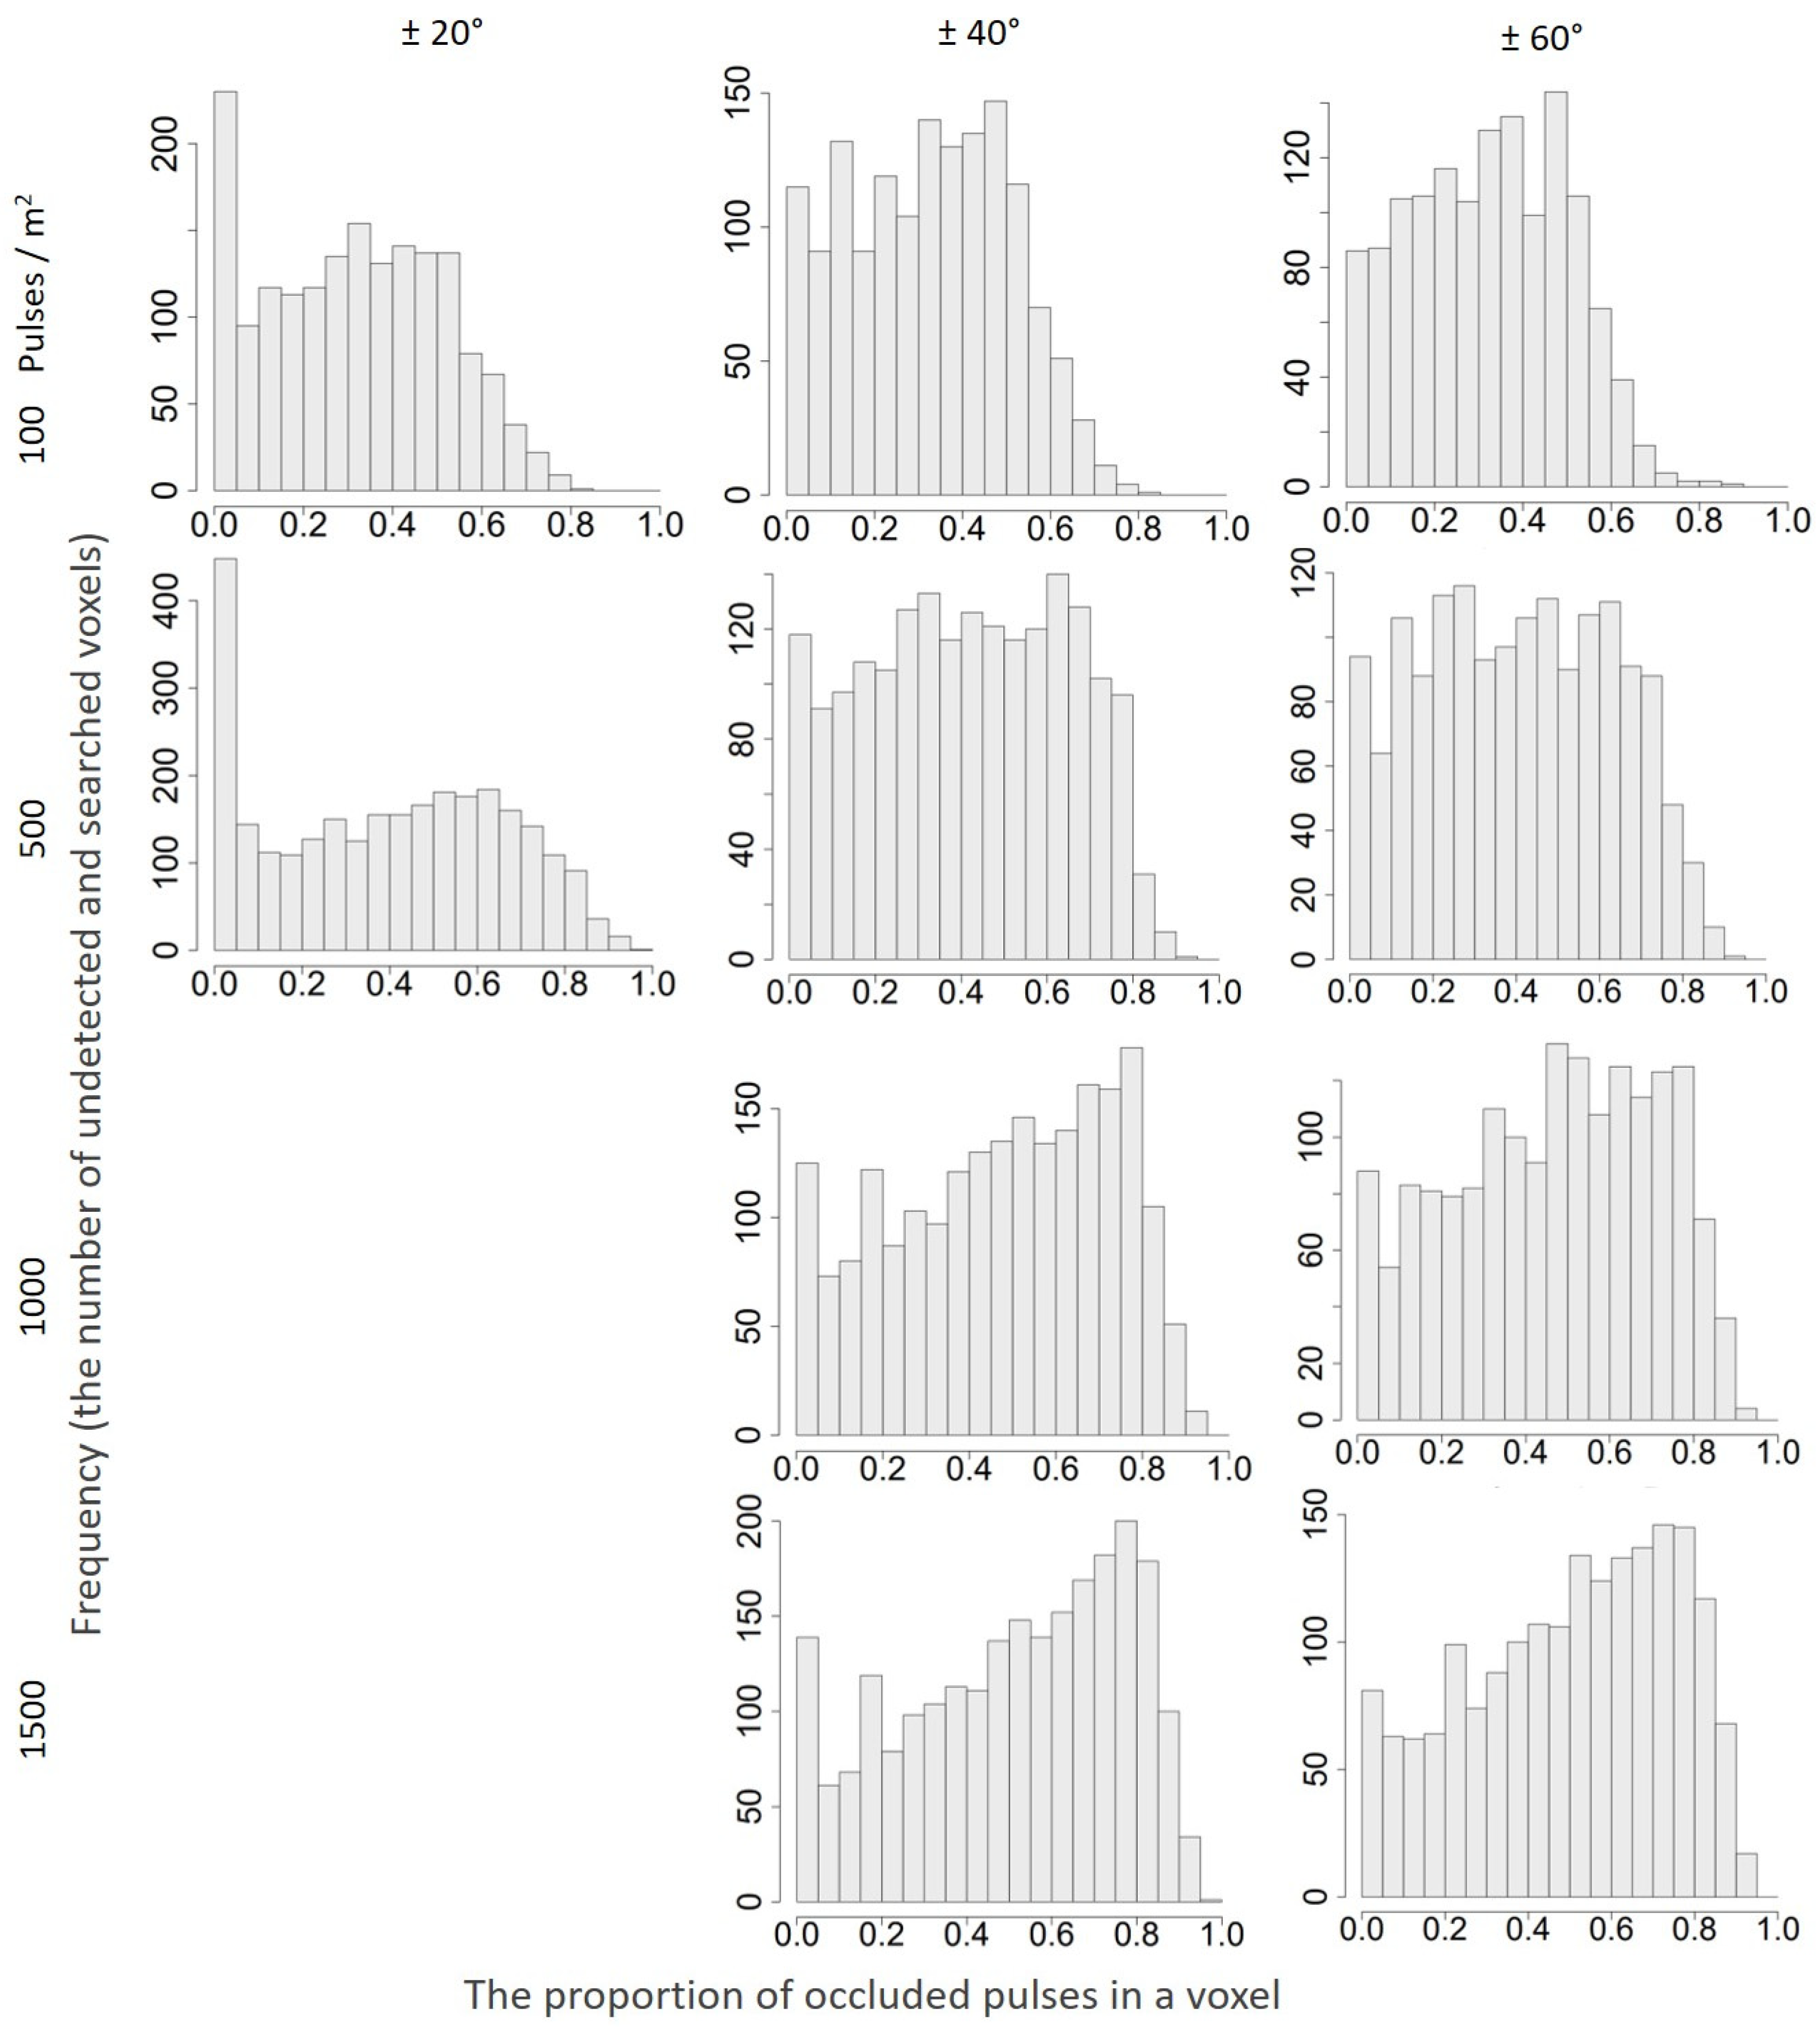
A majority of undetected and searched voxels had a large proportion of occluded pulses (Figure A16). When the pulse density was 1500 pulses/m2 and the scan-angle range was ±60°, most of the undetected and searched voxels were occluded by more than half the pulses. The number of undetected and searched voxels with pulses that were occluded >50% of the time increased with pulse density and scan-angle range.
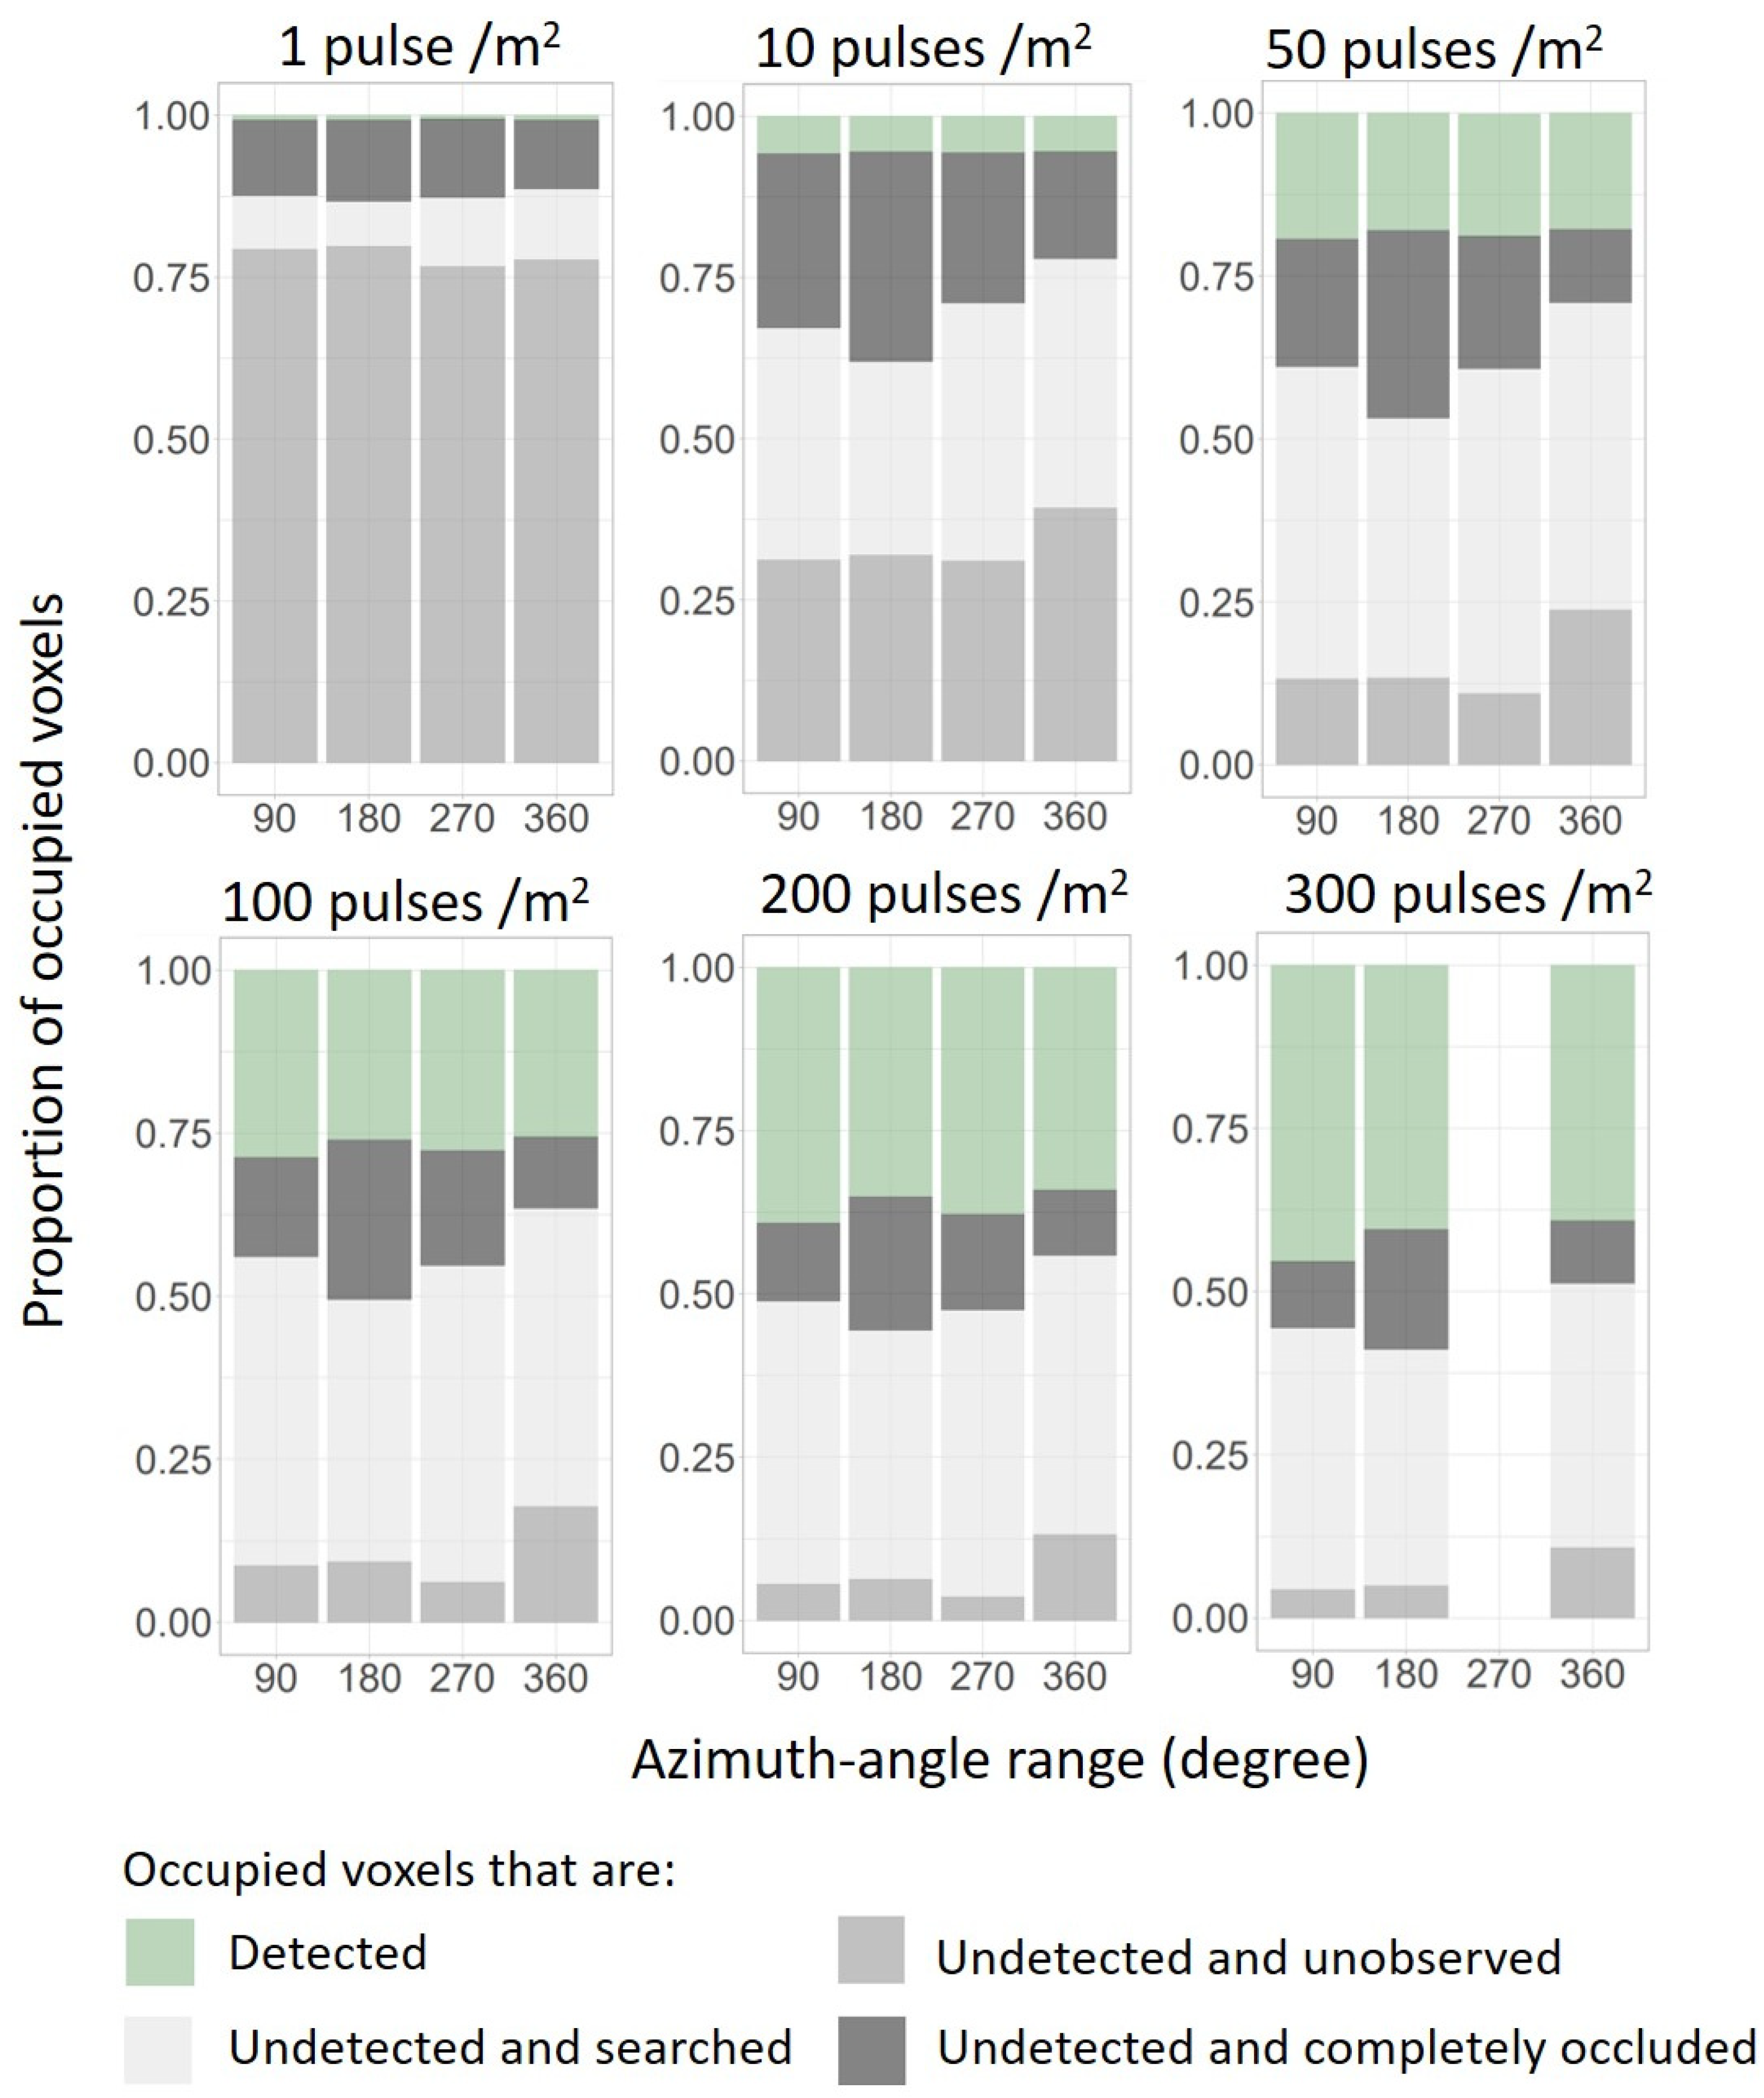
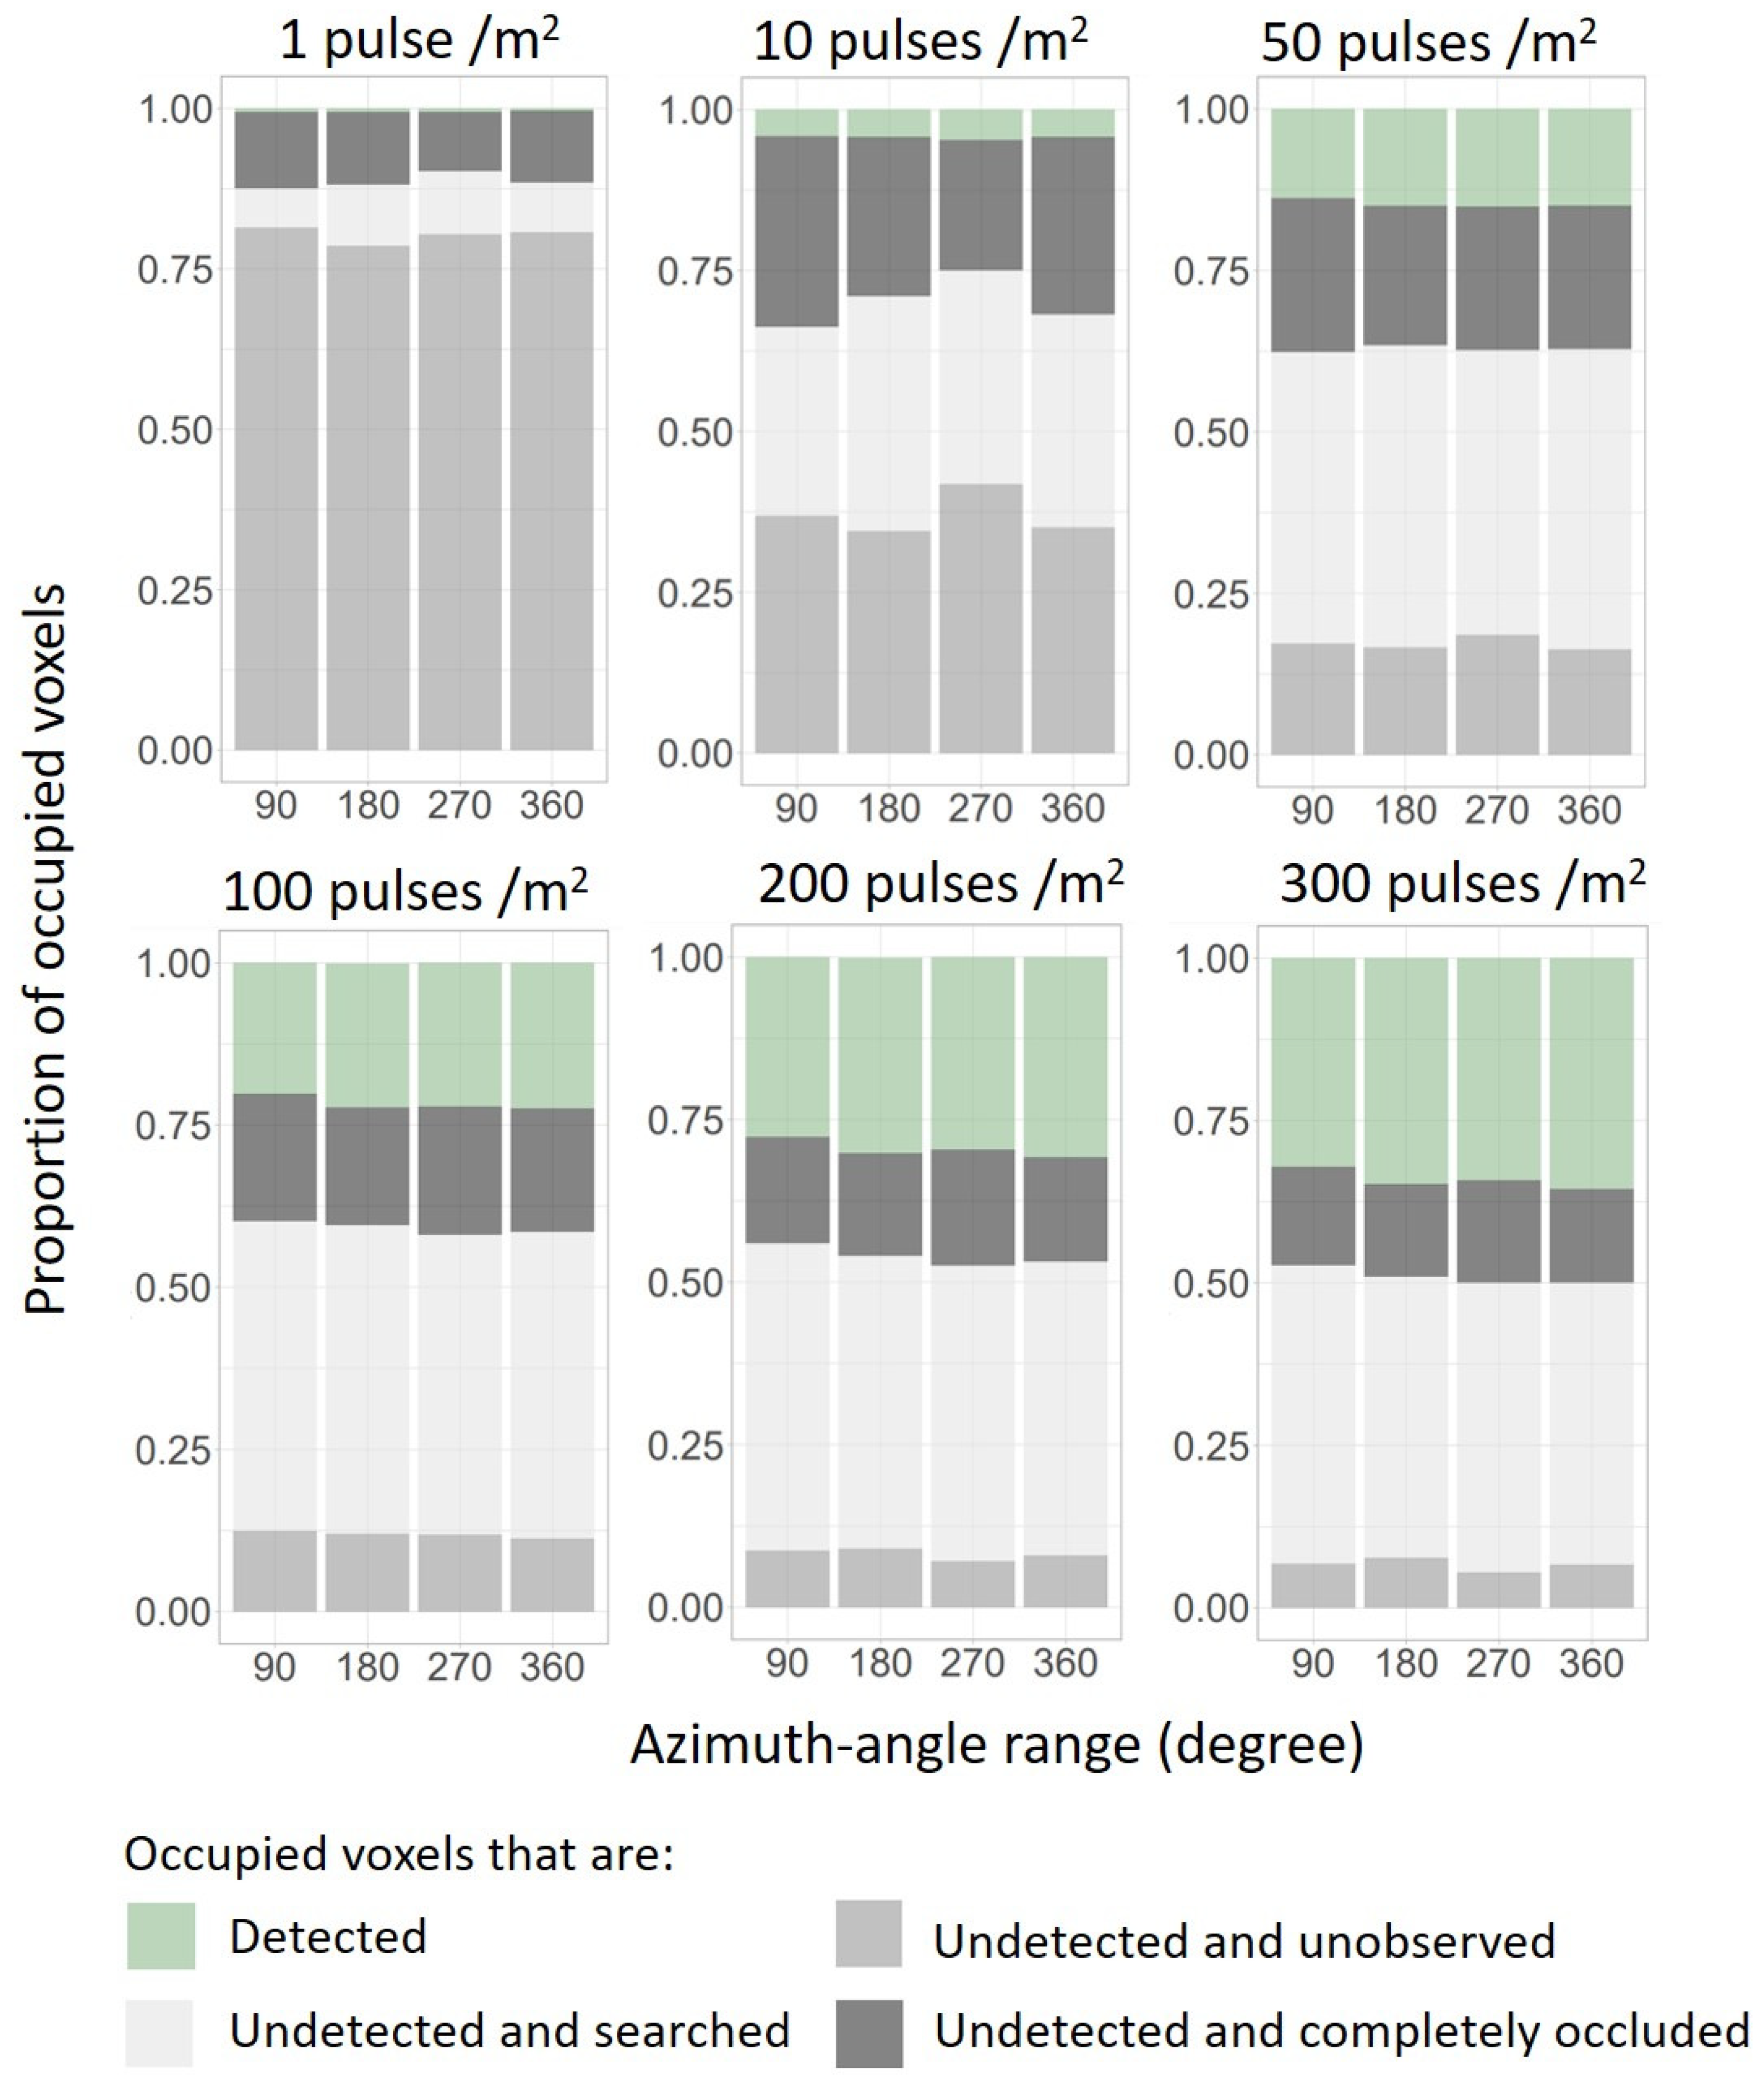
Azimuth-angle range had less impact on detected voxels than undetected voxels (Figure A7, Figure A8, Figure A9 and Figure A10). When the pulse density was <100 pulses/m2, the proportions of detected voxels from the four azimuth-angle ranges were similar. Variation in sampling completeness from different azimuth-angle ranges was greater at large pulse densities. This probably reflected local differences in forest structure within the 100 m2 plots.
Returns outside a plot may have influenced our results, but we believe the impact was small. Because we tracked all pulse trajectories associated with returns inside the plot, returns outside the plot could have affected the proportions of undetected and unsearched voxels, but not the proportions of detected voxels. By tracing additional pulses that triggered returns outside the plot, some undetected and unobserved voxels might be reclassified as undetected and searched or undetected and completely occluded voxels. Voxels that were undetected and completely occluded might remain the same or be reclassified as undetected and searched voxels in this scenario. Because the proportion of undetected and unsearched voxels was small (Figure 5, especially when the pulse density was greater than 1000 pulses/m2), pulses outside the plot would have had limited impact on our results.

4.3. Vertical Variability of Proportions of Different Types of Voxels

Our study demonstrates that, despite a reduction in sampling completeness as pulses penetrated deeper into the canopy (i.e., as the height above ground decreased; Figure 7), the use of drone lidar data with a wide scan-angle range was able to achieve sampling completeness > 50% close to ground level (Figure A14). For example, when the pulse density was 1000 pulses / m2, approximately half of the occupied voxels at 5–5.5 m above ground were detected, even with a scan-angle range of ±30° (Figure A14, when the scan-angle range was ±30°). When the pulse density was as high as 1500 pulses/m2 and the scan-angle range was ±60°, nearly 60% of the occupied voxels at 10–10.5 m above ground were detected (Figure A14, when the scan-angle range was ±60°).
Nevertheless, undetected voxels persisted at both lower and higher heights, even when the pulse density was large and the scan-angle range was wide (Figure 7). For example, at lower heights, greater pulse densities eliminated undetected and unobserved voxels, but undetected and completely occluded voxels and undetected and searched voxels remained. In the upper canopies, greater pulse densities eliminated undetected and completely occluded voxels and undetected and unobserved voxels, but undetected and searched voxels persisted. The persistence of undetected voxels at lower heights was probably due to the scarcity of pulses at these heights. A similar challenge near the top of the canopy exists in TLS sampling. Previous studies showed that a single scan from the center of a plot failed to detect upper-canopy vegetation and around 40% of the trees [21,84,85,86], and even multiple scans did not guarantee complete sampling of canopy volume or stem structure [21,67]. One study in a temperate broadleaf forest in North America showed that as many as nine TLS scans did not provide complete sampling of the upper canopy structure, where more than half of the voxels were unobserved, and that the proportion of unsampled voxels increased above 10 m in height [67].

4.4. Future Work

Some of our findings are likely to have depended on voxel size. For example, undetected and searched voxels may be more common among larger individual voxel sizes than smaller ones. A future investigation should consider voxels of different sizes, including sizes that approach the diameter of the laser footprint. We anticipate that when the voxel size is smaller, especially when the voxel size is close to the laser footprint size, there will be relatively fewer undetected and searched voxels, and relatively more undetected and unsearched voxels. Note that there are also other factors that may result in variation in sampling completeness across different sites, including flight and atmospheric conditions and properties of the lidar sensor, including wavelength, pulse repetition rate, and laser power [54]. Also note that although pulse trajectories are usually traced as lines, the actual interaction between a laser pulse and an object of interest may be influenced by beam divergence.
The proportion of detected voxels in this study was assessed from a 1 ha area in an old-growth temperate mountain forest, and proportions of undetected voxels were quantified in 100 m2 plots. Coincident drone lidar and TLS collected at different locations with different canopy densities can be used to test the generality of these findings. Given the scarcity of research exploring various types of failures to generate lidar returns, the empirical proportions derived from our study could be useful for calibrating sensor outputs, but the generality of our conclusions requires validation.
Our approach to sub-setting lidar data used tiles overlaid on each plot. Generating samples independently within each tile may have influenced our conclusions by preventing spatial heterogeneity in the density of returns. We expect the impact of sampling strategy to be most important when pulse density is small, but future work should consider alternative approaches to sub-sampling.

5. Conclusions

High-resolution drone lidar can acquire detailed measurements of vertical and horizontal forest structure. Drone lidar searched 98.1% of voxels known to contain vegetation in our study area, and generated returns in 81.8% of these voxels. By decoupling the impact of pulse density and scan-angle range on the likelihood of generating a return, this study demonstrates that nearly complete sampling of forest structure is possible using high-density drone lidar in a temperate mountain forest. The ability to generate a return when vegetation was present was more sensitive to pulse density than to scan-angle range. At very large pulse densities (>1000 pulses/m2), failure to generate a return was almost exclusively associated with searched voxels that contained vegetation but did not trigger a return.
This study documents three ways that a return can fail to be generated in the presence of vegetation: (1) the voxel could be searched but no return generated, for example, because the voxel was sparsely populated and contained mostly empty space; (2) the voxel could be unsearched because it was occluded; and (3) the voxel could be unsearched because no pulse was fired in the direction of the voxel. Our findings demonstrated that all types of undetected voxels existed, and the proportion of each type changed with pulse density and scan-angle range. The strength and form of the relationships depended on canopy height, pulse density, and scan-angle range. These findings provide an empirical assessment of sampling completeness using a combination of high-resolution drone lidar and coincident TLS data. Our findings demonstrate the value of ray tracing when considering questions of sampling completeness in drone lidar data.

Author Contributions

Conceptualization, D.Z. and J.R.K.; methodology, D.Z., K.C.C. and J.R.K.; formal analysis, D.Z.; data curation, K.K., M.K., K.C.C. and J.R.K.; writing—original draft preparation, D.Z.; writing—review and editing, D.Z., K.K., M.K., K.C.C. and J.R.K.; visualization, D.Z.; supervision, J.R.K.; funding acquisition, K.K. and J.R.K. All authors have read and agreed to the published version of the manuscript.

Funding

This research was funded by the Institute at Brown for Environment and Society, the Department of Ecology, Evolution, and Organismal Biology at Brown University, Peggy and Henry D. Sharpe Jr., INTER-COST project LUC23023, and the National Aeronautics and Space Administration of the United States of America. KCC was sponsored in part by the Laboratory Directed Research and Development Program of Oak Ridge National Laboratory (ORNL). ORNL is managed by the University of Tennessee-Battelle, LLC, under contract DE-AC05-00OR22725 with the U.S. Department of Energy.

Data Availability Statement

The data presented in this study are available on request from J.R.K. and K.K.

Acknowledgments

We gratefully acknowledge the ForestGEO Annual Analytical Workshop program funded by the Smithsonian Institution. We thank Christoph Eck, Christoph Falleger, Benedikt Imbach, Carlo Zgraggen, and the Center for Computation and Visualization at Brown University.

Conflicts of Interest

The authors declare no conflicts of interest.

Appendix A

Figure A1. Stem and branch structure as a function of pulse density and scan-angle range. The area is approximately 30 by 30 m in a temperate mountain forest in the southwest Czech Republic. The number of returns was more sensitive to pulse density than to scan-angle range.
Remotesensing 16 02774 g0a1
Figure A2. Stem and branch structure as a function of pulse density and scan-angle range, highlighting vegetation structure among prominent stems. Data are from high-density drone lidar in a temperate mountain forest in the southwest Czech Republic. The number of returns was more sensitive to pulse density than to scan-angle range.
Remotesensing 16 02774 g0a2
Figure A3. Stem and branch structure as a function of pulse density and scan-angle range, highlighting upper-canopy vegetation. Data are from high-density drone lidar in a temperate mountain forest in the southwest Czech Republic. The number of returns was more sensitive to pulse density than to scan-angle range.
Remotesensing 16 02774 g0a3
Figure A4. Proportions of occupied voxels that were detected and undetected as a function of pulse density and scan-angle range at Plot 2. On each of the six panels, from left to right, the black dots represent pulse densities of 1, 10, 50, 100, 200, 300, 400, 500, 1000, 1500 pulses/m2. Only 6 levels of scan-angle range (±10°, ±20°, ±30°, ±40°, ±50°, and ±60°) are shown here because Figure 4 shows the limited impact of scan-angle range after decoupling its impact from pulse density. Missing data points are associated with small sample sizes at certain combinations of scan-angle range and pulse density.
Remotesensing 16 02774 g0a4
Figure A5. Proportions of occupied voxels that were detected and undetected as a function of pulse density and scan-angle range at Plot 3. On each of the six panels, from left to right, the black dots represent pulse densities of 1, 10, 50, 100, 200, 300, 400, 500, 1000, 1500 pulses/m2. Only 6 levels of scan-angle range (±10°, ±20°, ±30°, ±40°, ±50°, and ±60°) are shown here because Figure 4 shows the limited impact of scan-angle range after decoupling its impact from pulse density. Missing data points are associated with small sample sizes at certain combinations of scan-angle range and pulse density.
Remotesensing 16 02774 g0a5
Figure A6. Proportions of occupied voxels that were detected and undetected as a function of pulse density and scan-angle range at Plot 4. On each of the six panels, from left to right, the black dots represent pulse densities of 1, 10, 50, 100, 200, 300, 400, 500, 1000, 1500 pulses/m2. Only 6 levels of scan-angle range (±10°, ±20°, ±30°, ±40°, ±50°, and ±60°) are shown here because Figure 4 shows the limited impact of scan-angle range after decoupling its impact from pulse density. Missing data points are associated with small sample sizes at certain combinations of scan-angle range and pulse density.
Remotesensing 16 02774 g0a6
Figure A7. Proportions of occupied voxels that were detected and undetected as a function of pulse density and azimuth-angle range (Plot 1). The azimuth-angle ranges were 0°–90°, 90°–180°, 180°–270°, and 270°–360°; they are labeled on the X-axis by the right bound (i.e., 90, 180, 270, 360, respectively). Missing data points are associated with small sample sizes at certain combinations of azimuth-angle range and pulse density.
Remotesensing 16 02774 g0a7
Figure A8. Proportions of occupied voxels that were detected and undetected as a function of pulse density and azimuth-angle range (Plot 2). The azimuth-angle ranges were 0°–90°, 90°–180°, 180°–270°, and 270°–360°; they are labeled on the X-axis by the right bound (i.e., 90, 180, 270, 360, respectively). Missing data points are associated with small sample sizes at certain combinations of azimuth-angle range and pulse density.
Remotesensing 16 02774 g0a8
Figure A9. Proportions of occupied voxels that were detected and undetected as a function of pulse density and azimuth-angle range (Plot 3). The azimuth-angle ranges were 0°–90°, 90°–180°, 180°–270°, and 270°–360°; they are labeled on the X-axis by the right bound (i.e., 90, 180, 270, 360, respectively). Missing data points are associated with small sample sizes at certain combinations of azimuth-angle range and pulse density.
Remotesensing 16 02774 g0a9
Figure A10. Proportions of occupied voxels that were detected and undetected as a function of pulse density and azimuth-angle range (Plot 4). The azimuth-angle ranges were 0°–90°, 90°–180°, 180°–270°, and 270°–360°; they are labeled on the X-axis by the right bound (i.e., 90, 180, 270, 360, respectively). Missing data points are associated with small sample sizes at certain combinations of azimuth-angle range and pulse density.
Remotesensing 16 02774 g0a10
Figure A11. Proportions of occupied voxels that were detected and undetected as a function of pulse density and scan-angle range at multiple heights above ground in a 100 m2 plot (Plot 2). Missing data points are associated with small sample sizes at certain combinations of scan-angle range and pulse density.
Remotesensing 16 02774 g0a11
Figure A12. Proportions of occupied voxels that were detected and undetected as a function of pulse density and scan-angle range at multiple heights above ground in a 100 m2 plot (Plot 3). Missing data points are associated with small sample sizes at certain combinations of scan-angle range and pulse density.
Remotesensing 16 02774 g0a12
Figure A13. Proportions of occupied voxels that were detected and undetected as a function of pulse density and scan-angle range at multiple heights aboveground in a 100 m2 plot (Plot 4). Missing data points are associated with small sample sizes at certain combinations of scan-angle range and pulse density.
Remotesensing 16 02774 g0a13
Figure A14. The proportion of detected voxels at different heights as a function of pulse density and scan-angle range in the 1 ha plot. Only 6 levels of scan-angle range (±10°, ±20°, ±30°, ±40°, ±50° and ±60°) are shown here because Figure 4 shows the limited impact of scan-angle range after decoupling from pulse density. Missing data points are associated with small sample sizes at some combinations of scan-angle range and pulse density.
Remotesensing 16 02774 g0a14
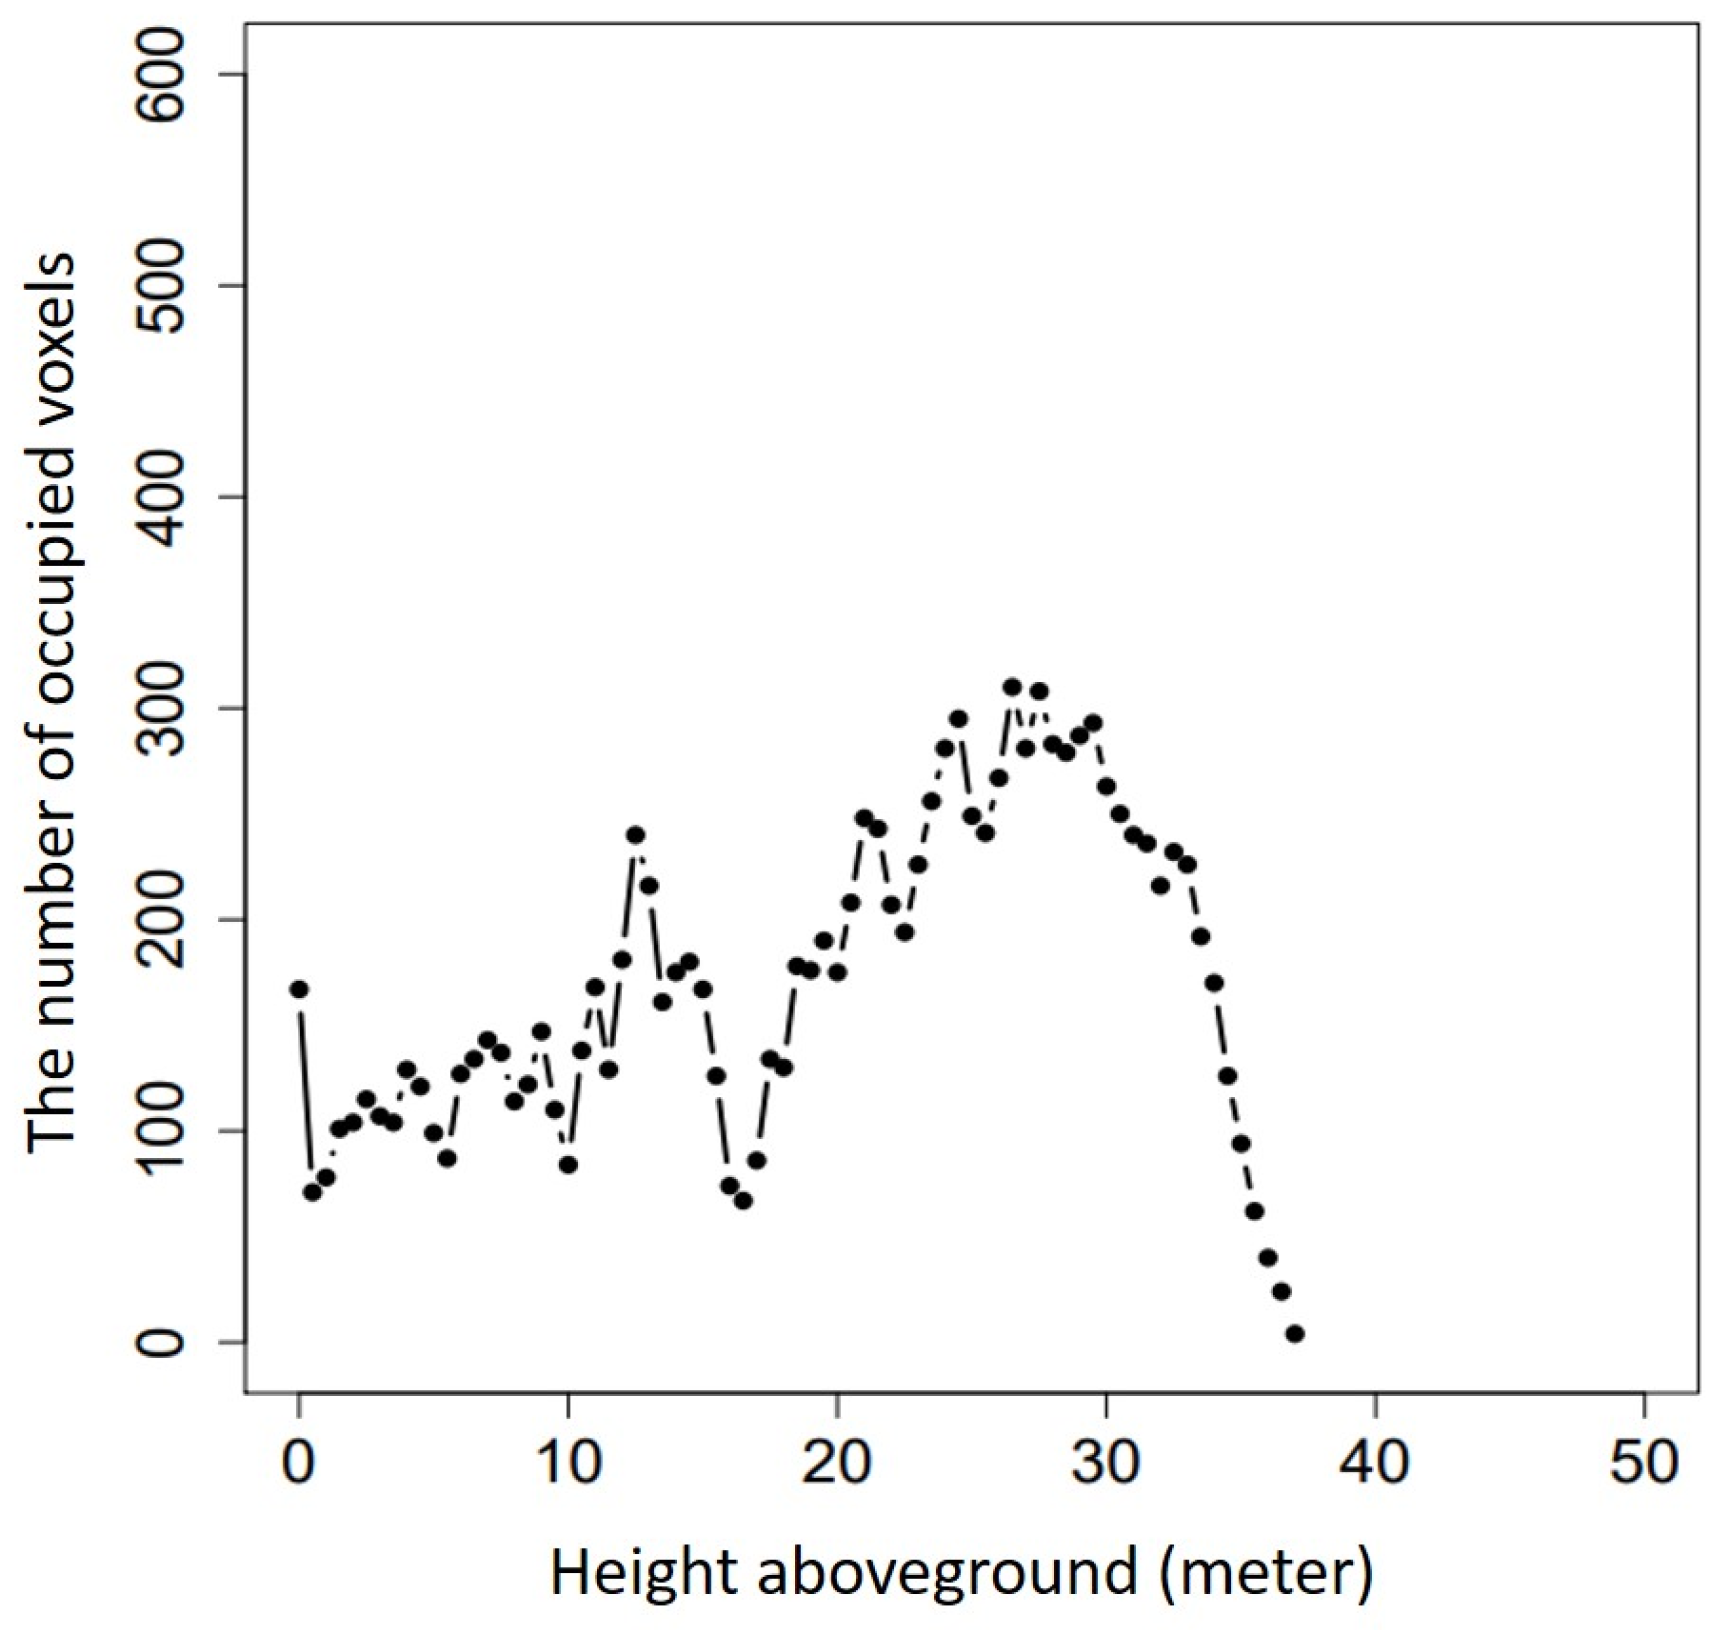
Figure A15. The number of occupied voxels at each height above ground in a 100 m2 plot (Plot 1).
Remotesensing 16 02774 g0a15
Figure A16. Proportions of occluded pulses in undetected and searched voxels as a function of pulse density and scan-angle range (Plot 1). Missing panels are associated with small sample sizes at certain combinations of scan-angle range and pulse density.
Remotesensing 16 02774 g0a16
Table A1. Linear regressions show that pulse density ( p d ) explains more of the variation in sampling completeness than scan-angle range ( s a r ).
ModelR2
s a m p .   c o m p l e t e n e s s = 0.0006 × p d + 0.0006 × s a r + 0.2544 0.652
s a m p .   c o m p l e t e n e s s = 0.0006 × p d + 0.2741 0.650
s a m p .   c o m p l e t e n e s s = 0.0039 × s a r + 0.3101 0.061

References

  1. Beer, C.; Reichstein, M.; Tomelleri, E.; Ciais, P.; Jung, M.; Carvalhais, N.; Rödenbeck, C.; Arain, M.A.; Baldocchi, D.; Bonan, G.B.; et al. Terrestrial Gross Carbon Dioxide Uptake: Global Distribution and Covariation with Climate. Science 2010, 329, 834–838. [Google Scholar] [CrossRef] [PubMed]
  2. Pan, Y.; Birdsey, R.A.; Phillips, O.L.; Jackson, R.B. The Structure, Distribution, and Biomass of the World’s Forests. Annu. Rev. Ecol. Evol. Syst. 2013, 44, 593–622. [Google Scholar] [CrossRef]
  3. FAO and UNEP. The State of the World’s Forests 2020: Forests, Biodiversity and People; The State of the World’s Forests (SOFO); FAO and UNEP: Rome, Italy, 2020; ISBN 978-92-5-132419-6. [Google Scholar]
  4. Morsdorf, F.; Kötz, B.; Meier, E.; Itten, K.I.; Allgöwer, B. Estimation of LAI and Fractional Cover from Small Footprint Airborne Laser Scanning Data Based on Gap Fraction. Remote Sens. Environ. 2006, 104, 50–61. [Google Scholar] [CrossRef]
  5. Yang, X.; Strahler, A.H.; Schaaf, C.B.; Jupp, D.L.B.; Yao, T.; Zhao, F.; Wang, Z.; Culvenor, D.S.; Newnham, G.J.; Lovell, J.L.; et al. Three-Dimensional Forest Reconstruction and Structural Parameter Retrievals Using a Terrestrial Full-Waveform Lidar Instrument (Echidna®). Remote Sens. Environ. 2013, 135, 36–51. [Google Scholar] [CrossRef]
  6. Pueschel, P.; Newnham, G.; Rock, G.; Udelhoven, T.; Werner, W.; Hill, J. The Influence of Scan Mode and Circle Fitting on Tree Stem Detection, Stem Diameter and Volume Extraction from Terrestrial Laser Scans. ISPRS J. Photogramm. Remote Sens. 2013, 77, 44–56. [Google Scholar] [CrossRef]
  7. Olsoy, P.J.; Glenn, N.F.; Clark, P.E.; Derryberry, D.R. Aboveground Total and Green Biomass of Dryland Shrub Derived from Terrestrial Laser Scanning. ISPRS J. Photogramm. Remote Sens. 2014, 88, 166–173. [Google Scholar] [CrossRef]
  8. Li, Y.; Guo, Q.; Su, Y.; Tao, S.; Zhao, K.; Xu, G. Retrieving the Gap Fraction, Element Clumping Index, and Leaf Area Index of Individual Trees Using Single-Scan Data from a Terrestrial Laser Scanner. ISPRS J. Photogramm. Remote Sens. 2017, 130, 308–316. [Google Scholar] [CrossRef]
  9. Roşca, S.; Suomalainen, J.; Bartholomeus, H.; Herold, M. Comparing Terrestrial Laser Scanning and Unmanned Aerial Vehicle Structure from Motion to Assess Top of Canopy Structure in Tropical Forests. Interface Focus 2018, 8, 20170038. [Google Scholar] [CrossRef] [PubMed]
  10. Liu, J.; Skidmore, A.K.; Wang, T.; Zhu, X.; Premier, J.; Heurich, M.; Beudert, B.; Jones, S. Variation of Leaf Angle Distribution Quantified by Terrestrial LiDAR in Natural European Beech Forest. ISPRS J. Photogramm. Remote Sens. 2019, 148, 208–220. [Google Scholar] [CrossRef]
  11. Disney, M.; Burt, A.; Wilkes, P.; Armston, J.; Duncanson, L. New 3D Measurements of Large Redwood Trees for Biomass and Structure. Sci. Rep. 2020, 10, 16721. [Google Scholar] [CrossRef]
  12. Coops, N.C.; Tompalski, P.; Goodbody, T.R.H.; Queinnec, M.; Luther, J.E.; Bolton, D.K.; White, J.C.; Wulder, M.A.; van Lier, O.R.; Hermosilla, T. Modelling Lidar-Derived Estimates of Forest Attributes over Space and Time: A Review of Approaches and Future Trends. Remote Sens. Environ. 2021, 260, 112477. [Google Scholar] [CrossRef]
  13. Saatchi, S.S.; Harris, N.L.; Brown, S.; Lefsky, M.; Mitchard, E.T.A.; Salas, W.; Zutta, B.R.; Buermann, W.; Lewis, S.L.; Hagen, S.; et al. Benchmark Map of Forest Carbon Stocks in Tropical Regions across Three Continents. Proc. Natl. Acad. Sci. USA 2011, 108, 9899–9904. [Google Scholar] [CrossRef] [PubMed]
  14. Stovall, A.E.L.; Shugart, H.H. Improved Biomass Calibration and Validation with Terrestrial LiDAR: Implications for Future LiDAR and SAR Missions. IEEE J. Sel. Top. Appl. Earth Obs. Remote Sens. 2018, 11, 3527–3537. [Google Scholar] [CrossRef]
  15. Disney, M.; Burt, A.; Calders, K.; Schaaf, C.; Stovall, A. Innovations in Ground and Airborne Technologies as Reference and for Training and Validation: Terrestrial Laser Scanning (TLS). Surv. Geophys. 2019, 40, 937–958. [Google Scholar] [CrossRef]
  16. Duncanson, L.; Armston, J.; Disney, M.; Avitabile, V.; Barbier, N.; Calders, K.; Carter, S.; Chave, J.; Herold, M.; Crowther, T.W.; et al. The Importance of Consistent Global Forest Aboveground Biomass Product Validation. Surv. Geophys. 2019, 40, 979–999. [Google Scholar] [CrossRef]
  17. Duncanson, L.; Armston, J.; Disney, M.; Avitabile, V.; Barbier, N.; Calders, K.; Carter, S.; Chave, J.; Herold, M.; MacBean, N.; et al. Aboveground Woody Biomass Product Validation Good Practices Protocol. Version 1.0. In Good Practices for Satellite Derived Land Product Validation; Duncanson, L., Disney, M., Armston, J., Nickeson, J., Minor, D., Camacho, F., Eds.; Land Product Validation Subgroup (WGCV/CEOS), 2021; p. 236. Available online: https://doi.org/10.5067/doc/ceoswgcv/lpv/agb.001 (accessed on 10 July 2024).
  18. Beland, M.; Parker, G.; Sparrow, B.; Harding, D.; Chasmer, L.; Phinn, S.; Antonarakis, A.; Strahler, A. On Promoting the Use of Lidar Systems in Forest Ecosystem Research. For. Ecol. Manag. 2019, 450, 117484. [Google Scholar] [CrossRef]
  19. Smith, M.N.; Stark, S.C.; Taylor, T.C.; Ferreira, M.L.; de Oliveira, E.; Restrepo-Coupe, N.; Chen, S.; Woodcock, T.; dos Santos, D.B.; Alves, L.F.; et al. Seasonal and Drought-Related Changes in Leaf Area Profiles Depend on Height and Light Environment in an Amazon Forest. New Phytol. 2019, 222, 1284–1297. [Google Scholar] [CrossRef]
  20. Ma, L.; Hurtt, G.; Tang, H.; Lamb, R.; Lister, A.; Chini, L.; Dubayah, R.; Armston, J.; Campbell, E.; Duncanson, L.; et al. Spatial Heterogeneity of Global Forest Aboveground Carbon Stocks and Fluxes Constrained by Spaceborne Lidar Data and Mechanistic Modeling. Glob. Chang. Biol. 2023, 29, 3378–3394. [Google Scholar] [CrossRef]
  21. Liang, X.; Kankare, V.; Hyyppä, J.; Wang, Y.; Kukko, A.; Haggrén, H.; Yu, X.; Kaartinen, H.; Jaakkola, A.; Guan, F.; et al. Terrestrial Laser Scanning in Forest Inventories. ISPRS J. Photogramm. Remote Sens. 2016, 115, 63–77. [Google Scholar] [CrossRef]
  22. Calders, K.; Adams, J.; Armston, J.; Bartholomeus, H.; Bauwens, S.; Bentley, L.P.; Chave, J.; Danson, F.M.; Demol, M.; Disney, M.; et al. Terrestrial Laser Scanning in Forest Ecology: Expanding the Horizon. Remote Sens. Environ. 2020, 251, 112102. [Google Scholar] [CrossRef]
  23. Hopkinson, C.; Chasmer, L.; Young-Pow, C.; Treitz, P. Assessing Forest Metrics with a Ground-Based Scanning Lidar. Can. J. For. Res. 2004, 34, 573–583. [Google Scholar] [CrossRef]
  24. Strahler, A.H.; Jupp, D.L.B.; Woodcock, C.E.; Schaaf, C.B.; Yao, T.; Zhao, F.; Yang, X.; Lovell, J.; Culvenor, D.; Newnham, G.; et al. Retrieval of Forest Structural Parameters Using a Ground-Based Lidar Instrument (Echidna®). Can. J. Remote Sens. 2008, 34, S426–S440. [Google Scholar] [CrossRef]
  25. Dassot, M.; Colin, A.; Santenoise, P.; Fournier, M.; Constant, T. Terrestrial Laser Scanning for Measuring the Solid Wood Volume, Including Branches, of Adult Standing Trees in the Forest Environment. Comput. Electron. Agric. 2012, 89, 86–93. [Google Scholar] [CrossRef]
  26. Zheng, G.; Moskal, L.M.; Kim, S.-H. Retrieval of Effective Leaf Area Index in Heterogeneous Forests with Terrestrial Laser Scanning. IEEE Trans. Geosci. Remote Sens. 2013, 51, 777–786. [Google Scholar] [CrossRef]
  27. Calders, K.; Newnham, G.; Burt, A.; Murphy, S.; Raumonen, P.; Herold, M.; Culvenor, D.; Avitabile, V.; Disney, M.; Armston, J.; et al. Nondestructive Estimates of Above-Ground Biomass Using Terrestrial Laser Scanning. Methods Ecol. Evol. 2015, 6, 198–208. [Google Scholar] [CrossRef]
  28. Wang, Q.; Pang, Y.; Chen, D.; Liang, X.; Lu, J. Lidar Biomass Index: A Novel Solution for Tree-Level Biomass Estimation Using 3D Crown Information. For. Ecol. Manag. 2021, 499, 119542. [Google Scholar] [CrossRef]
  29. Bornand, A.; Rehush, N.; Morsdorf, F.; Thürig, E.; Abegg, M. Individual Tree Volume Estimation with Terrestrial Laser Scanning: Evaluating Reconstructive and Allometric Approaches. Agric. For. Meteorol. 2023, 341, 109654. [Google Scholar] [CrossRef]
  30. Brede, B.; Lau, A.; Bartholomeus, H.M.; Kooistra, L. Comparing RIEGL RiCOPTER UAV LiDAR Derived Canopy Height and DBH with Terrestrial LiDAR. Sensors 2017, 17, 2371. [Google Scholar] [CrossRef]
  31. Wilkes, P.; Lau, A.; Disney, M.; Calders, K.; Burt, A.; de Tanago, J.G.; Bartholomeus, H.; Brede, B.; Herold, M. Data Acquisition Considerations for Terrestrial Laser Scanning of Forest Plots. Remote Sens. Environ. 2017, 196, 140–153. [Google Scholar] [CrossRef]
  32. Calders, K.; Armston, J.; Newnham, G.; Herold, M.; Goodwin, N. Implications of Sensor Configuration and Topography on Vertical Plant Profiles Derived from Terrestrial LiDAR. Agric. For. Meteorol. 2014, 194, 104–117. [Google Scholar] [CrossRef]
  33. Chasmer, L.; Hopkinson, C.; Treitz, P. Assessing the Three-Dimensional Frequency Distribution of Airborne and Ground-Based Lidar Data for Red Pine and Mixed Deciduous Forest Plots. Int. Arch. Photogramm. Remote Sens. Spat. Inf. Sci. 2004, 36, W2. [Google Scholar]
  34. LaRue, E.A.; Wagner, F.W.; Fei, S.; Atkins, J.W.; Fahey, R.T.; Gough, C.M.; Hardiman, B.S. Compatibility of Aerial and Terrestrial LiDAR for Quantifying Forest Structural Diversity. Remote Sens. 2020, 12, 1407. [Google Scholar] [CrossRef]
  35. Zhao, K.; Popescu, S.; Nelson, R. Lidar Remote Sensing of Forest Biomass: A Scale-Invariant Estimation Approach Using Airborne Lasers. Remote Sens. Environ. 2009, 113, 182–196. [Google Scholar] [CrossRef]
  36. Xu, L.; Saatchi, S.S.; Shapiro, A.; Meyer, V.; Ferraz, A.; Yang, Y.; Bastin, J.-F.; Banks, N.; Boeckx, P.; Verbeeck, H.; et al. Spatial Distribution of Carbon Stored in Forests of the Democratic Republic of Congo. Sci. Rep. 2017, 7, 15030. [Google Scholar] [CrossRef] [PubMed]
  37. Saarela, S.; Wästlund, A.; Holmström, E.; Mensah, A.A.; Holm, S.; Nilsson, M.; Fridman, J.; Ståhl, G. Mapping Aboveground Biomass and Its Prediction Uncertainty Using LiDAR and Field Data, Accounting for Tree-Level Allometric and LiDAR Model Errors. For. Ecosyst. 2020, 7, 43. [Google Scholar] [CrossRef]
  38. Ryding, J.; Williams, E.; Smith, M.J.; Eichhorn, M.P. Assessing Handheld Mobile Laser Scanners for Forest Surveys. Remote Sens. 2015, 7, 1095–1111. [Google Scholar] [CrossRef]
  39. Bauwens, S.; Bartholomeus, H.; Calders, K.; Lejeune, P. Forest Inventory with Terrestrial LiDAR: A Comparison of Static and Hand-Held Mobile Laser Scanning. Forests 2016, 7, 127. [Google Scholar] [CrossRef]
  40. Hyyppä, E.; Kukko, A.; Kaijaluoto, R.; White, J.C.; Wulder, M.A.; Pyörälä, J.; Liang, X.; Yu, X.; Wang, Y.; Kaartinen, H.; et al. Accurate Derivation of Stem Curve and Volume Using Backpack Mobile Laser Scanning. ISPRS J. Photogramm. Remote Sens. 2020, 161, 246–262. [Google Scholar] [CrossRef]
  41. Liang, X.; Kukko, A.; Kaartinen, H.; Hyyppä, J.; Yu, X.; Jaakkola, A.; Wang, Y. Possibilities of a Personal Laser Scanning System for Forest Mapping and Ecosystem Services. Sensors 2014, 14, 1228–1248. [Google Scholar] [CrossRef]
  42. Liang, X.; Hyyppä, J.; Kukko, A.; Kaartinen, H.; Jaakkola, A.; Yu, X. The Use of a Mobile Laser Scanning System for Mapping Large Forest Plots. IEEE Geosci. Remote Sens. Lett. 2014, 11, 1504–1508. [Google Scholar] [CrossRef]
  43. Jaakkola, A.; Hyyppä, J.; Kukko, A.; Yu, X.; Kaartinen, H.; Lehtomäki, M.; Lin, Y. A Low-Cost Multi-Sensoral Mobile Mapping System and Its Feasibility for Tree Measurements. ISPRS J. Photogramm. Remote Sens. 2010, 65, 514–522. [Google Scholar] [CrossRef]
  44. Yang, B.; Fang, L.; Li, J. Semi-Automated Extraction and Delineation of 3D Roads of Street Scene from Mobile Laser Scanning Point Clouds. ISPRS J. Photogramm. Remote Sens. 2013, 79, 80–93. [Google Scholar] [CrossRef]
  45. Kellner, J.R.; Armston, J.; Birrer, M.; Cushman, K.C.; Duncanson, L.; Eck, C.; Falleger, C.; Imbach, B.; Král, K.; Krůček, M. New Opportunities for Forest Remote Sensing through Ultra-High-Density Drone Lidar. Surv. Geophys. 2019, 40, 959–977. [Google Scholar] [CrossRef]
  46. Resop, J.P.; Lehmann, L.; Hession, W.C. Drone Laser Scanning for Modeling Riverscape Topography and Vegetation: Comparison with Traditional Aerial Lidar. Drones 2019, 3, 35. [Google Scholar] [CrossRef]
  47. Puliti, S.; Dash, J.P.; Watt, M.S.; Breidenbach, J.; Pearse, G.D. A Comparison of UAV Laser Scanning, Photogrammetry and Airborne Laser Scanning for Precision Inventory of Small-Forest Properties. For. Int. J. For. Res. 2020, 93, 150–162. [Google Scholar] [CrossRef]
  48. Qi, Y.; Coops, N.C.; Daniels, L.D.; Butson, C.R. Comparing Tree Attributes Derived from Quantitative Structure Models Based on Drone and Mobile Laser Scanning Point Clouds across Varying Canopy Cover Conditions. ISPRS J. Photogramm. Remote Sens. 2022, 192, 49–65. [Google Scholar] [CrossRef]
  49. Brede, B.; Bartholomeus, H.M.; Barbier, N.; Pimont, F.; Vincent, G.; Herold, M. Peering through the Thicket: Effects of UAV LiDAR Scanner Settings and Flight Planning on Canopy Volume Discovery. Int. J. Appl. Earth Obs. Geoinf. 2022, 114, 103056. [Google Scholar] [CrossRef]
  50. Shui, W.; Li, H.; Zhang, Y.; Jiang, C.; Zhu, S.; Wang, Q.; Liu, Y.; Zong, S.; Huang, Y.; Ma, M. Is an Unmanned Aerial Vehicle (UAV) Suitable for Extracting the Stand Parameters of Inaccessible Underground Forests of Karst Tiankeng? Remote Sens. 2022, 14, 4128. [Google Scholar] [CrossRef]
  51. Barazzetti, L.; Previtali, M.; Cantini, L.; Oteri, A.M. Digital Recording of Historical Defensive Structures in Mountainous Areas Using Drones: Considerations and Comparisons. Drones 2023, 7, 512. [Google Scholar] [CrossRef]
  52. Kükenbrink, D.; Schneider, F.D.; Leiterer, R.; Schaepman, M.E.; Morsdorf, F. Quantification of Hidden Canopy Volume of Airborne Laser Scanning Data Using a Voxel Traversal Algorithm. Remote Sens. Environ. 2017, 194, 424–436. [Google Scholar] [CrossRef]
  53. Torralba, J.; Carbonell-Rivera, J.P.; Ruiz, L.Á.; Crespo-Peremarch, P. Analyzing TLS Scan Distribution and Point Density for the Estimation of Forest Stand Structural Parameters. Forests 2022, 13, 2115. [Google Scholar] [CrossRef]
  54. Hopkinson, C. The Influence of Lidar Acquisition Settings on Canopy Penetration and Laser Pulse Return Characteristics. In Proceedings of the 2006 IEEE International Symposium on Geoscience and Remote Sensing, Denver, CO, USA, 31 July–4 August 2006; pp. 2420–2423. [Google Scholar]
  55. Dayal, K.R.; Durrieu, S.; Lahssini, K.; Alleaume, S.; Bouvier, M.; Monnet, J.-M.; Renaud, J.-P.; Revers, F. An Investigation into Lidar Scan Angle Impacts on Stand Attribute Predictions in Different Forest Environments. ISPRS J. Photogramm. Remote Sens. 2022, 193, 314–338. [Google Scholar] [CrossRef]
  56. Musselman, K.N.; Margulis, S.A.; Molotch, N.P. Estimation of Solar Direct Beam Transmittance of Conifer Canopies from Airborne LiDAR. Remote Sens. Environ. 2013, 136, 402–415. [Google Scholar] [CrossRef]
  57. Cifuentes, R.; Van der Zande, D.; Farifteh, J.; Salas, C.; Coppin, P. Effects of Voxel Size and Sampling Setup on the Estimation of Forest Canopy Gap Fraction from Terrestrial Laser Scanning Data. Agric. For. Meteorol. 2014, 194, 230–240. [Google Scholar] [CrossRef]
  58. Magney, T.S.; Eitel, J.U.H.; Griffin, K.L.; Boelman, N.T.; Greaves, H.E.; Prager, C.M.; Logan, B.A.; Zheng, G.; Ma, L.; Fortin, E.A.; et al. LiDAR Canopy Radiation Model Reveals Patterns of Photosynthetic Partitioning in an Arctic Shrub. Agric. For. Meteorol. 2016, 221, 78–93. [Google Scholar] [CrossRef]
  59. Li, W.; Guo, Q.; Tao, S.; Su, Y. VBRT: A Novel Voxel-Based Radiative Transfer Model for Heterogeneous Three-Dimensional Forest Scenes. Remote Sens. Environ. 2018, 206, 318–335. [Google Scholar] [CrossRef]
  60. Xie, D.; Wang, X.; Qi, J.; Chen, Y.; Mu, X.; Zhang, W.; Yan, G. Reconstruction of Single Tree with Leaves Based on Terrestrial LiDAR Point Cloud Data. Remote Sens. 2018, 10, 686. [Google Scholar] [CrossRef]
  61. Disney, M.; Lewis, P.; Saich, P. 3D Modelling of Forest Canopy Structure for Remote Sensing Simulations in the Optical and Microwave Domains. Remote Sens. Environ. 2006, 100, 114–132. [Google Scholar] [CrossRef]
  62. Van der Zande, D.; Mereu, S.; Nadezhdina, N.; Cermak, J.; Muys, B.; Coppin, P.; Manes, F. 3D Upscaling of Transpiration from Leaf to Tree Using Ground-Based LiDAR: Application on a Mediterranean Holm Oak (Quercus ilex L.) Tree. Agric. For. Meteorol. 2009, 149, 1573–1583. [Google Scholar] [CrossRef]
  63. Bienert, A.; Queck, R.; Schmidt, A.; Bernhofer, C.; Maas, H.-G. Voxel Space Analysis of Terrestrial Laser Scans in Forests for Wind Field Modelling. Int. Arch. Photogramm. Remote Sens. Spat. Inf. Sci. 2010, 38, 92–97. [Google Scholar]
  64. Béland, M.; Widlowski, J.-L.; Fournier, R.A.; Côté, J.-F.; Verstraete, M.M. Estimating Leaf Area Distribution in Savanna Trees from Terrestrial LiDAR Measurements. Agric. For. Meteorol. 2011, 151, 1252–1266. [Google Scholar] [CrossRef]
  65. Béland, M.; Widlowski, J.-L.; Fournier, R.A. A Model for Deriving Voxel-Level Tree Leaf Area Density Estimates from Ground-Based LiDAR. Environ. Model. Softw. 2014, 51, 184–189. [Google Scholar] [CrossRef]
  66. Stovall, A.E.L.; Vorster, A.G.; Anderson, R.S.; Evangelista, P.H.; Shugart, H.H. Non-Destructive Aboveground Biomass Estimation of Coniferous Trees Using Terrestrial LiDAR. Remote Sens. Environ. 2017, 200, 31–42. [Google Scholar] [CrossRef]
  67. Paynter, I.; Genest, D.; Saenz, E.; Peri, F.; Li, Z.; Strahler, A.; Schaaf, C. Quality Assessment of Terrestrial Laser Scanner Ecosystem Observations Using Pulse Trajectories. IEEE Trans. Geosci. Remote Sens. 2018, 56, 6324–6333. [Google Scholar] [CrossRef]
  68. Zong, X.; Wang, T.; Skidmore, A.K.; Heurich, M. The Impact of Voxel Size, Forest Type, and Understory Cover on Visibility Estimation in Forests Using Terrestrial Laser Scanning. GIScience Remote Sens. 2021, 58, 323–339. [Google Scholar] [CrossRef]
  69. Morsdorf, F.; Frey, O.; Koetz, B.; Meier, E. Ray Tracing for Modeling of Small Footprint Airborne Laser Scanning Returns. Int. Arch. Photogramm. Remote Sens. Spat. Inf. Sci. 2007, 36, 249–299. [Google Scholar]
  70. Korpela, I.; Hovi, A.; Morsdorf, F. Understory Trees in Airborne LiDAR Data—Selective Mapping Due to Transmission Losses and Echo-Triggering Mechanisms. Remote Sens. Environ. 2012, 119, 92–104. [Google Scholar] [CrossRef]
  71. Vincent, G.; Antin, C.; Laurans, M.; Heurtebize, J.; Durrieu, S.; Lavalley, C.; Dauzat, J. Mapping Plant Area Index of Tropical Evergreen Forest by Airborne Laser Scanning. A Cross-Validation Study Using LAI2200 Optical Sensor. Remote Sens. Environ. 2017, 198, 254–266. [Google Scholar] [CrossRef]
  72. Gastellu-Etchegorry, J.-P.; Yin, T.; Lauret, N.; Grau, E.; Rubio, J.; Cook, B.D.; Morton, D.C.; Sun, G. Simulation of Satellite, Airborne and Terrestrial LiDAR with DART (I): Waveform Simulation with Quasi-Monte Carlo Ray Tracing. Remote Sens. Environ. 2016, 184, 418–435. [Google Scholar] [CrossRef]
  73. Yang, X.; Wang, Y.; Yin, T.; Wang, C.; Lauret, N.; Regaieg, O.; Xi, X.; Gastellu-Etchegorry, J.P. Comprehensive LiDAR Simulation with Efficient Physically-Based DART-Lux Model (I): Theory, Novelty, and Consistency Validation. Remote Sens. Environ. 2022, 272, 112952. [Google Scholar] [CrossRef]
  74. Winiwarter, L.; Esmorís Pena, A.M.; Weiser, H.; Anders, K.; Martínez Sánchez, J.; Searle, M.; Höfle, B. Virtual Laser Scanning with HELIOS++: A Novel Take on Ray Tracing-Based Simulation of Topographic Full-Waveform 3D Laser Scanning. Remote Sens. Environ. 2022, 269, 112772. [Google Scholar] [CrossRef]
  75. Amanatides, J.; Woo, A. A Fast Voxel Traversal Algorithm for Ray Tracing. Eurographics 1987, 87, 3–10. [Google Scholar]
  76. Schneider, F.D.; Kükenbrink, D.; Schaepman, M.E.; Schimel, D.S.; Morsdorf, F. Quantifying 3D Structure and Occlusion in Dense Tropical and Temperate Forests Using Close-Range LiDAR. Agric. For. Meteorol. 2019, 268, 249–257. [Google Scholar] [CrossRef]
  77. Anderson-Teixeira, K.J.; Davies, S.J.; Bennett, A.C.; Gonzalez-Akre, E.B.; Muller-Landau, H.C.; Wright, S.J.; Abu Salim, K.; Almeyda Zambrano, A.M.; Alonso, A.; Baltzer, J.L.; et al. CTFS-ForestGEO: A Worldwide Network Monitoring Forests in an Era of Global Change. Glob. Chang. Biol. 2015, 21, 528–549. [Google Scholar] [CrossRef]
  78. Janík, D.; Král, K.; Adam, D.; Hort, L.; Samonil, P.; Unar, P.; Vrska, T.; McMahon, S. Tree Spatial Patterns of Fagus Sylvatica Expansion over 37 years. For. Ecol. Manag. 2016, 375, 134–145. [Google Scholar] [CrossRef]
  79. Cushman, K.C.; Armston, J.; Dubayah, R.; Duncanson, L.; Hancock, S.; Janík, D.; Král, K.; Krůček, M.; Minor, D.M.; Tang, H.; et al. Impact of Leaf Phenology on Estimates of Aboveground Biomass Density in a Deciduous Broadleaf Forest from Simulated GEDI Lidar. Environ. Res. Lett. 2023, 18, 065009. [Google Scholar] [CrossRef]
  80. Zhang, K.; Chen, S.-C.; Whitman, D.; Shyu, M.-L.; Yan, J.; Zhang, C. A Progressive Morphological Filter for Removing Nonground Measurements from Airborne LIDAR Data. IEEE Trans. Geosci. Remote Sens. 2003, 41, 872–882. [Google Scholar] [CrossRef]
  81. Krůček, M.; Král, K.; Cushman, K.C.; Missarov, A.; Kellner, J.R. Supervised Segmentation of Ultra-High-Density Drone Lidar for Large-Area Mapping of Individual Trees. Remote Sens. 2020, 12, 3260. [Google Scholar] [CrossRef]
  82. Trochta, J.; Krůček, M.; Vrška, T.; Král, K. 3D Forest: An Application for Descriptions of Three-Dimensional Forest Structures Using Terrestrial LiDAR. PLoS ONE 2017, 12, e0176871. [Google Scholar] [CrossRef]
  83. Terryn, L.; Calders, K.; Bartholomeus, H.; Bartolo, R.E.; Brede, B.; D’hont, B.; Disney, M.; Herold, M.; Lau, A.; Shenkin, A.; et al. Quantifying Tropical Forest Structure through Terrestrial and UAV Laser Scanning Fusion in Australian Rainforests. Remote Sens. Environ. 2022, 271, 112912. [Google Scholar] [CrossRef]
  84. Lovell, J.L.; Jupp, D.L.B.; Newnham, G.J.; Culvenor, D.S. Measuring Tree Stem Diameters Using Intensity Profiles from Ground-Based Scanning Lidar from a Fixed Viewpoint. ISPRS J. Photogramm. Remote Sens. 2011, 66, 46–55. [Google Scholar] [CrossRef]
  85. Liang, X.; Litkey, P.; Hyyppa, J.; Kaartinen, H.; Vastaranta, M.; Holopainen, M. Automatic Stem Mapping Using Single-Scan Terrestrial Laser Scanning. IEEE Trans. Geosci. Remote Sens. 2012, 50, 661–670. [Google Scholar] [CrossRef]
  86. Murphy, G.E.; Acuna, M.A.; Dumbrell, I. Tree Value and Log Product Yield Determination in Radiata Pine (Pinus radiata) Plantations in Australia: Comparisons of Terrestrial Laser Scanning with a Forest Inventory System and Manual Measurements. Can. J. For. Res. 2010, 40, 2223–2233. [Google Scholar] [CrossRef]
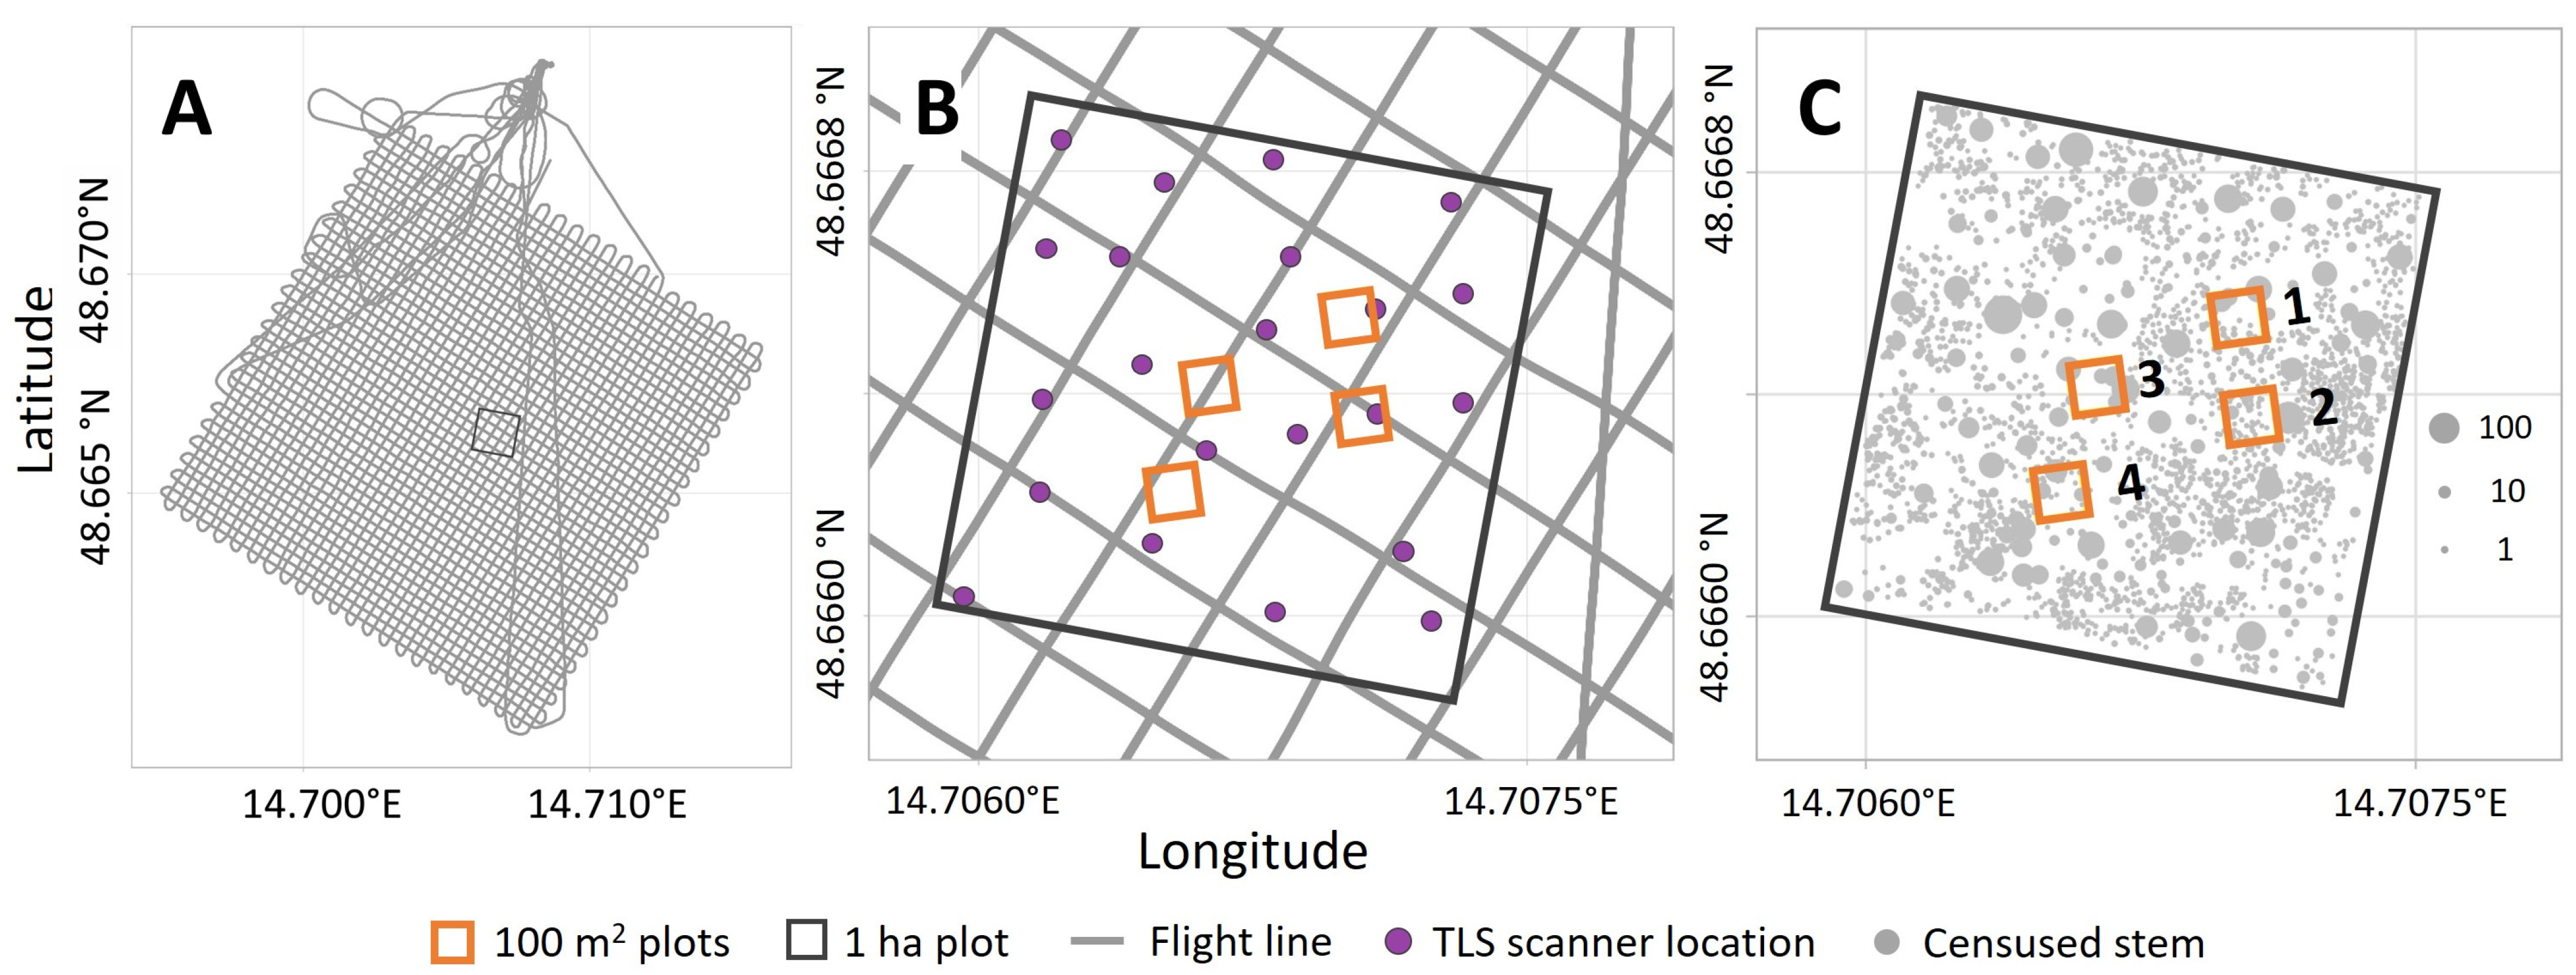
Figure 1. (A) Flight lines from drone lidar in a temperate mountain forest in the southwest Czech Republic. We completed two sets of orthogonal flight lines. (B) Locations of TLS scans and 100 m2 plots used in this study. (C) The 100 m2 plots used in this study in relation to censused stems. The point size of the censused stems is proportional to DBH (unit: cm).
Remotesensing 16 02774 g001
Figure 2. High-resolution forest structure from a high-density drone. Squares are 0.5 m voxels. Voxels were classified into four categories using non-ground returns from drone lidar: voxels with one or more returns (green), voxels that were searched by laser pulses and contained no return (yellow), voxels with only occluded pulses (blue), and voxels with no returns, laser pulses, or occluded pulses (white). Grey dots on green voxels represent lidar returns. Darker grey dots indicate more returns in the voxel.
Remotesensing 16 02774 g002
Figure 3. Voxel traversal and voxel type determination. (A) Illustration of voxel traversal in a 2-D view featuring nine voxels and a laser pulse generating a return. All the squares represent occupied voxels. The solid yellow line segment represents a pulse trajectory. The green dot represents a lidar return. The black dot is the starting point of the pulse trajectory. Letters a–i are labels for the voxels. (B) Relationships among the voxels depicted in (A).
Remotesensing 16 02774 g003
Figure 4. Sampling completeness (the proportion of occupied voxels that were detected) as a function of pulse density and scan-angle range (plot 1). (A) When scan-angle range was decoupled from pulse density, sampling completeness was more strongly associated with pulse density than with scan-angle range. (B) Sampling completeness when scan-angle range was not decoupled from pulse density. Missing data points in (A) are associated with small sample sizes at certain combinations of scan-angle range and pulse density.
Remotesensing 16 02774 g004
Figure 5. Proportions of occupied voxels that were detected and undetected as a function of pulse density and scan-angle range (plot 1). On each of the six panels, from left to right, the black dots represent pulse densities of 1, 10, 50, 100, 200, 300, 400, 500, 1000, 1500 pulses/m2. Only 6 levels of scan-angle range (±10°, ±20°, ±30°, ±40°, ±50° and ±60°) are shown here because Figure 4 shows the limited impact of scan-angle range after decoupling its impact from pulse density. Missing data points are associated with small sample sizes at certain combinations of scan-angle range and pulse density.
Remotesensing 16 02774 g005
Figure 6. Proportions of different types of undetected voxels under different pulse densities and scan-angle ranges (plot 1). (A) Undetected and unsearched voxels. (B) Undetected and searched voxels. (C) Undetected and unobserved voxels. (D) Undetected and completely occluded voxels. Missing data points in each panel are associated with small sample sizes at some combinations of scan-angle range and pulse density. The number of undetected and unsearched voxels (A) is equal to the number of undetected and unobserved voxels (C) plus the number of undetected and completely occluded voxels (D).
Remotesensing 16 02774 g006
Figure 7. Proportions of occupied voxels that were detected or undetected as a function of pulse density and scan-angle range at multiple heights above ground (Plot 1). Only 6 levels of scan-angle range (±10°, ±20°, ±30°, ±40°, ±50° and ±60°) are shown here because Figure 4 shows the limited impact of scan-angle range after decoupling its impact from pulse density. Missing data points are associated with small sample sizes at certain combinations of scan-angle range and pulse density. The number of occupied voxels at each height (i.e., the denominator for calculating proportions of different undetected voxels at each height) is shown in Figure A15.
Remotesensing 16 02774 g007
Figure 8. Proportions of occupied voxels that were detected and undetected as a function of pulse density and scan-angle range at multiple heights above ground (plot 1). Only 6 levels of scan-angle range (±10°, ±20°, ±30°, ±40°, ±50° and ±60°) are shown here because Figure 4 shows the limited impact of scan-angle range after decoupling its impact from pulse density. Missing data points are associated with small sample sizes at certain combinations of scan-angle range and pulse density. The number of occupied voxels at each height (i.e., the denominator for calculating proportions of different undetected voxels at each height) is shown in Figure A15.
Remotesensing 16 02774 g008
Figure 9. The proportion of undetected and searched voxels at different heights as a function of pulse density and scan-angle range in the 100 m2 plot (Plot 1). Only 6 levels of scan-angle range (±10°, ±20°, ±30°, ±40°, ±50° and ±60°) are shown here because Figure 4 shows the limited impact of scan-angle range after decoupling its impact from pulse density. Missing data points are associated with small sample sizes at certain combinations of scan-angle range and pulse density.
Remotesensing 16 02774 g009
Figure 10. The proportion of undetected and completely occluded voxels at different heights as a function of pulse density and scan-angle range in the 100 m2 plot (Plot 1). Only 6 levels of scan-angle range (±10°, ±20°, ±30°, ±40°, ±50° and ±60°) are shown here because Figure 4 shows the limited impact of scan-angle range after decoupling its impact from pulse density. Missing data points are associated with small sample sizes at some combinations of scan-angle range and pulse density.
Remotesensing 16 02774 g010
Table 1. Stem density and DBH within each plot used in the study.
Plot1 ha100 m2
1234
Mean point density (points/m2)33543870388138282953
Stem density (stems/m2)0.30.20.50.030.2
Mean DBH (cm)5.29.32.447.79.6
Maximum DBH (cm)134.260.037.061.573.0
Minimum DBH (cm)1.01.11.039.41.0
Disclaimer/Publisher’s Note: The statements, opinions and data contained in all publications are solely those of the individual author(s) and contributor(s) and not of MDPI and/or the editor(s). MDPI and/or the editor(s) disclaim responsibility for any injury to people or property resulting from any ideas, methods, instructions or products referred to in the content.