Article

MSSD-Net: Multi-Scale SAR Ship Detection Network

1
College of Information Engineering, Inner Mongolia University of Technology, Hohhot 010051, China
2
Inner Mongolia Key Laboratory of Radar Technology and Application, Hohhot 010051, China
*
Author to whom correspondence should be addressed.
Remote Sens. 2024, 16(12), 2233; https://doi.org/10.3390/rs16122233
Submission received: 12 May 2024 / Revised: 9 June 2024 / Accepted: 18 June 2024 / Published: 19 June 2024
(This article belongs to the Topic Computer Vision and Image Processing, 2nd Edition)

Abstract

:
In recent years, the development of neural networks has significantly advanced their application in Synthetic Aperture Radar (SAR) ship target detection for maritime traffic control and ship management. However, traditional neural network architectures are often complex and resource intensive, making them unsuitable for deployment on artificial satellites. To address this issue, this paper proposes a lightweight neural network: the Multi-Scale SAR Ship Detection Network (MSSD-Net). Initially, the MobileOne network module is employed to construct the backbone network for feature extraction from SAR images. Subsequently, a Multi-Scale Coordinate Attention (MSCA) module is designed to enhance the network’s capability to process contextual information. This is followed by the integration of features across different scales using an FPN + PAN structure. Lastly, an Anchor-Free approach is utilized for the rapid detection of ship targets. To evaluate the performance of MSSD-Net, we conducted extensive experiments on the Synthetic Aperture Radar Ship Detection Dataset (SSDD) and SAR-Ship-Dataset. Our experimental results demonstrate that MSSD-Net achieves a mean average precision (mAP) of 98.02% on the SSDD while maintaining a compact model size of only 1.635 million parameters. This indicates that MSSD-Net effectively reduces model complexity without compromising its ability to achieve high accuracy in object detection tasks.

1. Introduction

In the field of ocean monitoring, Synthetic Aperture Radar (SAR) technology is particularly advantageous for detecting ship targets due to its all-weather, all-time surveillance capabilities [1]. Since ships are the primary mode of maritime transportation, monitoring their movements is crucial for the regulation and management of maritime traffic. Compared to conventional optical remote sensing technologies, SAR can penetrate adverse weather conditions and provide high-resolution images, making it an optimal instrument for marine monitoring [2]. However, analyzing SAR images can be challenging due to the complex nature of sea surface backgrounds, the presence of clutter interference, and the blurred features of ship targets in the images. As globalization progresses, the significance of the ocean in military security, maritime transport, and environmental monitoring is becoming increasingly evident. Consequently, developing robust SAR ship detection technology is of paramount importance for enhancing marine safety, environmental monitoring, and resource management capabilities.
Traditional SAR ship target detection methods heavily rely on manually designed features and rules. For example, they use CFAR [3] algorithms to distinguish ship signals from the ocean background or extract information such as brightness, contrast, and texture for identification. However, these methods often struggle to achieve satisfactory detection accuracy in complex backgrounds. In recent years, the rapid advancement of deep learning technology has driven progress in deep learning-based SAR ship target detection methods. These methods automatically learn the features of ship targets in SAR images, leading to higher detection accuracy and robustness compared to traditional methods [4]. Faster R-CNN employs a Region Proposal Network (RPN) to generate candidate regions and extract features using a convolutional neural network, achieving both high accuracy and speed in target detection [5]. SSD directly predicts the class and bounding box on multiple feature maps of different sizes, effectively improving processing speed while maintaining high accuracy [6]. FCOS, as a fully convolutional single-stage detection model, eliminates anchor boxes by directly predicting the class and bounding coordinates at each pixel point, simplifying the model structure and enhancing detection efficiency [7]. YOLOv5 utilizes more efficient activation functions, modular design, and adaptive anchor box sizes, significantly improving the model’s processing speed and accuracy while maintaining its lightweight characteristics [8]. YOLOv8 builds upon these advancements by incorporating the latest convolutional architectures, improved attention mechanisms, and more refined feature fusion techniques [9]. It demonstrates higher accuracy and efficiency, particularly in small target detection.
Traditional object detection models face significant challenges when deployed on satellite platforms. These models often exhibit complex architectures, demanding substantial computational resources and storage capacity, which are severely limited on satellites. Spaceborne Synthetic Aperture Radar (SAR) systems, constrained by launch costs, impose strict limitations on both size and weight, making it impractical to accommodate the high memory and processing power requirements of existing object detection models. Furthermore, while transmitting SAR data back to the ground for processing is feasible, it incurs significant time delays and communication costs due to limited satellite bandwidth [10]. To overcome these limitations, developing lightweight neural network models capable of real-time object detection on board satellites without compromising accuracy is crucial. Such models would effectively utilize the limited resources available on satellite platforms while simultaneously reducing data transmission requirements and costs. This approach promises to revolutionize the field of satellite-based object detection, enabling the efficient and timely analysis of valuable SAR data. Several lightweight neural network architectures have been designed specifically for deployment on low-performance devices. For instance, MobileNet applies depthwise separable convolutions, reducing the model size and computational load by dividing a standard convolution into depthwise and pointwise convolutions [11]. ShuffleNet further reduces the model burden through channel shuffling and grouped convolutions, enhancing inter-channel information flow [12]. Xception employs depthwise separable convolutions to enhance channel independence and raise the efficiency of feature extraction [13]. GhostNet enhances the expressive capability of the network by generating more feature maps at a lower cost [14]. MixNet uses a convolutional architecture with multiple kernel sizes, improving the capture of complex features [15]. Although these networks perform well with high-resolution, low-noise optical images, they are not directly applicable for detecting ship targets in Synthetic Aperture Radar (SAR) images. SAR images are typically characterized by lower resolutions and higher noise levels, along with complex phase information and speckle noise that present significant challenges for feature extraction. Furthermore, the network architectures need to be optimized according to the characteristics of SAR imagery. This means developing a network capable of effectively handling the complex features inherent in SAR images and possessing high robustness to adapt to the unique noise and interference of SAR imagery, thereby improving accuracy in ship target detection. Dong et al. [16] proposed the FCCD-SAR algorithm, which leverages a lightweight design based on FasterNet. This architecture combines YOLOv5 and the C3-Faster module, which is further enhanced by CARAFE upsampling. While demonstrating efficient target recognition, performance under extremely low model parameter conditions requires improvement. Zhou et al. [17] introduced the HRLE-SARDet algorithm, integrating lightweight neural network structures with representation learning enhancement modules. This approach significantly reduces model parameters and computational requirements, making it suitable for embedded deployment while maintaining high detection performance. However, detection accuracy decreases when parameters are compressed to the extreme. Cuo et al. [18] developed the LMSD-YOLO network, centered around S-Mobilenet. The DSASFF module enables multi-scale feature fusion, making it suitable for real-time applications on mobile devices. However, performance is limited when dealing with complex SAR images. Yan et al. [19] proposed the LssDet method, employing ShuffleNet v2 as the backbone network. The CSAT module, L-PAFPN module, and Focus module enhance SAR ship target detection capabilities, achieving efficient detection with low computational complexity. However, low-contrast SAR images remain a challenge. Tian et al. [20] integrated novel convolutional modules and ECA modules into the YOLOv5 framework to form LFer-Net, improving small-target detection accuracy. However, efficiency requires enhancement on resource-constrained devices. Tang et al. [21] introduced the YOLO-SARSI method, incorporating the AMMRF convolution block and optimizing the YOLOv7 architecture. This approach improves feature fusion efficiency and target detection accuracy, but robustness in extreme environments requires optimization. Chen et al. [22] developed LiteSAR-Net, utilizing the E2IPNet preprocessing network and the CFGSPP module to enhance small-scale ship detection capabilities. However, balancing resolution and performance in high-density target areas requires optimization. Tang et al. [23] presented DBW-YOLO, based on YOLOv7-tiny. By introducing a feature extraction enhancement network and adaptive feature recognition, this method enhances detection speed and accuracy for small targets and near-shore ships in complex environments. However, marine environment adaptability and stability require improvement. Zhao et al. [24] proposed the MSFA-YOLO approach, which fuses the attention-based C2fSE module and DenseASPP module. The use of the Wise-IoU loss function optimizes the model, enhancing the detection accuracy of ships across different scales, especially in low-quality images. However, robustness and accuracy require further research and improvement.
Existing methods for ship detection in Synthetic Aperture Radar (SAR) images often face a trade-off between model size and detection accuracy, with model compression typically leading to performance degradation. This paper presents MSSD-Net, a novel model that addresses this limitation. MSSD-Net leverages the lightweight MobileOne [25] architecture as its backbone for efficient feature extraction and incorporates a novel Multi-Scale Context Aggregation (MSCA) module to effectively tackle the challenges of multi-scale target detection in SAR imagery. Furthermore, MSSD-Net adopts a hybrid Feature Pyramid Network (FPN) and Path Aggregation Network (PAN) structure for enhanced feature fusion and incorporates an Anchor-Free detection strategy. This strategy adapts to complex environments and achieves high detection accuracy without significant computational overhead. Compared to existing approaches, MSSD-Net demonstrates superior performance, significantly reducing model parameters and computational demands while maintaining high detection accuracy. This achievement is attributed to its efficient network architecture and innovative detection mechanism, making MSSD-Net highly advantageous for resource-constrained applications.
The remainder of this article is organized as follows: Section 2 provides a detailed explanation of the MSSD-Net model, Section 3 presents experimental analysis, and Section 4 discusses the results. Lastly, Section 5 concludes this study.

2. Materials and Methods

This section proposes MSSD-Net, a novel lightweight neural network for SAR ship detection. As illustrated in Figure 1, the architecture leverages efficient MobileOne modules for its backbone to enhance computational efficiency and reduce model complexity. A Multi-Scale Coordinate Attention (MSCA) module is introduced to significantly bolster feature extraction, ensuring richer and more diverse feature representations. The network’s neck section employs a combination of a Path Aggregation Network (PAN) [26] and a Feature Pyramid Network (FPN) [27] to further optimize multi-scale feature fusion and propagation. Finally, the head section eschews traditional anchor mechanisms, adopting an Anchor-Free [28] design for improved detection accuracy and robustness. This allows MSSD-Net to achieve high-precision ship detection with a low parameter count.

2.1. Lightweight Backbone Network: MobileOne

The main backbone network of MSSD-Net is visualized in Figure 1, consisting of five layers, C1 to C5. The C1 layer contains a single MobileOne module, while C2 and C3 consist of two and three MobileOne modules, respectively. C4 and C5 incorporate four and two MobileOne modules, respectively, with added ECA attention modules to increase feature extraction efficiency.
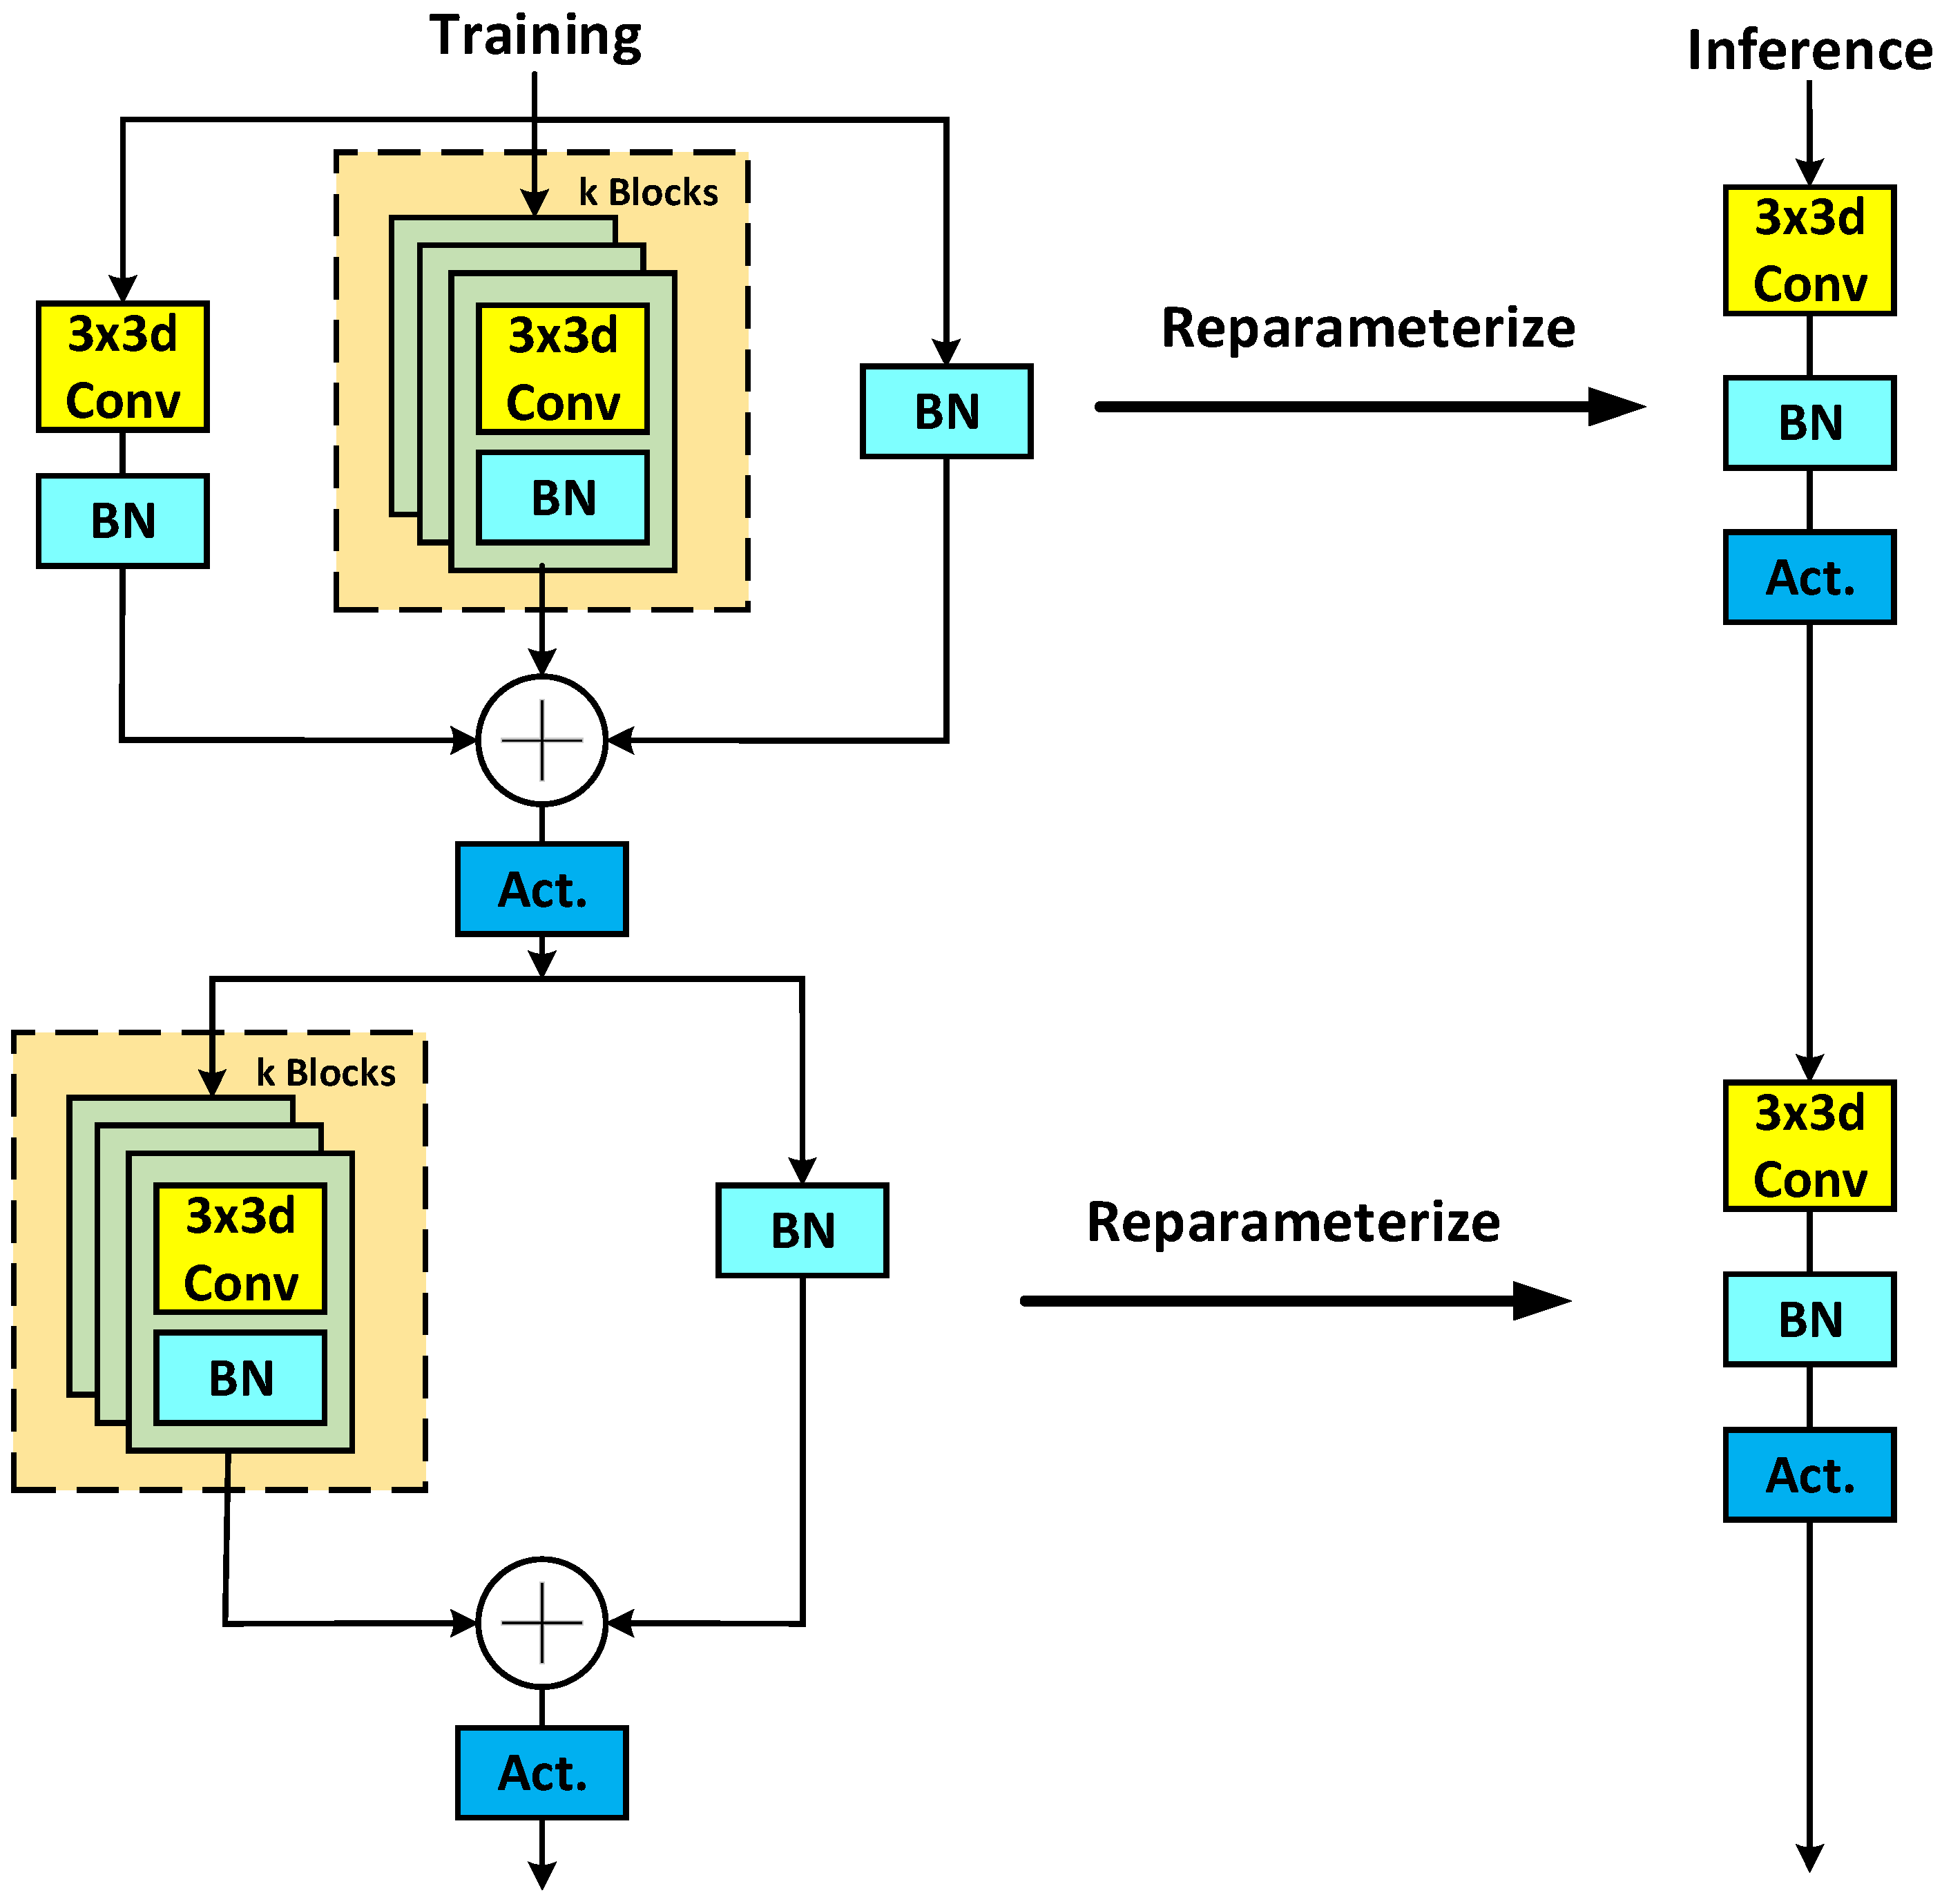
MobileOne refines its architecture to consist of two basic blocks: depthwise convolution and pointwise convolution, similar to MobileNet-V1. The MobileOne module is mainly divided into two parts: the depthwise convolution module and the pointwise convolution module. Each input channel is independently processed using its corresponding 3 × 3 convolution kernel in the depthwise convolution module, which includes three primary branches: a 1 × 1 convolution branch, an over-parameterized 3 × 3 convolution branch, and a skip connection branch. The outputs of all kernels are concatenated after the convolution operation, which greatly reduces the number of parameters in the model and the amount of computation. The pointwise convolution module, which contains an over-parameterized 1 × 1 convolution branch and a skip connection branch, is located in the bottom half of the MobileOne module. After passing through depthwise convolution, the pointwise convolution performs a 1 × 1 convolution to integrate the information between the channels, executing a weighted sum operation of all channel data at every spatial position to produce the final output [25]. Despite serving a purpose similar to that of a fully connected layer, pointwise convolution reduces the inter-channel dependencies and thereby reduces the parameter size, effectively alleviating computational demands.
As illustrated in Figure 2, MobileOne modules leverage structural reparameterization to effectively reduce computational complexity and latency during inference. The core idea lies in reconstructing the multi-branch structure of depthwise and pointwise convolutions into a single-branch equivalent convolution operation. This technique capitalizes on the equivalence of weighted summation of multiple convolution kernels, merging the multiple kernels in the multi-branch structure into a single equivalent kernel, thereby simplifying the network architecture [25,29]. Within the MobileOne module, depthwise convolutions are employed to extract features along individual channels independently, while pointwise convolutions are responsible for cross-channel information integration. This approach, which combines deep convolution with point convolution, enhances the expressive power of features. Moreover, reparameterization techniques effectively reduce the computational demands of convolution operations. This optimization significantly improves the efficiency of model inference and reduces computational costs.
In the original design of the MobileOne module, the Squeeze-and-Excitation (SE) [30] attention block was employed. This has now been replaced with the Efficient Channel Attention (ECA) [31] block. Both SE and ECA blocks aim to enhance the interaction of information between channels within neural networks, thereby increasing the focus on key channels and improving the expressive capability of the model.
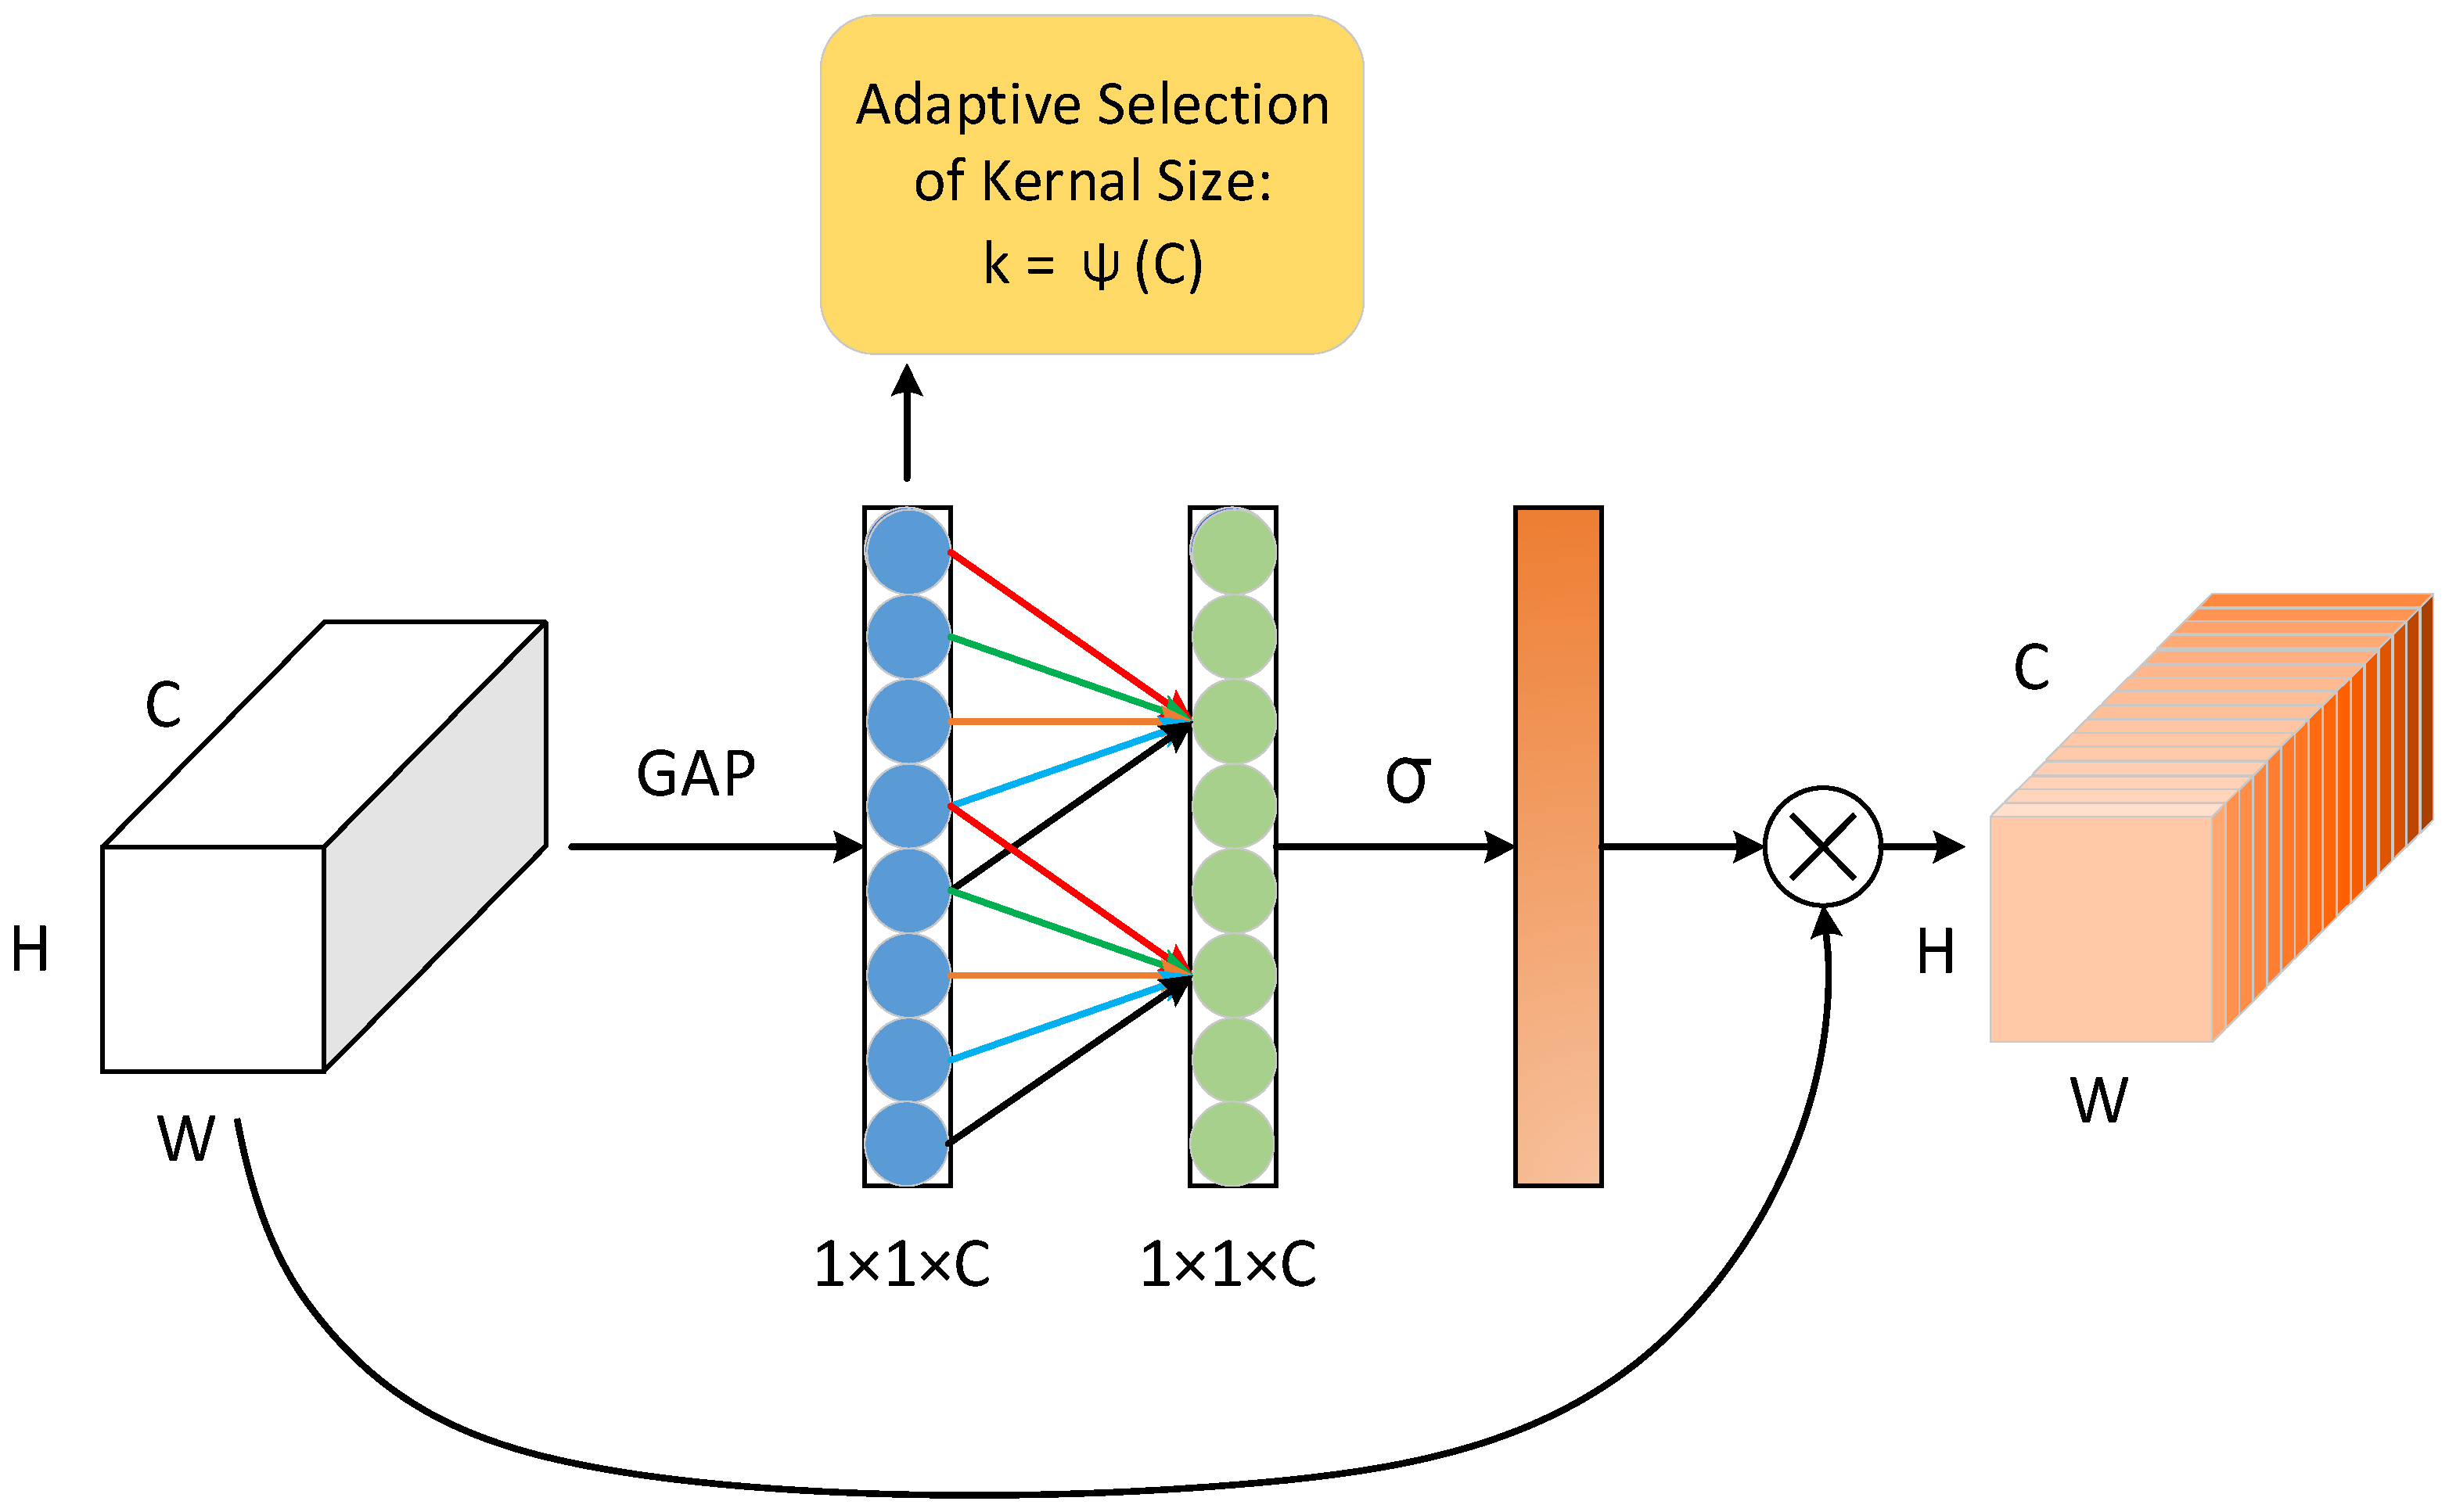
As illustrated in Figure 3, the SE (Squeeze-and-Excitation) module dynamically adapts channel weights through two components: Squeeze and Excitation. The Squeeze component utilizes global average pooling to compress each channel and extract global information. Then, the Excitation component calculates channel excitation values using two fully connected layers to obtain corresponding channel attention weights. Although the SE module emphasizes important channels, it is inefficient in computational time, especially for large-scale networks, due to its considerable computational complexity [30]. In contrast, as shown in Figure 4, the ECA (Efficient Channel Attention) module uses a more efficient approach. The ECA module first applies one-dimensional convolution along the channel direction for local feature perception and then obtains the channel attention weights using a sigmoid function [31]. Due to its reduced computational complexity, the ECA mechanism is more suitable for the design of lightweight networks and is more practical than the SE mechanism.
Consequently, substituting the SE module in the MobileOne module with an ECA module can effectively enhance the computational efficiency of the network, while allowing the model to maintain superior performance and achieve better lightweight characteristics. Such a replacement can balance performance and computational resource demands more effectively, leading to significant improvement in the overall performance of the MobileOne module. This will enable the module to perform outstandingly even in limited computational environments, making it an ideal lightweight neural network module.

2.2. Multi-Scale Coordinate Attention Module: MSCA

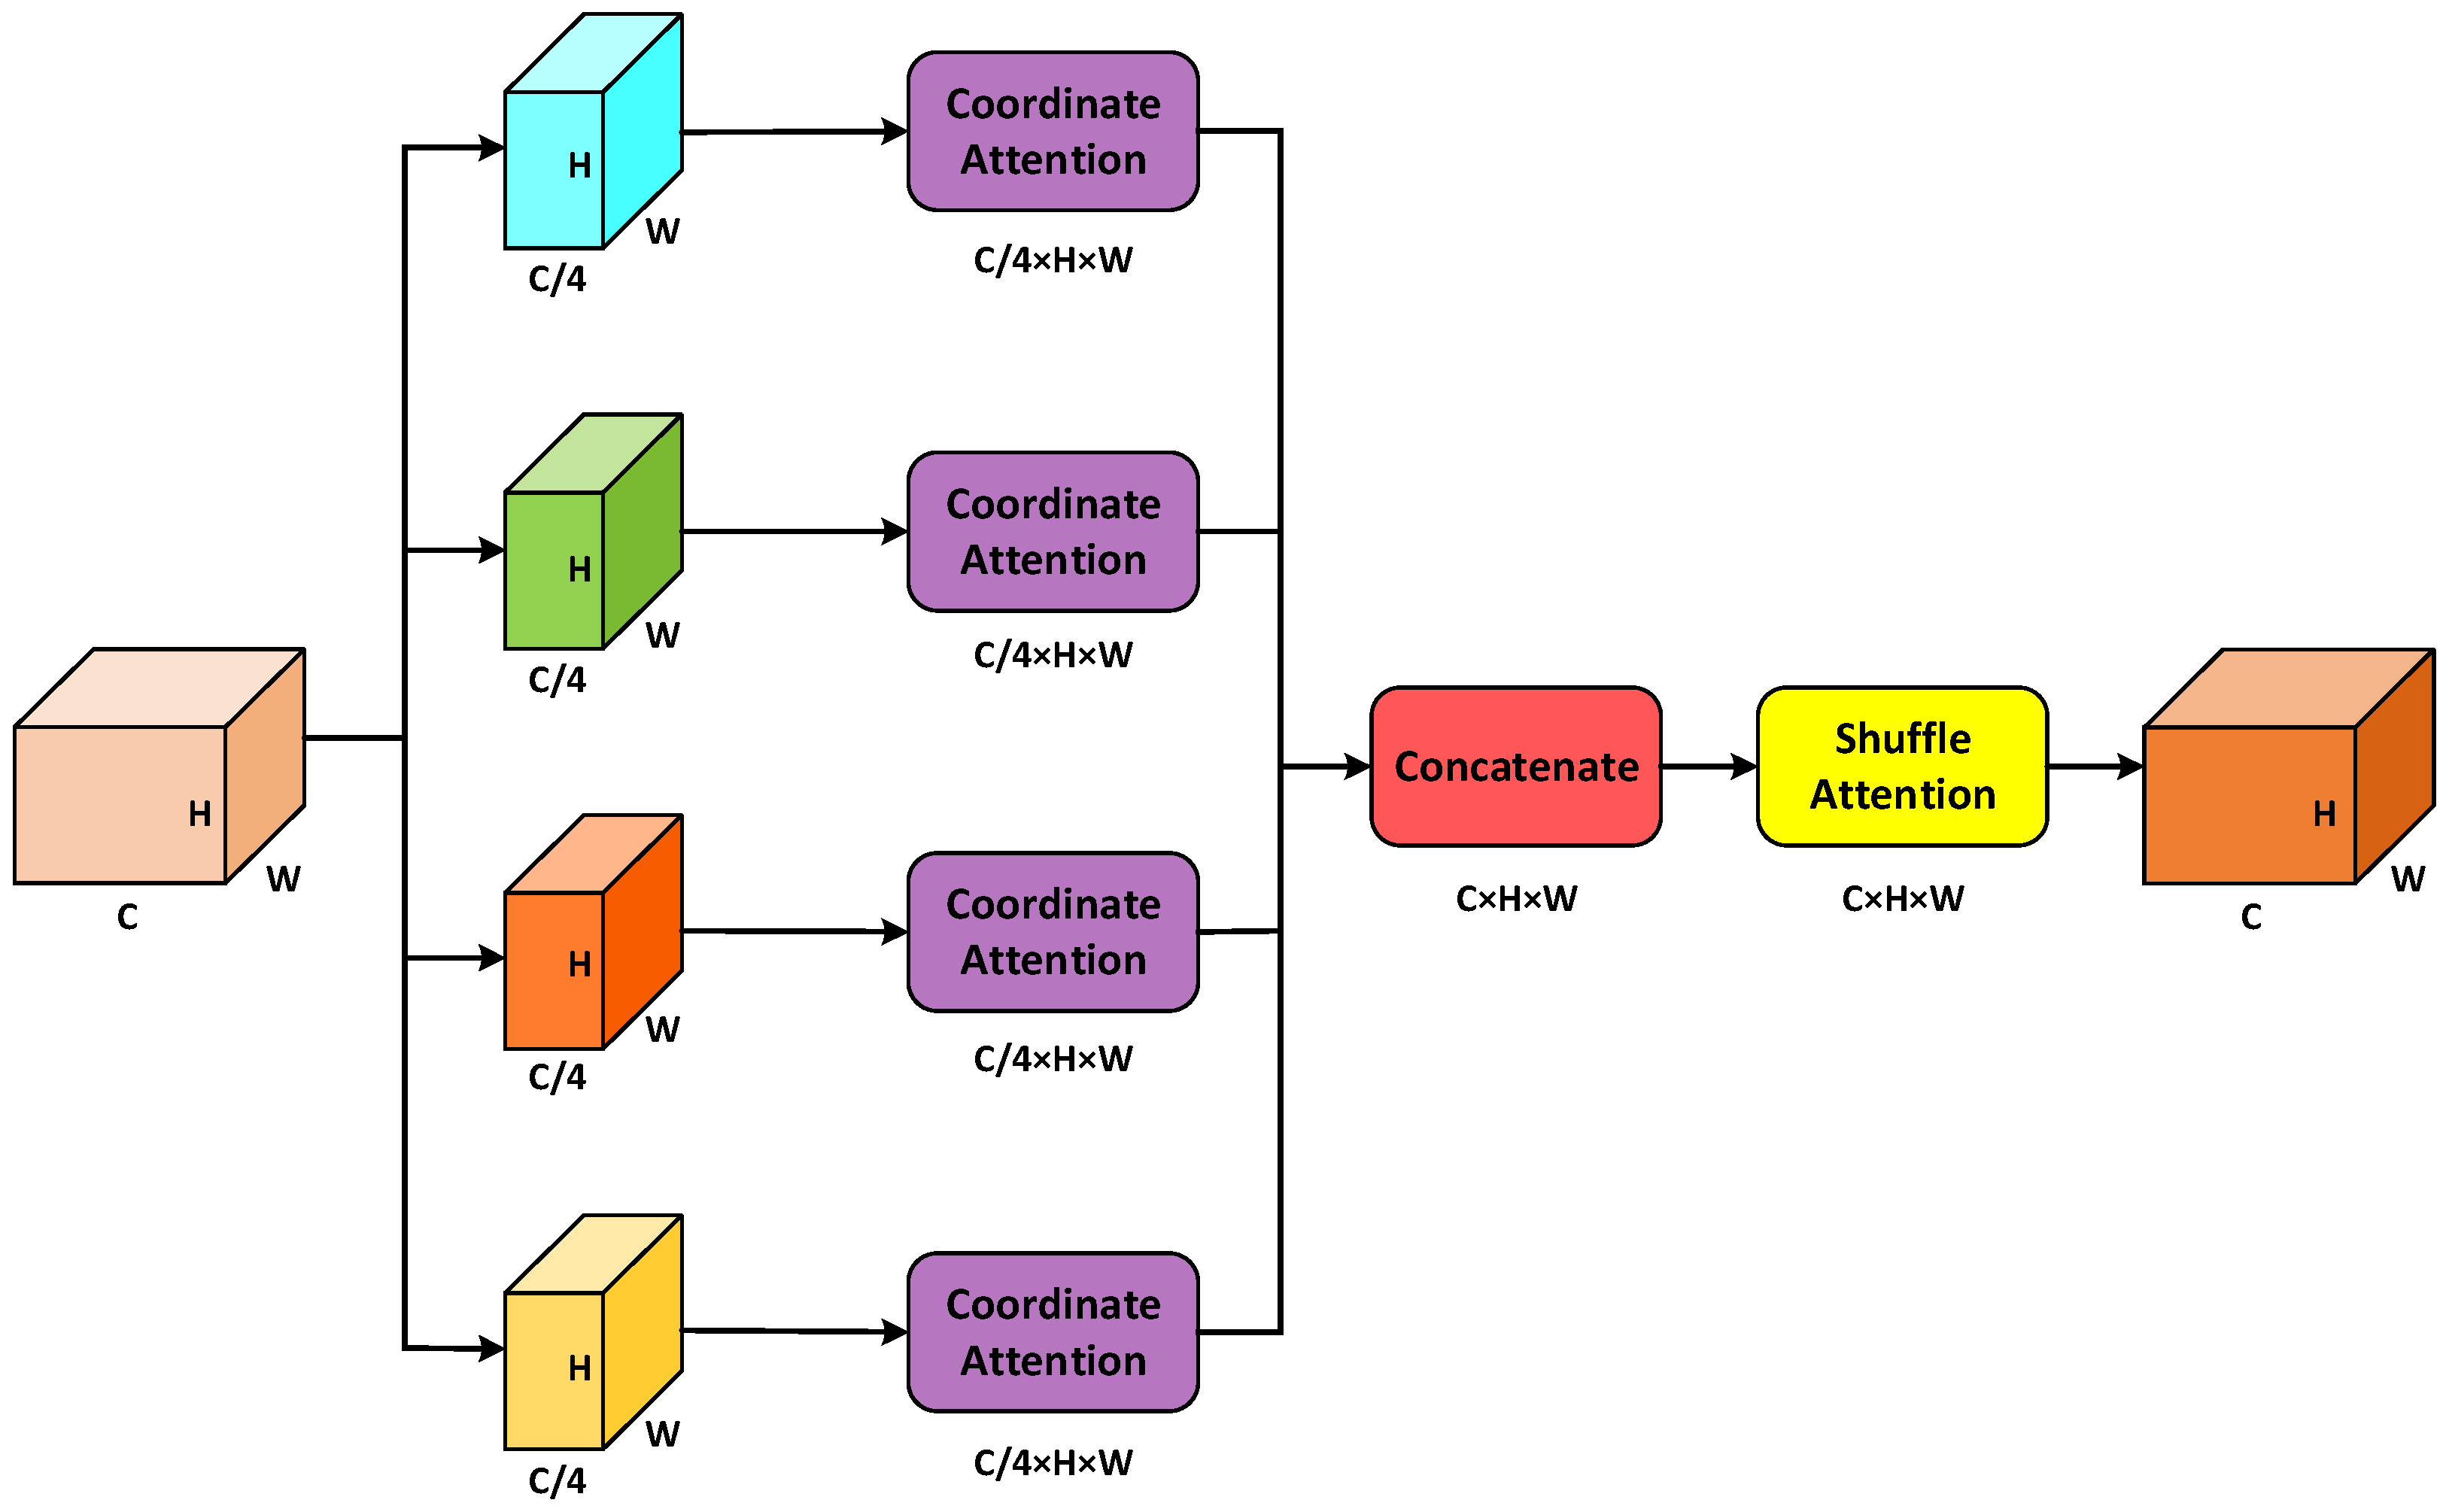
In the complex domain of ocean environment monitoring, the application of Synthetic Aperture Radar (SAR) imagery encounters numerous challenges, including waves, cloud cover, and sea surface disturbances. Additionally, ship targets in SAR images appear at varying scales, ranging from minuscule to enormous [32], which further complicates the recognition process. To address these challenges, a Multi-Scale Coordinate Attention module was designed. As illustrated in Figure 5, the core function of this module is to effectively capture the global information of the input feature map and enhance the capability to process features at different scales. The module first reduces the number of channels to a quarter of the original count through a convolutional layer. Then, dilated convolutions [33] of sizes 1, 3, 5, and 7 are applied to increase the receptive field to accommodate features of all sizes. Then, the Coordinate Attention (CA) [34] module combines features according to the coordinate information. Features from the four channels, each with a different receptive field expansion, are then combined. Lastly, a Shuffle Attention (SA) [35] module is utilized for channel shuffling to realize the combination of features across different channels effectively. The detailed structure is analyzed in greater depth below.
The applicability of dilated convolutions in the MSCA module is primarily due to their ability to greatly increase the receptive field without increasing the number of parameters or the computational burden. By incorporating zero padding, dilated convolutions enable the network to extend the kernel’s receptive field and capture a larger range of spatial information, thereby enhancing the model’s capacity for global perception [33]. This attribute is particularly useful when the target has large-scale structures or requires long-range spatial dependencies, as the network can better understand the context and overall structure of the target. Additionally, dilated convolutions reduce the loss of dimensions in feature maps, optimize the processing of multi-scale features, enhance the model’s representational capacity, and reduce computational complexity. Therefore, the use of dilated convolutions significantly enhances the model’s performance and computational efficiency [36]. Furthermore, features from different receptive field expansions are processed through a Coordinate Attention module. This module combines positional information with a channel attention mechanism to assign weights at different positions on the feature map, enhancing the focus on important areas. This combination of positional information with channel attention optimizes the model’s processing of spatial information, thereby improving overall performance and efficiency.
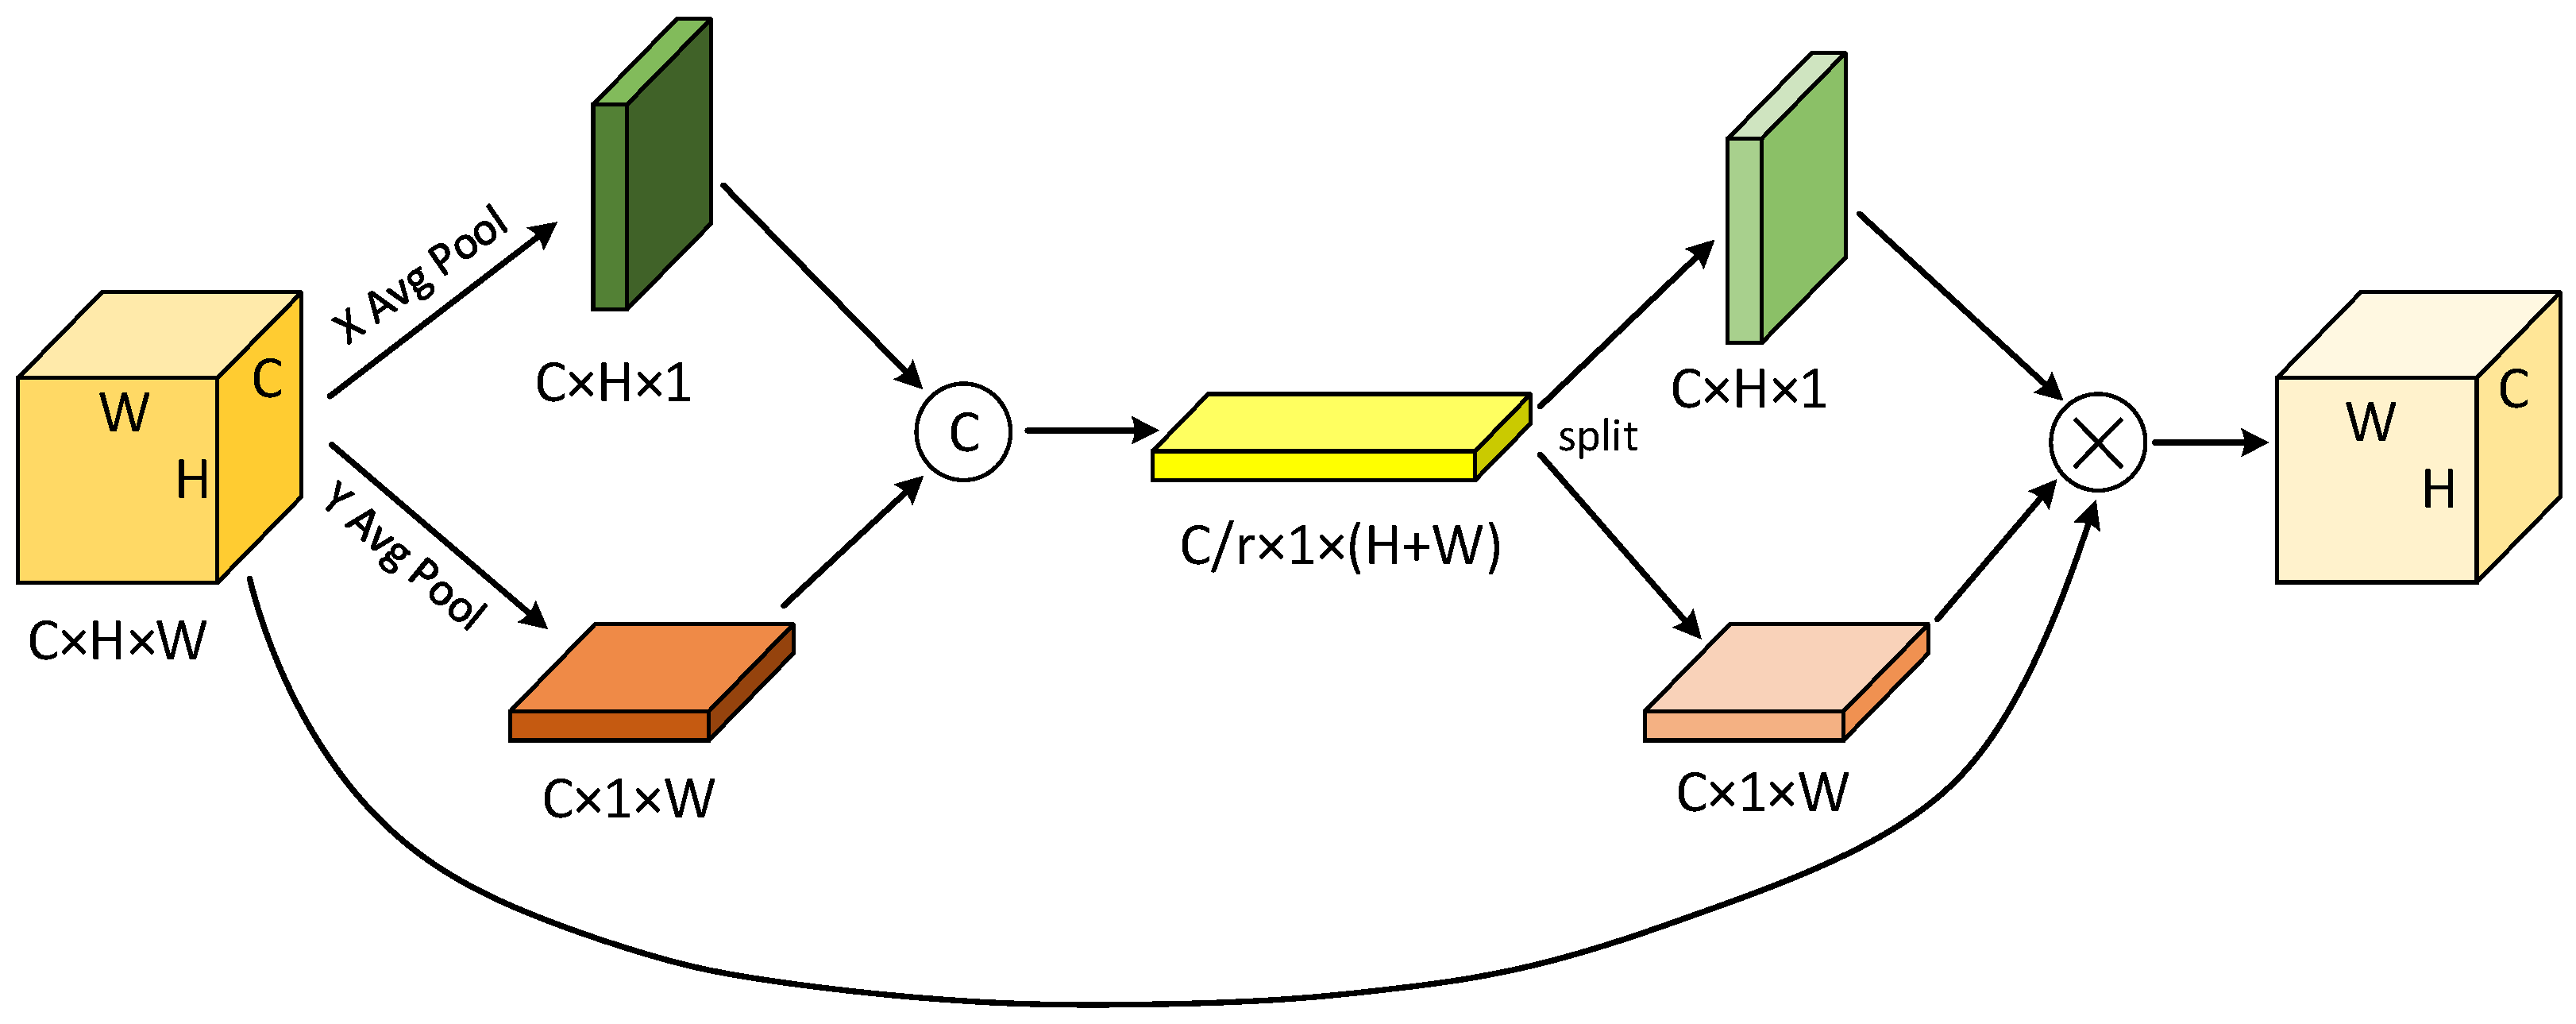
As illustrated in Figure 6, coordinate attention consists of two critical components: a positional encoder and a Channel Attention module [34]. The positional encoder is used to embed spatial information into the feature map for obtaining a position-encoded feature map. Based on these position-encoded feature maps, the channel attention mechanism computes the channel attention weights at various spatial locations. After processing the features X = [ x 1 , x 2 , x 3 , , x c ] C × H × W through an expanded receptive field, horizontal and vertical pooling are applied to each channel along the horizontal and vertical coordinates, respectively, resulting in horizontal encoding z c w ( w ) and vertical encoding z c h ( h ) .
z c w ( w ) = 1 H 0 j < H x c ( j , w )
z c h ( h ) = 1 W 0 i < W x c ( h , i )
Z w = [ z 1 w , z 2 w , z 3 w , , z c w ] C × 1 × W
Z h = [ z 1 h , z 2 h , z 3 h , , z c h ] C × H × 1
The positional encoder initially concatenates the obtained Z w and Z h , followed by the application of a 1 × 1 convolution kernel to perform feature transformation, thereby generating a positional encoding feature map. This feature map is designed to capture spatial relationships between different positions within the feature map. Subsequently, the positional encoding feature map is processed through batch normalization (BatchNorm) and a nonlinear activation function, further decomposing the feature map f into f h and f w . Subsequently, these components are processed through convolution and activation operations to compute channel attention weights. These weights assess the importance of different channels at specific locations, thereby adjusting the representation of each position within the feature map. This process enhances the model’s ability to perceive spatial feature variations, thereby optimizing feature representation.
f = δ ( B N ( C o n v ( [ Z h , Z w ] ) ) )
g h = σ ( C o n v ( f h ) )
g w = σ ( C o n v ( f w ) )
In this context, C o n v refers to convolution, B N stands for batch normalization, δ denotes the h_swish activation function, and σ represents the sigmoid activation function. The output of the Coordinate Attention module can be expressed as follows:
y c ( i , j ) = x c ( i , j ) × g c h ( i ) × g c w ( j )
The coordinate attention mechanism has been shown to significantly enhance model performance in two main aspects. Firstly, this mechanism integrates spatial coordinate information into channel attention, greatly enhancing the model’s capacity to perceive spatial information. With this design, the model can better assess the importance of different positions in the feature map, thus improving the representation of spatial dimensions. Secondly, the coordinate attention mechanism dynamically adjusts the weights of channel attention across different spatial positions, providing the model with varying perception intensities in different regions. This spatially sensitive weight adjustment strengthens the model’s focus on critical locations, thereby increasing its accuracy and robustness.
Features from four channels, processed through the Coordinate Attention module, are then concatenated and integrated by the Shuffle Attention module. This module significantly enhances the representation and classification of features by enabling the model to better interact with and transfer feature information. The architectural design combines channel attention mechanisms with feature shuffling techniques to reorganize and exchange information among the channels in the feature map. The main strategy involves using channel shuffling operations to blend and interact features across different channels. This improves the model’s understanding of inter-channel relationships, enhancing general performance and generalization ability. This approach ensures that the model is efficient and accurate in handling complex datasets.
As illustrated in Figure 7, the Shuffle Attention module includes two core components: the Channel Attention module and the Channel Shuffle Operation. The Channel Attention module is made up of a number of sub-modules, each of which is dedicated to calculating the attention weights between specific groups of channels. Subsequently, the weights are used to affect the relative importance of the corresponding channels in the feature map during the process of information exchange and recombination. Meanwhile, the channel shuffle operation rearranges the channels of the feature map by specific algorithm processes. This not only allows feature exchange among different channels but also enhances the interaction and transmission of information among channels, which can improve the information transmission ability of the feature map [35]. In the Shuffle Attention module, the feature X = [ x 1 , x 2 , x 3 , , x c ] C × H × W , post-concatenation operation, is divided along the channel dimension into g groups, each denoted as X k C / g × H × W . Each X k is subsequently divided into two along the channel dimension, generating X k 1 and X k 2 C / 2 g × H × W , which undergo different processes. X k 1 receives channel attention processing, whereas X k 2 is subjected to global attention processing. The structural design of the Shuffle Attention mechanism enables the effective combination of the advantages of both channel and global attention, resulting in the dynamic reorganization and optimization of features. The detailed process is as follows:
s = F g p ( X k 1 ) = 1 H + W i = 1 H j = 1 W X k 1 ( i , j )
Y k 1 = σ ( F c ( s ) ) X k 1 = σ ( W 1 s + b 1 ) X k 1
Y k 2 = σ ( W 2 G N ( X k 2 ) + b 2 ) X k 2
In this configuration, W 1 , W 2 C / 2 g × 1 × 1 and b 1 , b 2 C / 2 g × 1 × 1 are the scale transformation parameters of F c , σ represents the sigmoid function, and G N denotes group normalization. Subsequently, the two parts are combined via the concatenate operation to produce Y k = [ Y k 1 , Y k 2 ] . Finally, channel shuffling is used to obtain the final output Y .
The Shuffle Attention module is designed to serve two main functions. Firstly, the module enriches inter-feature interaction and information flow by embedding channel attention with channel shuffling operations. This helps not only to establish active information exchange and reorganization among features but also to reinforce the relationship between different feature maps for enhanced overall performance and generalization capability of the model. Secondly, the Shuffle Attention module modulates the dynamic relationships among different channels, which makes the model effectively handle task-relevant features. This is of paramount importance in enhancing the accuracy and robustness of the model for some specific tasks.

2.3. Feature Pyramid Neck Network: FPN + PAN

The Feature Pyramid Network (FPN) and the Path Aggregation Network (PAN) differ in their architectural design and functionality. FPN was originally designed to address the issue of multi-scale feature fusion by employing a top-down propagation mechanism and lateral connections, facilitating the effective transfer of semantic information from higher layers to lower, more detailed features. This process results in the generation of rich multi-scale feature maps, providing essential semantic information for object detection. However, the top-down propagation in FPN may result in information loss and blurring, necessitating additional feature fusion strategies for optimization. At this juncture, the introduction of PAN becomes particularly crucial [26]. The PAN module enhances the model’s localization capabilities through a bottom-up propagation mechanism, particularly in preserving detail features. The core component of the PAN architecture, the path aggregation module, extracts strong localization features from lower levels of the network and integrates them with FPN’s multi-scale feature maps via lateral connections. This integration enhances the precision of feature localization [27]. Combining FPN and PAN effectively leverages the strengths of both architectures, thereby enhancing the overall performance of the model. FPN provides a rich set of multi-scale semantic features, while PAN enhances the localization capabilities of the system through a bottom-up feature propagation mechanism. This structure captures the semantic information of targets more comprehensively and significantly improves the precision of target localization, thereby achieving higher performance in object detection tasks.
As illustrated in the neck section of Figure 1, feature layers C3, C4, and C5, derived through a Multi-Scale Coordinate Attention module, are integrated. Initially, the C5 layer, being the deepest feature layer, is upsampled to match the scale of the C4 layer and then concatenated with C4 to form an intermediate feature layer, K4. Subsequently, K4 is processed by a lightweight convolutional layer (MobileOne layer), upsampled once more to the scale of C3, and then concatenated with C3. This process generates a new feature layer, which, following further processing with a MobileOne layer, becomes a specialized layer for detecting small objects. The small object feature layer is capable of capturing finer details, thereby enhancing the detection capabilities for small-sized targets. Subsequently, in order to accommodate medium-sized object detection, the size of the small object feature layer is adjusted via convolution in order to match that of K4, and then concatenated with K4. Following processing with the MobileOne layer, a medium object feature layer is obtained. This layer retains detailed information while expanding the receptive field, rendering it more suitable for detecting medium-sized objects. Finally, to effectively detect large-sized objects, the medium object feature layer is adjusted through convolution to match the scale of C5, concatenated with C5, and then processed by the MobileOne layer to form a large object feature layer. This layer has a broader receptive field, which covers a larger feature area, thereby enhancing the detection performance for large-sized targets. The FPN + PAN structure, through the application of a progressive fusion strategy, effectively integrates multi-scale information, thereby enhancing the model’s detection capabilities across various object sizes [37]. The small object feature layer is designed to capture subtle details that are appropriate for detecting small objects. The medium object feature layer provides a balance between detail resolution and receptive field size, making it appropriate for medium-sized objects. The large object feature layer, with its even larger receptive field, is thus fit for large-sized objects. Multi-scale feature fusion improves not only detection performance but also allows real-time applications because the lightweight design of the MobileOne layer significantly reduces the computational load.

2.4. Detection Head: Anchor-Free

The object detection field enables an Anchor-Free approach with an effective and flexible network design. This approach does not require the pre-defined anchor boxes that are a hallmark of the traditional, anchor-based methods [28]. Hence, the Anchor-Free method makes network architecture simpler, lowering the design complexity with minimal requirement for the manual adjustment of anchor box sizes and ratios. As opposed to the anchor-based methods, the Anchor-Free model employs a direct regression approach to locate targets by regressing pixel positions. The direct approach not only serves to improve the model accuracy in capturing the geometric shapes and positions of objects but also strengthens model capacity in detecting targets of different sizes and ratios, thus making the detection recall rates higher with less missed detection. In addition, the Anchor-Free method can easily transfer and generalize well to different data distributions and scenarios, as it does not rely on fixed preset anchor box parameters. For that reason, this method simplifies the process of network tuning by reducing the requirement for extensive hyperparameter configurations and therefore enhances model robustness.
As illustrated in the head module of Figure 1, the Anchor-Free model incorporates two distinct types of loss functions: bounding box loss (Bbox loss) and classification loss (Cls loss). The bounding box loss comprises two distinct components: a location loss function and an object loss function.
First, the model’s precision in the location of the target is evaluated based on the loss function. In this study, the Complete Intersection over Union, CIoU [38], was used as a location loss function. CIoU represents an extension of the traditional IoU, considering the difference in the center points, aspect ratios, and area difference between target boxes. Therefore, the CIoU loss function is more accurate in assessing the similarity of target boxes, which effectively guides the model in learning precise target localization.
C I o U = I o U ρ 2 ( b , b g t ) c 2 α v
α = v ( 1 IoU ) + v
v = 4 π 2 ( arctan w g t h g t arctan w h ) 2
Loss C I o U = 1 I o U + ρ 2 ( b , b g t ) c 2 + α v
In this context, the symbol ρ represents the Euclidean distance between the predicted bounding box and the true bounding box. The symbols b and b g t represent the center coordinates of the predicted and true bounding boxes, respectively. The term c is defined as the diagonal distance of the bounding region encompassing both the predicted and true bounding boxes. The term α denotes a weighting coefficient, while v is employed to indicate the degree of similarity in aspect ratios. The terms w and h represent the width and height of the predicted bounding box, respectively, while w g t and h g t denote the width and height of the true bounding box, respectively.
Secondly, the objective loss function turns to a comprehensive consideration of the position and category information of the target. In this study, we use the Distribution Focal Loss (DFL) [39] function to act as the objective loss function, integrating the weights of the localization and classification losses. In terms of the weights on the losses concerning position information and categorical information of the target, the objective loss function guides the model effectively to accurately detect and classify the target as follows:
L o s s D F L = ( ( y i + 1 y ) log ( S i ) + ( y y i ) log ( S i + 1 ) )
S i = y i + 1 y y i + 1 y i
S i + 1 = y y i y i + 1 y i
where y is the sample label, and y i and y i + 1 are the two labels closest to ( y i < y < y i + 1 ).
Finally, the classification loss function measures how well the model predicts the target categories. In this study, we use the cross-entropy loss as the classification loss function, which effectively calculates the difference between the predicted probability distribution of the target categories by the model and the true labels [40]. Such minimization of cross-entropy loss enables the model to learn to distinguish among various categories for better classification accuracy.
L o s s C l s = ( y l o g ( y ^ ) + ( 1 y ) l o g ( 1 y ^ ) )
In this context, y ^ represents the probability that a model predicts a sample as positive, while y denotes the sample label, which is assigned a value of 1 if the sample belongs to the positive class and 0 otherwise.
In the case of object detection tasks, losses are formed by three different components: a location loss, a classification loss, and an object presence loss. The location loss employs the Complete Intersection over Union (CIoU) metric to evaluate the accuracy of the bounding box position predictions. The classification loss employs cross-entropy to evaluate the precision of target category prediction. Object presence loss utilizes the Distribution Focal Loss (DFL) function, which guides the model to precisely detect the presence of objects. These are extremely critical loss functions for enhancing the accuracy and robustness of the object detection task, especially in relation to the detection of the SAR ship target, for which the model performance drastically improves.
L o s s B b o x = L o s s C I o U + L o s s D F L
L o s s = L o s s C l s + L o s s B b o x

3. Results

3.1. Datasets

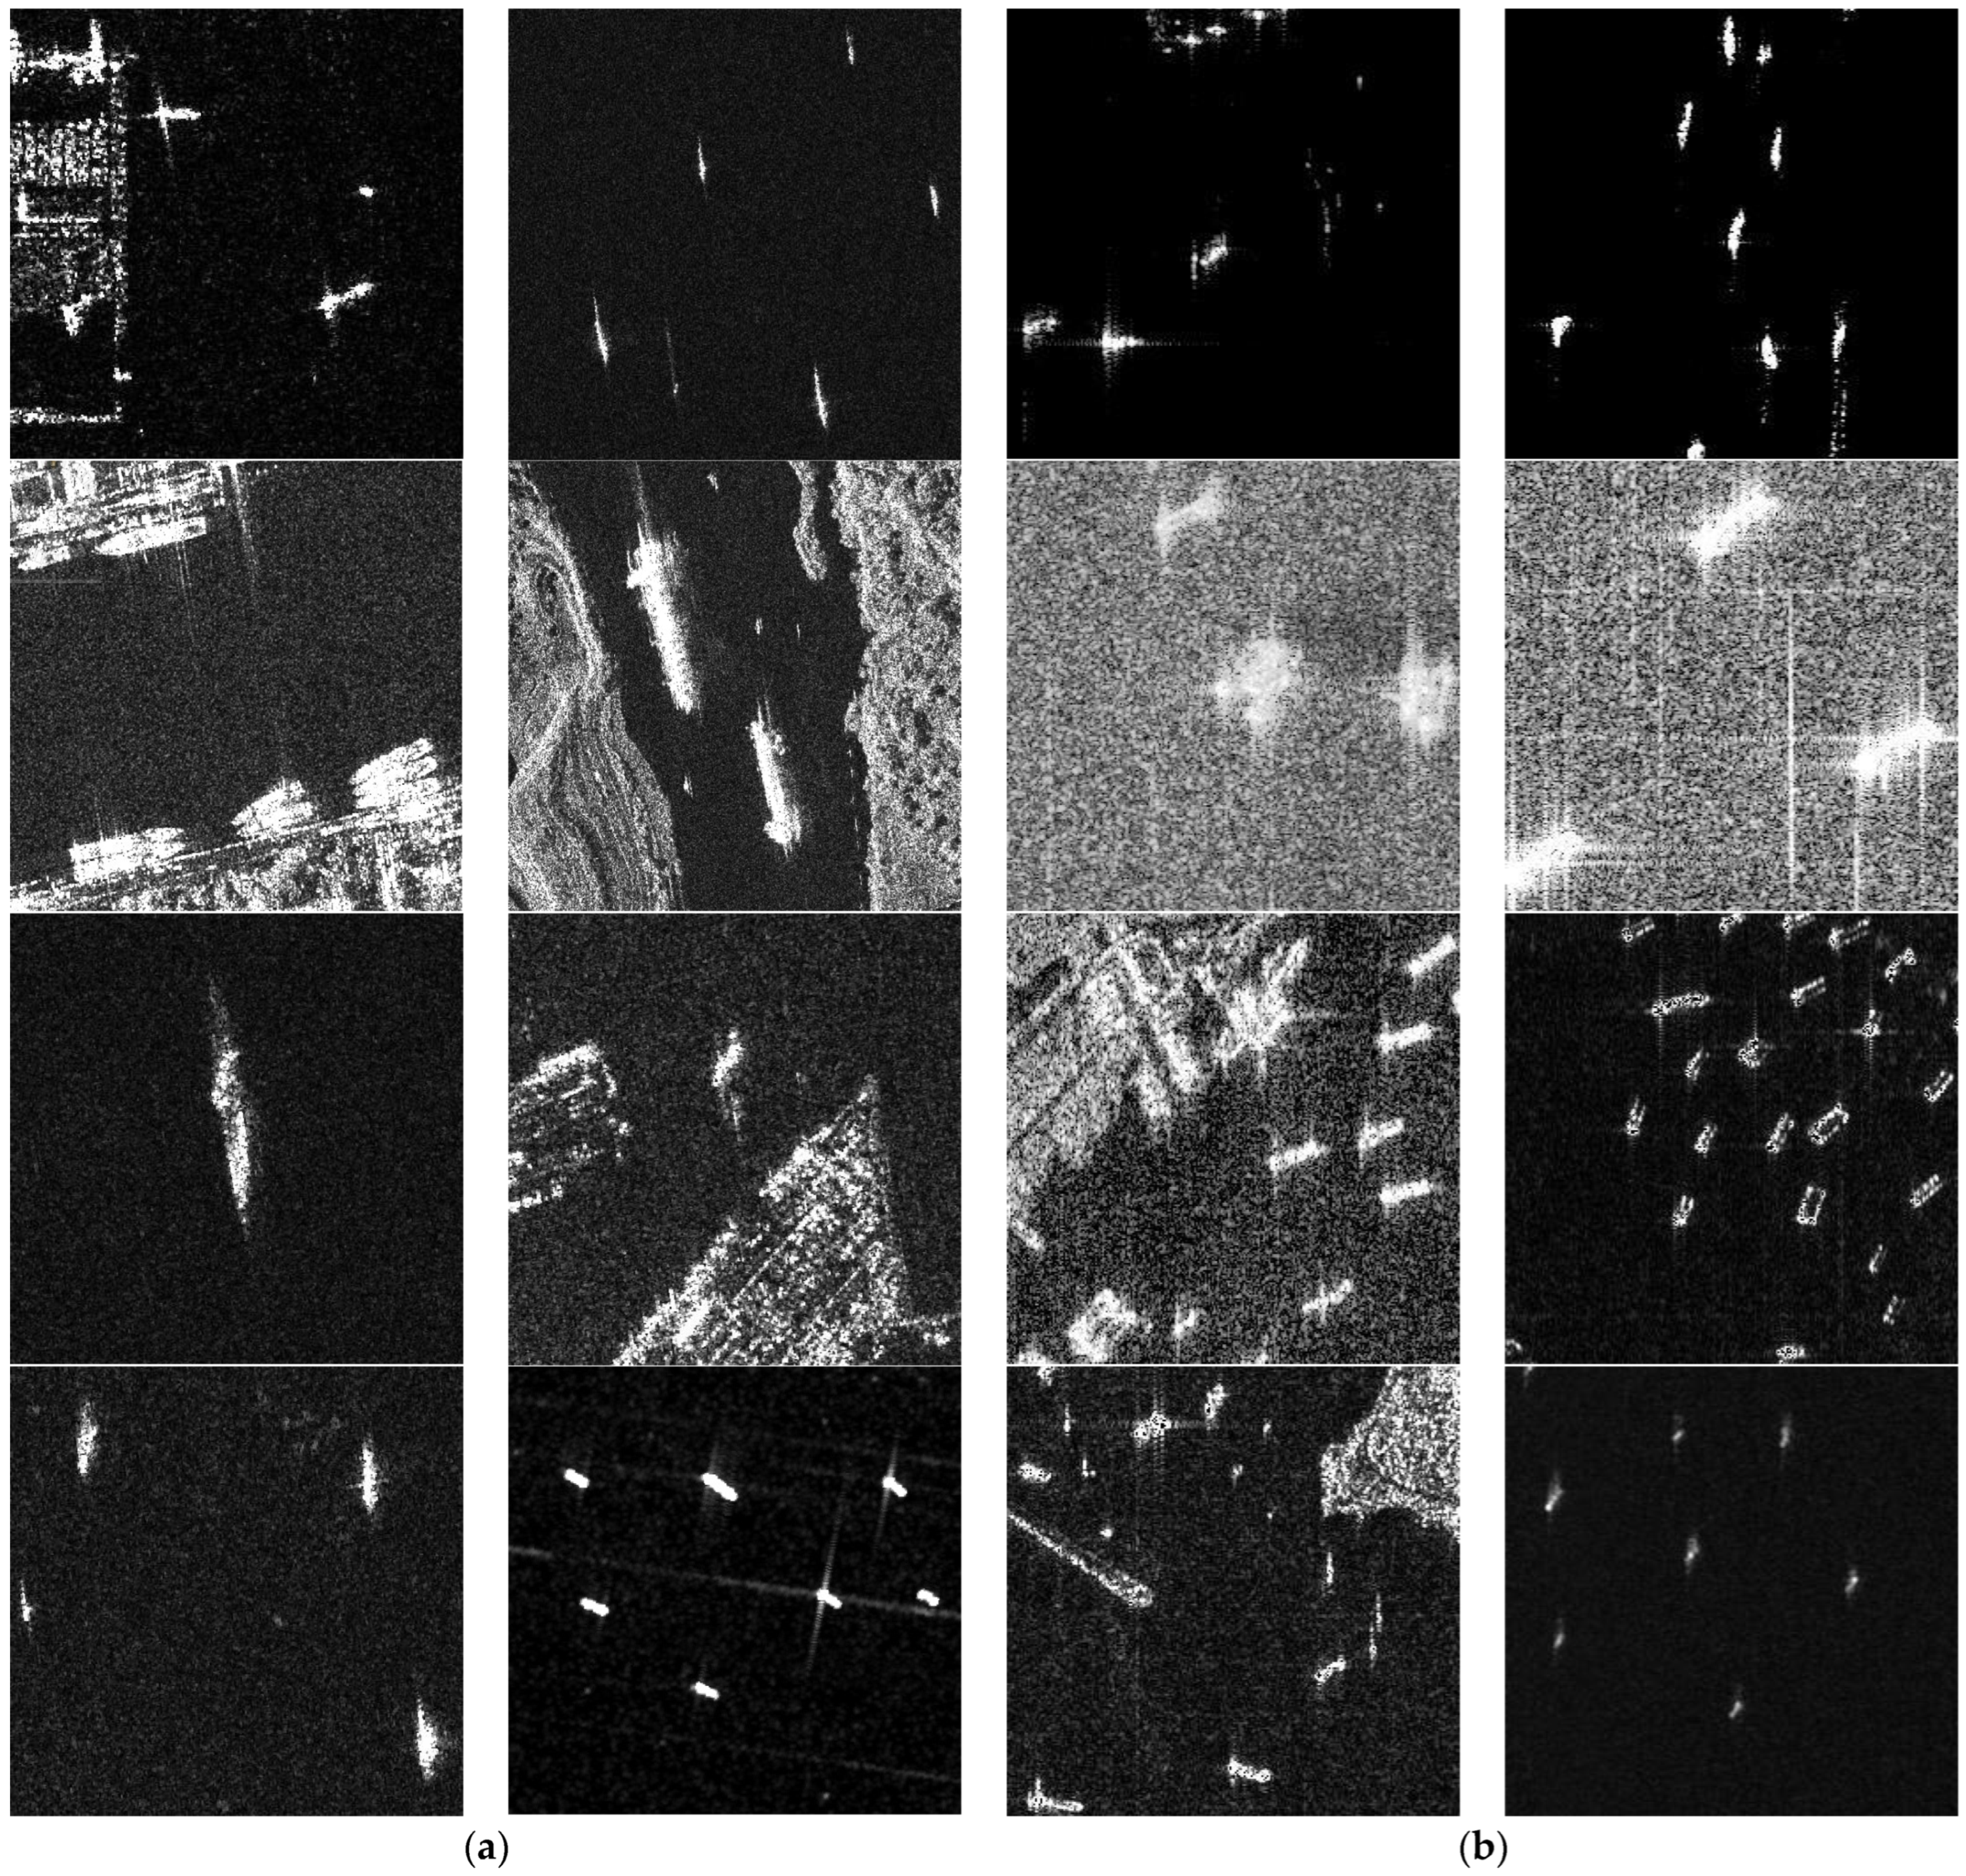
The Synthetic Aperture Radar Ship Detection Dataset (SSDD) [41] is a publicly available dataset containing 1160 SAR images with 2456 ship annotations. The objective of this SSDD is to facilitate research in the field of ship detection using deep learning technologies, particularly in the context of complex environmental backdrops. The dataset covers a range of ship sizes, types, and orientations under different maritime scenarios. Every image is precisely annotated to provide information on the location, size, and orientation of ships, which helps in the training and evaluation of models. This dataset is characterized by multi-scale complexity, where it ranges in size from a few pixels for the minuscule ships to thousands of pixels for the huge ones. Moreover, the backgrounds, which contain waves, sea foam, and wakes, increase the complexity of detecting the ships. Figure 8a shows some examples from the SSDD.
The SAR-Ship-Dataset [42] is a combination of 102 images taken by Gaofen-3 and 108 images taken by Sentinel-1; hence, it includes 210 images in total. It is a special source of information for the detection of ships in SAR images. This dataset includes various kinds of SAR images that depict ships in a wide range of scenes and environmental conditions. The ships total 39,729 in number; the dimensions of each ship image are 256 × 256. The images represent a wide spectrum of scales and orientations. Every ship image has gone through a deduplication process to improve the diversity and accuracy of the dataset. The SAR-Ship-Dataset represents full and fine annotation quality, which provides basic information on the position, size, and direction of the ships—this information is of paramount importance for researchers to conduct reliable training and evaluation. Figure 8b shows several examples of the SAR-Ship-Dataset.

3.2. Implementation Details

In this study, the computational platform consisted of an Intel Core i9-13900HX processor and an NVIDIA GeForce RTX 4060 graphics card, with a base frequency of 2.20 GHz and 16 GB of memory, running under the Windows 11 operating system. Additionally, CUDA 12.1 technology was employed to enhance computational efficiency. The datasets were randomly split into a 9:1 train–test split, with the training set further split into a 9:1 training–validation split. The model initialization phase used the random initialization method to set the weights and biases of the neural network, ensuring the model’s initial status was unbiased toward any particular set of parameter values. The learning rate was set to 0.001 and decreased in a cosine manner to minimize the loss function. The Adam optimizer [43] was used as the optimization algorithm, tracking adaptive estimates of first- and second-order moments of the gradient. The algorithm iteratively updated the model parameters during training by dynamically adjusting the learning rate. During the training process, the batch size was set to 16, and the model was trained for 300 epochs to ensure sufficient training and improvement in generalization performance.

3.3. Evaluation Index

mAP (mean Average Precision) evaluates performance by calculating the average precision of detection boxes at various IoU (Intersection over Union) thresholds. In most cases, this metric adopts an IoU threshold of 0.5 to gauge the average accuracy level of detection boxes across different categories.
mAP = 1 N i = 1 N ( R i R i 1 ) P ( R i )
The ith recall value, denoted by R i , and the precision value for the ith recall value pair, denoted by P ( R i ) , are the variables of interest in this context.
Precision is a measure of the proportion of the true positives among those samples predicted by the model as positive, i.e., the ratio of the number of correctly predicted positive samples to the total number of samples predicted as positive. The higher the precision, the fewer false positives there are in the predictions made by a model.
Precision = TP TP + FP
Recall is the evaluation index to present a ratio of how many real positive class samples are correctly identified by the model as positive, for example, the ratio of the number of positive class samples rightly forecasted by the model to all true positive class samples. A higher recall means that the model has a strong ability to cover positive class samples.
Recall = TP TP + FN
The F1 score is the harmonic mean of the precision and recall, providing a representation of both. A higher F1 score is indicative of the model exhibiting a balanced performance between precision and recall.
F 1 = 2 Precision × Recall Precision + Recall
In this context, the symbol TP represents a positive category that has been evaluated as positive, the symbol FP represents a negative category that has been evaluated as positive, and the symbol FN represents a negative category that has been evaluated as negative.
Params: The number of parameters shows the number of weights and biases in a model. A smaller number of parameters implies that the model is lighter in weight and occupies less space, requiring fewer computational resources.
FLOPs (Floating-Point Operations): This unit measures the number of floating-point operations a model performs during the inference process and is hence used as an indicator to evaluate the computational complexity of the model. The fewer FLOPs signify the model would consume fewer computing resources during inference and, hence, be suitable for deployment on not-so-powerful performance devices.

3.4. Deep Learning Experiment

Regarding MSSD-Net, we conducted experiments and repeatedly adjusted the number of layers in the backbone network to make it optimal for model performance, control complexity, and enhance feature extraction capability. First of all, performance can be optimized by changing the layers in the backbone network. The backbone network is the most central core in a neural network and is used for feature extraction from input images. Different layers of the backbone network have varying capabilities when it comes to feature extraction. We will be able to investigate how different setups of the layers impact model performance through repeated adjustment and experimentation of layers. Moreover, adjusting the layer count of the backbone network controls model complexity [44]. If the number of layers in the model increases, the model’s complexity increases, which might result in overfitting issues and occupy considerable computational resources. As a result, modifying the backbone’s number of layers appropriately can actually help manage complexity in the model, help avoid overfitting, and enhance efficiency in both training and inference. Moreover, adjusting the backbone network layers enhances the extraction capacity of the model in features. Backbone networks with different numbers of layers can extract features from basic to advanced levels. By utilizing a series of adjustments and experiments, we can gain a deep understanding of the effect of different layer counts on feature representation capabilities. Then, we can investigate the impacts of different layer counts on feature representation capabilities. As a result, we determine the optimal layer count of the backbone for ship target detection and then improve the model in ship target recognition accuracy. In summary, by repeatedly adjusting and experimenting with layers in the backbone network, we can attain an optimization of model performance, model complexity control, and increasing feature extraction capability, thus enhancing the overall performance of the MSSD-Net model.
During the experimental evaluation of MSSD-Net, several adjustments were made to the number of layers in the backbone network to optimize model performance, control model complexity, and improve feature extraction capabilities. First, an analysis from the perspective of performance metrics was conducted. As shown in Table 1, metrics such as the mAP, precision, recall, and F1 score indicated that Model 4 achieved the highest levels across these indicators. With an mAP of 98.02%, significantly higher than those for the other models, it is evident that increasing the number of layers in the backbone network enhances detection accuracy and recall rate, thus improving overall performance. Precision and recall measure the error rate and coverage of the model, respectively. The F1 score, the harmonic mean of the two, reflects balanced performance. Model 4 excels in these metrics, demonstrating superior detection precision, recall, and balanced performance.
Second, it is necessary to consider the computational complexity of the model and the number of parameters. Since the backbone network adopts the MobileOne model, there are sizes for both training parameters and inference parameters. As can be seen from Table 2, as the backbone network size increases, the number of parameters and FLOPs increases correspondingly. However, Model 4 can demonstrate high performance while showing a reduced number of parameters and FLOPs. To be specific, Model 4 contains 2.807 M parameters and 4.79 GFLOPs; these values are relatively low, indicating that Model 4 has some advantages in terms of computational complexity. From this, it can be derived that Model 4 is capable of conserving computational resources and improving the efficiency of training and inference under high performance.

3.5. Ablation Experiment

Table 3 compares the performance of C2f, MobileOne, and MobileOne combined with the MSCA module. The analysis shows that although the parameter count of MobileOne was reduced from 2.302 M to 1.477 M, its mAP slightly increased from 97.18% to 97.45%. This demonstrates that MobileOne can enhance performance while reducing parameters. This finding highlights MobileOne’s significant advantage in efficiency improvement. The precision and recall rates of MobileOne are 97.05% and 90.55%, respectively, which are a slight decrease compared with C2f’s 97.50% and 92.13%. This means that while enhancing the compactness of the model, MobileOne sacrificed some precision and recall rate, but its overall performance remains outstanding.
The introduction of the MSCA module significantly improves the model’s performance. By incorporating the Coordinate Attention module from MSCA, the mAP value increases from 97.45% to 97.95%, with a slight rise in the number of parameters to 1.651M. When combining MobileOne with the MSCA module, the model reaches its performance peak, with the mAP further increasing to 98.02%, and precision and recall rates reaching 99.21% and 91.94%, respectively. This improvement demonstrates the importance of the MSCA module in extracting contextual information, particularly in capturing multi-scale contextual information, thereby enhancing the model’s ability to handle complex environments. Additionally, the MSCA module significantly boosts precision and recall rates, from 97.05% to 99.21% and from 90.55% to 91.94%, respectively, indicating that the combination of MobileOne and the MSCA module not only improves performance but also maintains a low computational cost and parameter count. These results validate the effectiveness of the MSCA module and its positive impact on model performance.
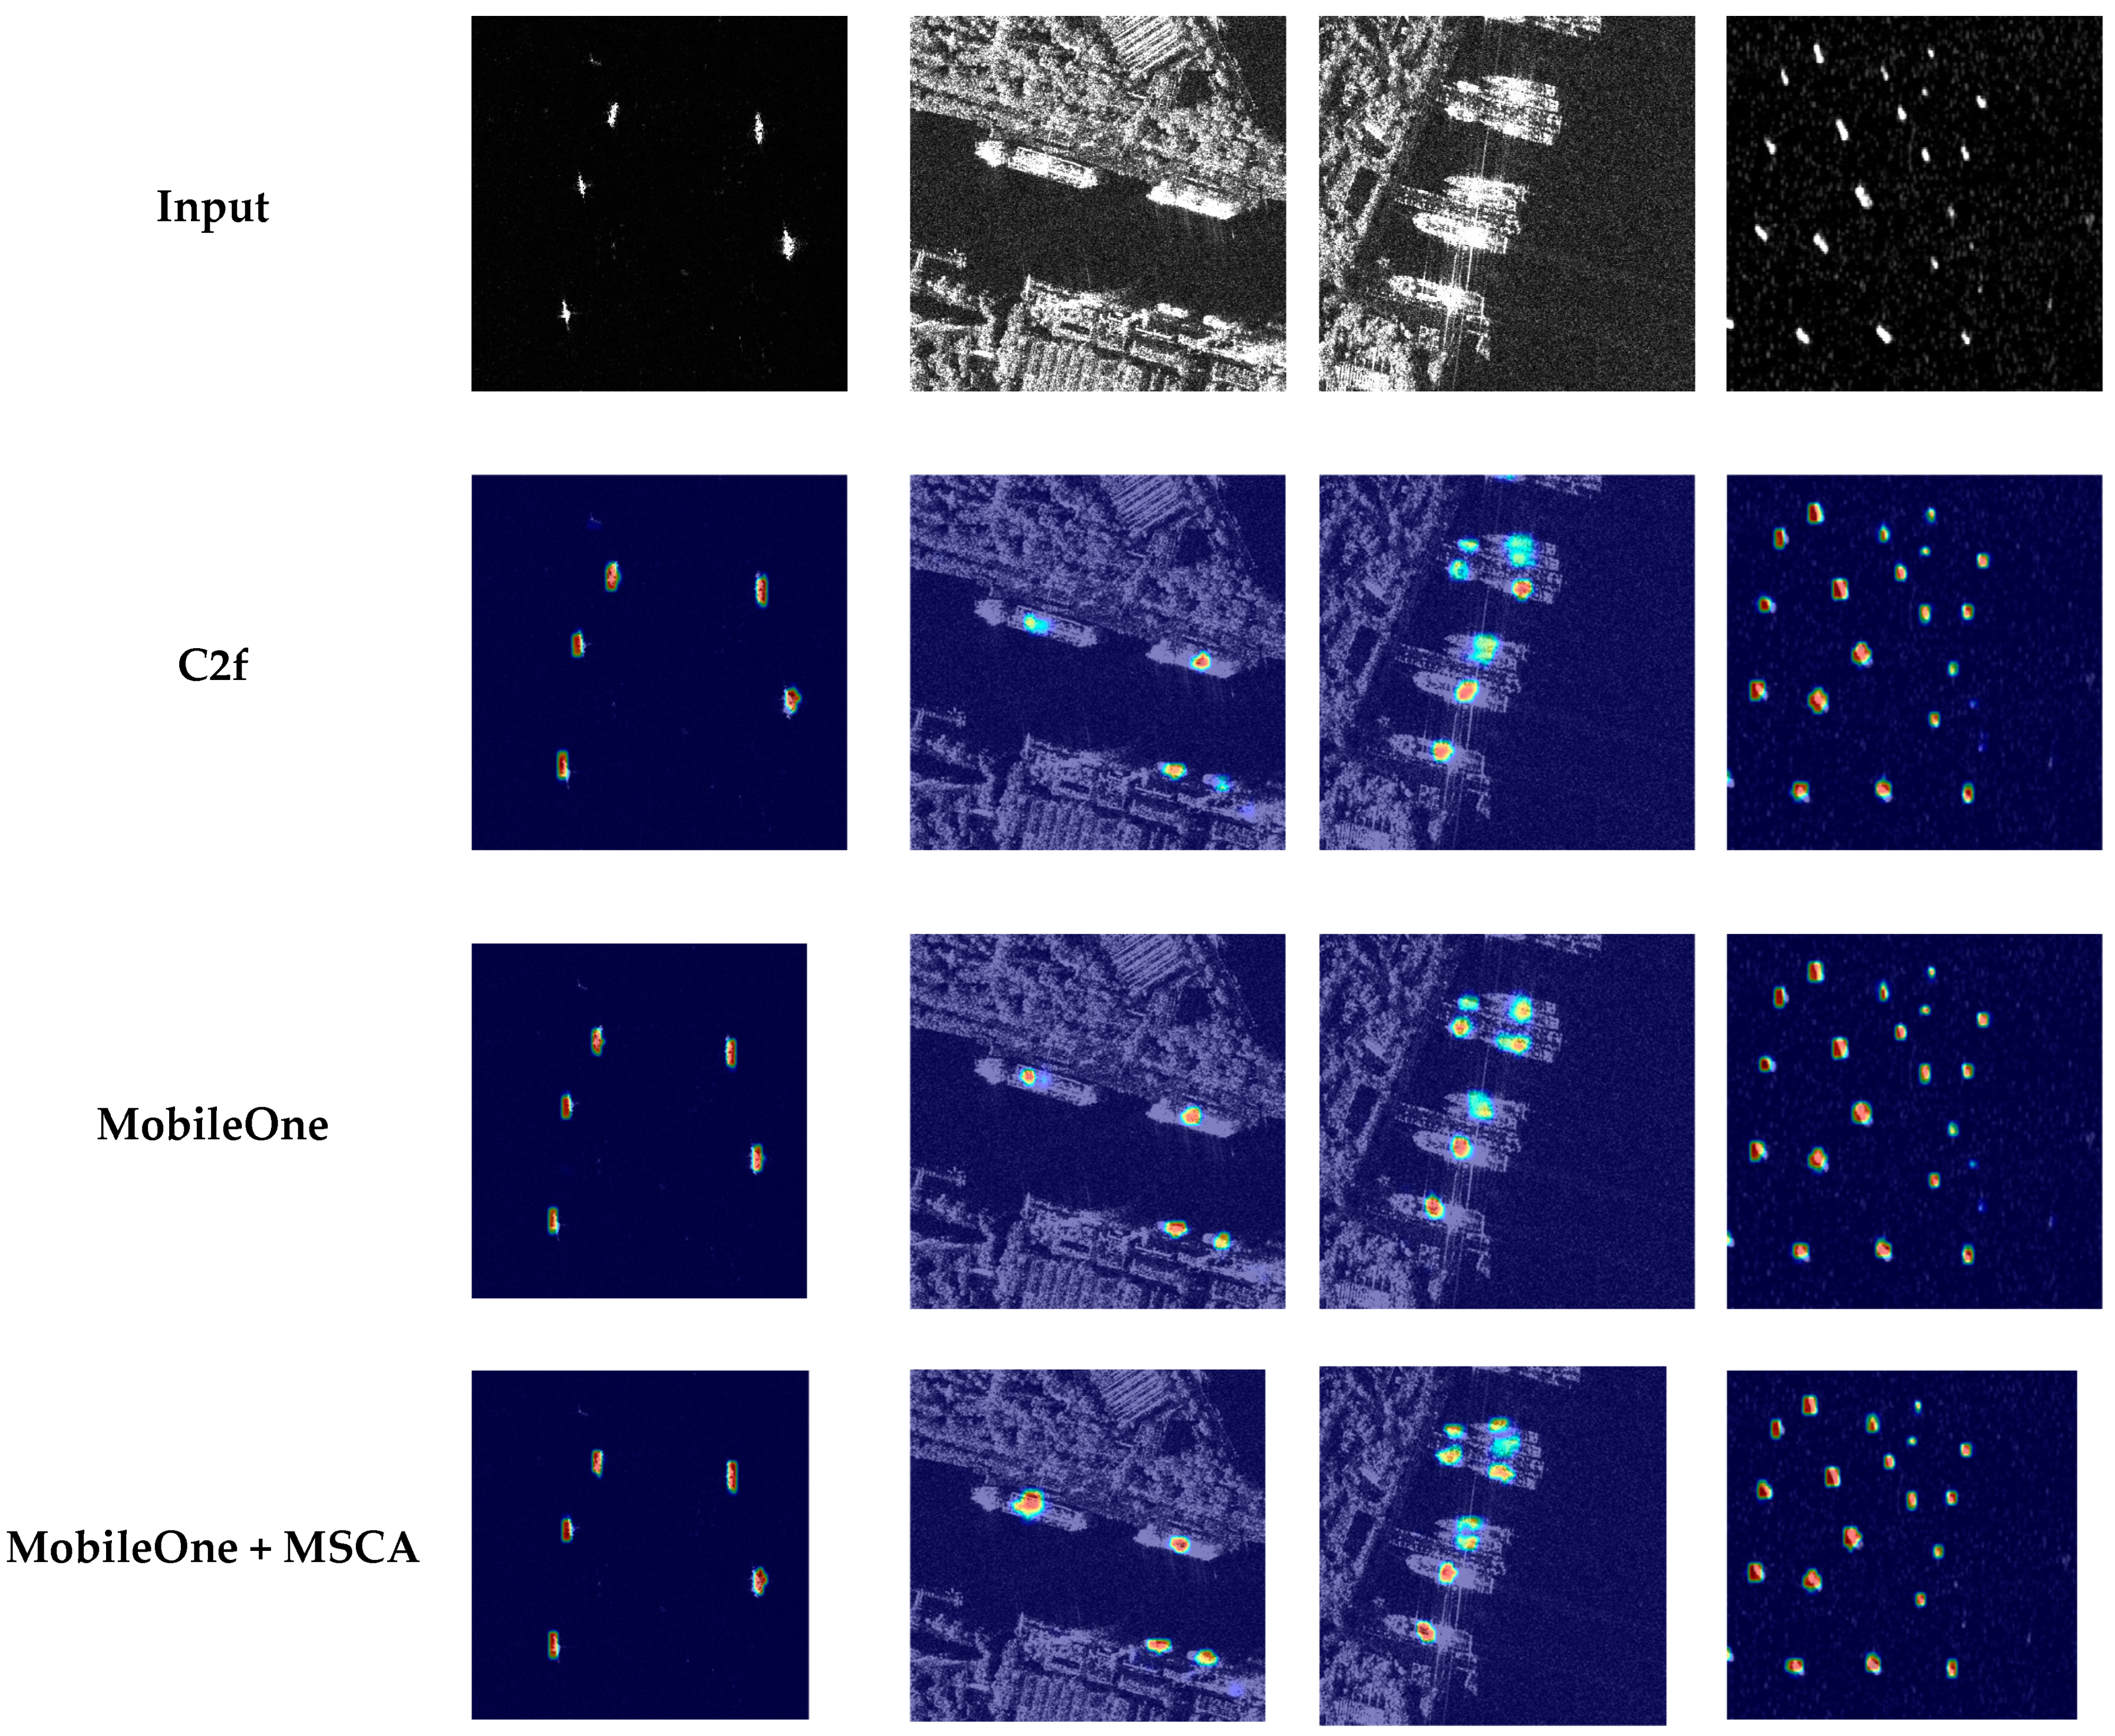
Heatmap analysis in Figure 9 further verifies the advantage of combining MobileOne with the MSCA module in handling dense multi-scale targets. The heatmap clearly demonstrates the efficiency of this combined model in recognizing and distinguishing crowded targets, attributed to the multi-scale contextual attention mechanism of the MSCA module, which significantly enhances the model’s detection capabilities in complex environments. The MobileOne module has already proven its advantages in improving efficiency and performance, and the addition of the MSCA module further enhances the model’s ability to handle complex scenarios. This combination not only improves precision and recall but also ensures optimized performance while maintaining low parameter counts and computational complexity.

3.6. Experiments with Different Datasets

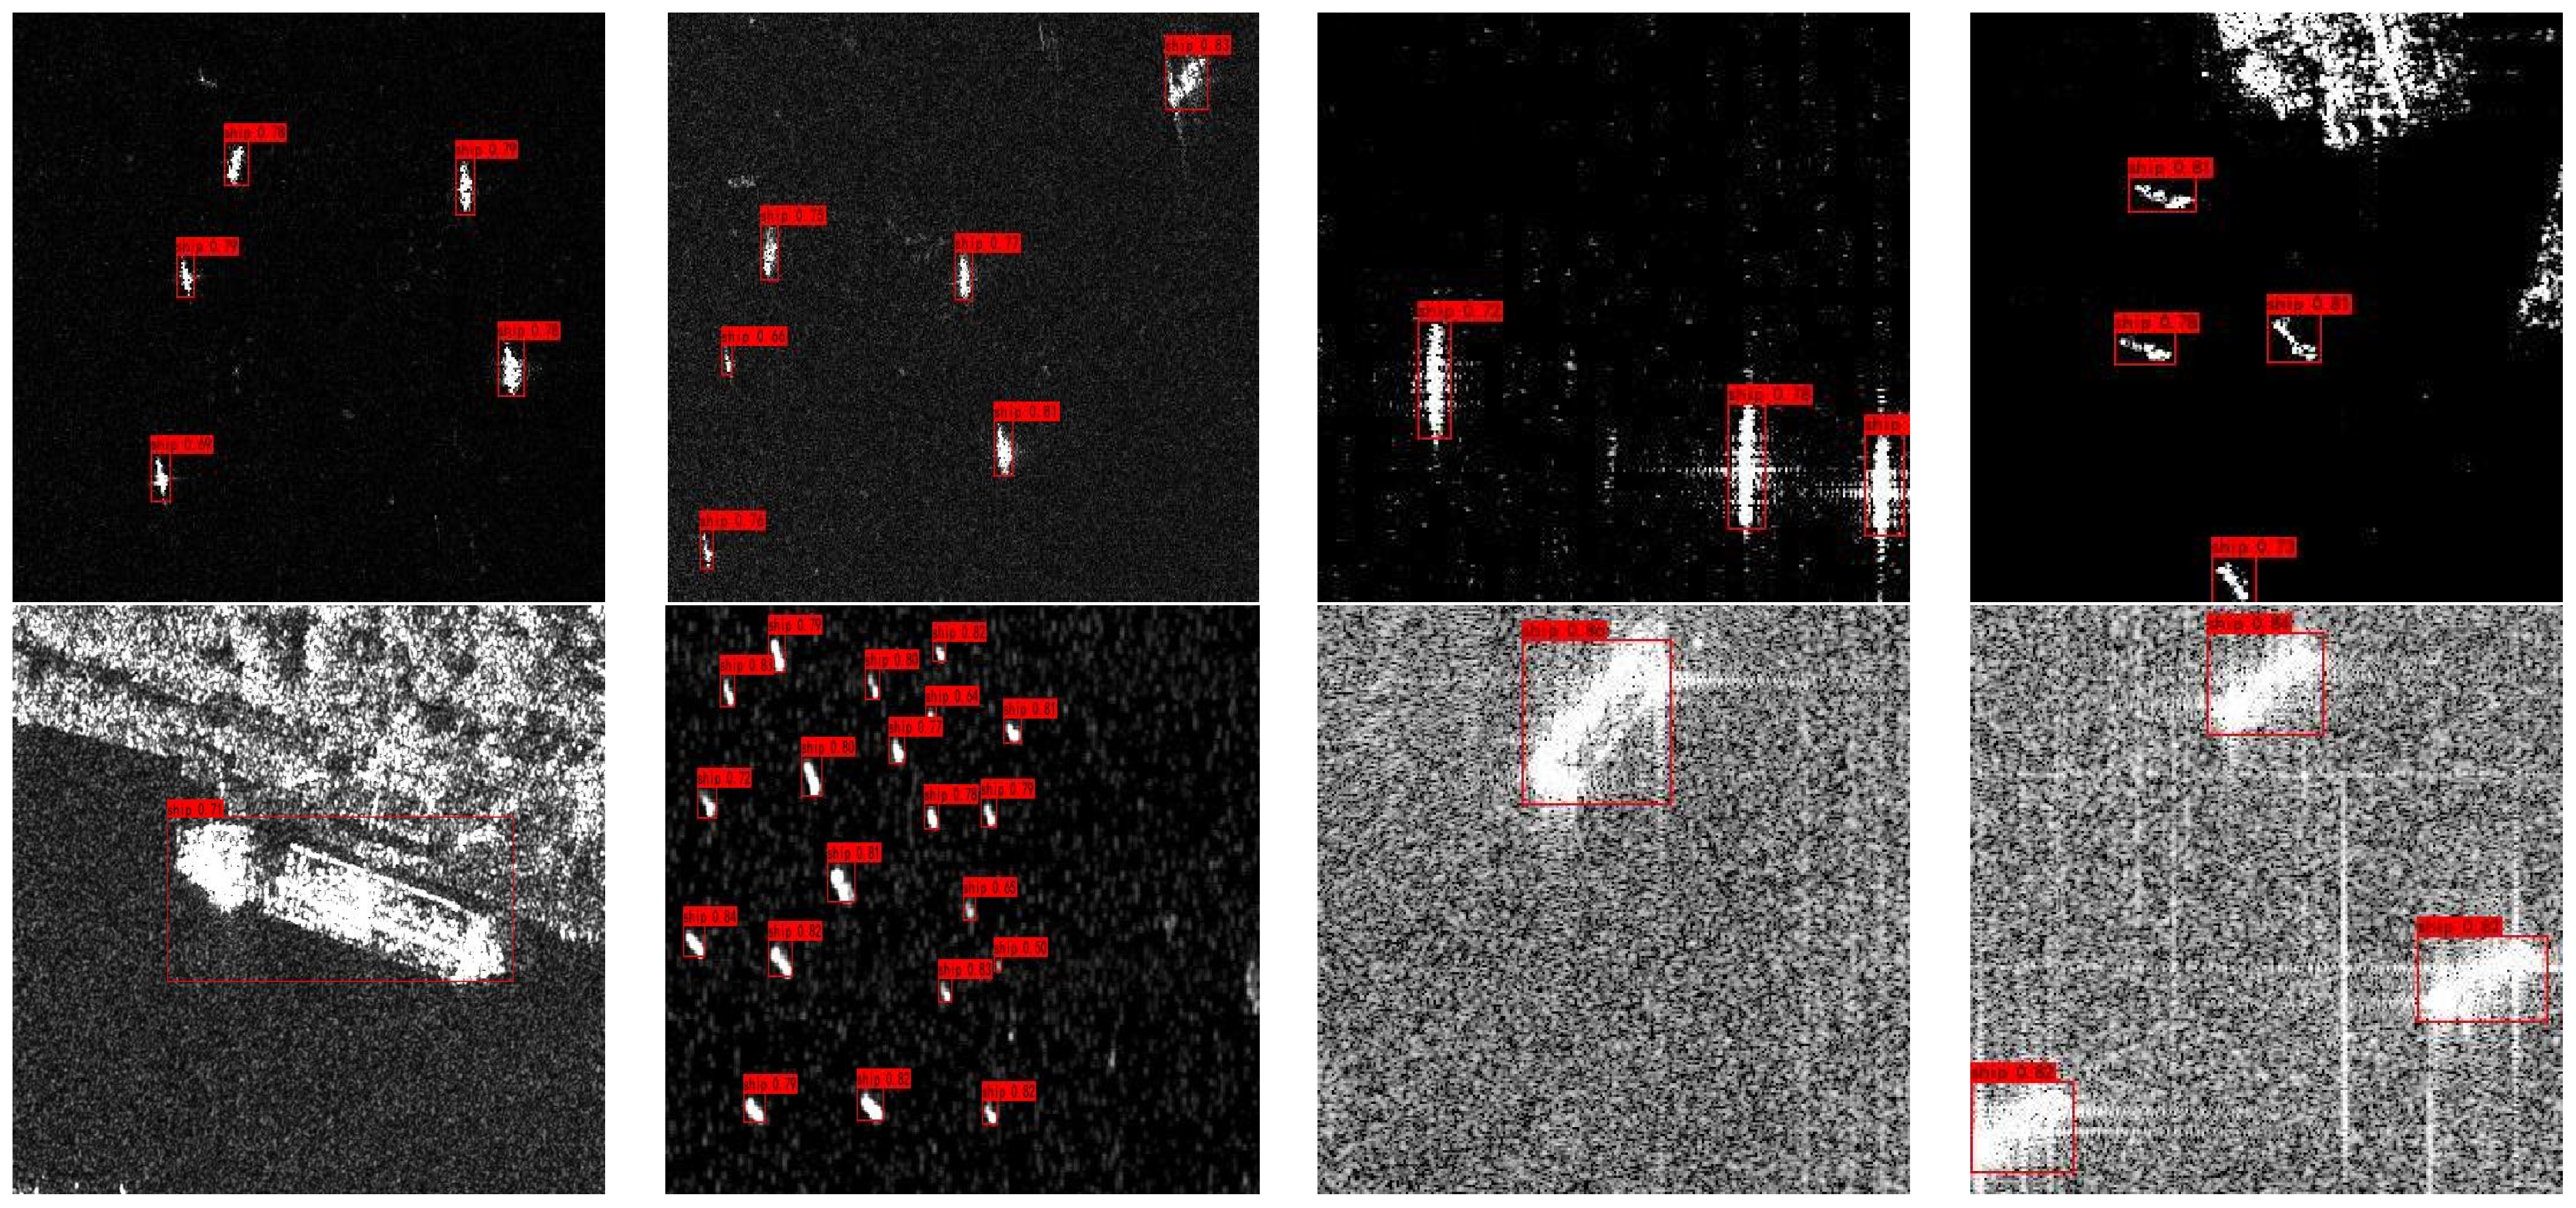
The performance evaluation of MSSD-Net revealed significant differences between the model’s performance on two distinct datasets. As illustrated in Table 4, MSSD-Net demonstrated superior performance on the SSDD in comparison with the SAR-Ship-Dataset. In the SSDD, the model achieved a mean average precision (mAP) of 98.02%, which is notably higher than the 93.80% achieved on the SAR-Ship-Dataset. This result indicates that MSSD-Net exhibits superior overall detection capabilities on the SSDD. The precision metric provides further insight into the performance differences between the two datasets. In the SSDD, MSSD-Net exhibited an exceptionally high precision of 99.21%, indicating a high ability to correctly identify positive class instances. Conversely, its precision on the SAR-Ship-Dataset was 93.57%, indicating a slightly higher rate of false positives in this dataset. Furthermore, the recall metric exhibited variability between the datasets. The recall rate was 91.94% for the SSDD, while it was only 83.61% for the SAR-Ship-Dataset, indicating a higher degree of missed detections on the SAR-Ship-Dataset, where MSSD-Net failed to correctly identify all actual positive class samples. Finally, the F1 score, defined as the harmonic mean of precision and recall, provides a basis for assessing the model’s balanced performance. On the SSDD, MSSD-Net achieved an F1 score of 0.95, indicating a satisfactory degree of balance. Nevertheless, the F1 score exhibited a slight decline in the SAR-Ship-Dataset, reflecting a relatively unstable performance on this dataset. Figure 10 provides a clear illustration of the comparative performance of MSSD-Net on the SSDD and SAR-Ship-Dataset, demonstrating the model’s varying performance under different conditions.
The analysis of performance differences is primarily based on variations in datasets, target features, and background complexity. The SSDD is of higher quality and more diverse, comprising SAR images from multiple sensors, including RadarSat-2, TerraSAR-X, and Sentinel-1, which results in more accurate annotations. Additionally, the SSDD covers a wider range of application scenarios and exhibits greater data diversity, making it extensively used in research on deep learning-based SAR ship detection techniques. The nature scene imagery within the SSDD facilitates easier target recognition due to relatively simple backgrounds, which is beneficial for model training and generalization. In contrast, the SAR-Ship-Dataset is composed entirely of data from the domestic Gaofen-3 SAR and Sentinel-1 SAR, resulting in relatively low diversity. Furthermore, the vague target features in SAR images can pose challenges in accurately recognizing positive class samples, potentially negatively impacting model performance. The complicated backgrounds in the SAR-Ship-Dataset may also suffer from clutter, which increases the difficulty of target detection and further decreases model performance.

3.7. Comparative Experiment

This experiment evaluates the performance of our proposed MSSD-Net for object detection against state-of-the-art models, including Faster-RCNN, FCOS, SSD, YOLOv5-s, and YOLOv8-s. As shown in Table 5, MSSD-Net achieves a mean average precision (mAP) of 98.02%, marginally trailing the leading YOLOv8-s model at 98.48% but significantly outperforming other benchmarks. This result indicates MSSD-Net’s capability to accurately identify objects within images with high confidence. The high mAP score signifies a well-balanced trade-off between recall and precision, demonstrating the model’s ability to achieve both comprehensive and accurate object detection. In terms of precision, MSSD-Net achieves an exceptional 99.21%, closely matching YOLOv8-s and substantially surpassing other comparative models. This highlights MSSD-Net’s superior accuracy in predicting positive samples, effectively minimizing false positives. Beyond mAP and precision, MSSD-Net exhibits commendable performance in recall (R) and F1 scores, reaching 91.94% and 0.95, respectively. This indicates the model’s effectiveness in identifying a large proportion of target objects while maintaining a good balance between precision and recall.
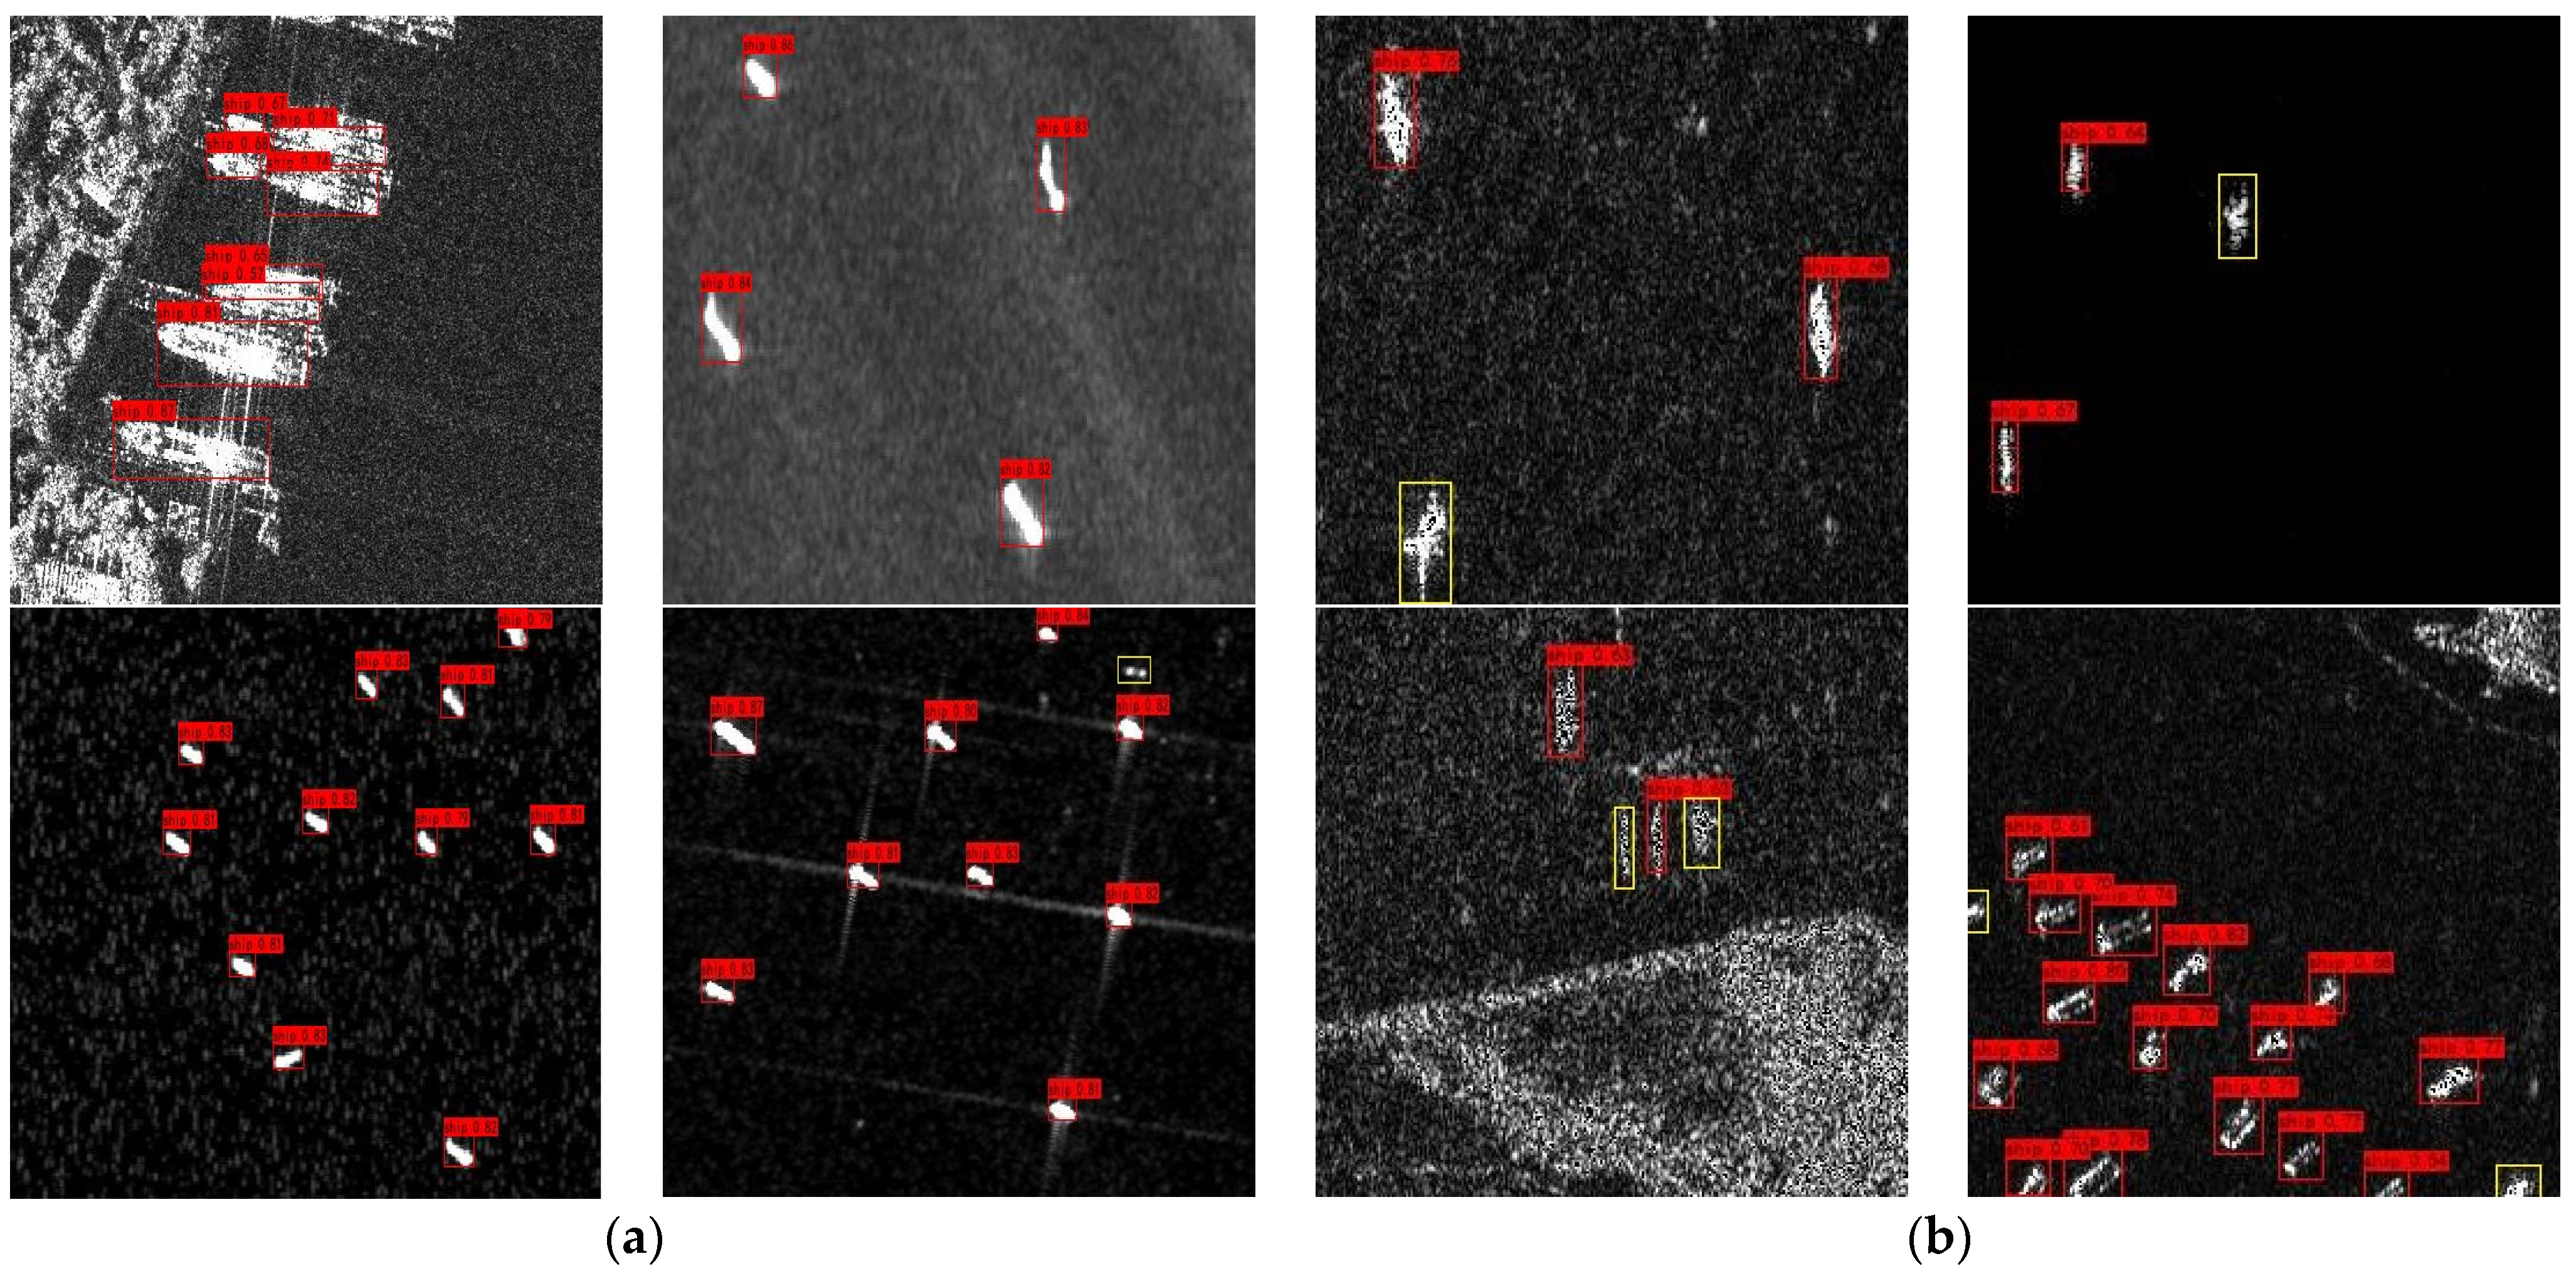
Remarkably, MSSD-Net achieves high accuracy while maintaining exceptionally low model complexity. Specifically, MSSD-Net utilizes only 1.6 M parameters and 4.8G FLOPs. In contrast, YOLOv5-s requires 29 times and 24 times more parameters and computations, respectively, while YOLOv8-s requires 7 times and 6 times more, respectively. The stringent parameter constraint of 1.6 M in MSSD-Net directly addresses the lightweight model requirements of spaceborne SAR systems, which often operate under limited computational resources, storage, and power constraints. Deploying lightweight models ensures real-time performance and extends the operational lifespan of these systems. MSSD-Net’s lightweight design allows for effective deployment on such platforms, presenting a promising solution for real-time, high-precision spaceborne SAR object detection. The visual comparison in Figure 11 further validates the performance of MSSD-Net. These comparative figures clearly illustrate that MSSD-Net exhibits fewer false positives and missed detections compared with other models. This not only underscores the superior optimization achieved in MSSD-Net, balancing accuracy, efficiency, and resource consumption but also showcases its potential value in practical applications.

4. Discussion

In the previous section, this study analyzed three experiments conducted to assess the performance of our proposed lightweight SAR ship detection neural network, MSSD-Net. In particular, this is a design for deployment on artificial satellites, where resource limitations in space environments must be considered. Finally, the following section is devoted to a deep examination of the theoretical and practical implications of these experimental results and further discusses the limitations of this study and future research directions.
The results of Experiment One show that Model 4 outperformed in all three criteria: performance, computational complexity, and parameter size, making it more suitable for application on satellite platforms where resources are constrained. In such contexts, model size and computational efficiency are crucial. Data analysis from the experiment indicated that altering the number of network layers impacts the model’s accuracy and operational efficiency, allowing for a balance between the two. Additionally, these results suggest the potential of lightweight deep-learning models for processing complex SAR image data. Experiment Two demonstrates that the MobileOne model reduces the number of parameters and enhances performance. The subsequent incorporation of the MSCA module further improves performance. This validates the efficacy of MSCA in augmenting the model’s capability to process complex environments while maintaining low computational costs. Experiment Three revealed that the performance variation in MSSD-Net across different datasets highlights the significant influence of data quality, target characteristics, and background complexity on model performance. The superior performance of MSSD-Net on the SSDD was attributed to its high quality, whereas the variations in target size and noise interference in the SAR-Ship-Dataset increased the difficulty of object detection. This finding emphasizes the importance of optimizing dataset quality and enhancing model generalization ability. Constructing high-quality, diverse datasets and exploring more advanced algorithms to improve the model’s adaptability to different scenarios can enhance its reliability in real-world satellite applications. The results of Experiment Four demonstrate some advantages of our model over others in terms of performance, parameter size, and computational demands, especially for resource-limited applications such as artificial satellites. These results not only confirm the viability of the model but also strongly support the applicability of the SAR ship detection technique in space.
The experimental results of MSSD-Net not only enhance our understanding of the performance of lightweight deep-learning models under various configurations but also provide important guidelines for the design and optimization of target detection systems on artificial satellites. Theoretically, MSSD-Net expands our understanding of the applicability of deep neural networks in space applications. Practically, it serves as an essential reference for implementing this technical area. Despite significant advancements, MSSD-Net still has some limitations. For instance, while the model exhibits promising performance in theoretical or simulated environments, it has yet to be tested and validated in a real-world, spaceborne Synthetic Aperture Radar (SAR) operational setting. Its stability and robustness also require further assessment. Future research should focus on validating the model’s performance in real space missions and exploring new data augmentation methods to enhance the interpretability of SAR images. Additionally, the model requires further optimization to reduce its dependence on computational resources, enabling deployment on a wider variety of satellite platforms.

5. Conclusions

This paper presents MSSD-Net, a novel, lightweight neural network model specifically designed for SAR ship target detection, which addresses the performance limitations of satellite platforms. The MSSD-Net model leverages the MobileOne module as its backbone network and incorporates the Efficient Channel Attention (ECA) module to replace the original Squeeze-and-Excitation (SE) module, resulting in a significant improvement in feature extraction efficiency. Additionally, we innovatively designed a Multi-Scale Coordinate Attention (MSCA) module to comprehensively capture feature map information and enhance contextual information processing capabilities. For feature fusion, the PAN + FPN architecture was employed as the neck network, combined with an Anchor-Free detection head to further enhance model performance. This innovative network structure aims to overcome the resource constraints imposed by satellite platforms, contributing significantly to providing efficient and accurate ship detection solutions.
In this study, we conducted experimental evaluations of the MSSD-Net model on the SSDD and SAR-Ship-Dataset. The results on the SSDD demonstrate that our model performed exceptionally well, achieving a mean average precision (mAP) of 98.02%, a precision of 99.21%, and an F1 score of 0.95. These metrics indicate high accuracy and overall effectiveness in the detection context. However, on the SAR-Ship-Dataset, the performance of MSSD-Net is slightly lower compared with the SSDD. Nevertheless, the model still achieves a mAP of 93.80% and a precision of 93.57%, confirming its robustness and effectiveness across different datasets. Additionally, MSSD-Net has a model parameter count of only 1.6 M, which is significantly smaller than other models such as YOLOv8-s, which has 11.2 M parameters. This demonstrates the lightness and efficiency of MSSD-Net. This study provides important technical support for the realization of efficient ship detection on resource-constrained artificial satellite platforms and offers insights into the optimization of lightweight object detection models.
The proposed MSSD-Net model exhibits high performance on the SAR ship detection task, effectively balancing accuracy and efficiency. The model’s lightweight design and high detection accuracy make it an ideal choice for various practical scenarios in real-world applications, particularly for ship detection on resource-constrained satellite platforms. Further improvements in the model architecture can be achieved through additional research, with potential exploration of its application in other remote sensing tasks beyond ship detection.

Author Contributions

Conceptualization, W.X.; methodology, X.W. and W.X.; software, X.W.; validation, X.W.; formal analysis, X.W.; investigation, W.X., X.W. and W.T.; data curation, X.W.; writing—original draft preparation, X.W. and W.X.; writing—review and editing, X.W. and P.H.; supervision, W.X. and W.T; funding acquisition, W.X. and P.H. All authors have read and agreed to the published version of the manuscript.

Funding

This research was funded by the National Natural Science Foundation of China under Grant Number 62071258 and in part by the Key Project of Regional Innovation and Development Joint Fund of the National Natural Science Foundation under Grant Number U22A2010.

Data Availability Statement

No new data were created or analyzed in this study. Data sharing is not applicable to this article.

Acknowledgments

The authors would like to thank the authors of the SSDD and SAR-Ship-Dataset for providing high-quality target annotation and dataset building.

Conflicts of Interest

The authors declare no conflicts of interest.

References

  1. Kim, K.; Kang, J.; Kim, J.-H. Phase calibration for ideal wideband chirp in satellite-based synthetic aperture radar. ICT Express 2022, 8, 490–493. [Google Scholar] [CrossRef]
  2. Zhang, C.; Zhang, X.; Zhang, J.; Gao, G.; Dai, Y.S.; Liu, G.W.; Jia, Y.J.; Wang, X.C.; Zhang, Y.; Bao, M. Evaluation and Improvement of Generalization Performance of SAR Ship Recognition Algorithms. IEEE J. Sel. Top. Appl. Earth Obs. Remote Sens. 2022, 15, 9311–9326. [Google Scholar] [CrossRef]
  3. Liu, M.Q.; Zhu, B.; Ma, H.B. A New Synthetic Aperture Radar Ship Detector Based on Clutter Intensity Statistics in Complex Environments. Remote Sens. 2024, 16, 664. [Google Scholar] [CrossRef]
  4. Chen, W.; Xing, X.; Ji, K. A Survey of Ship Target Recognition in SAR Images. Mod. Radar 2012, 34, 53–58. [Google Scholar]
  5. Ren, S.; He, K.; Girshick, R.; Sun, J. Faster R-CNN: Towards Real-Time Object Detection with Region Proposal Networks. arXiv 2015, arXiv:1506.01497. [Google Scholar] [CrossRef]
  6. Liu, W.; Anguelov, D.; Erhan, D.; Szegedy, C.; Reed, S.; Fu, C.-Y.; Berg, A.C. SSD: Single Shot MultiBox Detector. arXiv 2015, arXiv:1512.02325. [Google Scholar] [CrossRef]
  7. Tian, Z.; Shen, C.; Chen, H.; He, T. FCOS: Fully Convolutional One-Stage Object Detection. arXiv 2019, arXiv:1904.01355. [Google Scholar] [CrossRef]
  8. Wang, Z.X.; Hou, G.Y.; Xin, Z.H.; Liao, G.S.; Huang, P.H.; Tai, Y.H. Detection of SAR Image Multiscale Ship Targets in Complex Inshore Scenes Based on Improved YOLOv5. IEEE J. Sel. Top. Appl. Earth Obs. Remote Sens. 2024, 17, 5804–5823. [Google Scholar] [CrossRef]
  9. Wu, W.H.; Wong, M.S.; Yu, X.Y.; Shi, G.Q.; Kwok, C.Y.T.; Zou, K. Compositional Oil Spill Detection Based on Object Detector and Adapted Segment Anything Model from SAR Images. IEEE Geosci. Remote Sens. Lett. 2024, 21, 4007505. [Google Scholar] [CrossRef]
  10. Yang, Y.G.; Ju, Y.W.; Zhou, Z.Y. A Super Lightweight and Efficient SAR Image Ship Detector. IEEE Geosci. Remote Sens. Lett. 2023, 20, 4006805. [Google Scholar] [CrossRef]
  11. Howard, A.; Sandler, M.; Chu, G.; Chen, L.-C.; Chen, B.; Tan, M.; Wang, W.; Zhu, Y.; Pang, R.; Vasudevan, V.; et al. Searching for MobileNetV3. arXiv 2019, arXiv:1905.02244. [Google Scholar] [CrossRef]
  12. Zhang, X.; Zhou, X.; Lin, M.; Sun, J. ShuffleNet: An Extremely Efficient Convolutional Neural Network for Mobile Devices. arXiv 2017, arXiv:1707.01083. [Google Scholar] [CrossRef]
  13. Chollet, F. Xception: Deep Learning with Depthwise Separable Convolutions. arXiv 2016, arXiv:1610.02357. [Google Scholar] [CrossRef]
  14. Han, K.; Wang, Y.; Tian, Q.; Guo, J.; Xu, C.; Xu, C. GhostNet: More Features from Cheap Operations. arXiv 2019, arXiv:1911.11907. [Google Scholar] [CrossRef]
  15. Tan, M.; Le, Q.V. MixConv: Mixed Depthwise Convolutional Kernels. arXiv 2019, arXiv:1907.09595. [Google Scholar] [CrossRef]
  16. Dong, X.; Li, D.; Fang, J. FCCD-SAR: A Lightweight SAR ATR Algorithm Based on FasterNet. Sensors 2023, 23, 6956. [Google Scholar] [CrossRef] [PubMed]
  17. Zhou, Z.; Chen, J.; Huang, Z.; Lv, J.; Song, J.; Luo, H.; Wu, B.; Li, Y.; Diniz, P.S.R. HRLE-SARDet: A Lightweight SAR Target Detection Algorithm Based on Hybrid Representation Learning Enhancement. IEEE Trans. Geosci. Remote Sens. 2023, 61, 5203922. [Google Scholar] [CrossRef]
  18. Guo, Y.; Chen, S.; Zhan, R.; Wang, W.; Zhang, J. LMSD-YOLO: A Lightweight YOLO Algorithm for Multi-Scale SAR Ship Detection. Remote Sens. 2022, 14, 4801. [Google Scholar] [CrossRef]
  19. Yan, G.; Chen, Z.; Wang, Y.; Cai, Y.; Shuai, S. LssDet: A Lightweight Deep Learning Detector for SAR Ship Detection in High-Resolution SAR Images. Remote Sens. 2022, 14, 5148. [Google Scholar] [CrossRef]
  20. Tian, C.; Liu, D.; Xue, F.; Lv, Z.; Wu, X. Faster and Lighter: A Novel Ship Detector for SAR Images. IEEE Geosci. Remote Sens. Lett. 2024, 21, 4002005. [Google Scholar] [CrossRef]
  21. Tang, H.; Gao, S.; Li, S.; Wang, P.; Liu, J.; Wang, S.; Qian, J. A Lightweight SAR Image Ship Detection Method Based on Improved Convolution and YOLOv7. Remote Sens. 2024, 16, 486. [Google Scholar] [CrossRef]
  22. Chen, C.X.; Zhang, Y.M.; Hu, R.L.; Yu, Y.T. A Lightweight SAR Ship Detector Using End-to-End Image Preprocessing Network and Channel Feature Guided Spatial Pyramid Pooling. IEEE Geosci. Remote Sens. Lett. 2024, 21, 4003605. [Google Scholar] [CrossRef]
  23. Zhao, L.J.; Ning, F.; Xi, Y.B.; Liang, G.; He, Z.L.; Zhang, Y.Y. MSFA-YOLO: A Multi-Scale SAR Ship Detection Algorithm Based on Fused Attention. IEEE Access 2024, 12, 24554–24568. [Google Scholar] [CrossRef]
  24. Tang, X.; Zhang, J.F.; Xia, Y.Z.; Xiao, H.L. DBW-YOLO: A High-Precision SAR Ship Detection Method for Complex Environments. IEEE J. Sel. Top. Appl. Earth Obs. Remote Sens. 2024, 17, 7029–7039. [Google Scholar] [CrossRef]
  25. Anasosalu Vasu, P.K.; Gabriel, J.; Zhu, J.; Tuzel, O.; Ranjan, A. MobileOne: An Improved One millisecond Mobile Backbone. arXiv 2022, arXiv:2206.04040. [Google Scholar] [CrossRef]
  26. Lin, T.-Y.; Dollár, P.; Girshick, R.; He, K.; Hariharan, B.; Belongie, S. Feature Pyramid Networks for Object Detection. arXiv 2016, arXiv:1612.03144. [Google Scholar] [CrossRef]
  27. Liu, S.; Qi, L.; Qin, H.; Shi, J.; Jia, J. Path Aggregation Network for Instance Segmentation. arXiv 2018, arXiv:1803.01534. [Google Scholar] [CrossRef]
  28. Zhang, S.; Chi, C.; Yao, Y.; Lei, Z.; Li, S.Z. Bridging the Gap Between Anchor-based and Anchor-free Detection via Adaptive Training Sample Selection. arXiv 2019, arXiv:1912.02424. [Google Scholar] [CrossRef]
  29. Ding, X.; Zhang, X.; Ma, N.; Han, J.; Ding, G.; Sun, J. RepVGG: Making VGG-style ConvNets Great Again. arXiv 2021, arXiv:2101.03697. [Google Scholar] [CrossRef]
  30. Hu, J.; Shen, L.; Albanie, S.; Sun, G.; Wu, E. Squeeze-and-Excitation Networks. arXiv 2017, arXiv:1709.01507. [Google Scholar] [CrossRef]
  31. Wang, Q.; Wu, B.; Zhu, P.; Li, P.; Zuo, W.; Hu, Q. ECA-Net: Efficient Channel Attention for Deep Convolutional Neural Networks. arXiv 2019, arXiv:1910.03151. [Google Scholar] [CrossRef]
  32. Wen, X.; Zhang, S.M.; Wang, J.M.; Yao, T.J.; Tang, Y. A CFAR-Enhanced Ship Detector for SAR Images Based on YOLOv5s. Remote Sens. 2024, 16, 733. [Google Scholar] [CrossRef]
  33. Yu, F.; Koltun, V. Multi-Scale Context Aggregation by Dilated Convolutions. arXiv 2015, arXiv:1511.07122. [Google Scholar] [CrossRef]
  34. Hou, Q.; Zhou, D.; Feng, J. Coordinate Attention for Efficient Mobile Network Design. arXiv 2021, arXiv:2103.02907. [Google Scholar] [CrossRef]
  35. Zhang, Y.-B.; Yang, Q.-L. SA-Net: Shuffle Attention for Deep Convolutional Neural Networks. arXiv 2021, arXiv:2102.00240. [Google Scholar] [CrossRef]
  36. Yu, H.; Yang, S.H.; Zhou, S.P.; Sun, Y.B. VS-LSDet: A Multiscale Ship Detector for Spaceborne SAR Images Based on Visual Saliency and Lightweight CNN. IEEE J. Sel. Top. Appl. Earth Obs. Remote Sens. 2024, 17, 1137–1154. [Google Scholar] [CrossRef]
  37. Wang, X.; Hong, W.; Liu, Y.Q.; Hu, D.M.; Xin, P. SAR Image Aircraft Target Recognition Based on Improved YOLOv5. Appl. Sci. 2023, 13, 6160. [Google Scholar] [CrossRef]
  38. Zheng, Z.; Wang, P.; Ren, D.; Liu, W.; Ye, R.; Hu, Q.; Zuo, W. Enhancing Geometric Factors in Model Learning and Inference for Object Detection and Instance Segmentation. arXiv 2020, arXiv:2005.03572. [Google Scholar] [CrossRef]
  39. Li, X.; Wang, W.; Wu, L.; Chen, S.; Hu, X.; Li, J.; Tang, J.; Yang, J. Generalized Focal Loss: Learning Qualified and Distributed Bounding Boxes for Dense Object Detection. arXiv 2020, arXiv:2006.04388. [Google Scholar] [CrossRef]
  40. Mao, A.; Mohri, M.; Zhong, Y. Cross-Entropy Loss Functions: Theoretical Analysis and Applications. arXiv 2023, arXiv:2304.07288. [Google Scholar] [CrossRef]
  41. Zhang, T.W.; Zhang, X.L.; Li, J.W.; Xu, X.W.; Wang, B.Y.; Zhan, X.; Xu, Y.Q.; Ke, X.; Zeng, T.J.; Su, H.; et al. SAR Ship Detection Dataset (SSDD): Official Release and Comprehensive Data Analysis. Remote Sens. 2021, 13, 3690. [Google Scholar] [CrossRef]
  42. Wang, Y.; Wang, C.; Zhang, H.; Dong, Y.; Wei, S. A SAR Dataset of Ship Detection for Deep Learning under Complex Backgrounds. Remote Sens. 2019, 11, 765. [Google Scholar] [CrossRef]
  43. Kingma, D.P.; Ba, J. Adam: A Method for Stochastic Optimization. arXiv 2014, arXiv:1412.6980. [Google Scholar] [CrossRef]
  44. Tan, M.; Le, Q.V. EfficientNet: Rethinking Model Scaling for Convolutional Neural Networks. arXiv 2019, arXiv:1905.11946. [Google Scholar] [CrossRef]
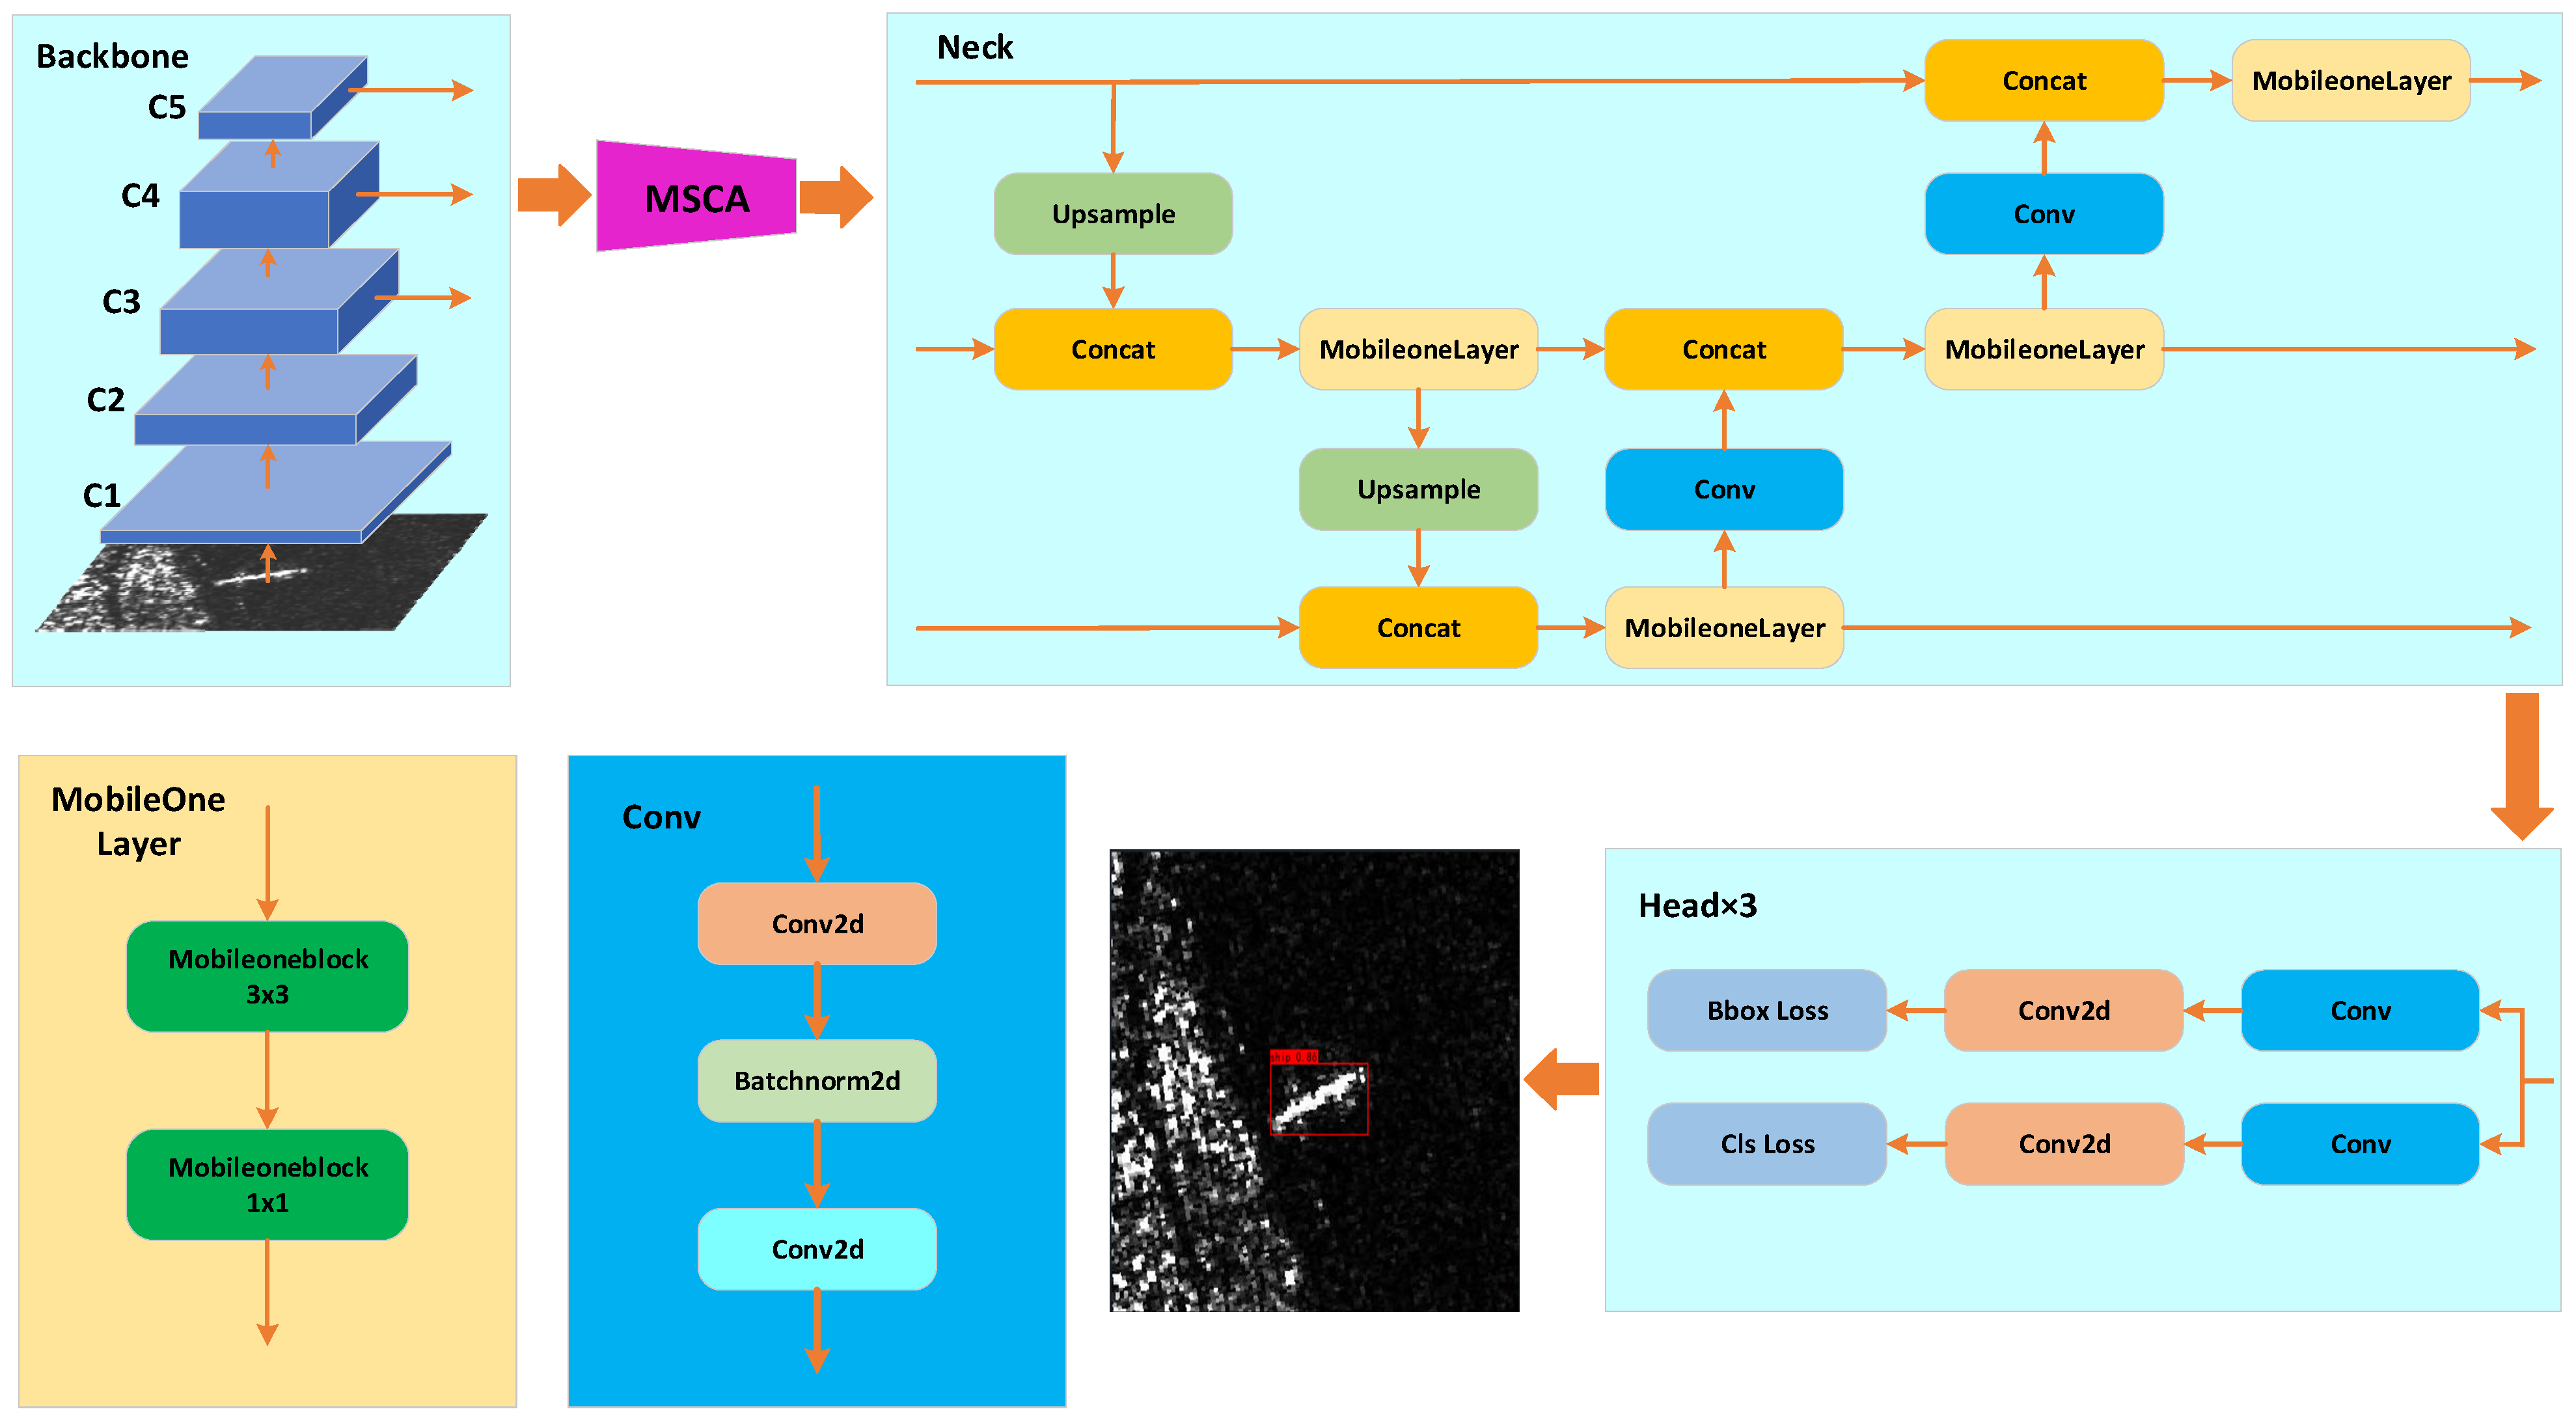
Figure 1. The general network architecture of MSSD-Net.
Remotesensing 16 02233 g001
Figure 2. The structure of the MobileOne block. The MobileOne training block on the left is reparameterized to obtain the MobileOne inference block on the right.
Remotesensing 16 02233 g002
Figure 3. The Squeeze-and-Excitation (SE) attention block.
Remotesensing 16 02233 g003
Figure 4. The Efficient Channel Attention (ECA) block.
Remotesensing 16 02233 g004
Figure 5. The Multi-Scale Coordinate Attention module.
Remotesensing 16 02233 g005
Figure 6. The Coordinate Attention (CA) module.
Remotesensing 16 02233 g006
Figure 7. The Shuffle Attention (SA) module.
Remotesensing 16 02233 g007
Figure 8. Examples of the datasets used in this study. (a) Examples of the SSDD; (b) examples of the SAR-Ship-Dataset.
Remotesensing 16 02233 g008
Figure 9. Heatmaps of the C2f (backbone network of YOLOv8), MobileOne, and MobileOne + MSCA modules.
Remotesensing 16 02233 g009
Figure 10. SAR target detection results via MSSD-Net. Red boxes are targets detected via MSSD-Net and yellow boxes are missed detections. (a) Detection results for the SSDD; (b) detection results for the SAR-Ship-Dataset.
Remotesensing 16 02233 g010aRemotesensing 16 02233 g010b
Figure 11. SAR target detection results via MSSD-Net and other models. Red boxes are target detections, yellow boxes are missed detections, and blue boxes are false detections. (a) Detection results for the Faster-RCNN; (b) detection results for the FCOS; (c) detection results for the SSD; (d) detection results for the YOLOv5-s; (e) detection results for the YOLOv8-s; and (f) detection results for the MSSD-Net model.
Remotesensing 16 02233 g011aRemotesensing 16 02233 g011b
Table 1. Performance comparison of backbone networks with different depths.
NumberBlock NumbermAP (%)P (%)R (%)F1 (%)FLOPs (G)
1[1,1,1,1]96.9097.5488.810.934.39
2[2,2,2,2]96.5797.1990.300.944.62
3[2,3,3,2]96.8697.1388.430.934.74
4[2,3,4,2]98.0299.2191.940.954.79
5[3,3,3,3]96.3297.5990.670.944.86
6[3,4,4,3]95.8097.2191.040.944.98
7[4,4,4,4]96.8396.7989.930.935.10
Table 2. Comparison of params for backbone networks with different depths.
Block Number[1,1,1,1][2,2,2,2][2,3,3,2][2,3,4,2][3,3,3,3][3,4,4,3][4,4,4,4]
Train-param(M)2.2652.6412.7342.8073.0173.1113.394
Infere-param(M)1.5201.6121.6351.6521.7041.7271.797
Table 3. Comparison of ship testing indicators on the SSDD.
BackboneMSCAmAP (%)P (%)R (%)F1 (%)Param (M)
CASA
C2f××97.1897.5092.130.952.302
MobileOne××97.4597.0590.550.941.477
MobileOne×97.9597.1390.940.941.651
MobileOne98.0299.2191.940.951.652
Table 4. Performance comparison of MSSD-Net on the SSDD and SAR-Ship-Dataset.
DatasetmAP (%)P (%)R (%)F1 (%)
SSDD98.0299.2191.940.95
SAR-Ship-Dataset93.8093.5783.610.88
Table 5. Comparison results of our MSSD-Net model against state-of-the-art models.
MethodmAP (%)P (%)R (%)F1 (%)Param (M)FLOPs (G)
Faster-RCNN75.5839.9786.940.55137.1370.2
FCOS97.1694.5590.670.9332.1161.9
SSD84.7194.3349.630.6526.362.7
YOLOv5-s96.8191.9889.930.9147.0115.9
YOLOv8-s98.4899.1989.380.9411.228.8
Ours98.0299.2191.940.951.64.8
Disclaimer/Publisher’s Note: The statements, opinions and data contained in all publications are solely those of the individual author(s) and contributor(s) and not of MDPI and/or the editor(s). MDPI and/or the editor(s) disclaim responsibility for any injury to people or property resulting from any ideas, methods, instructions or products referred to in the content.