Abstract
Phytoplankton are the foundation of marine ecosystems and play a crucial role in determining the optical properties of seawater, which are critical for remote sensing applications. However, passive remote sensing techniques are limited to obtaining data from the near surface, and cannot provide information on the vertical distribution of the subsurface phytoplankton. In contrast, active LiDAR technology can provide detailed profiles of the subsurface phytoplankton layer (SPL). Nevertheless, the large amount of data generated by LiDAR brought a challenge, as traditional methods for SPL detection often require manual inspection. In this study, we investigated the application of supervised machine learning algorithms for the automatic recognition of SPL, with the aim of reducing the workload of manual detection. We evaluated five machine learning models—support vector machine (SVM), linear discriminant analysis (LDA), a neural network, decision trees, and RUSBoost—and measured their performance using metrics such as precision, recall, and F3 score. The study results suggest that RUSBoost outperforms the other algorithms, consistently achieving the highest F3 score in most of the test cases, with the neural network coming in second. To improve accuracy, RUSBoost is preferred, while the neural network is more advantageous due to its faster processing time. Additionally, we explored the spatial patterns and diurnal fluctuations of SPL captured by LiDAR. This study revealed a more pronounced presence of SPL at night during this experiment, thereby demonstrating the efficacy of LiDAR technology in the monitoring of the daily dynamics of subsurface phytoplankton layers.
1. Introduction
Phytoplankton is the foundation of marine ecosystems. Dense aggregations of phytoplankton, known as phytoplankton layers [1], can be several kilometers long and range in thickness from a few centimeters to several meters, occasionally leading to harmful algal blooms [2]. These phytoplankton layers have profound effects on biogeochemical processes [3], primary productivity [4], carbon cycle [5], and climate [6] in the upper layers of the ocean. In addition, the actual distribution of phytoplankton contains important ecological information and is an indispensable part of discerning the optical properties of the ocean, which are essential for remote sensing. A comprehensive understanding of the state and stratification of phytoplankton not only deepens our understanding of its ecological role, but also refines the interpretation of remote sensing data [7]. These insights are also critical for managing ocean circulation, protecting marine ecosystems, and sustaining fisheries’ resources [8].
Traditional detection techniques, such as seawater sampling [9], the use of optical sensors [10] and acoustic systems [11], and underwater imaging [12], require in situ operations, which have shown limited efficiency and scalability for large-scale surveys. In contrast, LiDAR, as an advanced active remote sensing technology, has demonstrated its efficacy in mapping fish and zooplankton populations [13,14], detecting air bubbles [15], delineating bathymetric contours line [16], and characterizing optical water column profiles [17,18]. This capability enables LiDAR to provide comprehensive information on the diurnal variability of marine phytoplankton, contributing to a deeper understanding of the spatial and temporal distribution of phytoplankton [19], as well as the dynamics of the upper ocean [20].
In recent years, an increasing number of studies have utilized LiDAR data for internal surveys of the subsurface phytoplankton layer (SPL). Mitra and Churnside [21] estimated the optical signals from marine LiDAR by using the one-dimensional transient time-varying radiative transfer equation via the discrete ordinates method, and further investigated the influence of the SPL on different depths, thicknesses, and densities. Churnside et al. [22] conducted a comparative analysis of three different data-processing methods specifically for SPL, including manual identification, multiscale median filtering, and curve fitting applied to LiDAR profiles, all three of which require manual inspection. Hill and Zimmerman [23], in their study, emphasized the significant improvements LiDAR has brought to estimating the primary productivity of the Arctic Ocean through the combined use of active and passive remote sensing data, and pointed out its significant impact on Arctic estimations. In 2014, Churnside and Marchbanks [24] used airborne LiDAR to make sounding measurements of the subsurface phytoplankton layer in the western Arctic Ocean. Their study identified the phytoplankton layer in the Chukchi and Beaufort Seas and examined the effect of ice floes on the depth and thickness of the phytoplankton layer. A follow-up study conducted three years later in the same area showed that the average depth of the phytoplankton layer in open waters was greater than that of the layer under ice floes [25]. Zavalas et al. [26] applied an automatic classification technique of LiDAR data to the habitat classification of benthic macroalgae communities, and the result of the study proved its effectiveness. Chen et al. [27,28] introduced a novel hybrid inversion method that combined Klett LiDAR per perturbation of βπ using airborne LiDAR over the South China Sea. The inversion results of this method are in good agreement with the in situ chlorophyll-a measurements. Liu et al. [29] used airborne LiDAR to study the spatial distribution and seasonal dynamics of the subsurface phytoplankton layer in Sanya Bay, South China Sea, and gained significant insights. Recently, M. Shangguan et al. conducted a comprehensive study of diurnal continuous, high-resolution SPL in the South China Sea using single-photon underwater LiDAR technology [30,31]. These examples fully demonstrate the usefulness of LiDAR, and data processing for LiDAR is an essential step regardless of the application of LiDAR.
In the study of subsurface phytoplankton layers using LiDAR data, data processing includes data screening and calculations. Generally, each Lidar detection experiment will generate a large amount of data; however, not all LiDAR data are indicative of phytoplankton layers. Manual visual analysis to detect the physical signatures of these layers is typically required, consuming approximately 10 to 20 min for a specialist to discern a subsurface layer within an hour of LiDAR data. Consequently, there is an urgent need for an automated method to identify the phytoplankton layer to reduce the labor intensity of manual inspection. While the authors of previous studies have used spatial filtering and thresholding to detect phytoplankton, the authors of one study encountered challenges in fine-tuning the filtering parameters and threshold levels when using this approach [32]. Churnside explored the potential of supervised machine learning for locating regions containing fish [33], and found that there is no universally applicable optimal model; instead, the selection of a classifier depends on the specific goals of the research.
In the following paper, we explore the potential of using supervised machine learning algorithms to identify phytoplankton layers. The paper is organized as follows: Section 2 details the data collection and methodology; Section 3 presents the results obtained from the machine learning algorithm in detecting the phytoplankton layer; and Section 4 investigates the performance of the algorithm with respect to diurnal fluctuations in the phytoplankton layer.
2. Materials and Methods
2.1. Study Area
Our study focuses on the Gulf of Mexico, located off the southeastern coast of the North American continent, which has an ocean area of 1,507,639 km2 and an average depth of 1615 m. In a study of global changes of phytoplankton concentrations over the last 20 years, while the concentrations of phytoplankton have declined along the lower latitude coasts of the Northern Hemisphere, increased concentrations have been observed in the Gulf of Mexico. The phytoplankton layer is widely distributed in the Gulf of Mexico, with 70% concentrated in shallower bays. The formation probability of phytoplankton layers is influenced by chlorophyl concentration. In the Gulf of Mexico, the layers increase when Chl is less than 6 mg/m3, and the layers with a thickness less than 5 m are mainly located 10–15 m below the water surface. Fieldwork was conducted from 24 September to 7 October 2011, in the northern Gulf of Mexico, where NOAA’s LiDAR system was utilized both during the day and at night for the detection of flying fish, fish schools, jellyfish, and plankton layers (see Figure 1). The LiDAR was mounted underneath a small twin-engine aircraft and was capable of conducting and extensive survey of the study area at an altitude of 300 m above sea level and at speeds of 80–100 m/s. Routine daytime flights were conducted at night, twice a day. For analysis purposes, the collected dataset was divided into daytime and nighttime sets based on the respective flight times, and subjected to separate data preprocessing, parameter optimization, and model training. The airborne NOAA LiDAR system consist of a frequency-modulated, continuous-wave Nd:YAG laser emitting 532 nm linearly polarized light at a repetitive frequency of 30 Hz, containing 12 ns pulses. The receiver has two channels: a co-polarized channel and a cross-polarized channel, each equipped with an optical filtering system with a 1 nm bandwidth interference filter, supplemented by a photomultiplier tube (PMT) for effective detection. Unprocessed LiDAR data were generously provided by the NOAA Chemical Sciences Laboratory.
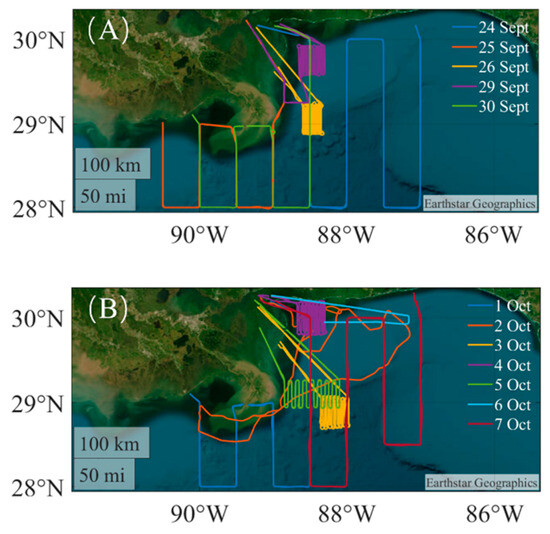
Figure 1.
Flight route map for airborne LiDAR detection in the Gulf of Mexico from 24 September through to 7 October. (A) shows the flight path in September and (B) shows the flight path in October.
2.2. Data Processing
The raw data are PNG images of 1000 × 1000 pixels, and each PNG image contains four object labels: flying fish, fish schools, jellyfish, and phytoplankton layers. Data transformation is performed for each image and the four object labels are placed into a matrix where each row corresponds to four objects and each column indicates the presence of the object, and then, the data for each day are presented in separate Matlab .mat files. In our study, we prioritized the phytoplankton layer; hence, the other three object labels were ignored. For each region, the labels were divided into 1000 windows, and a region is considered to be a region of layer (ROL) if a layer label ids present in the region. Figure 2 shows an example of LiDAR data displaying a phytoplankton layer captured on the evening of 26 September at an approximate depth of 25 m.

Figure 2.
Example of cross-polarized channel LiDAR data from the Gulf of Mexico. The red color represents high intensity while the blue color means low intensity.
2.2.1. Data Preprocessing
Three steps are required to preprocess the converted PNG image data, which are surface detection and smoothing, surface correction, and depth adjustment. The first two steps aim to compensate for aircraft altitude variations, and the depth adjustment is to reduce the dimensionality of data and reduce the time for calculation. The cross-polarized channel data were used for both surface correction and depth adjustment since the cross polarized data provide a better contrast between the phytoplankton layer and the background water column. Water surface detection involves finding the maximum echo of each LiDAR data in the co-polarized channel and moving up to 25% of this maximal echo.
where is the surface index, is the vector return value, and is the return value within sample range n. To avoid large gaps between the identified surface locations and the neighboring data, a mean shift filter is applied for surface smoothing operations.
Once the surface is found, the surface data were shifted up to the first row and the bottom were filled with 0 data to maintain the original number of rows. Surface correction enables the machine learning algorithm to interpret each row as a specific feature, correlating the LiDAR’s returned intensity with a precise depth in the water column.
Following surface correction, the dataset was condensed to 300 rows corresponding to a depth of approximately 35 m, based on the penetration depth of the LiDAR and the expected depth of the layer. The adjustment in depth is to reduce the data dimensionality, thereby simplifying the complexity of machine learning algorithm and mitigating the influence of the appended zero data from the surface correction process.
2.2.2. Parameter Adjustment
The preprocessed data were partitioned into training and test subsets, while daily data were divided into day and night datasets, which were then subsequently segmented into sets of 1000 contiguous shots. Of these, 80% of both daytime and nighttime data were randomly designated as training data, while the remaining 20% constituted the test data.
For parameter optimization for the training data, we utilized a triple cross-validation approach, which involved fine-tuning the hyperparameters of each algorithm, the undersampling ratio, and the requisite count of predicted labels for a region of layer (ROL) classification. Table 1 shows the hyperparameter setting range of machine learning algorithms. The default parameters served as the starting point for undersampling adjustments, supplemented by a grid search with an increment of 0.05 within the range [0, 0.95]. For each parameter setting, triple cross-validation was employed, the F3 scores—outlined in Section 2.4—for each fold were documented, and the mean score calculated per grid node. The undersampling ratio yielding the highest mean F3 score was selected for subsequent use. Hyperparameter refinement proceeded through the use of MATLAB’s Bayesian optimization function. In instances where the F3 scores remained suboptimal post-adjustments, the default settings were reinstated. Subsequently, to curtail potential predictive inaccuracies, the threshold for layer label counts per region was modified, with the optimal label threshold derived from a spectrum ranging from 1 to 100, based on the highest mean F3 score achieved.

Table 1.
Machine Learning Algorithm Hyperparameter Setting Range.
2.3. Supervised Machine Learning Algorithms
Supervised learning is a form of machine learning in which a model is trained using labeled sample data, enabling it to make label predictions for new, unlabeled data. The accurate training of supervised algorithms has the potential to minimize classification errors and enhance predictive precision. This study examines a selection of notable supervised machine learning algorithms, including support vector machine (SVM) [34], linear discriminant analysis (LDA) [35], neural networks [36], decision trees [37], and Random Under-Sampling Boost (RUSBoost) [38]. While SVM, LDA, and decision trees are standard classifiers, RUSBoost has been tailored for imbalanced datasets by integrating random undersampling with the AdaBoost M2 [39] boosting framework, thereby improving overall algorithmic performance. The technique of random undersampling [40], widely regarded as an effective approach to addressing dataset imbalances, has been empirically shown to yield positive results. Despite the potential for information loss due to the removal of samples from the majority class [41], this strategy reduces imbalance and shortens training durations [42]. AdaBoost, a prevalent boosting method, iteratively trains a weak learner, adjusts sample weights based on the current learner’s accuracy, and ultimately aggregates all weak learners to establish the final model.
2.4. Evaluation Indicators
The findings of this study are presented in the confusion matrix (refer to Table 2). This matrix serves as a visual representation of the classification outcomes derived from the applied classifier:

Table 2.
Confusion matrix.
The efficacy of the classifier’s classification capabilities is assessed through precision, recall, and F3 score. Precision and recall represent nuanced balances between metrics that can be categorized as either “too conservative” or “too aggressive.” Originally employed within the realm of information retrieval, these metrics were introduced to ascertain the susceptibility of a model to degradation by irrelevant data. Precision is the measure of identified positive instances (layers) that are genuinely positive, reflecting the accuracy and reliability of the classifier’s predictions. Specifically, a high precision value signifies the classifier’s adeptness at avoiding the misclassification of non-layer instances as layers:
Recall represents the proportion of true positive instances (layers) within a sample that the classifier accurately identifies; in other words, it gauges the classifier’s competency in detecting positive cases. A higher recall value indicates enhanced capacity of the model to identify a larger subset of positive instances, with a recall of 1 indicating towards successful recognition of all layers:
The F-score is a metric that amalgamates both precision and recall. It is computed based on the weighted harmonic mean of these two metrics, with the weighting relationship between precision (accuracy) and recall typically set at a 1/β ratio:
In the context of this study, β was defined as 3, thereby employing the F3 score as a solitary measure for evaluating the classifier’s performance:
For the selection of the optimal model, F3 is the primary basis of consideration, and the model that obtains the highest F3 value is considered to be the optimal model. The next indicator considered is the recall, as it indicates the number of layers correctly identified by the algorithm out of all the layer signals. Finally, precision is considered. In addition to the three evaluation indicators, the parameter tuning time and running time of each algorithm are also counted as a comprehensive consideration of the model performance.
3. Result
In the following section, the experimental outcomes for both the daytime and nighttime datasets are presented. The section encompasses the test results and region of layer (ROL) findings alongside those obtained from cross-validation procedures.
3.1. Daytime Results
Table 3 shows the hyperparameter values for each algorithm that was calibrated using daytime data from the Gulf of Mexico. Notably, the default hyperparameters for LDA surpassed the performance of all others assessed during the tuning process, leading to the exclusive adjustment of the FN cost.

Table 3.
Hyperparameter values for daytime data in the Gulf of Mexico.
Figure 3 illustrates the test prediction outcomes using daytime data from the Gulf of Mexico. The figure shows that the decision tree algorithm classified all the data as layers, whereas the neural network excelled with the highest correct identification rate of layers at approximately 22.4%. RUSBoost followed with a commendable 17.1%, while SVM, LDA, and decision tree yielded similar accuracy rates of 7.0%, 7.3%, and 6.9%, respectively. These latter three algorithms demonstrated a tendency to incorrectly label non-layer data as layers. In contrast, the neural network and RUSBoost showed a propensity to erroneously categorize layer data as non-layers. Figure 4 displays the cross-validated outcomes, where there was a slight decrease in accuracy for all algorithms, yet the ranking order of their performance persisted. The neural network still leads with an accuracy rate of 19.8%, RUSBoost ranks the second at 16.1%, and the SVM, LDA, and decision tree performances remain close to one another at 6.3%, 6.4%, and 6.1%, respectively. Despite the neural network showcasing superior accuracy in both the test and the cross-validated results, as stated in Table 4, RUSBoost achieved the highest F3 score, with the neural network ranking second.
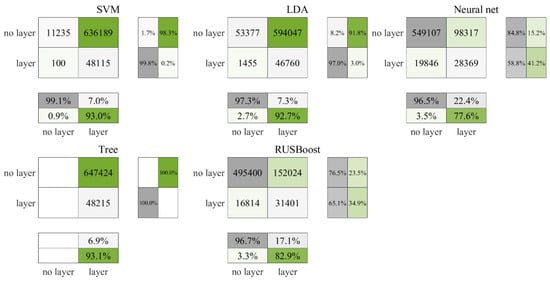
Figure 3.
Test results for daytime data in the Gulf of Mexico.
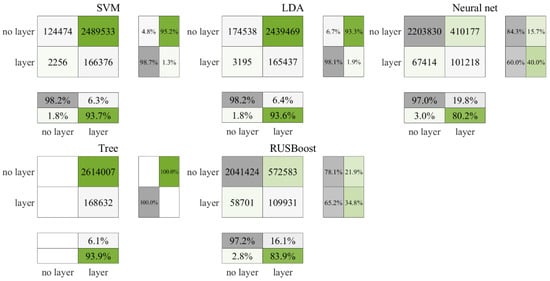
Figure 4.
Cross-validation results for daytime data in the Gulf of Mexico.

Table 4.
Statistics for the daytime data assessment indicators in the Gulf of Mexico.
Figure 5 illustrates the test outcomes for the daytime ROL data from the Gulf of Mexico, and Figure 6 corresponds to the cross-validation outcomes. According to Figure 5, both the SVM and decision tree algorithms classified all data points as layers, yet they also registered the highest count of accurately identified layers, at 78 each. Following cross-validation, as depicted in Figure 6, the decision tree alone continued to categorize all data as layers, in contrast, the SVM accurately recognized 41 non-layers. In comparison, the neural network and RUSBoost demonstrated a lower accuracy in identifying layers but exhibited superior performance in correctly categorizing non-layers relative to the other algorithms. Table 5 encapsulates the ROL data results, indicating that the neural network achieved the most elevated F3 score, with RUSBoost ranking a close second.
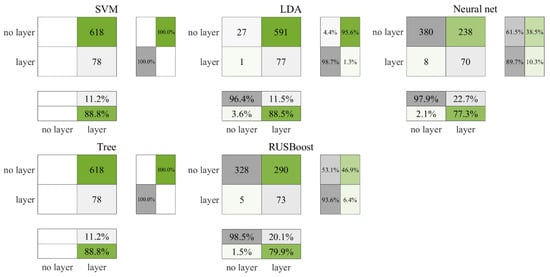
Figure 5.
Test results for daytime ROL data in the Gulf of Mexico.
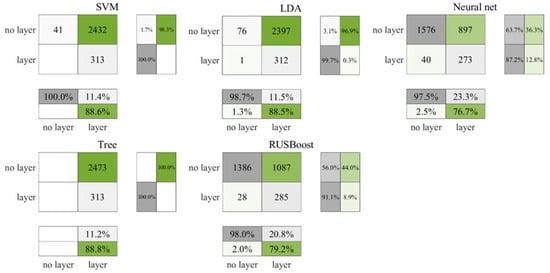
Figure 6.
Cross-validation results for daytime ROL data in the Gulf of Mexico.

Table 5.
Statistics on daytime ROL data assessment metrics in the Gulf of Mexico.
3.2. Nighttime Results
Table 6 displays the hyperparameter settings for each algorithm, which were calibrated using nighttime data from the Gulf of Mexico. The default LDA hyperparameters surpassed the performance of all others evaluated throughout the tuning process; thus, only the FN cost underwent fine-tuning.

Table 6.
Hyperparameter values for nighttime data in the Gulf of Mexico.
Figure 7 and Figure 8 illustrate that the precision of the prediction outcomes for nighttime data surpass those of the daytime. In the testing phase, RUSBoost accurately identified 35.2% of the layers, with a slight increase to 36.7% in the cross-validation stage. Conversely, the neural network correctly identified 24.6% of the layers in the testing phase, which slightly decreased to 23% in the cross-validation. In comparison, neither SVM nor the decision tree classified any non-layers correctly in either the testing or cross-validation phases. As indicated in Table 7, RUSBoost consistently secured higher F3 values across both result sets.
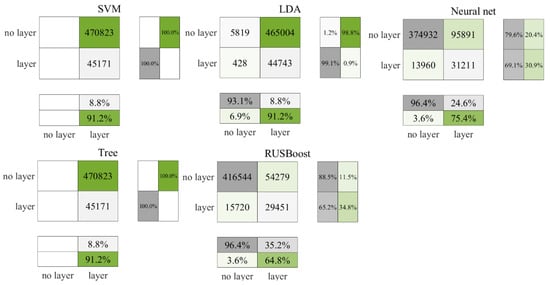
Figure 7.
Test results for nighttime data in the Gulf of Mexico.
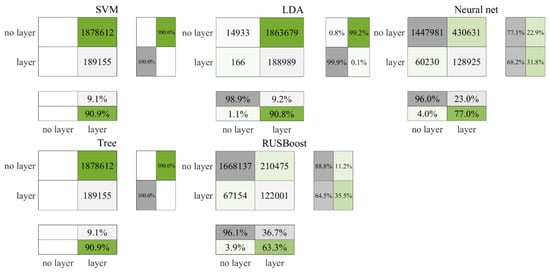
Figure 8.
Cross-validation results for nighttime data in the Gulf of Mexico.

Table 7.
Statistics for the nighttime data assessment indicators in the Gulf of Mexico.
Figure 9 and Figure 10 present the test and cross-validation outcomes for nighttime ROL data, respectively. Echoing the patterns observed in earlier findings, RUSBoost achieved the most robust performance followed by the neural network, with both SVM and the decision tree categorizing all data as layers. During the testing phase, LDA similarly classified all data as layers, whereas the cross-validation phase showed a marginal improvement, with one non-layer data point being correctly identified. As illustrated in Figure 10, in the cross-validation phase, RUSBoost correctly identified 314 more non-layer data points than the neural network, albeit accurately identifying seven fewer layers. The neural network misclassified 50.2% of non-layer data as layers, in contrast to RUSBoost, which was found to have a lower misclassification rate of 32.3%. Consistent with previous trends, the results shown in Table 8 confirm the fact RUSBoost secured the highest F3 score among the evaluated metrics.
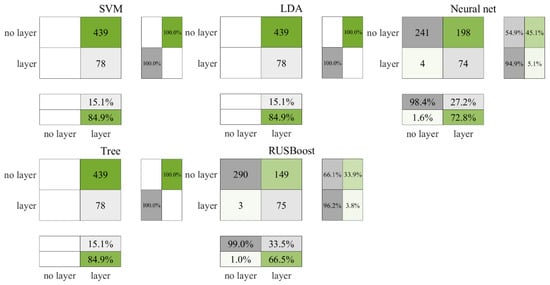
Figure 9.
Test results for nighttime ROL data in the Gulf of Mexico.
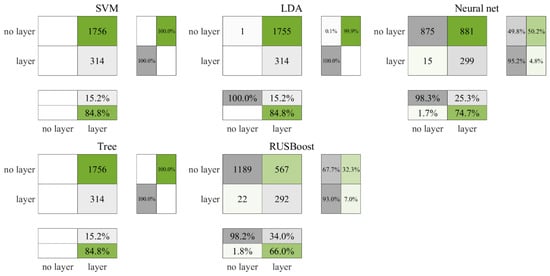
Figure 10.
Cross-validation results for nighttime ROL data in the Gulf of Mexico.

Table 8.
Statistics for the nighttime ROL data assessment metrics in the Gulf of Mexico.
4. Discussion
4.1. Performance Analysis of Supervised Learning Algorithms
The findings detailed in Section 3 demonstrate that both the neural network and RUSBoost algorithms outperform the three alternative algorithms by a notable margin, with RUSBoost achieving the top F3 score in three out of four sets of evaluation metric statistics. RUSBoost’s superior F3 values were noted across multiple categories, except in the daytime ROL data set, where the neural network ranked highest (as confirmed by the results shown in Table 5). Furthermore, algorithms that excelled in cross-validation tended to also show strong performance with the test data. This could suggest that the LiDAR data’s regions, containing layers, possess distinctive characteristics or distribution properties. Generally, the study’s algorithms operate under the presumption of data independence, which might not align with the real-world scenario where a single layer may extend across several adjacent areas, challenging this assumption.
According to the study’s outcomes, both the neural network and RUSBoost are recommended for detecting phytoplankton layers. As illustrated by the results shown in Table 9, despite requiring the most extended total time with prolonged hyperparameter tuning phases compared to other algorithms, RUSBoost is preferred due to its accuracy, notwithstanding its longer running time. If more rapid analysis is prioritized, the neural network serves as an efficient alternative, consuming only 85% and 61% of the time required by RUSBoost for daytime and nighttime data, respectively, while still delivering similar results.

Table 9.
Running time statistics for the tuning of each algorithm parameter, described in seconds (s). Training was run on a Windows system computer with 32 gigabytes of RAM.
Use of the decision tree algorithm is advised against as it consistently misclassified all data as layers, besides being significantly slower, with the average run times being 8.2 and 4.5 times longer than SVM and LDA, respectively. Similarly, SVM’s tendency to classify all data as layers in three out of four cases, despite having the shortest run time, limits it from being recommended. SVM is mainly applied to small-scale datasets, and when the number of samples and classes increase, the optimization scale increases and the algorithm time consumption increases accordingly. When faced with data with imbalanced categories, SVM may fail to recognize a few classes. LDA may identify more layers accurately than RUSBoost and neural networks; however, it has a high false-positive rate for non-layers, improving recall but necessitating additional manual review. Consequently, while LDA remains an option, it is only suitable when manual verification time can be afforded.
4.2. Diurnal Variation in Phytoplankton Layers
In this study, phytoplankton layers were delineated using layer labels from LiDAR data, as cited in reference [32]. The characteristics of selected phytoplankton layer profiles are illustrated in Figure 11, with their depth and thickness details presented in Figure 12. Single-layer regions, designated as (A–D), exhibit average depths of −4.17 m, −11.80 m, −1.61 m, and −13.02 m, respectively, in addition to average thicknesses of 4.14 m, 2.80 m, 2.25 m, and 1.16 m. Profiles (E–H) reveal dual-layer regions, with average depths for the shallower and deeper layers being −1.83 m and −15.08 m, −1.78 m and −11.08 m, −1.8 m and −13.59 m, and −2.05 m and −7.51 m, correspondingly. The thicknesses for these deeper layers are noted as 1.97 m and 4.63 m, 2.07 m and 3.06 m, 2.19 m and 3.68 m, and 2.72 m and 3.34 m, respectively. A comparison of the layer labels with profile outcomes suggests an oversight of deeper layer labels particularly in regions comprising multiple layers. For instance, the results shown in Figure 11E indicate layer presence at distances beyond 4000, though there exists a significant layer within the 1000–4000 distance range at a depth of 17 m, which seems to have been overlooked in labeling.
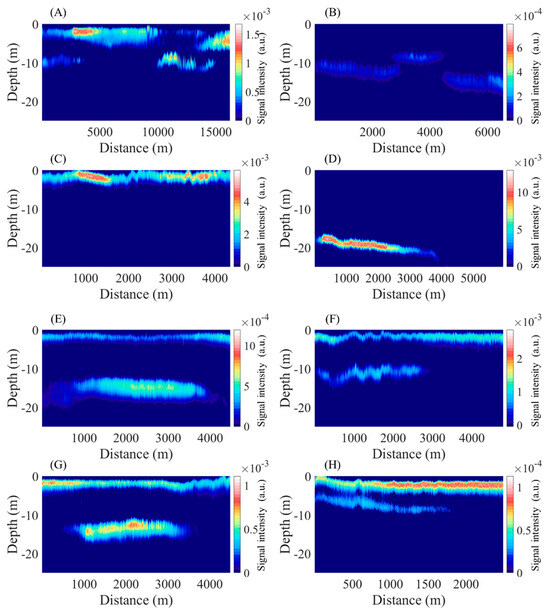
Figure 11.
Example of phytoplankton layers in the Gulf of Mexico; (A–D) are single layers and (E–H) are multiple layers. The X-axis is the distance flown by the airborne lidar and the Y-axis is the depth below sea level. The color bar is the signal strength of the lidar (a.u.).
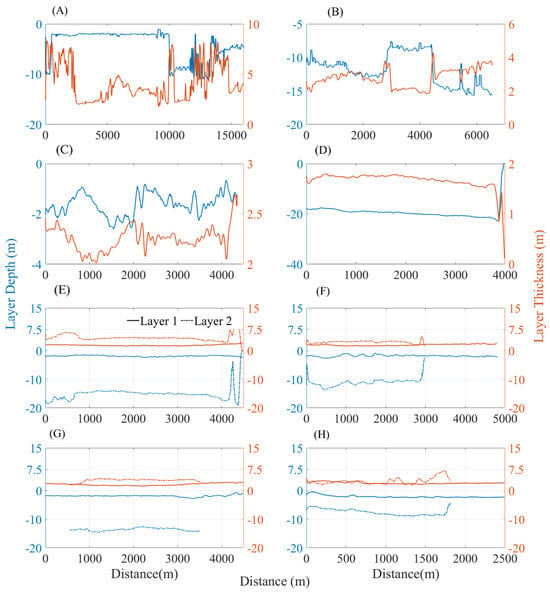
Figure 12.
Depth and thickness statistics for the phytoplankton layer in the Gulf of Mexico, (A–H) correspond to (A–H) of Figure 11, respectively. Bule lines are the depth of layers and orange lines are the thickness of layers.
Despite occasional omissions in labeling, leveraging machine learning algorithms for data prediction markedly reduces the manual processing time required for depth and thickness calculations. As an illustrative case, Figure 10 shows that RUSBoost identified 1189 (57%) of the 2070 analyzed regions as non-layers. These 2070 regions represent roughly 20.6 h of LiDAR data, which would ideally require 6.9 h for manual analysis, estimated at about 20 min per hour of LiDAR data. Accordingly, the identification of the 1189 non-layered segments could potentially save about 3.9 h of analysis time.
The observations from the flight conducted on 4 October revealed significant detection of thin phytoplankton layers, with daytime LiDAR data capturing about 35% of the layers and nighttime data detecting approximately 39% of the layers. This result indicates higher efficacy in layer detection during the nighttime. The results shown in Figure 13 juxtapose the layers detected in the same geographic area both during the day and at night. Notably, a thin layer located at 30.15°S, 88.53°W, at a depth of roughly 20 m, is observable during the daytime. However, at nighttime, this layer appears elongated with an enhanced signal strength, alongside two additional layers at the same depth but with marginally weaker signal intensity. This variation is attributed to the diurnal changes affecting the phytoplankton concentration, which typically remains low in the latter part of the day but experiences significant increase after 6 p.m., according to findings cited in reference [43].
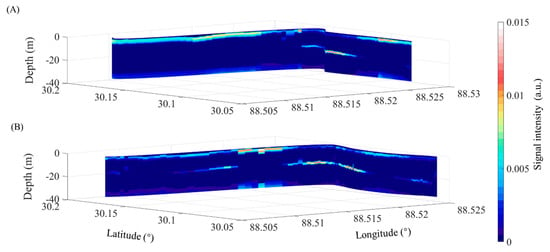
Figure 13.
Comparison of daytime and nighttime detections in the same area on 4 October. (A) Layers detected by daytime flights and (B) layers detected by nighttime flights.
In shallow aquatic environments, the phytoplankton layer depth is predominantly determined by the water depth. Selph [44] discussed, in his research on phytoplankton community composition within the Gulf of Mexico, how the biomass and composition of phytoplankton vary according to depth and season. Specifically, the surface water or mixed layer is predominated by prokaryotic and cryptophytic algae, whereas diatoms are more predominant at the depth of the chlorophyll maximum in deeper waters. Moreover, the concentration of nitrate and phosphate is minimal in the mixed layer, and the distribution of these nutrients significantly influences the community composition of phytoplankton [45].
The formation of phytoplankton layers is also subject to environmental factors such as salinity, wind, internal waves, and hypoxia, with distinct formation patterns emerging in different regions [46]. Therefore, understanding the dynamics of phytoplankton layer formation necessitates further investigation into the interplay between these environmental factors and the interactions among phytoplankton, zooplankton, and fish behavior.
5. Conclusions
The findings presented in this paper illustrate the potential of applying supervised machine learning algorithms to ascertain regions likely to harbor phytoplankton layers based on LiDAR data. The data in this study were divided into daytime data and nighttime data for testing based on the time of the survey flight. Empirical evidence suggests that among the evaluated algorithms, RUSBoost garners the most commendable performance albeit one with the longest runtime. Conversely, the neural network stands out as a viable alternative should there be a premium on saving time. RUSBoost distinguished itself by accurately predicting the majority of regions with phytoplankton layers, thereby streamlining the overall data-analysis duration. Moreover, a comparative study of phytoplankton layers during the day and night unraveled an increased detection frequency at night, thus offering valuable insights. Such findings serve to augment future research directed toward deciphering phytoplankton layer formation mechanisms, as well as understanding their diurnal and seasonal fluctuations.
Author Contributions
Conceptualization, C.Z. and P.C.; methodology, C.Z.; software, C.Z.; validation, C.Z. and S.Z.; writing—original draft preparation, C.Z.; writing—review and editing, C.Z. and P.C.; funding acquisition, P.C. All authors have read and agreed to the published version of the manuscript.
Funding
This research was funded by the National Key Research and Development Program of China (2022YFB3901702; 2022YFB3901703; 2022YFB3902603; 2022YFC3104200), the National Natural Science Foundation (42322606; 42276180; 61991453): Key R&D Program of Shandong Province, China (2023ZLYS01), the Key Special Project for Introduced Talents Team of Southern Marine Science and Engineering Guangdong Laboratory (GML2021GD0809), the Donghai Laboratory Preresearch Project (DH2022ZY0003), and the Key Research and Development Program of Zhejiang Province (grant No. 2020C03100).
Data Availability Statement
The Lidar data are available at https://csl.noaa.gov/groups/csl3/measurements/2011McArthurII/ (accessed on 9 January 2024).
Acknowledgments
The authors are grateful to Churnside at the NOAA for making the data public.
Conflicts of Interest
The authors declare no conflict of interest.
References
- Dekshenieks, M.; Donaghay, P.; Sullivan, J.; Rines, J.; Osborn, T.; Twardowski, M. Temporal and spatial occurrence of thin phytoplankton layers in relation to physical processes. Mar. Ecol. Prog. Ser. 2001, 223, 61–71. [Google Scholar] [CrossRef]
- Berdalet, E.; McManus, M.A.; Ross, O.N.; Burchard, H.; Chavez, F.P.; Jaffe, J.S.; Jenkinson, I.R.; Kudela, R.; Lips, I.; Lips, U.; et al. Understanding harmful algae in stratified systems: Review of progress and future directions. Deep Sea Res. Part II Top. Stud. Oceanogr. 2014, 101, 4–20. [Google Scholar] [CrossRef]
- Uitz, J.; Claustre, H.; Gentili, B.; Stramski, D. Phytoplankton class-specific primary production in the world’s oceans: Seasonal and interannual variability from satellite observations. Glob. Biogeochem. Cycles 2010, 24, GB3016. [Google Scholar] [CrossRef]
- Righetti, D.; Vogt, M.; Gruber, N.; Psomas, A.; Zimmermann, N.E. Global pattern of phytoplankton diversity driven by temperature and environmental variability. Sci. Adv. 2019, 5, eaau6253. [Google Scholar] [CrossRef] [PubMed]
- Ryan-Keogh, T.J.; Thomalla, S.J.; Monteiro, P.M.S.; Tagliabue, A. Multidecadal trend of increasing iron stress in Southern Ocean phytoplankton. Science 2023, 379, 834–840. [Google Scholar] [CrossRef] [PubMed]
- Chien, C.T.; Pahlow, M.; Schartau, M.; Li, N.; Oschlies, A. Effects of phytoplankton physiology on global ocean biogeochemistry and climate. Sci. Adv. 2023, 9, eadg1725. [Google Scholar] [CrossRef]
- Moore, T.S.; Churnside, J.H.; Sullivan, J.M.; Twardowski, M.S.; Nayak, A.R.; Mcfarland, M.N.; Stockley, N.D.; Gould, R.W.; Johengen, T.H.; Ruberg, S.A. Vertical distributions of blooming cyanobacteria populations in a freshwater lake from LIDAR observations. Remote Sens. Environ. 2019, 225, 347–367. [Google Scholar] [CrossRef]
- Boyce, D.G.; Lewis, M.R.; Worm, B. Global phytoplankton decline over the past century. Nature 2010, 466, 591–596. [Google Scholar] [CrossRef]
- Lunven, M.; Guillaud, J.F.; Youénou, A.; Crassous, M.P.; Berric, R.; Gall, E.L.; Kérouel, R.; Labry, C.; Aminot, A. Nutrient and phytoplankton distribution in the Loire River plume (Bay of Biscay, France) resolved by a new Fine Scale Sampler. Estuar. Coast. Shelf Sci. 2005, 65, 94–108. [Google Scholar] [CrossRef]
- Twardowski, M.S.; Sullivan, J.M.; Donaghay, P.L.; Zaneveld, J.R.V. Microscale Quantification of the Absorption by Dissolved and Particulate Material in Coastal Waters with an ac-9. J. Atmos. Ocean. Technol. 1999, 16, 691–707. [Google Scholar] [CrossRef]
- Moline, M.A.; Benoit-Bird, K.J.; Robbins, I.C.; Schroth-Miller, M.; Waluk, C.M.; Zelenke, B. Integrated measurements of acoustical and optical thin layers II: Horizontal length scales. Cont. Shelf Res. 2010, 30, 29–38. [Google Scholar] [CrossRef]
- Prairie, J.C.; Franks, P.J.S.; Jaffe, J.S. Cryptic peaks: Invisible vertical structure in fluorescent particles revealed using a planar laser imaging fluorometer. Limnol. Oceanogr. 2010, 55, 1943–1958. [Google Scholar] [CrossRef]
- Churnside, J.H.; Sawada, K.; Okumura, T. A comparison of airborne LIDAR and echo sounder performance in fisheries. J. Mar. Acoust. Soc. Jpn. 2001, 28, 175–187. [Google Scholar]
- Roddewig, M.R.; Churnside, J.H.; Hauer, F.R.; Williams, J.; Bigelow, P.E.; Koel, T.M.; Shaw, J.A. Airborne lidar detection and mapping of invasive lake trout in Yellowstone Lake. Appl. Opt. 2018, 57, 4111–4116. [Google Scholar] [CrossRef] [PubMed]
- Churnside, J.H.; Marchbanks, R.D.; Lee, J.H.; Shaw, J.A.; Weidemann, A.; Donaghay, P.L. Airborne lidar detection and characterization of internal waves in a shallow fjord. J. Appl. Remote Sens. 2012, 6, 063611. [Google Scholar] [CrossRef]
- Parrish, C.E.; Magruder, L.A.; Neuenschwander, A.L.; Forfinski-Sarkozi, N.; Alonzo, M.; Jasinski, M. Validation of ICESat-2 ATLAS Bathymetry and Analysis of ATLAS’s Bathymetric Mapping Performance. Remote Sens. 2019, 11, 1634. [Google Scholar] [CrossRef]
- Liu, H.; Chen, P.; Mao, Z.; Pan, D. Iterative retrieval method for ocean attenuation profiles measured by airborne lidar. Appl. Opt. 2020, 59, C42–C51. [Google Scholar] [CrossRef] [PubMed]
- Chen, P.; Pan, D. Ocean Optical Profiling in South China Sea Using Airborne LiDAR. Remote Sens. 2019, 11, 1826. [Google Scholar] [CrossRef]
- Churnside, J.H.; Marchbanks, R.D.; Vagle, S.; Bell, S.; Stabeno, P.J. Stratification, plankton layers, and mixing measured by airborne lidar in the Chukchi and Beaufort seas. Deep Sea Res. Part II Top. Stud. Oceanogr. 2020, 177, 104742. [Google Scholar] [CrossRef]
- Churnside, J.; Donaghay, P. Thin scattering layers observed by airborne lidar. ICES J. Mar. Sci. 2009, 66, 778–789. [Google Scholar] [CrossRef]
- Mitra, K.; Churnside, J. Transient Radiative Transfer Equation Applied to Oceanographic Lidar. Appl. Opt. 1999, 38, 889–895. [Google Scholar] [CrossRef] [PubMed]
- Churnside, J.H.; Tenningen, E.; Wilson, J.J. Comparison of data-processing algorithms for the lidar detection of mackerel in the Norwegian Sea. ICES J. Mar. Sci. 2009, 66, 1023–1028. [Google Scholar] [CrossRef]
- Hill, V.J.; Zimmerman, R.C. Estimates of primary production by remote sensing in the Arctic Ocean: Assessment of accuracy with passive and active sensors. Deep Sea Res. Part I Oceanogr. Res. Pap. 2010, 57, 1243–1254. [Google Scholar]
- Churnside, J.H.; Marchbanks, R.D. Subsurface plankton layers in the Arctic Ocean. Geophys. Res. Lett. 2015, 42, 4896–4902. [Google Scholar] [CrossRef]
- Churnside, J.; Marchbanks, R.; Marshall, N. Airborne Lidar Observations of a Spring Phytoplankton Bloom in the Western Arctic Ocean. Remote Sens. 2021, 13, 2512. [Google Scholar] [CrossRef]
- Zavalas, R.; Ierodiaconou, D.; Ryan, D.; Rattray, A.; Monk, J. Habitat Classification of Temperate Marine Macroalgal Communities Using Bathymetric LiDAR. Remote Sens. 2014, 6, 2154–2175. [Google Scholar] [CrossRef]
- Peng, C.; Cédric, J.; Zhang, Z.; Yan, H.; Zhihua, M.; Delu, P.; Tianyu, W.; Dong, L.; Yu, D. Vertical distribution of subsurface phytoplankton layer in South China Sea using airborne lidar. Remote Sens. Environ. 2021, 263, 112567. [Google Scholar] [CrossRef]
- Chen, P.; Jamet, C.; Liu, D. LiDAR Remote Sensing for Vertical Distribution of Seawater Optical Properties and Chlorophyll-a from the East China Sea to the South China Sea. IEEE Trans. Geosci. Remote Sens. 2022, 60, 4207321. [Google Scholar] [CrossRef]
- Hang, L.; Peng, C.; Zhihua, M.; Delu, P. Subsurface plankton layers observed from airborne lidar in Sanya Bay, South China Sea. Opt. Express 2018, 26, 29134–29147. [Google Scholar] [CrossRef]
- Shangguan, M.; Yang, Z.; Lin, Z.; Weng, Z.; Sun, J. Full-day profiling of a beam attenuation coefficient using a single-photon underwater lidar with a large dynamic measurement range. Opt. Lett. 2024, 49, 626–629. [Google Scholar] [CrossRef]
- Shangguan, M.; Guo, Y.; Liao, Z. Shipborne single-photon fluorescence oceanic lidar: Instrumentation and inversion. Opt. Express 2024, 32, 10204–10218. [Google Scholar] [CrossRef] [PubMed]
- Churnside, J.H.; Thorne, R.E. Comparison of airborne lidar measurements with 420 kHz echo-sounder measurements of zooplankton. Appl. Opt. 2005, 44, 5504–5511. [Google Scholar] [CrossRef] [PubMed]
- Vannoy, T.C.; Belford, J.; Aist, J.N.; Rust, K.R.; Roddewig, M.R.; Churnside, J.H.; Shaw, J.A.; Whitaker, B.M. Machine learning-based region of interest detection in airborne lidar fisheries surveys. J. Appl. Remote Sens. 2021, 15, 038503. [Google Scholar] [CrossRef]
- Vapnik, V. Estimation of Dependences Based on Empirical Data; Springer: New York, NY, USA, 2006. [Google Scholar] [CrossRef]
- Fisher, R.A. The Use of Multiple Measurements in Taxonomic Problems. Ann. Eugen. 1936, 7, 179–188. [Google Scholar] [CrossRef]
- Mehrotra, K.; Mohan, C.; Ranka, S. Elements of Artificial Neural Networks; The MIT Press: Cambridge, MA, USA, 1996. [Google Scholar] [CrossRef]
- Breiman, L.; Friedman, J.H.; Olshen, R.A.; Stone, C.J. Classification and Regression Trees. Biometrics 1984, 40, 874. [Google Scholar]
- Seiffert, C.; Khoshgoftaar, T.M.; Van Hulse, J.; Napolitano, A. RUSBoost: A Hybrid Approach to Alleviating Class Imbalance. IEEE Trans. Syst. Man Cybern. Part A Syst. Hum. 2010, 40, 185–197. [Google Scholar] [CrossRef]
- Freund, Y.; Schapire, R. Experiments with a new boosting algorithm. In Proceedings of the International Conference on Machine Learning, International Conference on Machine Learning, Bari, Italy, 3–6 July 1996. [Google Scholar]
- He, H.; Garcia, E.A. Learning from Imbalanced Data. IEEE Trans. Knowl. Data Eng. 2009, 21, 1263–1284. [Google Scholar] [CrossRef]
- Batista, G.E.A.P.A.; Prati, R.C.; Monard, M.C. A study of the behavior of several methods for balancing machine learning training data. SIGKDD Explor. Newsl. 2004, 6, 20–29. [Google Scholar] [CrossRef]
- Van Hulse, J.; Khoshgoftaar, T.M.; Napolitano, A. Experimental perspectives on learning from imbalanced data. In Proceedings of the ICML ‘07 & ILP ‘07: The 24th Annual International Conference on Machine Learning Held in Conjunction with the 2007 International Conference on Inductive Logic Programming, Corvallis, OR, USA, 21–23 June 2007. [Google Scholar]
- Li, C.; Chiang, K.P.; Laws, E.A.; Liu, X.; Chen, J.; Huang, Y.; Chen, B.; Tsai, A.Y.; Huang, B. Quasi-Antiphase Diel Patterns of Abundance and Cell Size/Biomass of Picophytoplankton in the Oligotrophic Ocean. Geophys. Res. Lett. 2022, 49, e2022GL097753. [Google Scholar] [CrossRef]
- Selph, K.E.; Swalethorp, R.; Stukel, M.R.; Kelly, T.B.; Knapp, A.N.; Fleming, K.; Hernandez, T.; Landry, M.R. Phytoplankton community composition and biomass in the oligotrophic Gulf of Mexico. J. Plankton Res. 2021, 44, 618–637. [Google Scholar] [CrossRef]
- Biggs, D.C.; Ressler, P.H. Distribution and Abundance of Phytoplankton, Zooplankton, Ichthyoplankton, and Micronekton in the Deepwater Gulf of Mexico. Gulf Mex. Sci. 2018, 19, 2. [Google Scholar] [CrossRef]
- Yang, Y.; Pan, H.; Zheng, D.; Zhao, H.; Zhou, Y.; Liu, D. Characteristics and Formation Conditions of Thin Phytoplankton Layers in the Northern Gulf of Mexico Revealed by Airborne Lidar. Remote Sens. 2022, 14, 4179. [Google Scholar] [CrossRef]
Disclaimer/Publisher’s Note: The statements, opinions and data contained in all publications are solely those of the individual author(s) and contributor(s) and not of MDPI and/or the editor(s). MDPI and/or the editor(s) disclaim responsibility for any injury to people or property resulting from any ideas, methods, instructions or products referred to in the content. |
© 2024 by the authors. Licensee MDPI, Basel, Switzerland. This article is an open access article distributed under the terms and conditions of the Creative Commons Attribution (CC BY) license (https://creativecommons.org/licenses/by/4.0/).