Article

Revealing the Hidden Consequences of Increased Soil Moisture Storage in Greening Drylands

1
State Key Laboratory of Urban and Regional Ecology, Research Center for Eco-Environmental Sciences, Chinese Academy of Sciences, Shuangqing Road 18, Beijing 100085, China
2
University of Chinese Academy of Sciences, Beijing 100049, China
3
College of Geoscience and Surveying Engineering, China University of Mining and Technology-Beijing, Beijing 100083, China
4
Institute of International Rivers and Eco-Security, Yunnan University, Kunming 650091, China
*
Author to whom correspondence should be addressed.
Remote Sens. 2024, 16(10), 1819; https://doi.org/10.3390/rs16101819
Submission received: 1 April 2024 / Revised: 11 May 2024 / Accepted: 16 May 2024 / Published: 20 May 2024
(This article belongs to the Section Ecological Remote Sensing)

Abstract

:
Vegetation primarily draws water from soil moisture (SM), with restoration in drylands often reducing SM storage (SMS). However, anomalies have been detected in the Beijing–Tianjin Sand Source Region (BTSSR) of China via the Global Land Data Assimilation System (GLDAS) and Gravity Recovery and Climate Experiment (GRACE). This study quantified the sources of increased SMS in drylands to elucidate the effects of vegetation restoration on SMS. The results indicated the following: (1) In vegetated drylands, 46.2% experienced a significant increase in SMS while 53.8% remained stable; both were positively correlated with the normalised difference vegetation index (NDVI). (2) The increase in SMS was accompanied by a decrease in groundwater storage (GWS), as indicated by the significant correlation coefficients of −0.710 and −0.569 for SMS and GWS, respectively. Furthermore, GWS served as the primary source of water for vegetation. (3) The results of the redundancy analysis (RDA) indicated that the initial vegetation, the driver of the observed trend of increased SMS and decreased GWS, accounted for 50.3% of the variability in water storage. Therefore, to sustain dryland ecosystems, we recommend that future vegetation restoration projects give due consideration to the water balance while concurrently strengthening the dynamic monitoring of SMS and GWS.

Graphical Abstract

1. Introduction

Changes in water availability have a substantial impact on vegetation growth. More than 60% of terrestrial vegetated areas are dominated by water conditions, whereas the remaining vegetation in other areas is, either directly or indirectly, influenced by the spatial and temporal heterogeneity in water availability [1]. Precipitation and shallow groundwater are the main water sources available for vegetation and usually converted into soil moisture (SM) prior to absorption and utilisation by vegetation [2]. Therefore, SM is the key hydroclimatic variable linking the biosphere, pedosphere, hydrosphere, and atmosphere [3]. SM storage (SMS) refers to the equivalent height of the water column that can be formed by the water contained in a soil layer at a specific depth, usually expressed in millimetres (mm) or centimetres (cm), which allows the water storage capacity of different soil layers to be quantified and compared. SM and SMS can influence not only the growth but also the structure and distribution of vegetation in regional ecosystems [4,5,6], the changes of which have been a source of great concern [7,8,9], especially in drylands [10]. Drylands, associated with an aridity index of <0.65, which represents the ratio of annual precipitation to potential evapotranspiration (ET), cover more than 40% of the global land area and are commonly characterised by water shortages [11]. In the context of global climate change, water security in drylands is increasingly vulnerable [12]. Consequently, it is important to clarify the relationship between vegetation and SMS so that researchers and policymakers can develop effective management strategies to enhance water security and ensure the sustainability of dryland ecosystems.
Drylands are typically ecologically vulnerable and accommodate more than 38% of the global population [11]. Moreover, they serve as crucial areas for the development of sand belts and ecological barriers in many regions [13,14]. Numerous studies have focused on the effects of dryland vegetation restoration on the spatial distribution and temporal variation of SMS. Vegetation restoration leads to an increase in water losses owing to the expansion of leaf area, which facilitates ET (encompassing transpiration and evaporation) [15,16]. More than 60% of the increase in global ET during the past two decades of this century (2001–2020) has been attributed to vegetation restoration [17]. Vegetation restoration alters the distribution of SMS by affecting ET [18]. At the local scale, ET from vegetation restoration contributes less to locally recycled precipitation but decreases SMS [19], thereby exacerbating ecological drought [20]. For example, an instance of a decreasing trend in SMS was detected subsequent to large-scale vegetation restoration in the Loess Plateau of China, where vegetation restoration is approaching the threshold of the local vegetation-carrying capacity of water resources [21]. Similarly, increased evapotranspiration from grassland restoration has become a key factor contributing to the reduction in water resources in China’s drylands [22]. At the regional or global scales, vegetation greening-induced ET increases the water vapour content of the atmosphere and promotes precipitation downwind, thereby preventing major changes in SMS on a large scale [23]. For example, the coexistence of grass greening and increased water production in the Northern China and the Tibetan Plateau is due to an increase in the effects of the evapotranspiration cycle [24].
However, not all local increases in SMS are attributable to this effect. In groundwater-dependent ecosystems, interactions between precipitation, groundwater table fluctuations, and vegetation are exerted through SM. The dynamics of SMS is closely linked to groundwater table fluctuations, and together, they control the dynamics of the entire ecosystem [25]. Previous studies have exclusively examined the impact of vegetation restoration on SMS; however, the relationships between SMS, vegetation, and groundwater storage (GWS) at large spatiotemporal scales in greening drylands have not yet been adequately identified and demonstrated. This lack of knowledge could have a detrimental impact for the overall management and formulation of policies pertaining to vegetation restoration in drylands. The spatiotemporal continuity of data over a long time series is a key constraint in the comprehensive assessment of regional SMS and GWS. At present, water storage monitoring relies heavily on the data obtained from the Global Land Data Assimilation System (GLDAS) and Gravity Recovery and Climate Experiment (GRACE) satellite mission [26,27]. Changes in GWS can be isolated from GRACE-observed terrestrial water storage using data provided by the GLDAS for the components of SMS, ice, and canopy water storage [28,29]. The accessibility of these data offers substantial support for investigating the relationship between vegetation restoration and water storage and facilitates further comprehensive analyses that may yield novel insights regarding future vegetation restoration efforts.
Thus, the main objectives of this study are (1) to explore the causes of increased SMS in greening drylands and (2) to probe the hidden consequences of increased SMS in greening drylands. By revealing previously neglected vegetation–SM–groundwater interactions, this study would contribute to a more comprehensive understanding of the effects of long-term vegetation restoration efforts.

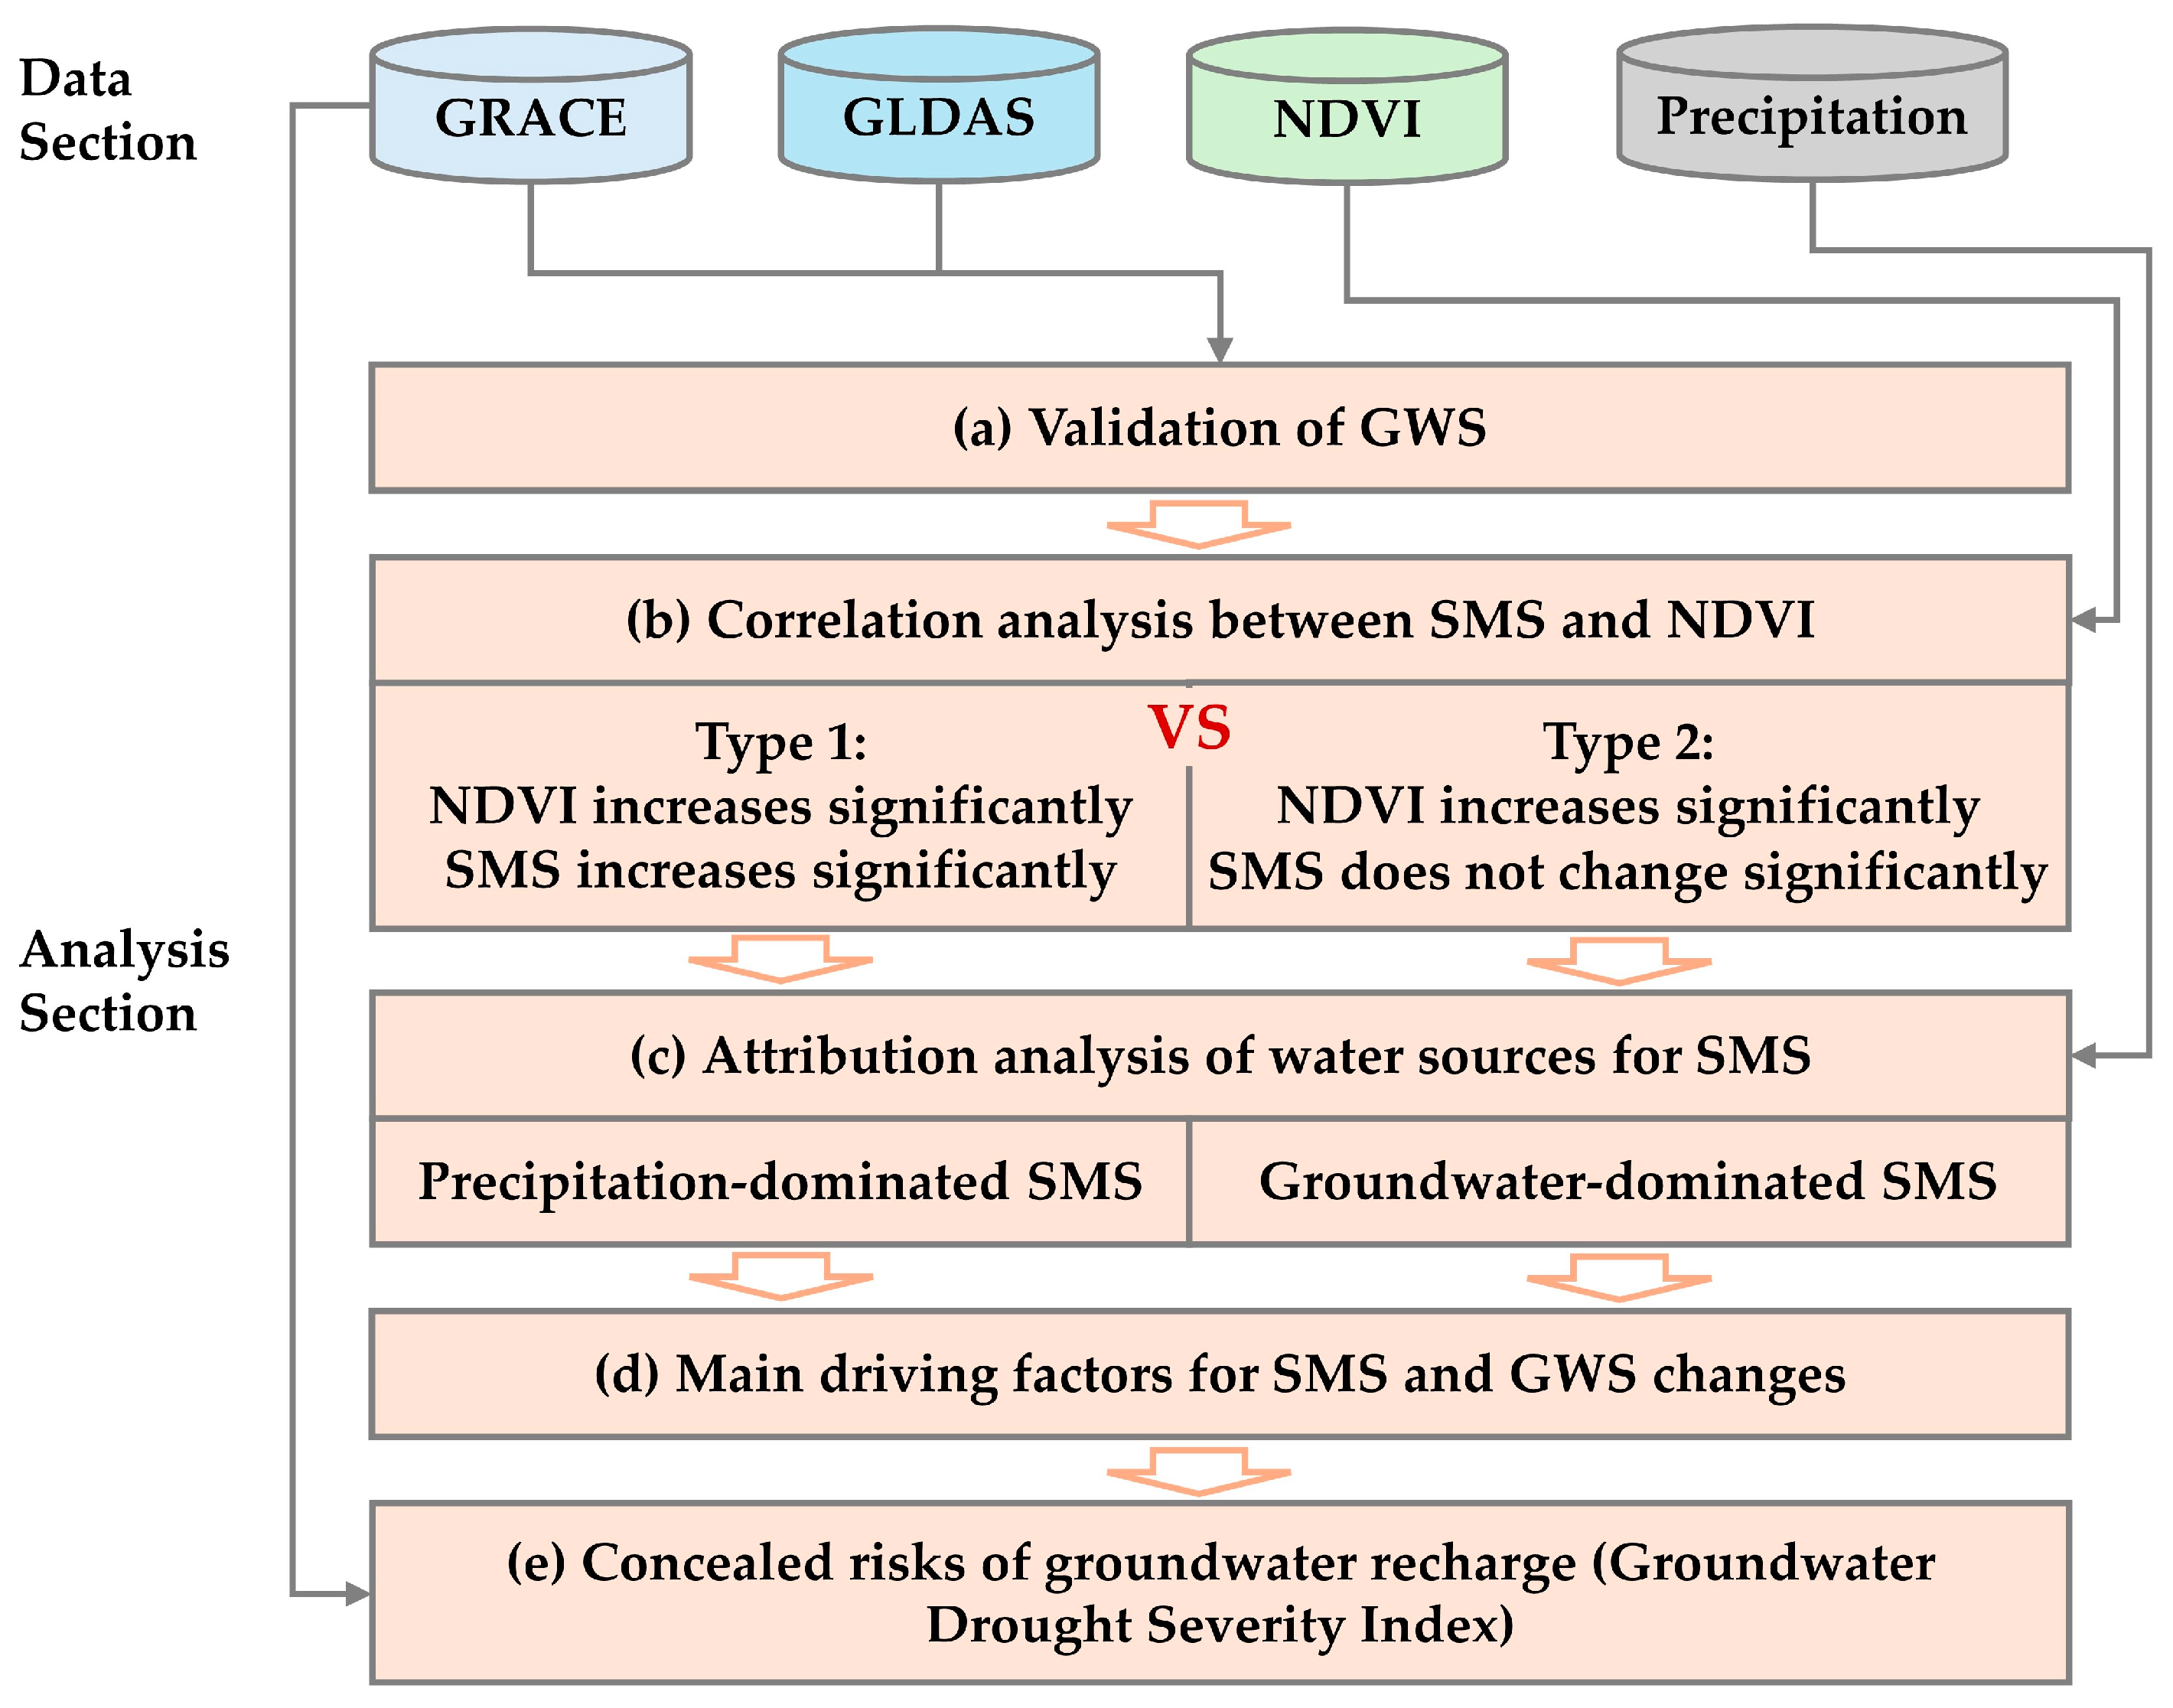
2. Materials and Methods

2.1. Study Area

The Beijing–Tianjin Sand Source Region (BTSSR) was chosen as it is located in a typical arid to semi-arid area in China (Figure 1) and spans 138 counties in six provinces (autonomous regions and municipalities directly under the central government): Beijing, Tianjin, Hebei, Shanxi, Shaanxi, and Inner Mongolia. The average annual temperature and total annual precipitation show decreasing trends from east to west, ranging from −2 to 13 °C and 250 to 470 mm, respectively [30]. Forests and grasslands account for more than 70% of the total area. The Beijing–Tianjin Sand Source Control Project, which is the most prominent human activity in the area, was initiated in 2001 to reduce soil erosion and sandstorms caused by the destruction of vegetation and the degradation of ecosystems. The project implements comprehensive management strategies based on the establishment of forest and grass vegetation (e.g., Robinia pseudoacacia, Populus tomentosa, Eucalyptus robusta Smith, Salix cheilophila, and Caragana Korshinskii). According to the data released by China’s State Forestry and Grassland Administration, from 2001 to 2014, the annual investment in the project exceeded CNY 1 billion, with a cumulative investment of more than CNY 31.6 billion, and more than 5.11 million acres have cumulatively been afforested and 2.06 million acres of grassland areas have been protected; the afforestation project is still in progress, and the improved area of grassland have been declining year by year. Vegetation restoration affects water resources through ET. Apart from vegetation restoration, other human impacts on water resources are negligible in this region, making the BTSSR an ideal area for studying the impacts of vegetation restoration on water storage in dryland ecosystems.

2.2. Data Sources and Processing

Multiple datasets were used to analyse the changes in vegetation, climate, and hydrological variables from 2001 to 2019. All the datasets are listed in Table 1. The spatial resolution of all the data was standardised to 0.25°, and the temporal resolution was annual.
The boundary extent of the Beijing–Tianjin Sand Source Region was obtained from the dataset of the scope of implementation of major ecological projects in China published by [31]. Land use and land cover change (LUCC) data with a spatial resolution of 1 km in 2020 were downloaded from the Resource and Environment Science and Data Center of the Chinese Academy of Sciences (derived from https://www.resdc.cn/, accessed on 23 March 2023), and the first level was divided into six categories: cropland, forest, grassland, water body, artificial land, and bare land. NDVI can accurately reflect the surface vegetation cover status from −1 to 1. The annual NDVI dataset with a spatial resolution of 1 km from 2001 to 2019 was downloaded from the Resource and Environmental Science and Data Center of the Chinese Academy of Sciences (derived from https://www.resdc.cn/, accessed on 9 November 2022), which was based on the continuous time series of SPOT/VEGETATION NDVI satellite remote sensing data generated by the maximum value synthesis method. Raster points greater than 0.2 in the maximum NDVI images from 2001 to 2019 were selected as vegetation growth points and combined with the 2020 LUCC for the forest and grassland raster to jointly delineate natural vegetation areas. A total of 858 vegetation rasters were finally selected in the BTSSR.
The growth of dryland vegetation depends on the availability of water in the 0 to 200 cm soil layer and the availability of groundwater stored below 200 cm in the case of insufficient precipitation. The Global Land Data Assimilation System (GLDAS) uses advanced land surface modelling and data assimilation techniques to generate optimal fields of surface states and fluxes by combining satellite and ground-based observational data products (derived from https://ldas.gsfc.nasa.gov/gldas/, accessed on 6 April 2022). The Noah model in GLDAS provided the monthly shallow surface water storage data (SMS, snow water equivalent, and canopy water storage at 0–10 cm, 10–40 cm, 40–100 cm, and 100–200 cm) at a spatial resolution of 0.25° from 2001 to 2019. Many studies using satellite-based hydrological flux data, station observations, and other hydrological modelling methods have demonstrated the applicability of GLDAS for large-scale water balance analysis in China. For consistency with the GRACE data below, the conversion to equivalent water column height (cm) was based on the average shallow surface water storage from 2004 to 2009, and the monthly shallow surface water storage was subtracted from the baseline to obtain the month-by-month shallow surface water storage change. In addition, storm surface runoff data were also obtained from the GLDAS dataset and converted to mm.
The Gravity Recovery and Climate Experiment (GRACE) satellite provides the capability to remotely analyse regional water storage by detecting the Earth’s gravitational field over time and translating it into changes in the Earth’s surface mass, thereby measuring changes in total terrestrial water storage (TWS). CSR RL06 mascons products from 2003 to 2019, provided by the Centre for Space Research (CSR) at the University of Texas, USA (derived from https://www.csr.utexas.edu/grace/, accessed on 28 April 2022), were used with a spatial resolution of 0.25°, expressed as the equivalent water column height (cm). The data were distance-averaged from 2004 to 2009 (named TWS anomaly, TWSA) and have been widely used in water storage studies, usually in conjunction with GLDAS data to obtain GWS. The missing months (July 2017 to May 2018) between the GRACE satellite and its successor GRACE-Follow On were obtained from the published literature [32], and the remaining missing data due to technical reasons were supplemented by linear interpolation (fitting a linear trend based on the nearest available months before and after the gaps to estimate the missing values).
The Global Precipitation Climate Center (GPCC) provides a monthly gridded land surface precipitation dataset for monitoring the Earth’s climate, constructed on the basis of a large number of station observations around the globe (derived from https://opendata.dwd.de/climate_environment/GPCC, accessed on 6 July 2022), for the years 2001 to 2019, with a spatial resolution of 0.25° in mm. The annual mean AET data from 2001 to 2019 were derived from the Amsterdam Global Land Evaporation Model (GLEAM) (derived from http://www.gleam.eu, accessed on 7 November 2022) v3.6a dataset, which is based on satellite and reanalysed data (MSWX net radiation and air temperatures) with a spatial resolution of 0.25° in mm. The temperature data were derived from air temperature data at 2 m over land provided by ERA5 (derived from https://cds.climate.copernicus.eu, accessed on 16 April 2023), with a spatial resolution of 0.25° in K, converted to degrees Celsius.
The depth of groundwater table data from typical observation stations of the National Ecosystem Research Network of China (derived from http://www.cnern.ac.cn/index.action, accessed on 12 October 2022) (Table 2) were used for validation on a time series. The dates and time intervals of the groundwater observed by the stations were not fixed, the continuity of the data was not very good, and its long-term change trend was obvious.

2.3. Methods

In this study, we analysed the effects of vegetation restoration on SMS in drylands within the BTSSR of China. The flowchart is presented in Figure 2. In the first step, data were collected, and GRACE-derived groundwater data were validated. In the second step, the trend spatial coupling between NDVI and SMS was analysed. Then, the sources of SMS in greening areas were quantified by Multivariate Linear Regression (MLR). Next, the main factors affecting water storage were identified using a redundancy analysis (RDA). In the final step, the groundwater drought severity index was calculated to reveal concealed risks.

2.3.1. Validation of Groundwater Storage (GWS)

The depth to the groundwater table is the depth of the water table from the ground surface, and the deeper the depth to groundwater, the deeper the GWS, which needs to be converted in order to calculate the equivalent water height, so only the correlation between the two is analysed in the correlation analysis.

2.3.2. Calculation of Soil Moisture Storage (SMS) and GWS Anomaly (GWSA)

Throughout this study, SM and groundwater refer to the hydrological variable, and SMS and GWS stand for its storage. An SMS from 0 to 200 cm was obtained by summing the four layers of soil moisture data from the GLDAS data.
SMS = SM 0 10 cm + SM 10 40 cm + SM 40 100 cm + SM 100 200 cm / 10
where  SMS  is the total SMS for the 0–200 cm soil depth layer and  SM 0 10 cm SM 10 40 cm SM 40 100 cm , and  SM 100 200 cm  are the SM at the depths corresponding to the GLDAS data, initially expressed in kg/m2, equivalent to mm, and finally converted to cm.
SMS anomalies were calculated for consistency with the GRACE data.
SMSA = SMS i SMS mean
where  SMSA  is the SMS anomaly,  SMS i  is the SMS of the year, and  SMS mean  is the average value from January 2004 to December 2009.
TWS is the result of hydrologic processes such as precipitation, evaporation, and runoff, including surface water, groundwater, SM, ice, and canopy water. Therefore, the trend in GWSA can be considered as the trend in GWS, calculated as follows:
GWSA = TWSA SMSA SWESA CWSA
where  GWSA  is the GWS anomaly,  SWESA  is SWES anomaly, and  CWSA  is the CWS anomaly, all expressed in cm. The formulas for  SWESA  and  CWSA  are the same as those for  SMSA .

2.3.3. Trends and Correlation Analysis of Vegetation and Hydrological Factors

This study utilised the Theil–Sen (TS) median trend analysis method in conjunction with the Mann–Kendall (MK) test to detect trends in vegetation and hydrological data from 2001 to 2019. TS is a nonparametric test for robust linear regression that does not necessitate a normal distribution of data and can be resistant to outliers when evaluating the rate of change in data over a short time series [36]. The MK test is frequently applied to assess trends in TS [37]. Its purpose is to determine the significance of the trend and the z-value of the direction. A positive slope (z ≥ 1.96) indicates a statistically significant increase in the variable at the 95% confidence level, whereas a negative slope (z ≤ −1.96) indicates a statistically significant decrease in the variable at the 95% confidence level. Pearson’s method was employed to determine the relationships between factors, and the correlation significance was calculated at the 95% confidence level.

2.3.4. Soil Moisture Storage (SMS) Source Attribution Analysis

MLR was developed to illustrate the contribution of precipitation and GWS to SMS in areas with restored vegetation within the BTSSR [38]. The model utilised normalised SMS (NSMS) as the dependent variable and normalised precipitation (NPRE) and normalised GWSA (NGWSA) as the independent variables.
NSMS = SMS SMS mean /   SMS max SMS min
NGWSA = GWSA GWSA mean / GWSA max GWSA min
N PRE   = PRE PRE mean / PRE max PRE min
NSMS = a × NGWSA + b × NPRE + ε
where a and b refer to the coefficients of  NGWSA  and  NPRE , respectively, and  ε  refers to the residuals of the linear regression model. The larger the coefficient, the greater the significance of the variable (GWS or precipitation) to SMS. We defined the SMS sources in the drylands as groundwater-dominated  abs a > abs b  or precipitation-dominated  abs a < abs b .

2.3.5. Driver Analysis of SMS and GWSA by Vegetation Restoration

RDA was used to determine the interactions between environmental trends and water storage [39]. RDA, a constrained ranking methodology designed to identify key drivers and determine their relative contributions to water storage trends, was performed using Canoco software (version 5.0). The initial NDVI (NDVI initial), NDVI trend, precipitation trend (PRE trend), and temperature trend (TEM trend) have been consistently identified in previous research as significant indicators influencing water storage (both SMS and GWS). The initial NDVI indicates the baseline vegetation coverage and its health and serves as a primary factor affecting water uptake by roots and surface water retention through evapotranspiration [40]. The NDVI trend captures the long-term changes in vegetation cover, reflecting the resilience of vegetation to climatic variations and its cumulative effect on water storage [41,42]. The precipitation trend significantly influences the storage and recharge rates of soil moisture and groundwater [43]. The temperature trend affects the evapotranspiration rates and soil moisture retention [44,45,46].

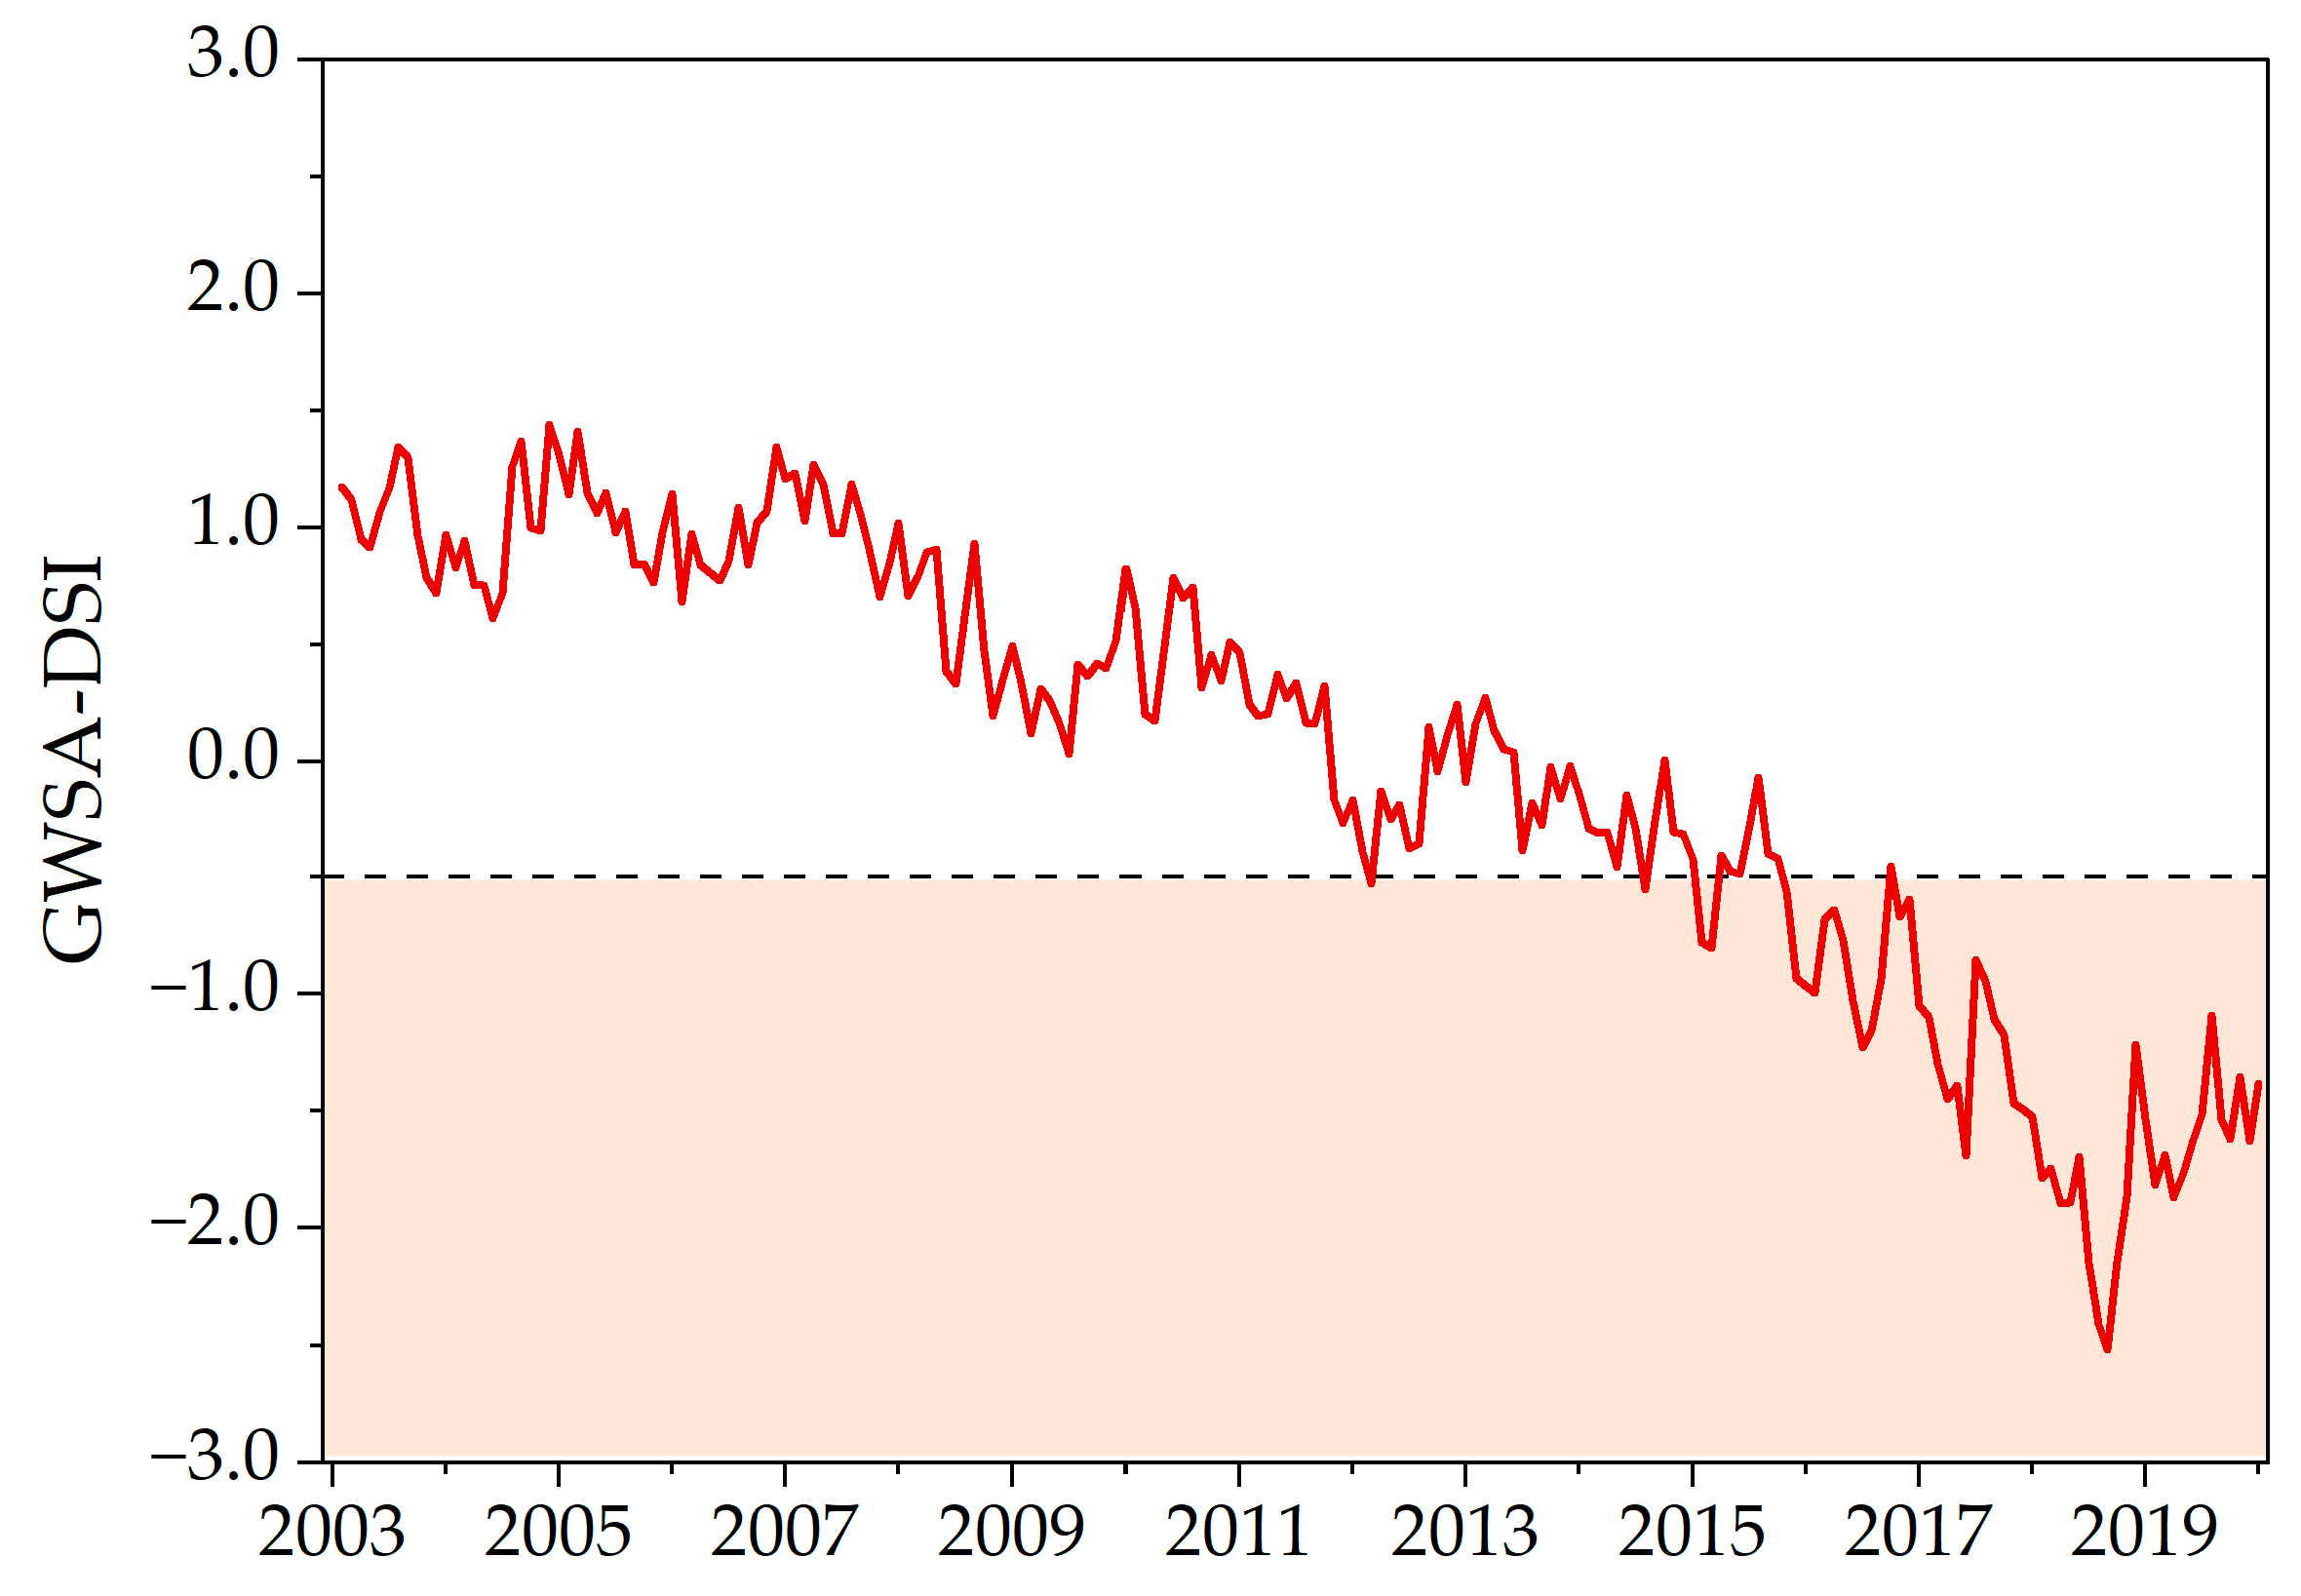
2.3.6. Calculation of the Groundwater Drought Severity Index (GWSA-DSI)

For each grid, the GWSA-DSI is defined as the standardised anomaly of the GWSA [47]. It is a dimensionless quantity that detects drought events.
GWSA - DSI i , j = GWSA i , j   - GWSA j , mean σ j
where  i  represents the year, from 2003 to 2019;  j  is the month, from January to December; and  GWSA j , mean  and  σ j  are the mean and standard deviation of the GWSA in month  j , respectively. GWSA-DSI is a dimensionless quantity that detects drought events: less than −0.5 is drought, where less than −2.0 is exceptional drought.

3. Results

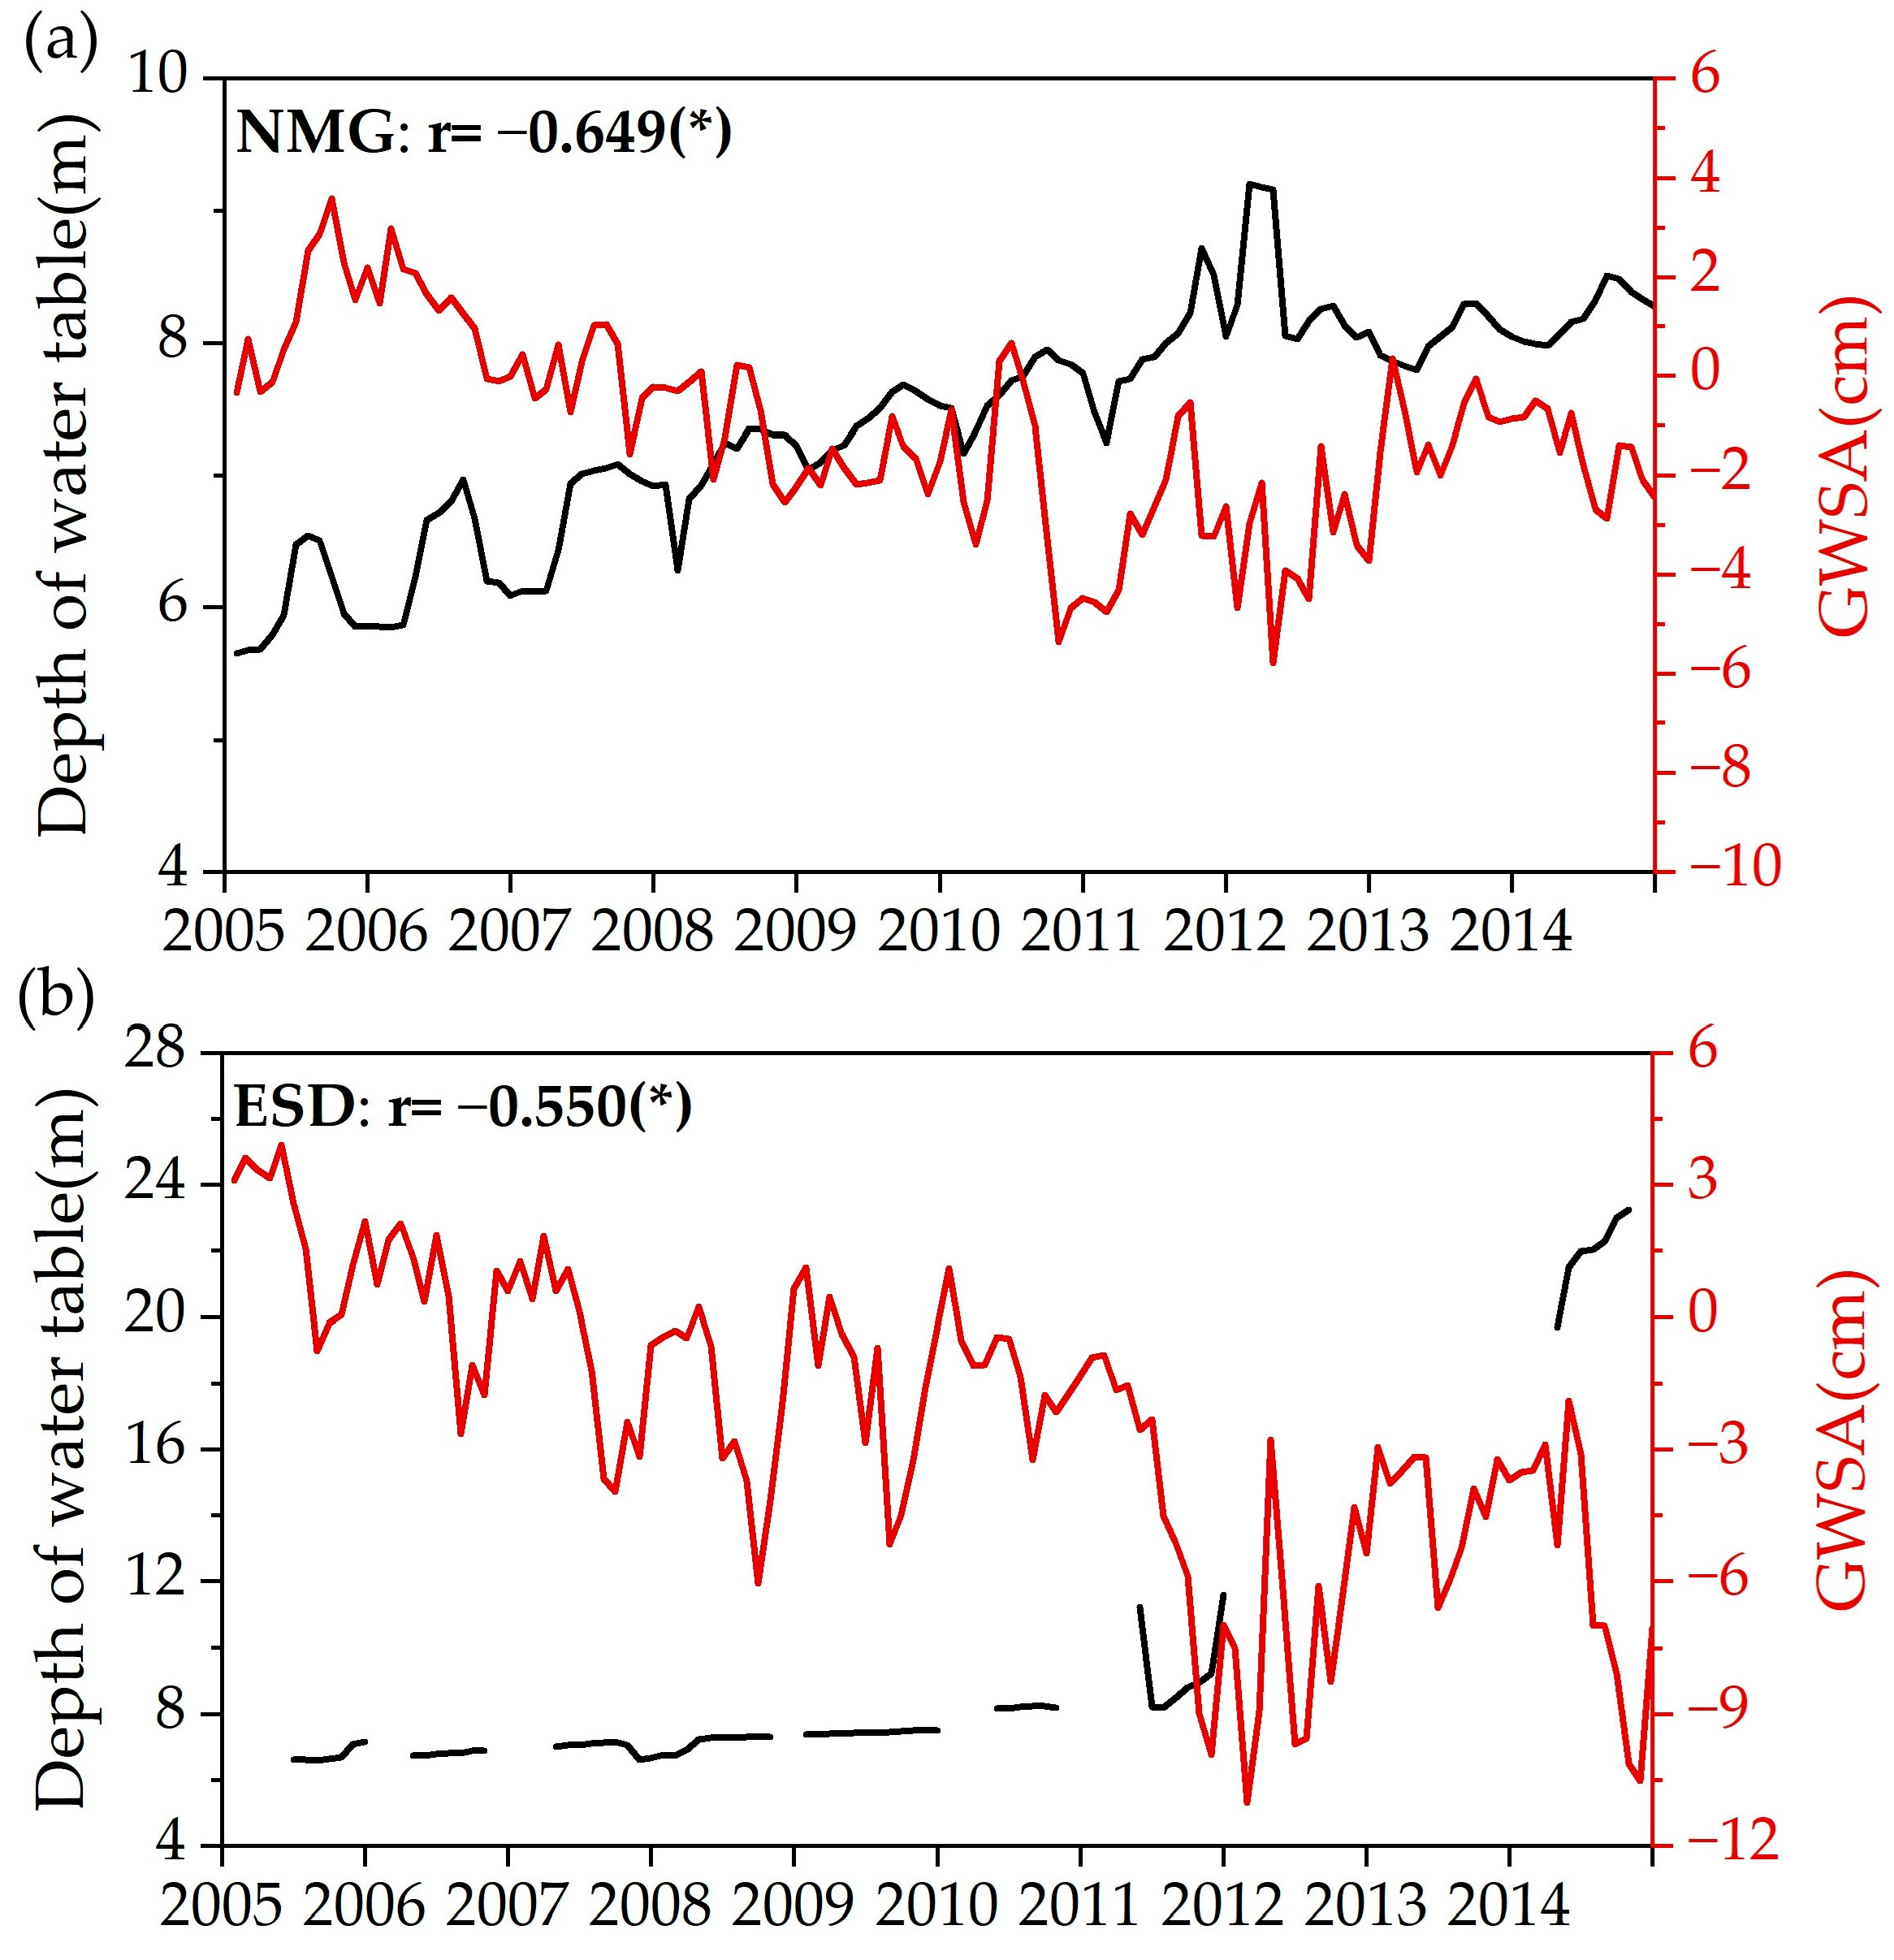
3.1. High Correlation between GRACE Data and Ground-Measured Data

As shown in Figure 3, from 2005 to 2014, the depth of the groundwater table at the stations showed an opposite trend to the GWSA, with negative correlations of 0.649 and 0.550 (p-value < 0.05) at the NMG and ESD stations, respectively. This indicates that GRACE data can detect GWS changes.

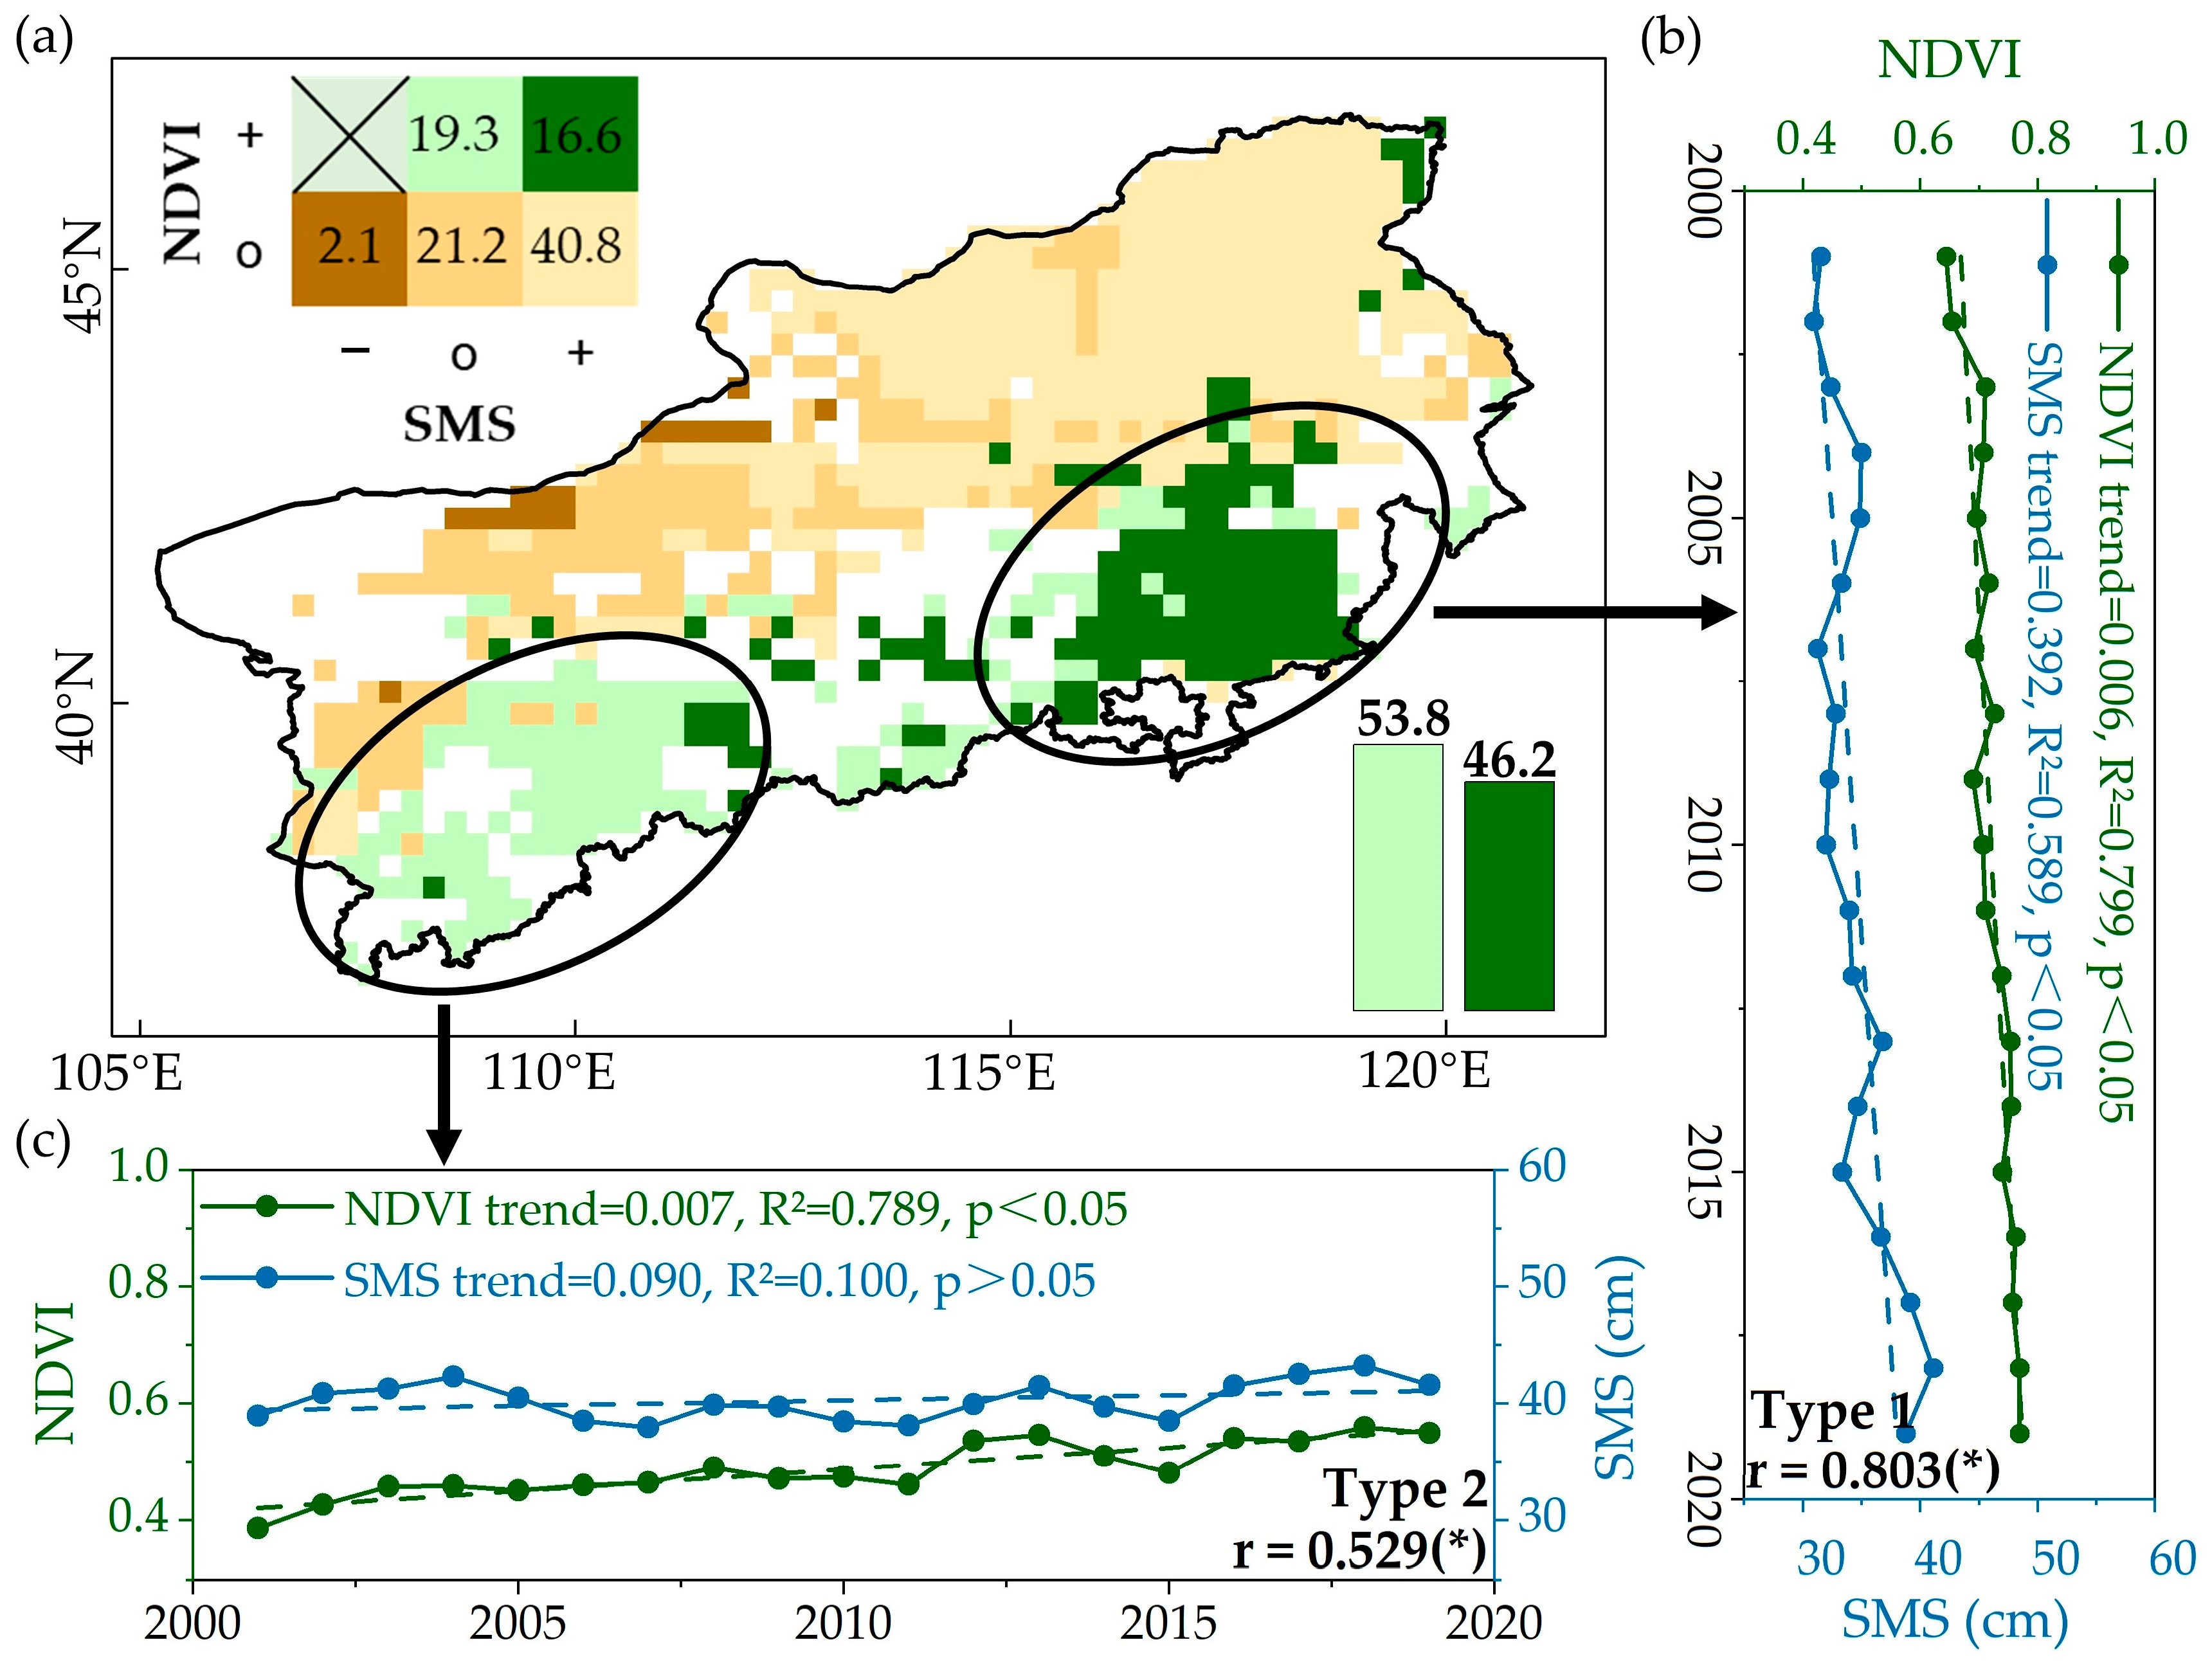
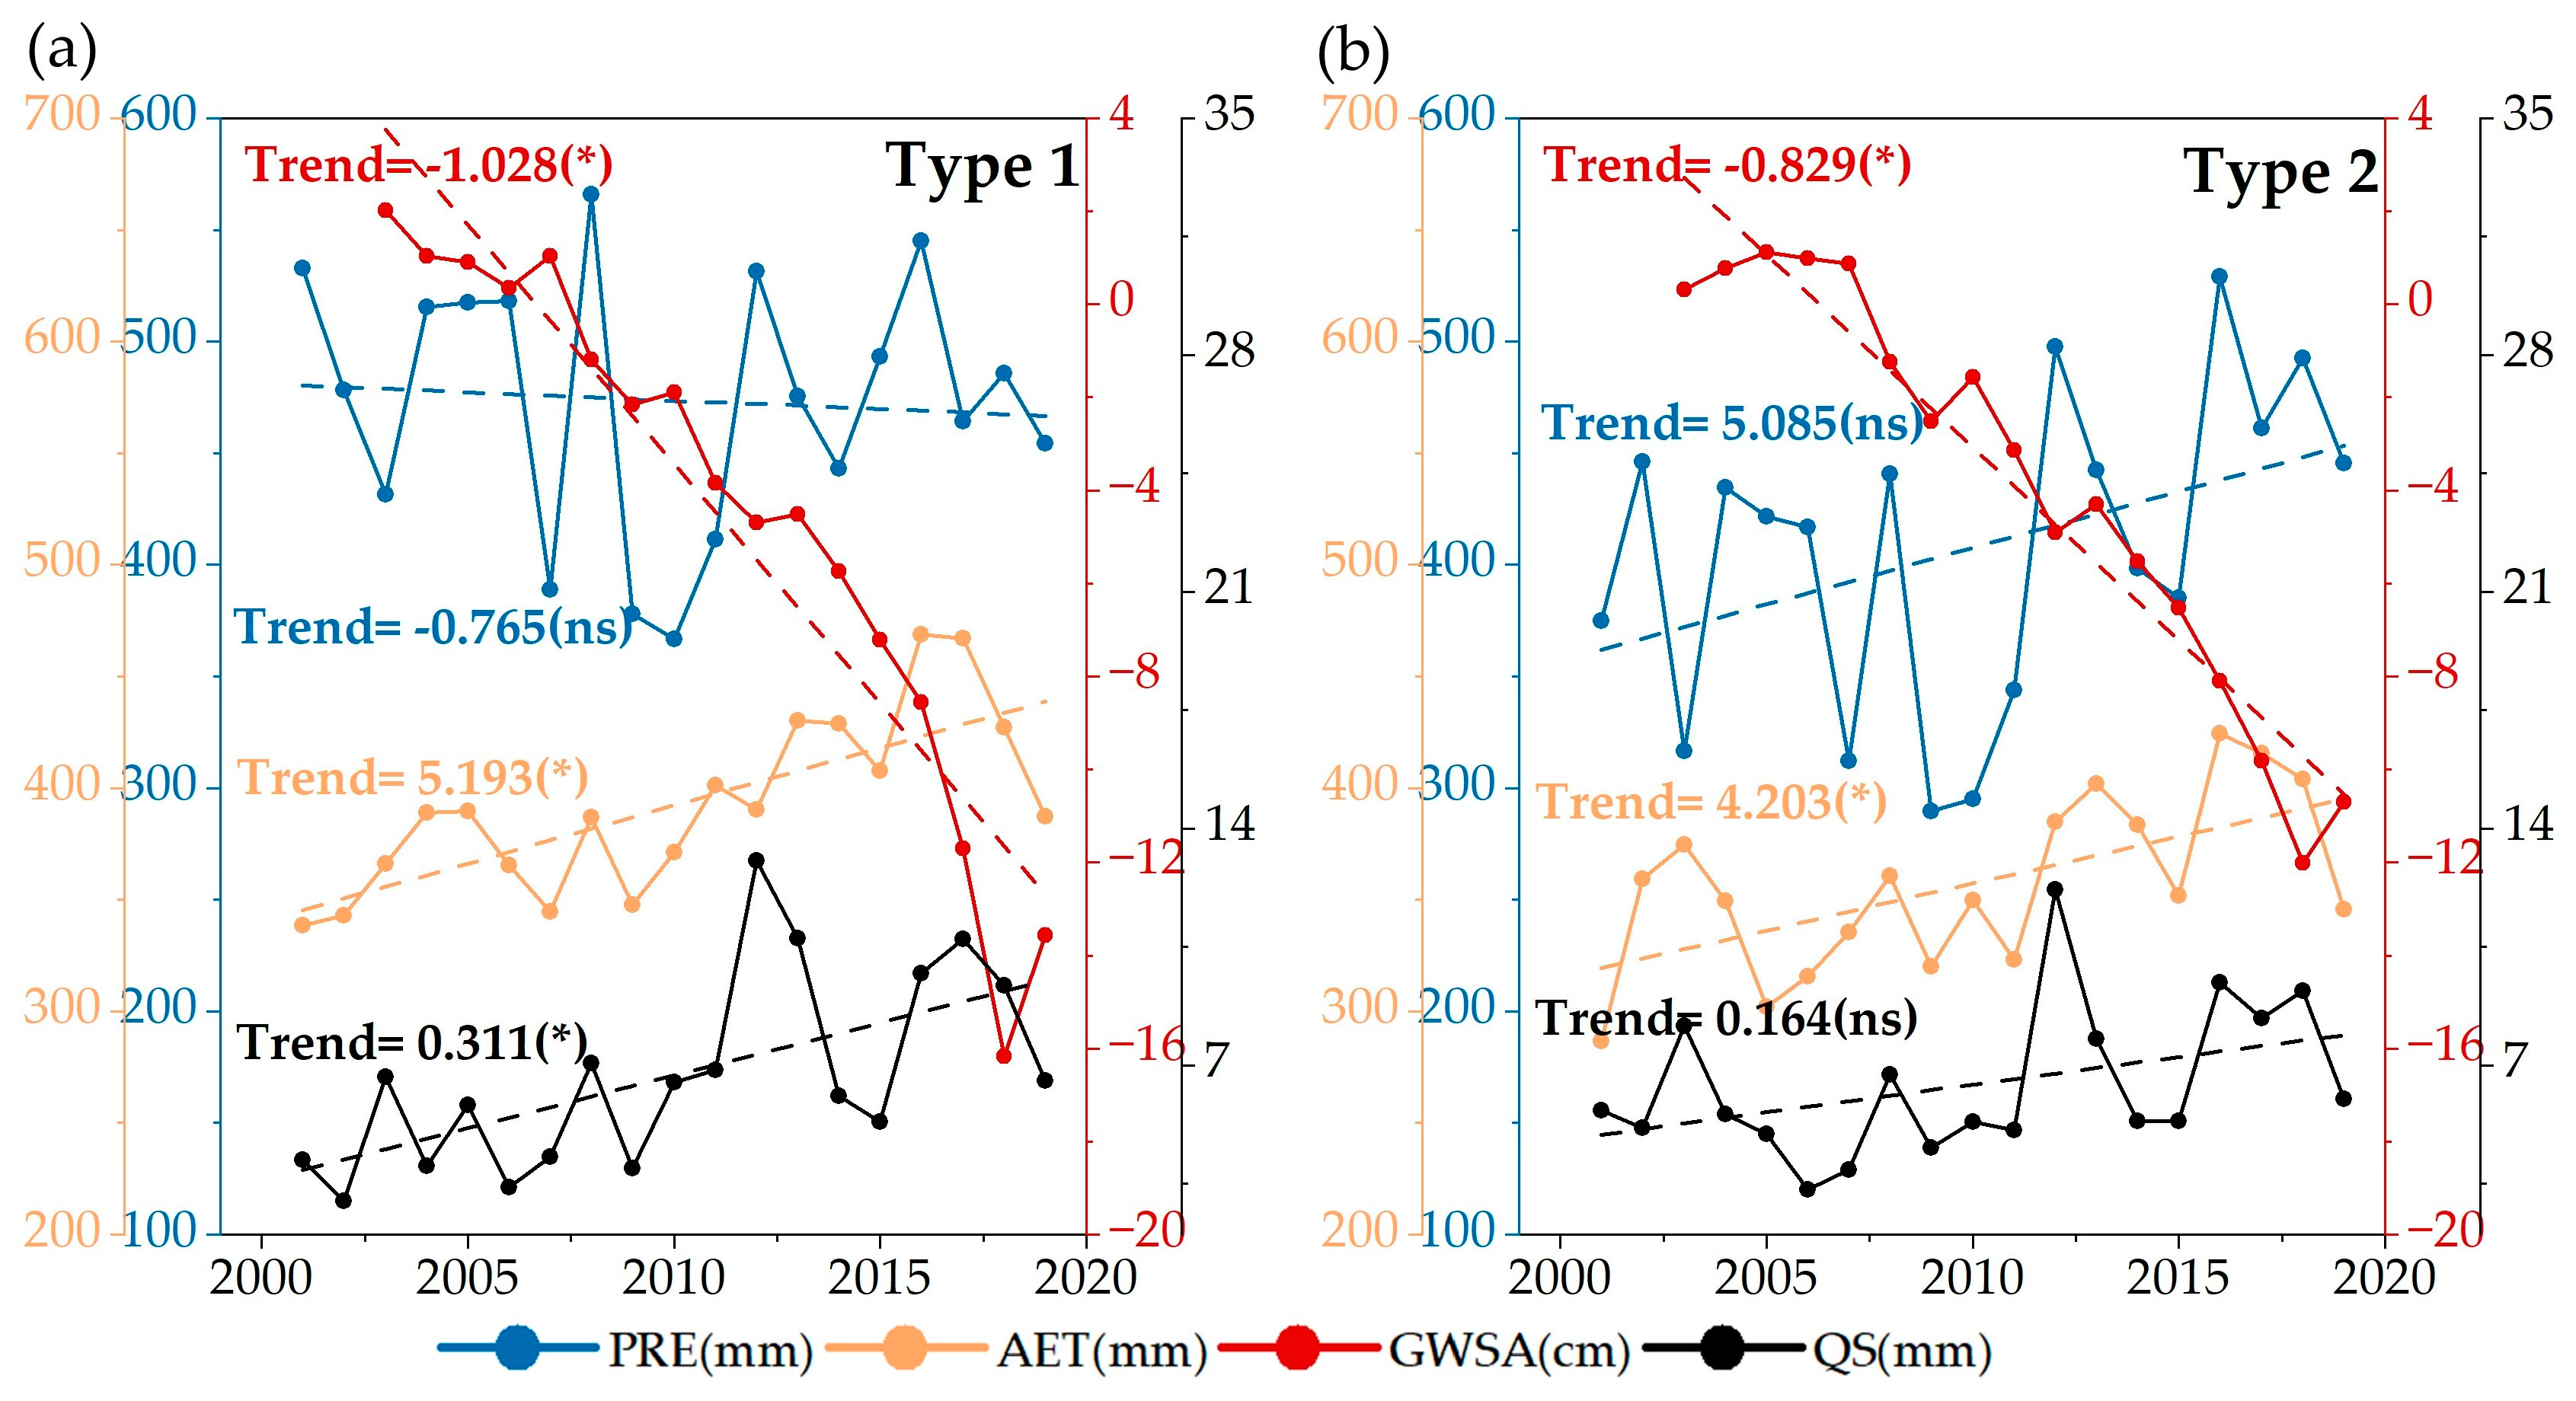
3.2. Dryland Greening Does Not Trigger a Significant Decrease in SMS

Based on a combination of the NDVI and SMS trends (significant increase ‘+’, significant decrease ‘−’, and no significant change ‘o’), five types were observed in the study area (Figure 4). Overall, the vegetation became greener, with a significant increase of 35.9% (++ and +o) in the area. SMS increased overall, with a significant increase of 57.4% (++ and o+). We focused on areas with significant increases in the NDVI, where the SMS showed two types: 46.2% with significant increases (++, Type 1) and 53.8% with no significant change (+o, Type 2). The increasing trends of NDVI were similar between Types 1 and 2 at 0.006/yr and 0.007/yr, respectively. In addition, a significant positive correlation was found between the NDVI and SMS in both Types 1 and 2, with correlation coefficients of 0.803 and 0.529, respectively.

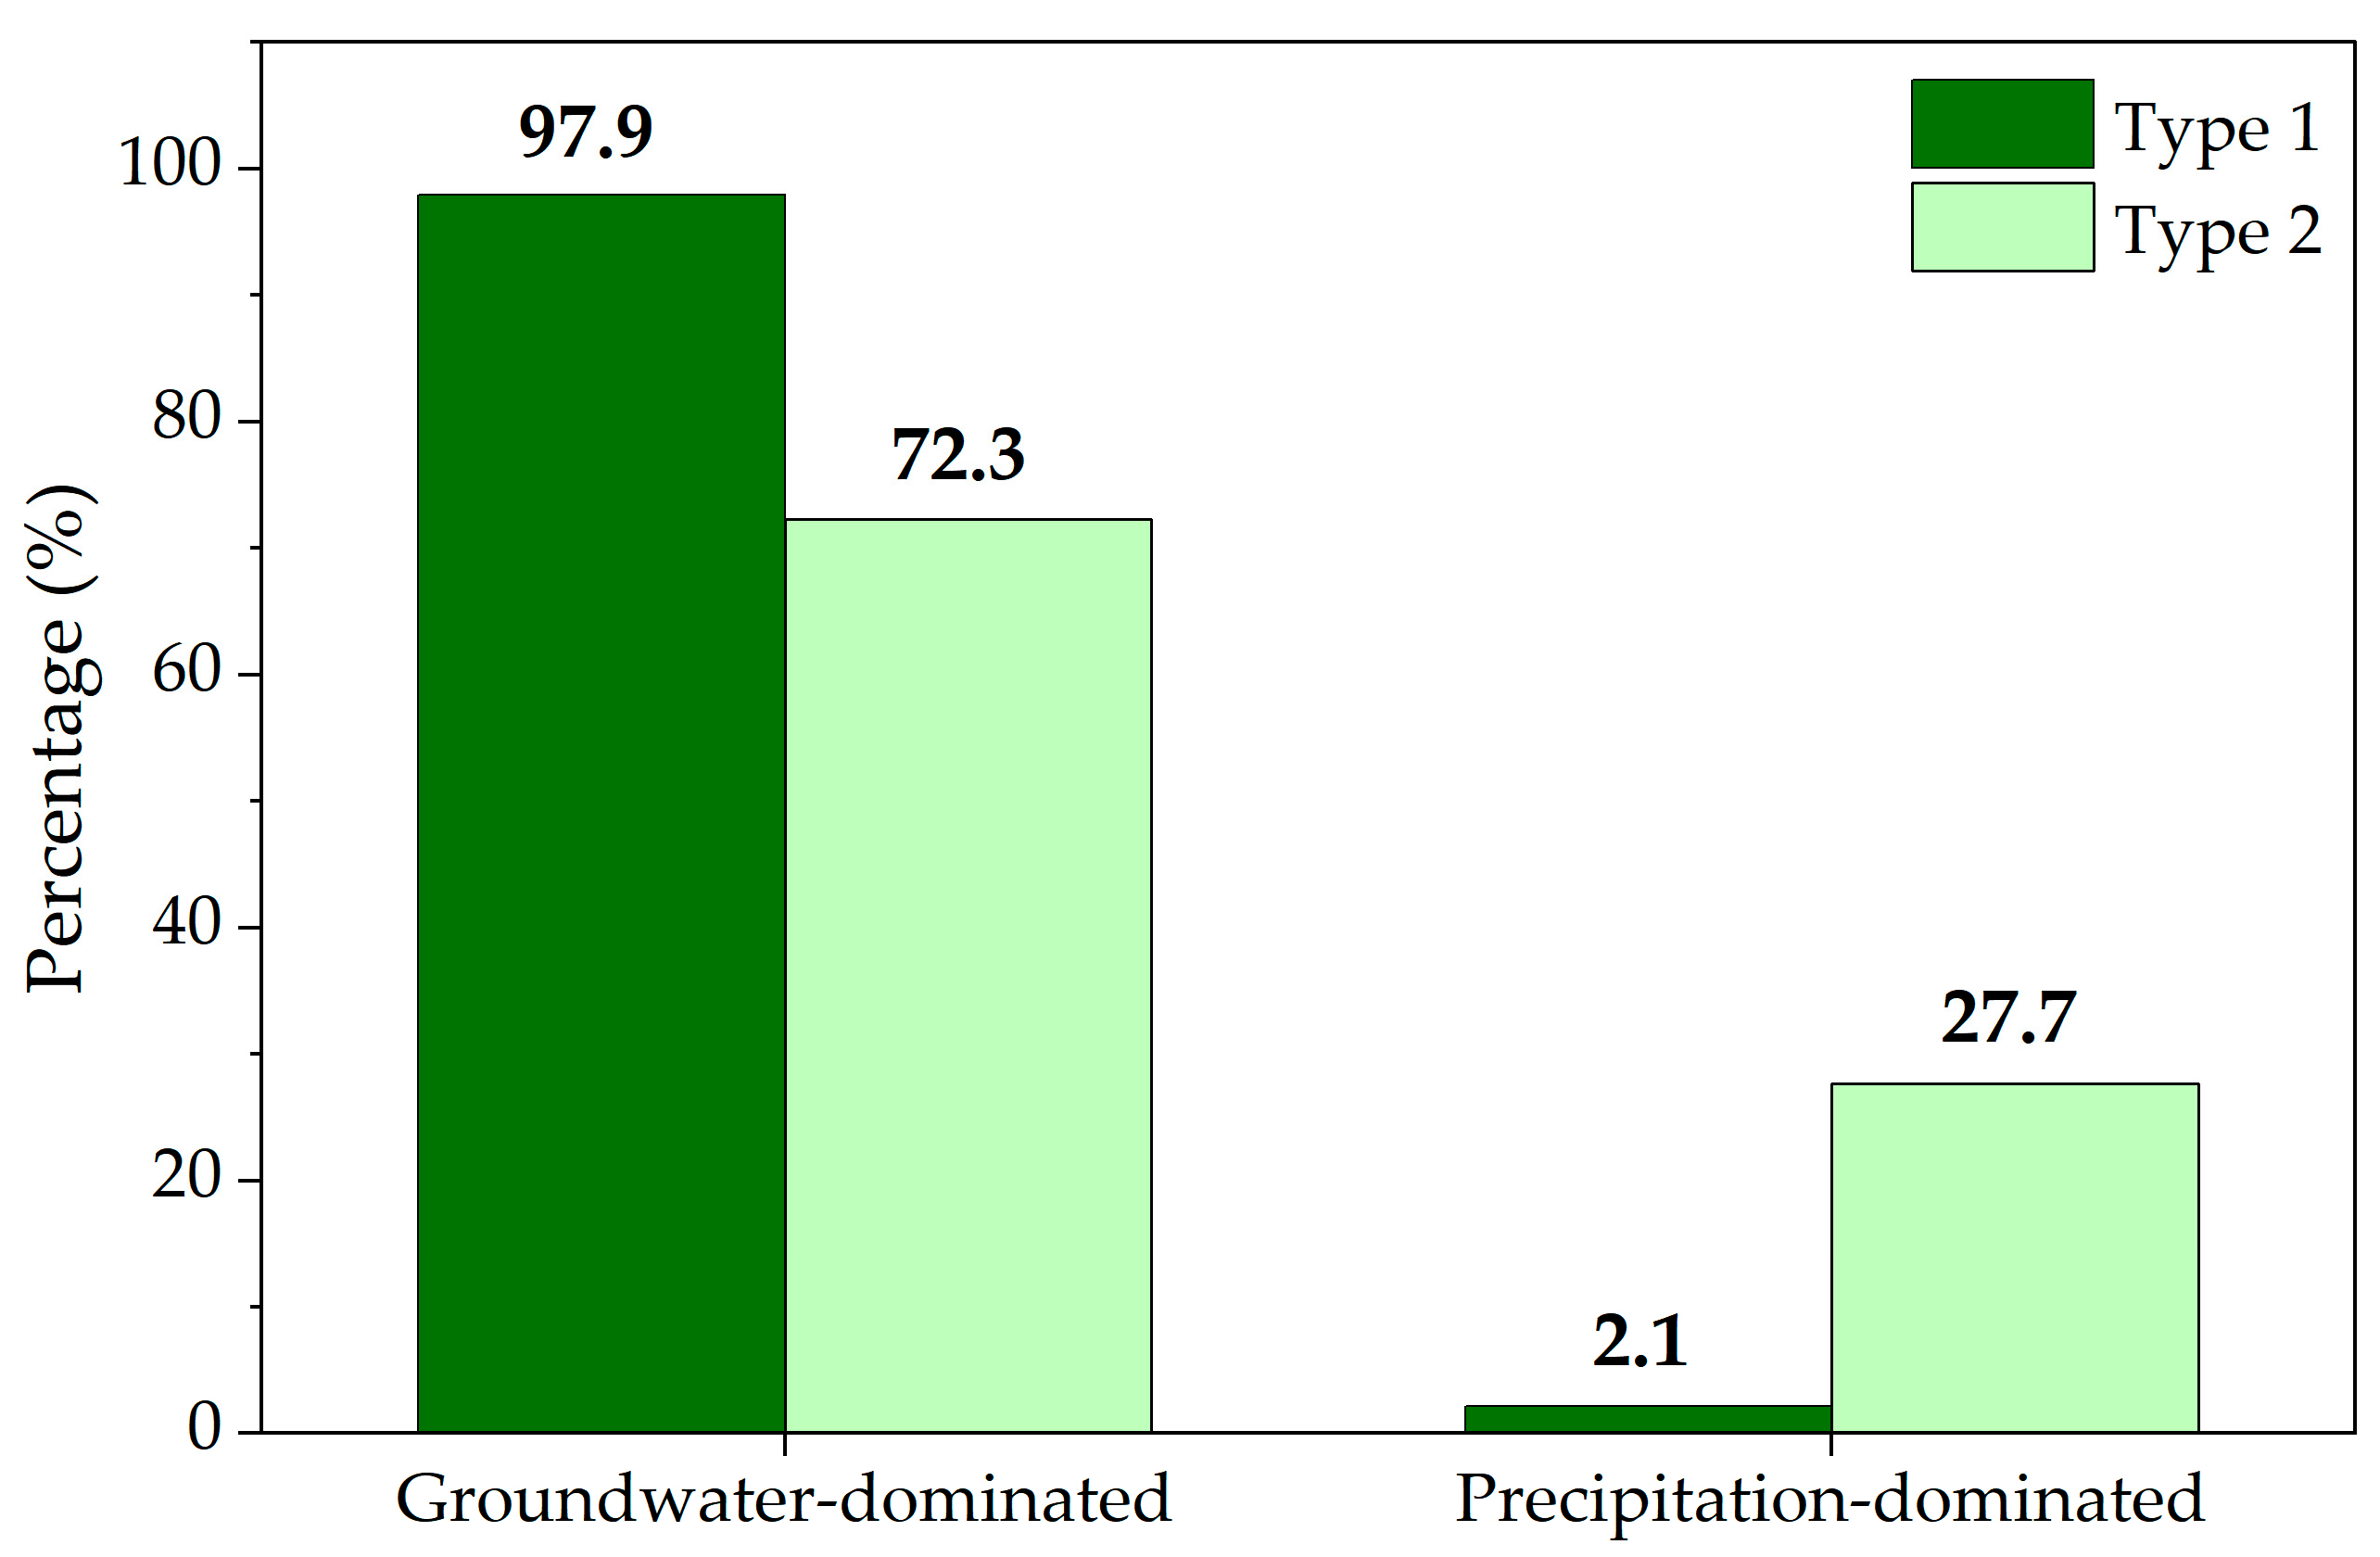
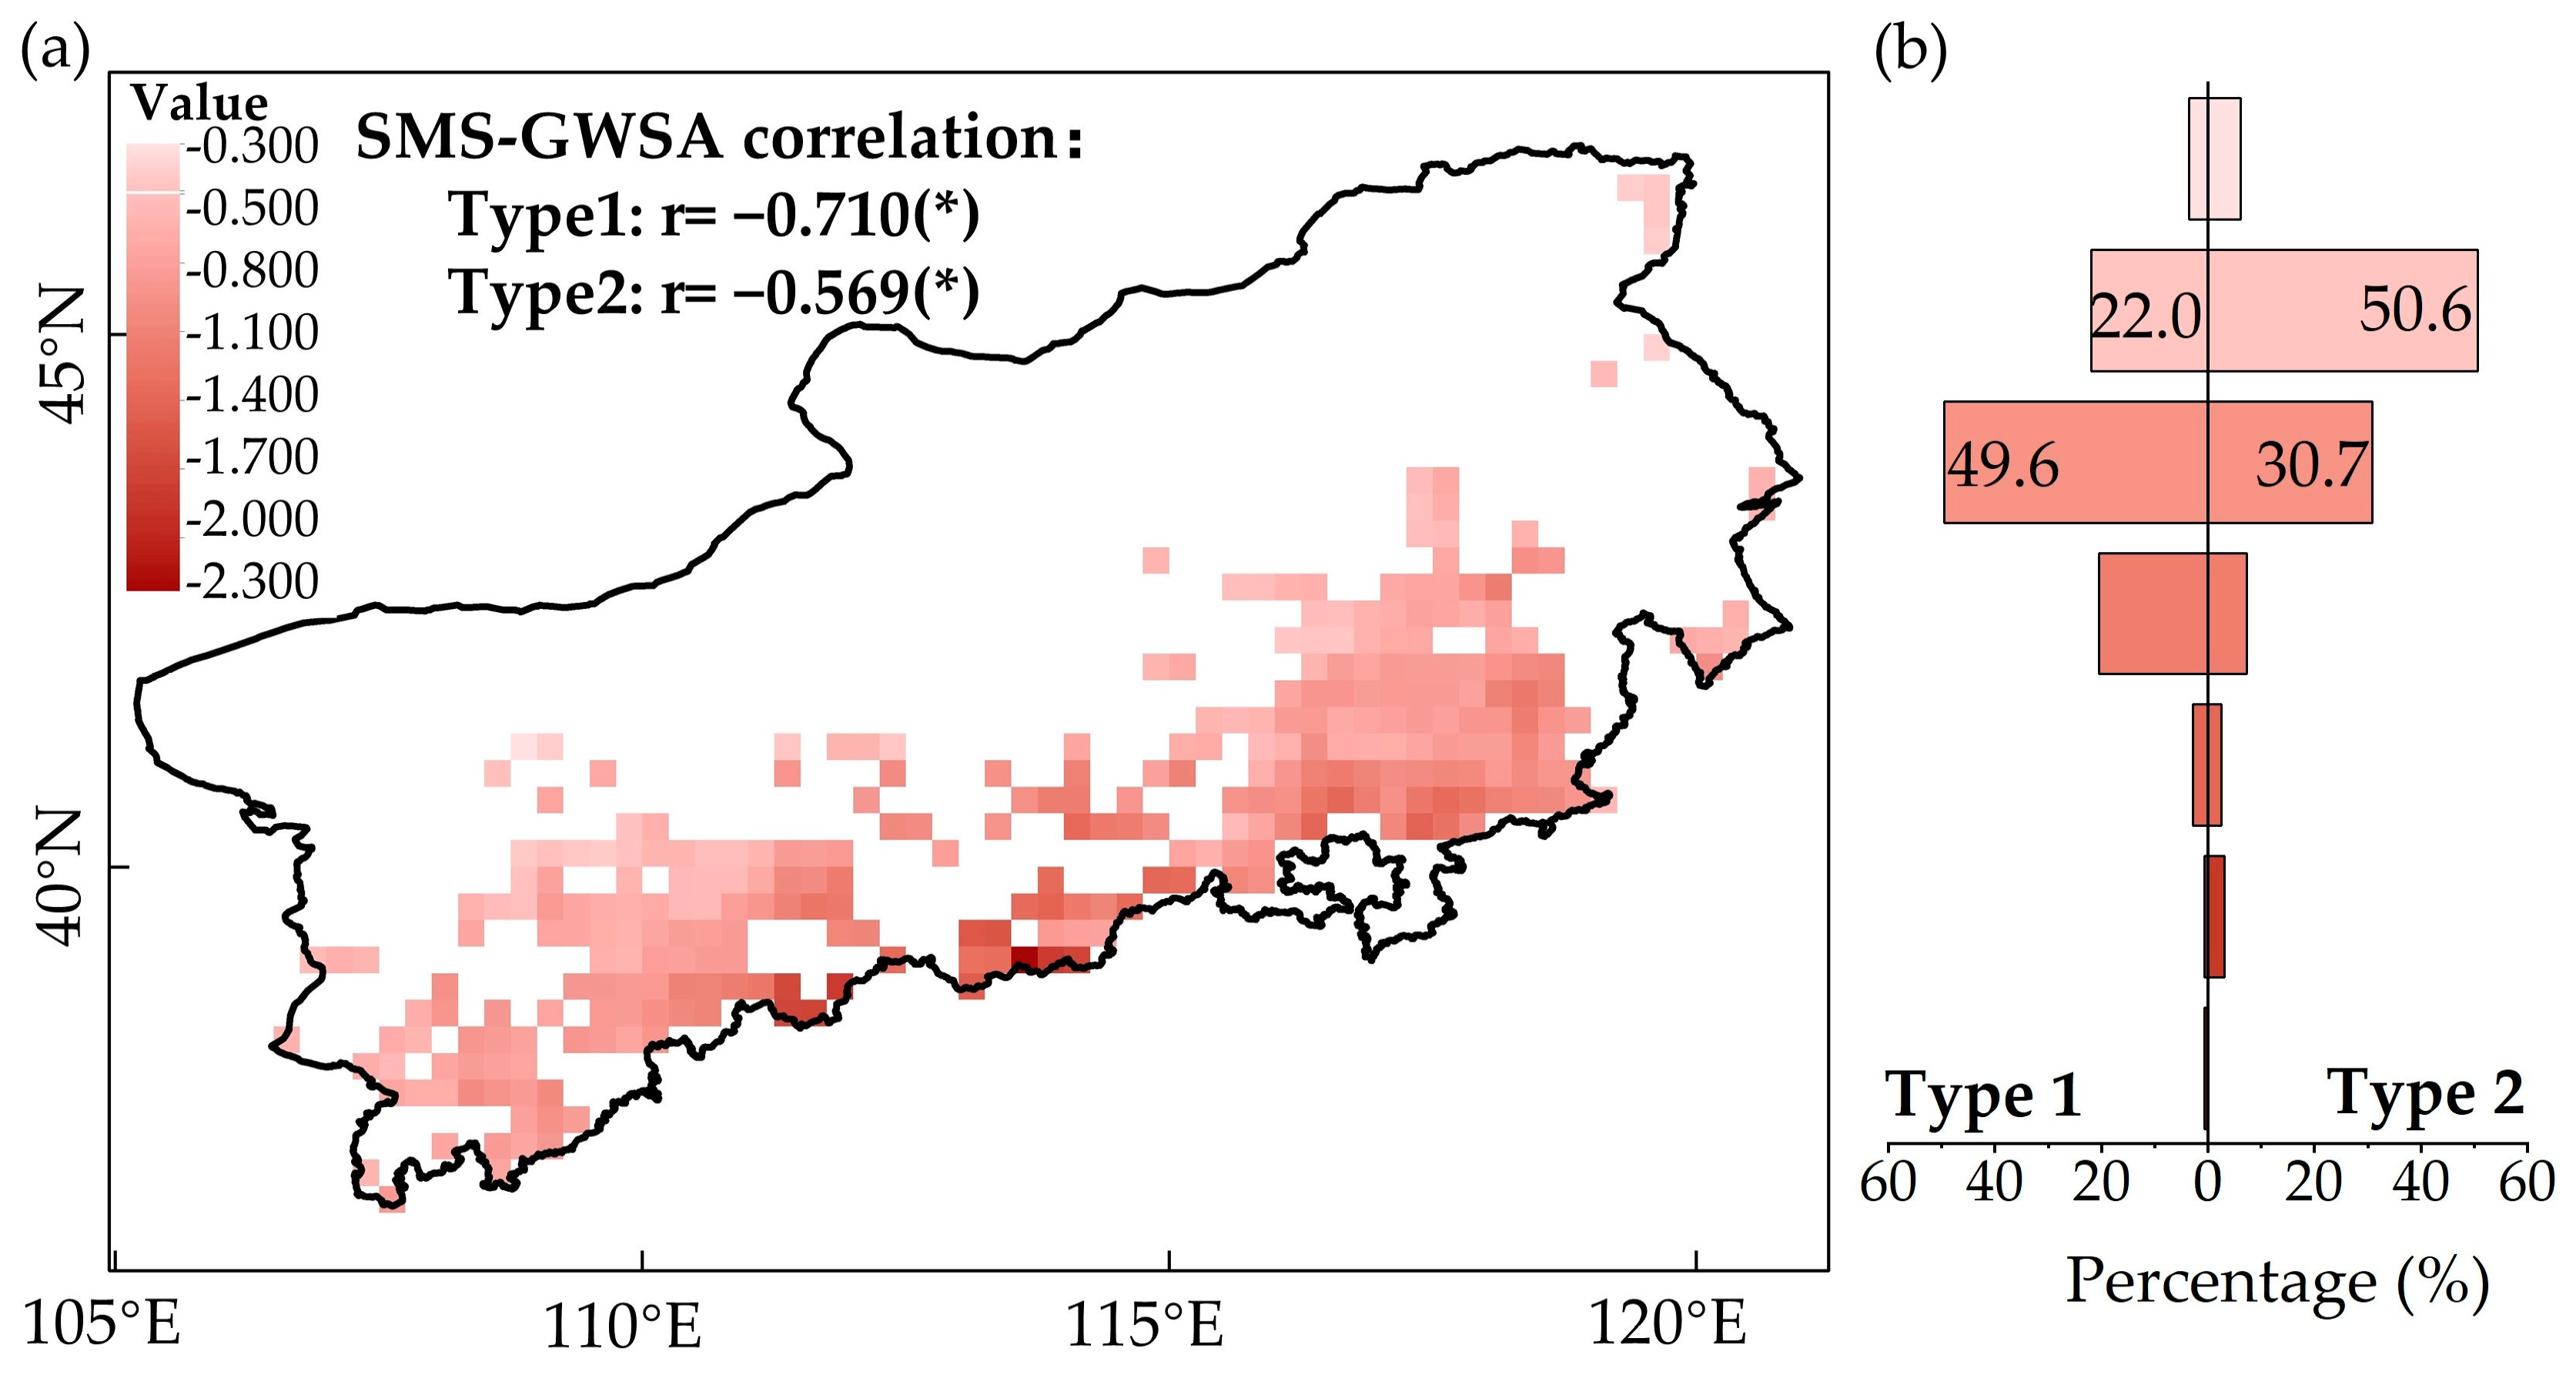
3.3. The Increased SMS in Areas with Restored Vegetation Was Groundwater-Dominated

The attribution analysis of SMS showed that GWS was the primary water source (defined as groundwater-dominated SMS) in 97.9% of Type 1 and 72.3% of Type 2 areas (Figure 5). Based on the conjoint analysis of SMS sources and NDVI–SMS correlations, we discovered that 100% of the groundwater-dominated SMS areas had a positive correlation with NDVI–SMS, whereas 100% and 91.3% of precipitation-dominated SMS areas in Types 1 and 2, respectively, had a positive correlation. This indicates that during the recovery of vegetation in drylands lacking SMS, shallow GWS replenishes the SM deficit upward through capillary action, thereby providing a potential source of water to support the growth of vegetation.
A trend analysis of the components of the hydrological cycle in the region is shown in Figure 6. From the perspective of SMS input, there was no significant change in precipitation in both Type 1 and Type 2 areas, which excludes the possibility of an increase in regional precipitation caused by vegetation restoration and thus an increase in SMS and a significant decrease in GWS, with rates of change of −1.028 cm/year and −0.829 cm/year, respectively. From the perspective of SMS output, actual evaporation and runoff increased.
Moreover, the SMS and GWSA trends showed significant negative correlations (Figure 7), with correlation coefficients of −0.710 and −0.569 for Types 1 and 2, respectively. Combined with the attribution analysis of the SMS and the trend analysis of hydrologic cycle components, this indicated a potential supply–demand link between the SMS and GWS in the drylands with restored vegetation, with trends in SMS in Type 1 being more correlated with trends in changes in GWS. Figure 6 shows a faster rate of decline in groundwater storage in Type 1 compared to Type 2 areas, with a concentration of −0.800 cm/year to −1.100 cm/year (49.6%), while the trend in Type 2 is concentrated in −0.500 cm/year to −0.800 cm/year (50.6%). As the transpiration demand of vegetation increased, GWS provided additional support, especially in areas with shallow groundwater. The recharge of upper soil by GWS, which was facilitated by vegetation restoration, was the principal factor contributing to the positive correlation between NDVI and SMS.

3.4. Main Driving Factors for SMS and GWS Changes

The RDA showed that the environmental variables explained 55.5% (p-value < 0.05) of the variability in water storage (Figure 8a). The effect of the initial vegetation NDVI on the SMS and GWSA trends was significant, with an explanation of 50.3%, which can be considered the main factor driving the change in water storage, followed by the PRE trend (3.8%), NDVI trend (1.2%), and TEM trend (0.2%). The regression analysis found that the initial vegetation NDVI was positively and negatively correlated with SMS and GWS, respectively, with significant correlation coefficients of 0.627 and −0.273 (Figure 8b). This indicated that the higher the initial NDVI, the higher the rate of increase in SMS and the faster the rate of decrease in GWSA. The initial NDVI of Type 1 was higher than that of Type 2; therefore, the rate of increase in SMS and the rate of decrease in GWSA were somewhat different.

4. Discussion

4.1. Relationship between Dryland Vegetation Restoration and the Water Cycle

SMS and GWS have often been discussed separately in previous studies, given that vegetation restoration depletes either SMS or GWS [48]. However, they excluded or oversimplified the groundwater connection, which is the main factor controlling SMS, particularly in drylands. The results of this study provide evidence of intertransformation between water components at large scales. In contrast to SMS, which is affected by evaporation in drylands, GWS can serve as an important supply of water for vegetation survivability in areas with insufficient precipitation. Several empirical and mechanistic studies have been conducted to confirm the role of GWS recharge in relation to SMS. A strong relationship between precipitation, SMS, and GWS was revealed by quantifying and analysing the differences in their isotopic compositions [49,50]. The clay layer began to appear in dryland soils at a depth of approximately 100 cm, and groundwater replenished the SMS in this layer in the form of a capillary rise [51]. The SMS affected by the water table could be increased by approximately 20% [52]. Particularly, under shallow water table conditions (depth ≤ 10 m), the water exchange between SM and groundwater was tight, and groundwater recharged SM via capillary action and by the upward movement of water via evaporation [53,54,55,56]. These processes aided in alleviating the SM deficit to some extent and offered a potential water source for the upper soil [57,58]. Consequently, this phenomenon might have contributed to the consistent decrease in GWS in drylands [59]. In addition, the potential groundwater utilisation of groundwater-dependent vegetated ecosystems is observed on a global scale, with the highest occurrence in drylands [60]. This process can significantly enhance SM retention and support vegetation sustainability even during dry periods. This widespread occurrence is substantiated by research in regions such as the Pampas of Argentina [61], south-east Australia, and the Horqin sandy land of China [56,62,63], where similar interactions have been extensively documented.
Consistent with the results of previous studies [64], this study found evident vegetation restoration in the BTSSR following the implementation of large-scale ecological projects. The correlations between the NDVI and climatic factors (precipitation and temperature) within the drylands with restored vegetation were only 0.380 (p-value > 0.05) and 0.088 (p-value > 0.05), respectively, indicating that climate was not the main factor driving vegetation change in the BTSSR. Instead, the observed changes were more related to the implementation of ecological projects. As previously mentioned, vegetation restoration has minimal association with climate but alters the original SMS-GWS transport processes. Vegetation restoration contributes to the loss of SMS by increasing vegetation transpiration and increases the input of SMS by increasing upward groundwater recharge. In locations with high precipitation, vegetation is able to sequester water, and the increase in precipitation resulting from increased vegetation cover can offset the increase in evaporation; thus, SM shows a non-significant trend [3,23]. Based on previous calculations, the precipitation-supplied vegetation growth in the BTSSR is very low [65], indicating that local precipitation cannot provide the water needed for vegetation growth. An additional piece of evidence is that significant leakage from the understory occurred only during years when precipitation exceeded the average annual precipitation of 590 mm [66]. Therefore, the increased evaporation associated with vegetation restoration in this region may significantly reduce precipitation leakage into the deeper layers of the soil and groundwater recharge. Instead, the main water sources utilised by plants in the BTSSR are deep SMS and shallow GWS to counter water stress [67]. The extent to which groundwater can recharge SM notably depends on regional characteristics. For instance, the existence of a shallow groundwater connection determines whether recharge can occur [55], soil properties such as texture and structure determine the soil’s capacity to facilitate capillary rise [68], and the type of vegetation determines its ability to utilise deep water sources effectively [63,69]. These regional factors are crucial for understanding the variability in groundwater use by vegetation in greening drylands. Our findings in the BTSSR reflect these complex interactions, highlighting the critical need for considering local ecological and hydrological conditions in vegetation restoration and water management strategies.

4.2. Concealed Risks of Groundwater Recharge in Dryland Degradation

Although a decrease in the SMS was not detected at the temporal and spatial scales in this study, this did not imply that the activity solely benefitted water resources, as a rapid decrease in GWS was also observed. Mechanistically, this decrease introduced several potential risks. On the one hand, salinity at the bottom of the soil or groundwater rises to the surface via capillary action as GWS decreases. After the water evaporates, salinity accumulates in the surface soil, which easily causes soil salinisation [70]. On the other hand, following an excessive decrease in groundwater, the efficiency of plant roots in absorbing and utilising groundwater is reduced, and vegetation cannot obtain enough SM [71]. Consequently, the regional vegetation cover is reduced, and the soil structure is loosened, which renders it susceptible to soil degradation and desertification.
There were two stages of vegetative growth responses to varying levels of SM deficiency. When the SM deficit was slight, the frequency of the vegetation growth response to the deficit was low because of the resistance of vegetation growth to the deficit. When the SM deficit reached a moderate level, the response of vegetation growth to the deficit changed abruptly [72]. Over the past decade, increasing global SM limitations have led to an increase in browned vegetation areas [73]. When forest area and quality increase at rates that exceed the carrying capacity of relatively limited precipitation in a dryland watershed, this increase can lead to reduced surface runoff, accelerated decreases in SMS, downstream GWS depletion, and reduced water resources, thereby inhibiting forest quality [74]. We found that the groundwater had experienced drought since 2015, with the most severe drought occurring in 2018 (Figure 9). As drought severity increases, recharge from groundwater to SM decreases, and the direction of recharge will reverse, eventually leading to a disconnection from SM. It has also been found that drought events may directly affect groundwater [75]. Therefore, under the dual pressure of climate warming and the subsequent expansion of drylands [76], and socio-economic development exacerbating water withdrawals [77], researchers and managers must comprehensively consider and assess the short- and long-term benefits of vegetation restoration projects. Moreover, it is crucial for policies to be adapted to the specific circumstances of each region.

4.3. Implications and Management Insights of This Study

SM is the most direct indicator of water availability for vegetation, and its storage intuitively affects subsequent vegetation restoration. Upon comparing the vegetation and water resource information of Types 1 and 2 (Table 3), we discovered that Type 1 and 2 areas corresponded to different vegetation type proportions and initial NDVI values. Type 1 was dominated by forests, whereas Type 2 was dominated by grasslands. Forests include shrubs and trees, which require more water for growth than herbaceous plants. Type 1 was over 0.2 higher than Type 2. As found in this study, the initial NDVI has a more significant impact on SMS and GWS than the NDVI trend. This finding is consistent with previous studies that observed the impacts of initial vegetation cover on water storage variability and its response to climate and vegetation [78,79]. The predominant influence of the initial NDVI can be attributed to the stage and state of vegetation restoration and reflects the baseline health and degree of cover of vegetation, which directly affects the water uptake and storage capabilities of the soil and underlying aquifers. Although the NDVI trend shows the trend of vegetation change over time, it has less influence on the immediate hydrological processes because these changes may take a longer time to show their impact on water resources, so based on the current results of this study, as well as other results from the region, the study area has not yet reached the threshold of soil water depletion by vegetation growth [80]. In addition, the NDVI trend plays an amplifier role in altering the terrestrial water cycle, depending on the degree of vegetation cover [81]. Therefore, analysing the data so far, the initial value, i.e., the vegetation factor, which includes the climatic condition factor, has a greater influence on the water cycle components. This finding indicates the importance of considering the initial vegetation conditions when assessing the hydrological impacts and strengthening the long-term dynamic monitoring of the impacts on SMS and GWS by accounting for the water balance in the process of vegetation restoration [82]. Finally, considering the decrease in GWS, effective measures should be taken to manage and maintain existing vegetation while ensuring the water supply [83]. For Type 1 areas with slightly more precipitation, less water-intensive and drought-resistant tree species should be selected [84]. Conversely, for Type 2 areas with less precipitation, natural restoration (predominantly grasslands supplemented with drought-resistant shrubs) is a relatively better option [85].
This study assessed the changes in GWS and their contribution to the SMS using multi-source data and comprehensively analysed the impacts of vegetation restoration on water resources. These findings can provide novel perspectives for the implementation of rational vegetation restoration activities in drylands. It is worth stating that this study analysed water resource changes at a regional scale by using multi-source assimilation and satellite data, which have been previously validated for their applicability in this specific region [80,86]. The utilisation of coarse-resolution data products allows for the detection of trends in change and can be employed in areas where SMS and GWS monitoring networks are not available. In the future, long-term monitoring of water storage should be maintained, and top-down and bottom-up mechanistic analyses can be carried out if sufficient measured and simulated data are available [87,88].

5. Conclusions

Healthy vegetation and adequate water resources are key factors in maintaining the stability of dryland ecosystems. Ecological restoration projects in drylands have been successful in preventing degradation; however, there remains a need to assess their ecohydrological impacts. This study investigated vegetation trends and their relationships with regional water resources in the BTSSR after the implementation of large-scale ecological projects over the past 19 years. The results showed that the NDVI of natural land cover types (forests and grasslands) increased significantly. SMS showed two distinct types: significant increases and no significant changes. Moreover, vegetation restoration appeared to favour SMS accumulation. However, we also observed a significant decrease in GWS, with areas of SMS significantly increasing at a higher trend than those that did not change significantly. The initial vegetation NDVI had an important influence on the trend of increase in SMS and the trend of decrease in GWS. Vegetation restoration in areas with a high initial NDVI will result in a more rapid trend of increase in SMS and a decrease in GWS. The results of this study extended the chain of research on the relationship between vegetation restoration and SMS and are expected to provide a comprehensive understanding of the effects of vegetation restoration on water storage in the context of long-term vegetation restoration. Importantly, they highlight the importance of avoiding vegetation restoration projects that overexploit groundwater resources, especially in regions facing water scarcity.

Author Contributions

Conceptualisation, Y.W., R.L. and H.Z.; methodology, Y.W., R.L. and T.H.; formal analysis, Y.W.; data curation, Y.W., T.H., Y.Y., Y.H. and Z.W.; writing—original draft preparation, Y.W.; writing—review and editing, Y.W. and R.L.; visualisation, Y.W.; supervision, H.Z.; funding acquisition, R.L. and H.Z. All authors have read and agreed to the published version of the manuscript.

Funding

This research was supported by the National Natural Science Foundation of China (No. 41925005, 42171099) and the National Key Research and Development Program of China (No. 2022YFF1301802).

Data Availability Statement

The CSR GRACE/FO RL06 mascon dataset is obtained from the Center for Space Research at the University of Texas, Austin and downloaded at http://www.csr.utexas.edu/grace (accessed on 28 April 2022). The GLDAS Noah model dataset was developed by the National Aeronautics and Space Administration and the National Oceanic and Atmospheric Administration and downloaded at https://ldas.gsfc.nasa.gov/gldas/ (accessed on 6 April 2022). GPCC precipitation data were acquired from https://opendata.dwd.de/climate_environment/GPCC (accessed on 6 July 2022). ERA5 temperature data were accessed from the European Centre for Medium-Range Weather Forecasts at https://cds.climate.copernicus.eu (access on 16 April 2023). The GLEAM product was developed and provided by Research Fellow Miralles, Department of Hydrometeorology, School of Geographical Sciences, University of Bristol at https://www.gleam.eu/ (access on 7 November 2022). The NDVI and LUCC data were both provided by the Resources and Environment Science and Data Center, Chinese Academy of Sciences at http://www.resdc.cn/ (accessed on 9 November 2022 and 23 March 2023, respectively). The depth of groundwater table data from National Ecosystem Research Network of China at http://www.cnern.ac.cn/index.action (accessed on 12 October 2022).

Acknowledgments

We thank the anonymous reviewers for their invaluable suggestions.

Conflicts of Interest

The authors declare no conflicts of interest.

References

  1. Papagiannopoulou, C.; Miralles, D.G.; Dorigo, W.A.; Verhoest, N.E.C.; Depoorter, M.; Waegeman, W. Vegetation anomalies caused by antecedent precipitation in most of the world. Environ. Res. Lett. 2017, 12, 074016. [Google Scholar] [CrossRef]
  2. Miguez-Macho, G.; Fan, Y. Spatiotemporal origin of soil water taken up by vegetation. Nature 2021, 598, 624–628. [Google Scholar] [CrossRef] [PubMed]
  3. Wang, L.; Lu, J.; Zhou, R.; Duan, G.; Wen, Z. Analysis of soil moisture change characteristics and influencing factors of grassland on the Tibetan Plateau. Remote Sens. 2023, 15, 298. [Google Scholar] [CrossRef]
  4. Zhao, F.; Wang, X.; Wu, Y.; Sivakumar, B.; Liu, S. Enhanced dependence of China’s vegetation activity on soil moisture under drier climate conditions. J. Geophys. Res. Biogeosci. 2023, 128, e2022JG007300. [Google Scholar] [CrossRef]
  5. Shan, L.; Yu, X.; Sun, L.; He, B.; Wang, H.; Xie, T. Seasonal differences in climatic controls of vegetation growth in the Beijing–Tianjin Sand Source Region of China. J. Arid. Land 2018, 10, 850–863. [Google Scholar] [CrossRef]
  6. Zhang, W.; Li, Y.; Wu, X.; Chen, Y.; Chen, A.; Schwalm, C.R.; Kimball, J.S. Divergent response of vegetation growth to soil water availability in dry and wet periods over central Asia. J. Geophys. Res. Biogeosci. 2021, 126, e2020jg005912. [Google Scholar] [CrossRef]
  7. Wu, W.; Lan, C.; Lo, M.; Reager, J.T.; Famiglietti, J.S. Increases in the annual range of soil water storage at northern middle and high latitudes under global warming. Geophys. Res. Lett. 2015, 42, 3903–3910. [Google Scholar] [CrossRef]
  8. Ye, S.; Li, H.; Li, S.; Leung, L.R.; Demissie, Y.; Ran, Q.; Blöschl, G. Vegetation regulation on streamflow intra-annual variability through adaption to climate variations. Geophys. Res. Lett. 2015, 42, 10307–10315. [Google Scholar] [CrossRef]
  9. Deng, Y.; Wang, S.; Bai, X.; Luo, G.; Wu, L.; Chen, F.; Wang, J.; Li, C.; Yang, Y.; Hu, Z.; et al. Vegetation greening intensified soil drying in some semi-arid and arid areas of the world. Agric. For. Meteorol. 2020, 292, 108103. [Google Scholar] [CrossRef]
  10. Liu, H.; Liu, Y.; Chen, Y.; Fan, M.; Chen, Y.; Gang, C.; You, Y.; Wang, Z. Dynamics of global dryland vegetation were more sensitive to soil moisture: Evidence from multiple vegetation indices. Agric. For. Meteorol. 2023, 331, 109327. [Google Scholar] [CrossRef]
  11. Reynolds, J.F.; Stafford Smith, D.M.; Lambin, E.F.; Turner, B.L.; Mortimore, M.; Batterbury, S.P.J.; Downing, T.E.; Dowlatabadi, H.; Fernandez, R.J.; Herrick, J.E.; et al. Global Desertification: Building a Science for Dryland Development. Science 2007, 316, 847–851. [Google Scholar] [CrossRef] [PubMed]
  12. Stringer, L.C.; Mirzabaev, A.; Benjaminsen, T.A.; Harris, R.M.B.; Jafari, M.; Lissner, T.K.; Stevens, N.; Tirado-von der Pahlen, C. Climate change impacts on water security in global drylands. One Earth 2021, 4, 851–864. [Google Scholar] [CrossRef]
  13. Qin, G.; Meng, Z.; Fu, Y. Drought and water-use efficiency are dominant environmental factors affecting greenness in the Yellow River Basin, China. Remote Sens. Environ. 2022, 834, 155479. [Google Scholar] [CrossRef] [PubMed]
  14. Li, Y.; Li, Z.; Zhang, X.; Gui, J.; Xue, J. Vegetation variations and its driving factors in the transition zone between Tibetan Plateau and arid region. Ecol. Indic. 2022, 141, 109101. [Google Scholar] [CrossRef]
  15. Piao, S.; Wang, X.; Park, T.; Chen, C.; Lian, X.; He, Y.; Bjerke, J.W.; Chen, A.; Ciais, P.; Tømmervik, H.; et al. Characteristics, drivers and feedbacks of global greening. Nat. Rev. Earth Environ. 2019, 1, 14–27. [Google Scholar] [CrossRef]
  16. Xue, Y.; Liang, H.; Zhang, H.; Yin, L.; Feng, X. Quantifying the policy-driven large scale vegetation restoration effects on evapotranspiration over drylands in China. J. Environ. Manag. 2023, 345, 118723. [Google Scholar] [CrossRef] [PubMed]
  17. Yang, Y.; Roderick, M.L.; Guo, H.; Miralles, D.G.; Zhang, L.; Fatichi, S.; Luo, X.; Zhang, Y.; McVicar, T.R.; Tu, Z.; et al. Evapotranspiration on a greening Earth. Nat. Rev. Earth Environ. 2023, 4, 626–641. [Google Scholar] [CrossRef]
  18. Jasechko, S.; Sharp, Z.D.; Gibson, J.J.; Birks, S.J.; Yi, Y.; Fawcett, P.J. Terrestrial water fluxes dominated by transpiration. Nature 2013, 496, 347–350. [Google Scholar] [CrossRef]
  19. Cui, J.; Lian, X.; Huntingford, C.; Gimeno, L.; Wang, T.; Ding, J.; He, M.; Xu, H.; Chen, A.; Gentine, P.; et al. Global water availability boosted by vegetation-driven changes in atmospheric moisture transport. Nat. Geosci. 2022, 15, 982–988. [Google Scholar] [CrossRef]
  20. Tietjen, B.; Schlaepfer, D.R.; Bradford, J.B.; Lauenroth, W.K.; Hall, S.A.; Duniway, M.C.; Hochstrasser, T.; Jia, G.; Munson, S.M.; Pyke, D.A.; et al. Climate change-induced vegetation shifts lead to more ecological droughts despite projected rainfall increases in many global temperate drylands. Glob. Chang. Biol. 2017, 23, 2743–2754. [Google Scholar] [CrossRef]
  21. Feng, X.; Fu, B.; Piao, S.; Wang, S.; Ciais, P.; Zeng, Z.; Lü, Y.; Zeng, Y.; Li, Y.; Jiang, X.; et al. Revegetation in China’s Loess Plateau is approaching sustainable water resource limits. Nat. Clim. Chang. 2016, 6, 1019–1022. [Google Scholar] [CrossRef]
  22. Tian, J.; Wang, H.; Zhang, Z.; Fu, Y.; Zhao, T.; Tao, H. Unraveling the connection between vegetation greening and terrestrial water storage decline in the arid and semi-arid regions of northwest China. J. Hydrol. Reg. Stud. 2023, 49, 101509. [Google Scholar] [CrossRef]
  23. Li, Y.; Piao, S.; Li, L.Z.X.; Chen, A.; Wang, X.; Ciais, P.; Huang, L.; Lian, X.; Peng, S.; Zeng, Z.; et al. Divergent hydrological response to large-scale afforestation and vegetation greening in China. Sci. Adv. 2018, 4, eaar4182. [Google Scholar] [CrossRef] [PubMed]
  24. Zhang, C.; Long, D.; Liu, T.; Slater, L.J.; Wang, G.; Zuo, D.; Duan, L.; Cui, Y.; Cui, Y. Grassland Greening and Water Resource Availability May Coexist in a Warming Climate in Northern China and the Tibetan Plateau. Earth’s Future 2023, 11, e2023EF004037. [Google Scholar] [CrossRef]
  25. Tamea, S.; Laio, F.; Ridolfi, L.; D’Odorico, P.; Rodriguez-Iturbe, I. Ecohydrology of groundwater-dependent ecosystems: 2. Stochastic soil moisture dynamics. Water Resour. Res. 2009, 45, W05420. [Google Scholar] [CrossRef]
  26. Rodell, M.; Houser, P.; Jambor, U.; Gottschalck, J.; Mitchell, K.; Meng, C.; Arsenault, K.; Cosgrove, B.; Radakovich, J.; Bosilovich, M.; et al. The Global Land Data Assimilation System. Bull. Am. Meteorol. Soc. 2004, 85, 381–394. [Google Scholar] [CrossRef]
  27. Tapley, B.D.; Bettadpur, S.; Watkins, M.; Reigber, C. The gravity recovery and climate experiment: Mission overview and early results. Geophys. Res. Lett. 2004, 31, L09607. [Google Scholar] [CrossRef]
  28. Rodell, M.; Chen, J.; Kato, H.; Famiglietti, J.S.; Nigro, J.; Wilson, C.R. Estimating groundwater storage changes in the Mississippi River basin (USA) using GRACE. Hydrogeol. J. 2006, 15, 159–166. [Google Scholar] [CrossRef]
  29. Syed, T.H.; Famiglietti, J.S.; Rodell, M.; Chen, J.; Wilson, C.R. Analysis of terrestrial water storage changes from GRACE and GLDAS. Water Resour. Res. 2008, 44, W02433. [Google Scholar] [CrossRef]
  30. Zhao, Y.; Chi, W.; Kuang, W.; Bao, Y.; Ding, G. Ecological and environmental consequences of ecological projects in the Beijing–Tianjin sand source region. Ecol. Indic. 2020, 112, 106111. [Google Scholar] [CrossRef]
  31. Shao, Q.; Liu, S.; Ning, J.; Liu, G.; Yang, F.; Zhang, X.; Niu, L.; Huang, H.; Fan, J.; Liu, J. Assessment of ecological benefits of key national ecological projects in China in 2000-2019 using remote sensing. Acta Geogr. Sin. Chin. 2022, 77, 2133–2153. [Google Scholar] [CrossRef]
  32. Zhong, Y.; Feng, W.; Humphrey, V.; Zhong, M. Human-Induced and Climate-Driven Contributions to Water Storage Variations in the Haihe River Basin, China. Remote Sens. 2019, 11, 3050. [Google Scholar] [CrossRef]
  33. Becker, A.; Finger, P.; Meyer-Christoffer, A.; Rudolf, B.; Schamm, K.; Schneider, U.; Ziese, M. A description of the global land-surface precipitation data products of the Global Precipitation Climatology Centre with sample applications including centennial (trend) analysis from 1901–present. Earth Syst. Sci. Data 2013, 5, 71–99. [Google Scholar] [CrossRef]
  34. Martens, B.; Miralles, D.G.; Lievens, H.; van der Schalie, R.; de Jeu, R.A.M.; Fernández-Prieto, D.; Beck, H.E.; Dorigo, W.A.; Verhoest, N.E.C. GLEAM v3: Satellite-based land evaporation and root-zone soil moisture. Geosci. Model Dev. 2017, 10, 1903–1925. [Google Scholar] [CrossRef]
  35. Muñoz-Sabater, J.; Dutra, E.; Agustí-Panareda, A.; Albergel, C.; Arduini, G.; Balsamo, G.; Boussetta, S.; Choulga, M.; Harrigan, S.; Hersbach, H.; et al. ERA5-Land: A state-of-the-art global reanalysis dataset for land applications. Earth Syst. Sci. Data 2021, 13, 4349–4383. [Google Scholar] [CrossRef]
  36. Sen, P.K. Estimates of the Regression Coefficient Based on Kendall’s Tau. J. Am. Stat. Assoc. 1968, 63, 1379–1389. [Google Scholar] [CrossRef]
  37. Burn, D.H.; Elnur, M.A.H. Detection of hydrologic trends and variability. J. Hydrol. 2002, 255, 107–122. [Google Scholar] [CrossRef]
  38. Shen, Z.; Zhang, Q.; Piao, S.; Peñuelas, J.; Stenseth, N.C.; Chen, D.; Xu, C.Y.; Singh, V.P.; Liu, T. Mining can exacerbate global degradation of dryland. Geophys. Res. Lett. 2021, 48, e2021GL094490. [Google Scholar] [CrossRef]
  39. Legendre, P.; Gallagher, E.D. Ecologically meaningful transformations for ordination of species data. Oecologia 2001, 129, 271–280. [Google Scholar] [CrossRef]
  40. Wei, Z.; Wan, X. Spatial and Temporal Characteristics of NDVI in the Weihe River Basin and Its Correlation with Terrestrial Water Storage. Remote Sens. 2022, 14, 5532. [Google Scholar] [CrossRef]
  41. Wei, X.; Huang, Q.; Huang, S.; Leng, G.; Qu, Y.; Deng, M.; Han, Z.; Zhao, J.; Liu, D.; Bai, Q. Assessing the feedback relationship between vegetation and soil moisture over the Loess Plateau, China. Ecol. Indic. 2022, 134, 108493. [Google Scholar] [CrossRef]
  42. Kong, R.; Zhang, Z.; Zhang, Y.; Wang, Y.; Peng, Z.; Chen, X.; Xu, C.-Y. Detection and Attribution of Changes in Terrestrial Water Storage across China: Climate Change versus Vegetation Greening. Remote Sens. 2023, 15, 3104. [Google Scholar] [CrossRef]
  43. Oluwaniyi, O.; Zhang, Y.; Gholizadeh, H.; Li, B.; Gu, X.; Sun, H.; Lu, C. Correlating Groundwater Storage Change and Precipitation in Alabama, United States from 2000–2021 by Combining the Water Table Fluctuation Method and Statistical Analyses. Sustainability 2023, 15, 15324. [Google Scholar] [CrossRef]
  44. Zhang, T.; Jin, S. Evapotranspiration Variations in the Mississippi River Basin Estimated From GPS Observations. IEEE Trans. Geosci. Remote Sens. 2016, 54, 4694–4701. [Google Scholar] [CrossRef]
  45. Fathololoumi, S.; Karimi Firozjaei, M.; Biswas, A. Improving spatial resolution of satellite soil water index (SWI) maps under clear-sky conditions using a machine learning approach. J. Hydrol. 2022, 615, 128709. [Google Scholar] [CrossRef]
  46. Fathololoumi, S.; Vaezi, A.R.; Alavipanah, S.K.; Ghorbani, A.; Saurette, D.; Biswas, A. Effect of multi-temporal satellite images on soil moisture prediction using a digital soil mapping approach. Geoderma 2021, 385, 114901. [Google Scholar] [CrossRef]
  47. Zhao, M.; Geruo, A.; Velicogna, I.; Kimball, J.S. A Global Gridded Dataset of GRACE Drought Severity Index for 2002–14: Comparison with PDSI and SPEI and a Case Study of the Australia Millennium Drought. J. Hydrometeorol. 2017, 18, 2117–2129. [Google Scholar] [CrossRef]
  48. Han, Z.; Huang, S.; Huang, Q.; Bai, Q.; Leng, G.; Wang, H.; Zhao, J.; Wei, X.; Zheng, X. Effects of vegetation restoration on groundwater drought in the Loess Plateau, China. J. Hydrol. 2020, 591, 125566. [Google Scholar] [CrossRef]
  49. Adomako, D.; Maloszewski, P.; Stumpp, C.; Osae, S.; Akiti, T.T. Estimating groundwater recharge from water isotope (δ2H, δ18O) depth profiles in the Densu River basin, Ghana. Hydrol. Sci. J. 2010, 55, 1405–1416. [Google Scholar] [CrossRef]
  50. Li, Z.; Lin, X.; Coles, A.E.; Chen, X. Catchment-scale surface water-groundwater connectivity on China’s Loess Plateau. Catena 2017, 152, 268–276. [Google Scholar] [CrossRef]
  51. Zhou, Y.; Chen, S.; Song, W.; Lu, Q.; Lin, G. Water-use strategies of two dominant desert plants along a precipitation gradient in north-western China. Chin. J. Plant Ecol. Chin. 2011, 35, 789–800. [Google Scholar] [CrossRef]
  52. Chen, X.; Hu, Q. Groundwater influences on soil moisture and surface evaporation. J. Hydrol. 2004, 297, 285–300. [Google Scholar] [CrossRef]
  53. Portela, S.I.; Andriulo, A.E.; Jobbágy, E.G.; Sasal, M.C. Water and nitrate exchange between cultivated ecosystems and groundwater in the Rolling Pampas. Agric. Ecosyst. Environ. 2009, 134, 277–286. [Google Scholar] [CrossRef]
  54. Brolsma, R.J.; Karssenberg, D.; Bierkens, M.F.P. Vegetation competition model for water and light limitation. I: Model description, one-dimensional competition and the influence of groundwater. Ecol. Model. 2010, 221, 1348–1363. [Google Scholar] [CrossRef]
  55. Condon, L.E.; Atchley, A.L.; Maxwell, R.M. Evapotranspiration depletes groundwater under warming over the contiguous United States. Nat. Commun. 2020, 11, 873. [Google Scholar] [CrossRef] [PubMed]
  56. Wu, Y.; Liu, T.; Paredes, P.; Duan, L.; Wang, H.; Wang, T.; Pereira, L.S. Ecohydrology of groundwater-dependent grasslands of the semi-arid Horqin sandy land of inner Mongolia focusing on evapotranspiration partition. Ecohydrology 2015, 9, 1052–1067. [Google Scholar] [CrossRef]
  57. Priyadarshini, K.V.R.; Prins, H.H.T.; de Bie, S.; Heitkönig, I.M.A.; Woodborne, S.; Gort, G.; Kirkman, K.; Ludwig, F.; Dawson, T.E.; de Kroon, H. Seasonality of hydraulic redistribution by trees to grasses and changes in their water-source use that change tree–grass interactions. Ecohydrology 2015, 9, 218–228. [Google Scholar] [CrossRef]
  58. Krevh, V.; Filipović, V.; Filipović, L.; Mateković, V.; Petošić, D.; Mustać, I.; Ondrašek, G.; Bogunović, I.; Kovač, Z.; Pereira, P.; et al. Modeling seasonal soil moisture dynamics in gley soils in relation to groundwater table oscillations in eastern Croatia. Catena 2022, 211, 105987. [Google Scholar] [CrossRef]
  59. Ohte, N.; Koba, K.; Yoshikawa, K.; Sugimoto, A.; Matsuo, N.; Kabeya, N.; Wang, L. Water Utilization of Natural and Planted Trees in the Semiarid Desert of Inner Mongolia, China. Ecol. Appl. 2003, 13, 337–351. [Google Scholar] [CrossRef]
  60. Link, A.; El-Hokayem, L.; Usman, M.; Conrad, C.; Reinecke, R.; Berger, M.; Wada, Y.; Coroama, V.; Finkbeiner, M. Groundwater-dependent ecosystems at risk—Global hotspot analysis and implications. Environ. Res. Lett. 2023, 18, 094026. [Google Scholar] [CrossRef]
  61. Kroes, J.; van Dam, J.; Supit, I.; de Abelleyra, D.; Verón, S.; de Wit, A.; Boogaard, H.; Angelini, M.; Damiano, F.; Groenendijk, P.; et al. Agrohydrological analysis of groundwater recharge and land use changes in the Pampas of Argentina. Agric. Water Manag. 2019, 213, 843–857. [Google Scholar] [CrossRef]
  62. Mu, M.; De Kauwe, M.G.; Ukkola, A.M.; Pitman, A.J.; Guo, W.; Hobeichi, S.; Briggs, P.R. Exploring how groundwater buffers the influence of heatwaves on vegetation function during multi-year droughts. Earth Syst. Dyn. 2021, 12, 919–938. [Google Scholar] [CrossRef]
  63. Xu, X.; Zhao, J.; Wu, G.; Li, Y.; Hou, L. Tracing Water Recharge and Transport in the Root-Zone Soil of Different Vegetation Types in the Poyang Lake Floodplain Wetland (China) Using Stable Isotopes. Sustainability 2024, 16, 1755. [Google Scholar] [CrossRef]
  64. Song, W.; Feng, Y.; Wang, Z. Ecological restoration programs dominate vegetation greening in China. Remote Sens. Environ. 2022, 848, 157729. [Google Scholar] [CrossRef]
  65. Zhu, X.; Liu, H.; Li, Y.; Liang, B. Quantifying the role of soil in local precipitation redistribution to vegetation growth. Ecol. Indic. 2021, 124, 107355. [Google Scholar] [CrossRef]
  66. Schwarzel, K.; Zhang, L.; Montanarella, L.; Wang, Y.; Sun, G. How afforestation affects the water cycle in drylands: A process-based comparative analysis. Glob. Chang. Biol. 2020, 26, 944–959. [Google Scholar] [CrossRef] [PubMed]
  67. Pei, Y.; Huang, L.; Shao, M. Characteristics and their influencing factors of water recharge under different groundwater levels in the Mu Us Sandy Land of China. Trans. Chin. Soc. Agric. Eng. Chin. 2021, 37, 108–116. [Google Scholar] [CrossRef]
  68. Vincke, C.; Thiry, Y. Water table is a relevant source for water uptake by a Scots pine (Pinus sylvestris L.) stand: Evidences from continuous evapotranspiration and water table monitoring. Agric. For. Meteorol. 2008, 148, 1419–1432. [Google Scholar] [CrossRef]
  69. Jasper, K.; Calanca, P.; Fuhrer, J. Changes in summertime soil water patterns in complex terrain due to climatic change. J. Hydrol. 2006, 327, 550–563. [Google Scholar] [CrossRef]
  70. Qi, Z.; Xiao, C.; Wang, G.; Liang, X. Study on Ecological Threshold of Groundwater in Typical Salinization Area of Qian’an County. Water 2021, 13, 856. [Google Scholar] [CrossRef]
  71. Ren, W.; Gao, Y.; Qian, H.; Ma, Y.; Su, Z.; Ma, W.; Liu, Y.; Xu, P. Spatiotemporal Variation Characteristics of Groundwater Storage and Its Driving Factors and Ecological Effects in Tibetan Plateau. Remote Sens. 2023, 15, 2418. [Google Scholar] [CrossRef]
  72. Li, X.; Piao, S.; Huntingford, C.; Penuelas, J.; Yang, H.; Xu, H.; Chen, A.; Friedlingstein, P.; Keenan, T.F.; Sitch, S.; et al. Global variations in critical drought thresholds that impact vegetation. Natl. Sci. Rev. 2023, 10, nwad049. [Google Scholar] [CrossRef] [PubMed]
  73. Pan, N.; Feng, X.; Fu, B.; Wang, S.; Ji, F.; Pan, S. Increasing global vegetation browning hidden in overall vegetation greening: Insights from time-varying trends. Remote Sens. Environ. 2018, 214, 59–72. [Google Scholar] [CrossRef]
  74. Li, R.; Zheng, H.; O’Connor, P.; Xu, H.; Li, Y.; Lu, F.; Robinson, B.E.; Ouyang, Z.; Hai, Y.; Daily, G.C. Time and space catch up with restoration programs that ignore ecosystem service trade-offs. Sci. Adv. 2021, 7, eabf8650. [Google Scholar] [CrossRef] [PubMed]
  75. Ndehedehe, C.E.; Ferreira, V.G.; Adeyeri, O.E.; Correa, F.M.; Usman, M.; Oussou, F.E.; Kalu, I.; Okwuashi, O.; Onojeghuo, A.O.; Getirana, A.; et al. Global assessment of drought characteristics in the Anthropocene. Resour. Environ. Sustain. 2023, 12, 100105. [Google Scholar] [CrossRef]
  76. Huang, J.; Yu, H.; Guan, X.; Wang, G.; Guo, R. Accelerated dryland expansion under climate change. Nat. Clim. Chang. 2015, 6, 166–171. [Google Scholar] [CrossRef]
  77. Zhang, F.; Wei, L.; Hu, Y.; Yan, H.; Cui, H.; Chen, C.; Wang, Z. The expansion of the middle and rich classes heterogeneously intensifies regional water withdrawal in China. Resour. Environ. Sustain. 2023, 12, 100114. [Google Scholar] [CrossRef]
  78. Su, B.; Shangguan, Z. Decline in soil moisture due to vegetation restoration on the Loess Plateau of China. Land Degrad. Dev. 2018, 30, 290–299. [Google Scholar] [CrossRef]
  79. Peng, C.; Zeng, J.; Chen, K.-S.; Li, Z.; Ma, H.; Zhang, X.; Shi, P.; Wang, T.; Yi, L.; Bi, H. Global spatiotemporal trend of satellite-based soil moisture and its influencing factors in the early 21st century. Remote Sens. Environ. 2023, 291, 113569. [Google Scholar] [CrossRef]
  80. Zhang, M.; Wu, X. The rebound effects of recent vegetation restoration projects in Mu Us Sandy land of China. Ecol. Indic. 2020, 113, 106228. [Google Scholar] [CrossRef]
  81. Feng, H.; Zou, B.; Luo, J. Coverage-dependent amplifiers of vegetation change on global water cycle dynamics. J. Hydrol. 2017, 550, 220–229. [Google Scholar] [CrossRef]
  82. Cao, S.; Zhang, J.; Chen, L.; Zhao, T. Ecosystem water imbalances created during ecological restoration by afforestation in China, and lessons for other developing countries. J. Environ. Manag. 2016, 183, 843–849. [Google Scholar] [CrossRef] [PubMed]
  83. Liu, H.; Xu, C.; Allen, C.D.; Hartmann, H.; Wei, X.; Yakir, D.; Wu, X.; Yu, P. Nature-based framework for sustainable afforestation in global drylands under changing climate. Glob. Chang. Biol. 2022, 28, 2202–2220. [Google Scholar] [CrossRef] [PubMed]
  84. Li, B.; Zhang, W.; Li, S.; Wang, J.; Liu, G.; Xu, M. Severe depletion of available deep soil water induced by revegetation on the arid and semiarid Loess Plateau. For. Ecol. Manag. 2021, 491, 119156. [Google Scholar] [CrossRef]
  85. Ye, L.; Fang, L.; Shi, Z.; Deng, L.; Tan, W. Spatio-temporal dynamics of soil moisture driven by ‘Grain for Green’ program on the Loess Plateau, China. Agric. Ecosyst. Environ. 2019, 269, 204–214. [Google Scholar] [CrossRef]
  86. Mo, X.; Wu, J.; Wang, Q.; Zhou, H. Variations in water storage in China over recent decades from GRACE observations and GLDAS. Nat. Hazards Earth Syst. Sci. 2016, 16, 469–482. [Google Scholar] [CrossRef]
  87. Ding, Z.; Zheng, H.; Wang, J.; O’Connor, P.; Li, C.; Chen, X.; Li, R.; Ouyang, Z. Integrating top-down and bottom-up approaches improves practicality and efficiency of large-scale ecological restoration planning: Insights from a social–ecological system. Engineering 2023, 31, 50–58. [Google Scholar] [CrossRef]
  88. Li, X.; Long, D.; Scanlon, B.R.; Mann, M.E.; Li, X.; Tian, F.; Sun, Z.; Wang, G. Climate change threatens terrestrial water storage over the Tibetan Plateau. Nat. Clim. Chang. 2022, 12, 801–807. [Google Scholar] [CrossRef]
Figure 1. (a) Location of the BTSSR and spatial pattern of various land uses/covers. (b) Investment and the area restored in the BTSSR since 2001.
Remotesensing 16 01819 g001
Figure 2. Framework of the study.
Remotesensing 16 01819 g002
Figure 3. GWSA vs. the measured depth of the groundwater table at (a) Inner Mongolia Station (NMG) and (b) Erdos Station (ESD). ‘*’ indicates significance at the p-value < 0.05 level.
Remotesensing 16 01819 g003
Figure 4. (a) Combination of the NDVI and SMS trends in the BTSSR from 2001 to 2019. In the legend, ‘+’ represents a significant increase, ‘o’ denotes no significant change, and ‘−’ indicates a significant decrease; the values in the colour blocks refer to the proportion of vegetation areas occupied at the 95% confidence level, with × for nonexistent. The NDVI and SMS trends in the (b) ++ area (Type 1) and (c) +o area (Type 2) and their correlation coefficients. The green dotted line represents the trend-fit line for NDVI, and the blue dotted line represents the trend-fit line for SMS. ‘*’ indicates significance at the p-value < 0.05 level.
Remotesensing 16 01819 g004
Figure 5. Water sources for SMS in Type 1 areas and Type 2 areas. Dark green represents Type 1 areas, light green represents Type 2 areas, and the sum of the shares of the two water sources in each type area is 100%.
Remotesensing 16 01819 g005
Figure 6. Temporal trends of hydrological components in (a) Type 1 areas and (b) Type 2 areas. ‘*’ indicates significance at the p-value < 0.05 level, while ‘ns’ indicates not significant. The blue, orange, red and black dotted line represents the trend-fit line for PRE, AET, GWSA and QS, respectively.
Remotesensing 16 01819 g006
Figure 7. (a) Spatial distribution and (b) trend area proportion of groundwater storage anomaly temporal change trends. ‘*’ indicates significance at the p-value < 0.05 level.
Remotesensing 16 01819 g007
Figure 8. (a) RDA plot showing the relationship between the water storage trend (dark blue arrows) and environmental variable trend (red arrows) in drylands with restored vegetation. Different colours and shapes are used to distinguish between types: dark green spheres indicate Type 1 areas, and light green diamonds indicate Type 2 areas. RDA 1 and RDA 2 represent the first and second axes, respectively. The values in parentheses indicate the proportion (%) of significantly bounded variation accounted for by each RDA component. (b) Relationship between the initial NDVI and the SMS and GWSA trends. ‘*’ indicates significance at the p-value < 0.05 level.
Remotesensing 16 01819 g008
Figure 9. Changes in the GWSA-DSI in greened drylands, with the coloured areas representing the occurrence of groundwater drought.
Remotesensing 16 01819 g009
Table 1. Required data for this study.
Data RequirementsSpatial ResolutionTime ScaleSources
BTSSR boundary[31]
LUCC1 km1 kmRESDC
NDVI1 kmYearlyRESDC
SMS0.25°MonthlyGLDAS Noah [26]
SWES0.25°MonthlyGLDAS Noah [26]
CWS0.25°MonthlyGLDAS Noah [26]
TWSA0.25°MonthlyGRACE [27,32]
PRE0.25°MonthlyGPCC [33]
AET0.25°YearlyGLEAM [34]
QS0.25°MonthlyGLDAS Noah [26]
TEM0.25°MonthlyERA5 [35]
Abbreviations: LUCC, land use cover/change; SWES, snow water equivalent storage; CWS, canopy water storage; TWSA, terrestrial water storage anomaly; PRE, precipitation; AET, actual evaporation; QS, storm surface runoff; TEM; temperature; RESDC, Resource and Environmental Science and Data Centre (Institute of Geographic Sciences and Natural Resources Research, Chinese Academy of Science); GPCC, Global Precipitation Climatology Centre; GLEAM, Global Precipitation Climatology Centre; ERA5, European Centre for Medium-Range Weather Forecasts Reanalysis v5.
Table 2. Information on groundwater observation sites.
Station CodeStation NameEcological TypeLongitude (°)Latitude (°)Altitude (m)Mean Depth (m)
NMGInner MongoliaGrassland116.70043.63011881267
ESDOrdosDesert110.18039.48012678.090
Table 3. Information regarding vegetation and water for different area types.
Type AreaMean PRE (mm)Ecological Type (%)NDVI InitialSMS Trend (cm/yr)GWSA Trend (cm/yr)
Type 1473F:61; G:390.6450.392−1.028
Type 2407F:14; G:860.3870.090−0.829
Abbreviations: F, forest; G, grassland.
Disclaimer/Publisher’s Note: The statements, opinions and data contained in all publications are solely those of the individual author(s) and contributor(s) and not of MDPI and/or the editor(s). MDPI and/or the editor(s) disclaim responsibility for any injury to people or property resulting from any ideas, methods, instructions or products referred to in the content.

