Article

Statistical Analysis of Multi-Year South China Sea Eddies and Exploration of Eddy Classification

1
School of Marine Sciences, Nanjing University of Information Science and Technology, Nanjing 210000, China
2
School of Marine Sciences, Sun Yat-sen University, and Southern Marine Science and Engineering Guangdong Laboratory (Zhuhai), Zhuhai 519000, China
3
International Arctic Research Center, University of Alaska Fairbanks, Fairbanks, AK 99709, USA
*
Author to whom correspondence should be addressed.
Remote Sens. 2024, 16(10), 1818; https://doi.org/10.3390/rs16101818
Submission received: 16 March 2024 / Revised: 25 April 2024 / Accepted: 16 May 2024 / Published: 20 May 2024
(This article belongs to the Special Issue Recent Advances on Oceanic Mesoscale Eddies II)

Abstract

:
Mesoscale eddies are structures of seawater motion with horizontal scales of tens to hundreds of kilometers, impact depths of tens to hundreds of meters, and time scales of days to months. This study presents a statistical analysis of mesoscale eddies in the South China Sea (SCS) from 1993 to 2021 based on eddies extracted from satellite remote sensing data using the vector geometry eddy detection method. On average, about 230 eddies with a wide spatial and temporal distribution are observed each year, and the numbers of CEs (52.2%) and AEs (47.8%) are almost similar, with a significant correlation in spatial distribution. In this article, eddies with a lifetime of at least 28 days (17% of the number of total eddies) are referred to as strong eddies (SEs). The SEs in the SCS that persist for several years in similar months and locations, such as the well-known dipole eddies consisting of CEs and AEs offshore eastern Vietnam, are defined as persistent strong eddies (PSEs). SEs and PSEs affect the thermohaline structure, current field, and material and energy transport in the upper ocean. This paper is important as it names the SEs and PSEs, and the naming of eddies can facilitate research on specific major eddies and improve public understanding of mesoscale eddies as important oceanic phenomena.

1. Introduction

Ocean mesoscale eddies are widespread oceanic phenomena characterized by a closed circulation, with spatial scales of a few kilometers to hundreds of kilometers and temporal scales of a few days to several months [1,2]. Mesoscale eddies carry a large amount of kinetic energy from the entire upper ocean and play an important role in the exchange of energy [3]. Mesoscale eddies directly affect the thermohaline structure and distribution of flow velocities in oceans. They facilitate the transport of heat and mass in oceans, providing important nutrients to coastal zones and ocean surfaces, which, in turn, affects ecosystems, biological processes, and fisheries [3,4,5].
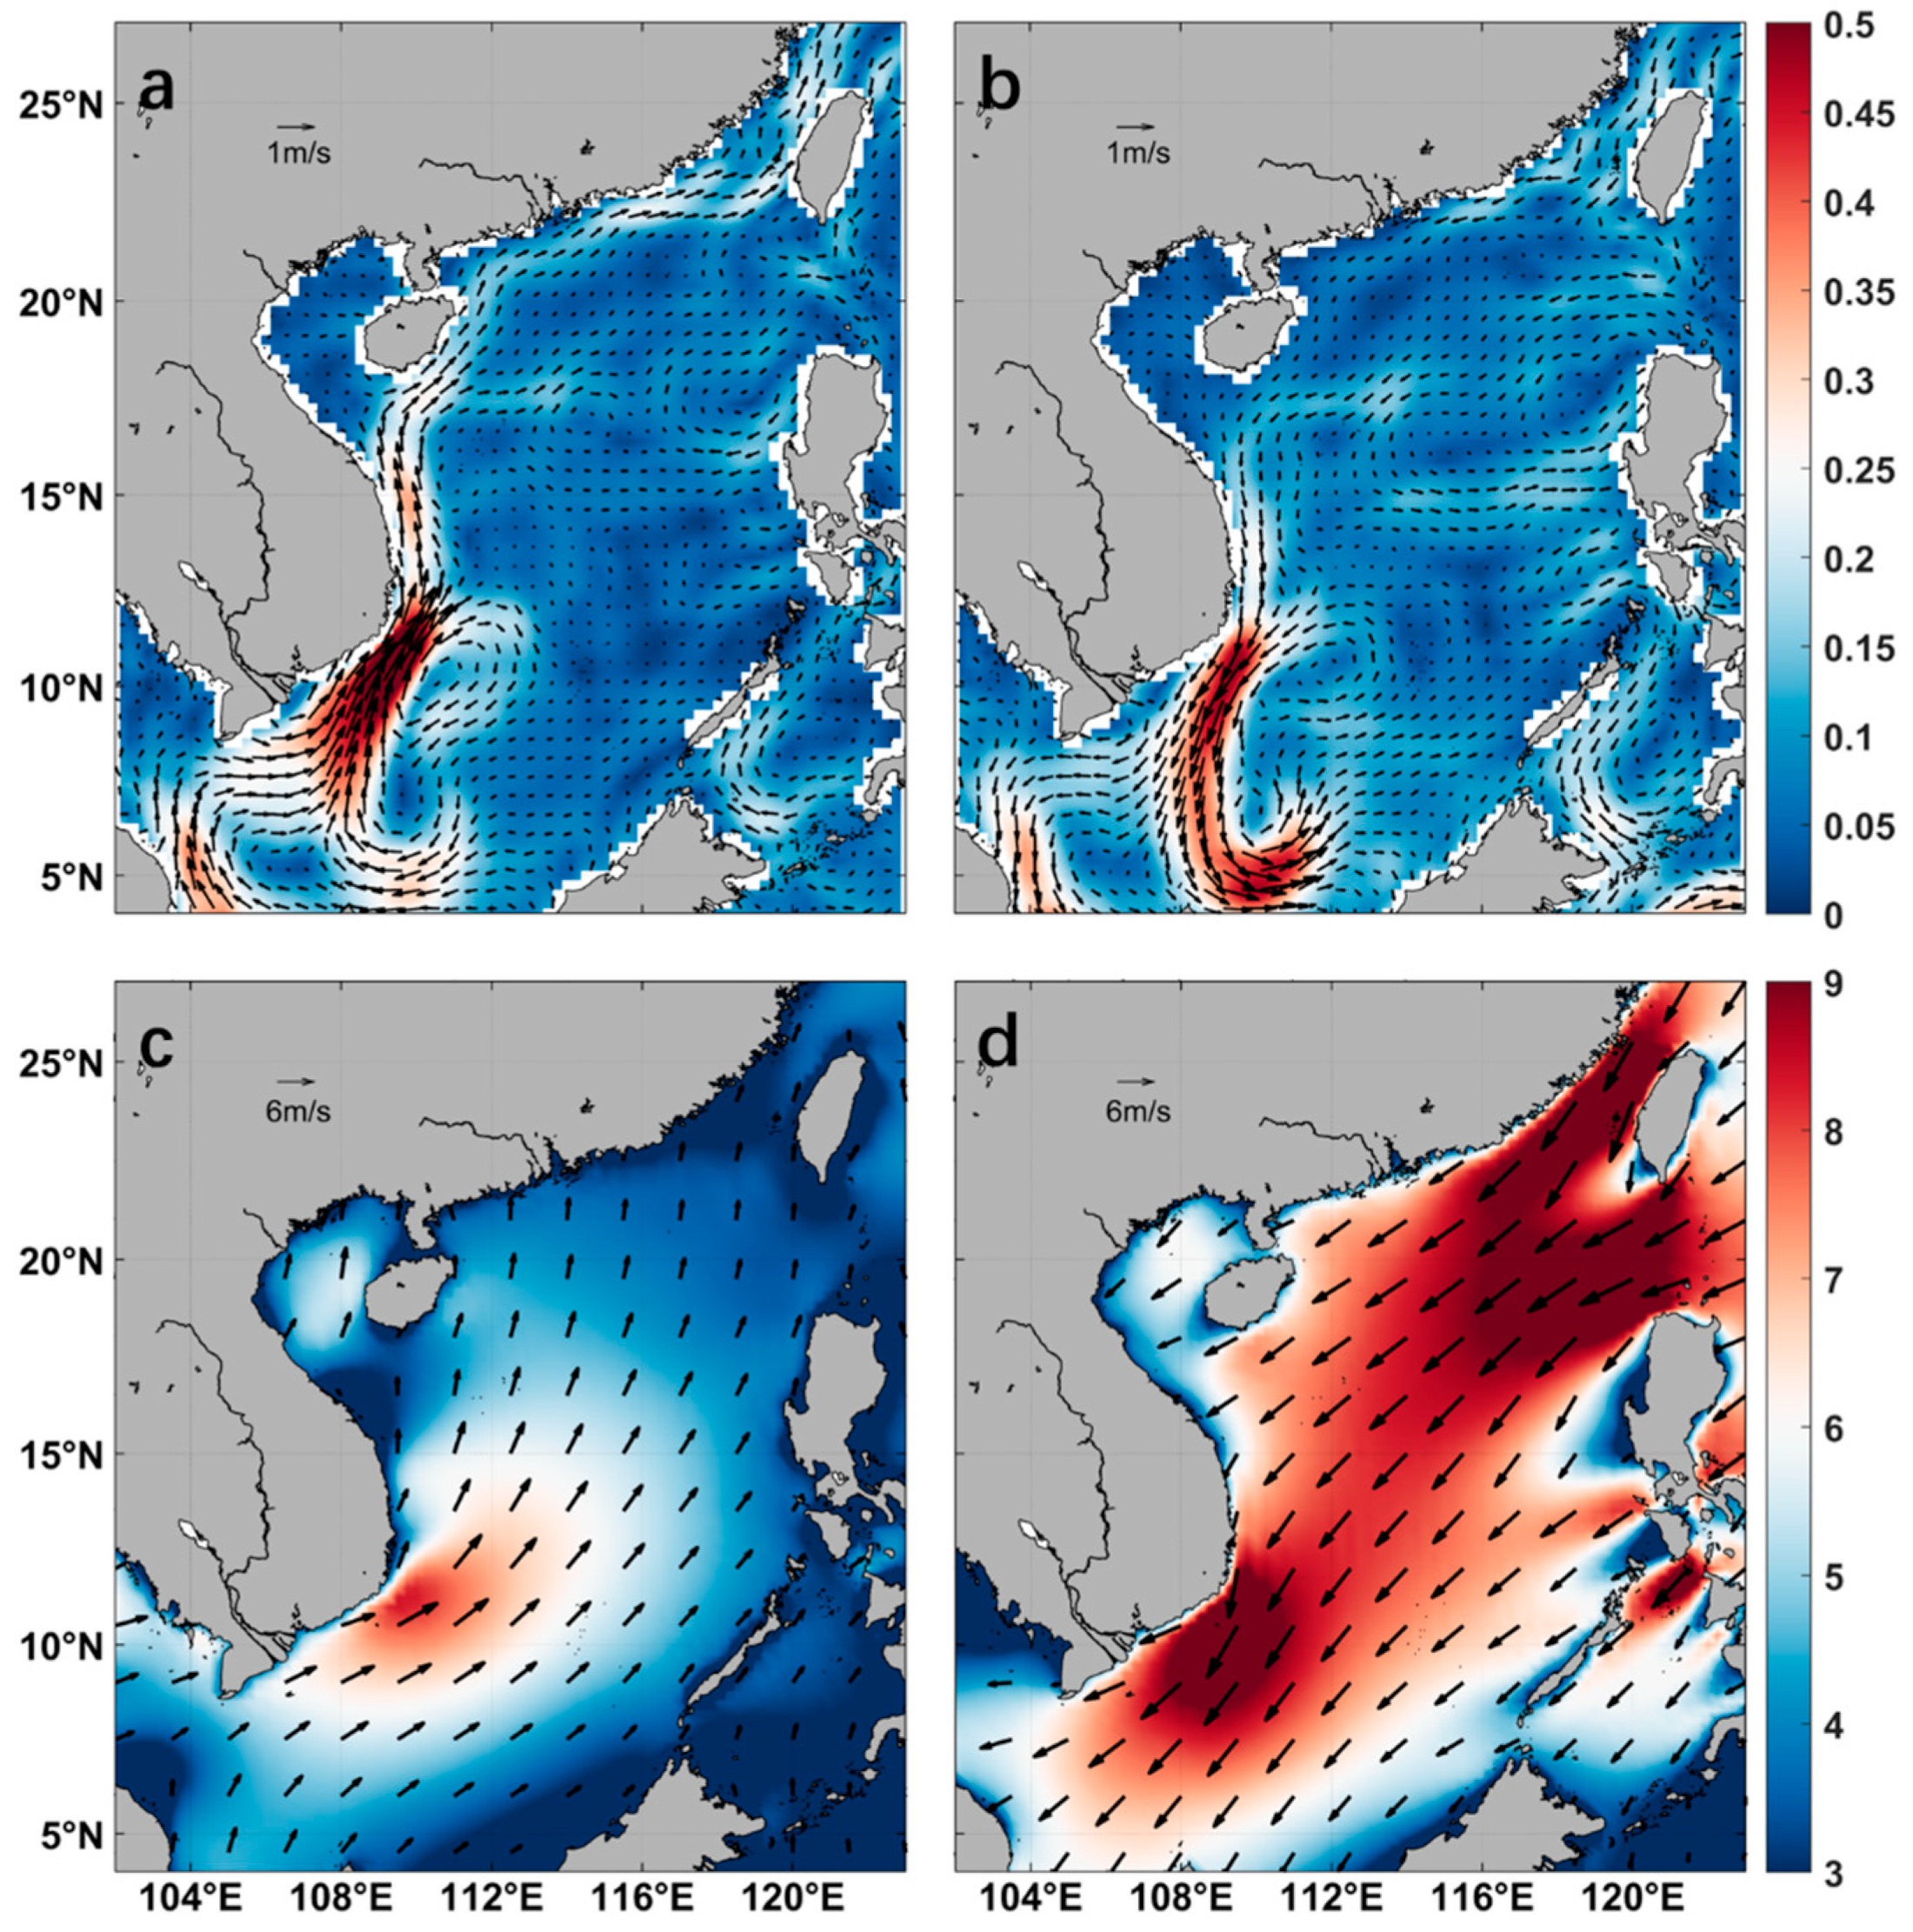
The South China Sea (SCS) is the largest and deepest semi-enclosed marginal sea (Figure 1) in the northwest Pacific Ocean, and it is connected to the Pacific Ocean in the northeast and the Indian Ocean in the southwest through narrow straits or channels [6]. The SCS covers an area of about 3.5 million square kilometers; it is shallow around the perimeter and deep in the middle. The average depth is 1212 m, with the deepest point reaching 5559 m. Numerous reef shoals are scattered in the SCS, and the seafloor topography is complex and diverse [7]. The SCS circulation shows a clear western intensification (Figure 2), where the upper ocean circulation is mainly driven by the East Asian monsoon, with northeasterly winds in the winter (November–March) and southwesterly winds in the summer (June–September), and seasonal alternations occurring in the April–May and October–November periods. Its northern part is also affected by the Kuroshio intrusion [8,9,10,11].
Since the establishment of the Mid-Latitude Ocean Dynamics Experiment in the 1970s by a multinational team of scientists, many scientists have begun to study mesoscale eddies using a variety of methods [5]. In recent years, with the development of ocean satellite remote sensing technology, multiple in situ observations, and the wide application of numerical reanalysis data, the study of mesoscale eddies in the SCS has been pushed forward [12,13,14]. Detecting mesoscale eddies is difficult since the shapes of eddies are not perfectly circular [15,16]. Currently, the common methods for detecting mesoscale eddies are the Okubo–Weiss (O-W) function method [17,18], the winding angle method [19,20], the two-dimensional vector geometry feature method [21,22,23,24,25], and the artificial intelligence identification method [26]. Xiu et al. [18] detected SCS eddies from 1993 to 2007 based on the O-W function method and found an average of 32.8 eddies per year for eddies with lifetimes of at least 28 days. About 53% of them were cyclonic eddies (CEs). The radius (size) of these eddies ranged from about 46.5 to 223.5 km, with a mean value of 87.4 km. Based on satellite altimetry data from 1992 to 2009, Chen et al. [20] used the winding angle method to detect SCS eddies with lifetimes of at least 28 days. They reported an annual mean number of 48 eddies, a mean lifetime of 62 days, and a mean radius of 132 km. Li et al. [23] used a vector geometry eddy detection method to compare the 2011 eddies identified using SLA and SST data in the SCS and tracked and analyzed the eddies. A total of 273 and 11 eddies with lifetimes of at least 7 days were detected using Sea Level Anomaly (SLA) and Sea Surface Temperature (SST) data, respectively. In addition, the eddies detected using SLA data had longer lifetimes and larger sizes than those detected using SST. Different data and methods used for detecting mesoscale eddies in the SCS have led to differences in the number of eddies, lifetimes, and boundaries [16].
Different intensities of eddies have varying impacts on the surrounding seawater. Research on eddies is limited to the oceanographic community, and information about eddies is not widely known by the public. The systematic classification and naming of eddies based on their lifetimes, intensity, and consistency is beneficial for the future development of deep-sea activities in the SCS. In scientific research, the classification of eddies helps different researchers to distinguish and pay more attention to eddies with longer lifespans, more energy, and greater impact on surrounding oceans. The classification of eddies can also promote the outreach of the scientific knowledge of ocean eddies to the general public, and that information is helpful for fisheries, tourism, navigation industries, resource exploration, oil and gas extraction, and other actions in the SCS.
The remainder of this paper is structured as follows: Section 2 describes the dataset and the methodology, Section 3 describes the SCS eddy statistics and naming methodology, Section 4 presents the discussion, and Section 5 draws the conclusions.

2. Materials and Methods

2.1. Materials

This study uses a time-lapse grid data product fused from multiple altimetric satellites provided by the Archiving, Validation and Interpretation of Satellite Oceanographic (AVISO) to identify and track eddies. One of the advantages of this satellite dataset is the improved observation of mesoscale phenomena in the global ocean [27]. This study uses sea level anomaly (SLA) and geostrophic current data acquired from SLA data from 1993 to 2021, with a temporal resolution of 1 day and a spatial resolution of 0.25° × 0.25°. Data can be acquired at http://cds.climate.copernicus.en/ (accessed on 1 October 2023).
Sea surface temperature (SST) data are acquired from the Advanced Very High Resolution Radiometer (AVHRR) for the 1993–2021 period, with a temporal resolution of 1 day and a spatial resolution of 0.25° × 0.25°. Data can be acquired at https://www.ncei.noaa.gov/ (accessed on 10 October 2023).
Wind field data are acquired using ERA5 from 1940 to the present. The data used in this study have a temporal resolution of 1 h, spanning the 1993–2021 period, and a spatial resolution of 0.25° × 0.25°. Data can be acquired at https://climate.copernicus.eu/ (accessed on 1 November 2023).

2.2. Eddy Detection Method

The eddy detection method in this study is based on velocity vectors [21] and is used to detect and track mesoscale eddies. An eddy, as a physical derivative rather than a real ocean observation, can indeed yield different results using different eddy detection methods. The Euler algorithm has been validated in multiple regions, including the SCS, the Bay of Bengal, the subtropical countercurrent zone, the Gulf Current, North Pacific Ocean, Southern Ocean, and the Tasman Sea [6,12,23,24,28,29,30,31,32,33,34,35,36,37,38,39]. Compared with the Okubo–Weiss (O-W) function method and angle winding method, the Euler vector geometry eddy detection method can achieve a higher success of detection rate and a lower excess of detection rate [28]. The Lagrangian method can better reveal long-range material transport and coherence in unsteady flows [39].
Eddy detection and tracking can be divided into three steps: (1) determining the eddy center, (2) determining the eddy boundary, and (3) determining the eddy trajectory. The determination of the eddy center must satisfy four constraints [37,38]. Two parameters, A and B, are determined to detect the eddy minimum size and adapt the algorithm to meshes of different resolutions. In this study, A = 4 and B = 2. The eddy boundary is determined by defining the outermost closed curve around the eddy center [5]. The eddy radius (size) is defined as the average distance from the boundary point to the eddy’s center [21]. The eddy trajectory is determined by comparing the eddy centers at continuous time steps [21]. Based on this eddy detection method, a dataset including the center position, radius, lifetime, and eddy boundary of the SCS eddies is obtained.
The automatic eddy detection method proposed by Nencioli et al. [21] was evaluated by comparing results with a mesoscale eddy expert identification library (where experts manually identify detected eddy data based on flow field data). They found a success of detection rate (SDR) of over 90% and an excess of detection rate (EDR) of less than 10% in different regions of the global ocean. In the region used in this study, the calculated SDR and EDR are 96.7% and 7.2%, which shows that the method has an accuracy as good as or even better than that obtained by Nencioli et al. [21], and these results are also similar to the results obtained by Yang et al. [40] in the SCS (EDR ≈ 11.4%, SDR ≈ 95.9%).

2.3. Eddy Characteristics

SLA data from satellite altimeter were used to derive geostrophic velocity anomalies (m/s) as follows [38]:
u g = g f h y
v g = g f h x
where h′ is the SLA, and g and f are the gravitational acceleration and Coriolis parameters, respectively. EKE, the relative vorticity (ζ), and the deformation rate of an eddy are calculated using altimeter data to study the energy and shape evolution of the eddy during its lifetime. EKE is defined as the average EKE (unit: m2/s2) in the eddy region [38] and is expressed as follows:
EKE = 1 2 ( u g 2 + v g 2 )
ζ (unit: s−1) characterizes the rotational properties of the velocity field and is defined as the average relative vorticity in the eddy region, and it is calculated as follows [38]:
  ζ = v g x u g y
Theoretically, the vorticity is at its maximum at the center and gradually decreases to reach 0 at the eddy boundary. The average vorticity within the eddy boundary characterizes the eddy’s vorticity.

3. Results

3.1. Eddy Statistical Analysis

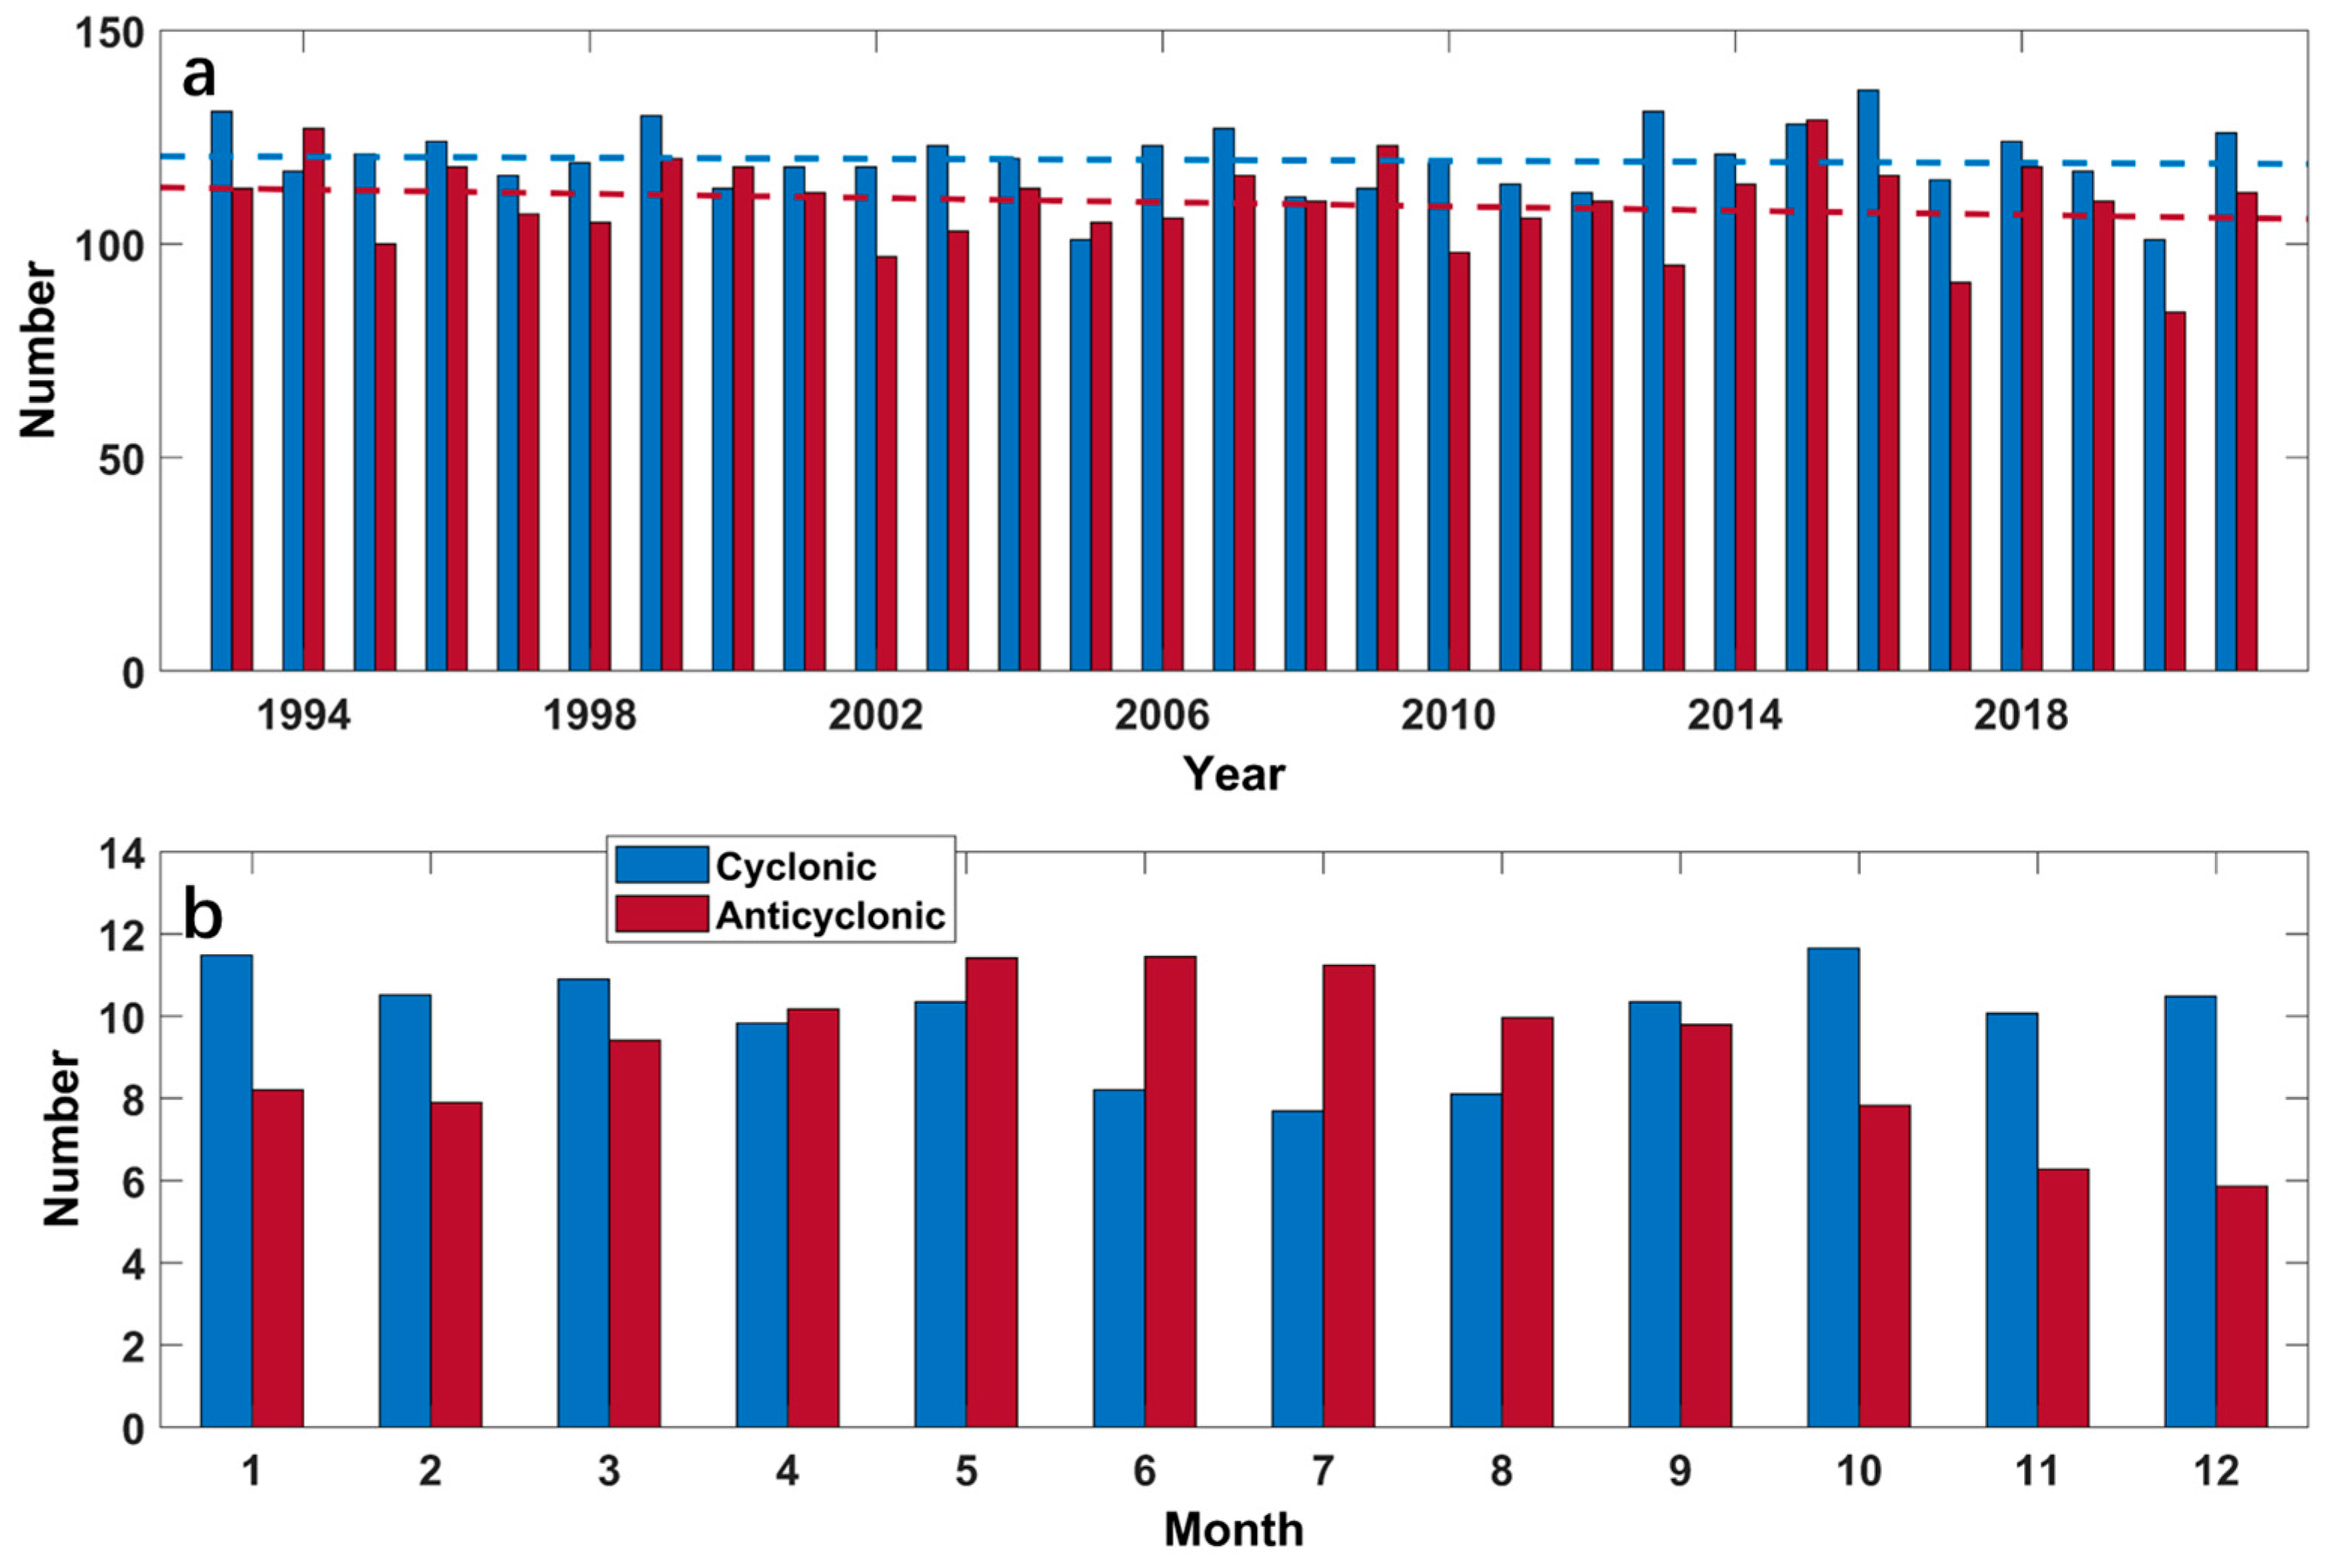
A remote sensing dataset, including multi-year eddy-related information (lifetime, radius, center position, and boundary), is derived from the AVISO geostrophic current data during the 1993–2021 period using the vector geometry eddy detection method. Based on this dataset, eddies with lifetimes of at least 7 days are statistically analyzed to determine the number and intensity of eddies [23]. On average, about 230 eddies are observed by satellite each year (Figure 3a). The interannual variability in the number of eddies is relatively small, with the highest (lowest) number of eddies being generated in 2015 (2020), specifically 257 (185) eddies. The numbers of cyclonic eddies (CEs) and anticyclonic eddies (AEs) per year are similar, with an average of 120 (52.2%) CEs and 110 (47.8%) AEs, agreeing with Xiu’s [18] statistic of 53% CEs from 1993 to 2007. There is a small decreasing trend in the annual change in the number for the generation of CEs (AEs), with the number of AEs decreasing more rapidly. The values of the slope in the trend of CEs (AEs) are −0.06 (−0.25) (number of eddies/year), and neither the CE nor AE trends (r2 = 0.085 and 0.071) were statistically significant. There are noticeable seasonal variations in eddy generation (Figure 3b). On average, 10 CEs (9 AEs) were generated per month during the 1993–2021 period. The number of AEs is higher than that of CEs in the April–August period, and the number of CEs is higher than that of AEs in the January-March and September–December periods. The winter (summer) is favorable for the generation of CEs (AEs), which is consistent with the results obtained by Lin et al. [12] and Zeng et al. [16]. Here, winter is in December, January, and February, and summer is in the June–August period.
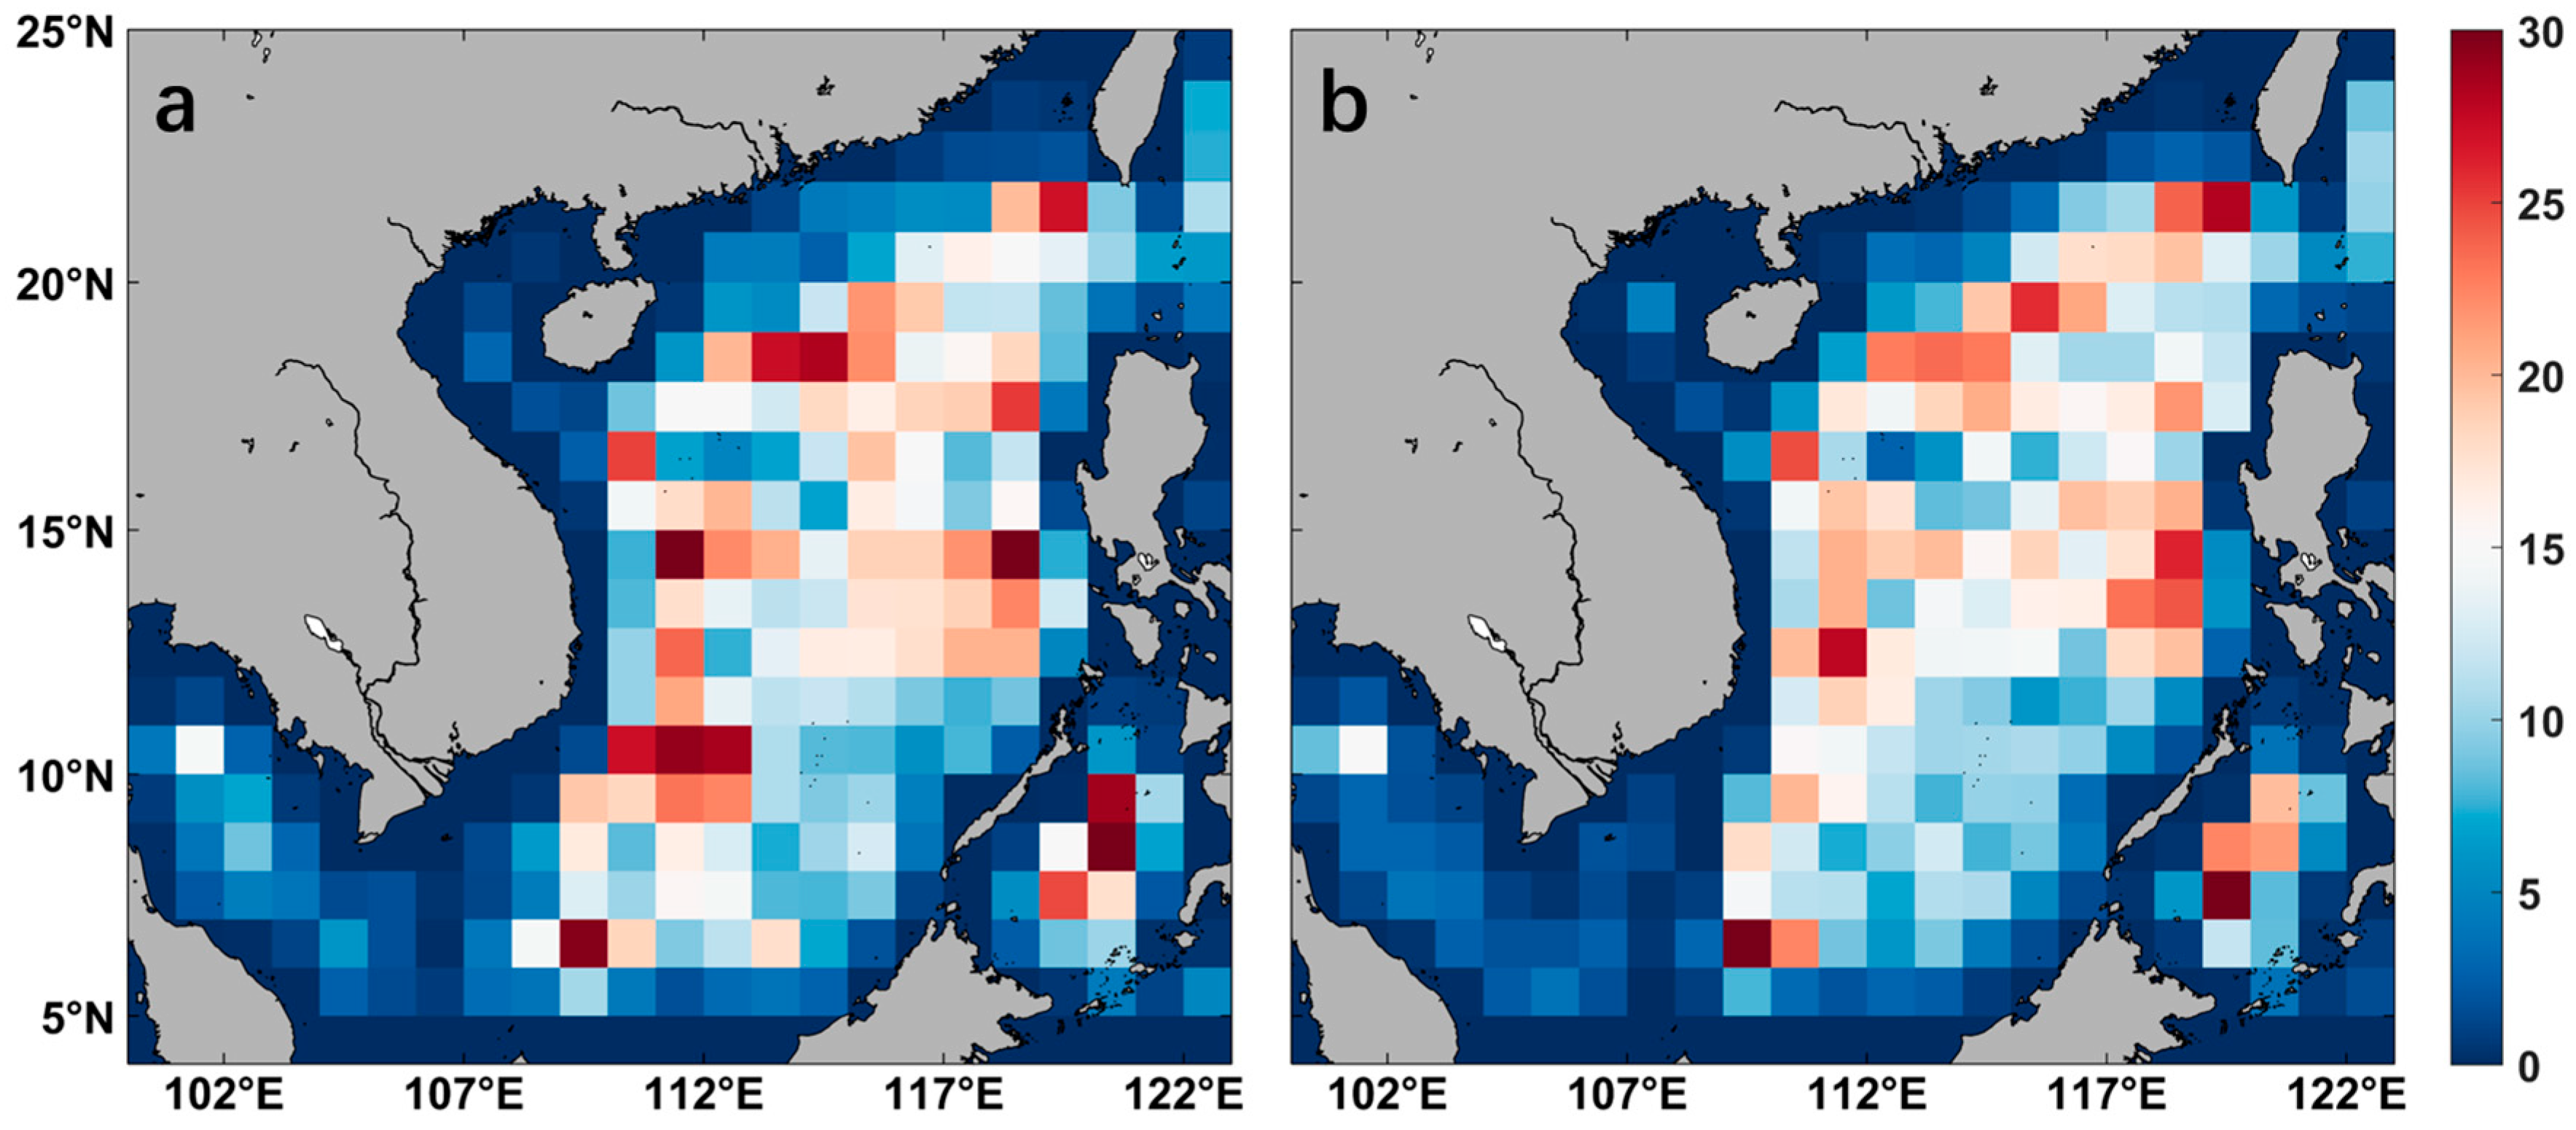
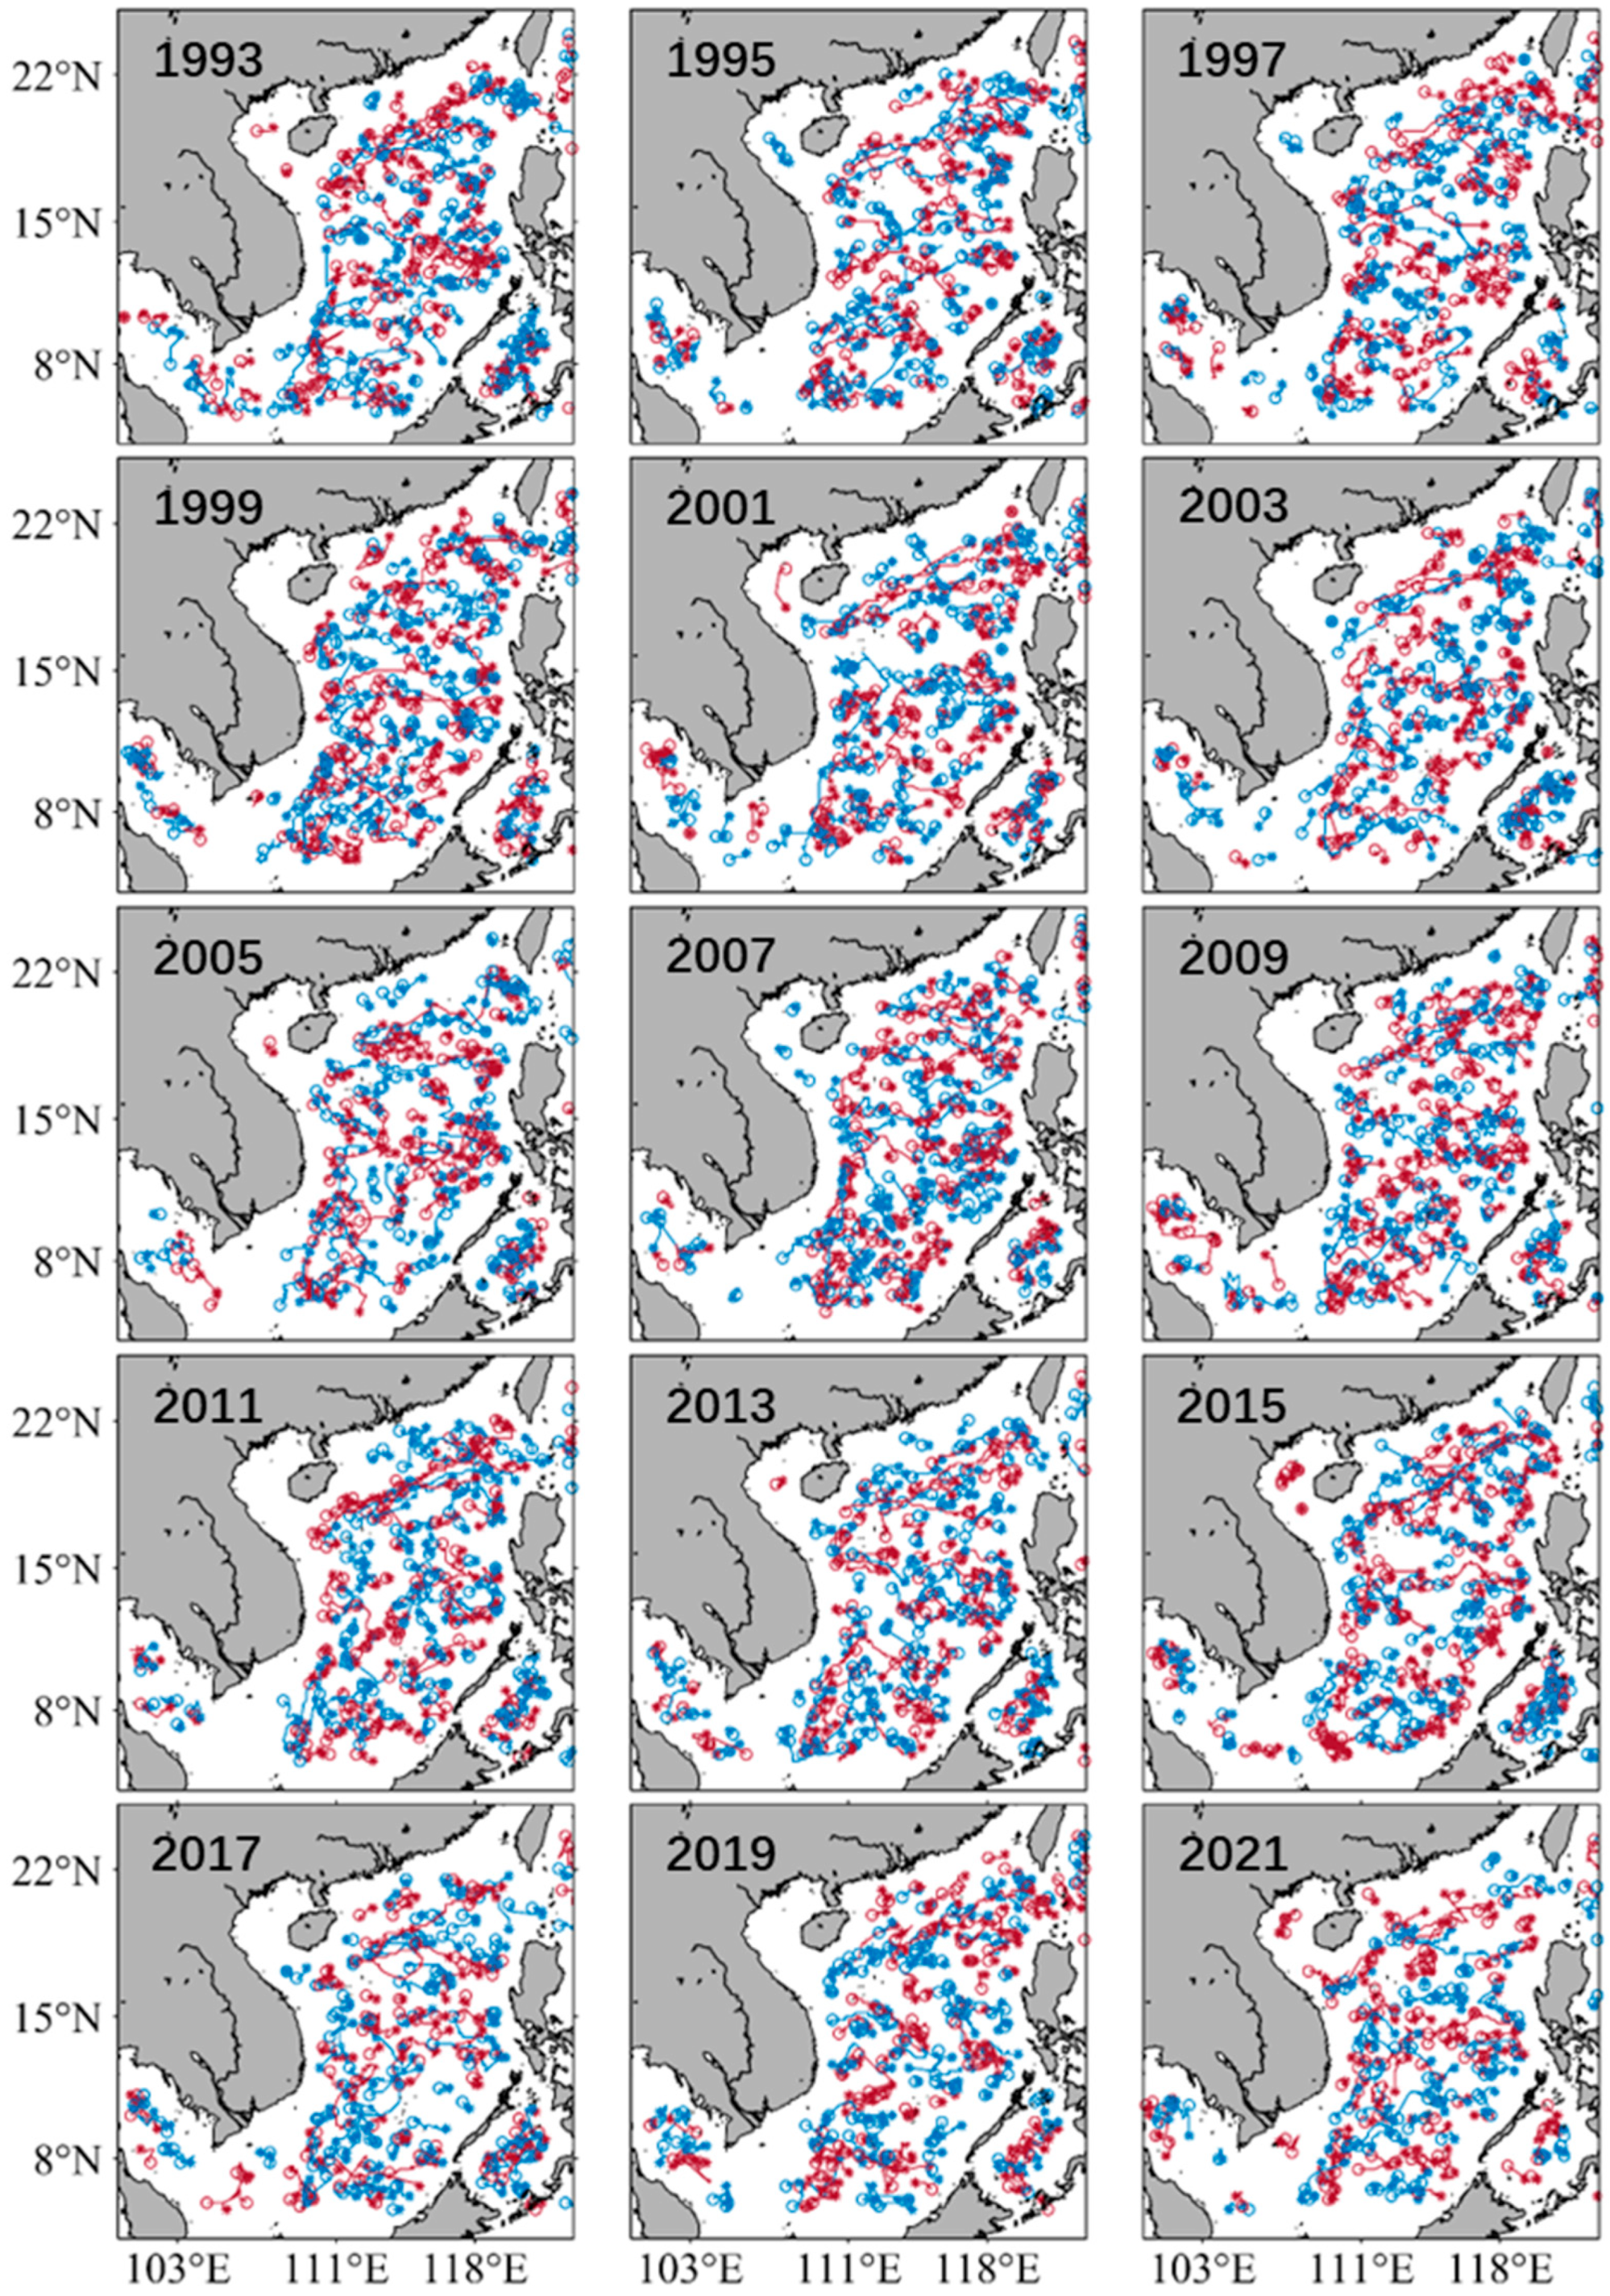
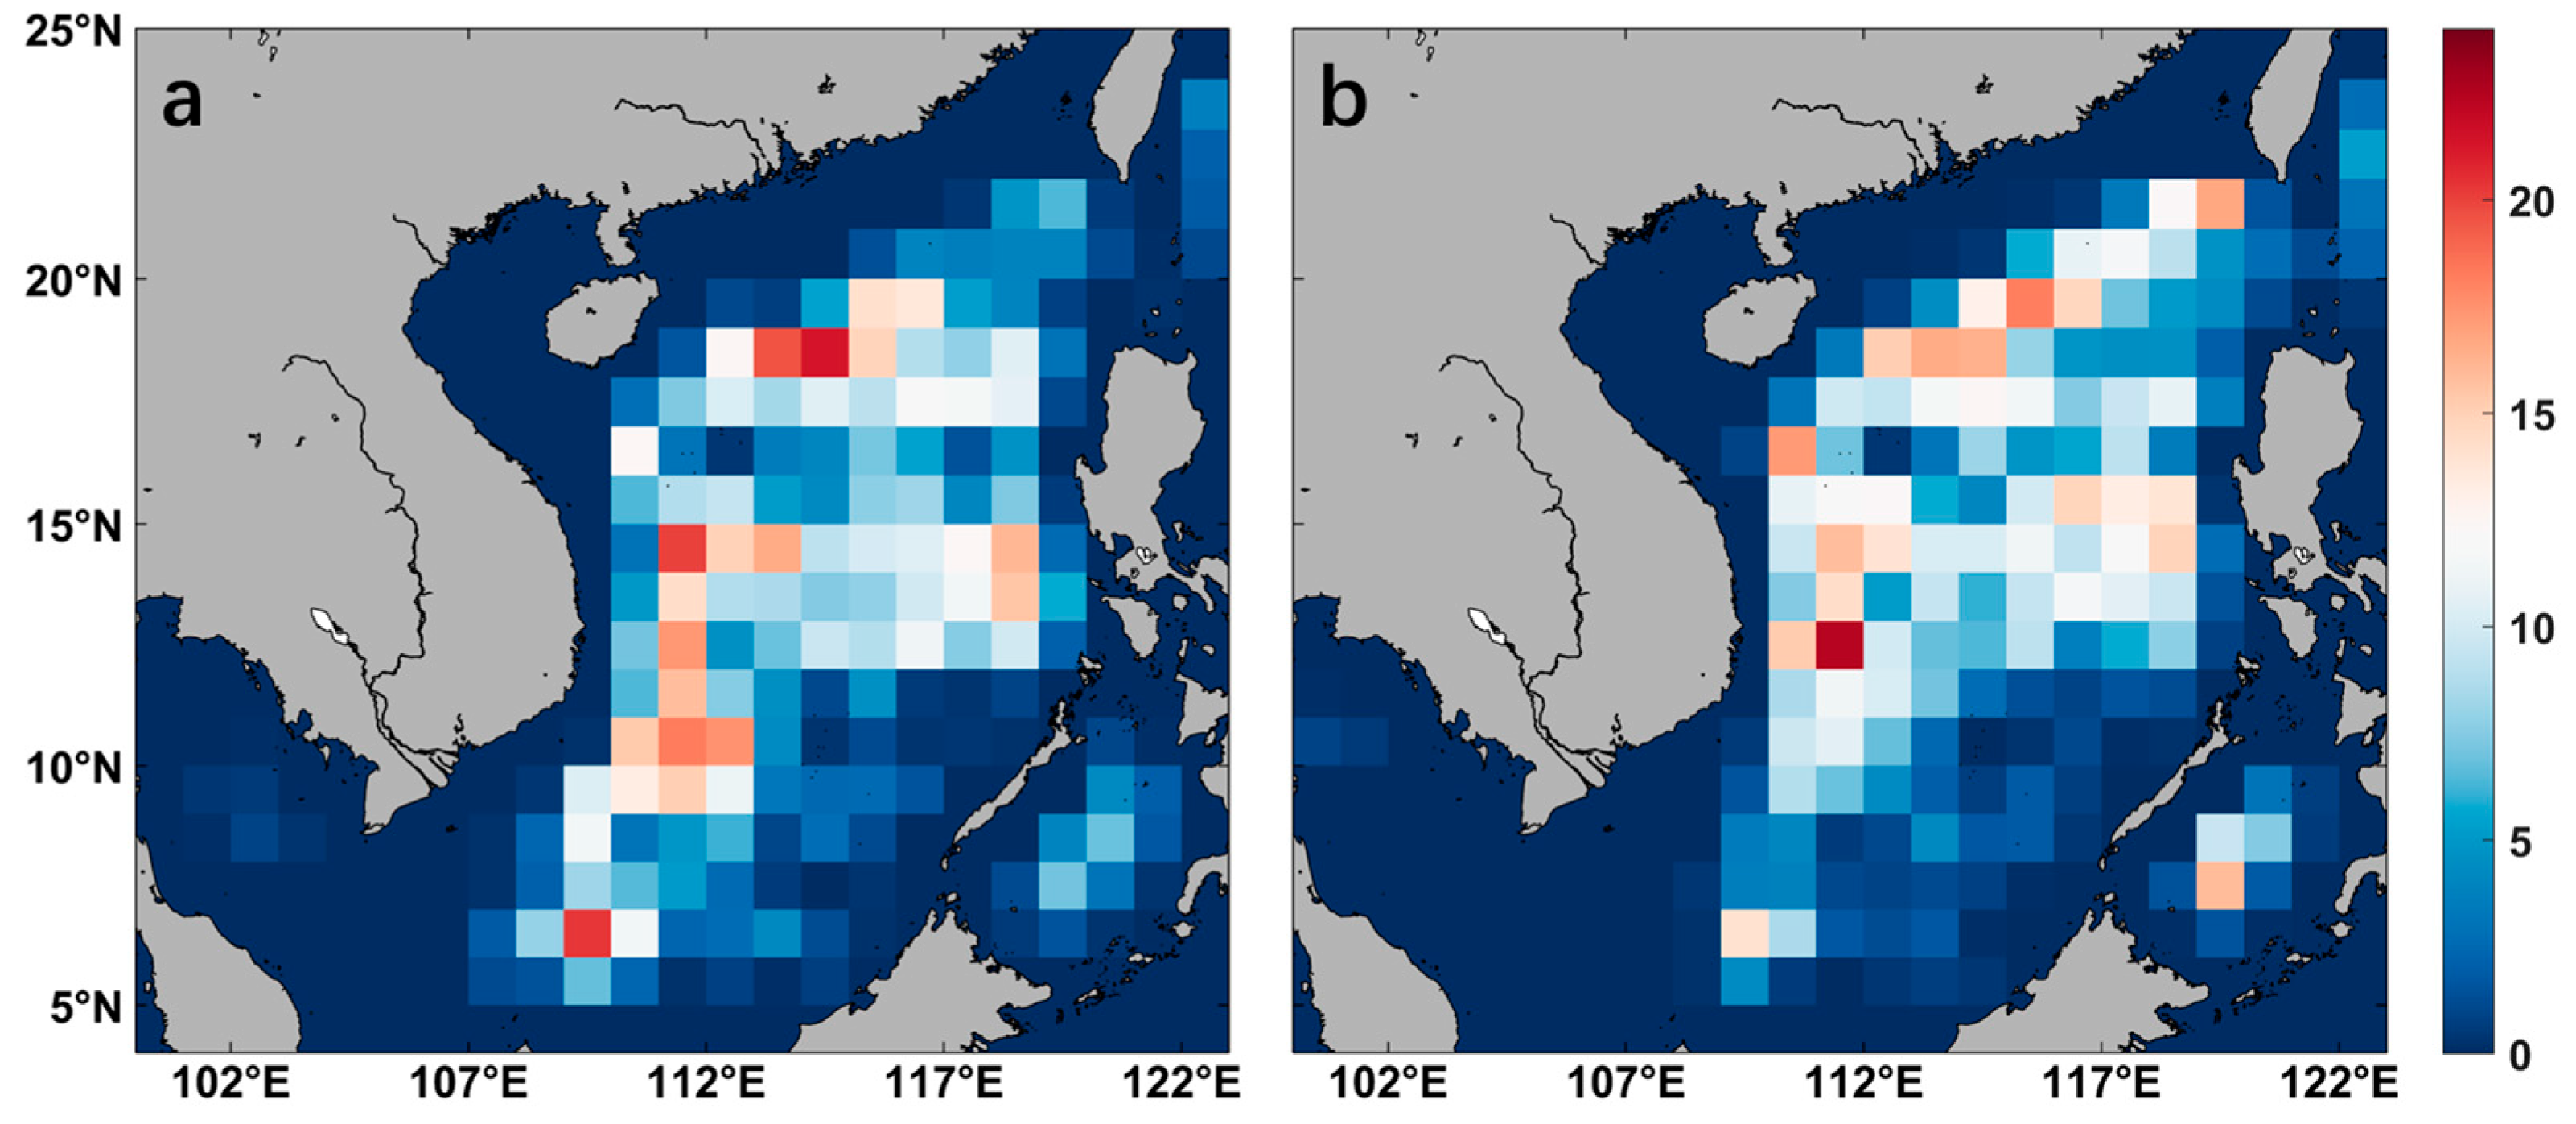
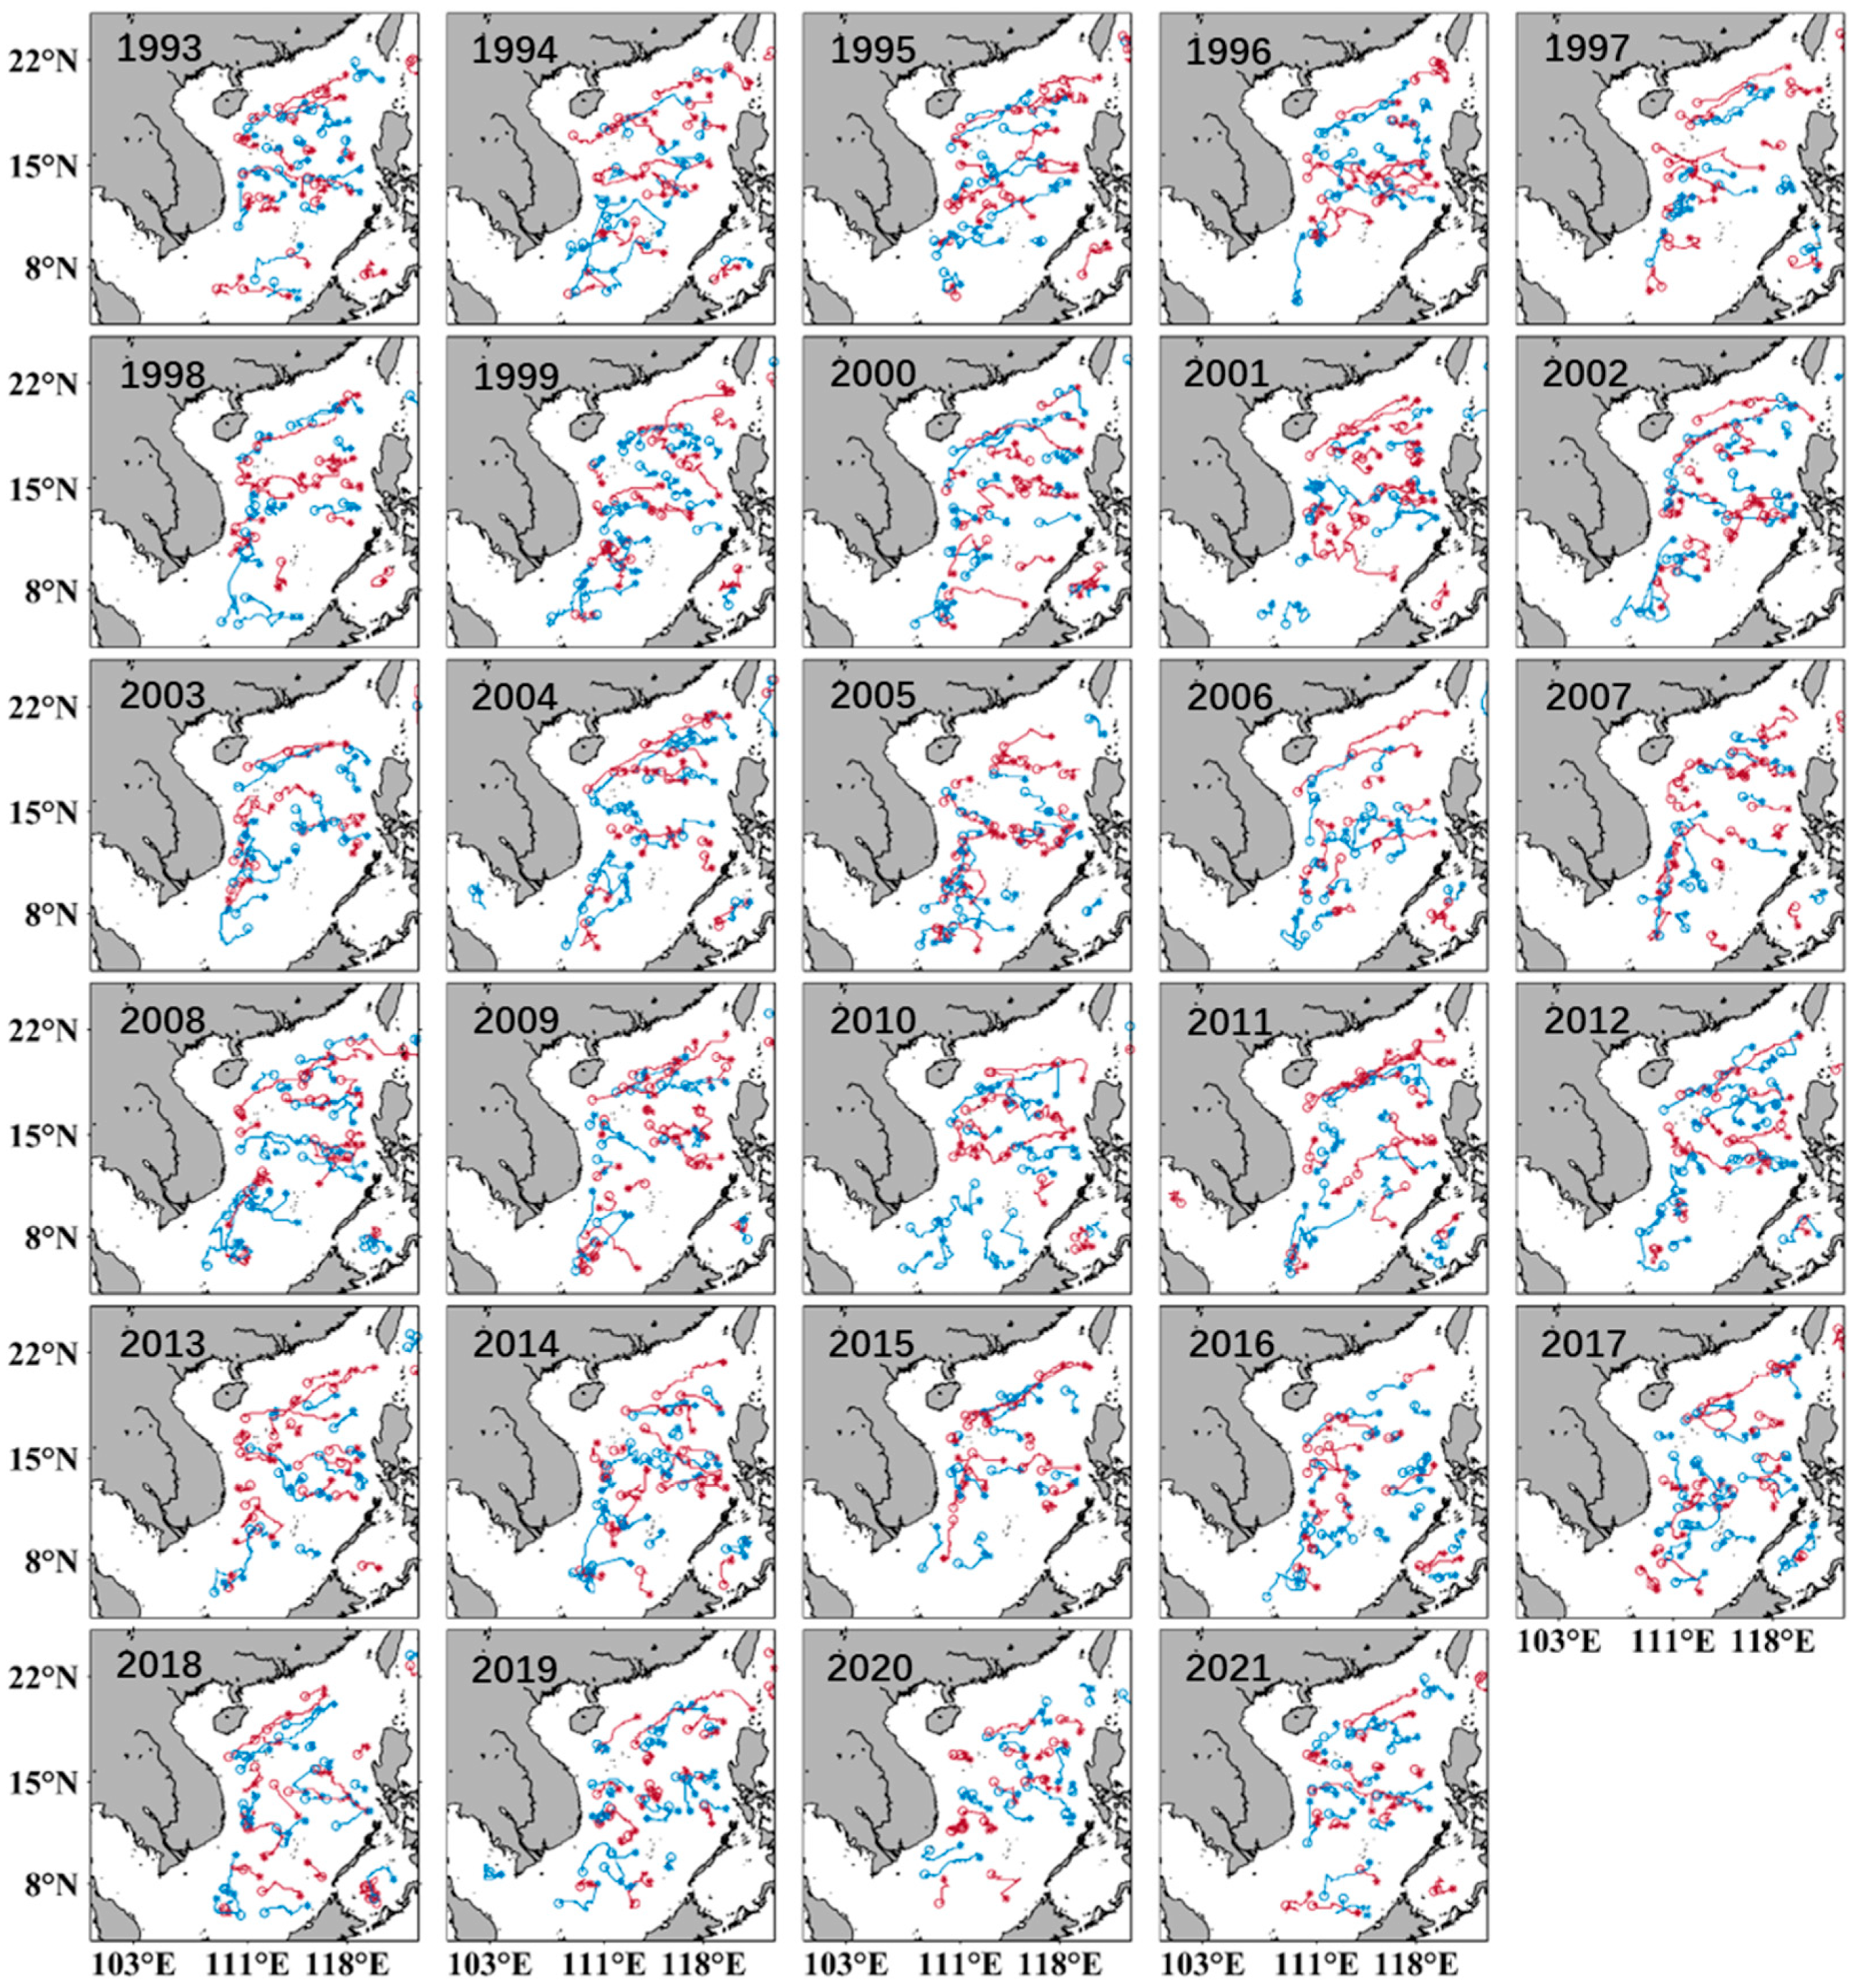
To further understand the distribution of eddies in different regions, the position of the eddy center is counted during the 1993–2021 period (Figure 4). Eddies in each grid point based on their center locations on each day of the 1993–2021 period are screened out [38]. The spatial distributions of CEs and AEs are similar, and both are concentrated in the central region of the SCS (112–118°E, 10–20°N). With reference to the bathymetric map of the SCS (Figure 1), the number of eddies on the continental shelf is the highest, followed by the sea basin, and the number in the nearshore is the lowest. A correlation analysis was conducted between the distribution of CEs (AEs) and water depth. The deeper the seawater, the greater the distribution of CE and AE quantities (r = 0.54 and 0.53, p < 0.05). The annual eddy trajectories for the 1993–2021 period are displayed in Figure 5. The eddies are scattered in the central part of the SCS, and most (73.0%) propagate westward, regardless of eddy polarity (CEs account for 73.1% of the total; AEs account for 72.8% of the total), consistent with Chen et al.’s [20] statistics. This propagation direction may be due to the westward intensification of the SCS circulations and the Kuroshio intrusion from the north [8,9,41].
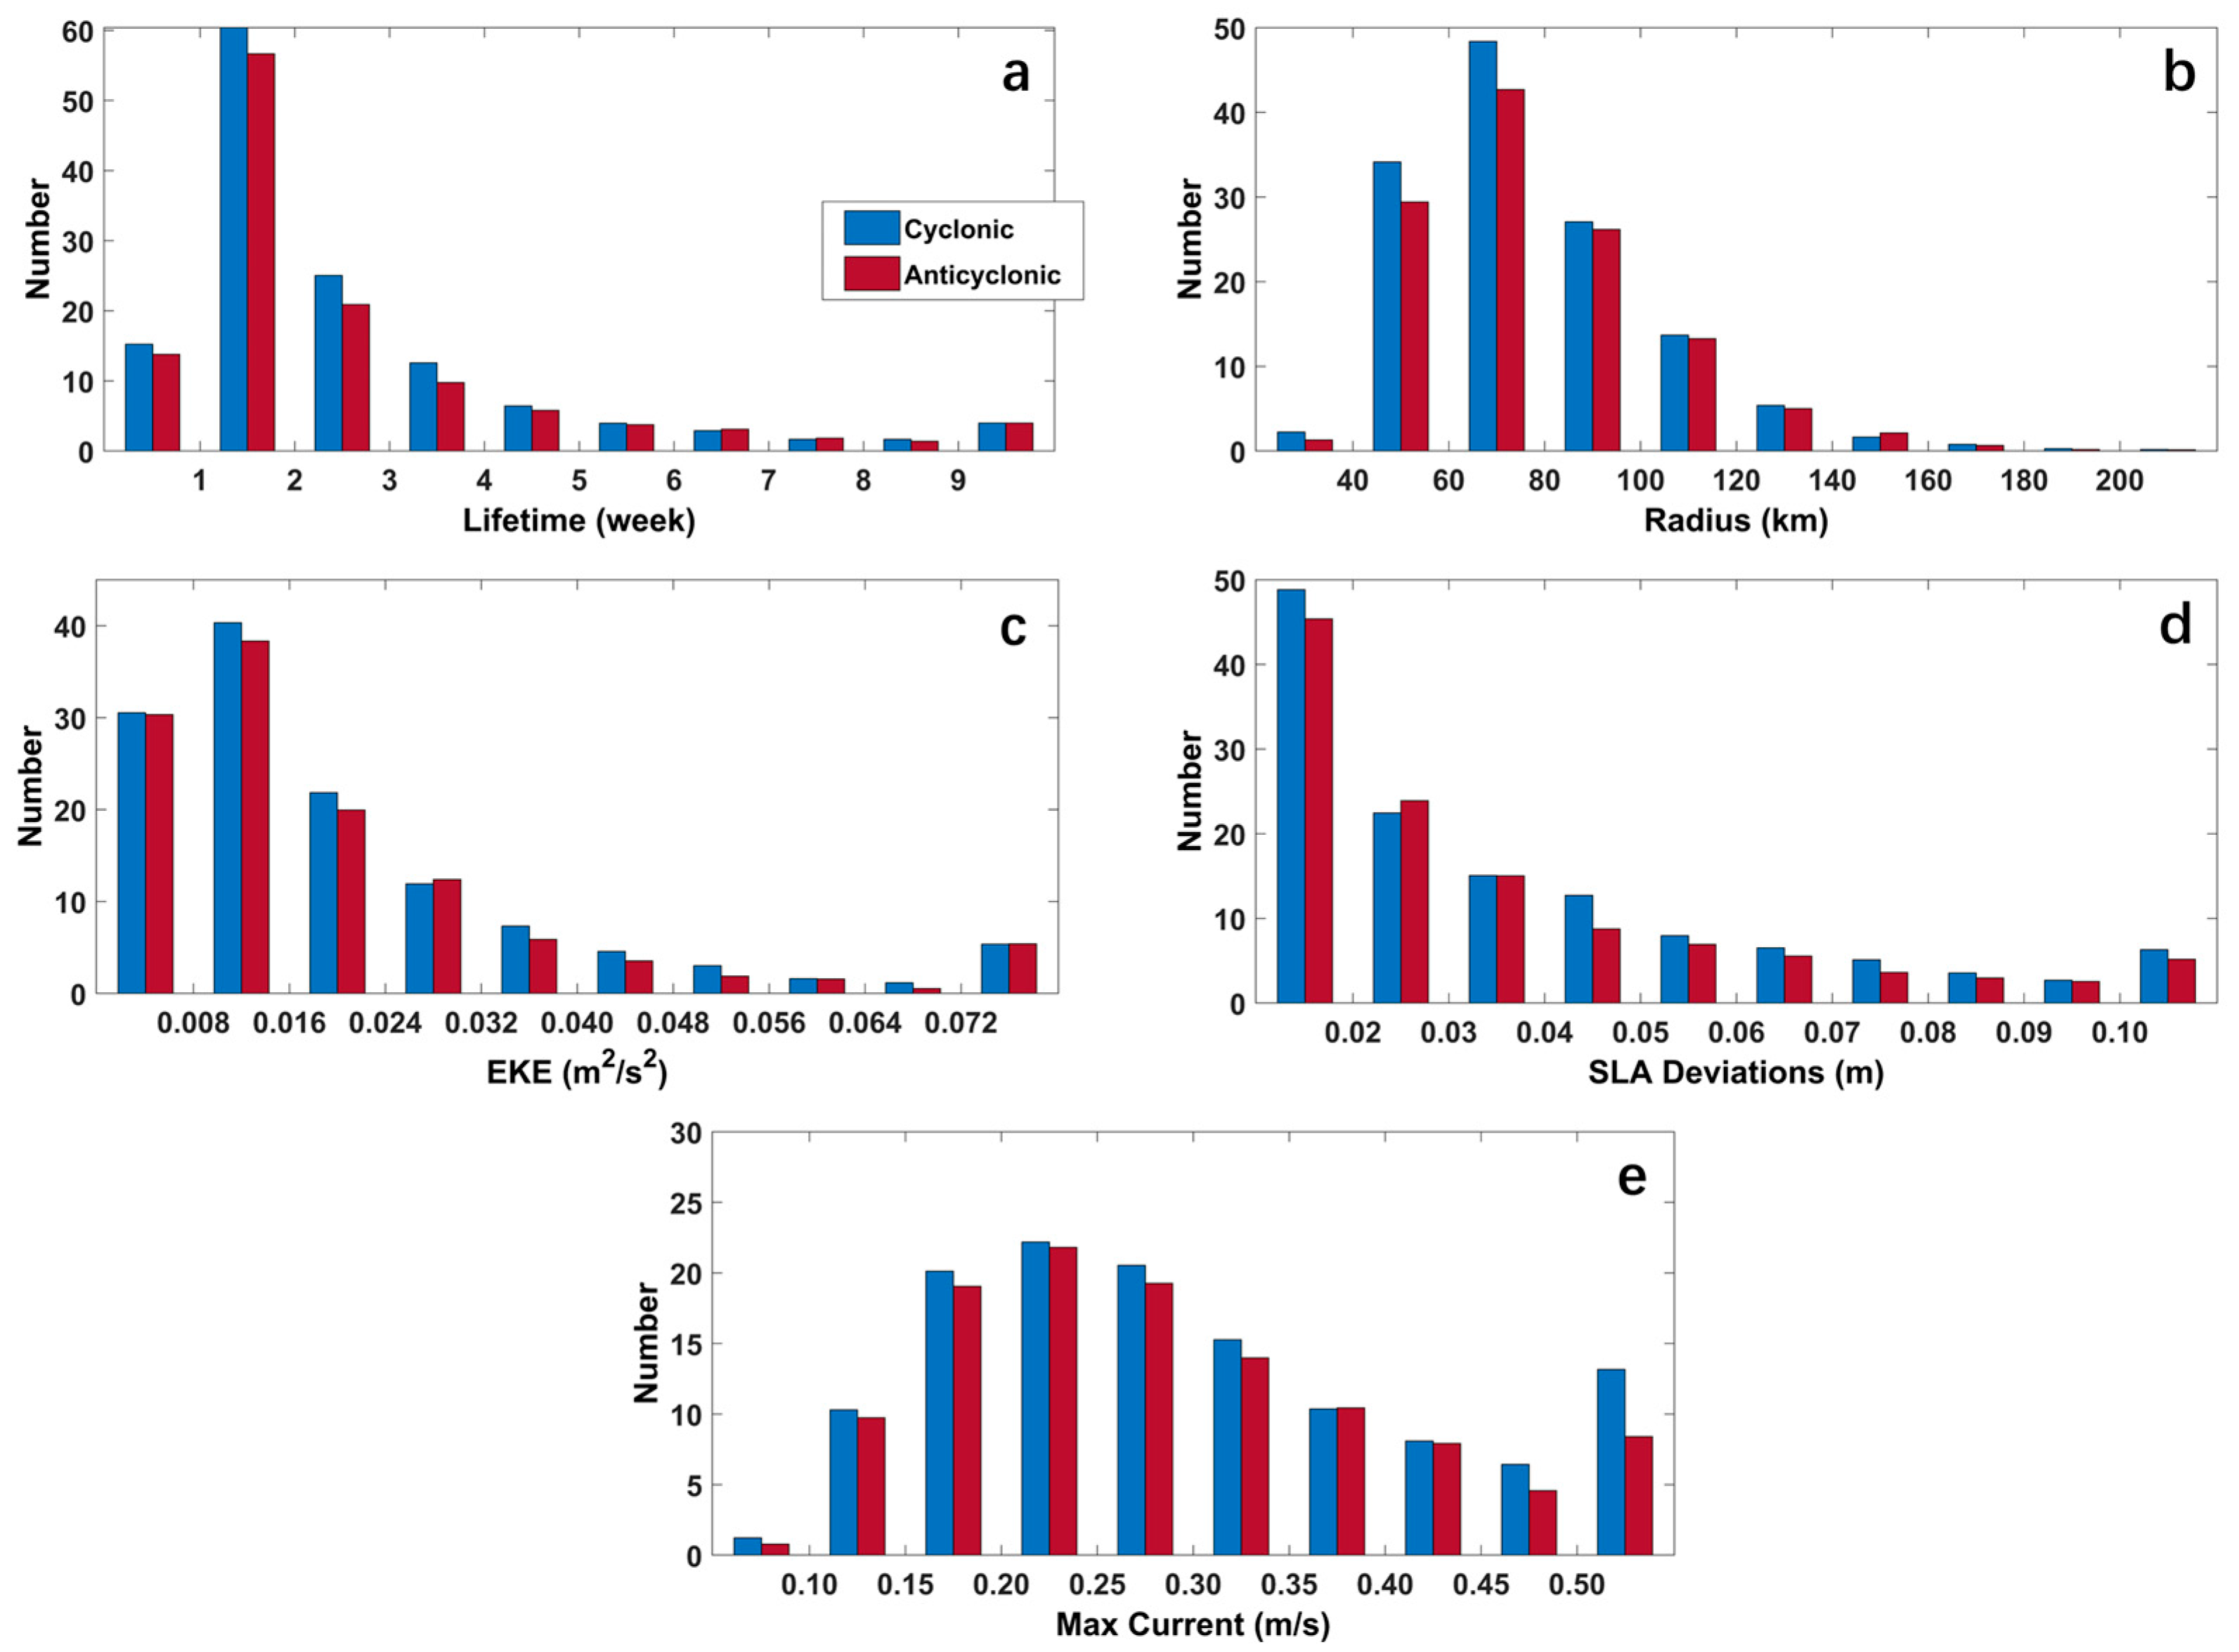
So, which eddies should be named? An average of about 230 eddies are generated in the SCS each year, but most decay quickly after generation and have a small impact on the surrounding sea water and energy exchange [20]. So, naming all of the eddies is cumbersome and of little significance. We divided the intensity of eddies to selectively carry out eddy naming efforts. The eddy lifetime, radius, EKE, SLA deviation, and maximum current speed of an eddy all characterize an eddy’s intensity. The SLA deviation is calculated by subtracting the SLA minimum from the SLA maximum within the detected eddy and the maximum current speed is the maximum current speed within the eddy boundary. Figure 6 shows the distribution of the number of eddies with different lifetimes (days ≥ 7), radius values (km), EKE values (m2/s2), SLA deviations (m), and maximum current speeds (m/s). The number of eddies with lifetimes in the 2–3 week range is the highest (64.0%) in the 1993–2021 period (Figure 6a). The number of eddies decreases as the lifetime increases. On average, about 40 eddies with a lifetime of at least 28 days are observed per year, accounting for about 17% of the total number of eddies, with the number of CEs (51.0%) being roughly equal to the number of AEs (49.0%). Eddies with a radius of 60–100 km account for about 81.6% of the total number of eddies (Figure 6b), with the highest number of eddies (35.7%) having radiuses of 60–80 km. The number of CEs (53.1%) is slightly larger than that of AEs (46.9%). EKE is concentrated in the range of less than 0.24 m2/s2 (Figure 6c). The numbers of CEs (51.5%) and AEs (48.5%) in the same EKE range are approximately the same. The number of eddies with SLA deviations less than 0.02 m is the highest (Figure 6d), accounting for 37.5% of the total number of eddies, and the number of eddies decreases with decreasing SLA deviations. The number of CEs (53.1%) is slightly larger than that of AEs (46.9%). The number of eddies with a maximum current speed of less than 0.02 m/s is the highest (Figure 6e), accounting for 37.5% of the total number of eddies, and the numbers of CE (52.3%) and AE (47.7%) are approximately equal.
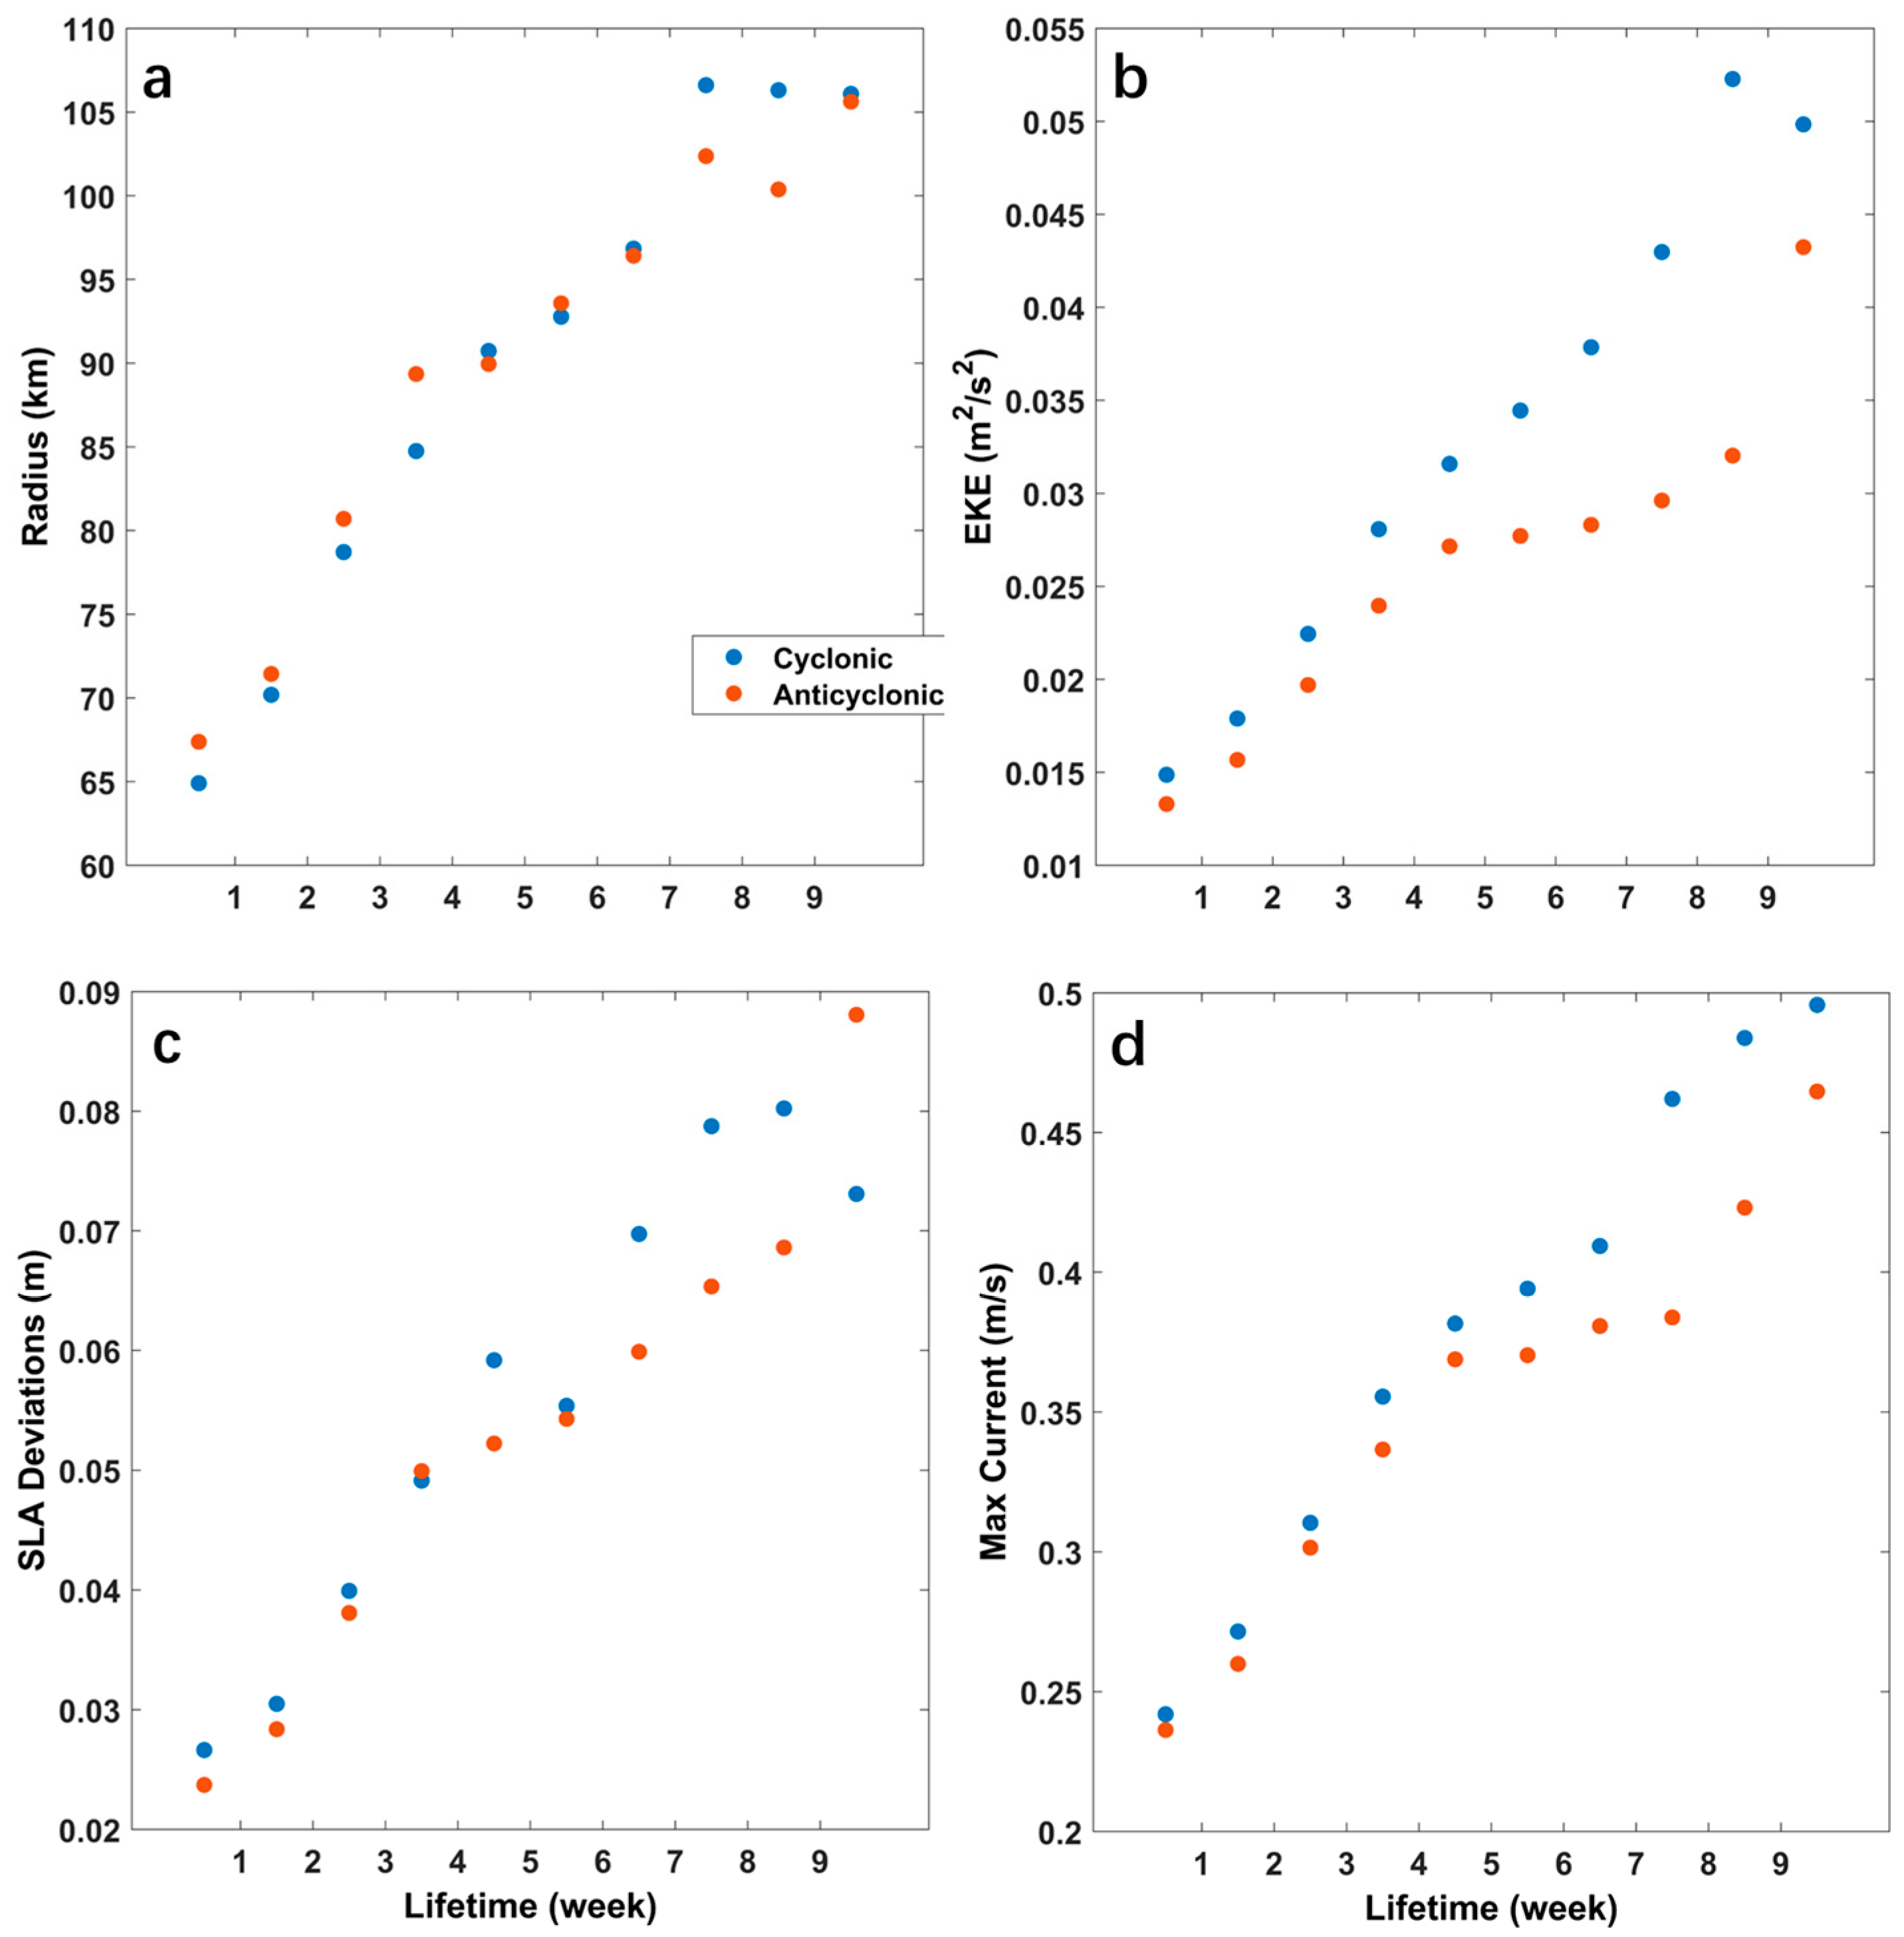
The relationships between the eddy lifetime and its mean radius (EKE, SLA deviation, and maximum current speed of eddy) are shown in Figure 7. Eddies with longer lifetimes are usually accompanied by larger mean eddy radius values, EKE values, SLA deviations, and maximum current speeds. This indicates that eddies with longer lifetimes usually have a larger range of impact in the ocean, with a larger EKE and current speed, leading to a greater increase or decrease in the sea level. Different eddy detection methods detect different mesoscale eddy boundaries [16,38]. So, there are large differences in the calculations of the eddy radius, EKE value, SLA deviations, and maximum current speed of the eddy. In addition, in previous statistical analyses of eddy characteristics in the SCS, given the accuracy of satellite measurements and the AVISO product [15] and to avoid sporadic eddy events [20], most eddies with a lifetime of at least 28 days were selected for the statistical analysis [18,20,23]. Therefore, eddies with a lifetime of at least 28 days (17% of the number of total eddies) were selected for eddy naming, and we refer to them as strong eddies (SEs).
The numbers of SEs and their trajectories are counted during the 1993–2021 period (Figure 8). The spatial distributions of CEs and AEs are similar (r = 0.64, p < 0.05), and the high CE and AE density distributions are similar to those of the western boundary current in the SCS. A correlation analysis was conducted between the spatial distribution of the number of CEs (AEs) and those with lifetimes of at least 7 days (Figure 4). The correlation between eddies with longer lifetimes and those with shorter lifetimes was significant (r = 0.85 and 0.86, p < 0.05). Therefore, there is no significant correlation between the distributions and lifespans of eddies. The annual eddy trajectories for the 1993–2021 period are displayed in Figure 9. About 40 SEs are generated yearly, with a small difference in the number of CEs (50.9%) and AEs (49.1%). The eddies are scattered in the central part of the SCS, and most (85.0%) propagate westward regardless of eddy polarity (CEs account for 85.9% of the total CEs; AEs account for 84.0% of the total AEs); this propagation direction may be due to the westward intensification of the SCS circulations and the Kuroshio intrusion from the north [8,9,41].
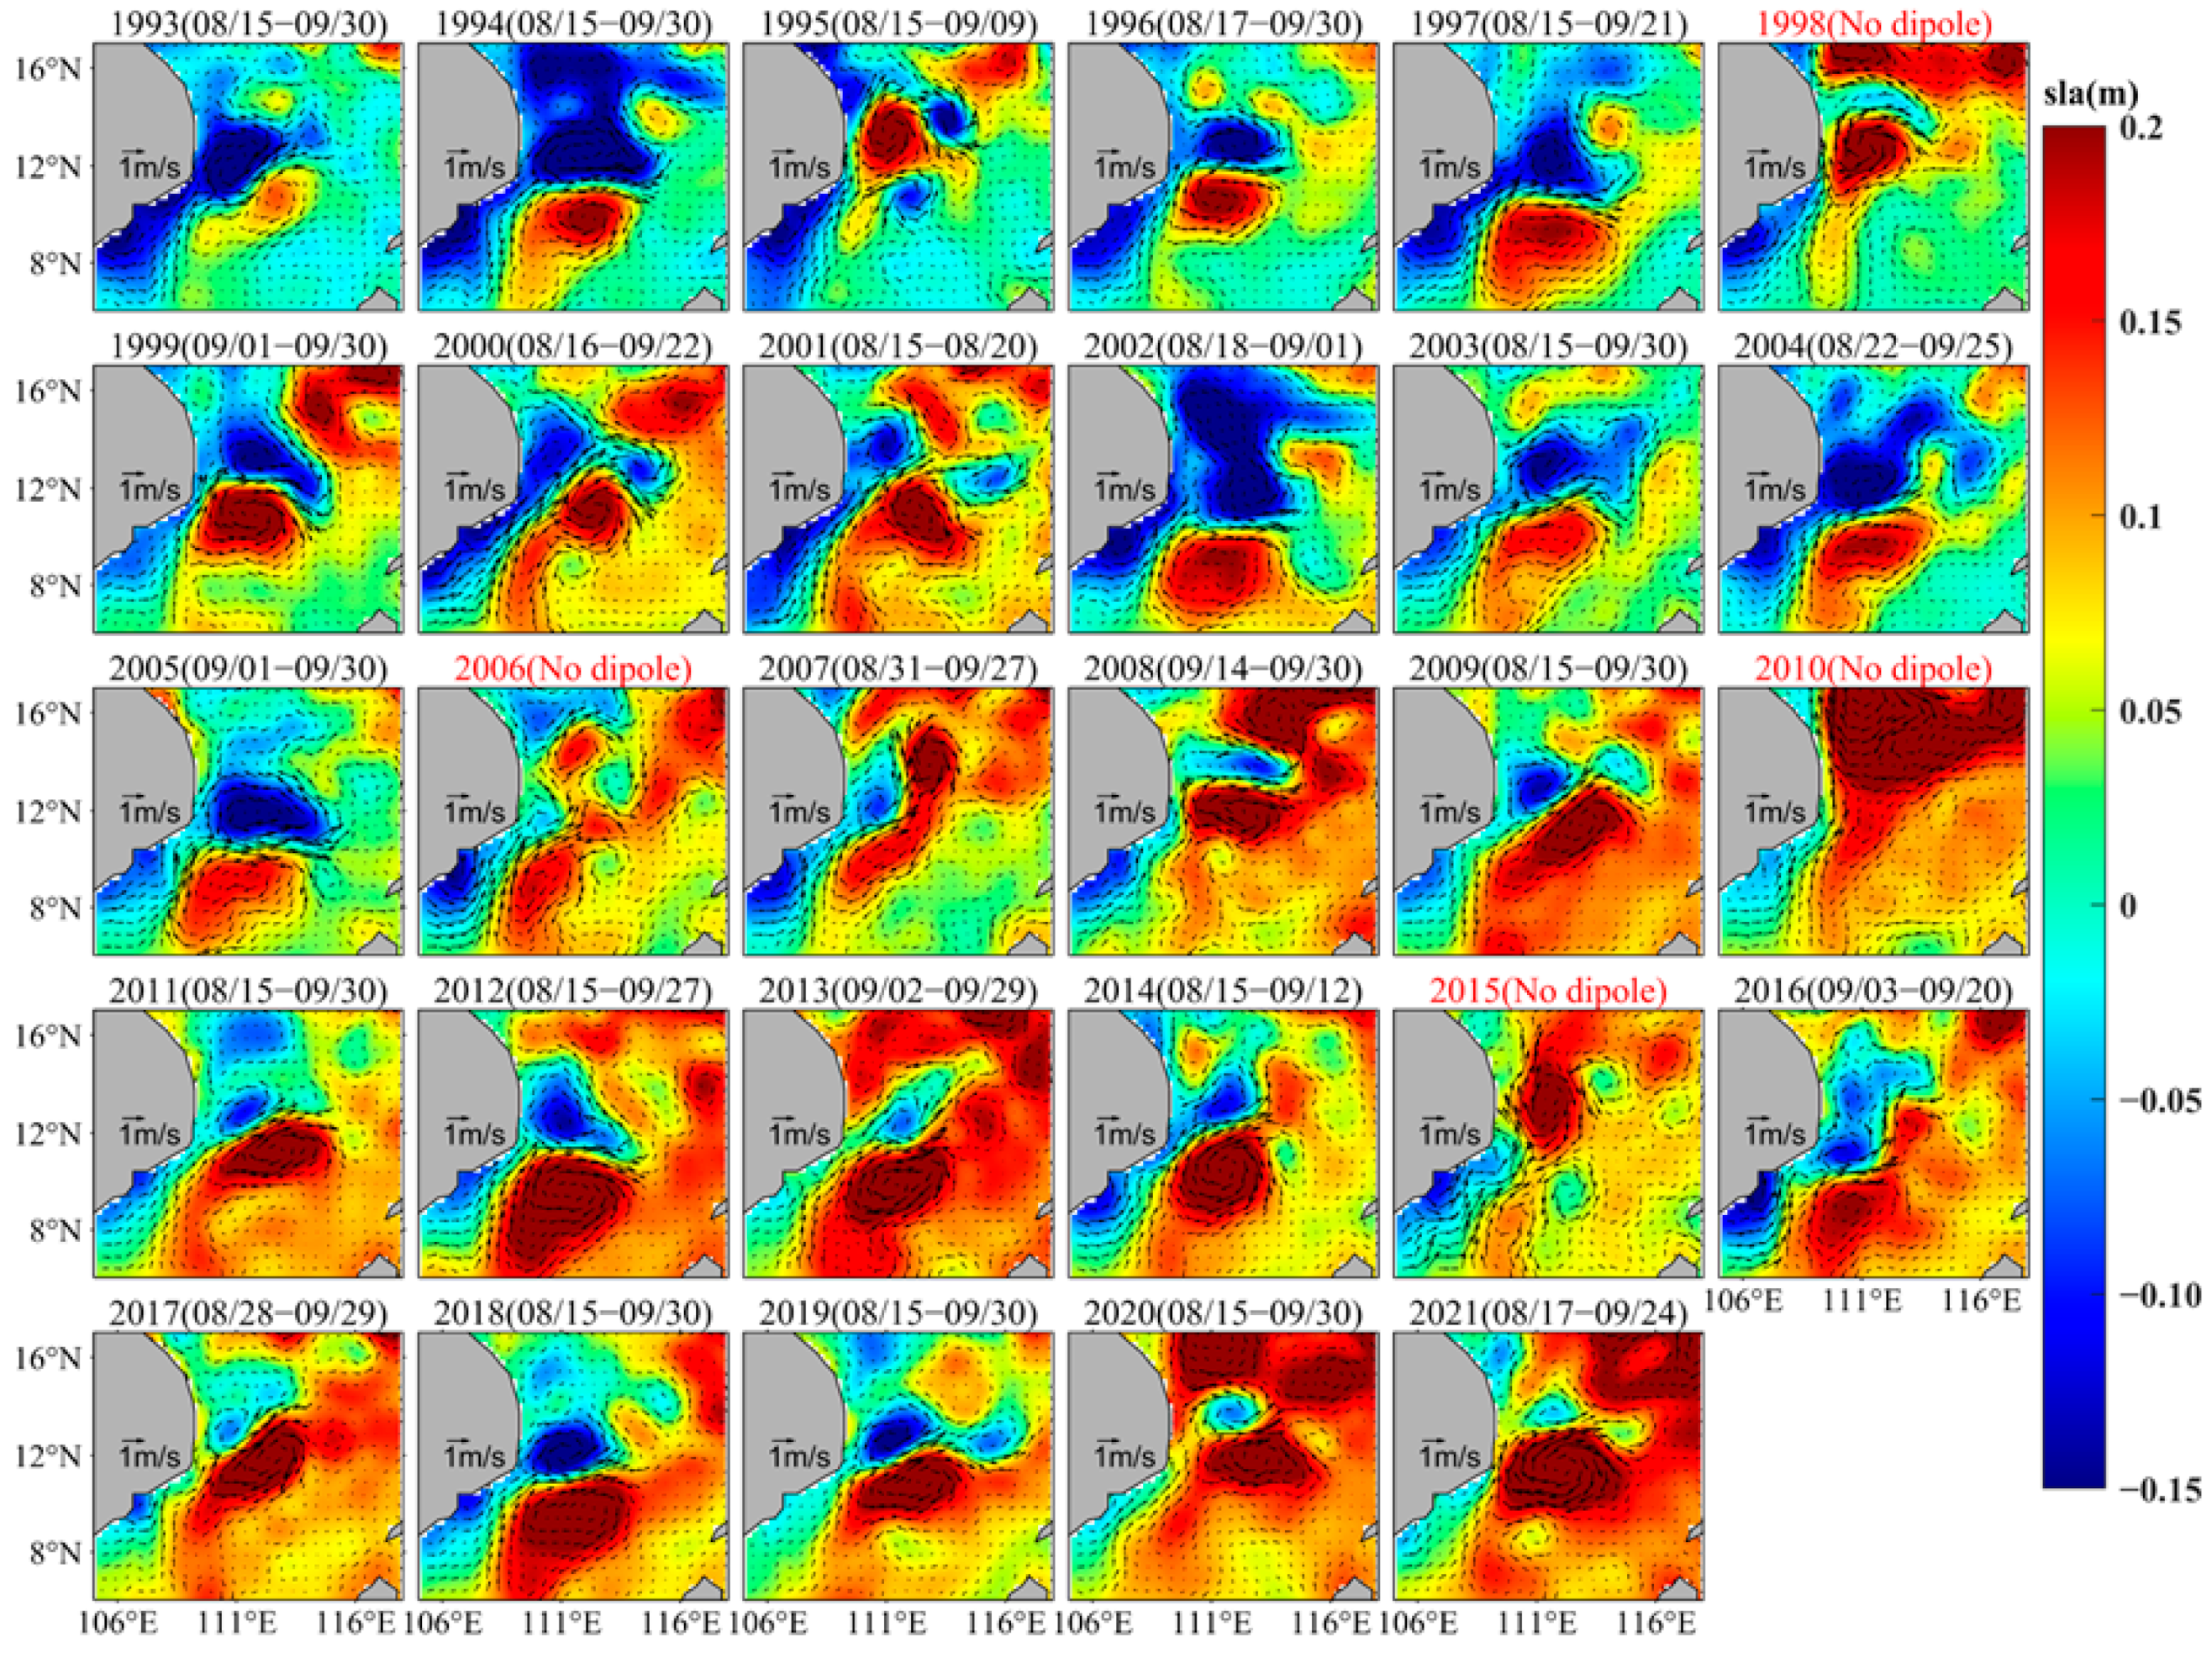
Despite there being significant interannual differences in time and region, there are still a few SEs in the SCS that persist for several years in similar months and locations, such as the well-known dipole eddies consisting of a CE and an AE offshore eastern Vietnam [9,42,43]. The dipole structure plays an important role in the distribution of sea surface flow fields, water transport, and the development of fisheries [9,42]. The multi-year eddy distribution in the eastern Vietnam Sea is shown in Figure 10. The closely associated cyclonic and anticyclonic circulations consist of a typical eddy dipole structure, and the dipole was first discovered through satellite data [44]. The dipole is usually generated in late June, peaks in August or September, and disappears in October with large seasonal and interannual variations. The dipole is present in most years, but not in every year, such as in 1998, 2006, 2010, and 2015.
SEs with the same polarity generated in similar times and positions in three out of five years are defined as persistent strong eddies (PSEs). A similar time is defined as the overlap time of two SEs in two consecutive years being more than 40% of their average lifespans. A similar position is defined as the overlap position being greater than 40% of the two SEs’ average coverage area during their lifespans. The above criteria value (40%) is chosen after sensitivity experiments of 30%, 40%, 50%, and 60%, which result in average annual PSE numbers of 13, 9, 5, and <1 (for the last two), respectively. Since we know that at least two SEs of the dipole offshore eastern Vietnam should be classified as PSEs for most of the last 30 years, 50% and 60% are inadequate, and 40% is tested to find those two PSEs in 25 out of 29 years from 1993 to 2021 (except for 1998, 2006, 2010, and 2015 when the dipole was not present). A persistent eddy may cause longer lasting and more persistent impacts on ocean mass transport, water exchange, and fisheries. For example, the dipole structures transport cold coastal seawater and nearshore nutrients to the open eastern sea every summer, and they play important roles in shaping the community structure and fish assemblages [43].

3.2. Classification of Strong and Persistent Eddies

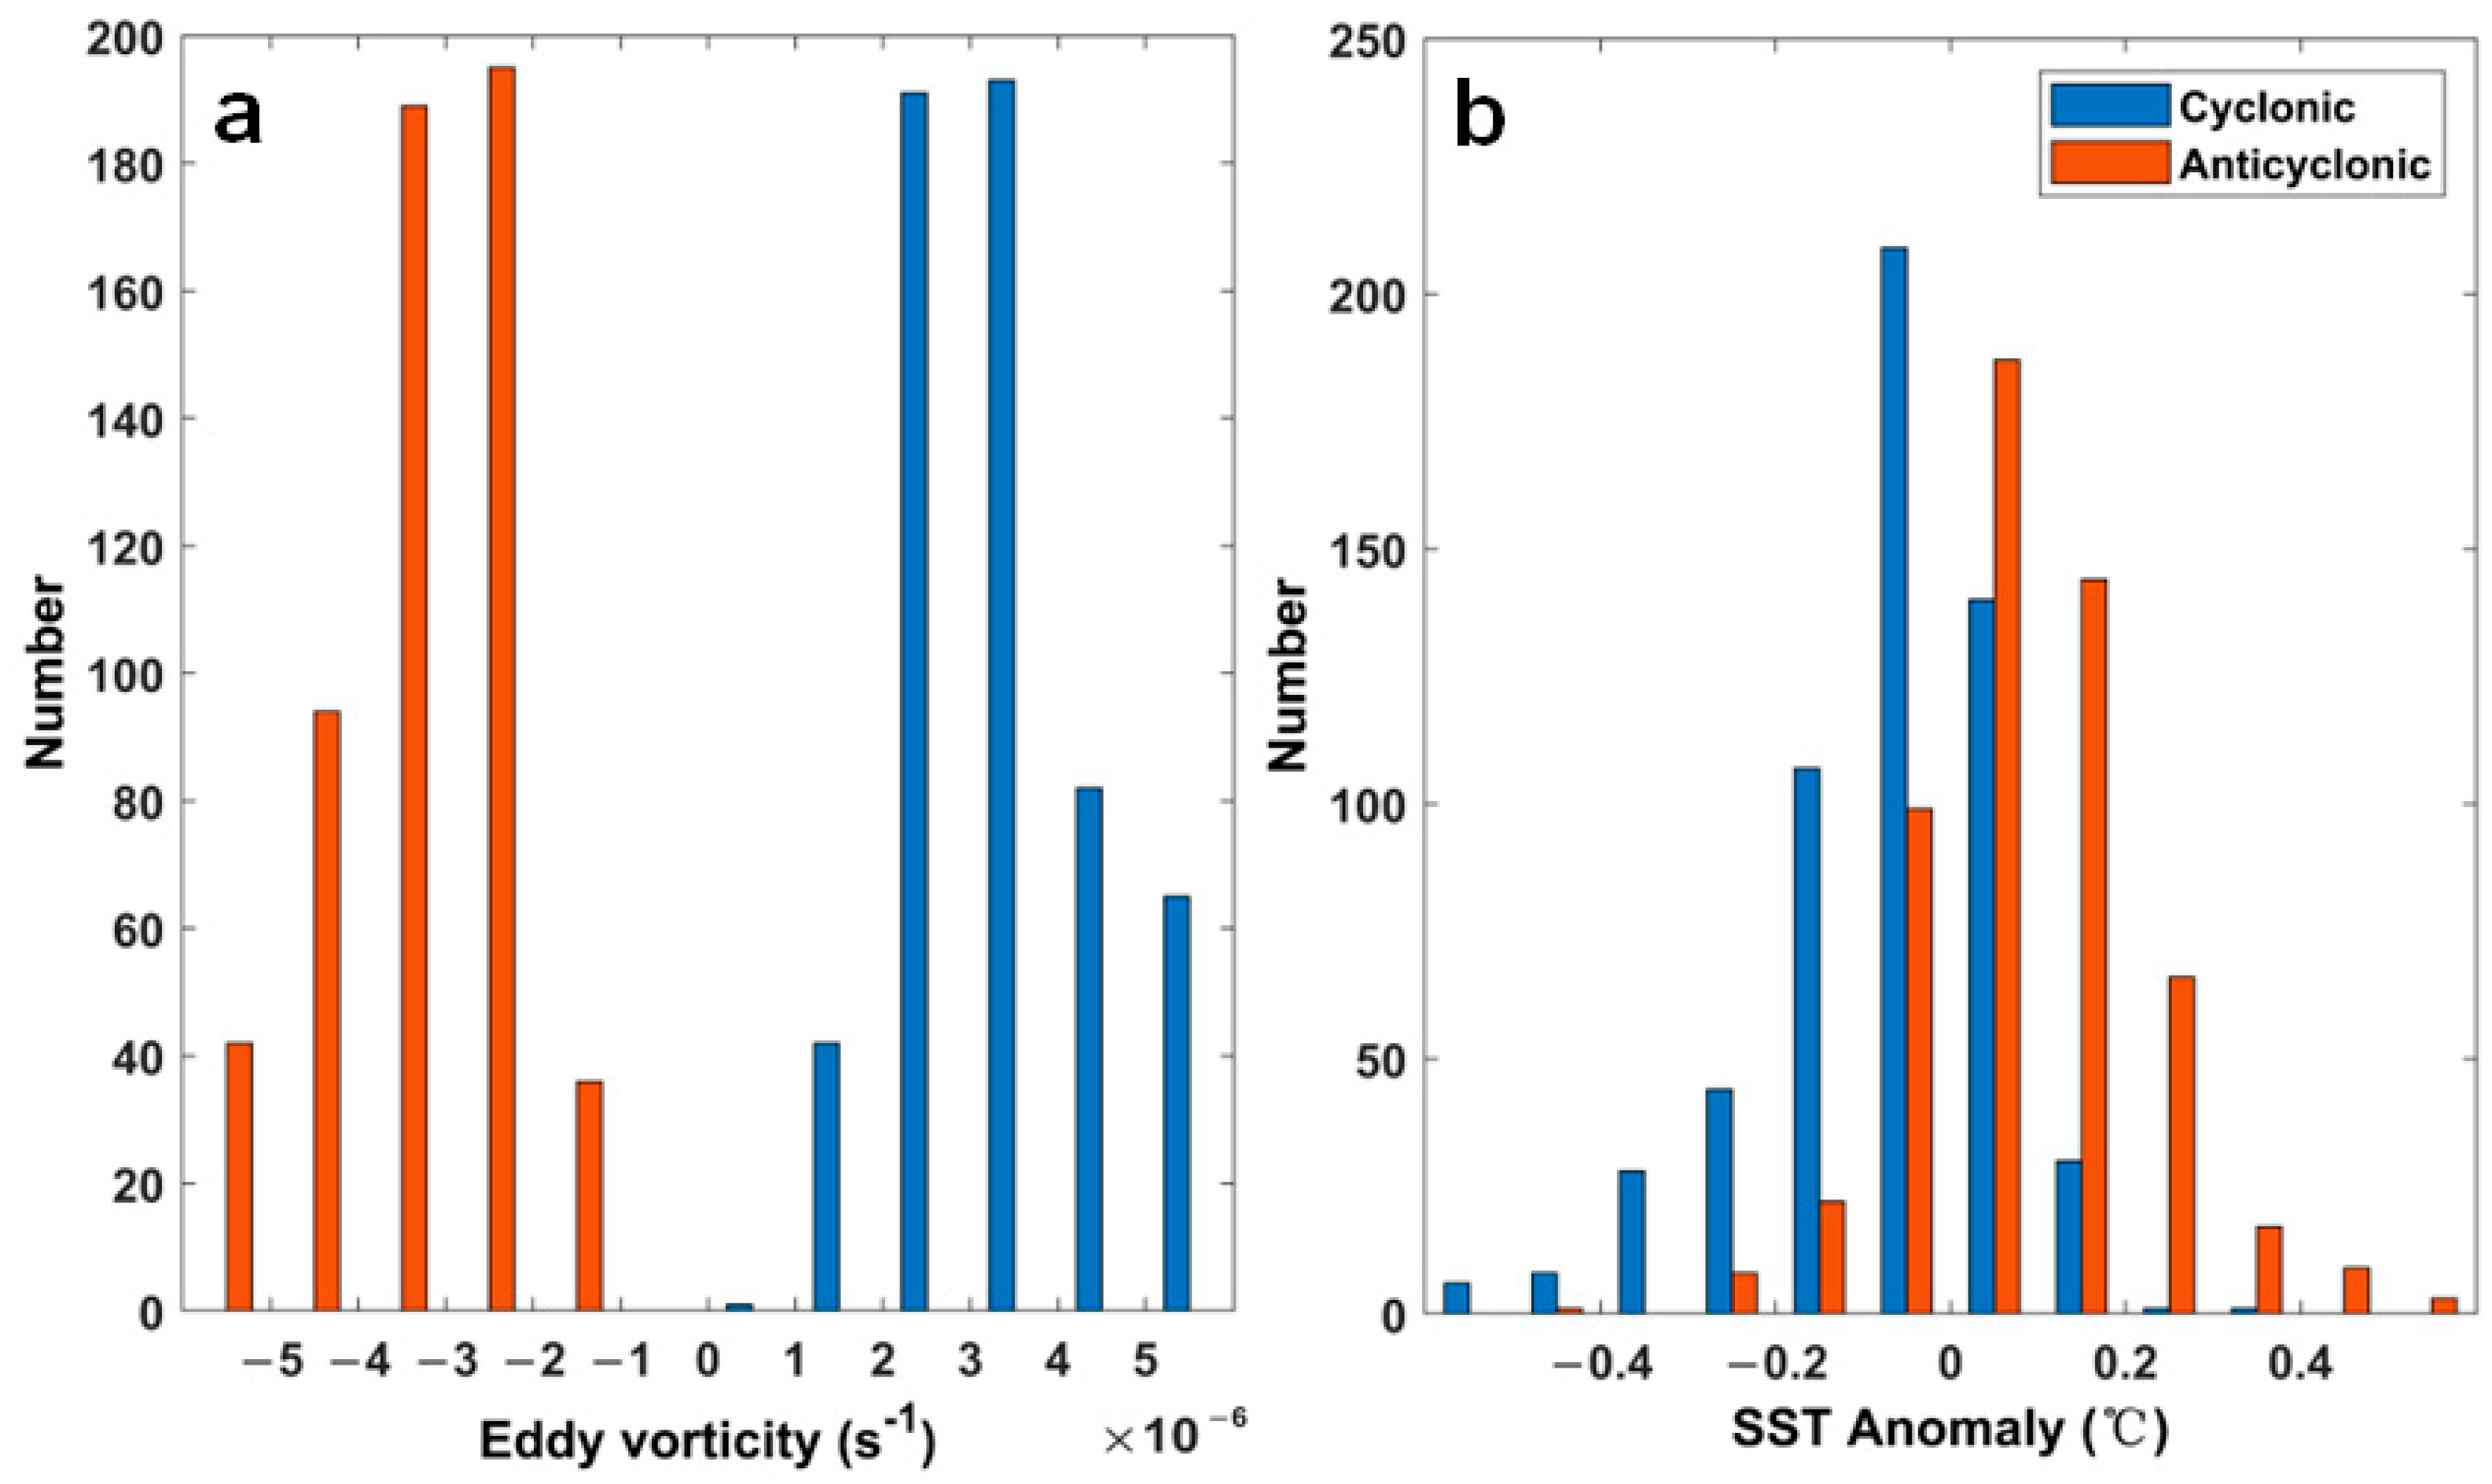
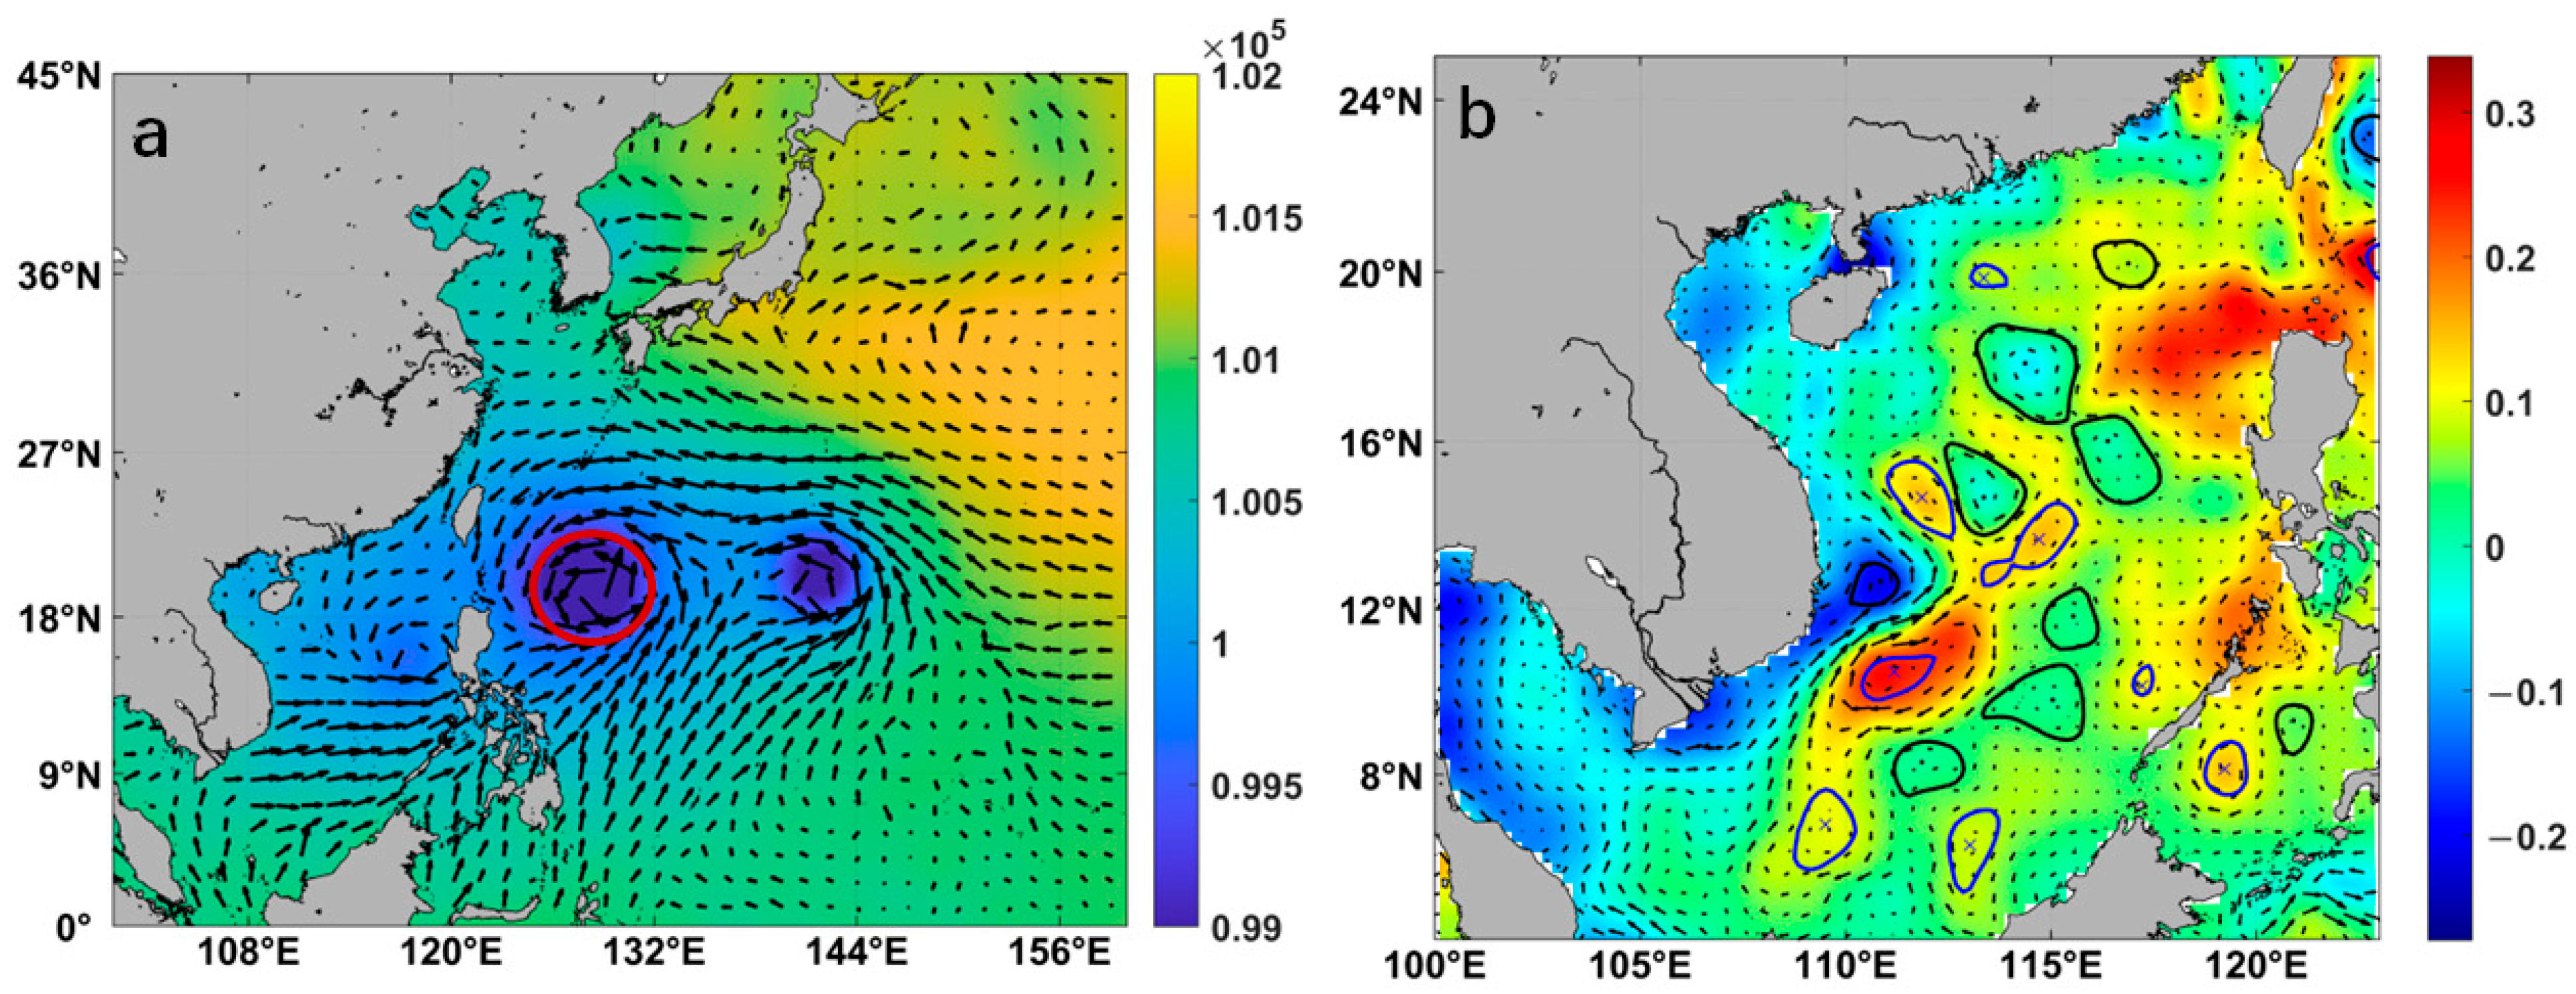
After a statistical analysis of the SCS eddies and classification based on their lifespans, intensity, and consistency, we named SEs and PSEs. We did not attempt to rename eddies, but instead used terminology unique to eddies themselves. Figure 11 shows the distribution of surface-eddy-induced temperature anomalies for the CEs and AEs, where the temperature anomalies are obtained by subtracting the mean temperature within the eddy from the mean temperature within two times the radius of the eddy [38]. The CEs (AEs) cause negative (positive) anomalies in sea surface heights accompanied by positive (negative) vorticity in the Northern Hemisphere. Usually, CEs (AE) are called cold (warm) core eddies with a rising (falling) sea level in the core. However, statistics on temperature anomalies due to SEs (Figure 11) during the 1993–2021 period show that there are 22.8% (18.6%) “anomalous” mesoscale CEs (AEs) of the total number of SEs associated with warm (cold) cores in the SCS every year. Similar to Sun et al. [24], for eddies generated during the 2000–2008 period, warm (cold) core “anomalous” mesoscale CEs (AEs) account for 14.6% and 15.8% of the total number of eddies, respectively. The cause of the “anomalous” eddies may be the intrusion of Kuroshio warm water [24]. Unlike typhoons (red circle in Figure 12a), which are all cyclonic, SEs can be both cyclonic and anticyclonic (Figure 12b). So, the polarity of the eddies should be distinguished in the eddy names.
The typhoon naming table has 140 names, with 10 names provided by each of the 14 countries and regions. According to statistics, from 2011 to 2022, approximately 29 typhoons were named each year, and the names in the naming table were repeated every 5 years. Following the tropical cyclone naming rules, the 100 most popular English boys’ and girls’ names are chosen to form the Eddy Naming Table (Table 1). The 100 names come from Name Chef’s 2023 Most Popular English Name Ranking. The first name in the Eddy Naming Table is a girl’s name, followed by a boy’s name. The boys’ and girls’ names are then arranged alternately. The first SE generated in 1993 is named using the first name in the Eddy Naming Table, and the second SE is named using the second name. When all 100 names are used up, the cycle is repeated starting from the first name. Because the names are reused, the eddy characteristics (polarity, generation time, and location) are added to the eddy names in order to distinguish between different eddies with the same name and to represent the eddy characteristics. The polarity of the eddy is distinguished by “C” and “A”, denoting a CE and AE, respectively. The generation time is the first day the eddy is detected, and the generation location is the latitude and longitude coordinates of the eddy’s center.
In summary, the eddy naming rules are as follows: (1) Eddies have been detected since 1 January 1993. Not all eddies are named, but each eddy is given a number on the first day it is generated and detected (e.g., 199301 and 199302, representing the year and number the eddy is generated and detected). If more than one eddy is generated on the same day, the numbers are given in the order of latitude and longitude from smallest to largest. The eddy is named based on the year in which it is generated. Even if the eddy exists across years, only the year it was generated is recorded. (2) Eddy naming starts with the first SE generated in 1993, starting with the first name in the Eddy Naming Table (Table 1) and followed by information about the eddy (polarity, generation time, and eddy center location). (3) The first name in the Eddy Naming Table is used for the first eddy generated, the second name is used for the second eddy generated, and so on. When the Eddy Naming Table names are all used up, the cycle starts again from the first name in the Eddy Naming Table. (4) If an SE is determined to be a PSE, “-p” is added after its name.
To better explain the eddy naming rules, the following eddy naming exercise is carried out using the eddies generated in 1993. About 248 eddies were generated in 1993, and 40 of them (16.1%) were SEs (22 CEs and 18 AEs). The first SE (CE) was generated on 1 January 1993. It was given the number 199306 and named “Ally (C19930101-10°N, 112°E)”. The second SE (AE), which was generated on the same day, was given the number 199309 and named “Aaron (A19930101-13°N, 113°E)”. The third SE was generated on 22 January 1993. It was given the number 199330, and it was named “Amber (A19930117-13°N, 116°E)”. The fourth SE, generated on 22 January 1993, has the number 199335 and was named “Adrian (C19930122-15°N, 115°E)”. All SE numbers and names for 1993 are included in Table 2. From 1993 to 2021, a total of 1158 SEs were generated, and the names in the Eddy Naming Table were reused 11 times.
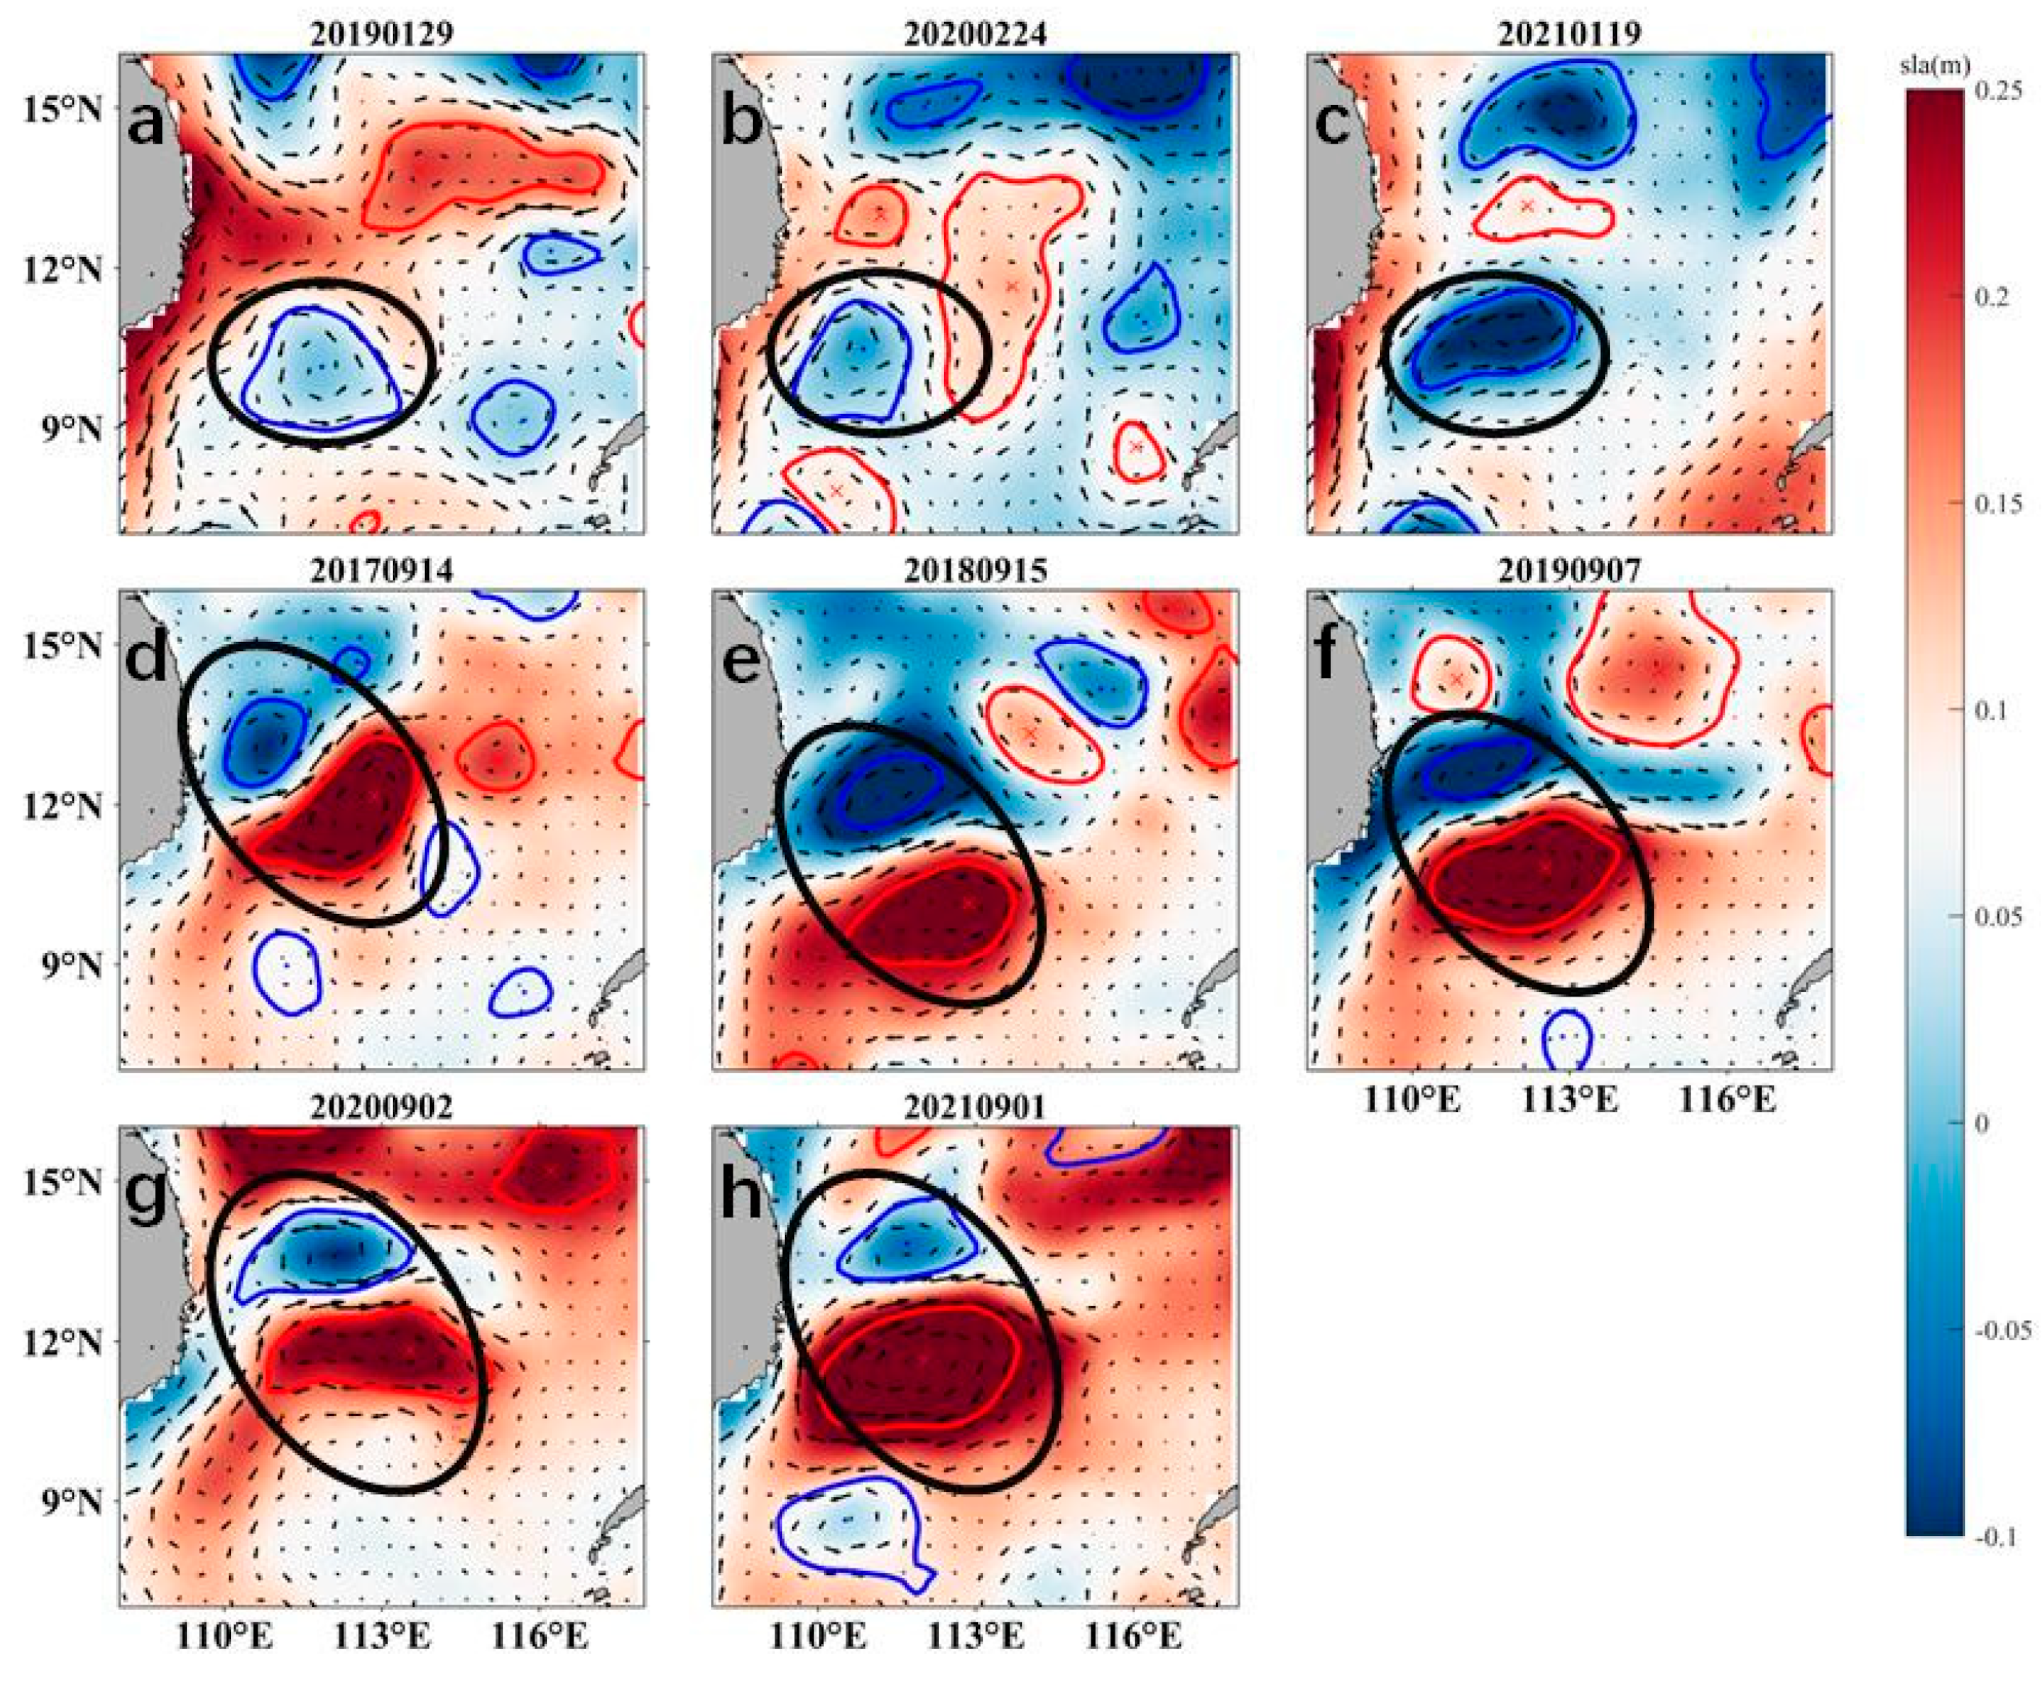
Here, we listed three PSEs in 2021 as examples: (1) Chelsea (C20210110-10°N, 113°E)-P (the black CE in Figure 13a–c), (2) Erin (C20210628-13°N, 113°E)-P (the black CE in Figure 13d–h), and (3) Eunice (A20210721-12°N, 111°E)-P (the black AE in Figure 13d–h). Figure 13 shows the distribution of the three PSEs. “Chelsea (C20210110-10°N, 113°E)-P” has been detected for three consecutive years (Figure 13a–c); “Erin (C20210628-13°N, 113°E)-P” and “Eunice (A20210721-12°N, 111°E)-P” have been detected for five consecutive years (Figure 13d–h). The corresponding PSEs for the past five years are also listed in Table 3. The last two PSEs are in close positions and times in most of the years and are called eddy dipoles. The PSEs may affect the accuracy of weather forecasting through a strong small-scale (10–100 km) air–sea interaction of momentum and heat flux, but studies of such phenomena are still lacking or not categorized by the names of PSEs. Hopefully this study can increase the awareness of PSE and its application in weather forecasting.

4. Discussion

This study aimed to name eddies in the SCS following typhoon and hurricane naming standards. In recent years, fishing activities, resource exploration, oil and gas extraction, and other actions in the SCS could not be separated from research on the marine environment. The systematic naming of eddies may help bring the oceanic eddy phenomenon into the public eye, which will be beneficial for the future development of deep-sea activities in the SCS.
This article focuses on a large-scale statistical analysis of mesoscale eddy characteristics and explores eddy classification. Considering that the horizontal spatial scale of mesoscale eddies is tens to hundreds of kilometers, the 0.25 × 0.25° resolution is sufficient for mesoscale eddy identification and detection. A higher resolution (such as 0.083 × 0.083°) may detect more details of the characteristic variables of mesoscale eddies, including their radius values, lifetimes, centers, and boundary information. We plan to explore this using high-resolution data in future research.
We classify eddies into SEs and PSEs. We name SEs and include information about sustained strong eddies in their names. The current eddy dataset for eddy naming uses the vector geometry eddy detection method proposed by Nencioli [21] to automatically detect mesoscale eddies from the velocity field. In order to distinguish between different eddies with the same name, the eddy names include the polarity, generation time, and location of the eddy center, which are based on the eddy information obtained from the remote sensing data detection process. The eddy names, as proposed in this study, do not yet contain the three-dimensional structure information of the eddies. The three-dimensional structural probing of eddies requires additional data sources, which are currently lacking. Furthermore, the eddy detection method does not recognize eddy fusion and splitting. So, the fusion and splitting of eddies are not considered in eddy naming.

5. Conclusions

Eddies do not have a unified name. In addition, the study of eddies is limited to the oceanographic community and not widely known by the public. Through an attempt to systematically name eddies, we hope to make it easier to retrieve specific eddy information. At the same time, freeing the science of eddies from the stereotype of being hard to understand will make eddies, mesoscale phenomena at sea, better known to the public. At the same time, with the development of science and technology, human activities are increasingly expanding into the deep sea. In recent years, fishing activities, resource exploration, oil and gas extraction, and other actions in the SCS could not be separated from research on the marine environment. Therefore, strengthening the study of eddies is even more important for enhancing research on the marine environment. So naming SCS eddies can help us deepen our understanding and increase people’s attention on them, which will be beneficial for future deep-sea activities.
This study analyzes the characteristics of eddies (eddy lifetimes, radius values, EKE values, SLA deviations, and maximum current speeds) identified using satellite remote sensing data during the 1993–2021 period using the vector geometry eddy detection method proposed by Nencioli [21]. A statistical analysis of eddies in the SCS shows that about 230 eddies are generated in the SCS each year. The interannual variability in the number of eddies generated is small, with nearly similar numbers of CEs (52.2%) and AEs (47.8%) each year. Regarding interannual variations, there is a small decreasing trend in the annual change in the number of the generation of CEs (AEs). The spatial distributions of CEs and AEs are similar (r = 0.87, p < 0.05), and both are concentrated in the central region of the SCS (112–118°E, 10–20°N). The quantity distributions of CEs and AEs are positively correlated (r = 0.54 and 0.53, p < 0.05) with the depth of the SCS, and the number of eddies on the continental shelf is the highest, followed by the sea basin, and that in the nearshore is the lowest. Most eddies (73.0%) propagate westward regardless of eddy polarity.
Naming all of the eddies is a tedious task with little significance because some eddies have a relatively short lifetime with little impact on the surrounding seawater [16]. The statistics of the four variables characterizing eddy strength (lifetime, radius, EKE, SLA deviations, and maximum current speed of the eddy) show that eddies with longer lifetimes have larger mean radius values, EKE values, SLA deviations, and maximum current speeds. Given the accuracy of satellite measurements and AVISO products [15], and in order to avoid sporadic eddy events [20], most of the previous studies selected eddies with lifetimes of at least 28 days for statistical analysis [18,20,23]. Therefore, only eddies with lifetimes of at least 28 days are named, and we refer to them as strong eddies (SEs). Typhoons can be classified into typhoon, strong typhoon, and super strong typhoon levels. The SEs with the same polarity generated in similar times and positions in three out of five years are defined as persistent strong eddies (PSEs), and we add extra information to their names.
Each eddy is given a number that corresponds to the year and number it is generated (e.g., 199301 and 199302). If more than one eddy is generated on the same day, the number is given in the order of latitude and longitude from smallest to largest. With reference to the naming method for typhoons, the 100 most popular used boys’ and girls’ names are selected for the Eddy Naming Table (Table 1), starting with the first name for SEs generated in 1993. If all 100 names in the Eddy Naming Table are exhausted, the cycle starts again from the first name. In the naming process, the eddy polarity and time and place of generation are added to the name as informative elements so that the eddies can be distinguished when searching for different eddies with the same name. Eddies are given a unified name from generation to extinction, and their names do not change even when they undergo significant spatial motion or change. For example, the first SE was generated on January 1, 1993 with the number 199306, and it was named “Ally (C19930101-10°N, 112°E)”. The second SE generated on the same day was numbered 199309 and was named “Aaron (A19930101-13°N, 113°E)”. If an SE is identified as a PSE, “-P” is added to its name suffix, as seen in two PSEs in 2021 as example: “Erin (C20210628-13°N, 113°E)-P” and “Eunice (A20210721-12°N, 111°E)-P”. They are in close positions and times in most of the years and are called eddy dipoles.

Author Contributions

Conceptualization, Y.J. and D.W.; methodology, Y.J.; software, Y.J.; validation, Y.J., M.J. and C.D.; formal analysis, Y.J.; investigation, Y.J.; resources, Y.J.; data curation, Y.J.; writing—original draft preparation, Y.J.; writing—review and editing, Y.J., M.J., C.D. and D.W.; visualization, Y.J.; supervision, M.J., C.D. and D.W.; funding acquisition, D.W. All authors have read and agreed to the published version of the manuscript.

Funding

This study is financially supported by the Key Research and Development Program of the Ministry of Science and Technology, grant number 2023YFC3008200; the National Natural Science Fund of China, grant number 42250710152; and the Jiangsu Province Graduate Innovation and Entrepreneurship Project, grant number KYCX22_1171.

Institutional Review Board Statement

Ethical review and approval were waived for this study due to studies not involving humans or animals.

Informed Consent Statement

Not applicable.

Data Availability Statement

No new data were created.

Acknowledgments

The altimeter products were provided by the Archiving, Validation and Interpretation of Satellite Oceanographic (AVISO) (https://cds.climate.copernicus.eu/, accessed on 1 October 2023). The SST product data were obtained from the Advanced Very High Resolution Radiometer (AVHRR) (https://www.ncei.noaa.gov/, accessed on 10 October 2023). The wind field data were acquired from the ERA5 from 1940 to the present (https://climate.copernicus.eu/, accessed on 1 November 2023). The authors are thankful to Kenny T.C. Lim Kam Sian for proofreading and providing constructive comments, which improved the overall English quality of the paper.

Conflicts of Interest

The authors declare no conflicts of interest.

References

  1. Chen, G.; Han, G.; Yang, X. On the intrinsic shape of oceanic eddies derived from satellite altimetry. Remote Sens. Environ. 2019, 228, 75–89. [Google Scholar] [CrossRef]
  2. Lin, P.; Liu, H.; Ma, J.; Li, Y. Ocean mesoscale structure–induced air–sea interaction in a high-resolution coupled model. Atmos. Ocean. Sci. Lett. 2019, 12, 98–106. [Google Scholar] [CrossRef]
  3. Zhang, Y.; Wang, N.; Zhou, L.; Liu, K.; Wang, H. Progress in surface characterization and three-dimensional structure of ocean mesoscale eddies. Adv. Earth Sci. 2020, 35, 568–580. [Google Scholar]
  4. Chen, G.; Gan, J.; Xie, Q.; Chu, X.; Wang, D.; Hou, Y. Eddy heat and salt transports in the South China Sea and their seasonal modulations. J. Geophys. Res. Ocean. 2012, 117, C05021. [Google Scholar] [CrossRef]
  5. Xia, Q.; Shen, H. Automatic detection of oceanic mesoscale eddies in the South China Sea. Chin. J. Oceanol. Limnol. 2015, 33, 1334–1348. [Google Scholar] [CrossRef]
  6. Liu, J.; Tian, F.; Chen, G. Statistical study on the characteristics of sea surface temperature of mesoscale eddies in the South China Sea. J. Ocean Univ. China Nat. Sci. Ed. 2020, 50, 146–156. [Google Scholar]
  7. Li, H.; Guo, J.; Wen, H. Comparative analysis of mesoscale eddies in the South China Sea based on satellite altimetry and satellite remote sensing sea surface temperature detection. Geod. Geodyn. 2018, 38, 1170–1173. [Google Scholar]
  8. Fang, W.; Fang, G.; Shi, P.; Huang, Q.; Xie, Q. Seasonal structures of upper layer circulation in the southern South China Sea from in situ observations. J. Geophys. Res. Ocean. 2002, 107, 23-1–23-12. [Google Scholar] [CrossRef]
  9. Wang, H.; Yuan, Y.; Guan, W.; Lou, R.; Wang, K. Circulation in the South China Sea during summer 2000 as obtained from observations and a generalized topography-following ocean model. J. Geophys. Res. Ocean. 2004, 109, C07007. [Google Scholar] [CrossRef]
  10. Wang, G.; Li, J.; Wang, C.; Yan, Y. Interactions among the winter monsoon, ocean eddy and ocean thermal front in the South China Sea. J. Geophys. Res. Ocean. 2012, 117, C08002. [Google Scholar] [CrossRef]
  11. Xie, S.P.; Chang, C.H.; Xie, Q.; Wang, D. Intraseasonal variability in the summer South China Sea: Wind jet, cold filament, and recirculations. J. Geophys. Res. Ocean. 2007, 112, C10008. [Google Scholar] [CrossRef]
  12. Lin, P.; Wang, F.; Chen, Y.; Tang, X. Temporal and spatial variation characteristics on eddies in the South China Sea I. Statistical analyses. J. Oceanogr. 2007, 29, 14–22. [Google Scholar]
  13. Qi, G.; Du, Y.; Cao, F. Rough set-based extraction of temporal and spatial relationships of mesoscale eddies in the South China Sea. Prog. Mar. Sci. 2010, 28, 417–427. [Google Scholar]
  14. Zhang, M.; Von Storch, H.; Chen, X.; Wang, D.; Li, D. Temporal and spatial statistics of travelling eddy variability in the South China Sea. Ocean Dyn. 2019, 69, 879–898. [Google Scholar] [CrossRef]
  15. Chaigneau, A.; Eldin, G.; Dewitte, B. Eddy activity in the four major upwelling systems from satellite altimetry (1992–2007). Prog. Oceanogr. 2009, 83, 117–123. [Google Scholar]
  16. Zeng, W.Q.; Zhang, S.W.; Ma, Y.G.; Wang, T. Characterization of mesoscale eddies in the South China Sea 1993–2017. J. Guangdong Ocean Univ. 2019, 39, 96–106. [Google Scholar]
  17. Chelton, D.B.; Schlax, M.G.; Samelson, R.M.; de Szoeke, R.A. Global observations of large oceanic eddies. Geophys. Res. Lett. 2007, 34, 87–101. [Google Scholar] [CrossRef]
  18. Xiu, P.; Chai, F.; Shi, L.; Xue, H.; Chao, Y. A census of eddy activities in the South China Sea during 1993–2007. J. Geophys. Res. 2010, 115, C03012. [Google Scholar] [CrossRef]
  19. Sadarjoen, I.A.; Post, F.H. Detection, quantification, and tracking of vortices using streamline geometry. Comput. Graph. 2000, 24, 333–341. [Google Scholar] [CrossRef]
  20. Chen, G.; Hou, Y.; Chu, X. Mesoscale eddies in the South China Sea: Mean properties, spatiotemporal variability, and impact on thermohaline structure. J. Geophys. Res. 2011, 116, C06018. [Google Scholar] [CrossRef]
  21. Nencioli, F.; Dong, C.; Dickey, T.; Washburn, L.; McWilliams, J.C. A vector geometry–based eddy detection algorithm and its application to a high-resolution numerical model product and high-frequency radar surface velocities in the Southern California Bight. J. Atmos. Ocean. Technol. 2010, 27, 564–579. [Google Scholar] [CrossRef]
  22. Dong, C.; Nencioli, F.; Liu, Y.; McWilliams, J.C. An Automated Approach to Detect Oceanic Eddies from Satellite Remotely Sensed Sea Surface Temperature Data. IEEE Geosci. Remote Sens. Lett. 2011, 8, 1055–1059. [Google Scholar] [CrossRef]
  23. Li, Y.; Han, W.; Wilkin, J.L.; Zhang, W.G.; Arango, H.; Zavala-Garay, J.; Levin, J.; Castruccio, F.S. Interannual variability of the surface summertime eastward jet in the South China Sea. J. Geophys. Res. Ocean. 2014, 119, 7205–7228. [Google Scholar] [CrossRef]
  24. Sun, W.; Liu, Y.; Chen, G.; Tan, W.; Lin, X.; Guan, Y.; Dong, C. Three-dimensional properties of mesoscale cyclonic warm-core and anticyclonic cold-core eddies in the South China Sea. Acta Oceanol. Sin. 2020, 40, 17–29. [Google Scholar] [CrossRef]
  25. Dong, C.; Liu, L.; Nencioli, F.; Bethel, B.J.; Liu, Y.; Xu, G.; Ma, J.; Ji, J.; Sun, W.; Shan, H.; et al. The near-global ocean mesoscale eddy atmospheric-oceanic-biological interaction observational dataset. Sci. Data 2022, 9, 436. [Google Scholar] [CrossRef] [PubMed]
  26. Xu, G.; Cheng, C.; Yang, W.; Xie, W.; Kong, L.; Hang, R.; Ma, F.; Dong, C.; Yang, J. Oceanic eddy identification using an ai scheme. Remote Sens. 2019, 11, 1349. [Google Scholar] [CrossRef]
  27. Pujol, M.-I.; Faugere, Y.; Taburet, G.; Dupuy, S.; Pelloquin, C.; Ablain, M.; Picot, N. DUACS DT 2014: The new multi-mission altimeter data set reprocessed over 20 years. Ocean Sci. 2016, 12, 1067–1090. [Google Scholar] [CrossRef]
  28. Liu, Q.; Kaneko, A.; Jilan, S. Recent progress in studies of the South China Sea circulation. J. Oceanogr. 2008, 64, 753–762. [Google Scholar] [CrossRef]
  29. Ji, J.; Dong, C.; Zhang, B.; Liu, Y.; Zou, B.; King, G.P.; Xu, G.; Chen, D. Oceanic eddy characteristics and generation mechanisms in the Kuroshio Extension region. J. Geophys. Res. Ocean. 2018, 123, 8548–8567. [Google Scholar] [CrossRef]
  30. Qiu, S.; Chen, X.; Tang, S. Study on the evolution of dipole in the Indochina Peninsula. J. Oceanol. Limnol. 2020, 51, 1332–1343. [Google Scholar]
  31. Wang, G.; Chen, D.; Su, J. Generation and life cycle of the dipole in the South China Sea summer circulation. J. Geophys. Res. Ocean. 2006, 111, C06002. [Google Scholar] [CrossRef]
  32. Sun, W.; Dong, C.; Tan, W.; He, Y. Statistical characteristics of cyclonic warm-core eddies and anticyclonic cold-core eddies in the North Pacific based on remote sensing data. Remote Sens. 2019, 11, 208. [Google Scholar] [CrossRef]
  33. Sun, W.; Zhou, S.; Yang, J.; Gao, X.; Ji, J.; Dong, C. Artificial intelligence forecasting of marine heatwaves in the south china sea using a combined U-Net and ConvLSTM system. Remote Sens. 2023, 15, 4068. [Google Scholar] [CrossRef]
  34. Sun, W.; An, M.; Liu, J.; Liu, J.; Yang, J.; Tan, W.; Sian, K.T.C.L.K.; Ji, J.; Liu, Y.; Dong, C. Comparative analysis of four types of mesoscale eddies in the North Pacific Subtropical Countercurrent region—Part II seasonal variation. Front. Mar. Sci. 2023, 10, 1121731. [Google Scholar] [CrossRef]
  35. An, M.; Liu, J.; Liu, J.; Sun, W.; Yang, J.; Tan, W.; Liu, Y.; Sian, K.T.C.L.K.; Ji, J.; Dong, C. Comparative analysis of four types of mesoscale eddies in the north pacific subtropical countercurrent region—Part I spatial characteristics. Front. Mar. Sci. 2022, 9, 1004300. [Google Scholar] [CrossRef]
  36. Sun, W.; Yang, J.; Tan, W.; Liu, Y.; Zhao, B.; He, Y.; Dong, C. Eddy diffusivity and coherent mesoscale eddy analysis in the Southern Ocean. Acta Ocean. Sin. 2021, 40, 1–16. [Google Scholar] [CrossRef]
  37. Sun, W.; An, M.; Liu, J.; Liu, J.; Yang, J.; Tan, W.; Dong, C.; Liu, Y. Comparative analysis of four types of mesoscale eddies in the Kuroshio-Oyashio extension region. Front. Mar. Sci. 2022, 9, 984244. [Google Scholar] [CrossRef]
  38. Yang, X.; Xu, G.; Liu, Y.; Sun, W.; Xia, C.; Dong, C. Multi-source data analysis of mesoscale eddies and their effects on surface chlorophyll in the Bay of Bengal. Remote Sens. 2020, 12, 3485. [Google Scholar] [CrossRef]
  39. Beron-Vera, F.J.; Wang, Y.; Olascoaga, M.J.; Goni, G.J.; Haller, G. Objective detection of oceanic eddies and the Agulhas leakage. J. Phys. Oceanogr. 2013, 43, 1426–1438. [Google Scholar] [CrossRef]
  40. Liu, L. Analysis of Mesoscale Vortex Characteristics and Its Impact on Chlorophyll. Master’s Thesis, Nanjing University of Information Technology, Nanjing, China, 2023. [Google Scholar]
  41. Hu, J.Y.; Gan, J.P.; Sun, Z.Y.; Zhu, J.; Dai, M. Observed three-dimensional structure of a cold eddy in the southwestern South China Sea. J. Geophys. Res. Ocean. 2011, 116, C05016. [Google Scholar] [CrossRef]
  42. Gan, J.; Li, H.; Curchitser, E.N.; Haidvogel, D.B. Modeling South China Sea circulation: Response to seasonal forcing regimes. J. Geophys. Res. Ocean. 2006, 111, C06034. [Google Scholar] [CrossRef]
  43. Chu, X.; Dong, C.; Qi, Y. The influence of ENSO on an oceanic eddy pair in the South China Sea. J. Geophys. Res. Ocean. 2017, 122, 1643–1652. [Google Scholar] [CrossRef]
  44. Wu, C.R.; Shaw, P.T.; Chao, S.Y. Assimilating altimetric data into a South China Sea model. J. Geophys. Res. Ocean. 1999, 104, 29987–30005. [Google Scholar] [CrossRef]
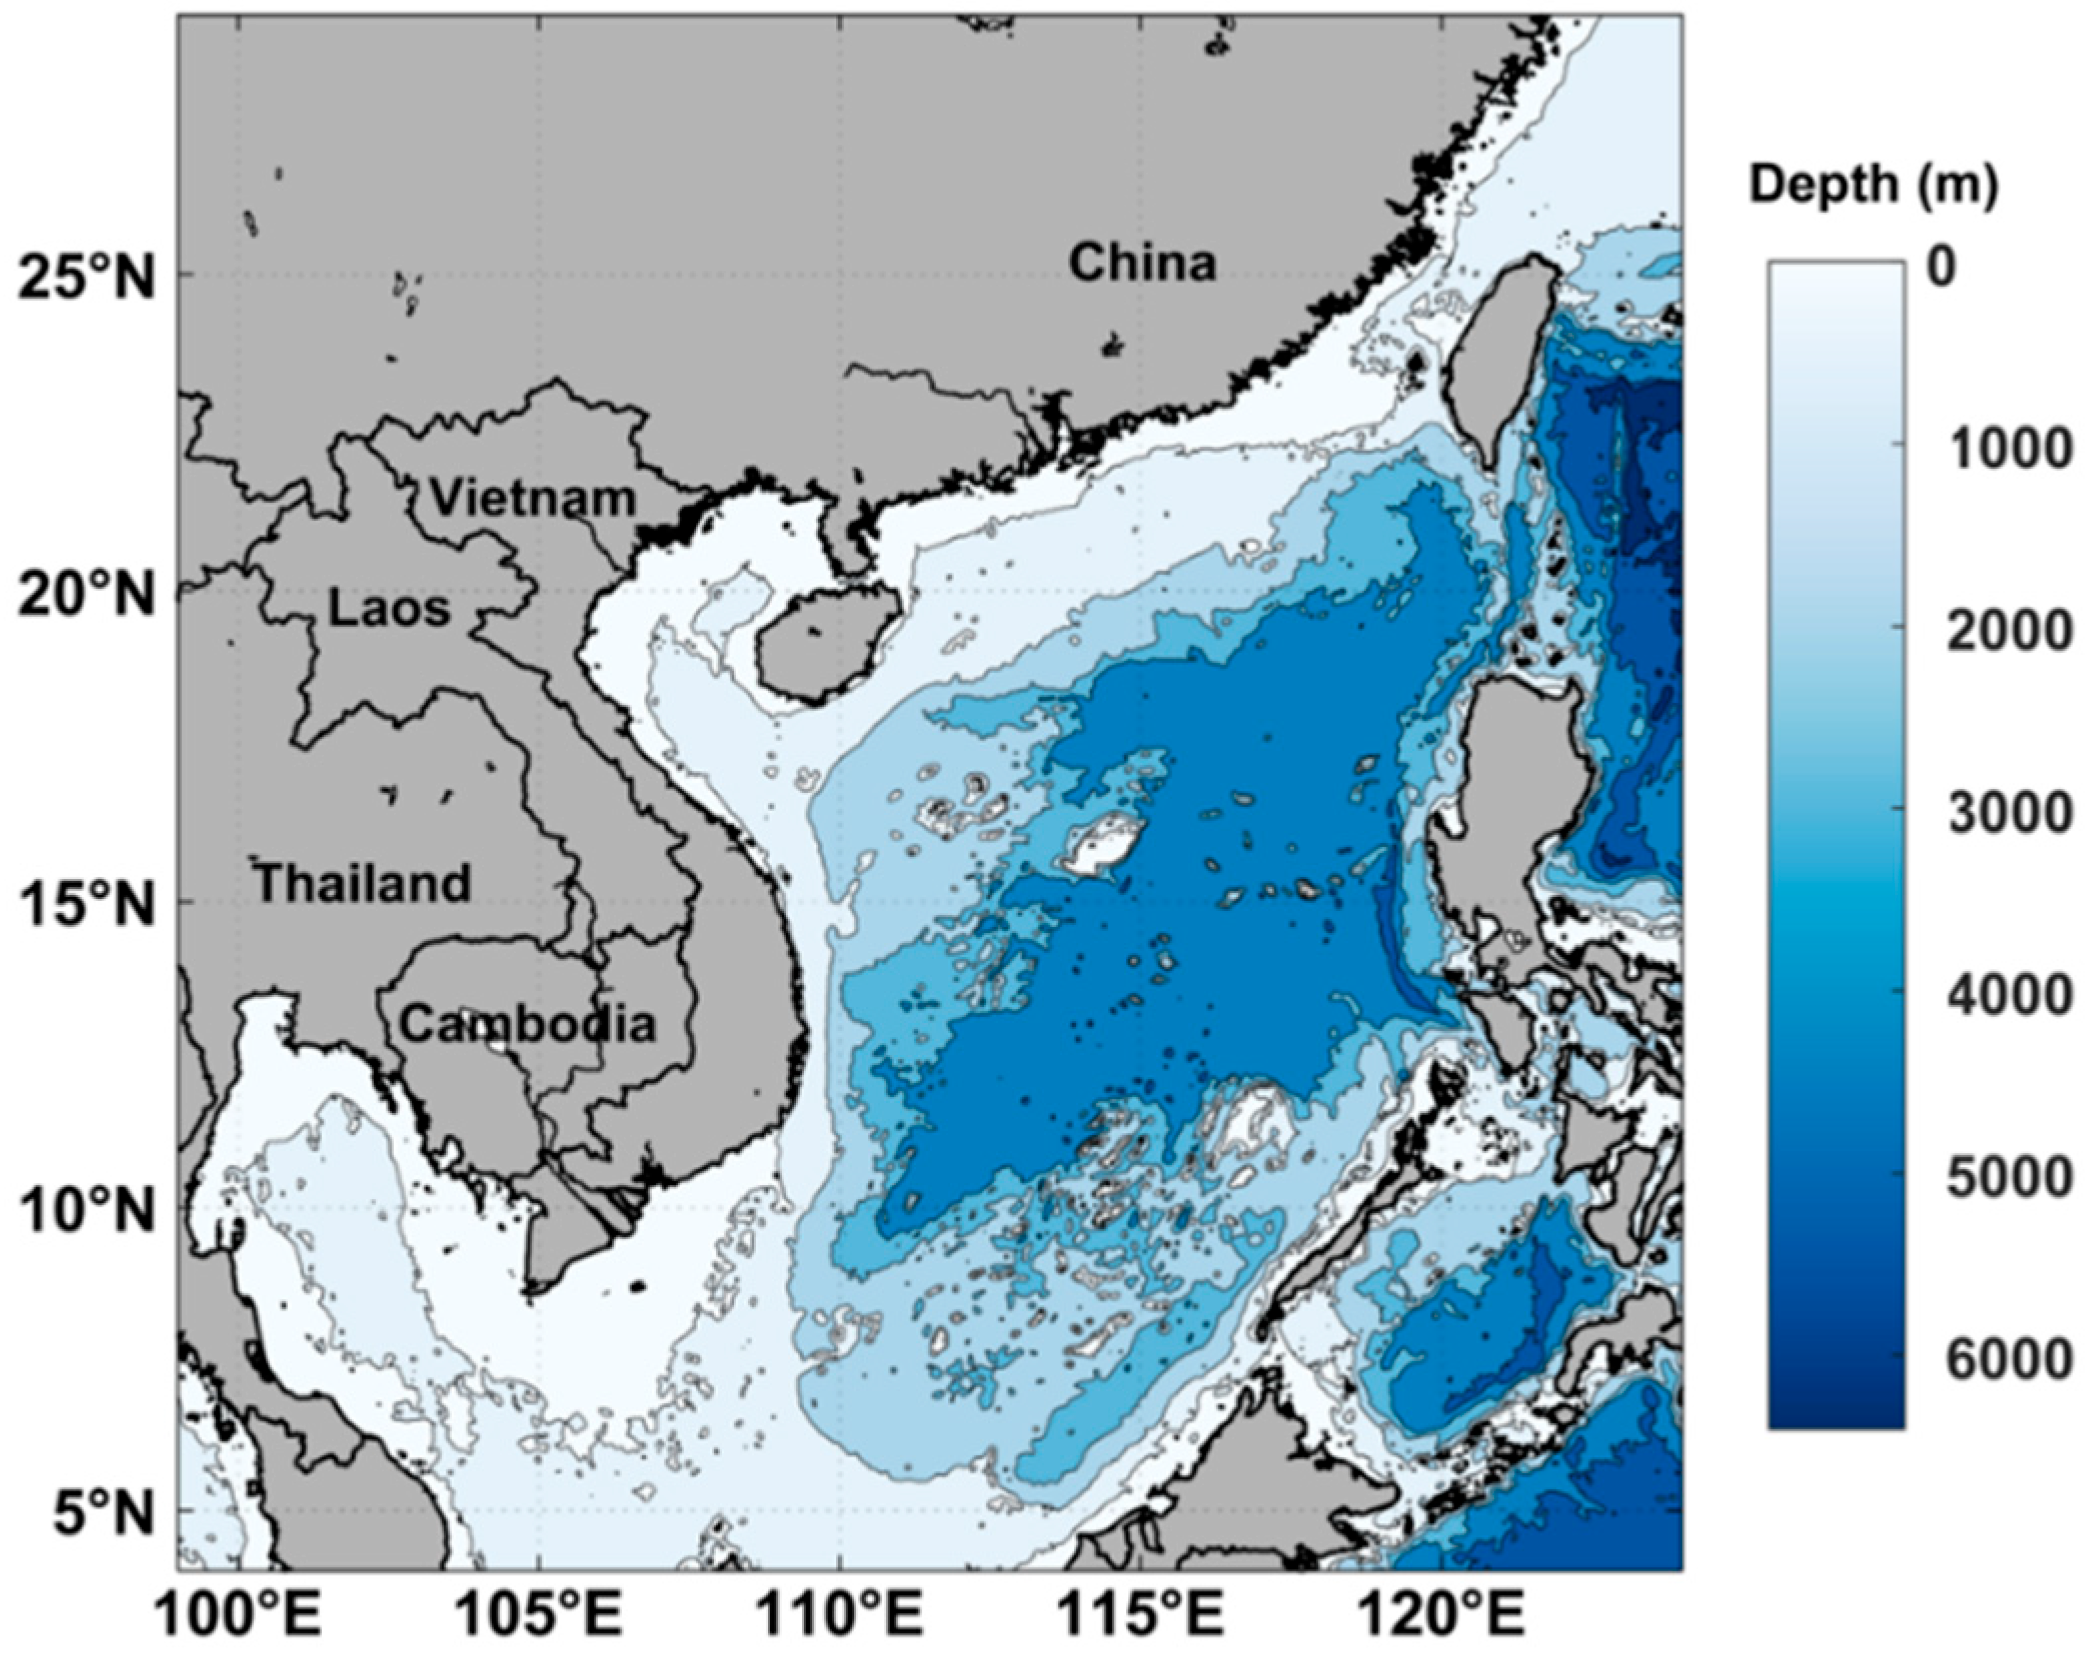
Figure 1. The bathymetry of the SCS derived from ETOPO1 (shaded: ocean depth; unit: m).
Remotesensing 16 01818 g001
Figure 2. The SCS surface current in (a) the summer (June–August) and (b) winter (December, January–February) averaged during the 1993–2021 period (unit: m/s). The SCS surface wind speed in (c) the summer and (d) winter averaged during the 1993–2021 period (unit: m/s).
Remotesensing 16 01818 g002
Figure 3. (a) The interannual variation in eddy numbers. (b) The seasonal variation in eddy numbers on average in a year during the 1993–2021 period. The blue (red) dashed lines indicate the trend of change in the number of CEs (AEs) on the interannual scale.
Remotesensing 16 01818 g003
Figure 4. The eddy number per year (lifetime ≥ 7 days) averaged during the 1993–2021 period for (a) CEs and (b) AEs.
Remotesensing 16 01818 g004
Figure 5. The distribution of eddy trajectories with lifetimes of at least 7 days during the 1993–2021 period (a sub image is drawn every two years). The trajectories of CEs (AEs) are shown in solid blue (red) lines, “*” is the position of eddy generation, and “o” is the position of eddy extinction.
Remotesensing 16 01818 g005
Figure 6. The number of eddies with different (a) lifetimes (days ≥ 7), (b) radius values (km), (c) EKE values (m2/s2), (d) SLA deviations (m), and (e) maximum current speeds (m/s) during the 1993–2021 period.
Remotesensing 16 01818 g006
Figure 7. Eddy (a) radius (km), (b) EKE (m2/s2), (c) SLA deviation (m), and (d) maximum current speed of eddy (m/s) based on different eddy lifetimes.
Remotesensing 16 01818 g007
Figure 8. SE number per year (lifetime ≥ 28 days) averaged during 1993–2021 period for (a) CE and (b) AE.
Remotesensing 16 01818 g008
Figure 9. The distribution of SE trajectories during the 1993–2021 period. The trajectories of CEs (AEs) are shown in solid blue (red) lines, “*” is the position of eddy generation, and “o” is the position of eddy extinction.
Remotesensing 16 01818 g009
Figure 10. Dipole eddy distribution averaged from 1993 to 2021 (No dipole structure is detected in 1998, 2006, 2010, or 2015). Colored shading and black vectors are SLA and geostrophic current anomalies, respectively.
Remotesensing 16 01818 g010
Figure 11. The numbers of eddies with different (a) vorticity (s−1) and (b) SST anomalies (°C) during the 1993–2021 period.
Remotesensing 16 01818 g011
Figure 12. (a) Spatial distribution of pressure (Pa; shaded) and wind speed (m/s; black vectors) during Typhoon “Lekima” (red circle) on 6 August 2019. (b) Distribution of SCS eddies on 6 August 2019. CEs (AEs) are shown in black (blue) solid lines, background colors represent SLA (m), and black vectors indicate surface current field (m/s).
Remotesensing 16 01818 g012
Figure 13. The distribution of surface eddies in the SCS from 2017 to 2021. The black box in (ac) shows the “Chelsea (C20210110-10°N, 113°E)-P” distribution from 2019 to 2021. The black box in (dh) shows the “Erin (C20210628-13°N, 113°E)-P” and “Eunice (A20210721-12°N, 111°E)-P” distributions from 2017 to 2021. The colored shading and black vectors represent the SLA and geostrophic current anomalies, respectively. The title of each subgraph is the date of the eddy distribution map. The CEs (AEs) are shown in blue (red) solid lines.
Remotesensing 16 01818 g013
Table 1. The pool of eddy names consisting of 100 boys’ (bold) and girls’ names.
AllyEliErinOakley
AaronCharlieJaydenLuna
AmberElvisEstherOliver
AdrianCharlotteJoeyLynn
AnyaEnzoEuniceRay
AidenChelseaKaiMia
AriaEricEvelynRoy
AlfieCherylKyleOllie
ArielEthanEvieRyan
AlvinChloeLeonPhoebe
AshleyEugeneHannahSamuel
AsherClaireLiamRenee
AstridEvanHaileySean
CasperCynthiaLucaRiley
AvaFelixHazelShane
CedricEileenLucasShane
AveryGavinIrisShawn
CharlieElaineLukeSylvia
CeciliaIanJamieTheo
ChrisElenaMurphyYuna
CeliaIvanJeanVincent
DavidEliseNathanYvonne
CelineJamieJoeyXavier
EasonEllieNoachZoe
CharleneJasperLenaZion
Table 2. Eddy numbers and names for 1993.
Eddy NumberEddy NameEddy NumberEddy Name
199306Ally (C19930101-10°N, 112°E)1993121Celia (C19930524-16°N, 112°E)
199309Aaron (A19930101-13°N, 113°E)1993126David (A19930527-18°N, 117°E)
199315Amber (A19930117-13°N, 116°E)1993132Celine (C19930624-16°N, 115°E)
199321Adrian (C19930122-15°N, 115°E)1993133Eason (A19930625-7°N, 110°E)
199333Anya (A19930207-6°N, 114°E)1993140Charlene (A19930628-13°N, 114°E)-P
199337Aiden (C19930215-17°N, 112°E)1993149Eli (C19930720-13°N, 114°E)-P
199338Aria (C19930216-23°N, 124°E)1993152Charlie (A19930725-17°N, 111°E)
199340Alfie (C19930217-21°N, 120°E)1993155Elvis (C19930803-8°N, 120°E)
199354Ariel (A19930311-8°N, 115°E)1993156Charlotte (A19930803-18°N, 116°E)
199355Alvin (A19930311-21°N, 124°E)1993173Enzo (A19930812-22°N, 124°E)
199357Ashley (C19930313-13°N, 118°E)1993178Chelsea (A19930824-9°N, 114°E)
199365Asher (C19930321-18°N, 118°E)1993181Eric (A19930827-14°N, 110°E)
199387Astrid (C19930406-12°N, 111°E)1993182Cheryl (A19930828-16°N, 113°E)
199389Casper (A19930409-14°N, 116°E)1993184Ethan (C19930830-20°N, 120°E)
199390Ava (C19930409-14°N, 112°E)1993187Chloe (C19930911-12°N, 116°E)
199394Cedric (A19930418-15°N, 118°E)1993192Eugene (C19930920-19°N, 115°E)
1993104Avery (C19930505-6°N, 115°E)1993205Claire (C19931010-14°N, 114°E)
1993105Charlie (C19930505-20°N, 117°E)1993216Evan (C19931014-12°N, 113°E)
1996109Cecilia (A19930519-15°N, 119°E)1993223Cynthia (A19931206-7°N, 108°E)
1993112Chris (C19930520-15°N, 114°E)1993234Felix (C19931212-14°N, 116°E)
Table 3. The eddy names of the three PSEs found in 2021.
YearPSE1PSE2PSE3
2017Does not existShawn (C20170713-14°N, 110°E)-PAmber (A20170724-10°N, 112°E)-P
2018Does not existCharlotte (C20180630-12°N, 114°E)-PIan (A20180828-10°N, 112°E)-P
2019Eunice (C20190119-10°N, 112°E)-PJean (C20190723-13°N, 112°E)-PHailey (A20190829-11°N, 112°E)-P
2020Xavier (C2020220-10°N, 112°E)-PEli (C2020604-13°N, 113°E)-PEason (A20200830-12°N, 113°E)-P
2021Chelsea (C20210110-10°N, 113°E)-PErin (C20210628-13°N, 113°E)-PEunice(A20210721-12°N,111°E)-P
Disclaimer/Publisher’s Note: The statements, opinions and data contained in all publications are solely those of the individual author(s) and contributor(s) and not of MDPI and/or the editor(s). MDPI and/or the editor(s) disclaim responsibility for any injury to people or property resulting from any ideas, methods, instructions or products referred to in the content.