Abstract
Underwater acoustic vector sensors (UAVSs) are increasingly utilized for remote passive sonar detection, but the accuracy of direction-of-arrival (DOA) estimation remains a challenging problem, particularly under low signal-to-noise ratio (SNR) conditions and complex background noise. In this paper, a comprehensive theoretical analysis is conducted on UAVS signal preprocessing subjected to gain-phase uncertainties for average acoustic intensity measurement (AAIM) and complex acoustic intensity measurement (CAIM)-based vector DOA estimation, aiming to explain the theoretical restrictions of intensity-based vector acoustic preprocessing approaches. On this basis, a generalized vector acoustic preprocessing optimization model is established in which the principle can be described as “maximizing the denoising performance under the constraints of an equivalent amplitude-gain response and phase-bias response”. A novel vector acoustic preprocessing method named linear matched stochastic resonance (LMSR) is proposed within the framework of matched stochastic resonance theory, which can naturally guarantee the linear gain-phase restrictions, as well achieving effective denoising performance. Numerical analyses demonstrate the superior vector DOA estimation performance of our proposed LMSR-AAIM and LMSR-CAIM methods in comparison to classical intensity-based AAIM and CAIM methods, especially under low-SNR conditions and non-Gaussian impulsive noise circumstances. Experimental verification conducted in the South China Sea further verifies its the effectiveness for practical application. This work can lay a solid foundation to break through the challenges of underwater remote vector acoustic DOA estimation under low-SNR conditions and complex ocean ambient noise and can provide important guidance for future research work.
1. Introduction
Underwater acoustic vector sensors (UAVSs) have attracted increasing attention in recent years for both military and civilian applications [1,2,3]. A single UAVS is composed of three orthogonally oriented uniaxial “particle-velocity sensors” plus a “pressure sensor”, all collocated in a point-like spatial geometry and, hence, can measure the full sound-field information. Compared to a traditional pressure sensor array, a vector acoustic sensor array can be seen as an extended array with several times the number of array elements with the same size [4]. Therefore, array signal processing techniques were initially developed for vector acoustic sensor arrays, such as conventional beam forming (CBF), multiple-signal classification (MUSIC), minimum-variance distortionless response (MVDR), estimation of signal parameters via rotational invariance technique (ESPRIT), etc. [5,6,7,8,9].
A AVScan be regarded as a point-space array. This merit can overcome the disadvantage of conventional arrays with a large aperture size and can enable estimation of both elevation and azimuth without left–right ambiguity, particularly for underwater very-low-frequency (VLF) remote passive sonars. Accordingly, single UAVSs have been ubiquitously applied in small underwater platforms, such as gliders, ocean bottom seismometers (OBSs), subsea latent buoys, and other ocean-monitoring equipment [10,11,12,13]. As a consequence, a sizable amount of the literature has focused on the application of single UAVSs in recent years, mainly with respect to vector acoustic DOA estimation [3,4,14,15,16,17,18,19,20,21,22]. From the point of view of methodology, there are three kinds of directions for single-vector acoustic DOA estimation, namely array signal processing-based methods and intensity-based methods. Array signal processing-based techniques like CBF, MVDR, ESPRIT, and MUSIC can be initially adopted with consideration of a point-space array [14,15,16,23]. However, the different signal-to -noise ratios (SNRs) of vector channels may corrupt the signal subspace, which leads to performance degradation when using the method under lower-SNR circumstances. Several studies have utilized higher-order statistics for preprocessing. Agarwal et al. [24] employed higher-order statistics that can increase the sound-source count estimation in utilizing a single UAVS. Zhang et al. [25] proposed a high-resolution ESPRIT algorithm for single-UAVS DOA estimation. The algorithm is based on higher-order cumulants with Gaussian noise suppression characteristics so that the estimation accuracy can be improved at lower SNRs. This method is essentially an improved array signal processing technique; the main idea is to adopt a denoised preprocessing method. Wang et al. [26] proposed a learning soft mask with DNN and DNN-SVM for multi-speaker vector acoustic DOA estimation. It can accurately extract TD-TFPs under different background noise and reverberant conditions, while this method was developed to solve the problem under high-SNR conditions. The intensity-based methods can generally be classified into two major categories, namely average acoustic intensity measurement (AAIM)-based methods in the time domain and complex acoustic intensity measurement (CAIM)-based methods in the frequency domain [4]. Related research has lasted for a long time. Experimental comparisons and verifications have shown that CAIM-based methods have more potential compared with array signal processing-based methods and intensity-based methods [15]. Since acoustic intensity measurement-based algorithms are proposed for zero mean and uncorrelated background noise, these methods are generally limited under higher-SNR conditions and ideal white Gaussian noise (WGN) backgrounds. Therefore, for practical application requirements, the CAIM method still suffers to low accuracy, especially for remote targets that correspond to lower-SNR and complex ocean ambient noise conditions.
To ease this problem, a weighted bar graph statistics-based CAIM method named WCAIM was proposed that can achieve better vector acoustic DOA estimation performance [15]. Zhong et al. [27] utilized the particle-filtering approach to vector acoustic DOA estimations, which can improve the accuracy performance for the sake of tracking processing. Similarly, Gunes et al. [28] utilized a Bernoulli filter and random finite sets to reprocess vector acoustic DOA estimations for better tracking. Chen et al. [29] proposed a source-counting method of vector acoustic DOA histograms for multi-source distinguishing. It can certainly improve the estimation performance due to its statistical property, while it essentially cannot solve the low-SNR problem, as it is a post-processing approach. Such methods can be regarded as post-processing methods, as they reprocess the DOA estimation outputs within a period of time to decrease the estimation error. However, these post-processing methods cannot essentially solve the poor accuracy performance under low-SNR circumstances. Therefore, several researchers have focused on preprocessing approaches. Zhao et al. [17] proposed an improved vector DOA estimation method utilizing matched filter preprocessing, which is considered to achieve the best output under a WGN background. However, this method can only be utilized with strictly defined prior information in active sonar systems. Stinco et al. [3] considered modulation analysis to determine the signatures in broadband propellers’ cavitation noise and proposed XC-DEMON and TF-DEMON to represent the intensity vector with DEMON preprocessing. Nevertheless, DEMON preprocessing can improve the clarity of ship features, while it is unable to process the received signal under low-SNR conditions. Cao et al. [30] utilized machine learning approaches to improve AVS-DOA estimation performance. However, the limited sample data restrict its generalization for real applications. Dong et al. [31] proposed a novel convolution (COV)-based single-vector acoustic preprocessing method that can improve vector acoustic DOA estimation performance. However, the improvement is limited in terms of filtering effect. It also suffers from degraded performance under complex non-Gaussian background noise. In view of the above analyses, to solve the problem of low-SNR vector acoustic DOA estimation, vector acoustic preprocessing with superior noise suppression performance should be adopted. In view of the possible influence of preprocessing methods on vector DOA estimation, the following two problems are worth studying:
- (1)
- What are the theoretical restrictions of preprocessing methods for vector DOA estimation?
- (2)
- How can vector acoustic DOA estimation performance be improved under low-SNR conditions and complex background noise?
Stochastic Resonance (SR) is an exciting nonlinear physical phenomenon in which the output of received noisy signals can be greatly enhanced under low-SNR conditions. It has been proven effective for weak-signal detection, particularly under low-SNR conditions and complex non-Gaussian background noise. Therefore, it has attracted considerable attention in a variety of research fields [32,33,34,35]. In our previous work, a matched stochastic resonance framework was proposed for remote passive sonar detection [35,36,37,38]. This work can effectively improve weak-signal detection performance, especially under low-SNR circumstances. Therefore, we further employed a particular parameter-tuning method with a classical bistable stochastic resonance model for vector acoustic DOA estimation, which can effectively improve AAIM estimation performance [20]. This work preliminarily demonstrated that preprocessing using bistable stochastic resonance can enhance vector acoustic DOA estimation under low-SNR conditions. However, it was simply realized by single adjustment of the system potential parameter (b) and keeping the system potential parameter (a) constant.
In view of the abovementioned research, in this paper, a comprehensive theoretical analysis is conducted on UAVS signal preprocessing subjected to gain-phase uncertainties for AAIM- and CAIM-based vector acoustic DOA estimation, aiming to establish a generalized vector acoustic preprocessing optimization model. A novel preprocessing method named linear matched stochastic resonance (LMSR) is proposed, which can achieve a superior vector DOA estimation performance under low-SNR conditions and Lévy impulsive noise circumstances. The main contributions of this work can summarized as follows:
- (1)
- A generalized vector acoustic preprocessing optimization model is established in a comprehensive theoretical analysis of UAVSsignal preprocessing, which indicates that the gain-phase constraints for vector DOA estimation are independent of the P channel.
- (2)
- A novel preprocessing method named linear matched stochastic resonance (LMSR) is proposed within the framework of matched stochastic resonance theory, which can naturally guarantee linear gain-phase restrictions, as well as achieving effective denoising performance.
- (3)
- Superior vector acoustic DOA estimation performance is achieved in comparison with classical intensity-based AAIM and CAIM methods, especially under low-SNR conditions and non-Gaussian impulsive noise circumstances.
- (4)
- This work can lay a solid foundation to break through the challenges of underwater remote vector acoustic DOA estimation under low SNR and complex ocean ambient noise and can provide important guidance for future research work.
The rest of this paper is arranged as follows. In Section 2, the generalized vector acoustic preprocessing optimization model is presented in a comprehensive theoretical analysis on AVSsignal preprocessing subjected to gain-phase uncertainties. In Section 3, the linear matched stochastic resonance (LMSR) method is proposed, and its implementation algorithm is presented within the framework of matched stochastic resonance theory. Simulation outcomes are evaluated in Section 4, and experimental verification is presented in Section 5. Finally, discussion and concluding remarks are presented in Section 6 and Section 7, respectively.
2. Generalized Vector Acoustic Preprocessing Optimization Model with Theoretical Analyses
2.1. Vector Acoustic Preprocessing Analysis Model Subject to Gain-Phase Uncertainties
An “underwater acoustic vector sensor” (UAVS) (known as an “underwater vector hydrophone”) is composed of a sound pressure sensor and vibration speed sensor to measure the pressure and vibration velocity of the sound field at one point, respectively. At any time (), it can measure the sound pressure () and three orthogonal vibration velocities (, , and , corresponding to the , , and axes, respectively).
In the follow-up discussion with the assumption of x–o–y plane waves, we can omit the height information for simplicity; then, the observations of UAVS can be simply expressed as [21]
where is the source signal; symbolizes the incident source’s elevation angle; denotes the corresponding azimuth angle; gathers the factor between the pressure and vibration velocity; and , , and are the corresponding noise items of the received vector acoustic signals and assumed to be uncorrelated with the source signal (). Assume that the noise field of the marine environment is isotropic and the autocorrelation coefficient of vibration velocity channel noise is 1/2; hence, the covariance matrix () can be expressed as
where is the variance of the P channel.
In general, to improve vector acoustic DOA estimation performance, signal preprocessing methods with noise reduction are likely to be adopted, especially under low-SNR conditions. However, different methods result in different output gain and phase-lag responses, causing unexpected significant estimation error.
To analyze the effects on estimation accuracy of different preprocessing (or denoising) methods, a generalized vector acoustic preprocessing analysis model is proposed below. The preprocessed vector acoustic signals with denoising effects of , , and can be subjected to a random gain-phase responses as follows:
where , , and represent the output gain response corresponding to the p, x, and y channels, respectively; , , and are the phase-bias responses of the three channels; and , , and are the noise items associated with the preprocessing approaches. Note that when = = = 1, = = = 0, corresponding to no pretreatment, which is consistent with the received signal of Equation (1).
2.2. Theoretical Analysis of Gain-Phase Constraints for AAIM
Ship radiated noise can be modeled as a combination of broadband noise and sinusoidal tonal signals. These sinusoidal tonals are generally considered the “acoustic fingerprint” of a moving vessel (refer to ship radiated line spectral signatures [39]). For simplicity, we can assume the target signal is a single sinusoidal tonal, as below.
where represents the character frequency and and are the corresponding amplitude and phase, respectively. Then, the gain-phase constraints of preprocessing for vector DOA estimation with the classical AAIM and CAIM can be analyzed as follows. For the AAIM method, the average acoustic intensity can be calculated as follows:
where denotes time averaging for sound intensity, and the corresponding the average acoustic intensity of and can be obtained as follows:
According to the principle of the AAIM method, the azimuth estimator () can be calculated as follows:
In consideration of preprocessing, we have the preprocessed vector acoustic signals according to Equation (3), and the average sound intensity of and can be described as follows:
This can be rewritten as
where and refer to the gain coefficients related to , and and represent the corresponding unrelated noise parts. Their mathematical representations are presented as follows:
and
From Equations (10) and (11), we can see that , , , and are directly related to the amplitude-gain response and phase-shift response, which will affect the accurate estimation of the target. Hence, considering an asymptotic unbiased estimator () of the true azimuth () after preprocessing, it is necessary to have
The equivalent condition can be difficult to satisfy for the sake of noise; hence, we could have an intuitive mathematical description of its asymptotic unbiased estimator () as below.
On this basis, theoretical discussions about the constraints are given as follows:
(1) For the first constraint (), according to Equation (10), we can see its amplitude directly related to the amplitude-gain response (, , and ) and phase-bias response (, , and ). In a strict sense, we can find a particular solution with an equivalent amplitude-gain response, as well as phase-bias lags; that is to say,
To ease up on these strict conditions, assume that the preprocessed noise item of the p channel is zero, meaning that = 0; then, Equation (10) can be rewritten as below.
Hence, Equation (14) can be simplified without regard to the p channel as follows:
This means the preprocessing method for the p channel is dependent on the x channel and y channel.
(2) For the constraints of and , according to Equation (11), we could have the preprocessed noise items of the x channel and y channel be zero and uncorrelated with the noise item of the p channel as follows:
However, in actual situations, , , and are probably correlated and nonzero mean. In general, under high-SNR conditions, the signal-item accumulation of the sound intensities of the x and y channels are large enough that and ; hence, they have a minimal effect on the estimation results. Nevertheless, under the lower-SNR conditions, the influence of noise influence on estimation error is significant, directly leading to the phenomenon of a rapid increase in estimation error. And in this circumstance, signal preprocessing with good filtering or noise reduction performance should may be affected. To asymptotically achieve and , filtering approaches can be adopted by maximizing the SNRI performance of the vector channels.
According to the aforementioned analyses, the constraints in Equation (13) can be eased and rewritten as below.
where equivalent gain-phase constraints of the x and y channels should be satisfied in order to achieve the desired denoising performance. , , and represent the SNR improvement (SNRI) of the x, y, and p channels, respectively.
2.3. Theoretical Analysis of Gain-Phase Constraints for CAIM
Such a calculation of acoustic intensity can be completed in the frequency domain by the CAIM method as well [15]. Owing to the sparse nature of target signal energy in the frequency domain, using CAIM can achieve a frequency-domain filtering effect. Therefore, the CAIM performs better than AAIM, especially under lower-SNR and multi-target source conditions. In this case, the direction of the intensity can be obtained by fast Fourier transform of the preprocessed vector channel signals as follows:
where and are the angular frequencies, and , , and are the amplitudes of background noise in the frequency domain. Then, we have
where is the estimated azimuth of the acoustic source, denotes the real part, and * represents the complex conjugation.
Then, we apply complex conjugation to and and multiply them by .
in which , , , and can be written as
and
where .
Equations (22) and (23) can be expanded by using Euler’s formula, taking the real part as follows:
and
Its asymptotic unbiased estimator () can be obtained as below.
In consideration of the constraints in Equation (18), as we have and , the constraint of can be satisfied. The noise items ( and ) represent the noise energy corresponding to the frequency (). They can be smaller than the and of the AAIM method measured in the time domain. Hence, Equation (26) can be eased and rewritten as below.
where the gain-phase constraints of CAIM are in accordance with AAIM. This means that under the same amplitude-gain and phase-shift constraints, preprocessing methods need to maximize the noise reduction performance.
2.4. Generalized Vector Acoustic Preprocessing Optimization Model
According to Equations (18) and (27), the principle of a generalized vector acoustic preprocessing optimization model can be described as ’maximizing denoising performance under the constraints of equivalent amplitude-gain response and phase-bias response’. Its mathematical relationship can be expressed as
in which SNRI is the sum of , , and . From the point view of the constraints in Equation (28), intuitively, we can see that the gain-phase constraints for vector acoustic DOA estimation are independence of the P channel. That means that the vector acoustic signal preprocessing method should have a linear gain response, as well as a certain phase bias for the x and y channels. To satisfy and , a superior noise reduction performance with preprocessing techniques is required, as the noise items of , , and are small enough.
In summary, the vector acoustic preprocessing method for the p channel is dependent on the x channel and y channel. To obtain an unbiased estimate of , the vector acoustic preprocessing techniques should be constrained by a linear gain-phase response, as well as the desired denoising performance. Note that the model can be applied to the array signal processing techniques of single-vector DOA estimation as well and can explain the matched-filter preprocessing approach proposed by Zhao et al. [17] for its linear signal processing characteristic.
3. Linear Matched Stochastic Resonance
3.1. Classical Bistable Stochastic Resonance (CBSR)
Stochastic resonance is a nonlinear phenomenon whereby a transfer of energy from noise to periodic signals can occur with a certain matched relationship of the signals, noise, and system nonlinearities. Such a phenomenon can be commonly described by Brownian motion.
in which m is the mass of the Brownian particle, x is the displacement trajectory, and is the coefficient of friction. represents a periodic signal with an amplitude of , a driving frequency of , and an initial phase of . represents the noise item, in which D and represent the noise intensity and additive noise, respectively. denotes the nonlinear quartic double well (QDW) potential as shown below.
where a and b denote the barrier potential parameters. For the potential (), there is one maximum and two minimum values at and , respectively. The depth between the maximum point and minimum point denotes the energy barrier as .
For simplicity, an overdamped LE model is commonly adopted [40].
In the situation of a stochastic signal forced nonlinear system, the statistical properties of particle transition between two potential wells can be characterized by the famous Kramers rate as follows:
where and represent the characteristic frequencies of the nonlinear system, and the bistable nonlinear system output amplitude response with a small periodic input signal can be written as
in which the nonlinear system output amplitude () and phase lag () can be expressed as
For an actual noisy signal, the noise intensity (D) can be regarded as fixed in a period of time under a high sampling frequency. As a result, and can be further written as
To characterize the performance of SR, we can use the system output power spectra to analyze the denoising performance with signal-to-noise ratio improvement (SNRI). In this way, the output power spectra of a nonlinear LE system can be expressed as [41]
in which and represent the corresponding output power spectra of signal and noise, respectively.
and
From Equation (38), we can see that the Kramers rate () is related to the output power spectra (), the system potential parameters (a and b), noise intensity (D), and driving frequency (). Therefore, for the periodic input with additive Gaussian noise in Equation (31), the input SNR of the system can be expressed as [42]
Upon combining Equations (37) and (38), the SNR output corresponding to Equation (31) can be finally approximated as [41]
Consequently, we have the SNRI as
where the output performance can be determined by the noise intensity (D), the barrier height (), and the damping factor ().
From the perspective of potential parameter tuning [43], utilizing SR for weak signal processing could be considered a nonlinear filter [36]. As a consequence, the system output amplitude and phase response should be nonlinear, stochastic, and arbitrarily distributed for varied system parameters, as shown in Figure 1.
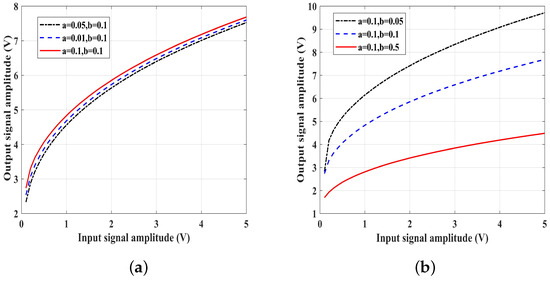
Figure 1.
Performance comparison for vector DOA estimation (a) input and output amplitude response of CBSR with varied a; (b) input and output amplitude response of CBSR with varied b.
3.2. Theory of Matched Stochastic Resonance (MSR)
The definition of matched stochastic resonance can be described as follows: For a dynamic nonlinear system, under the constraint of stochastic resonance effect, the nonlinearity of the system can be parameterized and optimized to achieve a matched output in maximizing the signal-to-noise ratio improvement (SNRI). Its generalized mathematical representation can be expressed as follows [35,36,37]:
where SR conditions can be obtained by classical theories and methods, including time-scale matching conditions [40,43], stability conditions [42,44], threshold conditions [45], amplitude gain under weak noise limit conditions [46], etc.
Assume a periodic forcing signal is applied to the particle in a bistable QDW potential; the matched relationship of the signal frequency (), noise intensity (D), and nonlinear system parameters (a and b) can be obtained by maximizing the system SNRI. This can be forulated as optimization problem as below [47].
where the constraint is the time-scale matching condition, is the threshold condition, and the constraint of is to ensure the denoising performance by utilizing an SR approach. Then, the optimization problem in Equation (43) can be further optimized with the respect to as follows:
To the sanctification of the SR matching principle, we can obtain the relationship of the mathematical matched potential parameters as below.
where and represent the estimations of the signal frequency () and the noise intensity (D), respectively, and e is the natural logarithm.
Consequently, the in Equation (40) can be rewritten as below.
Since we have the constraint of , the following relationship should be satisfied:
This can be further simplified under the assumption of adiabatic approximation as
Consequently, the optimization problem in Equation (43) can be simplified as below.
In this way, a weak signal submerged in a heavy background can be enhanced and detected. A comparison of output SNR curves corresponding to different input noise intensities is presented in Figure 2. For a deterministic static nonlinear system with fixed system parameters (CBSR), the curve of the output SNR varies with noise intensity (D) as a “resonance” curve, where there exists an optimal noise intensity value () that can achieve the maximum . For the curve corresponding to the MSR, we can see that the system parameters can be optimized under any circumstance, and its performance is generally weaker than the optimal matched filter under Gaussian noise.
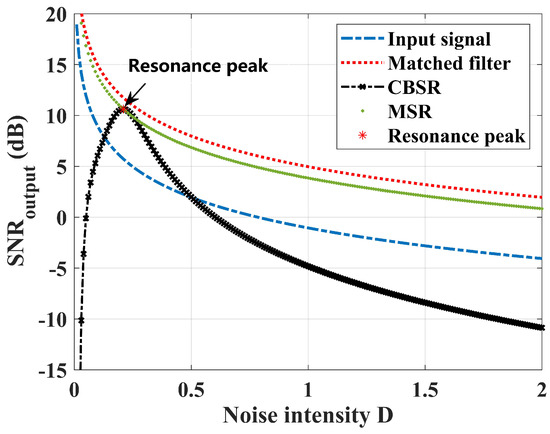
Figure 2.
A comparison of MSR output SNR responses under different noise intensities (D).
3.3. Linear Matched Stochastic Resonance for Vector Acoustic Preprocessing (LMSR)
According to the aforementioned analysis in Section 2, we have the constraints of vector acoustic preprocessing. Hence, the linear matched stochastic resonance can be generally modeled by maximizing the SNRI in the constraints of linear gain response and phase lag for SR output ( and ) as below.
where k is the linear factor, and denotes to a determined phase lag. The constraint of is to guarantee an optimal resonance output with optimized denoising performance. This can be realized according to Equation (48); then, we have
In consideration of the matched relationship in Equation (43), we have ; hence the in Equation (49) can be properly satisfied as a constant value.
This means that for AVSsignals with the same frequency (), utilizing LMSR for preprocessing would result in a constant phase lag. This is obvious, as shown in Equation (1). Then, the problem can be eased as the constraint of equivalent phase bias response can be intuitively guaranteed. For the linear amplitude constraint in Equation (49), as the optimal noise intensity () we have
It can be seen that the matched output amplitude of the LMSR is only inversely proportional to the system potential parameter (a). Hence, when is a constant value, the constraint of linear gain response can be satisfied. In this way, incorporating Equation (48) into Equation (49), the LMSR model in Equation (50) can be generally rewritten as
in which parameter a is varied with the signal frequency estimator (), which can be intuitively guaranteed as well.
This can yield to a novel linear matched stochastic resonance phenomenon with a linear gain-phase response. And according to the analytic results, a vector acoustic signal preprocessing strategy can be designed to enhance single-vector acoustic DOA estimation performance.
3.4. Implementation of LMSR-Based Vector Acoustic DOA Estimation
In the last subsection, we presented the optimization model of LMSR in Equation (53). Here, we introduce the implementation of an LMSR-based vector acoustic DOA estimation method for a single UAVS. The framework is illustrated in Figure 3, and the detailed implementation steps are summarized as follows:
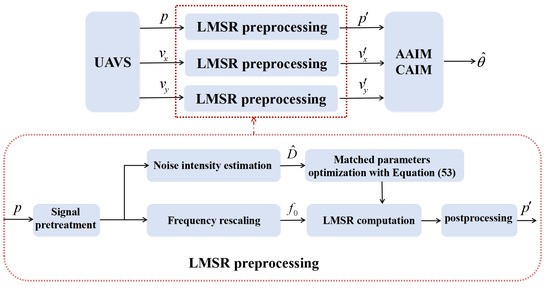
Figure 3.
The framework of LMSR-based vector acoustic DOA estimation method.
- (1)
- Signal pretreatment: Common techniques such as band-pass filtering, data normalization, or envelope extraction are executed to better reveal the signal periodicity of the actual received noisy signals.
- (2)
- Frequency rescaling: According to the adiabatic approximation theorem, the SR system is restricted by input signals with a low frequency () of Hz. For practical high input-signal frequencies of tens to thousands of hertz, a frequency rescaling preprocessing technique can be utilized to satisfy the assumption. By introducing a scaling factor () in the process of solving the Runge–Kutta algorithm, the signal frequency () is equivalently converted to a desirable value () as below.in which is the sampling time. Generally, the should be small enough; in this paper, the empirical value is set to Hz.
- (3)
- Noise intensity estimation: The noise intensity estimator () is obtained following a penalization-based least squares method by minimizing the generalized cross-validation score [48].
- (4)
- Parameter optimization: The reference frequency is initialized as Hz, and the optimal parameters ( and ) can be obtained according to Equation (53).
- (5)
- LMSR computation: The LMSR output corresponding to all the received AVS-channel signals is computer. The fourth-order Runge–Kutta (RK4) method is adopted to obtain the numerical solution of the LMSR output under Gaussian noise [35]. For the circumstance of Lévy impulsive noise, the numerical solution is reported in [49].
- (6)
- Post-processing: The Lorentz effect of SR, DC offset, and low-frequency interference removal are applied.
- (7)
- Vector acoustic DOA estimation: The estimation results are calculated by using the AAIM and CAIM methods with the processed multichannel UAVS signals.
4. Simulation Analyses
In this section, the simulation results are presented to verify the proposed methods. It is known that the effectiveness of LMSR for AAIM and CAIM depends on its ability to achieve a linear amplitude response as well as a fixed phase lag. Therefore, we first conduct simulation analyses to evaluate its amplitude responses. Then, the vector DOA estimation performances of LMSR-AAIM and LMSR-CAIM are further evaluated in comparison with traditional AAIM and CAIM methods under different SNR conditions. In the consideration of the merits of SR in dealing with complex background noise, the estimation performance under typical non-Gaussian impulsive noise is evaluated as well.
4.1. Linear Amplitude Response Characteristic Analysis
To assess the linearity of LMSR, the relationship between the input and output signal amplitudes is investigated. Here, we focus on analyzing the time-domain and frequency-domain quantization results under the same received signal amplitude. The output amplitudes corresponding to the time and frequency domains can be evaluated as below.
- (1)
- For the time-domain average amplitude quantization, we use peak averaging, which can be defined aswhere M is the number of sliding windows, and and represent the maximum and minimum amplitude within the i-th sliding window, respectively.
- (2)
- For the frequency domain, we calculate the average amplitude value corresponding to the signal frequency via fast Fourier transform (FFT).where is the number of points of the FFT, represents the amplitude of FFT corresponding to the signal frequency (), and ∗ denotes the complex conjugation.
The tested signal is a noisy sinusoid with signal a frequency of = 50 Hz, a sampling frequency of = 1 kHz, and a data length of 3000 points to better reveal its output performance. The classical frequency-shifted and rescaling SR method [50] with an elliptic high-pass filter is utilized with pass-band cut-off frequency and stop-band cut-off frequency set as and , respectively. The scale transformation factor (R) is set as 200. We fix the noise intensity as D = 1 under the assumption of white Gaussian noise, and the signal amplitude () is varied from 0 to 1. This can reveal the performance of different SNR conditions, where the smaller the , the lower the SNR. According to Equation (53) the optimal parameters can be directly obtained as and .
The amplitude responses in the time and frequency domains of the received noisy signals and the corresponding LMSR output signals, respectively, are shown in Figure 4. Every point of average amplitude quantization is obtained independently 20 times according to the simulation results. As the linear response property is derived in theory, we thought 20 times is enough and appropriate to reveal the amplitude responses. In comparison with Figure 4a,b, the amplitude response can only have a certain degree of linearity when the received noisy signal amplitude is large enough under higher-SNR conditions. Intuitively, the frequency-domain quantization results can be improved under lower-SNR circumstances. This is in accordance with the results, as CAIM performs better than AAIM. For the LMSR preprocessed output signals shown in Figure 4c,d, the linearity of the amplitude response is obviously improved, and improved vector DOA estimation performance can be expected. In view of the linear fitting curve, the frequency-domain quantization should be better, especially under low-SNR conditions. This indicates that LMSR-CAIM can achieve better performance, which is in accordance with the following DOA estimation results.
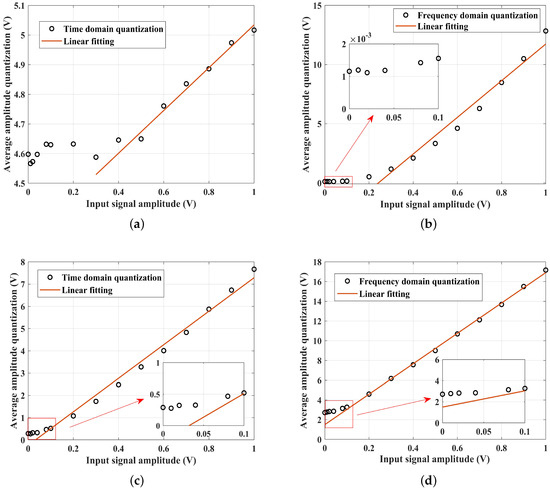
Figure 4.
Performance comparison for vector DOA estimation. (a) Time-domain quantization of received noisy signal; (b) frequency-domain quantization of received noisy signal; (c) time-domain quantization of preprocessed signal with LMSR; (d) frequency-domain quantization of preprocessed signal with LMSR.
4.2. Estimation Performance Analysis under White Gaussian Noise (WGN)
To verify the effectiveness of the performance of LMSR as a preprocessing method for vector DOA estimation, the estimated mean error (ME) and root-mean-square error (RMSE) of the azimuth angle are evaluated in comparison with the classical AAIM and CAIM methods [15]. Since the SNRs of AVSchannels are different, the SNR of the P channel is adopted for reference. The target source azimuth is simulated as 30°, and the ME and RMSE can be calculated as
and
where and represent true azimuth and estimated azimuth of the source, respectively, and N is the number of independent Monte Carlo trials. Note that every data point is obtained by 200 independent realizations.
As clearly shown in Figure 5, superior performance can be achieved with LMSR-AAIM and LMSR-CAIM, especially under low-SNR conditions. We can see that the performance of CAIM-based vector DOA estimation is better overall. For SNR < −10 dB, classical CAIM loses its performance quickly, while the mean error of SR preprocessing remains within until −25 dB. In comparison with the RMSE, within , the performance of the classical CAIM method is about −5 dB, while that of the proposed LMSR-CAIM method is about to −15 dB. Overall, within a certain level of estimation error, our proposed LMSR-CAIM is 10 dB better than the classical method, which can break through the hard problem of low-SNR vector DOA estimation.
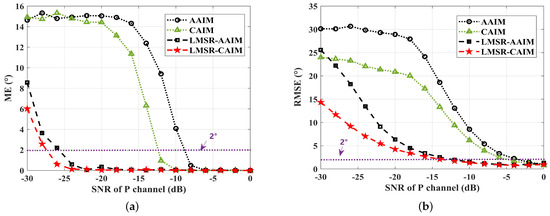
Figure 5.
Performance comparison for vector acoustic DOA estimation of AAIM, CAIM, LMSR-AAIM, and LMSR-CAIM. (a) Mean error (ME); (b) root-mean-square error (RMSE).
4.3. Estimation Performance Analysis under Non-Gaussian Impulsive Noise
Generally, a Gaussian assumption is widely used to describe background noise for simplicity in theory, while not always appropriate to describe real noisy processes. Since ocean ambient noise can be impulsive in nature, especially in the low-frequency band ( Hz), the stable distribution () provides an excellent way to model complicated noise processes and is employed and analyzed in the following sections of this paper. is a stability index that describes an asymptotic power law of the Lévy distribution; the smaller the , the stronger the pulse characteristics. refers to Gaussian noise. For ocean ambient noise, we set a typical impulsive noise with . As for , there is no finite variance of noise, and the noise intensity can be obtained via noise power as
where is the exponential form of Euler’s constant, and is the dispersion coefficient. In this paper, the Janicki–Weron algorithm is employed to generate the noise sequence [49]. A simulation of vector acoustic signal under impulsive noise is presented in Figure 6, where we can see that impulsive noise would seriously affect the average amplitude quantization.
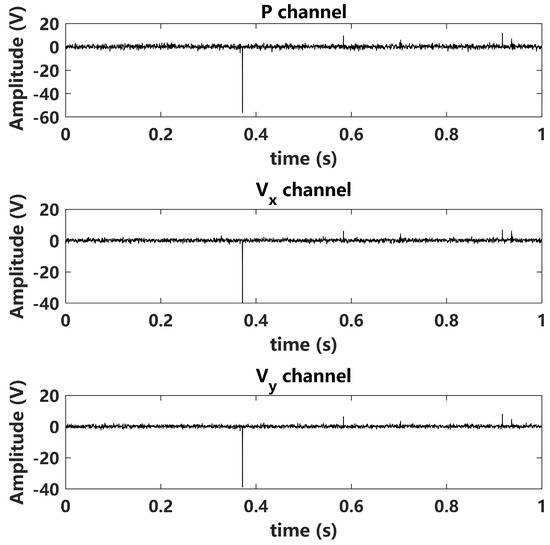
Figure 6.
Simulation of vector acoustic signal under impulsive noise (, ).
It is known that SR has merits in dealing with non-Gaussian noise. In view of this, our proposed LMSR is expected to achieve good results under impulsive noise. A simulation comparison of its nonlinear filtering effect is shown in Figure 7, where we can see a 10 dB improvement in the frequency domain. The denoised performance could also lead to the improvement of vector DOA estimation performance. The vector acoustic DOA estimation of AAIM, CAIM, LMSR-AAIM, and LMSR-CAIM under Lévy impulsive noise () is further studied, as shown in Figure 8. We can see that superior performance is achieved with LMSR-AAIM and LMSR-CAIM. This is in accordance with our expectation. As impulsive noise would seriously affect average amplitude quantization in the time domain, a CAIM-based vector acoustic DOA estimation method is recommended.
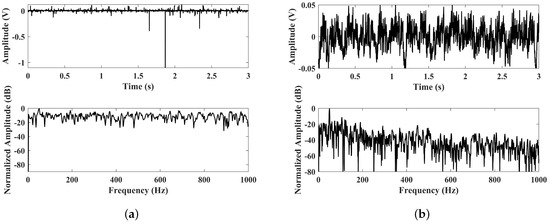
Figure 7.
Nonlinear filtering effect of LMSR under Lévy impulsive noise (). (a) Received signal and its normalized FFT; (b) LMSR output signal and its normalized FFT.
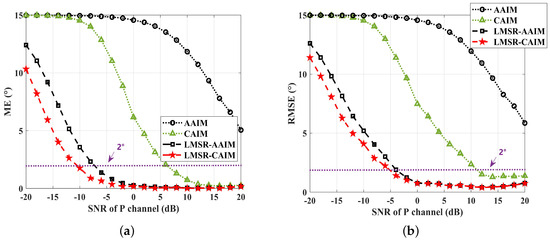
Figure 8.
Performance comparison for vector DOA estimation of AAIM, CAIM, LMSR-AAIM, and LMSR-CAIM under Lévy impulsive noise (). (a) Mean error (ME); (b) root-mean-square error (RMSE).
5. Experimental Verification
5.1. Experimental Description
To verify the effectiveness of the proposed methods in practical applications, a set of experimental sea data is adopted, which was collected in the South China Sea. A single UAVS was installed on a latent sea buoy and deployed at a depth of 1825 m. The UAVS was designed and calibrated with a low-frequency band from 3 Hz to 300 Hz. The sensitivity of the hydrophone is −175.3 dB re , and the sampling rate is = 1 kHz. The design of the experimental ship’s navigation survey line is shown in Figure 9a. The ship started from point A and sailed along the red dashed line to points B, C, and D and finished at point E. There are three horizontal passes across the latent buoy, as denoted by M, N, and Q. At points B and point C, the ship slowed down and turned back. The experimental ship’s radiated signal was acquired in real time by the UAVS system. As shown in Figure 10, 4.5 h radiated UAVS ship signals were received analyzed with LOFAR analysis. In view of the time-frequency results corresponding to the P channel, Vx channel, and Vy channel, the three times of horizontal passing are obvious. The line spectral signatures of the experimental ship have the same frequencies, while the amplitudes are different in each channel. This yields different SNRs of the three channels, as we mentioned before. Note that when the ship is slowing down, the SNR of the line spectral signatures greatly decrease.
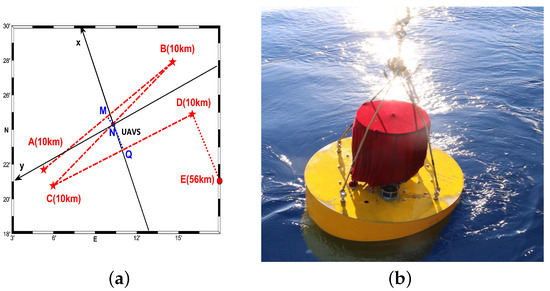
Figure 9.
Sea experiment description. (a) Experimental ship’s navigation survey line; (b) latent sea buoy with a single UAVS.
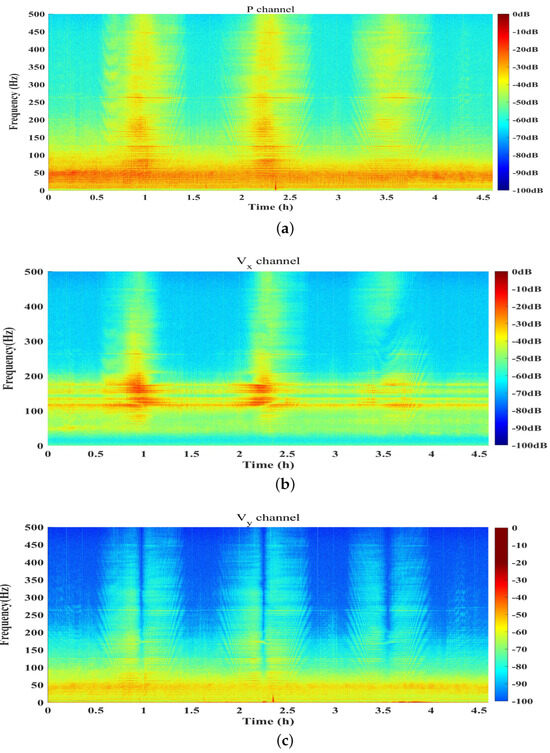
Figure 10.
Time-frequency analysis of received vector acoustic signal in 4.5 h. (a) P channel; (b) channel; (c) channel.
5.2. DOA Estimation Performance Analysis
The results of vector acoustic DOA estimation over time can be observed in Figure 11, where the classical AAIM and CAIM and the proposed LMSR-CAIM method are utilized for comparison. The results demonstrate that all three methods are able to roughly distinguish changes in azimuth angle over time. For the AAIM method, as shown in Figure 11a, the estimation error is larger, especially for the ship slowing down and turning back. The result of the CAIM method is better, as shown in Figure 11b, while the estimation error is till large in this circumstance. By utilizing our proposed LMSR-CAIM method, the estimation error can be greatly decreased, as shown in Figure 11c. This reveals superior performance for weak signals under low-SNR conditions, especially when the ship is slowing down and turning back.
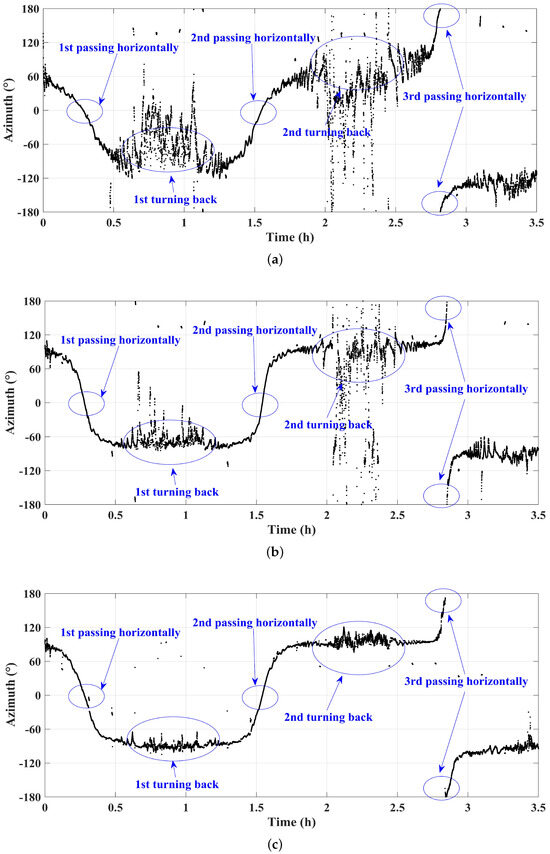
Figure 11.
Estimation performance comparison for the moving ship. (a) AAIM; (b) CAIM; (c) LMSR-CAIM.
According to the aforementioned analyses, our proposed LMSR method can effectively enhance CAIM-based DOA estimation performance. This demonstrates its effectiveness for practical applications, especially under low-SNR conditions and complex, noisy circumstances. Furthermore, the proposed LMSR-CAIM method outperforms the CAIM method, making it a promising approach for remote passive sonar with a single UAVS. The LMSR proposed in this paper is simply utilized as a first-order LE model for a matched stochastic resonance effect. In previous work, we proposed a series of methods within the framework of matched stochastic resonance theory for remote passive sonar detection [35,36,37,38]. Their nonlinear filtering performances are better, and they are expected to achieve better results with respect to the vector acoustic DOA estimation problem. Overall, these findings provide a promising insights for the development of advanced vector acoustic DOA estimation in the future.
6. Discussion
Here, we present some discussions with respect to future research directions.
- (1)
- With the development of advanced ship shock absorption and noise reduction technology, active or passive sonar detection tends toward lower-frequency bands ( Hz) or very low-frequency bands ( Hz). However, ambient ocean noise in the low-frequency band is generally non-Gaussian and impulsive [51,52,53]. Therefore, how to improve vector DOA estimation performance under low-SNR conditions and complex background noise is a key problem for underwater vector acoustic signal processing in the future.
- (2)
- Stochastic resonance has merits in dealing with non-Gaussian noise, which can provide new insights with respect to vector signal processing using nonlinear approaches. In Section 3, we demonstrated that within the framework of matched stochastic resonance theory, the linear gain-phase response can be guaranteed. The aforementioned numerical and practical analyses reveal the effectiveness of our proposed LMSR method. A considerable amount of research work has focused on the SR effect [32,33,34,35], and in previous work, we proposed PMSR, SMSR, IMSR, AIMSR, etc., which can achieve better nonlinear filtering performance than LMSR [35,36,37,38]. Therefore, there should be a number of approaches to improve the overall performance and stability. These can be further studied in the future.
- (3)
- In recent years, deep learning has led to rapid development in a variety of research fields. For vector signal processing, such an approach has already been adopted to improve AVS-DOA estimation performance [30]. However, learning tasks generally require guidance to determine a better loss function design. In Section 2, a generalized vector acoustic preprocessing optimization model was described as ’maximizing denoising performance in under the constraints of equivalent amplitude-gain response and phase-bias response’. We thought this would be important guidance for future research work.
7. Conclusions
This paper investigates the challenging problem of the low accuracy of underwater remote single-vector acoustic DOA estimation, particularly under low-SNR conditions and complex background noise. A comprehensive theoretical analysis was conducted on UAVS signal preprocessing to reveal the theoretical restrictions of intensity-based vector acoustic preprocessing approaches. A generalized vector acoustic preprocessing optimization model was established by maximizing the denoising performance under the constraints of equivalent amplitude-gain response and phase-bias response. To deal with the problem of how to improve vector DOA estimation performance under low-SNR conditions and complex background noise, a novel vector acoustic preprocessing method named linear matched stochastic resonance (LMSR) is proposed within the framework of matched stochastic resonance theory, which can naturally guarantee linear gain-phase restrictions, as well as achieving effective denoising performance. Numerical analyses and experimental verification demonstrate the superior estimation performance of the proposed method in comparison wiyh classical intensity-based AAIM and CAIM methods, especially under low-SNR conditions and non-Gaussian impulsive noise circumstances. In addition, intensive discussions are presented to provide inspiration for future investigations. This provides a new point of view with respect to preprocessing restrictions of vector acoustic DOA estimation and can represent a breakthrough innovation in underwater remote passive sonar detection with vector acoustic sensors in the future.
Author Contributions
H.D.: Conceptualization, Methodology, Software, Validation, and Writing—original draft preparation. Z.Z.: Data curation, Writing—review and editing. J.S.: Methodology and Data curation. H.W.: Project administration, Writing—review and editing, Investigation, and Supervision. H.J.: Supervision and Writing—review and editing. All authors have read and agreed to the published version of the manuscript.
Funding
This work was supported by the National Natural Science Foundation of China (Grant Nos. 62201439, 62031021, 62276204, and 62203343), the China Postdoctoral Science Foundation (Grant No. 2022M722493), the Fundamental Research Funds for the Central Universities (Grant No. XJSJ23026), and the Postdoctoral Research Project of Shannxi Province (Grant No. 2023BSHEDZZ174).
Data Availability Statement
Data sharing is not applicable to this article.
Acknowledgments
The authors would like to thank the anonymous reviewers for their valuable comments and suggestions.
Conflicts of Interest
The authors declare no conflicts of interest. The funding sponsors had no role in the design of the study or in the decision to publish the results.
References
- Cao, J.; Liu, J.; Wang, J.; Lai, X. Acoustic vector sensor: Reviews and future perspectives. IET Signal Process. 2016, 11, 1–9. [Google Scholar] [CrossRef]
- Wu, K.; Reju, V.G.; Khong, A.W. Multisource DOA estimation in a reverberant environment using a single acoustic vector sensor. IEEE/ACM Trans. Audio Speech Lang. Process. 2018, 26, 1848–1859. [Google Scholar] [CrossRef]
- Stinco, P.; Tesei, A.; Dreo, R.; Micheli, M. Detection of envelope modulation and direction of arrival estimation of multiple noise sources with an acoustic vector sensor. J. Acoust. Soc. Am. 2021, 149, 1596–1608. [Google Scholar] [CrossRef] [PubMed]
- Nehorai, A.; Paldi, E. Acoustic vector-sensor array processing. IEEE Trans. Signal Process. 1994, 42, 2481–2491. [Google Scholar] [CrossRef]
- Wong, K.T.; Zoltowski, M.D. Uni-vector-sensor ESPRIT for multisource azimuth, elevation, and polarization estimation. IEEE Trans. Antennas Propag. 1997, 45, 1467–1474. [Google Scholar] [CrossRef]
- Miron, S.; Le Bihan, N.; Mars, J.I. Quaternion-MUSIC for vector-sensor array processing. IEEE Trans. Signal Process. 2006, 54, 1218–1229. [Google Scholar] [CrossRef]
- Han, K.; Nehorai, A. Nested vector-sensor array processing via tensor modeling. IEEE Trans. Signal Process. 2014, 62, 2542–2553. [Google Scholar] [CrossRef]
- Najeem, S.; Kiran, K.; Malarkodi, A.; Latha, G. Open lake experiment for direction of arrival estimation using acoustic vector sensor array. Appl. Acoust. 2017, 119, 94–100. [Google Scholar] [CrossRef]
- Weiss, A. Blind direction-of-arrival estimation in acoustic vector-sensor arrays via tensor decomposition and Kullback-Leibler divergence covariance fitting. IEEE Trans. Signal Process. 2020, 69, 531–545. [Google Scholar] [CrossRef]
- Dreo, R.; Trabattoni, A.; Stinco, P.; Micheli, M.; Tesei, A. Detection and localization of multiple ships using acoustic vector sensors on buoyancy gliders: Practical design considerations and experimental verifications. IEEE J. Ocean. Eng. 2022, 48, 577–591. [Google Scholar] [CrossRef]
- Zhang, R.; Zhou, S.; Qi, Y.; Liang, Y.; Sui, Y. Characteristics of very-low-frequency pulse acoustic fields measured by vector sensor and ocean bottom seismometer in shallow water. J. Acoust. Soc. Am. 2018, 144, 1916. [Google Scholar] [CrossRef]
- Silvia, M.T.; Richards, R.T. A theoretical and experimental investigation of low-frequency acoustic vector sensors. In Proceedings of the OCEANS’02 MTS/IEEE, Biloxi, MI, USA, 29–31 October 2002; Volume 3, pp. 1886–1897. [Google Scholar]
- Thode, A.; Skinner, J.; Scott, P.; Roswell, J.; Straley, J.; Folkert, K. Tracking sperm whales with a towed acoustic vector sensor. J. Acoust. Soc. Am. 2010, 128, 2681–2694. [Google Scholar] [CrossRef] [PubMed]
- Tichavsky, P.; Wong, K.T.; Zoltowski, M.D. Near-field/far-field azimuth and elevation angle estimation using a single vector hydrophone. IEEE Trans. Signal Process. 2001, 49, 2498–2510. [Google Scholar] [CrossRef]
- Zhao, A.; Ma, L.; Hui, J.; Zeng, C.; Bi, X. Open-lake experimental investigation of azimuth angle estimation using a single acoustic vector sensor. J. Sens. 2018, 2018, 1–18. [Google Scholar] [CrossRef]
- Bereketli, A.; Guldogan, M.B.; Kolcak, T.; Gudu, T.; Avsar, A.L. Experimental results for direction of arrival estimation with a single acoustic vector sensor in shallow water. J. Sens. 2015, 2015, 1–9. [Google Scholar] [CrossRef]
- Zhao, A.; Ma, L.; Ma, X.; Hui, J. An improved azimuth angle estimation method with a single acoustic vector sensor based on an active sonar detection system. Sensors 2017, 17, 412. [Google Scholar] [CrossRef]
- Wu, Y.I.; Wong, K.T.; Yuan, X.; Lau, S.k.; Tang, S.k. A directionally tunable but frequency-invariant beamformer on an acoustic velocity-sensor triad to enhance speech perception. J. Acoust. Soc. Am. 2012, 131, 3891–3902. [Google Scholar] [CrossRef] [PubMed]
- Thode, A.M.; Kim, K.H.; Norman, R.G.; Blackwell, S.B.; Greene, C.R., Jr. Acoustic vector sensor beamforming reduces masking from underwater industrial noise during passive monitoring. J. Acoust. Soc. Am. 2016, 139, EL105–EL111. [Google Scholar] [CrossRef] [PubMed]
- Suo, J.; Dong, H.; Shen, X.; Wang, H. Bistable stochastic resonance with linear amplitude response enhanced vector DOA estimation under low SNR conditions. Chaos Solitons Fract. 2020, 136, 109825. [Google Scholar] [CrossRef]
- Terracciano, D.S.; Costanzi, R.; Manzari, V.; Stifani, M.; Caiti, A. Passive bearing estimation using a 2-D acoustic vector sensor mounted on a hybrid autonomous underwater vehicle. IEEE J. Ocean. Eng. 2022, 47, 799–814. [Google Scholar] [CrossRef]
- Suo, J.; Wang, H.; Dong, H.; Shen, X.; Yan, Y.; Zhang, H. Single acoustic vector sensor DOA enhanced by unsaturated bistable stochastic resonance with linear amplitude response constrained. Appl. Acoust. 2023, 214, 109695. [Google Scholar] [CrossRef]
- Hochwald, B.; Nehorai, A. Identifiability in array processing models with vector-sensor applications. IEEE Trans. Signal Process. 1996, 44, 83–95. [Google Scholar] [CrossRef]
- Agarwal, A.; Agrawal, M.; Kumar, A. Higher-order-statistics-based direction-of-arrival estimation of multiple wideband sources with single acoustic vector sensor. IEEE J. Ocean. Eng. 2019, 45, 1439–1449. [Google Scholar] [CrossRef]
- Zhang, J.; Xu, X.; Chen, Z.; Bao, M.; Zhang, X.P.; Yang, J. High-resolution DOA estimation algorithm for a single acoustic vector sensor at low SNR. IEEE Trans. Signal Process. 2020, 68, 6142–6158. [Google Scholar] [CrossRef]
- Wang, D.; Zou, Y.; Wang, W. Learning soft mask with DNN and DNN-SVM for multi-speaker DOA estimation using an acoustic vector sensor. J. Frankl. Inst. 2018, 355, 1692–1709. [Google Scholar] [CrossRef]
- Zhong, X.; Premkumar, A.B. Particle filtering approaches for multiple acoustic source detection and 2-D direction of arrival estimation using a single acoustic vector sensor. IEEE Trans. Signal Process. 2012, 60, 4719–4733. [Google Scholar] [CrossRef]
- Gunes, A.; Guldogan, M.B. Joint underwater target detection and tracking with the Bernoulli filter using an acoustic vector sensor. Digit. Signal Process. 2016, 48, 246–258. [Google Scholar] [CrossRef]
- Chen, Y.; Wang, W.; Wang, Z.; Xia, B. A source counting method using acoustic vector sensor based on sparse modeling of DOA histogram. IEEE Signal Process. Lett. 2019, 26, 69–73. [Google Scholar] [CrossRef]
- Cao, H.; Wang, W.; Su, L.; Ni, H.; Gerstoft, P.; Ren, Q.; Ma, L. Deep transfer learning for underwater direction of arrival using one vector sensor. J. Acoust. Soc. Am. 2021, 149, 1699–1711. [Google Scholar] [CrossRef]
- Dong, H.; Suo, J.; Zhu, Z.; Li, S. Improved Underwater Single-Vector Acoustic DOA Estimation via Vector Convolution Preprocessing. Electronics 2024, 13, 1796. [Google Scholar] [CrossRef]
- Lu, S.; He, Q.; Wang, J. A review of stochastic resonance in rotating machine fault detection. Mech. Syst. Signal Process. 2019, 116, 230–260. [Google Scholar] [CrossRef]
- Qiao, Z.; Lei, Y.; Li, N. Applications of stochastic resonance to machinery fault detection: A review and tutorial. Mech. Syst. Signal Process. 2019, 122, 502–536. [Google Scholar] [CrossRef]
- He, D.; Lin, Y.; He, C.; Jiang, L. A novel spectrum-sensing technique in cognitive radio based on stochastic resonance. IEEE Trans. Veh. Technol. 2010, 59, 1680–1688. [Google Scholar]
- Dong, H.; Wang, H.; Shen, X.; He, K. Parameter matched stochastic resonance with damping for passive sonar detection. J. Sound Vib. 2019, 458, 479–496. [Google Scholar] [CrossRef]
- Dong, H.; Wang, H.; Shen, X.; Jiang, Z. Effects of Second-Order Matched Stochastic Resonance for Weak Signal Detection. IEEE Access 2018, 6, 46505–46515. [Google Scholar] [CrossRef]
- Dong, H.; Shen, X.; He, K.; Wang, H. Nonlinear filtering effects of intrawell matched stochastic resonance with barrier constrainted duffing system for ship radiated line signature extraction. Chaos Solitons Fract. 2020, 141, 110428. [Google Scholar] [CrossRef]
- Dong, H.; He, K.; Shen, X.; Ma, S.; Wang, H.; Qiao, C. Adaptive intrawell matched stochastic resonance with a potential constraint aided line enhancer for passive sonars. Sensors 2020, 20, 3269. [Google Scholar] [CrossRef] [PubMed]
- Ross, D. Mechanics of Underwater Noise; Pergamon Press: Los Altos, CA, USA, 1976; pp. 272–280. [Google Scholar]
- Gammaitoni, L.; Hänggi, P.; Jung, P.; Marchesoni, F. Stochastic resonance. Rev. Mod. Phys. 1998, 70, 223–286. [Google Scholar] [CrossRef]
- McNamara, B.; Wiesenfeld, K. Theory of stochastic resonance. Phys. Rev. A 1989, 39, 4854. [Google Scholar] [CrossRef]
- Hu, N.Q. Theory and Methods for Weak Characteristic Signal Detection with Stochastic Resonance; National Defense Industry Press: Beijing, China, 2012; pp. 42–46. [Google Scholar]
- Xu, B.; Duan, F.; Bao, R.; Li, J. Stochastic resonance with tuning system parameters: The application of bistable systems in signal processing. Chaos Solitons Fract. 2002, 13, 633–644. [Google Scholar] [CrossRef]
- Kovacic, I.; Brennan, M.J. The Duffing Equation: Nonlinear Oscillators and Their Behaviour; John Wiley & Sons: Hoboken, NJ, USA, 2011. [Google Scholar]
- Stocks, N.G. Suprathreshold stochastic resonance in multilevel threshold systems. Phys. Rev. Lett. 2000, 84, 2310. [Google Scholar] [CrossRef]
- Herrmann, S.; Imkeller, P.; Pavlyukevich, I.; Peithmann, D. Stochastic Resonance; American Mathematical Society: Ann Arbor, MI, USA, 2013; Volume 194. [Google Scholar]
- Dong, H.; Wang, H.; Shen, X.; Huang, Z.; Ma, S. Detection of underwater weak signal via matched stochastic resonance. In Proceedings of the OCEANS 2017, Aberdeen, UK, 19–22 June 2017; pp. 1–7. [Google Scholar]
- Garcia, D. Robust smoothing of gridded data in one and higher dimensions with missing values. Comput. Stat. Data Anal. 2010, 54, 1167–1178. [Google Scholar] [CrossRef] [PubMed]
- Ma, S.; Wang, H.; Shen, X.; Dong, H. Stochastic resonance for underwater vlf weak signal detection under lévy noise background. In Proceedings of the 2017 IEEE International Conference on Signal Processing, Communications and Computing (ICSPCC), Xiamen, China, 22–25 October 2017; pp. 1–5. [Google Scholar]
- Tan, J.; Chen, X.; Wang, J.; Chen, H.; Cao, H.; Zi, Y.; He, Z. Study of frequency-shifted and re-scaling stochastic resonance and its application to fault diagnosis. Mech. Syst. Signal Process. 2009, 23, 811–822. [Google Scholar] [CrossRef]
- Ma, S.; Wang, H.; Shen, X.; He, K.; Dong, H. Detection method of VLF acoustic signal in complex marine environmental noise. Acta Armamentarii 2020, 41, 2495. [Google Scholar]
- Ainslie, M.A.; Andrew, R.K.; Howe, B.M.; Mercer, J.A. Temperature-driven seasonal and longer term changes in spatially averaged deep ocean ambient sound at frequencies 63–125 Hz. J. Acoust. Soc. Am. 2021, 149, 2531–2545. [Google Scholar] [CrossRef]
- Siddagangaiah, S.; Li, Y.; Guo, X.; Yang, K. On the dynamics of ocean ambient noise: Two decades later. Chaos Interdiscip. J. Nonlinear Sci. 2015, 25, 103117. [Google Scholar] [CrossRef]
Disclaimer/Publisher’s Note: The statements, opinions and data contained in all publications are solely those of the individual author(s) and contributor(s) and not of MDPI and/or the editor(s). MDPI and/or the editor(s) disclaim responsibility for any injury to people or property resulting from any ideas, methods, instructions or products referred to in the content. |
© 2024 by the authors. Licensee MDPI, Basel, Switzerland. This article is an open access article distributed under the terms and conditions of the Creative Commons Attribution (CC BY) license (https://creativecommons.org/licenses/by/4.0/).