Article

A New Large-Scale Monitoring Index of Desertification Based on Kernel Normalized Difference Vegetation Index and Feature Space Model

1
School of Civil Architectural Engineering, Shandong University of Technology, Zibo 255000, China
2
Key Laboratory of Remote Sensing of Gansu Province, Heihe Remote Sensing Experimental Research Station, Northwest Institute of Eco-Environment and Resources, Chinese Academy of Sciences, Lanzhou 730000, China
3
State Key Laboratory of Efficient Utilization of Arid and Semi-Arid Arable Land in Northern China, Institute of Agricultural Resources and Regional Planning, Chinese Academy of Agricultural Sciences, Beijing 100081, China
*
Author to whom correspondence should be addressed.
Remote Sens. 2024, 16(10), 1771; https://doi.org/10.3390/rs16101771
Submission received: 12 April 2024 / Revised: 13 May 2024 / Accepted: 13 May 2024 / Published: 16 May 2024
(This article belongs to the Special Issue Remote Sensing for Land Degradation and Drought Monitoring II)

Abstract

:
As a new vegetation monitoring index, the KNDVI has certain advantages in characterizing the evolutionary process of regional desertification. However, there are few reports on desertification monitoring based on KNDVI and feature space models. In this study, seven feature parameters, including the kernel normalized difference vegetation index (KNDVI) and Albedo, were introduced to construct different models for desertification remote-sensing monitoring. The optimal desertification remote-sensing monitoring index model was determined with the measured data; then, the spatiotemporal evolution pattern of desertification in Gulang County from 2013 to 2023 was analyzed and revealed. The main conclusions were as follows: (1) Compared with the NDVI and MSAVI, the KNDVI showed more advantages in the characterization of the desertification evolution process. (2) The point–line pattern KNDVI-Albedo remote-sensing index model had the highest monitoring accuracy, reaching 94.93%, while the point–line pattern NDVI-TGSI remote-sensing monitoring index had the lowest accuracy of 54.38%. (3) From 2013 to 2023, the overall desertification situation in Gulang County showed a trend of improvement with a pattern of “firstly aggravation and then alleviation.” Additionally, the gravity center of desertification in Gulang County first shifted to the southeast and then to the northeast, indicating that the northeast’s aggravating rate of desertification was higher than in the southwest during the period. (4) From 2013 to 2023, the area of stable desertification in Gulang County was the largest, followed by the slightly weakened zone, and the most significant transition area was that of extreme desertification to severe desertification. The research results provide important decision support for the precise monitoring and governance of regional desertification.

1. Introduction

With the continuous increase in global climate change and human activities, desertification has become one of significant environmental issues facing the world today. Desertification refers to the process whereby originally non-desert areas gradually degrade, experience vegetation loss, and witness a decline in soil quality due to natural or anthropogenic factors, ultimately evolving into landscapes resembling deserts. This process not only leads to the loss of land resources but also has a profound impact on ecological environments, socio-economics, and human livelihoods.
Desertification monitoring methods can be divided into field-based observational methods and remote-sensing technology extraction methods. Traditional field-based observational methods, although accurate, are time-consuming, labor-intensive, and limited in scope, and the production of research results is slow and, therefore, lacks universality. With the continuous launch of Earth observation satellites, remote sensing has become the primary means for the dynamic monitoring of desertification at medium to large scales. Scholars, both domestically and internationally, have utilized methods such as image classification, comprehensive index methods, and multiple regression analysis to qualitatively or quantitatively extract desertification information using remote sensing, resulting in a series of achievements. For instance, Tong et al. [1], based on Landsat remote-sensing images from 1985 to 2017, employed an object-oriented classification method to study the changes in the desertification land area in the Horqin Sandy Land over the past three decades, identifying human factors as the dominant ones. Guo et al. [2] conducted research into the sensitivity of land desertification in the arid regions of northwest China using remote sensing and GIS spatial analysis techniques, revealing that soil and climate are the primary influencing factors, with vegetation as the most active and fundamental factor, and socio-economics representing the fastest influencing factor of desertification sensitivity. Abdelhafid et al. [3] utilized a multivariate point–line equation to assess the relationship between Landsat imagery and soil texture, dynamically analyzing desertification in the Nemamcha region and concluding there was a strong correlation between soil indicators and surface soil sand content, thereby indicating an increase in desertification signs. Maria et al. [4] investigated the impacts of rainfall intensity on soil properties in Brazilian desertification areas using simulated rainfall and discovered that rainfall intensity significantly affects runoff time and accelerates soil erosion rates. Wang et al. [5] extracted desertification land information based on Landsat data and analyzed the spatiotemporal variation characteristics of desertification in the eastern part of the Helan Mountain region in Ningxia using a centroid model. The results revealed an overall northward migration of desertification in the eastern part of the Helan Mountain region in Ningxia, with some improvement identified in the situation. However, while image classification methods have certain advantages in defining the scope of desertification, these methods cannot obtain internal spatial variation information. The comprehensive index method and multiple regression analysis methods could consider the impacts of multiple factors on the desertification process but could not consider the interactions between factors and the nonlinear characteristics of their impacts on the desertification process.
In recent years, many scholars have attempted to introduce a remote-sensing inversion index of land surface information to construct a feature space desertification monitoring model, including a humidity index, surface Albedo, vegetation index, and surface temperature, which has achieved improved results. Based on the Google Earth Engine (GEE) for the extraction of the normalized difference vegetation index (NDVI) and surface Albedo, Ma et al. [6] constructed a feature space to monitor the land desertification in Ongniud Banner using remote sensing and found that the desertification in this area experienced the evolution process of first development and then reversal. Based on the NDVI and surface Albedo data of MODIS remote-sensing images from 2000 to 2016, Yu et al. [7] constructed a feature space to calculate the desertification difference index (DDI) and the vegetation condition Albedo drought index (VCADI). On this basis, the DDI and VCADI were used to analyze the spatial and temporal evolution patterns of desertification in Shaanxi Province, and the coefficient of variation method was used to explore the correlation between desertification and drought in this area. Zhang et al. [8] utilized the MODIS data from 2000 to 2012 to establish the Albedo-NDVI feature space model to explore the evolution of desertification in Turkmenistan. Wang et al. [9] applied the Albedo-NDVI feature space index model to extract desertification data in Chifeng and found that the degree of desertification had improved over time. Gao et al. [10] utilized four vegetation indices, namely, the NDVI, the enhanced vegetation index (EVI), the ratio vegetation index (RVI), and the modified soil adjusted vegetation index (MSAVI), to establish four feature space index models with land surface temperature (Ts) and found that the MSAVI-Ts feature space index model performed the best in desertification extraction under different vegetation cover and soil backgrounds. Mohamed et al. [11] quantitatively assessed desertification in the central region of the Moulouya basin in northeastern Morocco based on Sentinel-2 satellite imagery data and found that the feature space index model of NDVI-Albedo and MSAVI-Albedo showed the best correlations. Vani et al. [12] constructed a feature space model using the NDVI and LST to calculate the soil moisture index and then combined the crop condition classification map with SMI to evaluate the drought conditions of four different types in India in 2016.
Compared to other vegetation indices, the kernel normalized difference vegetation index (KNDVI) [13] could integrate information from different scales based on kernel functions, resulting in stronger spatial resolution. It is suitable for various research and monitoring needs, showing higher sensitivity to vegetation and better capturing vegetation characteristics. At the same time, it reduces the impact of land use and land cover on remote-sensing data to reflect the vegetation status more accurately. Gustau et al. proposed that the correlation of the KNDVI (0.68) was higher than that of the NDVI in the calculation of monitoring accuracy of total primary productivity and solar-induced chlorophyll fluorescence, and the correlation of the NDVI was 0.59 [14]. However, there have been no reports on desertification monitoring models based on the KNDVI and feature space methods.
The northern agro-pastoral ecotone of Gulang County is a typical fragile ecological area that has been plagued by desertification for a long time. In this study, based on Landsat time series data from 2013 to 2023, various desertification characterization parameters, including the KNDVI, were introduced to construct different types of feature space desertification monitoring index models. The optimal monitoring index method was determined through ground-truth data. The gravity center model and other methods were introduced to reveal the spatial and temporal evolution characteristics and laws of desertification in Gulang County. Through the remote-sensing monitoring of desertification areas, we can more objectively understand the impact of desertification on local residents’ quality of life and regional economic development. In relation to desertification prevention and control, we can provide a scientific basis and public opinion support for government decision-making and community participation, ultimately providing decision and data support for the prediction and regulation of regional desertification.

2. Research Methods and Data Sources

2.1. Overview of the Study Region

Gulang County (102°43′~103°51′E, 37°09′~37°54′N), with an area of 5046 km2, has a roughly east–west length of about 102 km and a north–south width of about 88 km (Figure 1). It is located at the eastern end of the Hexi Corridor, bordered to the north by the Tengger Desert, adjacent to Jingtai County to the east, and relying on the Tianzhu Tibetan Autonomous County to the south [15]. The terrain shows a decreasing trend from south to north, exhibiting diverse and complex landforms with elevations ranging from 1577 m to 3536 m [16]. Gulang County is dominated by the climates of the cold arid zone of the Qilian Mountains and the cold temperate arid zone of Hexi, characterized by abundant sunlight, strong radiation, significant temperature differences, and sparse and uneven precipitation [17]. The rate of precipitation decreases from over 400 mm in the southern mountainous areas to less than 175 mm in the northern deserts, leading to severe soil erosion. The county’s soil types are diverse, primarily consisting of loess soil, calcareous soil, and aeolian sandy soil. It is rich in mineral resources, with significant deposits of limestone, coal, and granite [18]. Due to the combined effects of climate change and human activities, desertification in Gulang County is relatively severe.

2.2. Data Source and Preprocessing

In this study, Landsat 8 OLI/TIRS remote-sensing images with a spatial resolution of 30 m in August of 2013, 2018, and 2023 were utilized, and these datasets with cloud cover of less than 10% were derived from the Geospatial Data Cloud Platform (http://www.gscloud.cn (accessed on 22 May 2023)), orbit number 131/34) of the Computer Network Information Center of the Chinese Academy of Sciences. ENVI 5.3 software was used to perform radiometric calibration and atmospheric correction preprocessing on remote-sensing images. The land use data of Gulang County originated from the Resource and Environmental Science and Data Center of the Chinese Academy of Sciences (https://www.resdc.cn/ (accessed on 20 May 2023))) with a spatial resolution of 30 m. The ArcGIS10.2 tool was used to remove buildings and water, which can eliminate their impact on the inversion of the desertification index.

2.3. Research Method

2.3.1. Feature Parameters Extraction

Based on preprocessed remote-sensing images, feature parameters were extracted using band calculations (Table 1), including the normalized difference vegetation index (NDVI), kernel normalized difference vegetation index (KNDVI), modified soil adjusted vegetation index (MSAVI), Albedo, topsoil grain size index (TGSI), LST, and surface water content index (SWCI).
(1)
The NDVI is widely utilized as a vegetation status indicator in remote-sensing monitoring applications. It can assess vegetation coverage and growth conditions through measurement of the difference in reflectance between near-infrared and red light bands. In desertification monitoring, decreased vegetation coverage accompanies desertification, thus exhibiting a correlation [19]. Wang et al. studied the driving factors of the NDVI in the desertification area of northern China from 1998 to 2015 [20].
(2)
The KNDVI is an enhanced version of the NDVI, commonly employed to improve the sensitivity and accuracy of vegetation monitoring compared to the traditional NDVI. The KNDVI may be able to capture more accurately the multiple scattering effects within vegetation canopies, thereby providing more precise vegetation information. Hence, in desertification monitoring, a decrease in the KNDVI can indicate vegetation degradation and the progression of desertification [14].
(3)
The MSAVI aims to mitigate the influence of the soil background on vegetation signals via the computation of specific reflectance ratios in the red and near-infrared bands. It provides more accurate assessments of vegetation coverage and growth conditions, particularly in areas with low vegetation cover or complex backgrounds. Thus, the MSAVI is particularly suitable for vegetation monitoring in arid and semi-arid regions [21]. Wu et al. studied the desertification index of semi-arid grassland based on the Albedo-MSAVI feature space [22].
(4)
Surface Albedo represents the ability of the ground to absorb and reflect solar radiation. The greater the Albedo, the less the ground absorbs solar radiation, and vice versa. In the process of desertification, the surface vegetation coverage decreased and the surface reflectance increased, resulting in an increase in Albedo. Therefore, the degree and trend of desertification could be monitored by monitoring the change in surface Albedo [23].
(5)
TGSI can reflect the particle composition of the surface soil. The thickness of the soil particles affects the soil’s water retention capacity, aeration, and erosion resistance. The coarsening in soil particle size is a sign of land degradation. The coarser the soil particle size, the more serious the desertification. Therefore, the surface soil particle size index could be used as one of the indicators for monitoring desertification [24]. Hashem et al. used wavelet and time series analysis to simulate different degrees of desertification based on the TGSI and Albedo index [25].
(6)
Land surface temperature is the most intuitive reflection of the surface temperature of rock, soil, and vegetation. The surface temperature is directly related to the soil moisture content. The higher the surface temperature, the lower the soil moisture content, which in turn affects vegetation coverage and accelerates the desertification process [26]. The higher the degree of desertification, the higher the surface temperature, so the surface temperature can also be used to reflect the change in desertification. Kumar et al. used the LST and NDVI to monitor and evaluate the geological environment of land degradation and desertification in semi-arid areas [27].
(7)
The SWCI is a unified surface water content model constructed by Du et al. After testing and evaluation, the model integrates the influence of water absorption characteristics of vegetation and soil on spectral reflection. It requires fewer parameters and can be quickly calculated. Compared with the NDVI, it is less affected by soil vegetation coverage. Soil water content gradually decreases with the aggravation of desertification; otherwise, it gradually increases, so the model can be used to monitor desertification [28].
In the formula, BRED, BBLUE, BGREEN, BNIR, SWIR1, and SWIR2 are the red band, blue band, green band, near-infrared band, shortwave infrared band 1, and shortwave infrared band 2 of the remote-sensing image, respectively. σ is a length-scale parameter to be specified and represents the sensitivity of the index to sparsely/densely vegetated regions; a and b are coefficients; τ is atmospheric transmittance; ε is surface emissivity; T is the radiation brightness temperature; and Ta is the atmospheric average temperature.

2.3.2. Parameter Standardization

In order to eliminate the difference between typical surface parameters and determine the maximum and minimum values of each parameter, the following equations were applied in the process of data standardization to normalize the data [29]:
M i = MI i MI i , min MI i , max MI i , min
In the formula, Mi represents the i-th normalized index; MIi represents the i-th characteristic parameter; MIi, min represents the minimum value of the i-th characteristic parameter; and MIi, max represents the maximum value of the i-th characteristic parameter.

2.3.3. Principle of Feature Space Model

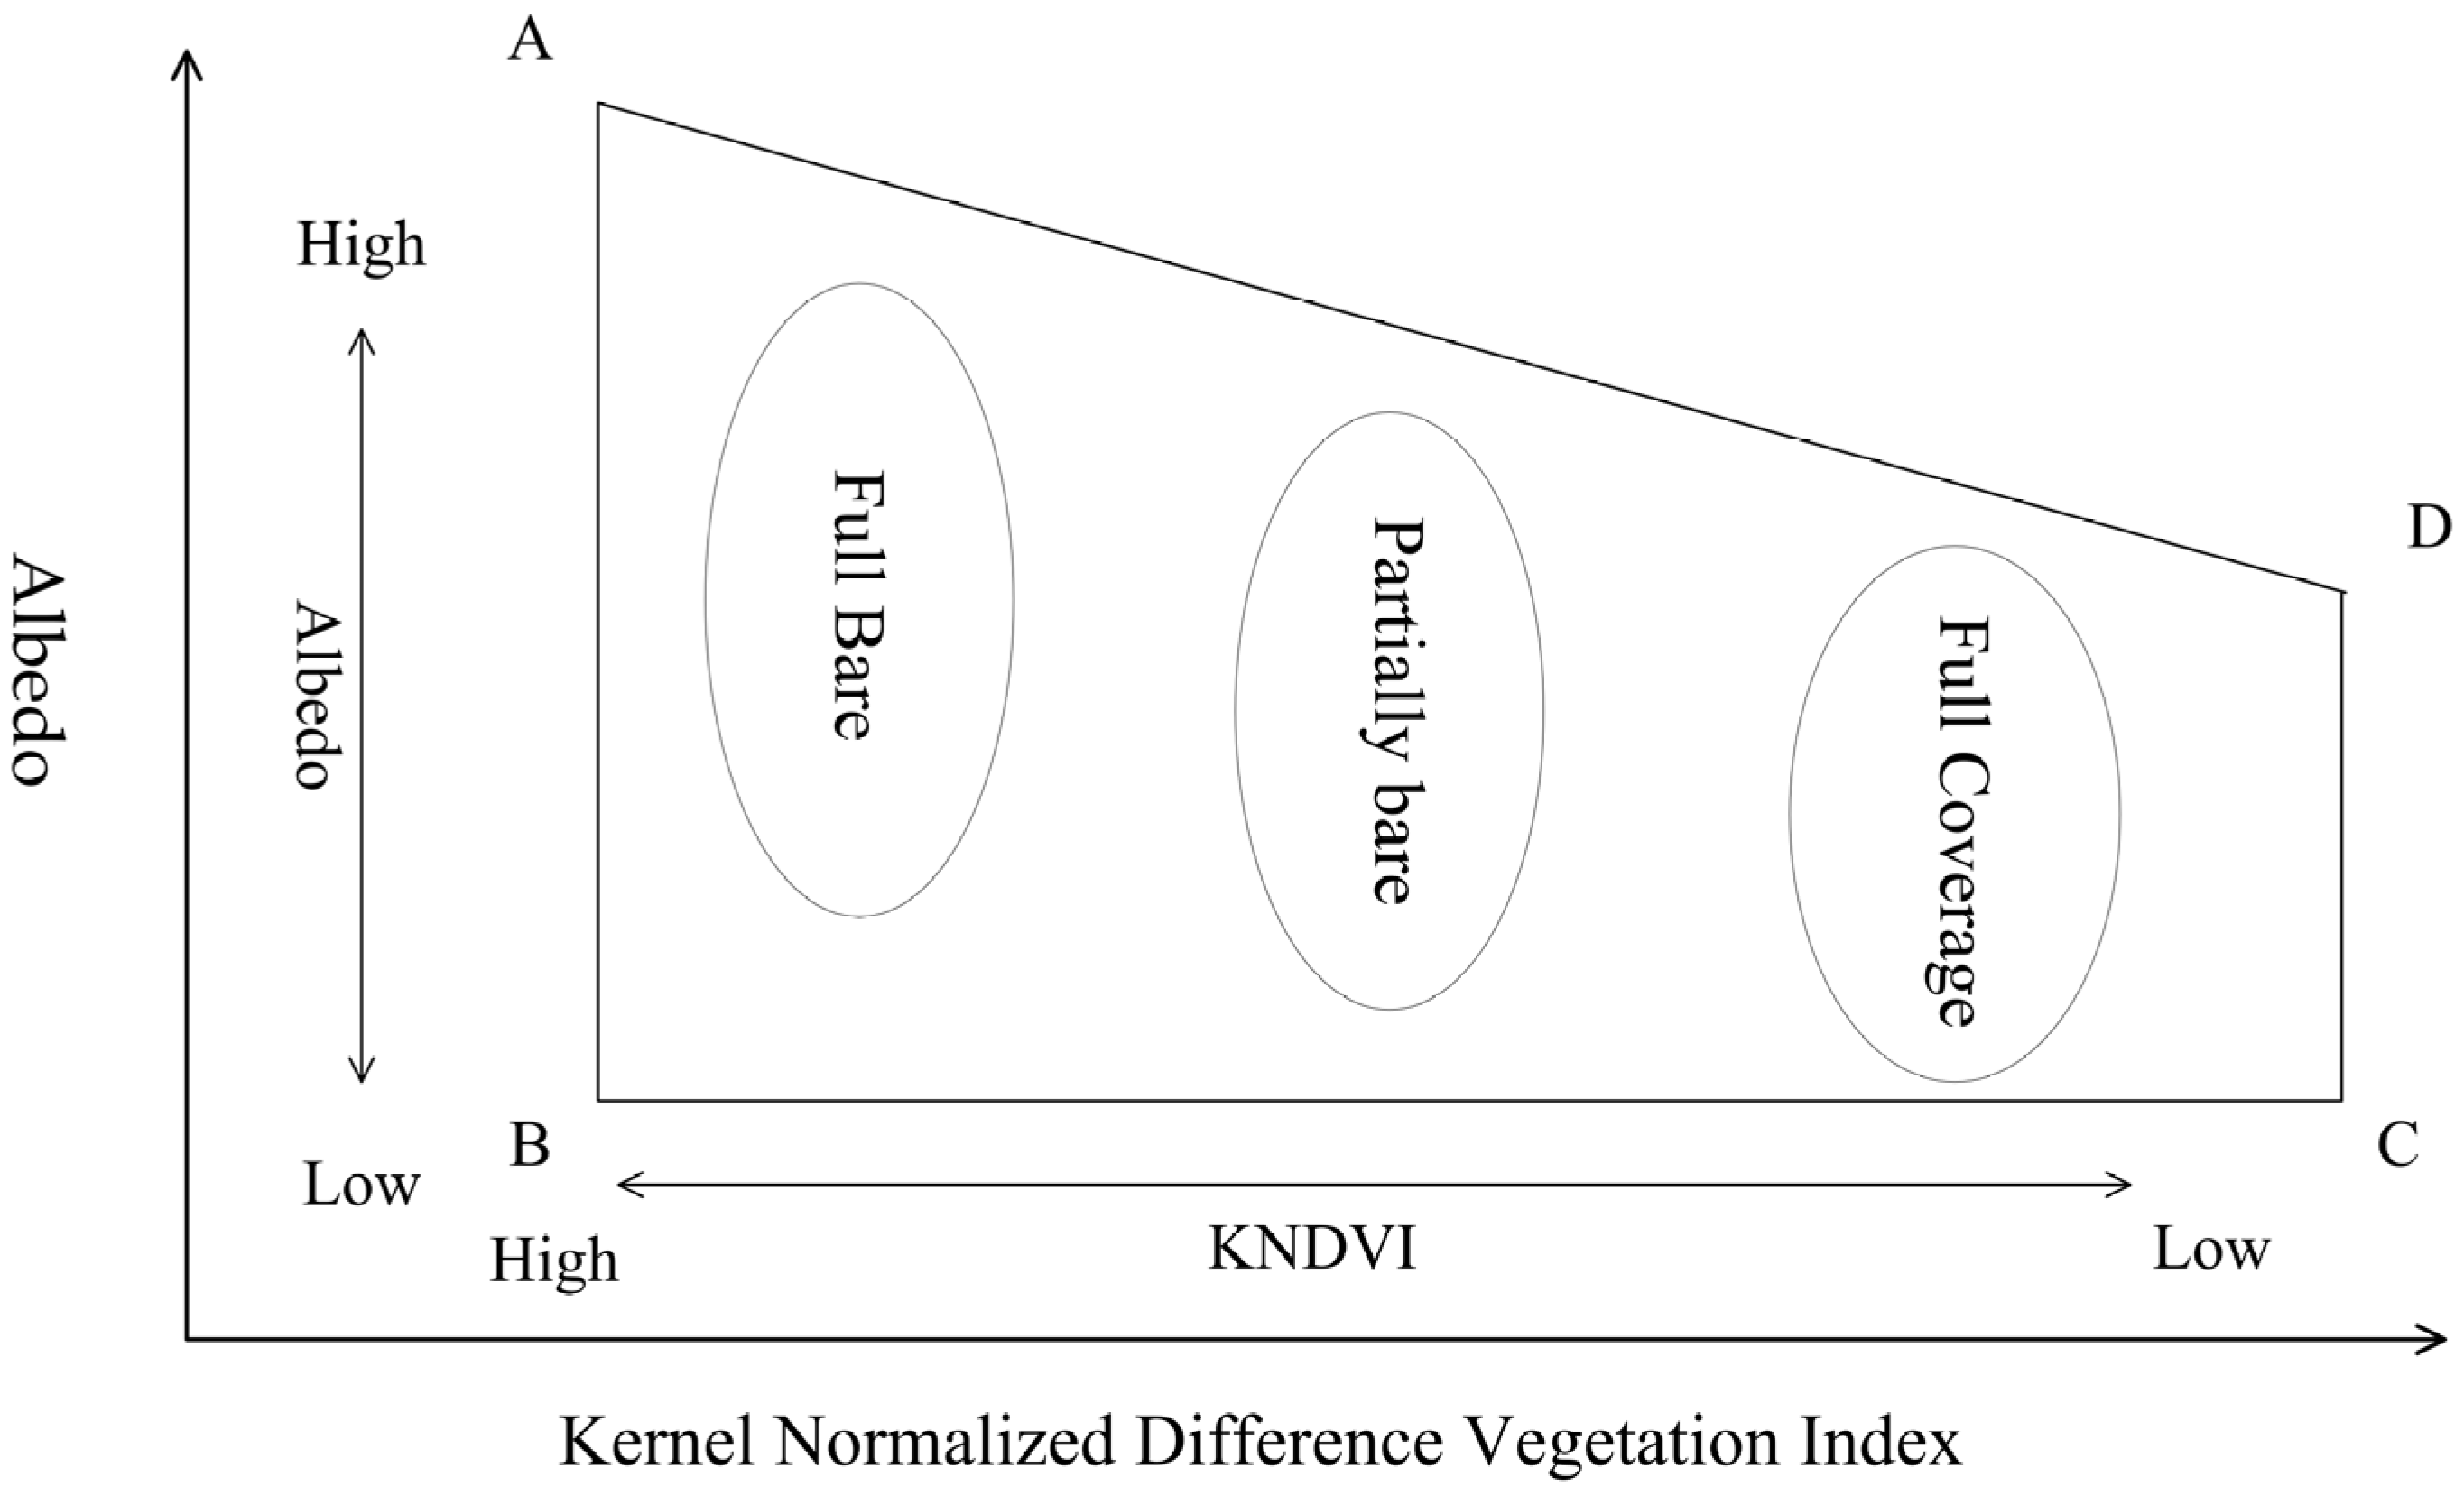
Due to the complex diversity of terrain, landforms, and other environments in the study area, the accuracy of a single index for desertification monitoring was limited. Therefore, the feature space model was adopted to add a variety of feature parameters to improve the monitoring accuracy. In this study, a two-dimensional feature space was used, i.e., two typical feature parameters were utilized, the X-axis and Y-axis, to construct a two-dimensional feature space. Each point in the feature space was a sample, and similar samples would gather together to form different point groups, which were easier to classify [30]. As shown in Figure 2, the surface Albedo had a significant point–line negative correlation with the KNDVI. The Albedo-KNDVI feature space was constructed using the KNDVI as the abscissa and Albedo as the ordinate. The upper boundary A-D edge represented the high Albedo line and reflected the drought condition, which was the limit of the highest Albedo corresponding to the completely dry land under the condition of given vegetation coverage. The lower boundary B-C was a low Albedo line, which represented the condition of sufficient surface water. In Figure 2, four points, A, B, C, and D, represent four extreme states. The closed area surrounded by the four points contains all types of ground objects except clouds and water bodies and presents a certain spatial differentiation law.

3. Results

3.1. The Distribution of Different Degrees of Desertification in the Feature Space

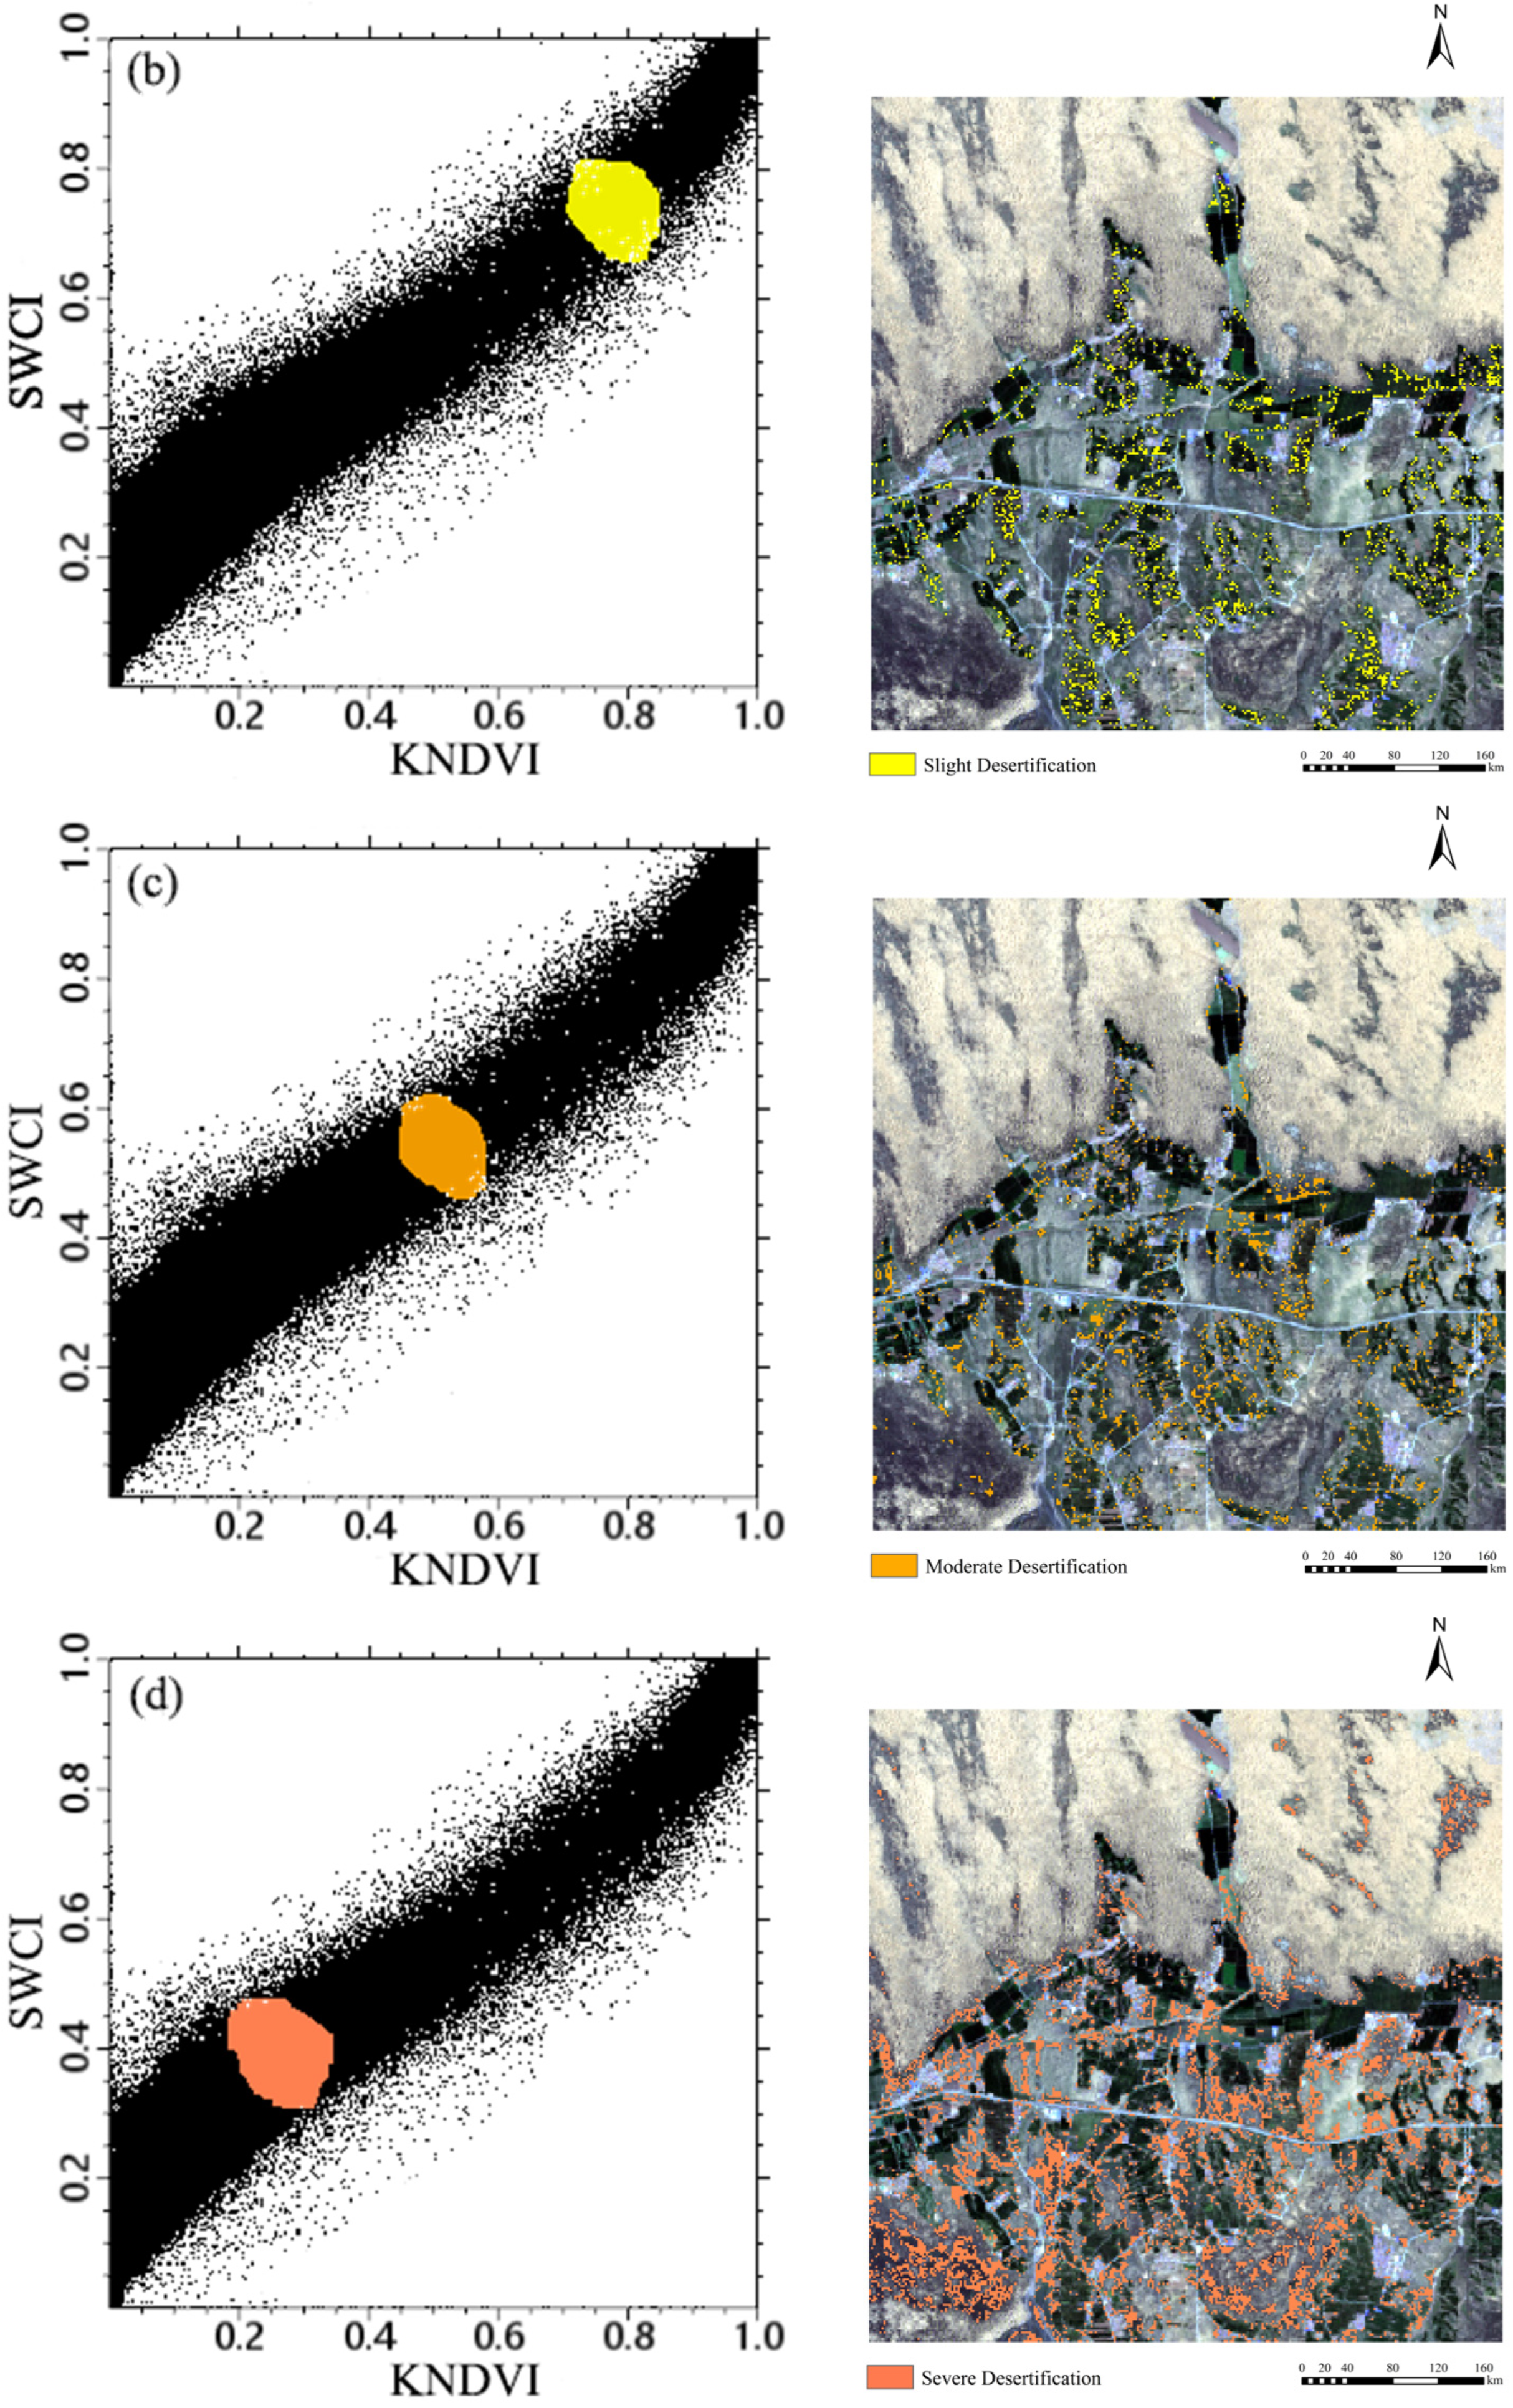
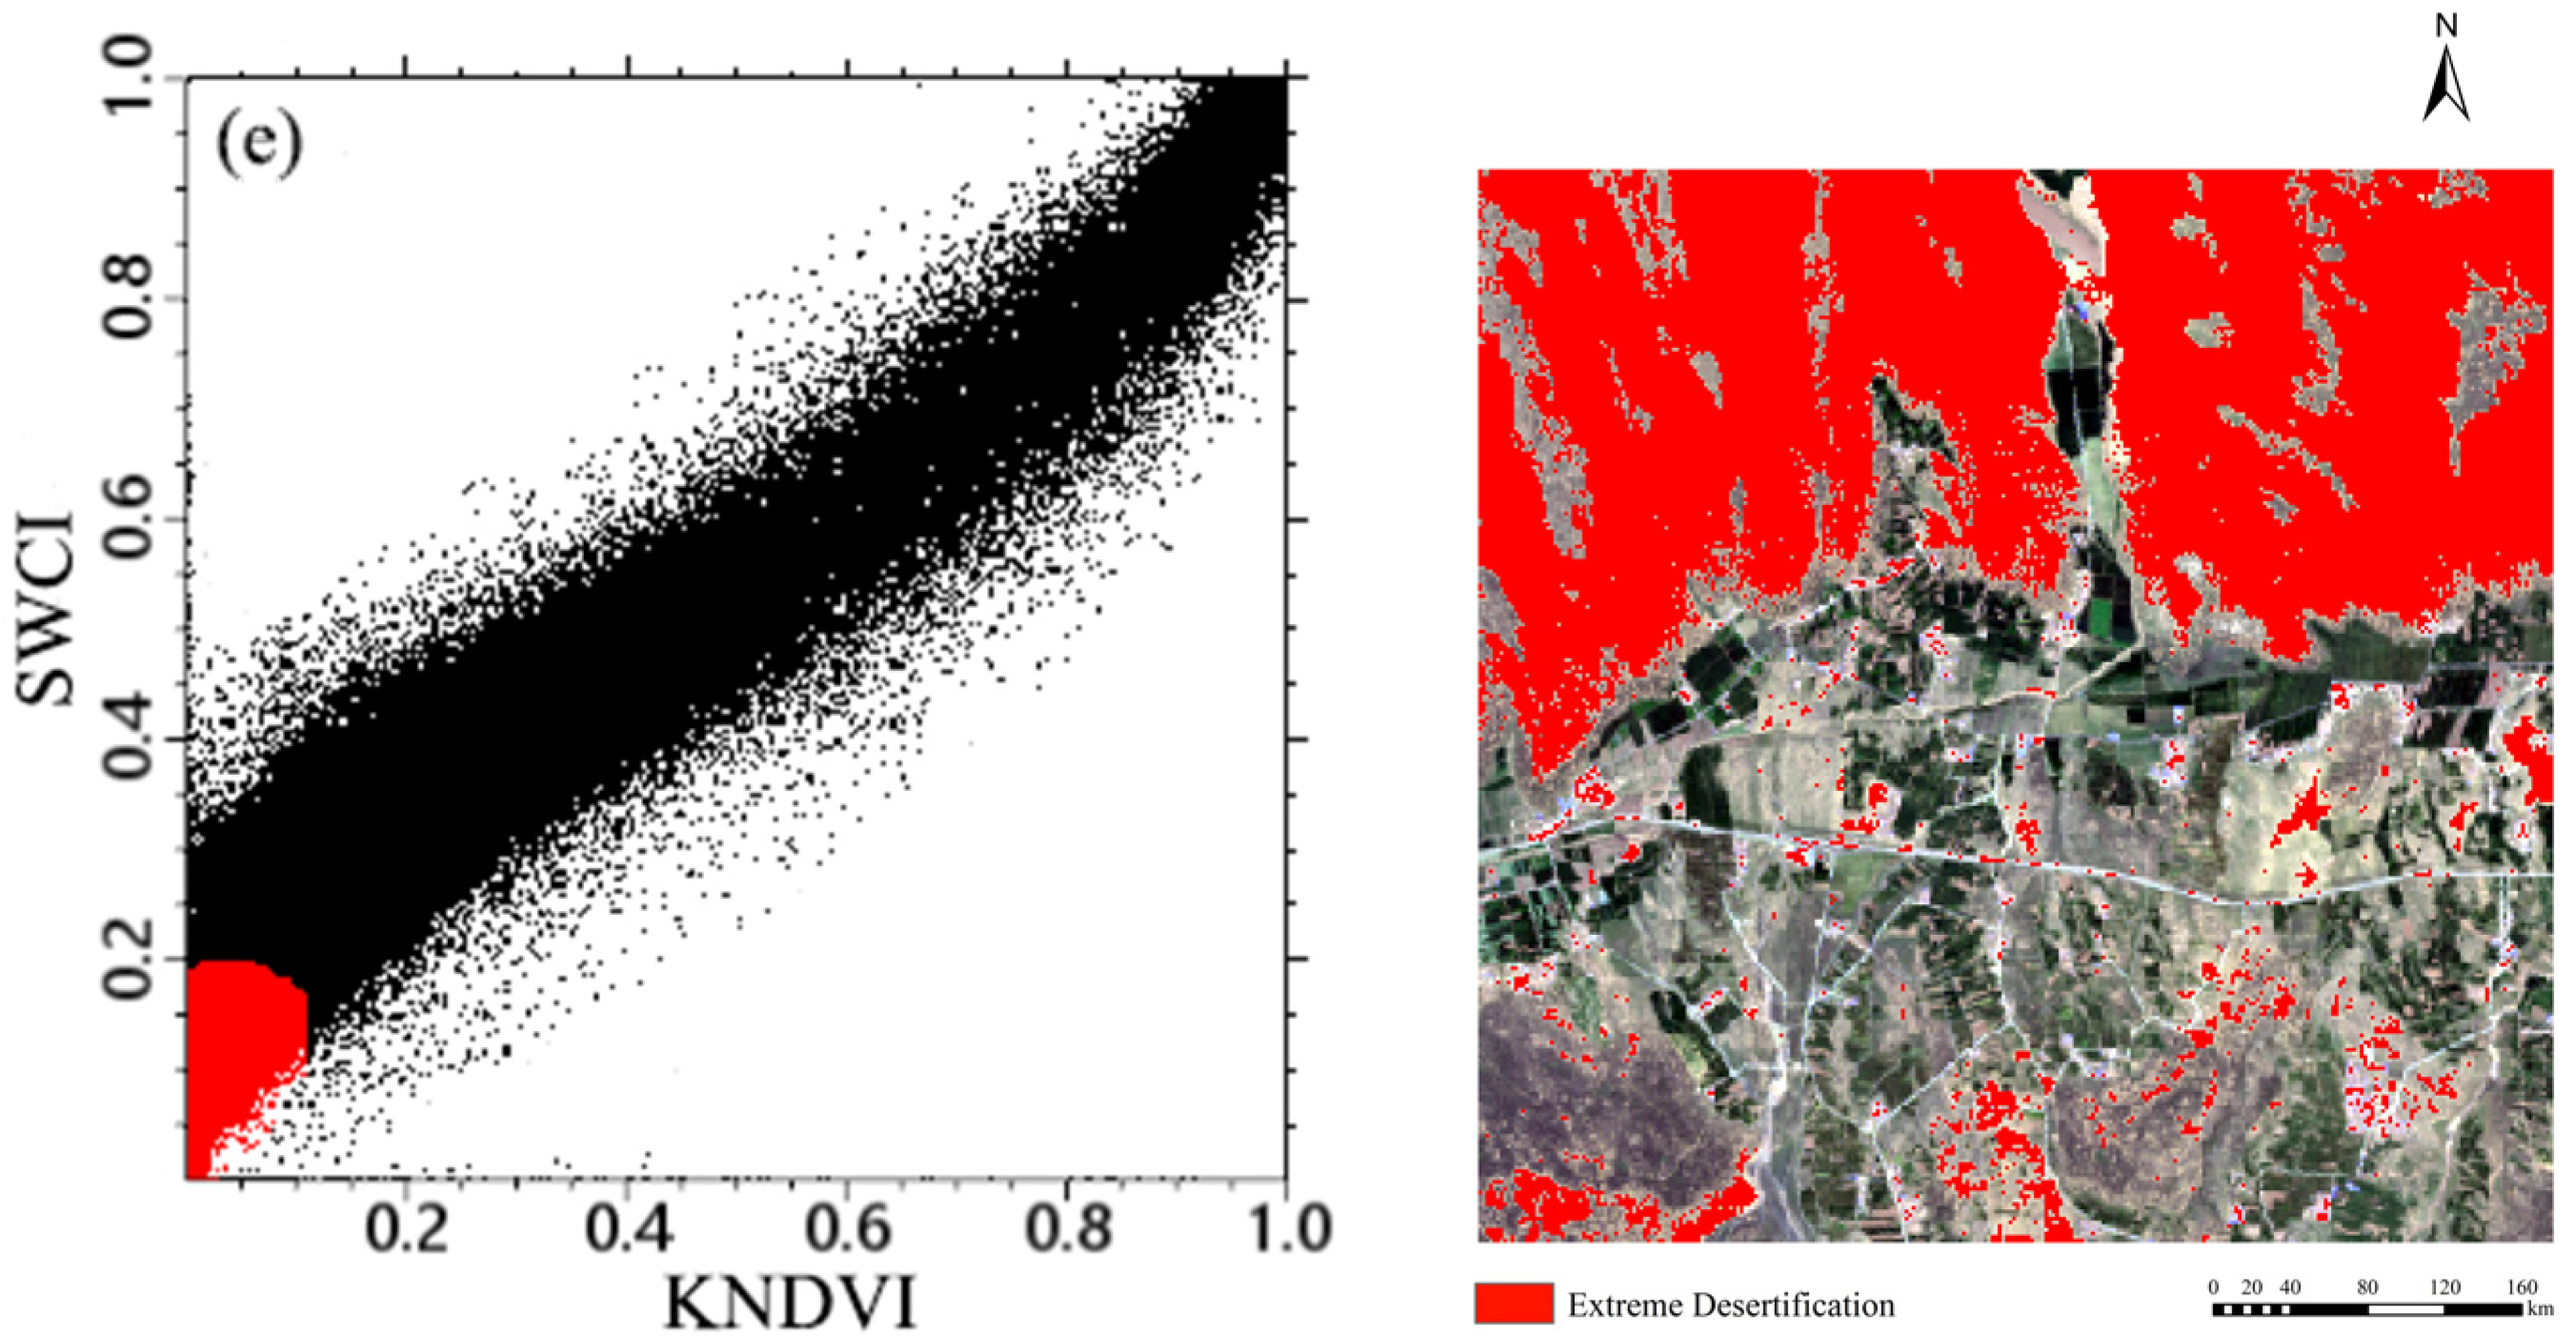
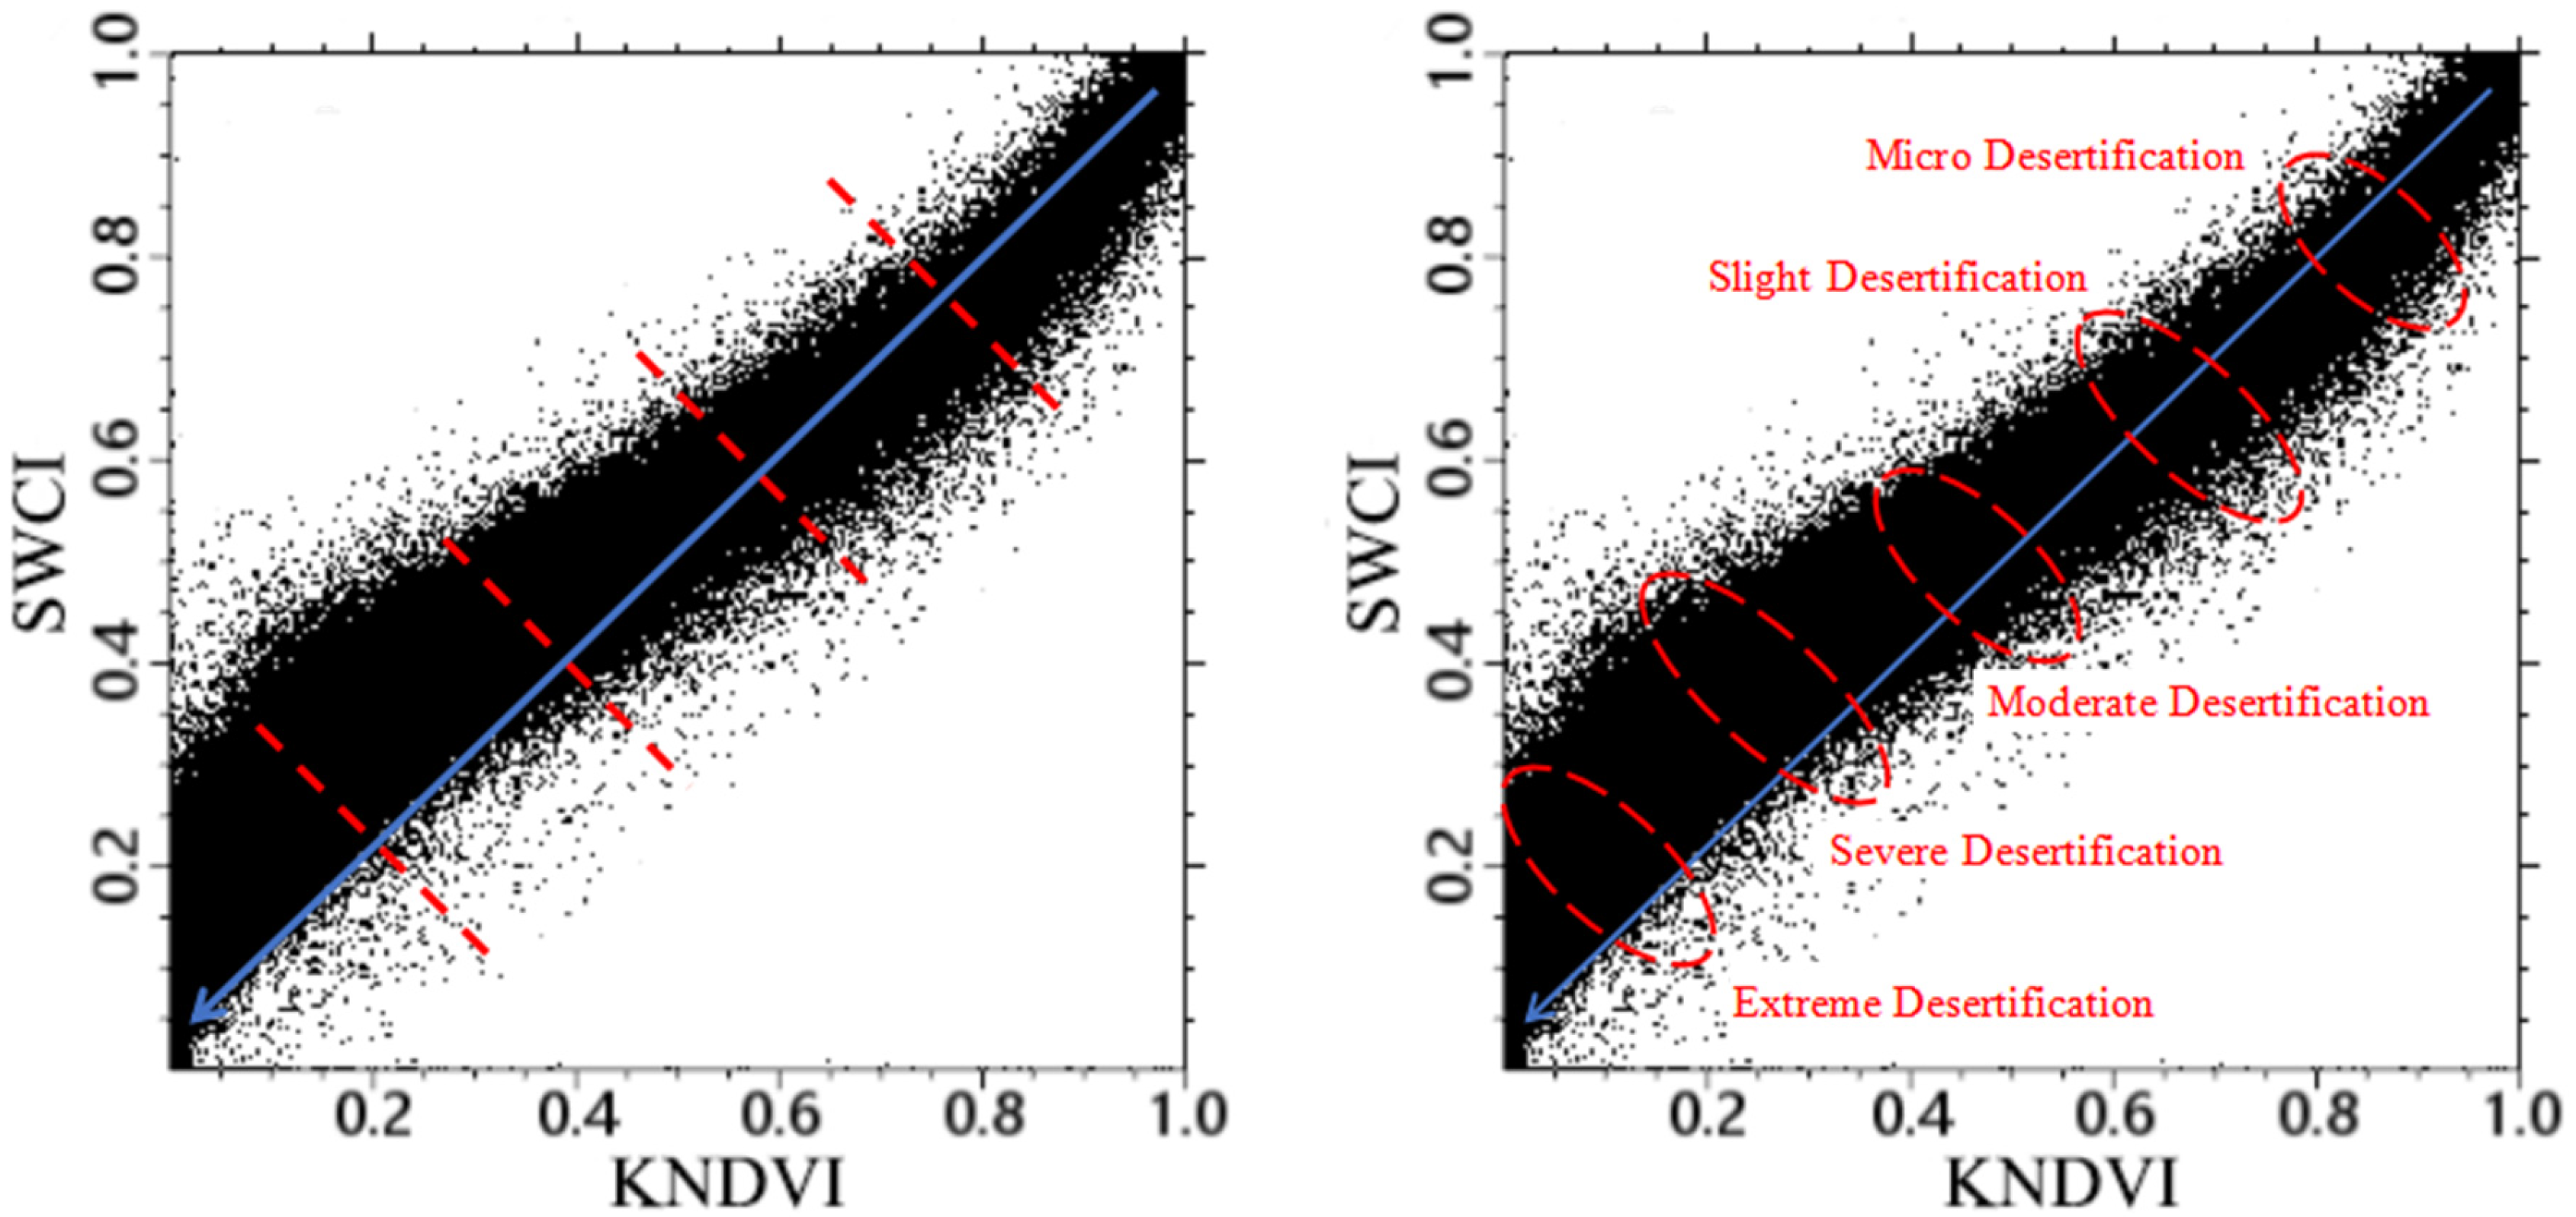
In this study, the above seven parameters are divided into vegetation parameters and soil parameters. According to the research of Dai et al. investigating agricultural drought based on feature space, the vegetation parameters are placed on the X axis, while the soil parameters are placed on the Y axis [31]. The vegetation parameters include the NDVI, KNDVI, and MSAVI, and the soil parameters include Albedo, LST, SWCI, and TGSI. Taking the SWCI-KNDVI feature space as an example, the spatial distribution laws of different levels of desertification in the feature space were analyzed. It was discovered that the spatial distribution of different degrees of desertification and their corresponding points in SWCI-KNDVI feature space had obvious relationships. With the increase in the SWCI, the KNDVI increased, and the degree of desertification gradually decreased. According to the distance from any point to the (0, 0) point in feature space(Figure 3), the farther the distance from the (0, 0) point, the more serious the degree of desertification. Desertification could be divided into five categories, namely, slight desertification, mild desertification, moderate desertification, severe desertification, and extreme desertification. These five categories were clearly distributed in different locations in the feature space.

3.2. Construction of Desertification Remote-Sensing Monitoring Index Model

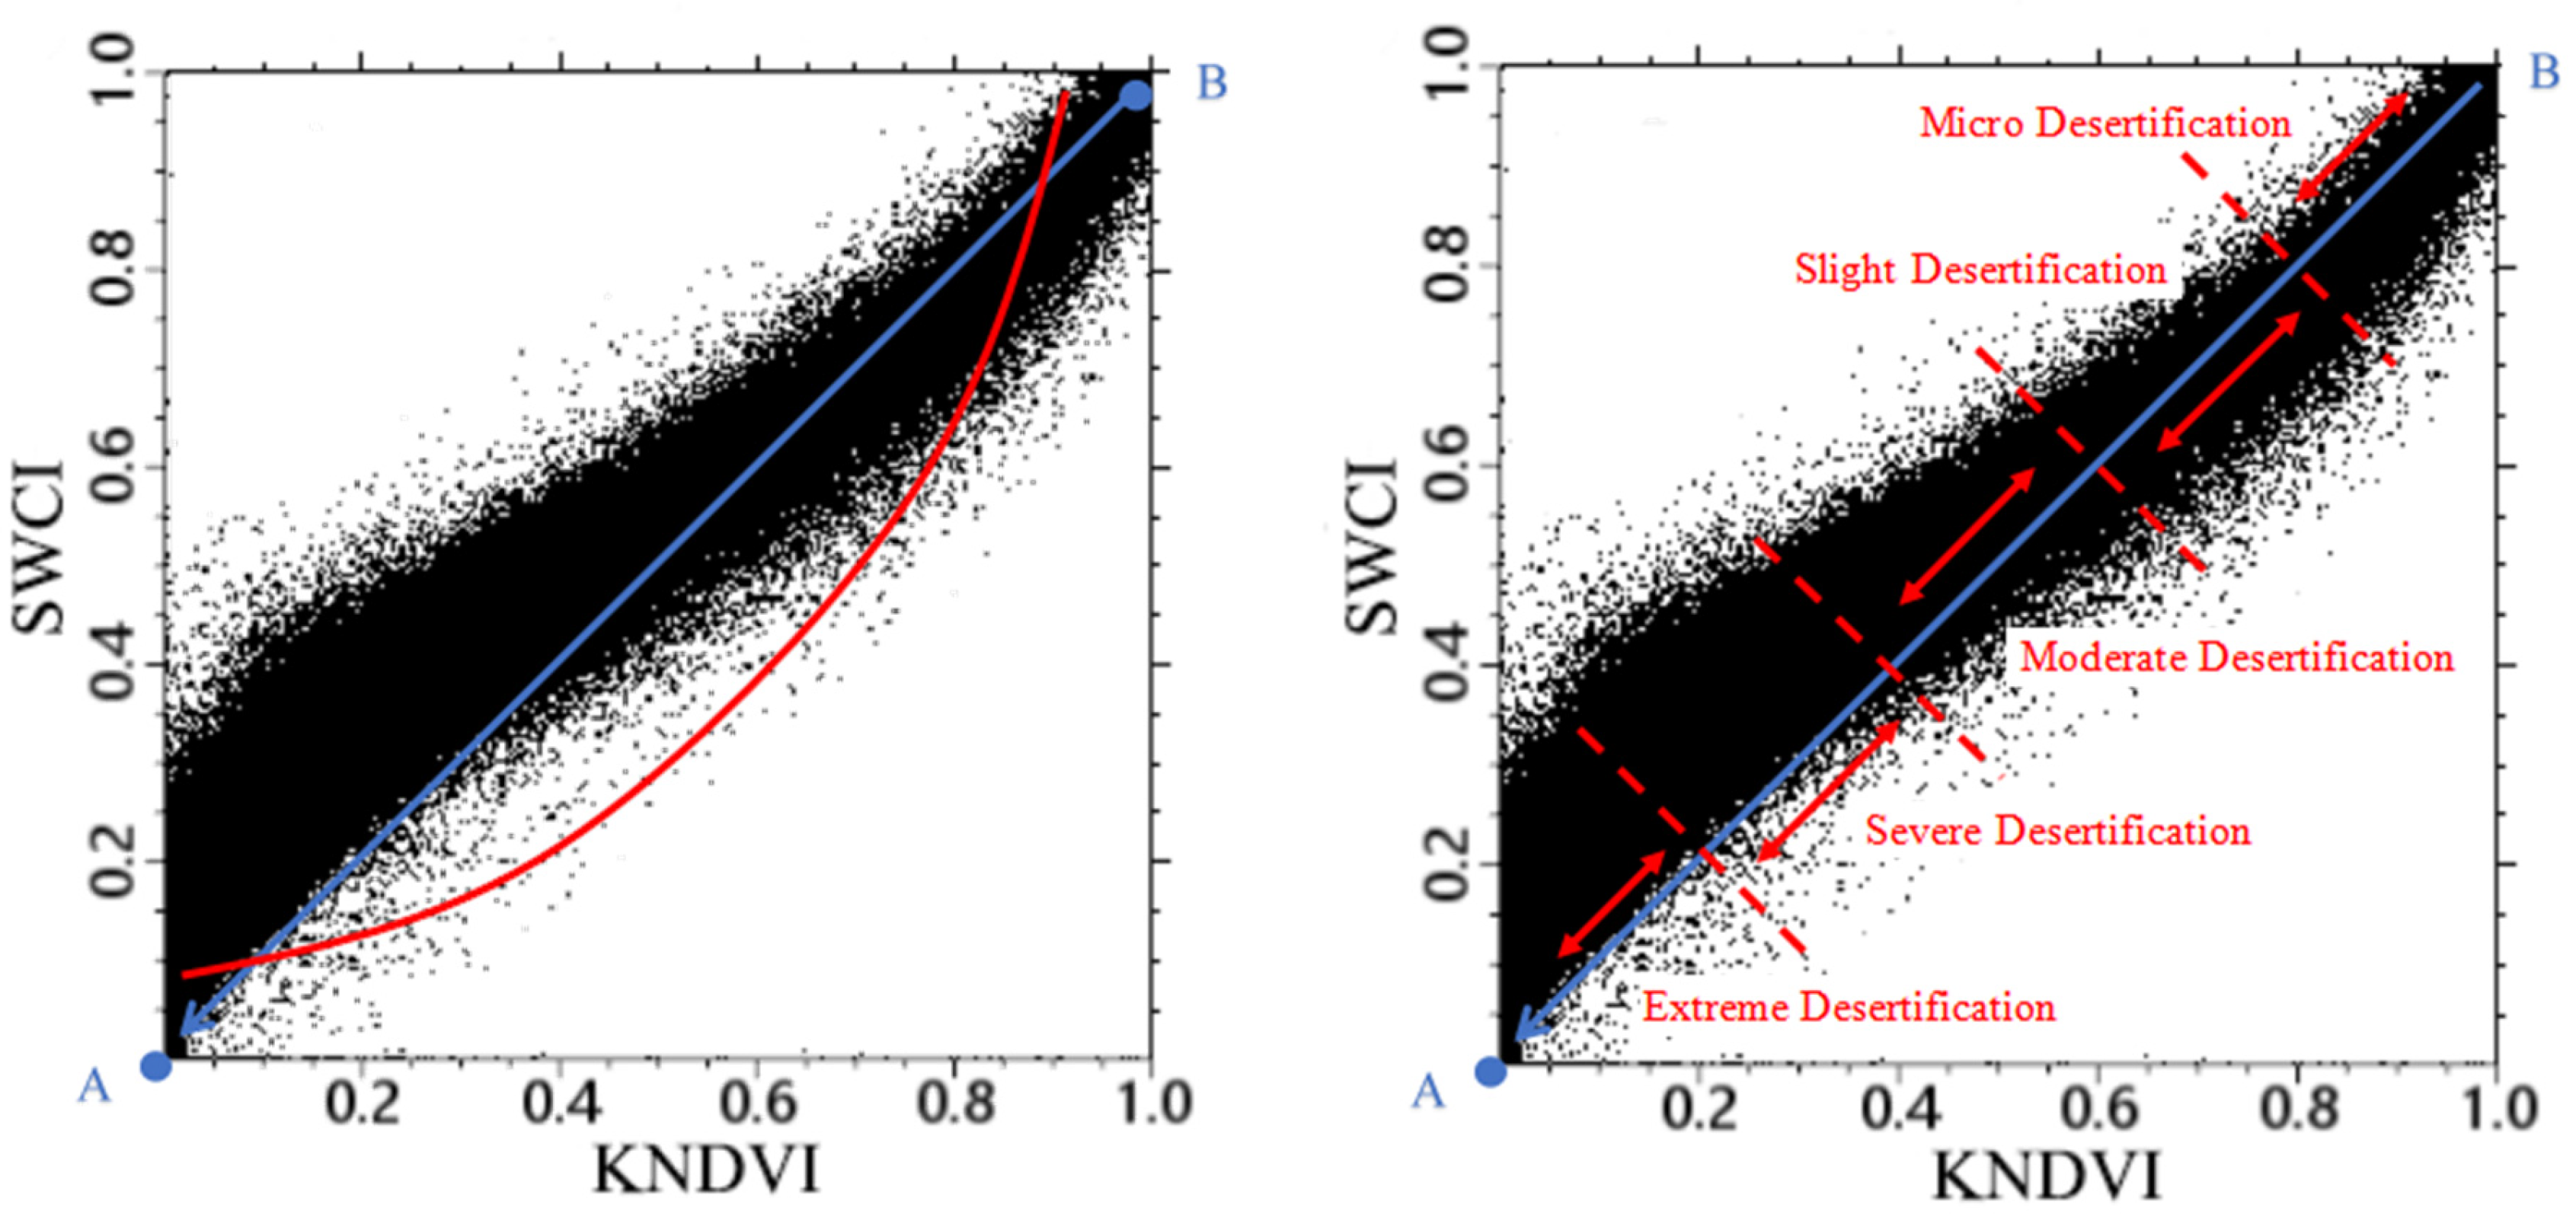
As shown in Figure 4, in the SWCI-KNDVI feature space, there was a spatial differentiation law. According to the law, the straight line perpendicular to the AB line could distinguish different degrees of desertification. The distance from any point in the feature space to point A (0, 0) could be used to divide different states of land desertification. That is to say, the further away the distance from point A (0, 0) was, the sparser the vegetation coverage, the higher the surface Albedo, and the more serious the desertification. Using the distance formula between two points, the distance L from point B (x, y) (any point in the SWCI-KNDVI feature space) to point A (0, 0) could be expressed as:
L = x 2 + y 2
Based on this, the SWCI-KNDVI point-to-desertification difference index model (DDI) can be constructed as follows:
DDI = SWCI 2 + KNDVI 2
As shown in Figure 5, according to the research conclusions of Verstrate and Pinty [32,33], if the SWCI-KNDVI feature space was divided in the vertical direction of the desertification change trend, different desertification lands could be effectively distinguished. According to this principle, 2000 sample points in the study area were randomly selected, and the SWCI and KNDVI values of the sample points were extracted to construct the point–line regression equation (Equation (11)). According to the coefficients a, SWCI, and KNDVI in the equation, the point–line desertification difference index model (Equation (12)) was constructed as follows:
SWCI = a KNDVI + b
DDI = ( 1 a ) KNDVI SWCI
In the formula, a and b are the coefficients and intercepts of the point–line regression equation, respectively.
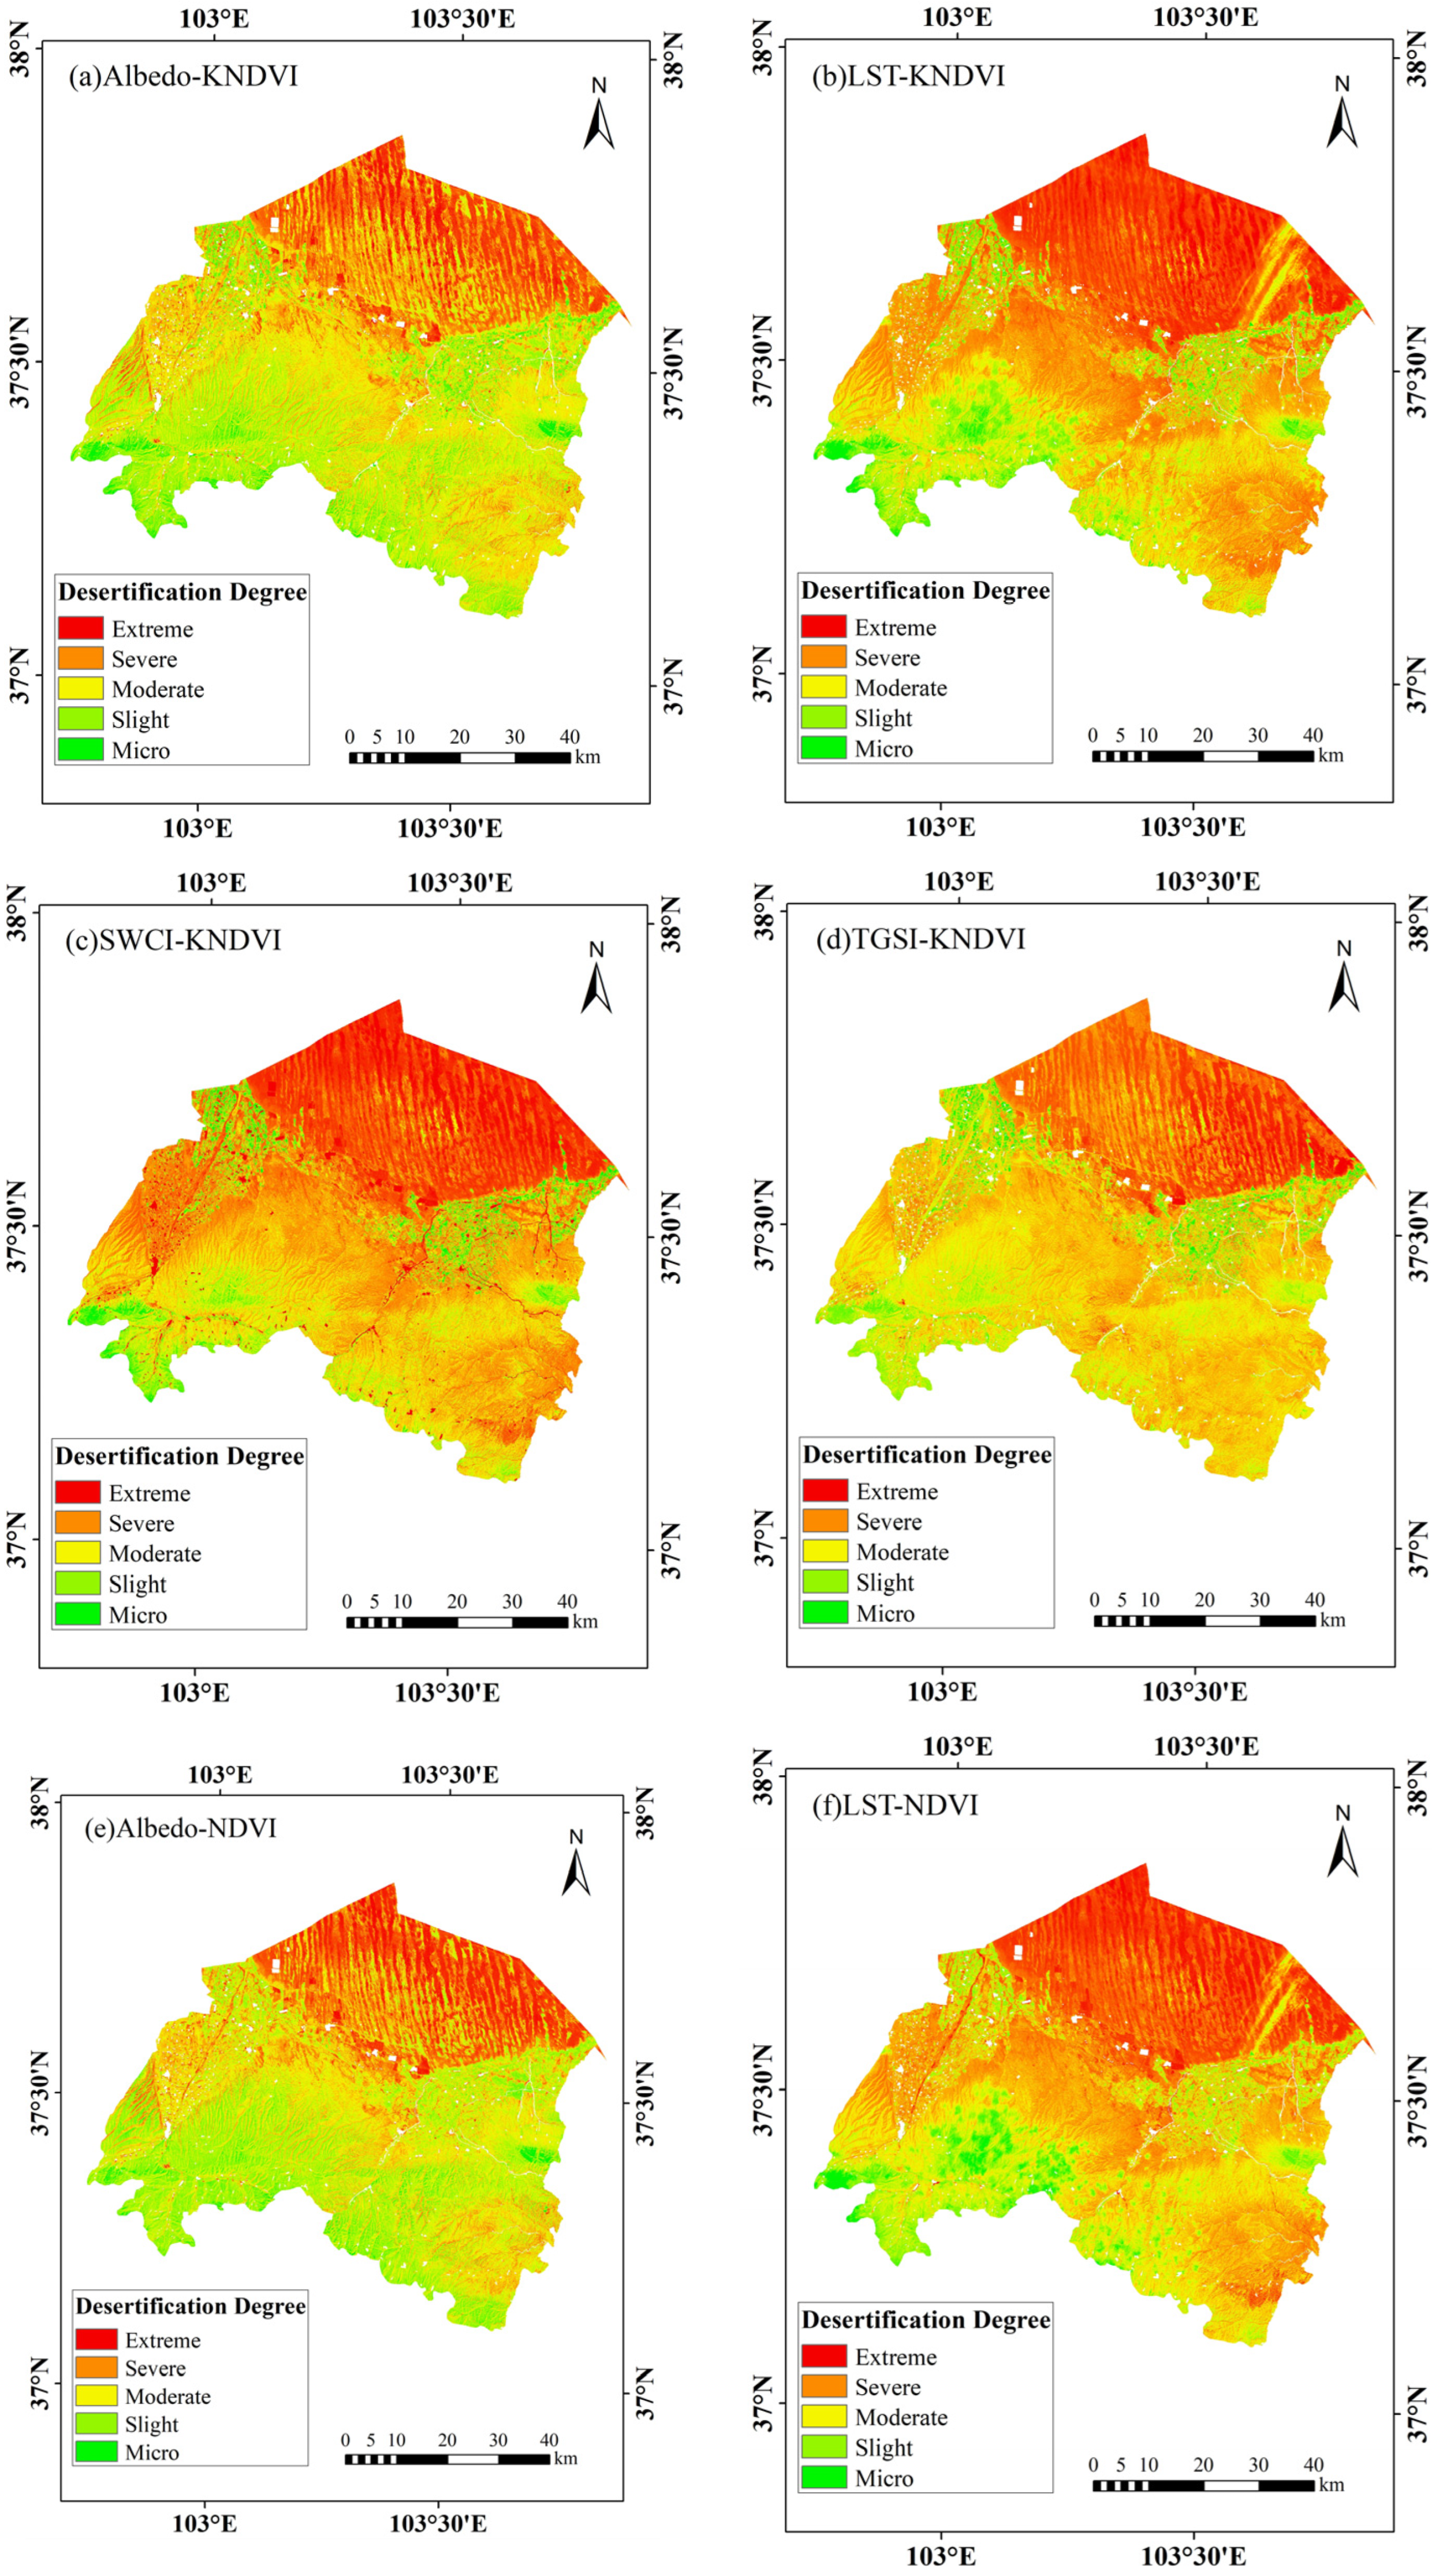
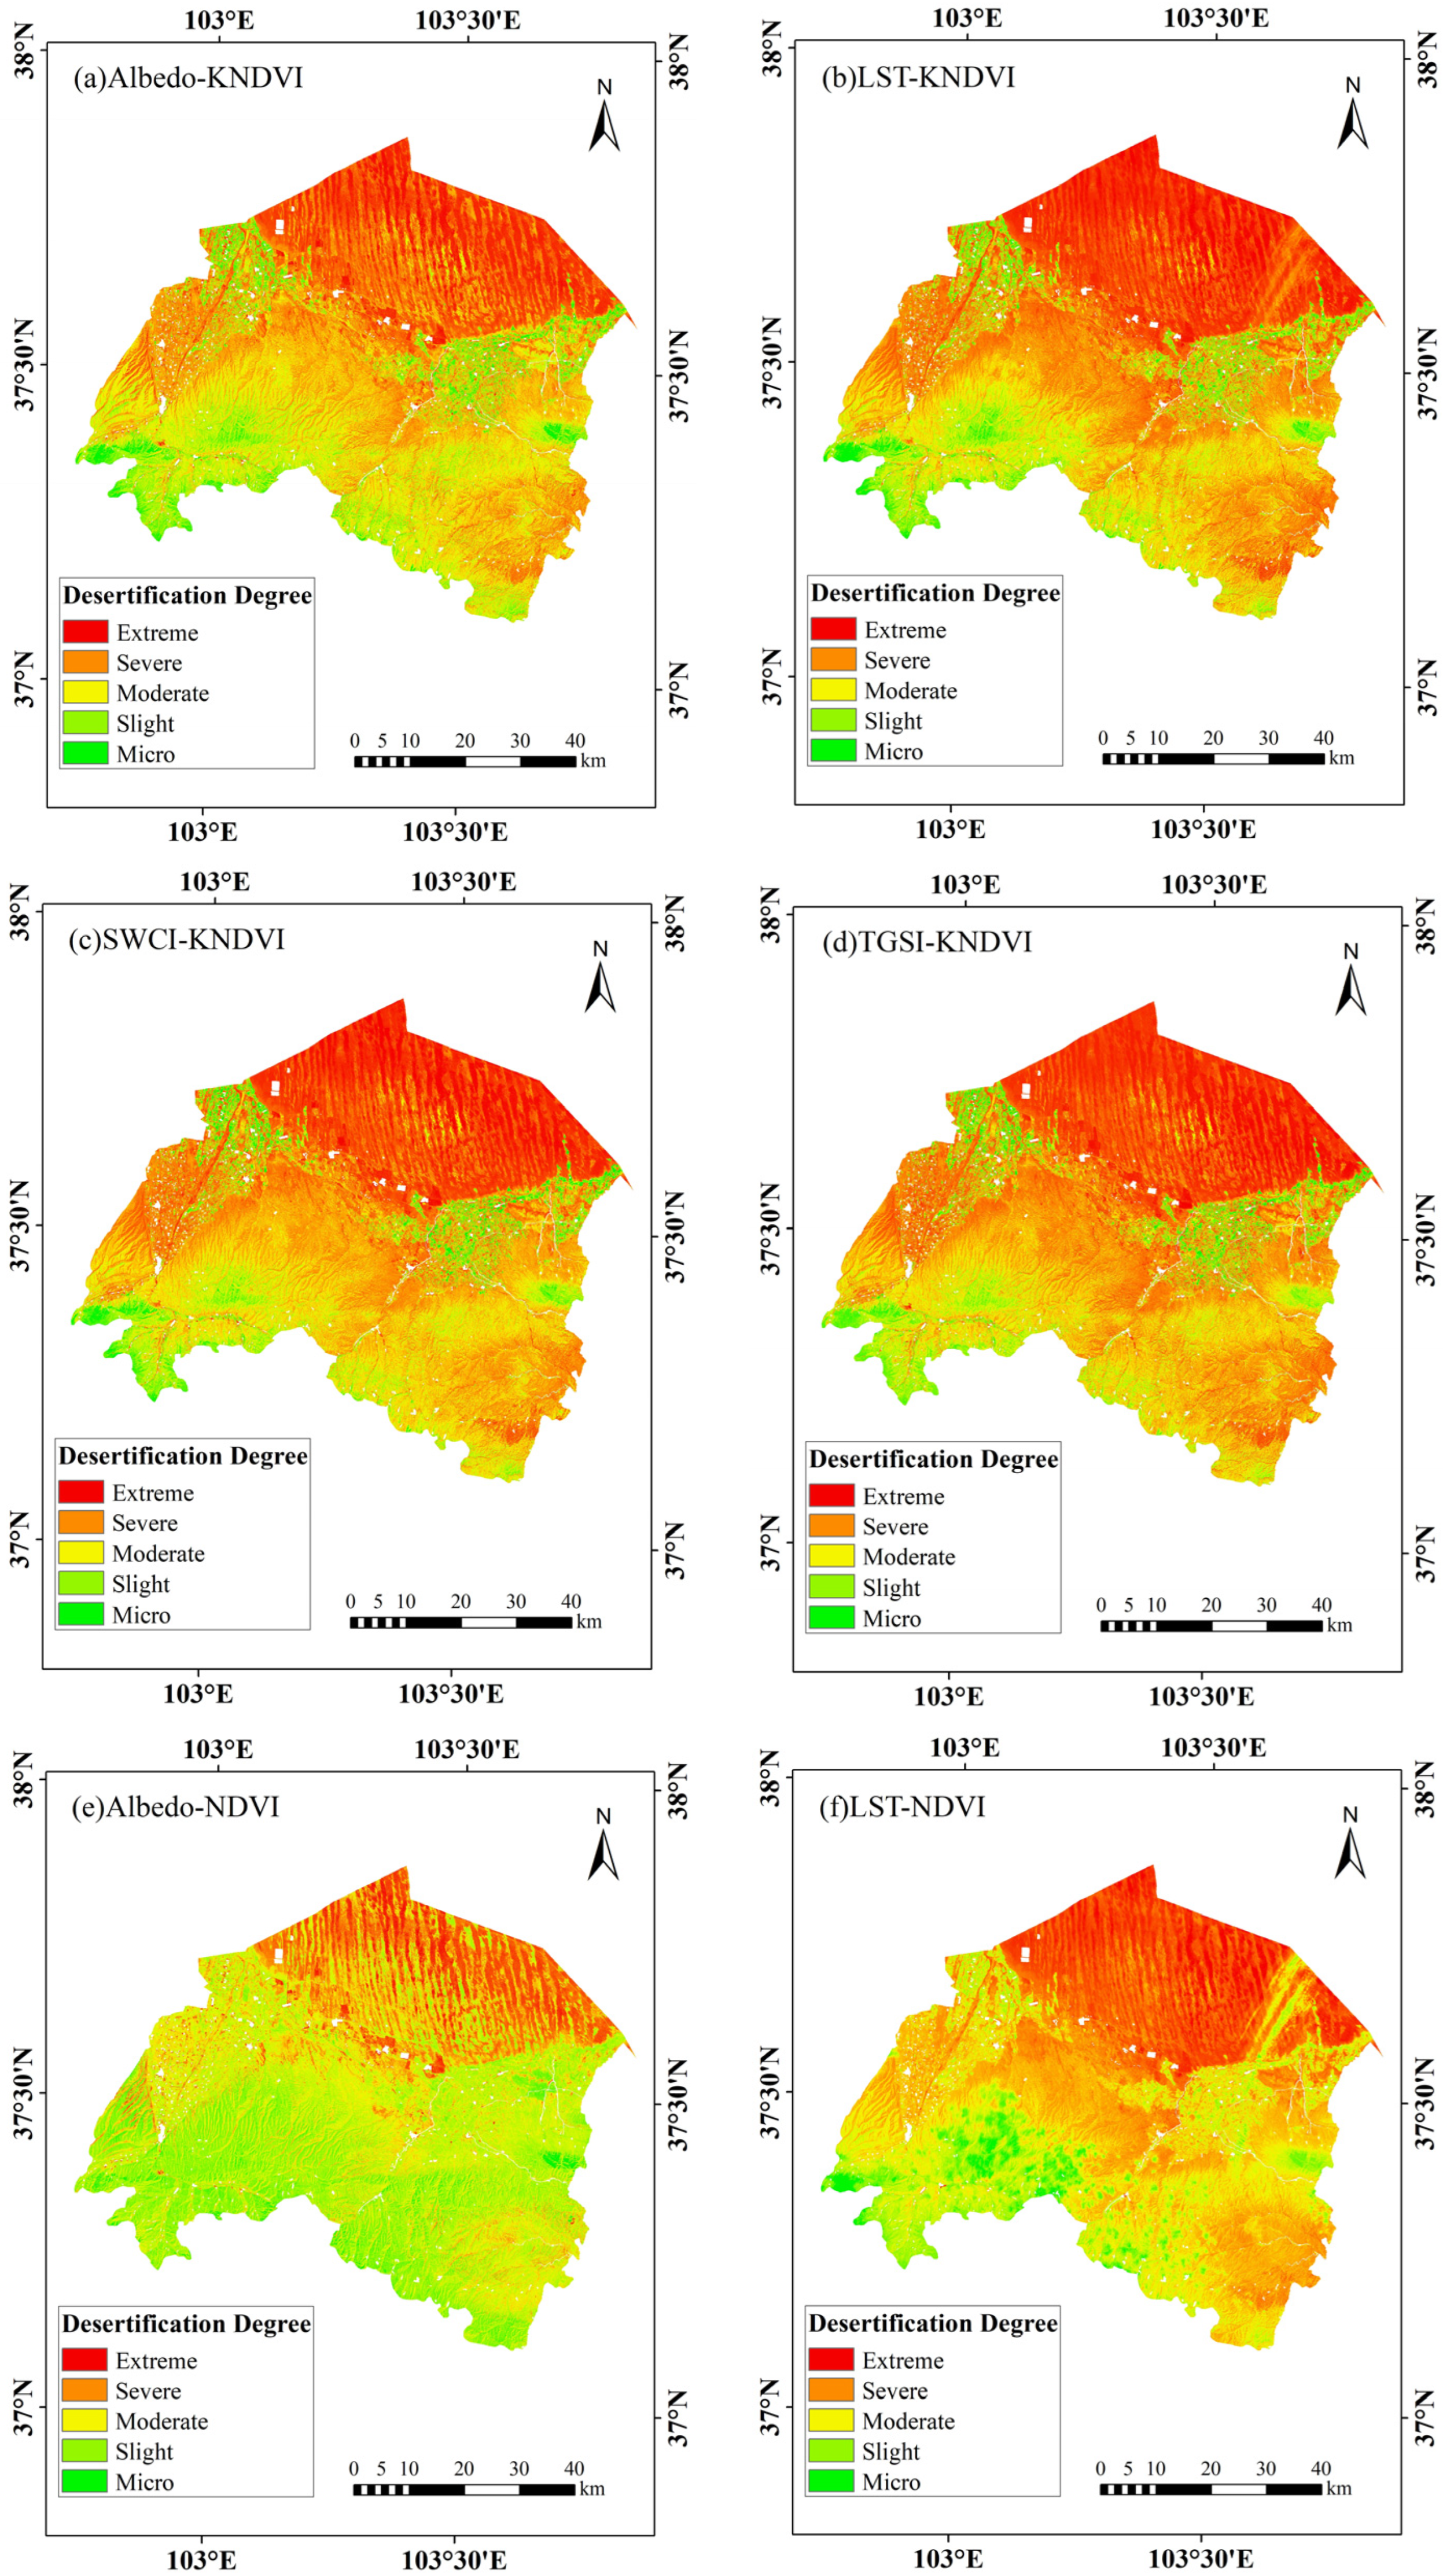
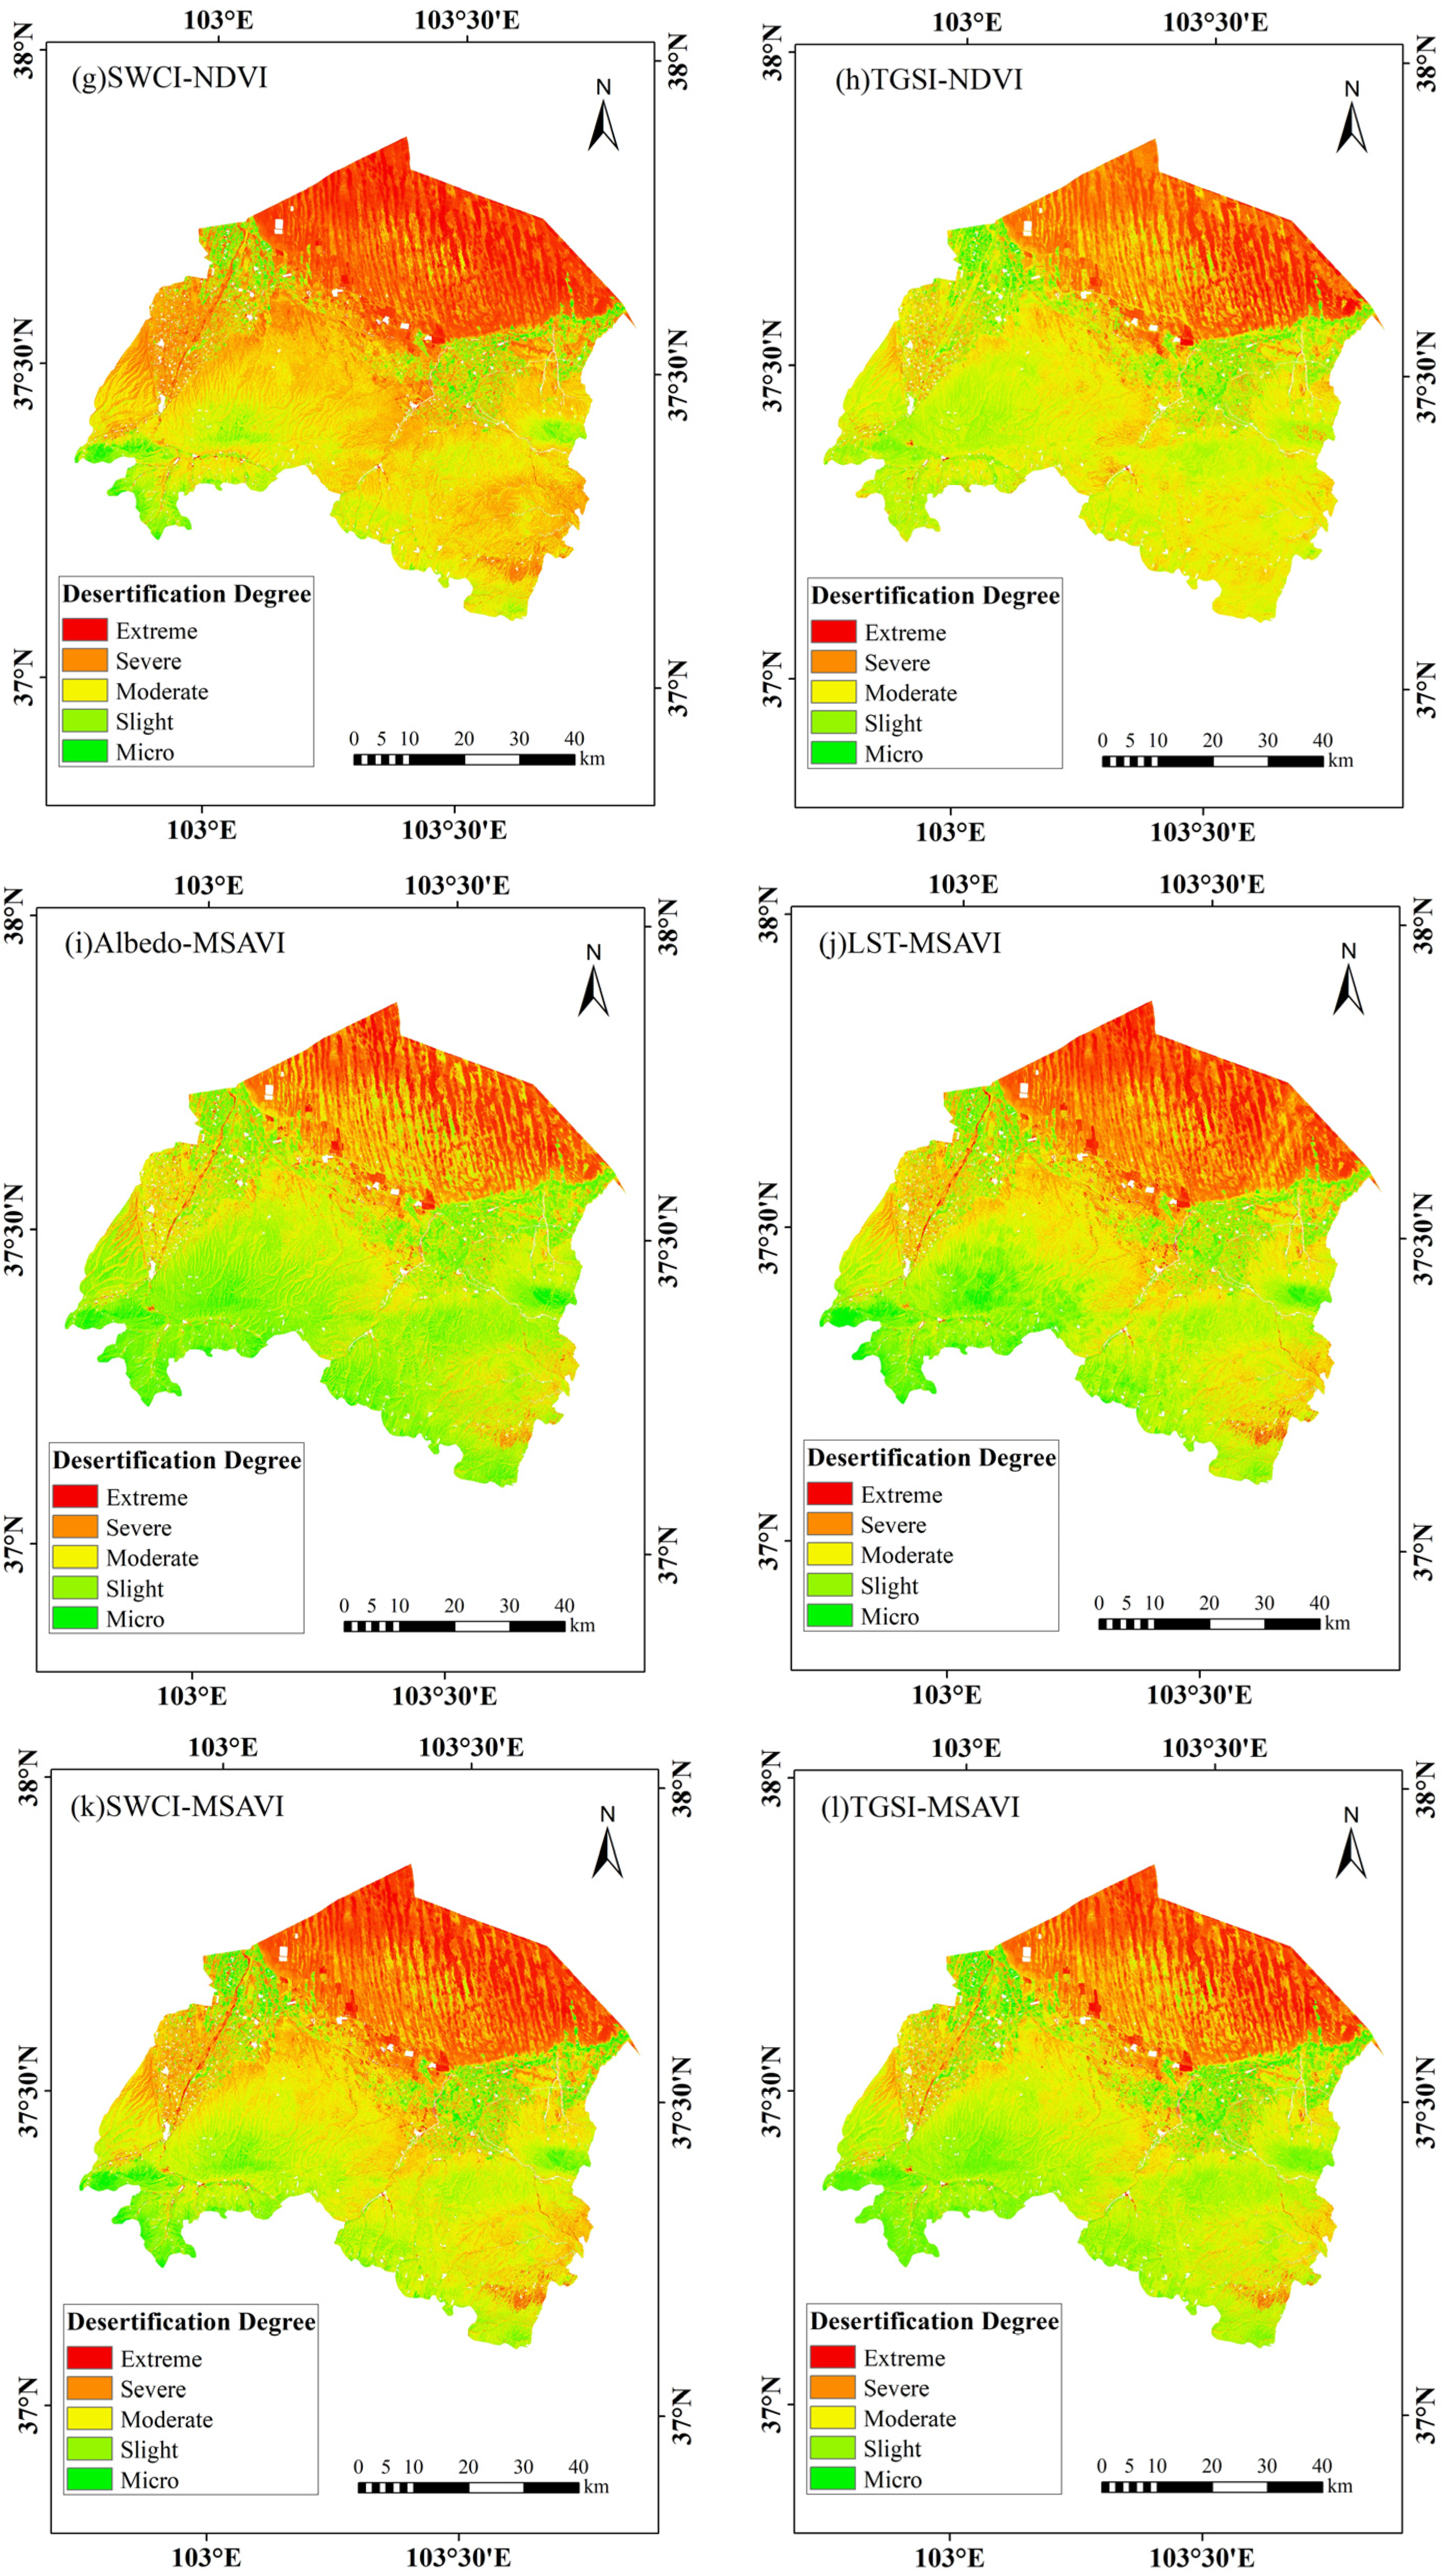
According to the construction principle of the above two desertification difference index models of point distance and point line and the distribution law of desertification degree combined with point group, 12 point distance monitoring models and 12 point–line monitoring models were constructed with seven characteristic parameters(Figure 6 and Figure 7).

3.3. Accuracy Evaluation

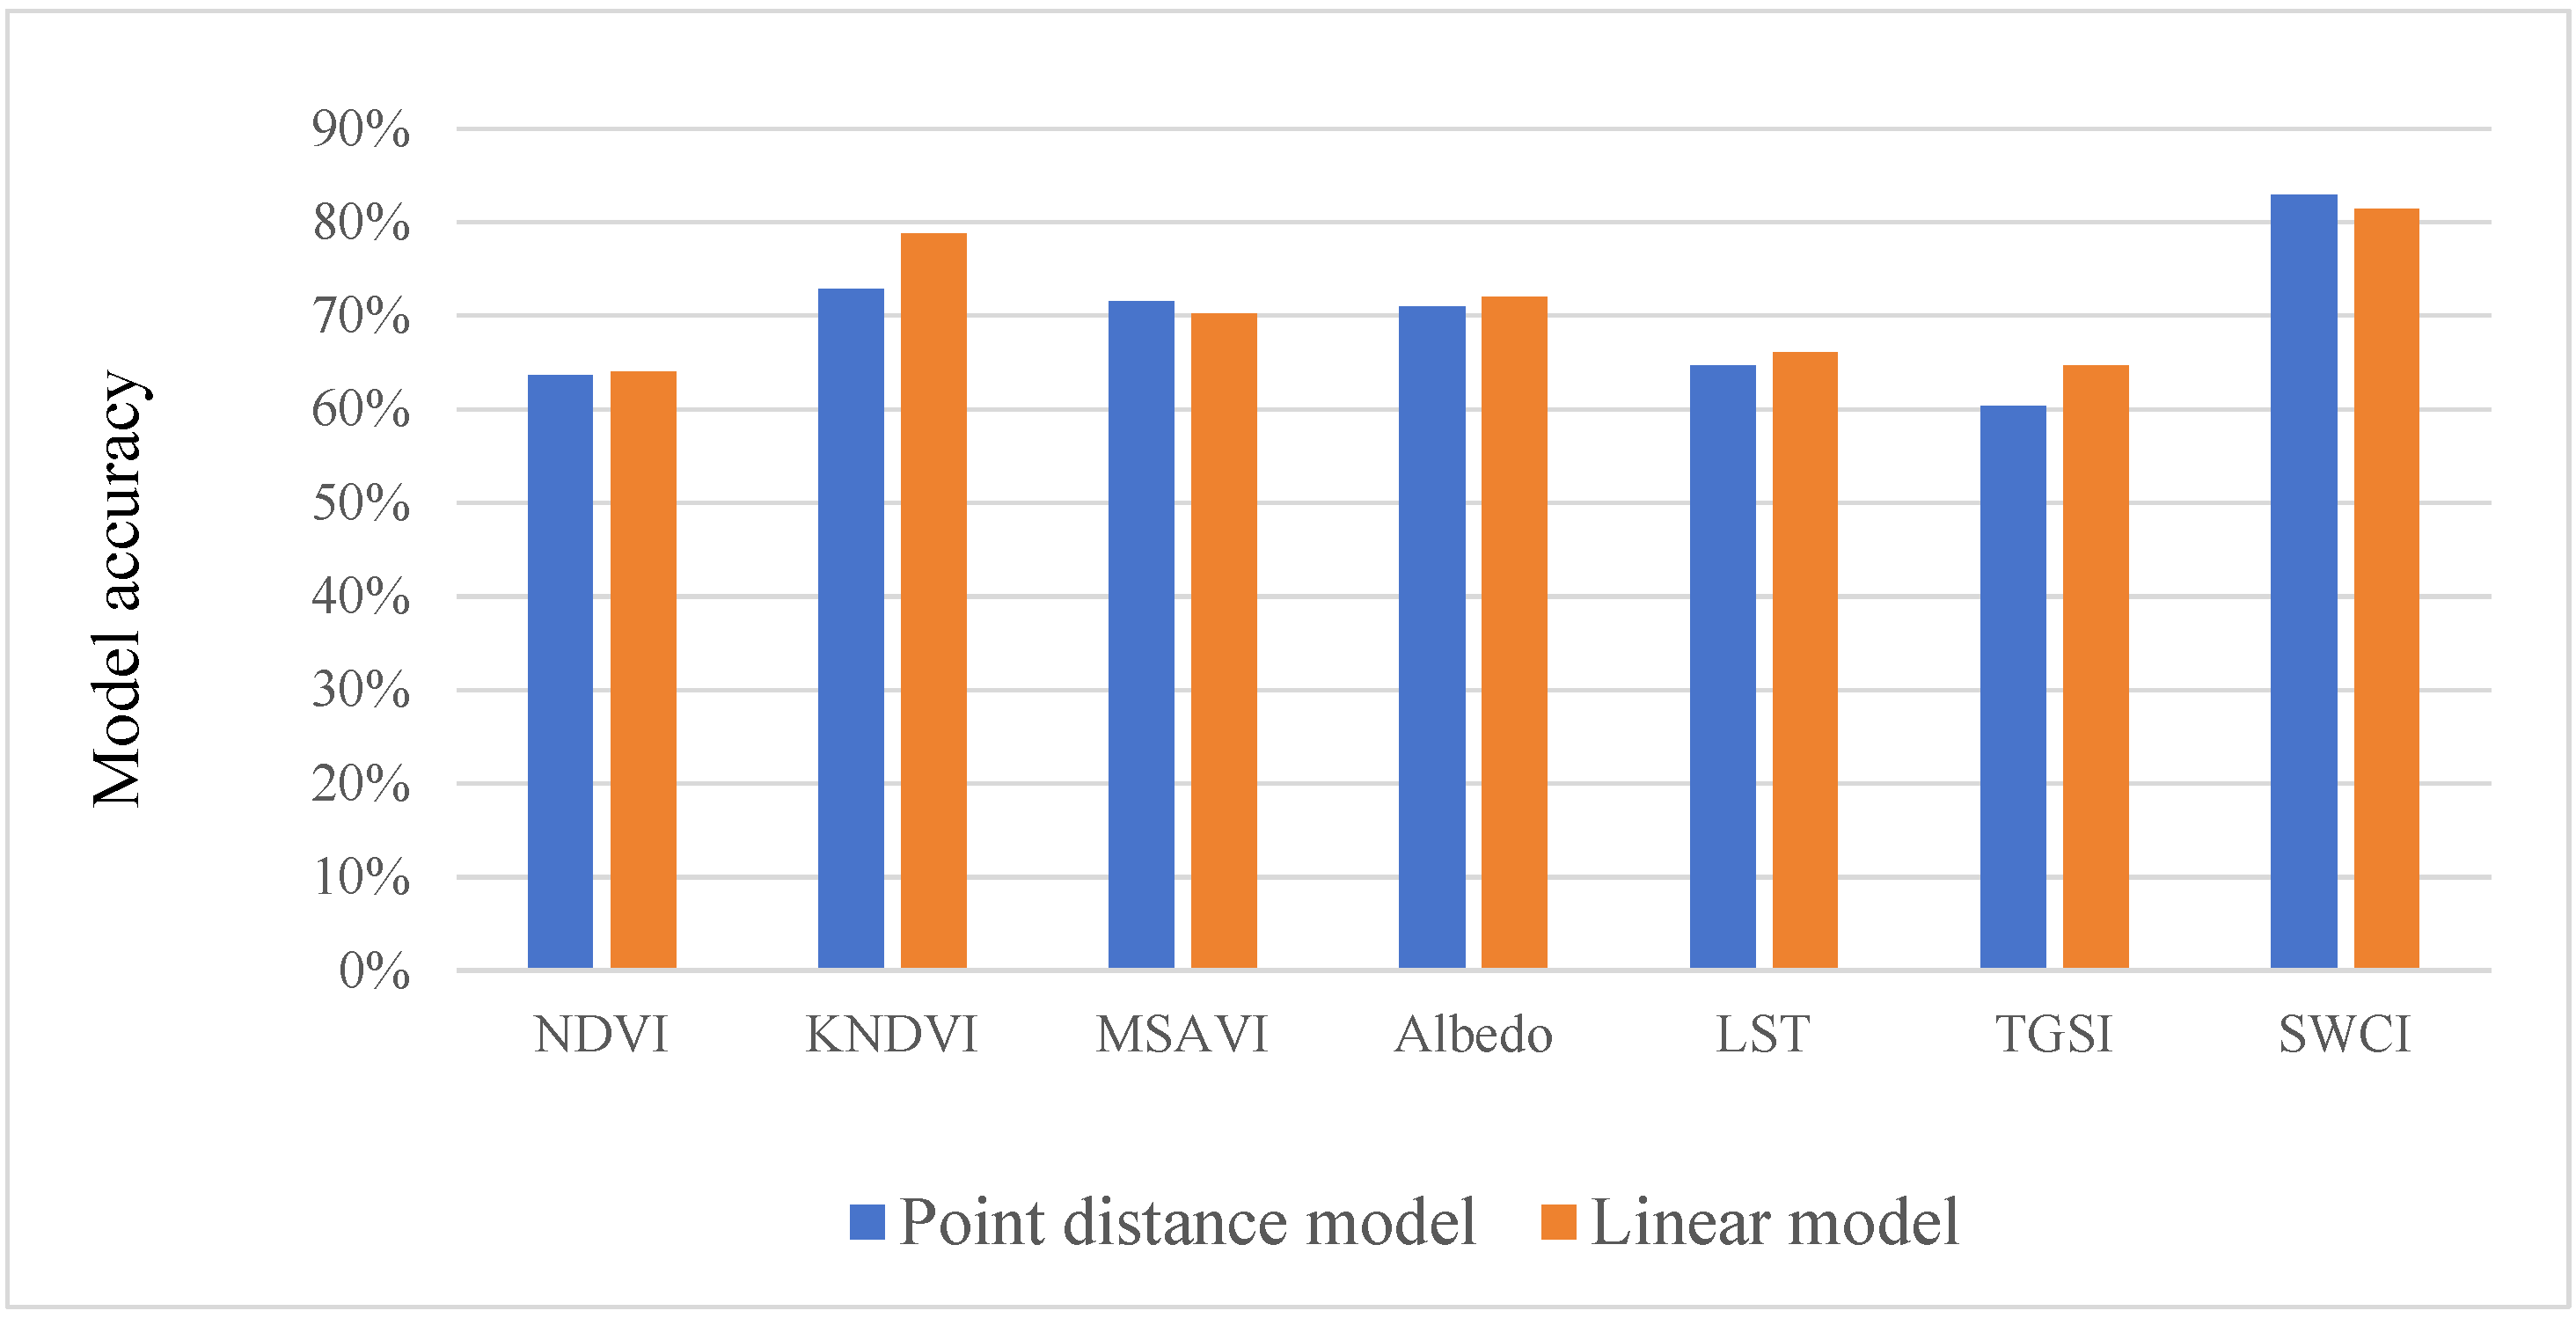
Based on the measured ground data and Google Earth images, 216 verification points were selected in the study area to construct the confusion matrix [32]. Taking the KNDVI-Albedo index model of point–line mode as an example (Table 2), the accuracy and Kappa coefficient of each model were calculated based on the confusion matrix (Table 3). The closer the Kappa coefficient was to 1, the higher the consistency. According to the accuracy of each model, the accuracy of each surface parameter was statistically analyzed (Figure 8). As shown in Table 3 and Figure 9, the KNDVI-Albedo index model in point–line mode had the highest accuracy of 94.93% with a Kappa coefficient of 0.934, followed by a point distance MSAVI-SWCI index model with an accuracy of 88.94% and a Kappa coefficient of 0.856. The accuracy of 54.38% for the NDVI-TGSI point–line model was the lowest, with a Kappa coefficient of 0.405. Among the seven surface parameters, the accuracy of the point distance model and point–line model constructed using the KNDVI index was higher than that of the point distance model and point–line model constructed with the NDVI and MSAVI. There are many factors affecting the surface temperature and surface reflectance, so these will, in turn, affect the accuracy of the model. The surface water content directly reflects the degree of soil desertification, and the measurement accuracy is high. The composition of soil particles is complex, and the soil desertification standards of different components are different, so the accuracy of the soil particle size index is low. Compared with the NDVI and MSAVI, the KNDVI has higher sensitivity and stability due to the large number of terrain types and complex vegetation types in Gulang County. Therefore, in summary, the point–line model KNDVI-Albedo index was more suitable for the remote-sensing monitoring of desertification in Gulang County.

3.4. The Spatial Distribution of Different Degrees of Desertification Area in Gulang County

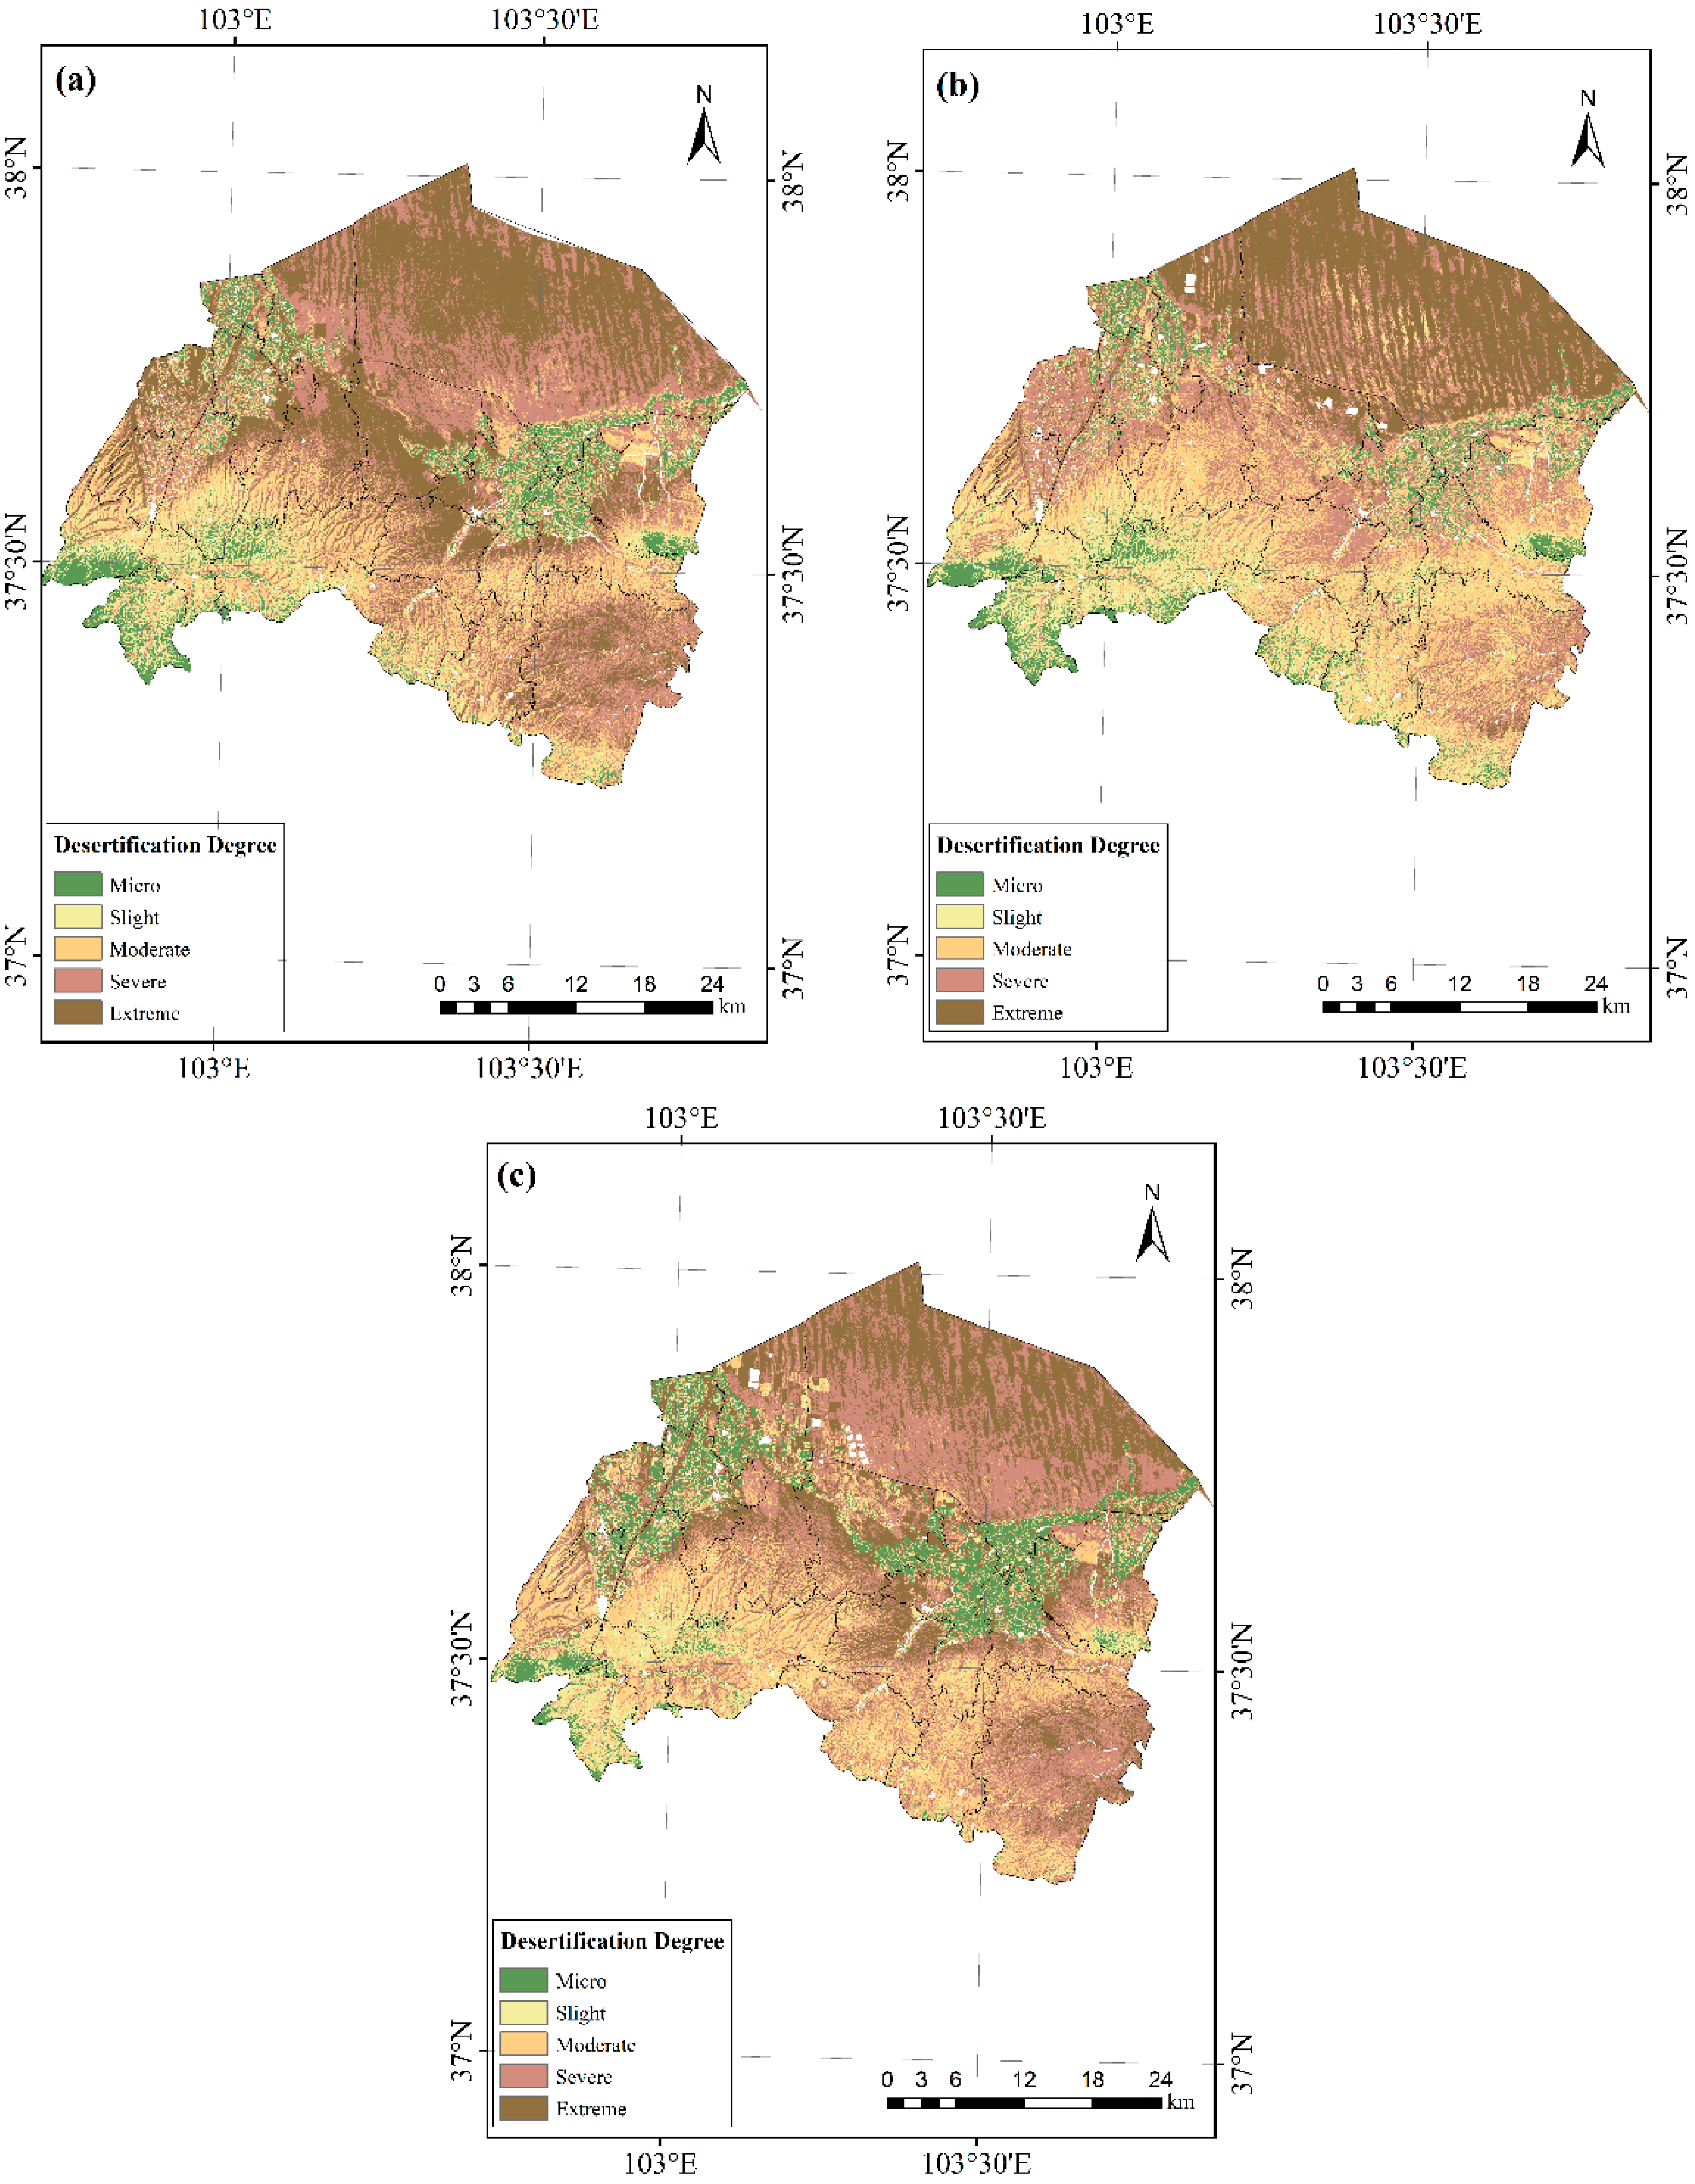
Based on the KNDVI-Albedo remote-sensing monitoring model in point–line mode, this study inverted the desertification datasets of 2013, 2018, and 2023 (Figure 9). The area and proportion of different degrees of desertification in 2013–2023 are shown in Table 4. In 2013, the area of extreme desertification of 1598.22 km2 was the largest, accounting for 32.13% of the land area and mainly distributed in Haizitan Town, Huanghuatan Town, Xijing Township, and Minquan Township. The area of micro-desertification of 416.01 km2 was the smallest, accounting for 8.36%, and was mainly distributed in Yongfengtan Town, Dajing Town, Zhitan Town, Shibalipu Township, Heisongyi Town, and Peijiaying Town. In 2018, the area of severe desertification of 1350.54 km2 was the largest, accounting for 27.17%, which was mainly distributed in Sishui Town, Haizitan Town, Xinbao Township, Minquan Township, Xijing Township, and Huanghuatan Town. The area of micro-desertification of 430.55 km2 is the smallest, accounting for 8.66% of the land area. The spatial distribution areas were essentially the same as those in 2013. In 2023, the area of severe desertification of 1677.74 km2 was the largest, accounting for 33.76%, and mainly distributed in Haizitan Town, Huanghuatan Town, Peijiaying Town, Hengliang Township, Qiancheng Town, and Xinbao Township. The area of slight desertification accounted for the smallest proportion, which was 470.37 km2, accounting for 9.46%, and was mainly distributed in Yongfengtan Town, Dajing Town, Tumen Town, Sishui Town, Zhitan Town, Heisongyi Town, and Shibalipu Township. According to the changes in different degrees of desertification area, compared with 2013, the area of desertification mitigation in Gulang County in 2023 was 103.95 km2 more than the area of desertification intensification. Therefore, on the whole, Gulang County showed a slight trend of improvement, mainly from extreme desertification to severe desertification. Wuxiaomei’s research showed that due to global warming, vegetation restoration and growth were affected, and most areas of Wuwei City still showed a trend of increasing desertification; meanwhile, the sand control measures undertaken in Gulang County achieved remarkable results [34]. This is consistent with the conclusion that the degree of desertification in human-intensive areas is alleviated and the degree of desertification in human-sparse areas is aggravated.

3.5. Migration Trajectory of Desertification Gravity Center in Gulang County

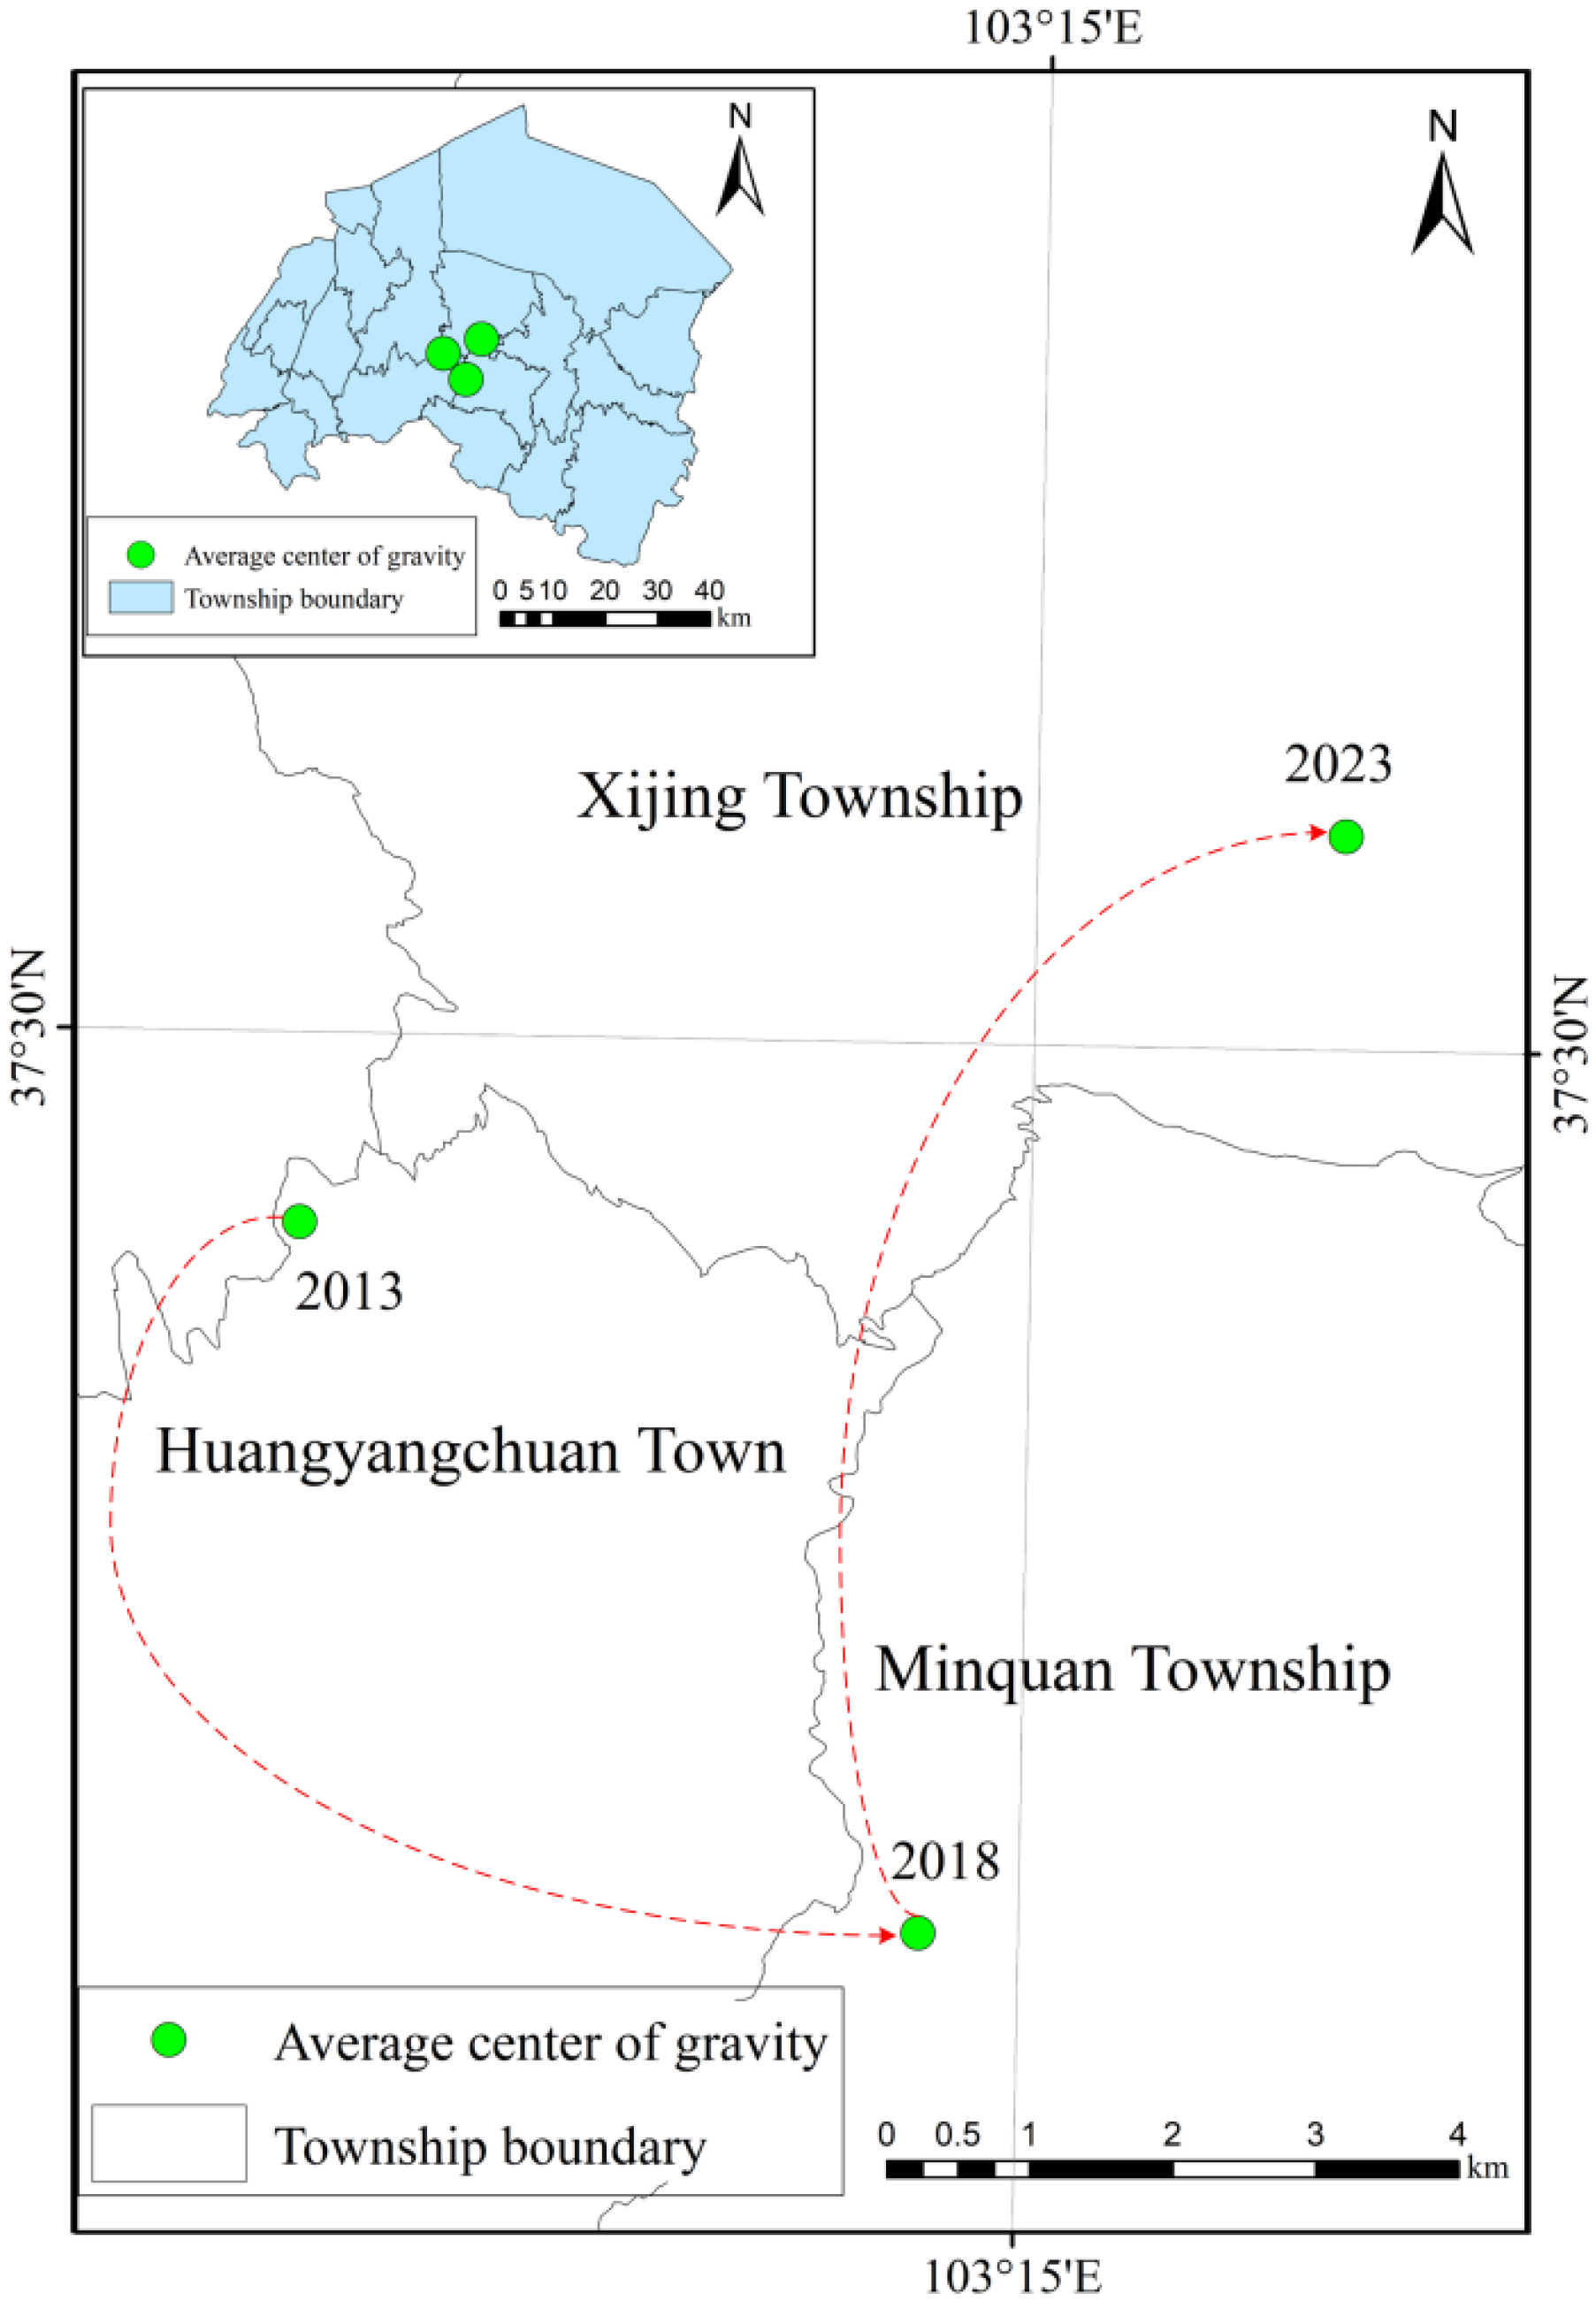
The gravity center represents the spatial and temporal characteristics of geographical elements. In this study, the gravity center represented the unevenness of the change in desertification degree. As shown in Figure 10, from 2013 to 2023, the average gravity center of desertification was mainly concentrated at the junction of Xijing Township, Huangyangchuan Town, and Minquan Township. From 2013 to 2018, the average gravity center of desertification was 6.66 km in the east–south direction. During this period, the change rate in desertification in the south of Gulang County was greater than that in the north, and the change rate in desertification in the east was greater than that in the west. From 2018 to 2023, the average gravity center of desertification moved 7.67 km in the northeast direction, indicating that during this period of time, the aggravation rate of desertification in the north of Gulang County was greater than that in the south, and the aggravation rate of desertification in the east was greater than that in the west. From 2013 to 2023, the average desertification center in Gulang County moved 8.61 km to the northeast. On the surface, the aggravation rate of desertification in the northeast of Gulang County was greater than that in the southwest during this decade.

3.6. Transformation of Desertification Degree in Gulang County

In order to study the transfer of desertification degree, the transfer types of different degrees of desertification were divided into nine categories, which are stable area, mild weakening area, moderate weakening area, severe weakening area, extreme weakening area, mild strengthening area, moderate strengthening area, severe strengthening area, and extreme strengthening area, as shown in Table 5.
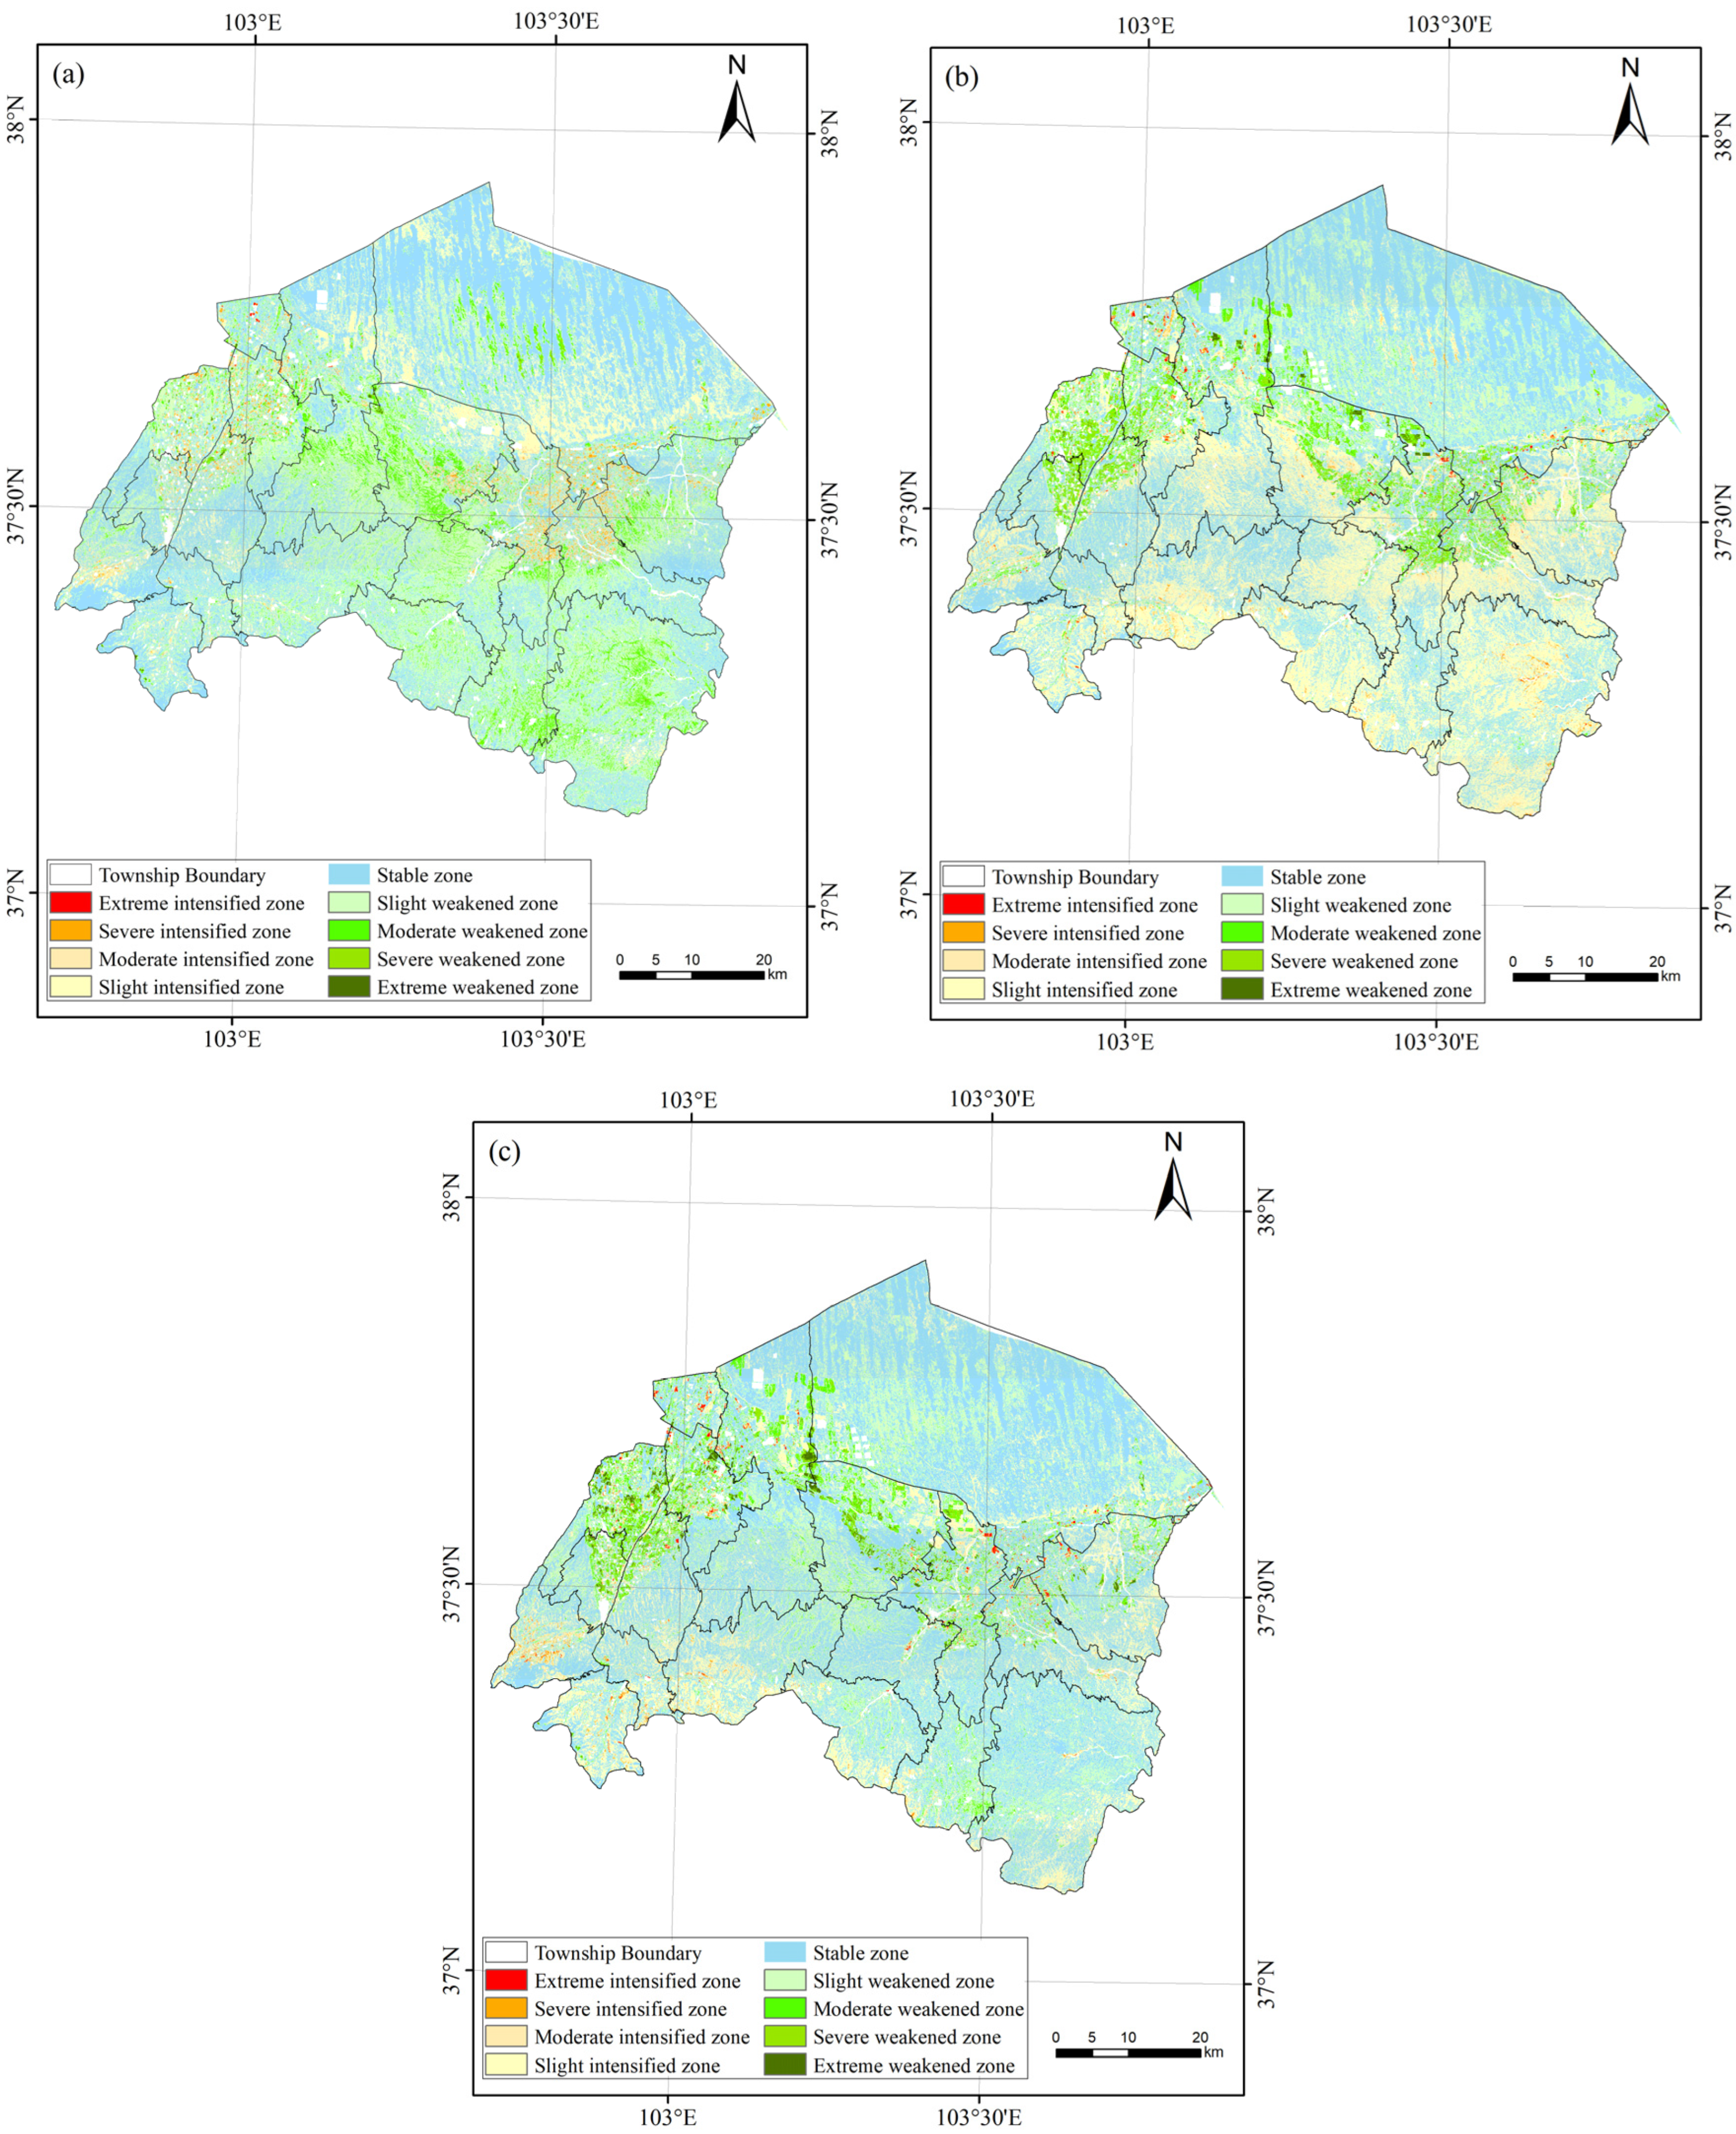
As shown in Figure 11 and Table 6, from 2013 to 2018, the area of the desertification stable zone of 2298.5 km2 was the largest, accounting for 25.23%. The area of the slightly weakened zone was the second largest, with 1548.74 km2, accounting for 22.74%. Among them, the area of extreme desertification transferred to severe desertification of 600.74 km2 was the largest. As shown in Figure 11 and Table 7, from 2018 to 2023, the area of the desertification stable zone of 2230.82 km2 was the largest, accounting for 27.48%. The slightly intensified zone of 1445.28 km2 represented the second largest area, accounting for 15.11%. Among them, the area of moderate desertification transferred to severe desertification of 584.02 km2 was the largest. As shown in Figure 11 and Table 8, from 2013 to 2023, the area of the desertification stable zone of 2712.48 km2 was the largest, accounting for 27.51%. The slightly weakened zone of 1032.71 km2 was the second largest area, accounting for 10.59%. Among them, the area of extreme desertification transferred to severe desertification was 565.35 km2, which represented the largest area.

4. Discussion

4.1. The Superiority of Monitoring Index Method Based on the KNDVI-Feature Space Model

The image classification method had certain advantages in defining the scope of desertification, but it was not able to obtain internal spatial variation information. The comprehensive index method and multiple regression analysis methods were able to consider the influence of multiple factors on the desertification process but could not consider the interaction between factors and the nonlinear characteristics of their impact on the desertification process [35]. Image classification can only simply represent the different degrees of desertification of the land. The feature space can accurately obtain the desertification index while reflecting the degree of desertification. Combined with the desertification index in different periods, it can more clearly reflect the desertification trends in a certain area, which is more conducive to analysis and prediction. The feature space method could fully consider the complex impacts of the interaction between different biotic and abiotic factors on the process of desertification. In addition, the feature space model could cover multi-dimensional information about the evolutionary process of desertification, such as soil, vegetation, and climate, and could evaluate the development trend and influencing factors of desertification more comprehensively [36]. Based on the feature space, this study introduced the KNDVI as the desertification characterization parameter to construct a desertification remote-sensing monitoring index and achieved accurate results [37]. This is because the KNDVI could reduce the influences of the atmosphere and soil on the vegetation index to a certain extent by improving the algorithm so that it could more accurately reflect the vegetation situation. In areas with dense vegetation or biologically rich areas, the NDVI had a certain saturation effect, which made it impossible to accurately display vegetation coverage, and the KNDVI mitigated this saturation issue [38]. In addition, the KNDVI had better compatibility with other vegetation indices and could be applied in combination with other indices to improve the accuracy of monitoring. By evaluating the accuracy of the constructed feature space model, the monitoring accuracy of the KNDVI model was higher than that of the NDVI and MSAVI models, and its applicability to the remote-sensing monitoring of desertification was better than that of the NDVI and MSAVI [39]. However, the KNDVI has a low correlation with the SIF value of vegetation in areas with low vegetation coverage. As a relatively new vegetation parameter, the research on the KNDVI is currently insufficient and comprehensive, and the universality and reliability of the index application need to be further studied.

4.2. Cause Analysis of Temporal and Spatial Evolution of Desertification in Gulang County from 2013 to 2023

From 2013 to 2023, desertification in Gulang County showed an overall improving trend. The micro- and slight-desertification areas in Gulang County were mainly distributed in Yongfengtan Town, Tumen Town, Sishui Town, Gulang Town, Dajing Town, the west of Zhitan Town, and the north of Peijiaying Town. These areas are those with a high population density in Gulang County. Therefore, human activities can be identified as principally protecting the environment and preventing and controlling sand [2]. On the whole, the stable zone of desertification had the largest area, mainly distributed in Haizitan Town, Yongfengtan Town, Dajing Town, Peijiaying Town, and Zhitan Town. The slight desertification zone was the second largest area, which was mainly degraded from extreme desertification to severe desertification and was distributed in the central and southern parts of Haizitan Town. Human activities have contradictory effects on the evolution of desertification. Unreasonable economic activities, such as overgrazing, deforestation, blind reclamation, and other acts that destroy the vegetation, as well as urban and rural construction and the irrational use of water resources due to the continuous growth in population, contribute to the degradation of forest land and grassland, the lack of water resources, and the aggravation of land desertification. However, nowadays, under the regulation and supervision of laws and regulations, humans have strengthened their awareness of the need to protect the environment, carrying out a series of activities such as returning farmland to forests, closing sand for afforestation, and strengthening soil and water conservation. These activities have achieved remarkable results in land desertification control and alleviated land desertification. Intensification has improved the desertification of Haizitan Town in the Tengger Desert in the northern part of Gulang County. This is mainly due to the inaccessibility of warm and humid ocean currents in the region, the hot and dry summer, strong solar radiation, and scarce precipitation. With global warming, more frequent sandstorms and other severe weather are intensifying land desertification [40]. The central area of Gulang County is flat, making it difficult for surface water to converge. This aggravates wind erosion and promotes the intensification of desertification. In addition, the soil in Gulang County is mainly sandy, with strong water permeability and poor water retention, which also aggravates desertification. Therefore, in areas with fewer human activities, such as Gulang County, it is imperative to strengthen desertification control, develop green ecological technology, expand the area of afforestation, strengthen publicity and education about desertification control, regularly monitor the desertification situation in Gulang County, and carry out targeted prevention and control [41]. Therefore, the effect of desertification control in the northern part of Gulang County is obvious, and the central and southern regions now need to strengthen desertification control.

5. Conclusions

Based on the principle of feature space, seven types of surface feature parameters were selected, and the KNDVI was introduced. Based on the spatial distribution differentiation law of different degrees of desertification, the desertification remote-sensing monitoring model was constructed, and an optimal model was selected on the basis of accuracy verification. The spatial and temporal evolution patterns and causes of desertification in Gulang County from 2013 to 2023 were analyzed from the aspects of area distribution, area transfer intensity, and center of gravity transfer through the introduction of a geographical detector and other methods. The specific conclusions are as follows:
(1)
Compared with the NDVI and MSAVI, because the KNDVI has a higher sensitivity to vegetation, it solves the problem of NDVI saturation and can more accurately capture vegetation characteristics and reflect vegetation status. Therefore, the KNDVI has better applicability to desertification research.
(2)
The point–line pattern KNDVI-Albedo remote-sensing index model had the highest monitoring accuracy, reaching 94.93%, while the point–line pattern NDVI-TGSI remote-sensing monitoring index had the lowest accuracy of 54.38%.
(3)
From 2013 to 2023, the overall desertification situation in Gulang County showed an improved trend with a pattern of “firstly aggravation and then alleviation.” The gravity center of desertification in Gulang County first shifted to the southeast and then to the northeast, indicating that the intensification of desertification in the northeast was higher than that in the southwest during this period.
From 2013 to 2023, the area of stable desertification in Gulang County was the largest, followed by the slightly weakened zone, with extreme desertification to severe desertification representing the largest transition area. According to the research conclusions, the experience of sand prevention and control in the areas with improved desertification is understood, and the desertification land in the northern part of Gulang County and the sparsely populated areas in the central part are scientifically controlled. According to the actual situation in each region and local conditions, different means of sand control have been adopted to carry out targeted governance.

Author Contributions

Conceptualization, methodology, and writing—original draft preparation, B.G. and M.L.; investigation, supervision, project administration, and funding acquisition, R.Z. and M.X.; Methodology, and writing—original draft preparation, P.L. and L.W. All authors have read and agreed to the published version of the manuscript.

Funding

This research was funded by the Scientific Innovation Project for Young Scientists in Shandong Provincial Universities (grant number: 2022KJ224), the National Natural Science Foundation of China (grant numbers: 42101306, 42301102, 42071419), the Natural Science Foundation of Shandong Province (grant number: ZR2021MD047), and the Agricultural Science and Technology Innovation Program (grant number CAAS-ZDRW202201).

Data Availability Statement

Data are contained within the article.

Conflicts of Interest

The authors declare no conflicts of interest.

References

  1. Tong, L.N.; Ning, X.L.; Zhang, J.; Zhang, X. Spatial-temporal variation and driving mechanism of desertification in Hunshandake (Otindag) Sandy Land in recent 30 years. Arid Land Geogr. 2021, 44, 992–1002. [Google Scholar]
  2. Guo, Z.; Wei, W.; Shi, P.; Zhou, L.; Wang, X.; Li, Z.; Pang, S.; Xie, B. Spatiotemporal changes of land desertification sensitivity in the arid region of Northwest China. J. Acta Grographica Sin. 2020, 75, 1948–1965. [Google Scholar]
  3. Abdelhafid BK, T.A.; Aliat, T.; Rebouh, N.Y.; Chenchouni, H.; Kucher, D.; Dokukin, P.; Mohamed, E.S. Assessment of the spatial dynamics of sandy desertification using remote sensing in Nemamcha region (Algeria). Egypt. J. Remote Sens. Space Sci. 2023, 26, 642–653. [Google Scholar]
  4. CiLins CM, T.; de Souza, E.R.; dos Santos Souza TE, M.; Paulino MK, S.S.; Monteiro, D.R.; de Souza Júnior, V.S.; Dourado, P.R.M.; de Andrade Rego Junior, F.E.; da Silva, Y.J.A.; Schaffer, B. Influence of vegetation cover and rainfall intensity on soil attributes in an area undergoing desertification in Brazil. Catena 2023, 221, 106751. [Google Scholar]
  5. Wang, Y.Z.; Yue, X.B.; Xie, J.L.; Liu, Z.; Wang, Y.; Gong, Y. Desertification evolution in the sandy region to the east of the Yellow River in Ningxia from 2000 to 2020. J. Desert Res. 2023, 43, 31–40. [Google Scholar]
  6. Ma, H.W.; Wang, Y.F.; Guo, E.L. Remote sensing monitoring of aeolian desertification in Ongniud Banner based on GEE. Arid. Zone Res. 2023, 40, 504–516. [Google Scholar]
  7. Yue, H.; Liu, Y. Monitoring of Drought and Desertification in Shaanxi Province Based on NDVI-Albedo Space. J. Northwest For. Univ. 2019, 34, 198–205. [Google Scholar]
  8. Zhang, Y.J.; Xia, J.; Jiang, H.T.; Wu, X.M. Desertification monitoring with remote sensing in the Central Asia: A case of Turkmenistan. Arid Land Geogr. 2013, 36, 724–730. [Google Scholar]
  9. Wang, J.Q.; Chen, X.R. Study on the Variation Trend of Desertification in Chifeng, Inner Mongolia and Its Surrounding Area- Based on the Albedo and the Characteristic Space of the Normalized Difference V egetation 1 Index. J. Anhui Agi. 2016, 44, 217–219. [Google Scholar]
  10. Gao, H.; Zhang, J.H.; Xia, X. Drought Monitoring by Remote Sensing over India and Pakistan Based on Temperature V egetation Dryness Index. Remote Sens. Inf. 2016, 31, 62–68. [Google Scholar]
  11. Mohamed, L.; Nezha, L.; AbdelKhalek, G.; El Harchaoui, N.; Adnan, M.S.G.; Islam, M.S. Evaluation of Desertification in the Middle Moulouya Basin (North-East Morocco) Using Sentinel-2 Images and Spectral Index Techniques. Earth Syst. Environ. 2022, 7, 473–492. [Google Scholar]
  12. Vani, V.; Kummamuru, P.K.; Mandla, V.R. Agriculture drought analysis using remote sensing based on NDVI-LST feature space. Indian J. Ecol. 2018, 45, 6–10. [Google Scholar]
  13. Wang, A.; Moreno-Matinez, A.; Muioz-Mari, J.; Campos-Taberner, M.; Camps-Valls, G. Estimation of egetation traits with kemel NDVI. S8PRS J. Photogrammery Remote Sens. 2023, 195, 408–447. [Google Scholar] [CrossRef]
  14. Camps-Valls, G.; Campos-Taberner, M.; Moreno-Martínez, Á.; Walther, S.; Duveiller, G.; Cescatti, A.; Mahecha, M.D.; Muñoz-Marí, J.; García-Haro, F.J.; Guanter, L.; et al. A unified vegetation index for quantifying the terrestrial biosphere. Sci. Adv. 2021, 7, eabc7447. [Google Scholar] [CrossRef] [PubMed]
  15. Wu, J.H. Causes of land desertification and measures of sand prevention and control in Gulang County. Contemp. Hortic. 2023, 46, 157–159. [Google Scholar]
  16. Luo, R.J.; Wang, H.T.; Wang, C. Ecological quality evaluation of Gulang County in Gansu Province based on improved remote sensing ecological index. Arid. Land Geogr. 2023, 46, 539–549. [Google Scholar]
  17. Ma, Z.Q. Discussion on the layout mode of different functional forest species-Taking the construction area of returning farmland to forest in Gulang County of Qilian Mountain ecological project as an example. Gansu Agric. 2022, 07, 87–89. [Google Scholar]
  18. Ding, F.; Gao, Z.H.; Wei, H.D. Processing and Application Evaluation of CBERS-1 Data in Desertification Monitoring. Remote Sens. Technol. Appl. 2004, 5, 339–342. [Google Scholar]
  19. Wang, J.; Sun, T.; Fu, A.; Xu, H.; Wang, X. Optimization of the time series NDVI-rainfall relationship using linear mixed-effects modeling for the anti-desertification area in the Beijing and Tianjin sandstorm source region. Theor. Appl. Climatol. 2018, 132, 1291–1301. [Google Scholar] [CrossRef]
  20. Wang, X.Y.; Li, Y.Q.; Wang, X.Y.; Li, Y.; Lian, J.; Gong, X. Temporal and Spatial Variations in NDVI and Analysis of the Driving Factors in the Desertified Areas of Northern China From 1998 to 2015. Front. Environ. Sci. 2021, 9, 633020. [Google Scholar] [CrossRef]
  21. Voitika, A.; Kravchenkob, V.; Pushkac, O.; Kutkovetskad, T.; Shchure, T.; Kocira, S. Comparison of NDVI, NDRE, MSAVI and NDSI Indices for Early Diagnosis of Crop Problems. Agric. Eng. 2023, 27, 47–57. [Google Scholar] [CrossRef]
  22. Lu, J.; Zhang, X.J.; Ye, P.S.; Wu, H.; Wang, T. Remote sensing monitoring of salinization in Hetao irrigation district based on Sl-MSAVl feature space. Remote Sens. Nat. Resour. 2020, 32, 169–175. [Google Scholar]
  23. Wu, Z.; Lei, S.; Bian, Z.; Huang, J.; Zhang, Y. Study of the desertification index based on the albedo-MSAVI feature space for semi-arid steppe region. Environ. Earth Sci. 2019, 78, 232. [Google Scholar] [CrossRef]
  24. Xiao, J.; Shen, Y.; Tateishi, R.; Bayaer, W. Development of topsoil grain size index for monitoring desertification in arid land using remote sensing. Int. J. Remote Sens. 2006, 27, 2411–2422. [Google Scholar] [CrossRef]
  25. Sareh, G.H.; Abbasali, V.; Reza, M.S. Desertification simulation using wavelet and box-jenkins time series analysis based on TGSI and albedo remote sensing indices. J. Arid. Environ. 2023, 219, 105069. [Google Scholar]
  26. Qu, T. Distribution characteristics and its influencing factors of soil moisture in western Jilin. Jilin Water Resour. 2023, 10, 40–45. [Google Scholar]
  27. Pradeep, K.B.; Raghu, B.K.; Anusha, B.N.; Rajasekhar, M. Geo-environmental monitoring and assessment of land degradation and desertification in the semi-arid regions using Landsat 8 OLI/TIRS, LST, and NDVI approach. Environ. Chall. 2022, 8, 100578. [Google Scholar]
  28. Du, X.; Wang, S.X.; Zhou, Y.W.; Yi, W.H. Construction and Validation of a New Model for Unified Surface: Water Capacity Based on M ODIS Data. Geomat. Inf. Sci. Wuhan Univ. 2007, 3, 205–207+211. [Google Scholar]
  29. Chen, S.H. Spatial and Temporal Evolution Pattern and Driving Mechanism of Rocky Desertification in Typical Karst Areas. Master’s Thesis, Shandong University of Technology, Zibo, China, 2022. [Google Scholar]
  30. Zeng, Y.N.; Xiang, N.P.; Feng, Z.D.; Hu, H. Albedo-NDVI Space and Remote Sensing Synthesis Index Models for Desertification Monitoring. Sci. Geogr. Sin. 2006, 1, 75–81. [Google Scholar]
  31. Dai, R.; Chen, S.; Cao, Y.; Zhang, Y.; Xu, X. A Modified Temperature Vegetation Dryness Index (mTVDI) for Agricultural Drought Assessment Based on MODIS Data: A Case Study in Northeast China. Remote Sens. 2023, 15, 1915. [Google Scholar] [CrossRef]
  32. Verstraete, M.M.; Pinty, B. Designing optimal spectral indexes for remote sensing applications. IEEE Trans. Geosci. Remote Sens. 1996, 34, 1254–1265. [Google Scholar] [CrossRef]
  33. Xu, W.N.; Wang, P.X.; Han, P.; Yan, T.L.; Zhang, S.-Y. Application of Kappa coefficient to accuracy assessments of drought forecasting model: A case study of Guanzhong Plain. J. Nat. Disasters 2011, 20, 81–86. [Google Scholar]
  34. Wu, X.M. Analysis of the present situation, causes and measures of land desertification in Gansu area. Contemp. Hortic. 2023, 46, 178–180. [Google Scholar]
  35. Yang, X.; Wu, J.J.; Yan, F.; Zhang, J. Assessment of regional soil moisture status based on characteristics ofsurface temperature/vegetation index space. Acta Ecol. Sin. 2009, 29, 1205–1216. [Google Scholar]
  36. Yang, J.Y. Desertification Dynamics Monitoring and Driving Force Research in the Pumqu River Basin. Master’s Thesis, Sichuan Agricul Tural University, Ya’an, China, 2023. [Google Scholar]
  37. Gu, Z.P.; Chen, X.W.; Ruan, W.F.; Zheng, M.L.; Gen, K.L. Quantifying the direct and indirect effects of terrain, climate and human activity on the spatial pattern of kNDVI-based vegetation growth: A case study from the Minjiang River Basin, Southeast China. Ecol. Inform. 2024, 80, 102493. [Google Scholar] [CrossRef]
  38. Li, Z.; Zhuang, L.H.; Bai, Y.N.; Han, B.; Miao, J.; Du, D.; Xu, D. Spatiotemporal Dynamic Monitoring of Desertification in Kangbao County of Zhangjiakou City Based on Albedo-NDVI Feature Space. Acta Geosci. Sin. 2023, 1–11. [Google Scholar]
  39. Guan, Q.; Guan, W.; Yang, J.; Zhao, S.; Pan, B.; Wang, L.; Song, N.; Lu, M. Spatial and temporal changes in desertification in the southern region of the Tengger Desert from 1973 to 2009. Theor. Appl. Climatol. 2017, 129, 487–502. [Google Scholar] [CrossRef]
  40. Wang, J.J. Effect of Different Vegetation Restoration Models on Soil Characteristics and Ecological Environment—Take Taizi mountain of Gansu province as an example. Master’s Thesis, Gansu Agricultural University, Lanzhou, China, 2018. [Google Scholar]
  41. Ma, Y.F. Research on flower stick planting and artificial regeneration technology in sandy area of northern Gulang County. Gansu Sci. Technol. 2018, 34, 138–140. [Google Scholar]
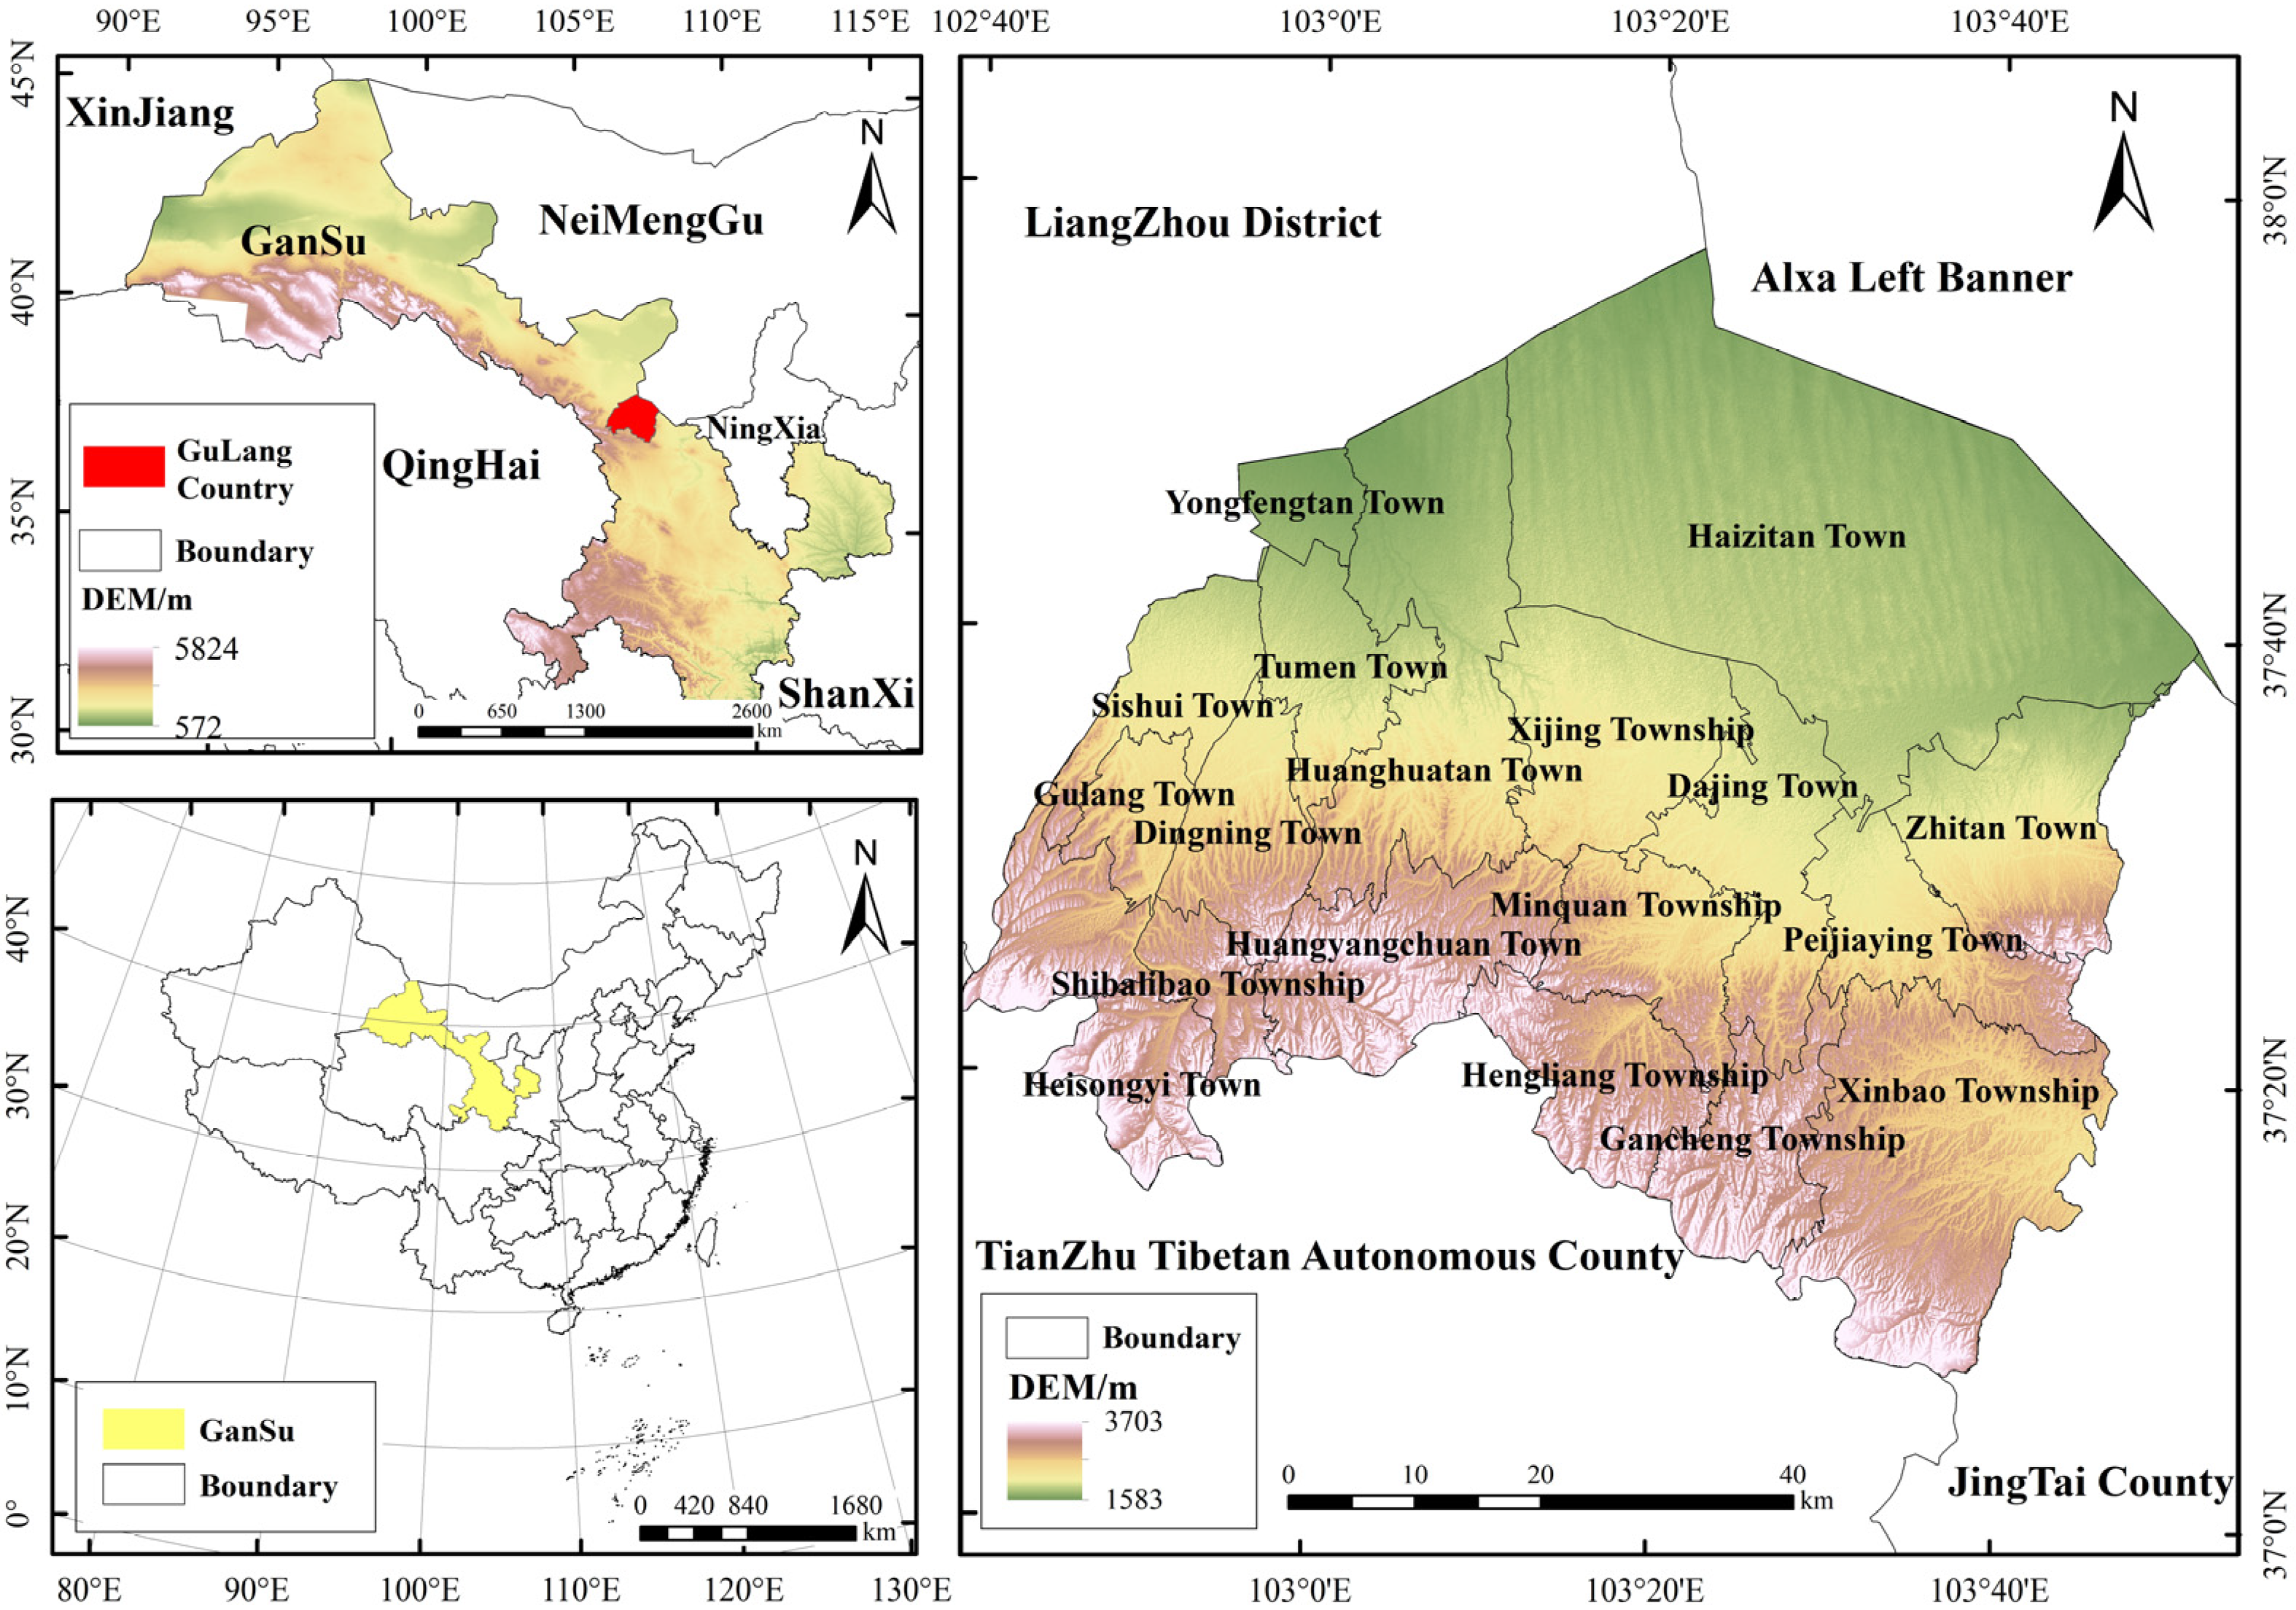
Figure 1. Overview of the study area.
Remotesensing 16 01771 g001
Figure 2. The Albedo-KNDVI feature space.
Remotesensing 16 01771 g002
Figure 3. The distribution of different degrees of desertification in SWCI-KNDVI feature space: (a) micro-desertification area; (b) slight desertification area; (c) moderate desertification area; (d) severe desertification area; (e) extreme desertification area.
Remotesensing 16 01771 g003aRemotesensing 16 01771 g003bRemotesensing 16 01771 g003c
Figure 4. SWCI-KNDVI point distance feature space.
Remotesensing 16 01771 g004
Figure 5. SWCI-KNDVI point–line feature space.
Remotesensing 16 01771 g005
Figure 6. The point distance feature space.
Remotesensing 16 01771 g006aRemotesensing 16 01771 g006b
Figure 7. The point–line feature space.
Remotesensing 16 01771 g007aRemotesensing 16 01771 g007b
Figure 8. The accuracy of different surface parameter models.
Remotesensing 16 01771 g008
Figure 9. The distribution of desertification in 2013–2023: (a) 2013; (b) 2018; (c) 2023.
Remotesensing 16 01771 g009
Figure 10. The average gravity center shift of desertification from 2013 to 2023.
Remotesensing 16 01771 g010
Figure 11. The area transfer of different degrees of desertification in Gulang County from 2013 to 2023: (a) 2013–2018; (b) 2018–2023; (c) 2013–2023.
Remotesensing 16 01771 g011
Table 1. Calculation formula for characteristic parameters.
Characteristic ParameterCalculation Formula
NDVI
NDVI = B NIR B RED B NIR + B RED
KNDVI
KNDVI = tanh ( ( B NIR B RED 2 σ ) 2 )
MSAVI
MSAVI = 2 B NIR + 1 ( 2 B NIR + 1 ) 2 8 ( B NIR B RED ) 2
Albedo
Albedo = 0.356 B BLUE + 0.13 B RED + 0.373 B NIR + 0.085 B SWIR 1 + 0.072 B SWIR 2 0.0018
TGSI
TGSI = ( B RED B BLUE ) ( B RED + B BLUE + B GREEN )
LST
LST = a ( 1 C D ) + ( b ( 1 C D ) + C + D ) T D T a C = τ ε D = ( 1 τ ) [ 1 + ( 1 ε ) τ ]
SWCI
SWCI = SWIR 1 SWIR 2 SWIR 1 + SWIR 2
Table 2. The confusion matrix of the MSAVI-SWCI desertification monitoring model.
Predicted ValueReference Value
MicroSlightModerateSevereExtremeTotalUser Accuracy
Micro1110001291.67%
Slight1445005088%
Moderate00660066100%
Severe0014604797.87%
Extreme0002404295.24%
Total1245724840217
Producer accuracy91.67%97.78%91.67%95.83%100%Expected consistency rate0.2353
Overall accuracy95.39%Kappa coefficient0.9397
Table 3. The evaluation results of 24 desertification monitoring models.
Model FormulationModel TypesModel AccuracyKappa Coefficient
NDVI-AlbedoPoint Distance61.26%0.508
Point–line54.84%0.425
NDVI-LSTPoint Distance58.53%0.446
Point–line61.75%0.502
NDVI-TGSIPoint Distance55.76%0.425
Point–line54.38%0.405
NDVI-SWCIPoint Distance83.87%0.790
Point–line85.25%0.807
KNDVI-AlbedoPoint Distance86.47%0.825
Point–line94.93%0.934
KNDVI-LSTPoint Distance66.36%0.566
Point–line72.35%0.642
KNDVI-TGSIPoint Distance62.67%0.511
Point–line74.65%0.669
KNDVI-SWCIPoint Distance76.04%0.688
Point–line73.27%0.651
MSAVI-AlbedoPoint Distance65.28%0.558
Point–line66.36%0.572
MSAVI-LSTPoint Distance69.12%0.605
Point–line64.06%0.542
MSAVI-TGSIPoint Distance62.67%0.515
Point–line64.98%0.549
MSAVI-SWCIPoint Distance88.94%0.856
Point–line85.71%0.815
Table 4. The areas of different degrees of desertification in 2013–2023.
Year201320182023
Degree Area/km2Proportion/%Area/km2Proportion/%Area/km2Proportion/%
Micro Desertification416.018.36430.558.66470.319.46
Slight Desertification533.3910.72796.3216.02513.8910.34
Moderate Desertification897.2518.041222.1524.581036.9420.87
Severe Desertification1528.7230.741350.5427.171677.7433.76
Extreme Desertification1598.2232.131172.0523.571270.7625.57
Table 5. Different degrees of desertification transfer types.
Type of Transfer StrengthStrength Transfer NameExamples of Strength Transfer
Remain constantStable zoneExtreme → Extreme
IntensifySlightly intensified zoneSevere → Extreme
Moderately intensified zoneModerate → Extreme
Severely intensified zoneSlight → Extreme
Extremely intensified zoneMicro → Extreme
WeakenSlightly weakened zoneExtreme → Severe
Moderately weakened zoneExtreme → Moderate
Severely weakened zoneExtreme → Slight
Extremely weakened zoneExtreme → Micro
Table 6. The transfer of different degrees of desertification area in Gulang County from 2013 to 2018 (km2).
2018Micro Slight Moderate Severe Extreme
2013
Micro250.6877.9138.1145.781.75
Slight 126.09287.2173.3535.082.09
Moderate 30.47324.91422.0897.5313.87
Severe 12.8475.98484.47567.65371.67
Extreme 5.5421.86195.18600.74765.13
Table 7. The transfer of different degrees of desertification area in Gulang County from 2018 to 2023 (km2).
2023Micro Slight Moderate Severe Extreme
2018
Micro 224.04136.1045.1311.888.76
Slight 67.88222.21377.81100.2620.04
Moderate 60.4531.05141.70584.02419.44
Severe103.6356.89126.39642.38418.21
Extreme 10.3815.9737.38408.69685.88
Table 8. The transfer of different degrees of desertification area in Gulang County from 2013 to 2023 (km2).
2023Micro Slight Moderate Severe Extreme
2013
Micro 250.45103.3936.8414.7311.12
Slight 91.44209.29183.6131.6011.03
Moderate47.01119.24481.82208.5138.44
Severe 48.8650.36264.52851.83303.73
Extreme 31.3430.4668.33565.35894.59
Disclaimer/Publisher’s Note: The statements, opinions and data contained in all publications are solely those of the individual author(s) and contributor(s) and not of MDPI and/or the editor(s). MDPI and/or the editor(s) disclaim responsibility for any injury to people or property resulting from any ideas, methods, instructions or products referred to in the content.