Article

Fire Vulnerability, Resilience, and Recovery Rates of Mediterranean Pine Forests Using a 33-Year Time Series of Satellite Imagery

by
Esther Peña-Molina
1,*,
Daniel Moya
1,
Eva Marino
2,
José Luis Tomé
2,
Álvaro Fajardo-Cantos
1,
Javier González-Romero
3,
Manuel Esteban Lucas-Borja
1 and
Jorge de las Heras
1
1
Forest Ecology Research Group (ECOFOR), High Technical School of Agricultural and Forestry Engineering and Biotechnology, University of Castilla-La Mancha, University Campus, s/n, 02071 Albacete, Spain
2
AGRESTA Sociedad Cooperativa, c/Duque de Fernán Núñez 2, 28012 Madrid, Spain
3
Department of Forestry and Environmental Engineering and Management, Technical University of Madrid, 28040 Madrid, Spain
*
Author to whom correspondence should be addressed.
Remote Sens. 2024, 16(10), 1718; https://doi.org/10.3390/rs16101718
Submission received: 22 March 2024 / Revised: 10 May 2024 / Accepted: 10 May 2024 / Published: 13 May 2024
(This article belongs to the Special Issue Land Use/Cover Mapping and Trend Analysis Using Google Earth Engine)

Abstract

:
The modification of fire regimes and their impact on vegetation recovery, soil properties, and fuel structure are current key research areas that attempt to identify the thresholds of vegetation’s susceptibility to wildfires. This study aimed to evaluate the vulnerability of Mediterranean pine forests (Pinus halepensis Mill. and Pinus pinaster Aiton) to wildfires, analyzing two major forest fires that occurred in Yeste (Spain) in 1994 and 2017, affecting over 14,000 and 3200 hectares, respectively. Four recovery regions were identified based on fire severity—calculated using the delta Normalized Burn Ratio (dNBR) index—and recurrence: areas with high severity in 2017 but not in 1994 (UB94-HS17), areas with high severity in 1994 but not in 2017 (HS94-UB17), areas with high severity in both fires (HS94-HS17), and areas unaffected by either fire (UB94-UB17). The analysis focused on examining the recovery patterns of three spectral indices—the Normalized Difference Vegetation Index (NDVI), Normalized Moisture Index (NDMI), and Normalized Burn Ratio (NBR)—using the Google Earth Engine platform from 1990 to 2023. Additionally, the Relative Recovery Indicator (RRI), the Ratio of Eighty Percent (R80P), and the Year-on-Year average (YrYr) metrics were computed to assess the spectral recovery rates by region. These three spectral indices showed similar dynamic responses to fire. However, the Mann–Kendall and unit root statistical tests revealed that the NDVI and NDMI exhibited distinct trends, particularly in areas with recurrence (HS94-HS17). The NDVI outperformed the NBR and NDMI in distinguishing variations among regions. These results suggest accelerated vegetation spectral regrowth in the short term. The Vegetation Recovery Capacity After Fire (VRAF) index showed values from low to moderate, while the Vulnerability to Fire (V2FIRE) index exhibited values from medium to high across all recovery regions. These findings enhance our understanding of how vegetation recovers from fire and how vulnerable it is to fire.

1. Introduction

Wildfires play a significant role in shaping the landscape of Mediterranean environments. In the current global change context, the numbers of both ignitions and burned surfaces are expected to increase [1]. In the Iberian Peninsula, rural abandonment is leading to a significant increase in available fuel in forest areas. This fact increases the risk of experiencing waves of extreme wildfire events (EWEs) [2], which are extremely dangerous for populations and beyond extinguishing capacity. These fires, characterized by explosive and intense behavior and rapid spread rates, are linked with climate change and alter the meteorological conditions in affected areas, resulting in true firestorms. Although they occur in relatively small proportions, they catastrophically damage the landscape, countries’ economies, and the lives of their citizens (e.g., EWEs in Portugal in 2017, Spain in 2019 and 2022 and, most recently, Greece in 2023). The scientific community has referred to them as “sixth-generation wildfires or megafires” [3,4,5,6,7]. Society faces a significant challenge as these high-severity wildfires become increasingly inevitable due to rural abandonment and climate change. Therefore, it is imperative to focus on enhancing our ability to mitigate wildfires, reduce their severity, and minimize their impacts. In Spain, large investments in firefighting resources conducted to achieve a high wildfire suppression success proved not to be useful for fire impact mitigation under current climate change scenarios [8,9]. High fire exclusion rates, added to scarce forest management and traditional practices due to rural abandonment, result in fuel accumulation, leading to more intense fire behavior in many ecosystems [10]. The solution lies in comprehensive prevention, where forest management and restoration are crucial. Through this restoration, we can shape the future landscape, promote more fire-resilient and diversified landscapes that are better adapted to climate change, and minimize the risk to humans and infrastructure.
In this context, the confluence of various factors, including the persistent and escalating trend of rural abandonment, fuel accumulation in forested areas, rising global average temperatures, and inadequate precipitation due to climate change, among others [11,12], is rendering forest ecosystems increasingly susceptible to such disturbances [13,14]. As a result, the ability of ecosystems to react to wildfires, even Mediterranean ones with adaptations to these perturbations [15,16,17], is directly diminishing.
Over the years, the terms resilience and vulnerability have been widely used somewhat ambiguously and have often been interchanged without a clear definition of their precise meanings being provided [18,19,20]. Resilience is employed across various academic and policy disciplines and has diverse interpretations owing to its inherent flexibility [21,22,23]. It is applied for multiple purposes [24,25,26,27,28,29,30,31,32]. All authors acknowledge resilience as the capacity of an ecosystem, organism, etc., to recover its initial state following disturbance. Similarly to resilience, the term vulnerability has multiple definitions and applications in various fields [33,34,35,36]. Vulnerability can be defined as the sensitivity of a system to a driver of change [34]. Depending on the specific driver of change, vulnerability can be referred to as vulnerability to fire, social vulnerability, or ecological vulnerability, among others. In all cases, the term signifies susceptibility or weakness when confronted by a driver of change. Therefore, a forest system will be considered vulnerable if its characteristics (e.g., topography, canopy cover, fuel models, etc.) are such that they are likely to result in substantial adverse impacts in the event of disturbance. Furthermore, the terms vulnerability and resilience are interrelated, because a system that exhibits resilience to fire is likely to have low vulnerability, and vice versa [37]. When establishing vulnerability and resilience indicators, particularly on large scales (e.g., landscape scale), utilizing remote sensing (RS) information is a valuable tool [38]. The introduction of the Google Earth Engine (GEE) platform [39] has significantly reduced processing times for analyzing spectral vegetation indices over time series [40] and includes the possibility of obtaining global-scale results for imagery tasks that do not require excessive processing capacity [41].
As previously mentioned, establishing indicators or indices [42,43] that allow us to assess which areas are more vulnerable and which are more resilient to such disturbances is a priority to act accordingly by prioritizing actions in the most sensitive areas to minimize both risks and effects by forest management [44,45,46,47]. For this purpose, environmental characteristics and vegetation are critical factors for estimating ecological vulnerability to fire [34].
This study aims to assess the vulnerability of endemic Mesogean pine forests (habitat type 9540 of Directive 92/43/EEC) to wildfires by explicitly focusing on the two major fires that occurred in 1994 and 2017 in the vicinity of Yeste (Albacete, Spain). The objective of this assessment was to evaluate the sensitivity of these areas to new wildfires by considering the history of previous fires and their different impact degrees. This study also investigated the effects of wildfires (based on fire severity and recurrence) and applied approaches such as susceptibility indicators and spectral indices to analyze their consequences. To achieve these objectives, we carried out the following tasks:
(i)
Calculation of spectral indices to analyze the temporal dynamics of the vegetation spectral response within the designated timeframe (1990–2023).
(ii)
Analysis of the vegetation recovery rates in the different delimited zones based on fire severity and recurrence.
(iii)
Implementation of the conceptual model, including the analysis and evaluation of resilience after fire and vegetation’s vulnerability to wildfires, based on selected indicators.
These analyses aim to enhance our understanding of how vulnerable and resilient endemic Mediterranean pine forests are to wildfires, and to contribute to developing effective management strategies. Our initial hypotheses posit that the areas subjected to two high-severity burns with a recurrence interval of fewer than 25 years will have slower vegetation recovery rates than those subjected to only one burn.

2. Materials and Methods

2.1. Study Area

The study site is in Albacete Province, southeast Spain (Figure 1). Two large forest fires occurred here in 1994 and 2017. The 1994 fire burned more than 14,000 ha, and the 2017 fire burned 3200 ha. Both fires had a recurrence burn surface. According to the Köppen–Geiger classification [48], the study area has a hot-summer Mediterranean climate (type “Csa”). The mean annual precipitation is 400–600 mm, with a mean temperature of 10–14 °C. These values were obtained from the Agricultural Geographic Information System [49]. According to the USDA’s Soil Taxonomy [50], soils in the area are classified as Aridisols and Inceptisols. The natural vegetation community is Pinus halepensis Mill., and Pinus pinaster Aiton forests are accompanied by the shrub species Quercus coccifera L., Pistacia lentiscus L., Viburnum tinus L., Phyllirea angustifolia L., Arbutus unedo L., Lonicera implexa Ait., Daphne gnidium L., Rubia peregrina L., and Juniperus oxycedrus L., among others. The study sites belong to habitat type 9540 according to Directive 92/43/EEC.
We used the following categories to delimit the recovery regions based on fire severity and recurrence (Figure 1):
(i)
Zones that were either unburned or underwent very low-intensity burning during the 1994 wildfire but were subjected to high-severity burning in 2017 (UB94-HS17).
(ii)
Zones that were subject to high–medium-severity burning in 1994 but remained unburned in 2017 (HS94-UB17).
(iii)
Zones that faced high–medium-severity burning during both the 1994 and 2017 fires (HS94-HS17).
(iv)
Control zones that remained unburned during both the 1994 and 2017 wildfires (UB94-UB17).

2.2. Datasets

2.2.1. Landsat Collections

One Landsat scene covers the entire study area (path/row: 200/033, Worldwide Referencing System: WRS-2), which can be accessed with the GEE catalog [39]. Our case study used images from the Landsat Collection 2 Level-2 Surface Reflectance. These datasets contain atmospherically corrected surface reflectance and land surface temperature data. They are derived from the data acquired from the Landsat Thematic Mapper (TM), Landsat Enhanced Thematic Mapper Plus (ETM+), Operational Land Imager (OLI), and Thermal Infrared Sensor (TIRS) sensors. The Landsat Ecosystem Disturbance Adaptive Processing System (LEDAPS) was employed for the TM and ETM+ data. At the same time, the Land Surface Reflectance Code (LaSRC) system algorithm was utilized for the Landsat OLI/TIRS sensors. Both algorithms ensure the inter-calibration and comparability of the results across the TM, ETM+, and OLI/TIRS sensors, making them suitable for time-series analyses [51,52,53]. All of the images were provided by the United States Geological Survey (USGS) and the National Aeronautics and Space Administration (NASA). Since 2003, the Landsat 7 (L7) satellite images have exhibited a banding effect. This indicates a region lacking data due to the malfunction of the Scan Line Corrector (SLC) system, a component of the ETM+ system that compensates for the satellite’s movement during image capture. The use of this collection was minimized as much as possible to cover the time series from 1990 to 2023. The spatial and temporal resolutions were 30 m and 16 days, respectively.

2.2.2. Auxiliary Data: Orthophotos and Cartography Sources

We used vector data from the Nature Database, which belongs to the Spanish Ministry for Ecological Transition and Demographic Challenge, about Mediterranean pine forests with endemic species of Mediterranean pines (habitat type 9540 of Annex I Directive 92/43/ECC). This information, combined with fire severity, allowed us to delimit the preliminary recovery areas affected by wildfires.
Additionally, we used the historical orthophotos from the National Plan for Aerial Orthophotography (PNOA) [54], along with static photos from the Spanish Forestry Map [55], to assess the changes observed in each recovery area and to determine the occurrence of any landscape modifications (i.e., salvage logging, prescribed burns, shrub clearing, etc.) aside from wildfires to subsequently revise and update the existing mapping.
To map fire vulnerability, we used the 25 × 25 m Digital Terrain Model (DTM) from the Spanish National Centre for Geographic Information (CNIG), generated by the Directorate General for the National Geographic Institute (IGN). This DTM facilitated the generation of slope and aspect information. Additionally, the fuel models provided by the Forest Information Management Platform (GINFOR) of Castilla-La Mancha allowed us to obtain information about the vertical and horizontal distribution of vegetation.

2.3. Data Processing

The methodology followed in this study is structured in three blocks: (i) data acquisition and preparation, (ii) data processing methods, and (iii) output maps and graphs (Figure 2).

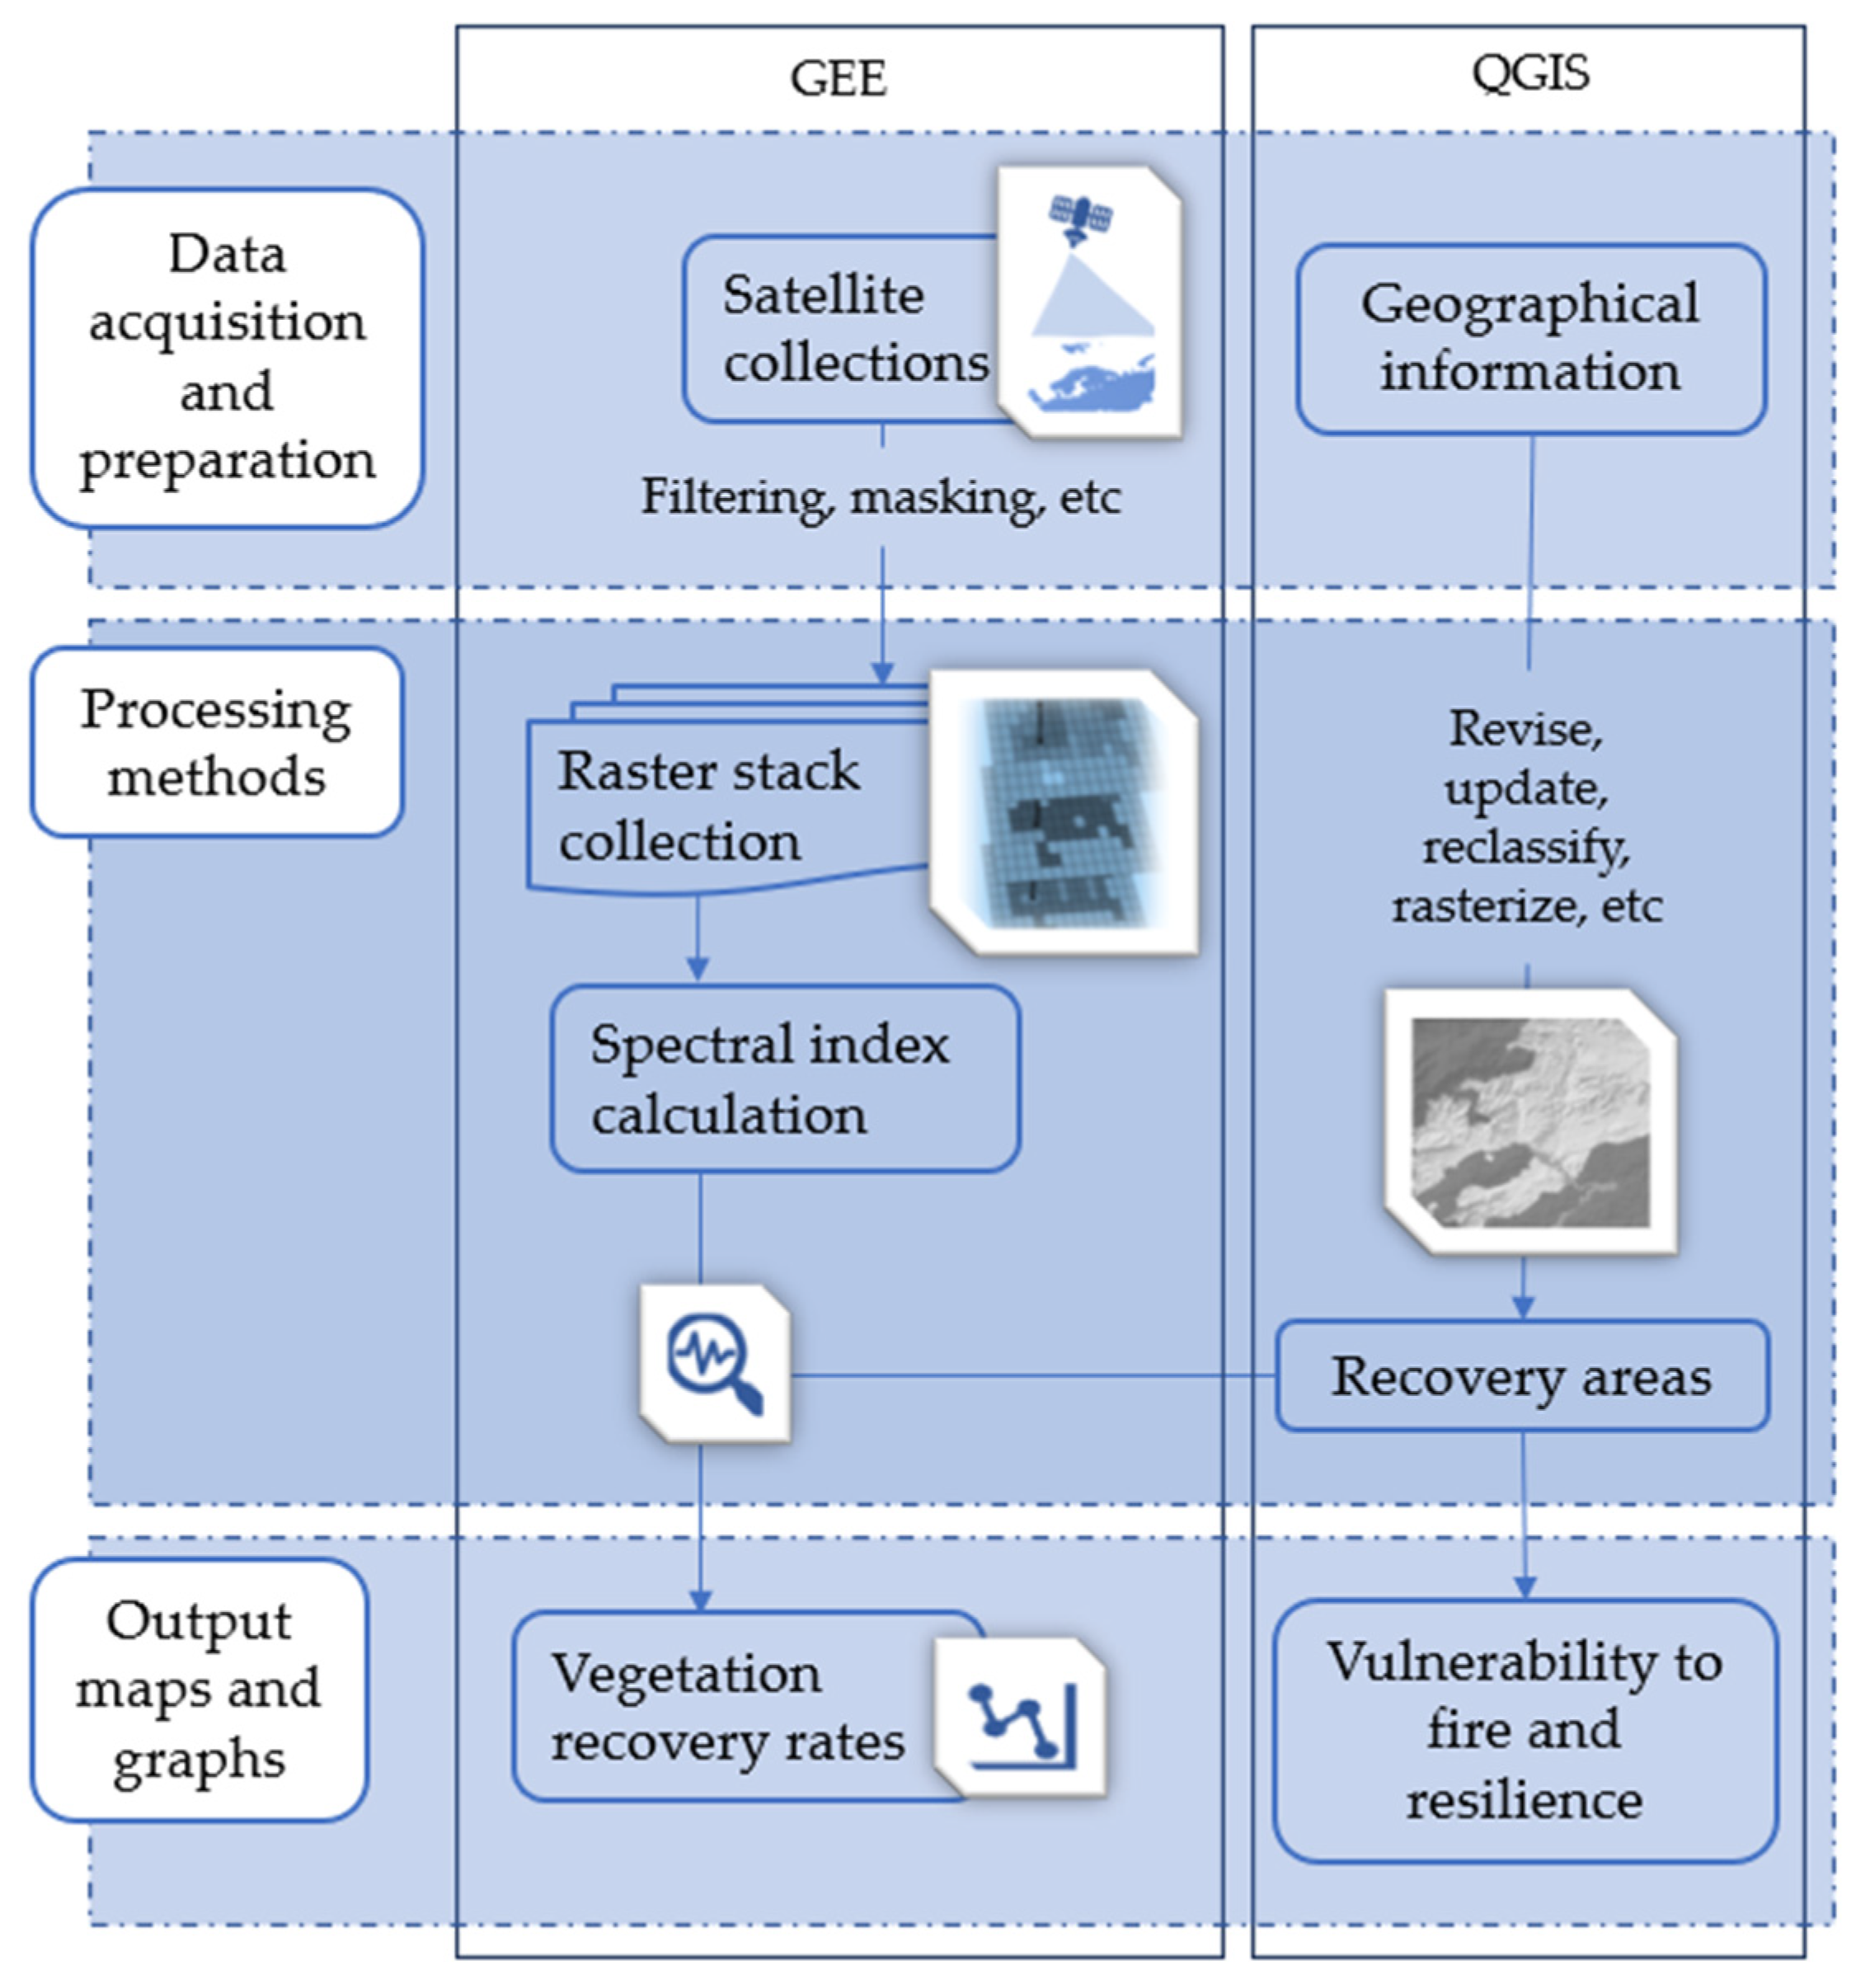
2.3.1. Data Preparation, Processing Methods, and Cloud Computing

First, the different image collections were loaded on the GEE platform, and all of the scenes were filtered and selected based on four parameters: perimeter, path/row (to avoid overlapping with other scenes), timeframe, and a cloud percentage below 10%. The final scenes used in the study are summarized in Table 1.
Then, we calculated three spectral indices [56] (Table 2) for each Landsat collection using the specific “ee.Image.normalizeDifference” method. The selected indices are the most familiar and extensively used for post-fire recovery dynamics [57,58,59]. The NDVI is the most widely used vegetation index indicator of photosynthetically active biomass. It allows for the assessment of vegetation health [60]. Negative values correspond to areas with water surfaces, artificial structures, rocks, clouds, and snow. Bare soil generally falls within the range of 0.1–0.2. A healthy, dense vegetation canopy should have values above 0.5, while sparse vegetation falls within the range of 0.2 to 0.5.
The NDMI is used to determine vegetation’s water content [61]. Its range is −1 to +1. Negative values correspond to bare soil (<−0.8) and dry or very low canopy cover (−0.8 to 0). Lower values (0 to 0.4) indicate high water stress or low canopy cover, while higher values (0.4 to 1) denote high water content or canopy cover.
The NBR is a spectral index developed specifically for delineating burnt areas in extensive fire zones. The disparity between the pre-fire and post-fire NBR, commonly called dNBR, is a measure for assessing fire severity. The dNBR (Table 2) was only used to calculate the severity of the fires in 1994 and 2017, and it was not included in the time-series analysis. High dNBR values indicate more damage, whereas negative dNBR values may suggest post-fire regrowth [62]. According to [63], the dNBR is classified according to the following thresholds: unburned (<−0.1), low severity (0.1 to 0.27), moderate–low severity (0.27 to 0.44), moderate–high severity (0.44 to 0.66), and very high severity (>0.66).
Table 2. Summary of the vegetation indices calculated from the Landsat collections. The NIR represents the near-infrared band, and SWIR1 and SWIR2 refer to the first and second shortwave infrared bands, respectively.
Vegetation IndexFormulaReference
NDVI(NIR − RED)/(NIR + RED)[60]
NDMI(NIR − SWIR1)/(NIR + SWIR1)[64,65]
NBR(NIR − SWIR2)/(NIR + SWIR2)[66]
dNBRdNBR = NBRPrefire − NBRPostfire[63]
Finally, we merged the various collections of raster stacks and plotted them together to analyze the dynamics and trends of spectral indices across the recovery areas using the “Ui.Chart.image.seriesByRegion” method. This representation enabled the calculation of the vegetation recovery rates. For detailed information about the methods employed in this study, readers should refer to the Earth Engine’s Developer Guide [67].
Based on the work of Frazier et al. [68], we calculated three metrics to analyze the recovery rates: the Relative Recovery Indicator (RRI), the Ratio of Eighty Percent (R80P), and the Year-on-Year Average (YrYr). We applied the equations to the three spectral indices (NDVI, NDMI, and NBR), even though the reference study only used the NBR. The formula for each metric is presented in Table 3.

2.3.2. Model Adjustment and Validation

To validate the NDVI results obtained from the remote sensing datasets, 12 plots of 30 × 30 m were established in the study area in 2022. In those plots, 240 Leaf Area Index (LAI) measurements were taken with an ACCUPAR LP-80 ceptometer (Decagon Devices, Pullman, WA, USA). Subsequently, a model for the NDVI was calculated based on the LAI measurements taken during fieldwork, and the results were compared to the corresponding satellite image. The plots were revisited during 2022–2023 fieldwork, and measurements were compared to the results obtained from RS. It is essential to emphasize that the validation applied here was designed for recent data and sensors, as it is impossible to validate for the past.

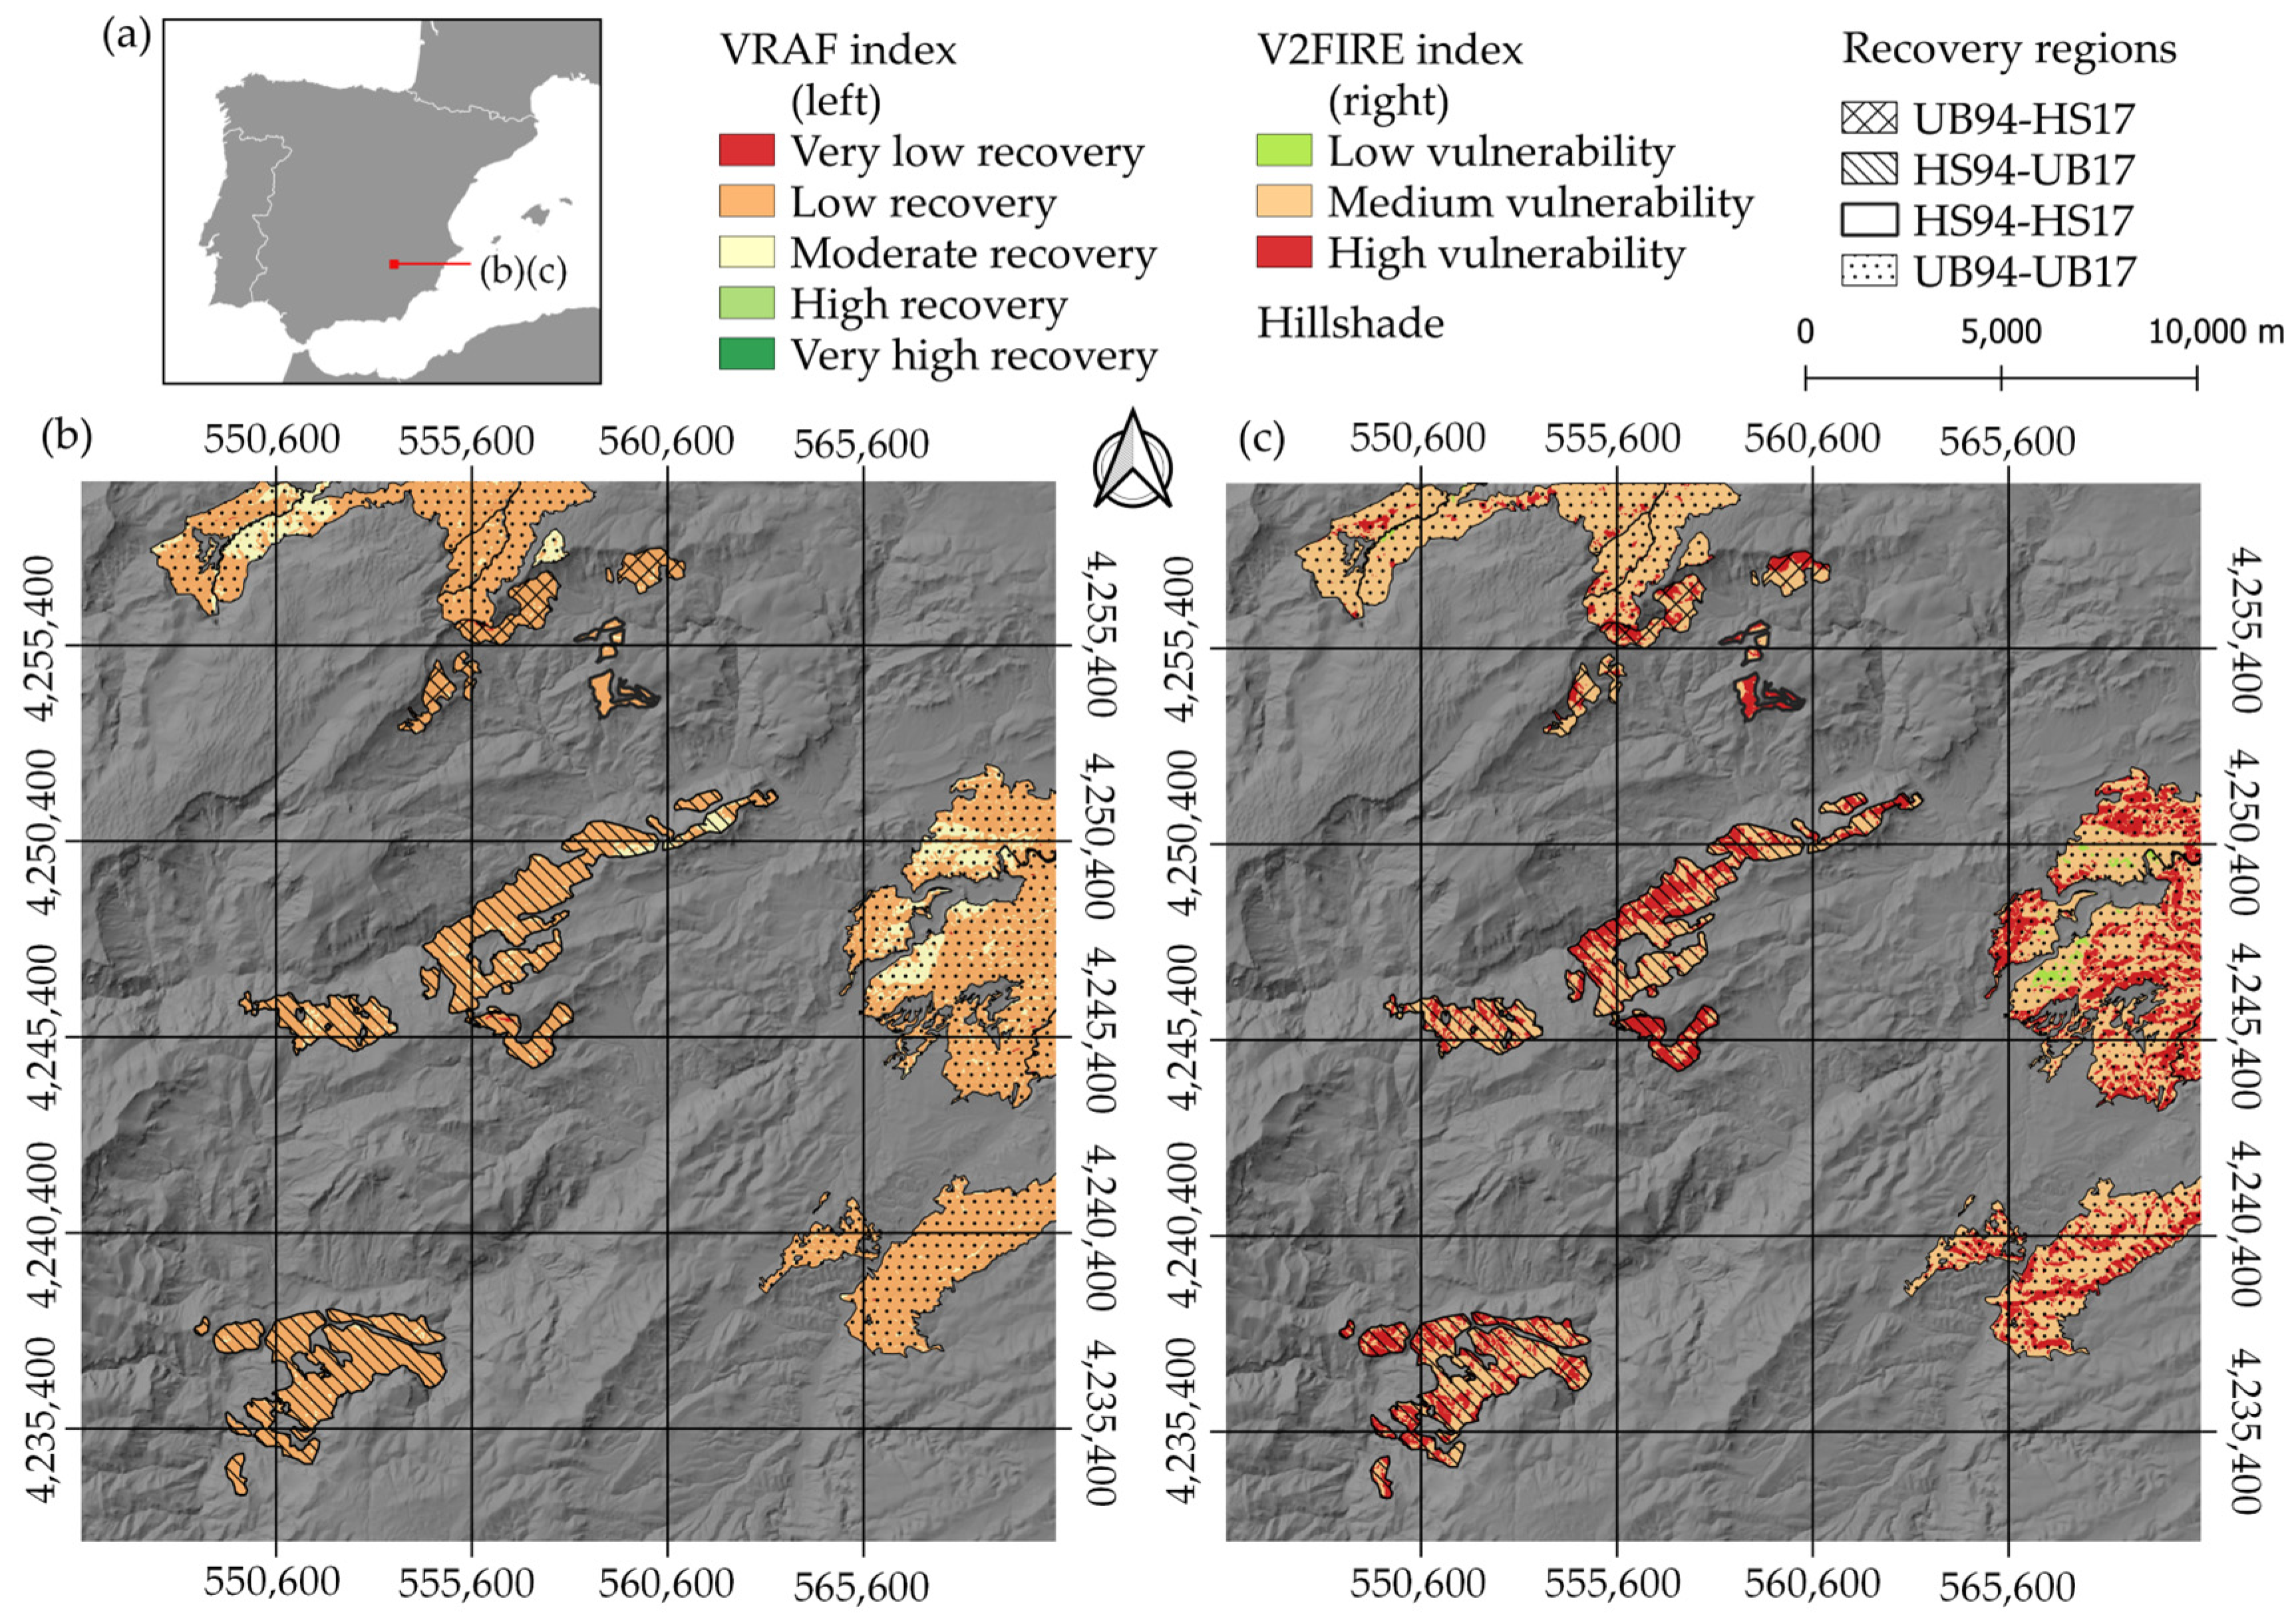
2.3.3. Mapping Resilience and Vulnerability to Wildfires

The Vegetation Resilience After Fire (VRAF) index developed by Bisson et al. (2008) [37] quantifies the recovery capacity of vegetation in areas affected by wildfires by considering critical factors like soil characteristics, vegetation composition, and canopy cover. The process involves digitizing and transforming data into raster files. A comprehensive description of the calculation methodology can be found in the corresponding paper [37]. The VRAF index is classified into distinct categories to reflect the recovery capacity, as follows: very low (VRAF ≤ 1.7), low (1.7 < VRAF ≤ 2.5), moderate (2.5 < VRAF ≤ 3.3), high (3.3 < VRAF ≤ 4.0), and very high (VRAF > 4.0).
For the vulnerability assessment, the V2FIRE index was developed by considering the following parameters:
V2FIRE = 2(SL + A) + FT + SN + S +V,
where
  • SL is the slope gradient (%).
  • A describes the aspect (°).
  • FT refers to the fuel types—a simplified representation of a forest ecosystem used to predict and analyze fire behavior. Each FT describes the structure of the vegetation in terms of height, density, load, and continuity [69].
  • SN describes the proximity to NATURA 2000 protected sites, such as Special Protected Areas (SPAs) and Special Areas of Conservation (SACs).
  • S is the ability of the soil to recover after the fire.
  • V refers to the capacity of the vegetation to recover after the fire.
Similarly to the VRAF index, calculating the V2FIRE index required digitizing the information presented in Table 4 and converting it into raster files. These raster files were then combined to derive the final index values to reflect vulnerability in three categories: low (V2FIRE ≤ 10), medium (10 < V2FIRE ≤ 14), and high (V2FIRE > 14).
The slope significantly impacts the ecological susceptibility to fire through various mechanisms. Forest fires propagate faster on steep slopes, intensifying the risk in such regions. Regions characterized by steep gradients are prone to fire propagation, whereas places with a plain topography have reduced susceptibility [70,71]. In addition, areas with steeper slopes are more susceptible to soil erosion and face greater regeneration and recovery challenges [71,72], which lead to increased vulnerability.
Sun-exposed areas exhibit lower humidity levels, making them more prone to wildfires. Similarly, north-facing slopes retain more moisture and are less vulnerable to fire [71].
Fuel models influence the ecological vulnerability to fire by determining the quantity, spatial distribution, moisture content, and phenology of plant fuels [70].
Land management, human activity, and climate change are a few factors that may impact forest fire vulnerability in protected areas [73]. Effective conservation policies and fire management in these spaces are critical to addressing ecological vulnerability to fire in protected areas [74].
Soil types influence ecological vulnerability due to their response to fires and short- and medium-term impacts on their properties [34]. After the fire, soils with lower water retention capacity, such as sandy soils, are more prone to erosion. The soil structure is degraded, erodibility increases, and fertility decreases, leading to a significant level of nutrient poverty [75,76]. In addition, water repellency can reduce the soil infiltration capacity, increasing the susceptibility to erosion losses [77,78,79].
The vegetation type significantly influences the ecological vulnerability to forest fires [34,71]. For example, in Mediterranean ecosystems, vegetation has a remarkable ability to recover from disturbances caused by fire [80,81,82]. However, plant species that lack adaptations or tolerance to fire may suffer a high mortality rate, altering the dynamics and composition of the ecosystem [83]. Also, vegetation regeneration after the fire is a crucial factor in reducing soil erosion, as the presence of vegetation helps to protect the soil from erosion [84,85].

2.4. Statistical Analysis

With reference to [86], the trend and seasonal characteristics of the NDVI, NDMI, and NBR time series from 1990 to 2023 across the different recovery regions (UB94-HS17; HS94-UB17; HS94-HS17; UB94-UB17) were obtained. The statistical analysis used the average values of spectral indices across all recovery regions for each satellite image as input data. The trends were analyzed using the Mann–Kendall test [87], while stationarity was evaluated using the unit root test [88].
Normality and homoscedasticity were evaluated before any ANOVA. For this purpose, the Shapiro–Wilk test and Levene’s test were calculated, respectively. If variables deviated from a normal distribution, we employed the Kruskal–Wallis test to determine any significant disparities in vegetation response across the different recovery regions. Tukey’s HSD or the Dunn–Bonferroni post hoc test was run to assess the differences between recovery regions. The statistical tests were conducted at a significance level of 95% (p-value < 0.05).
All of the analyses were performed using version 4.3.2 of RStudio [89]. The investigation also employed other tools and packages, such as “dplyr version 1.1.2” [90] for data processing and “ggplot2 version 3.4.2” [91] for creating graphics and visualizations.

3. Results

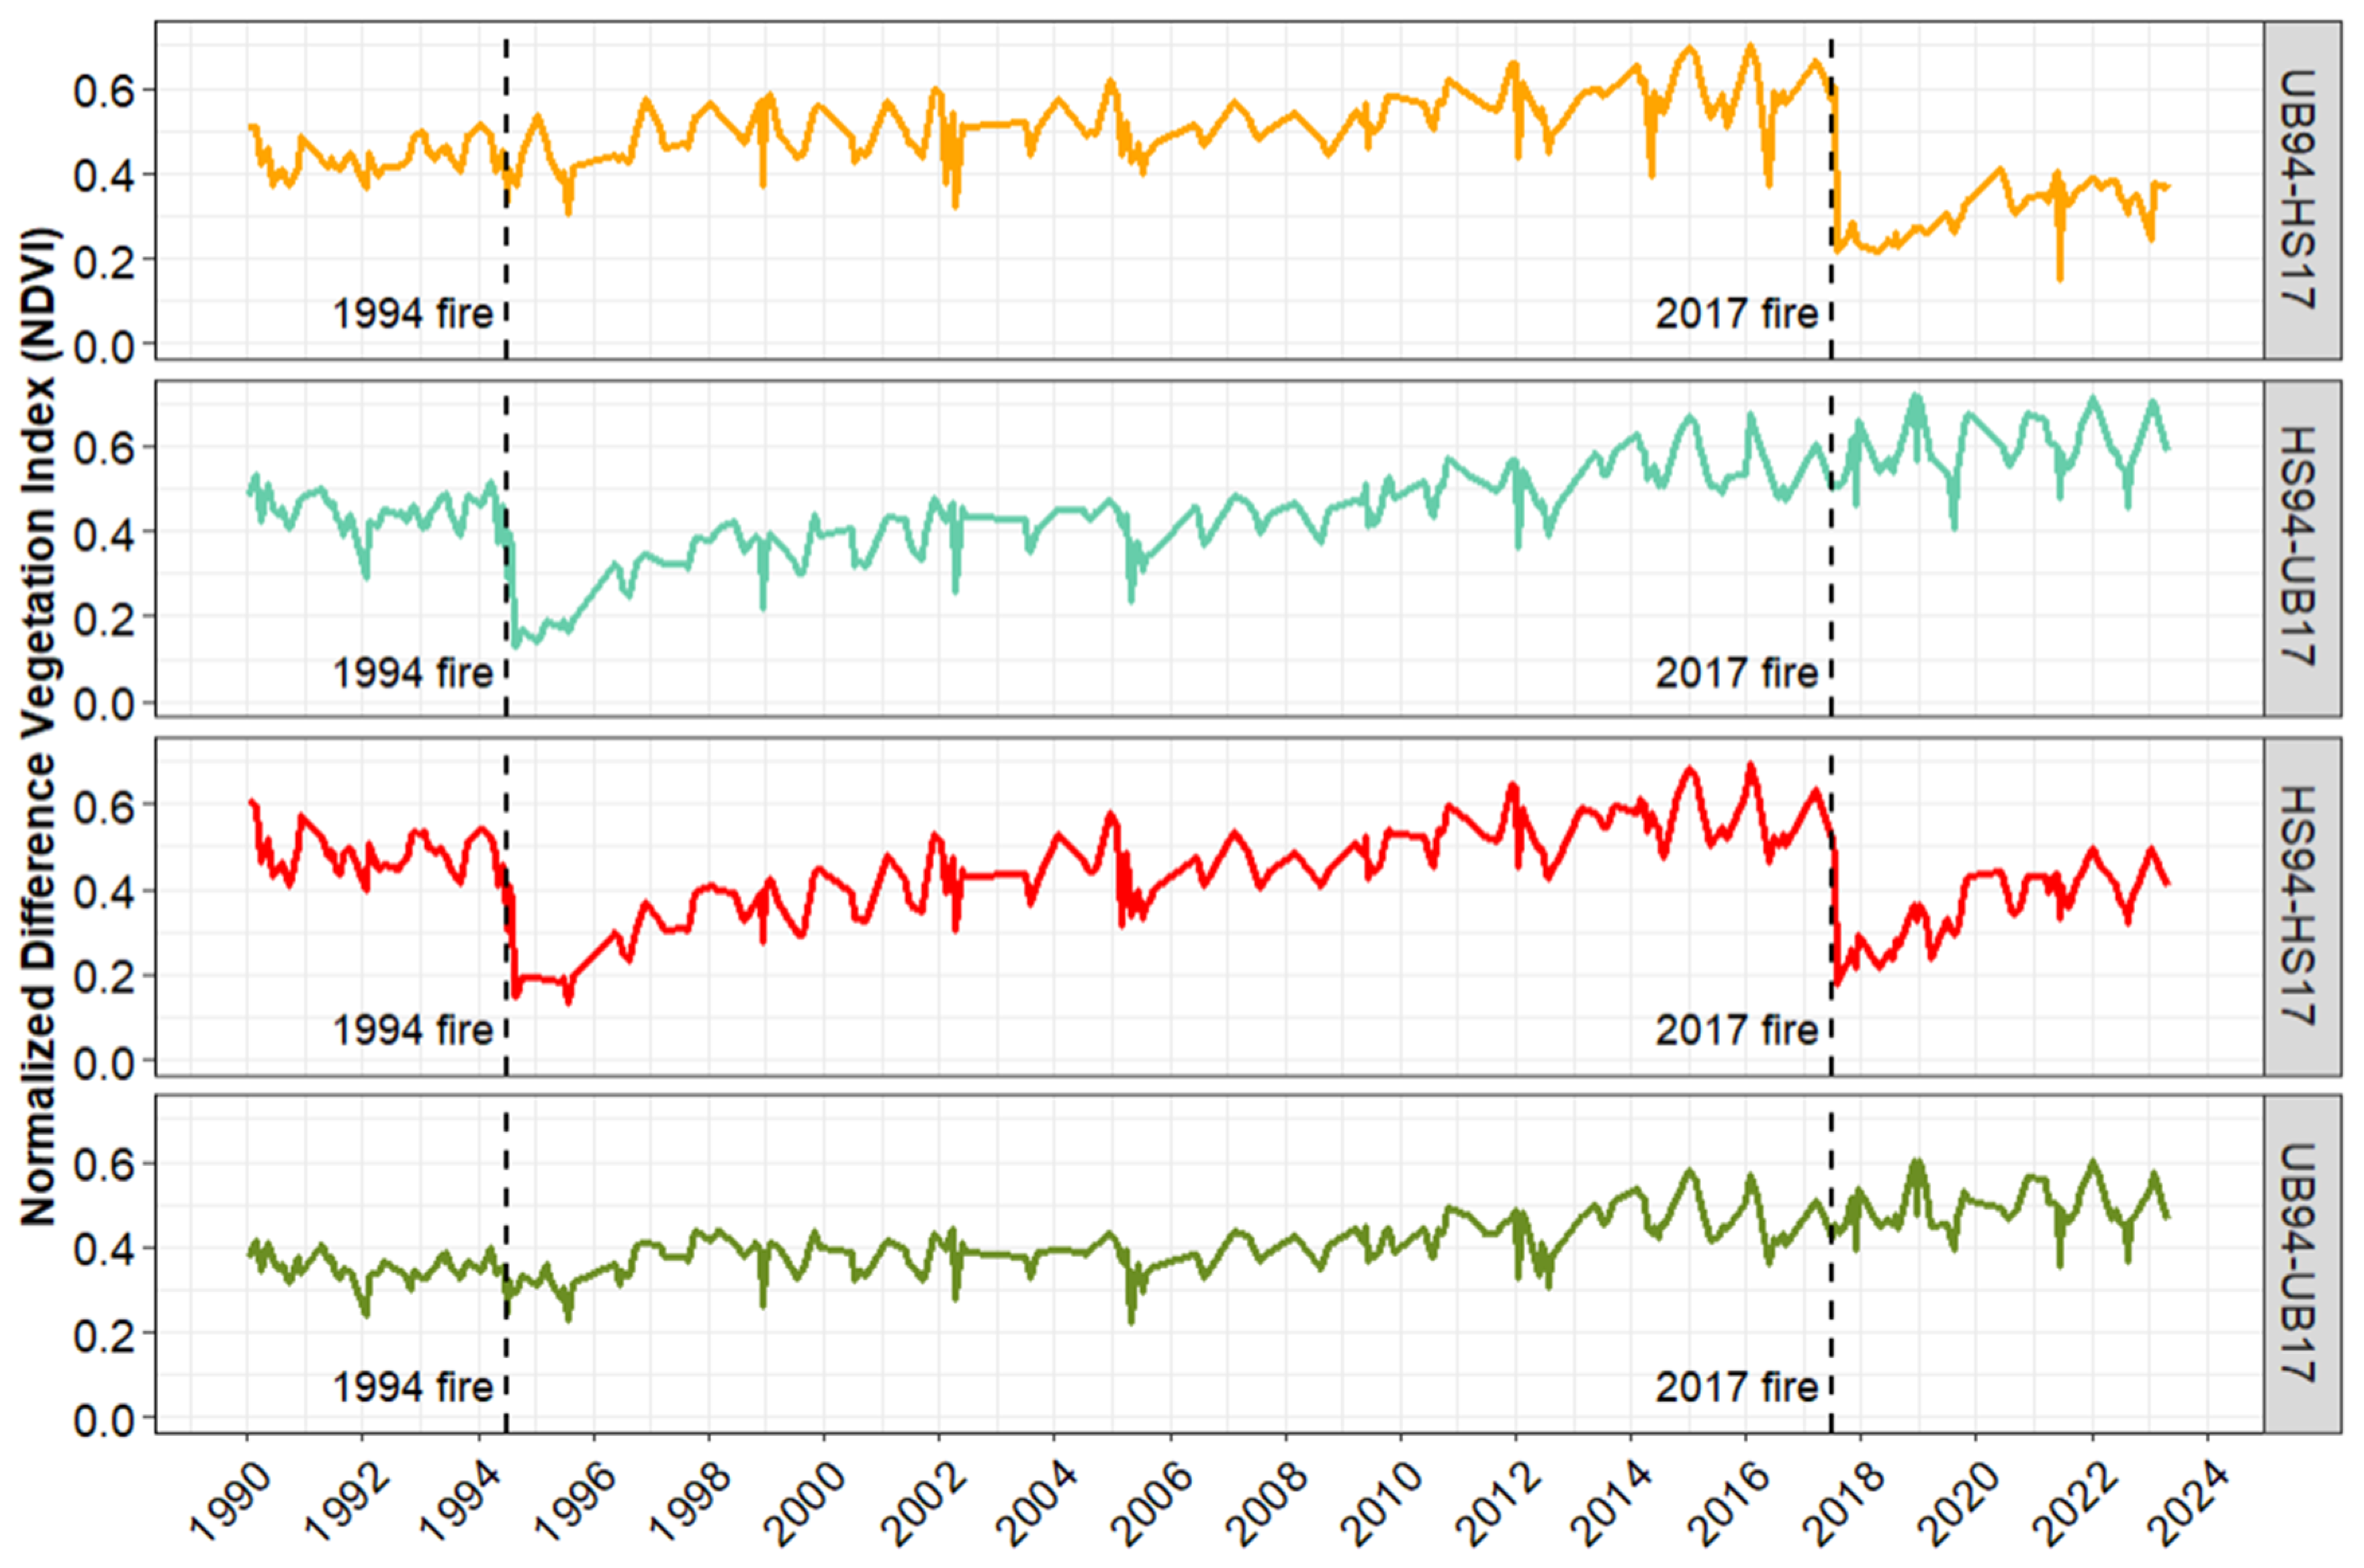
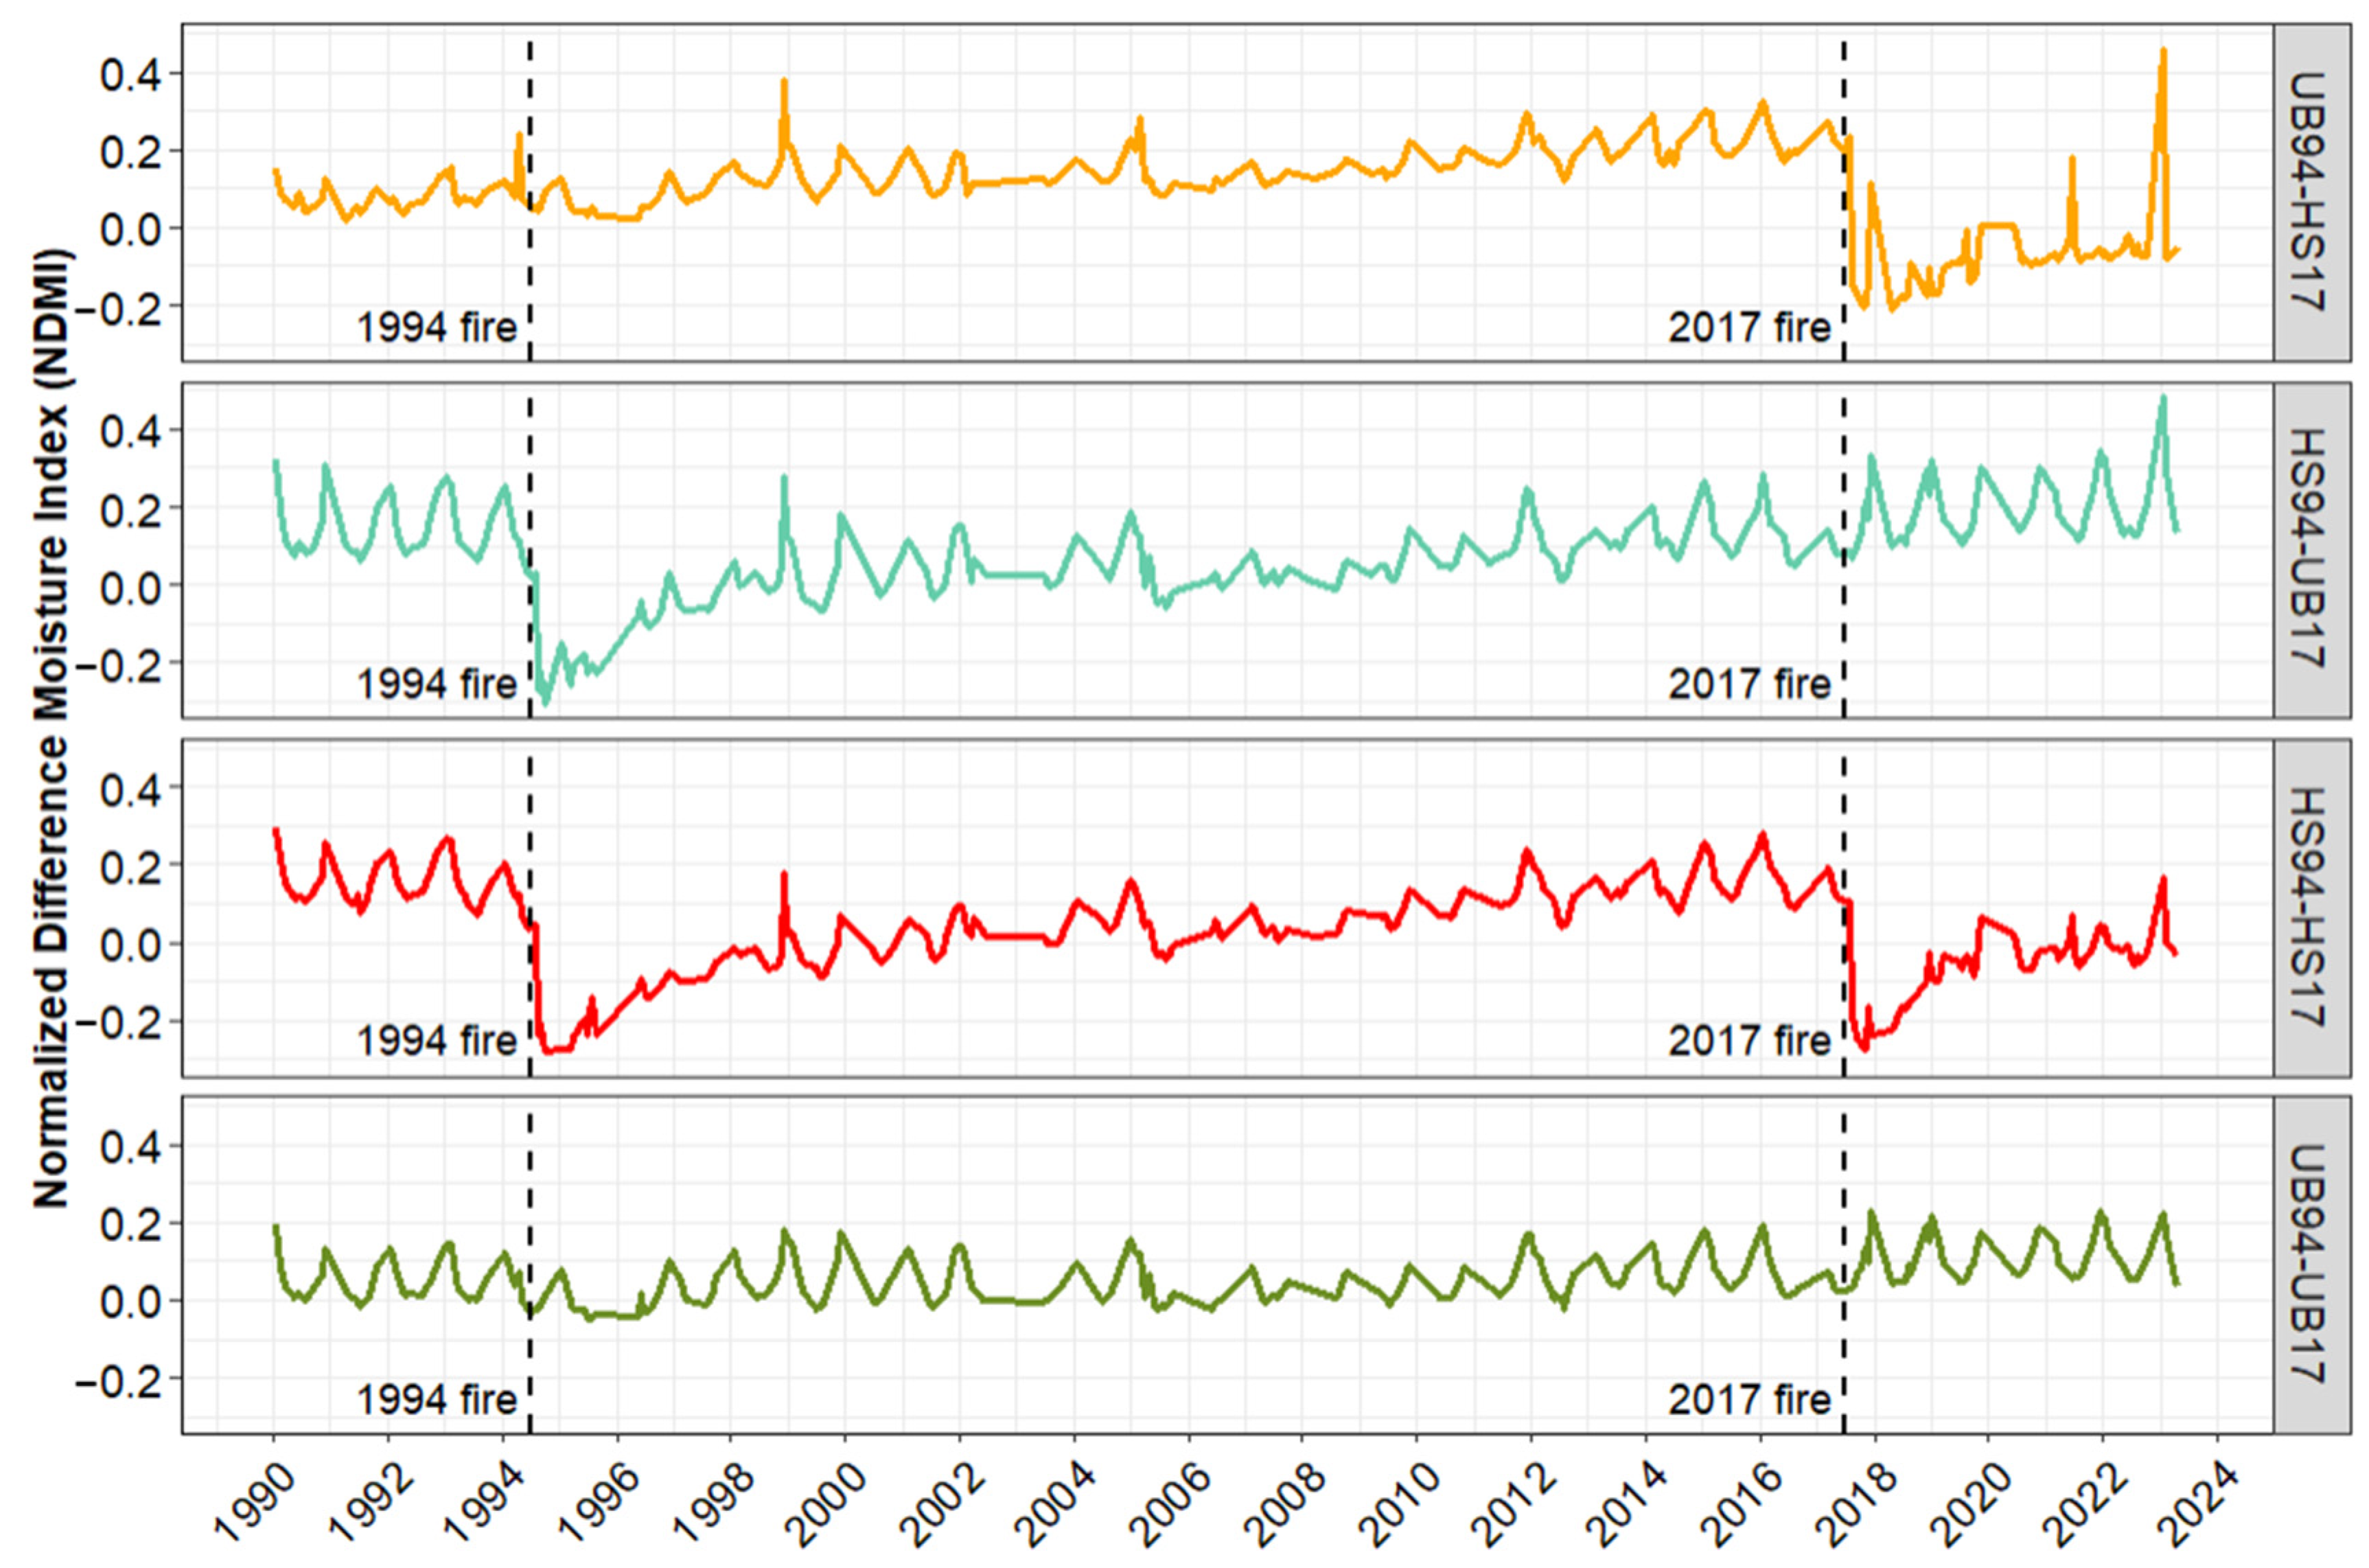
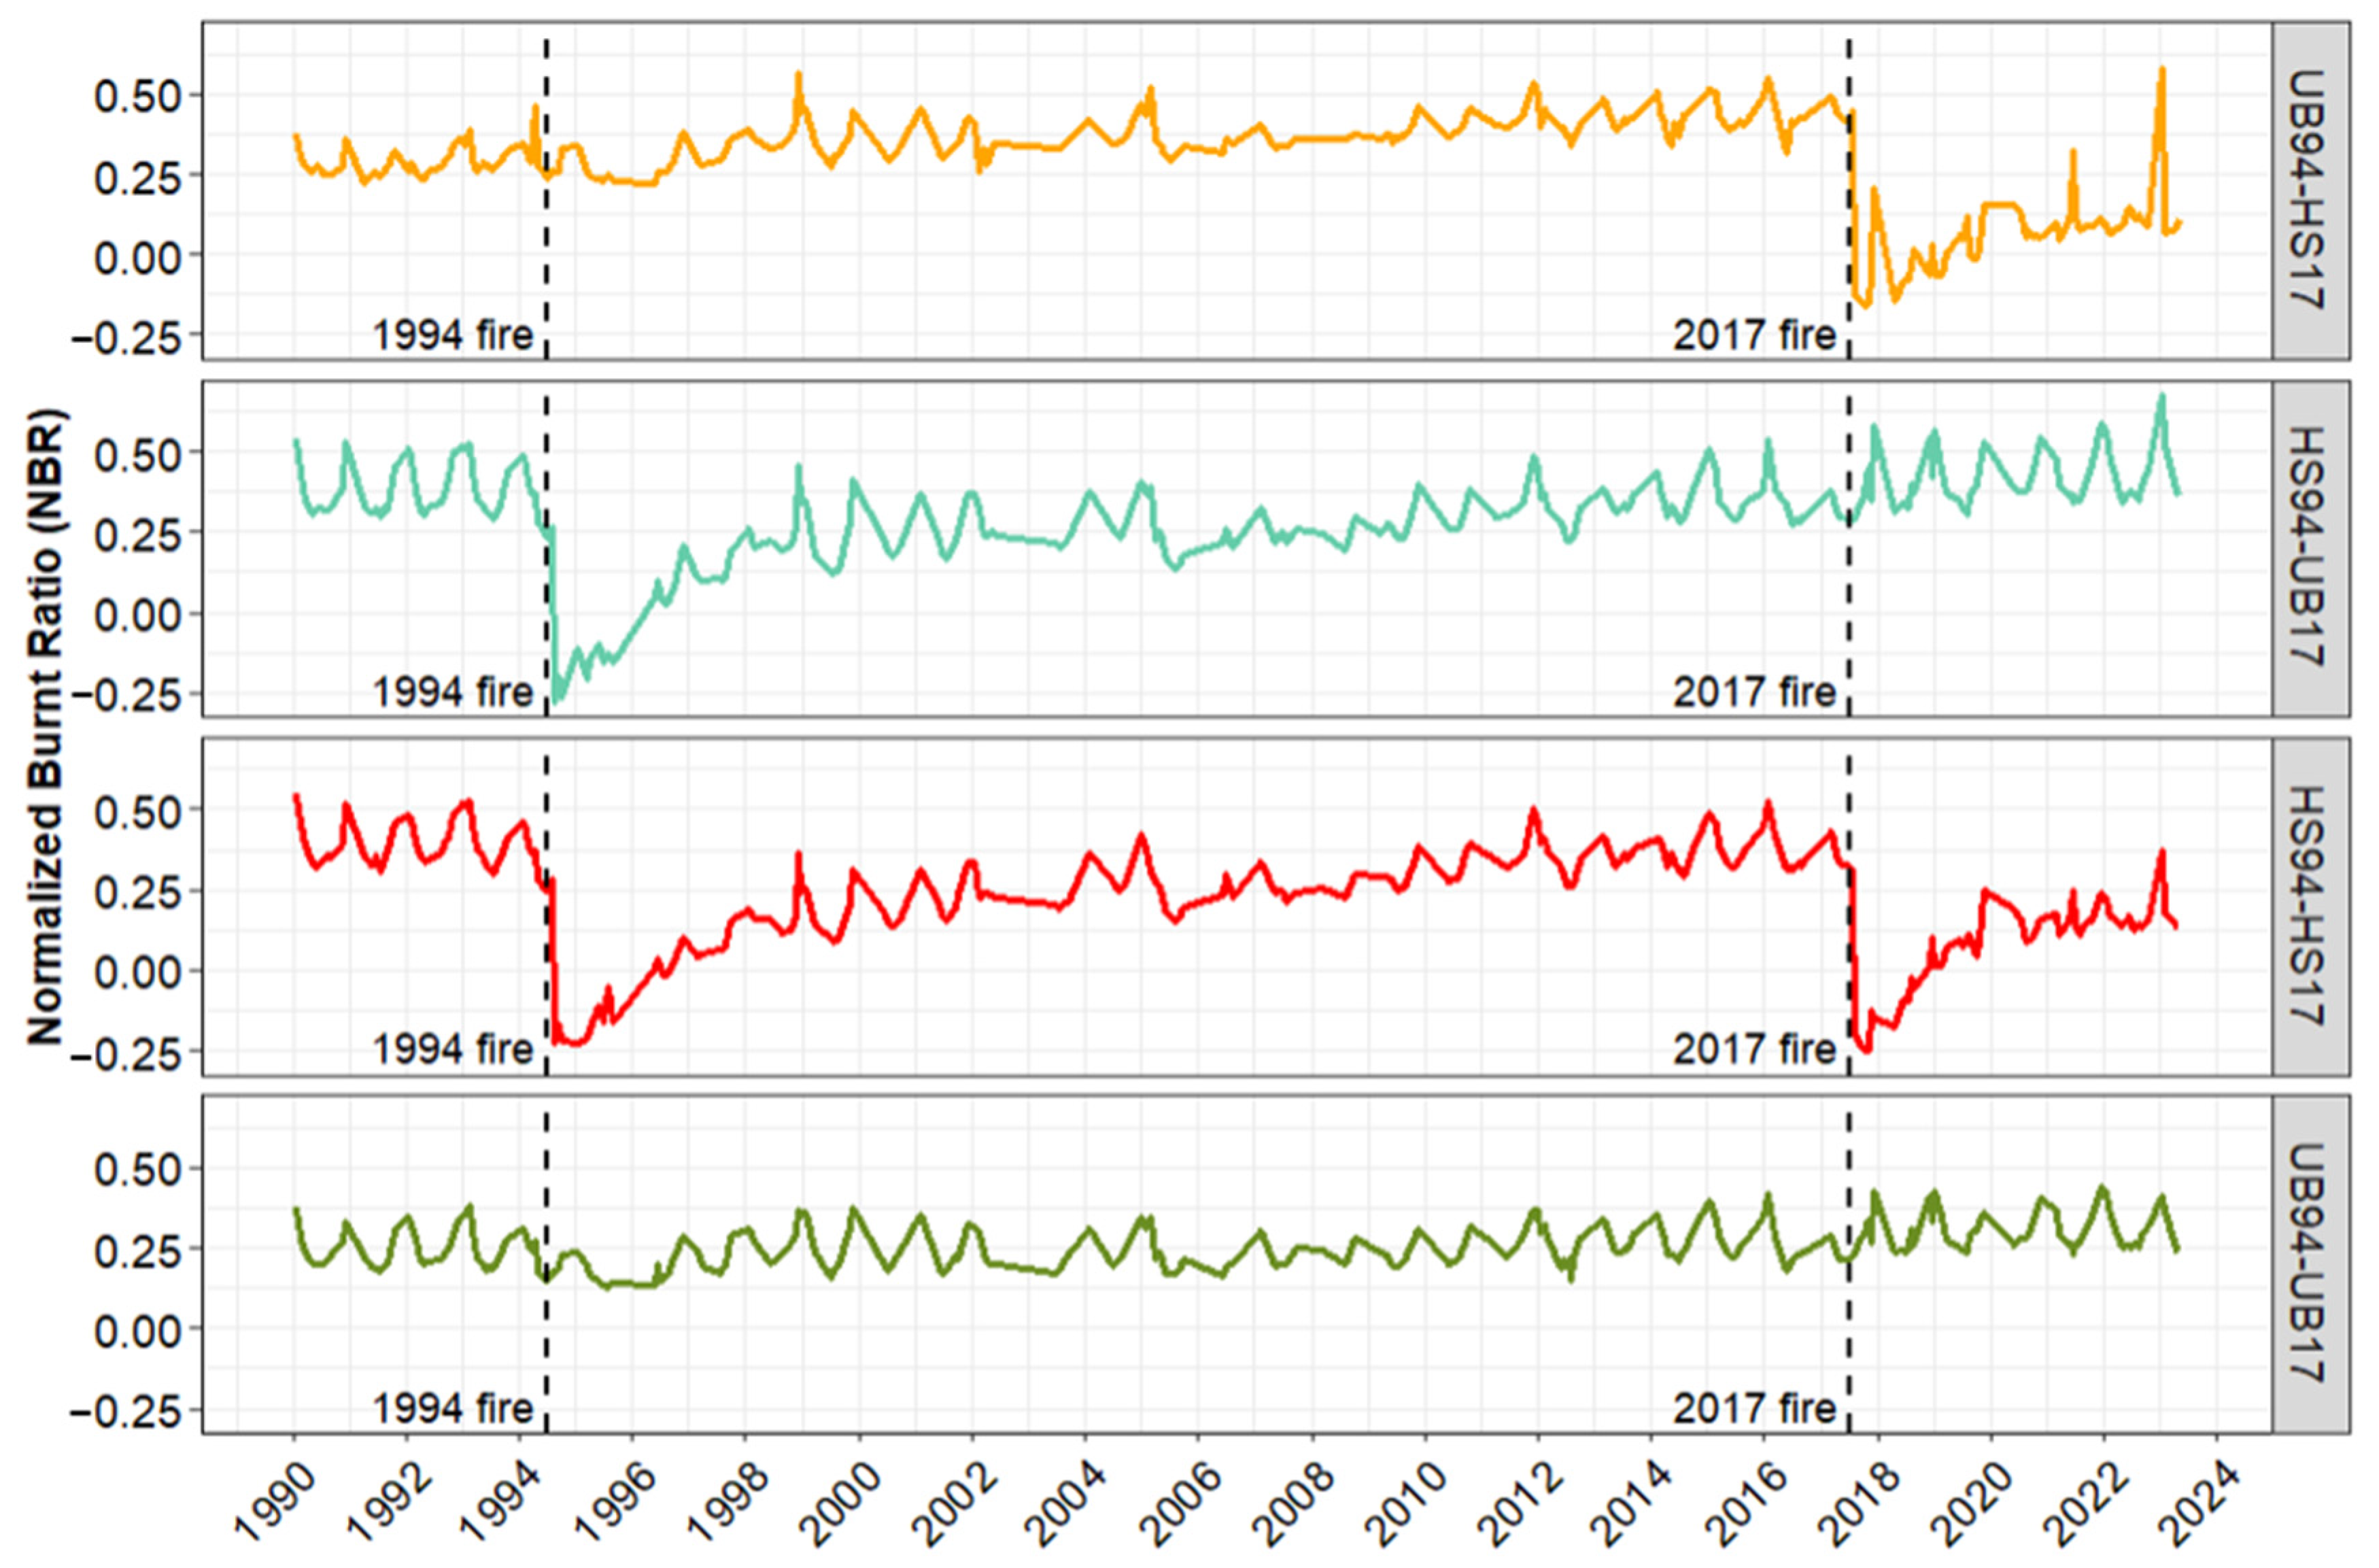
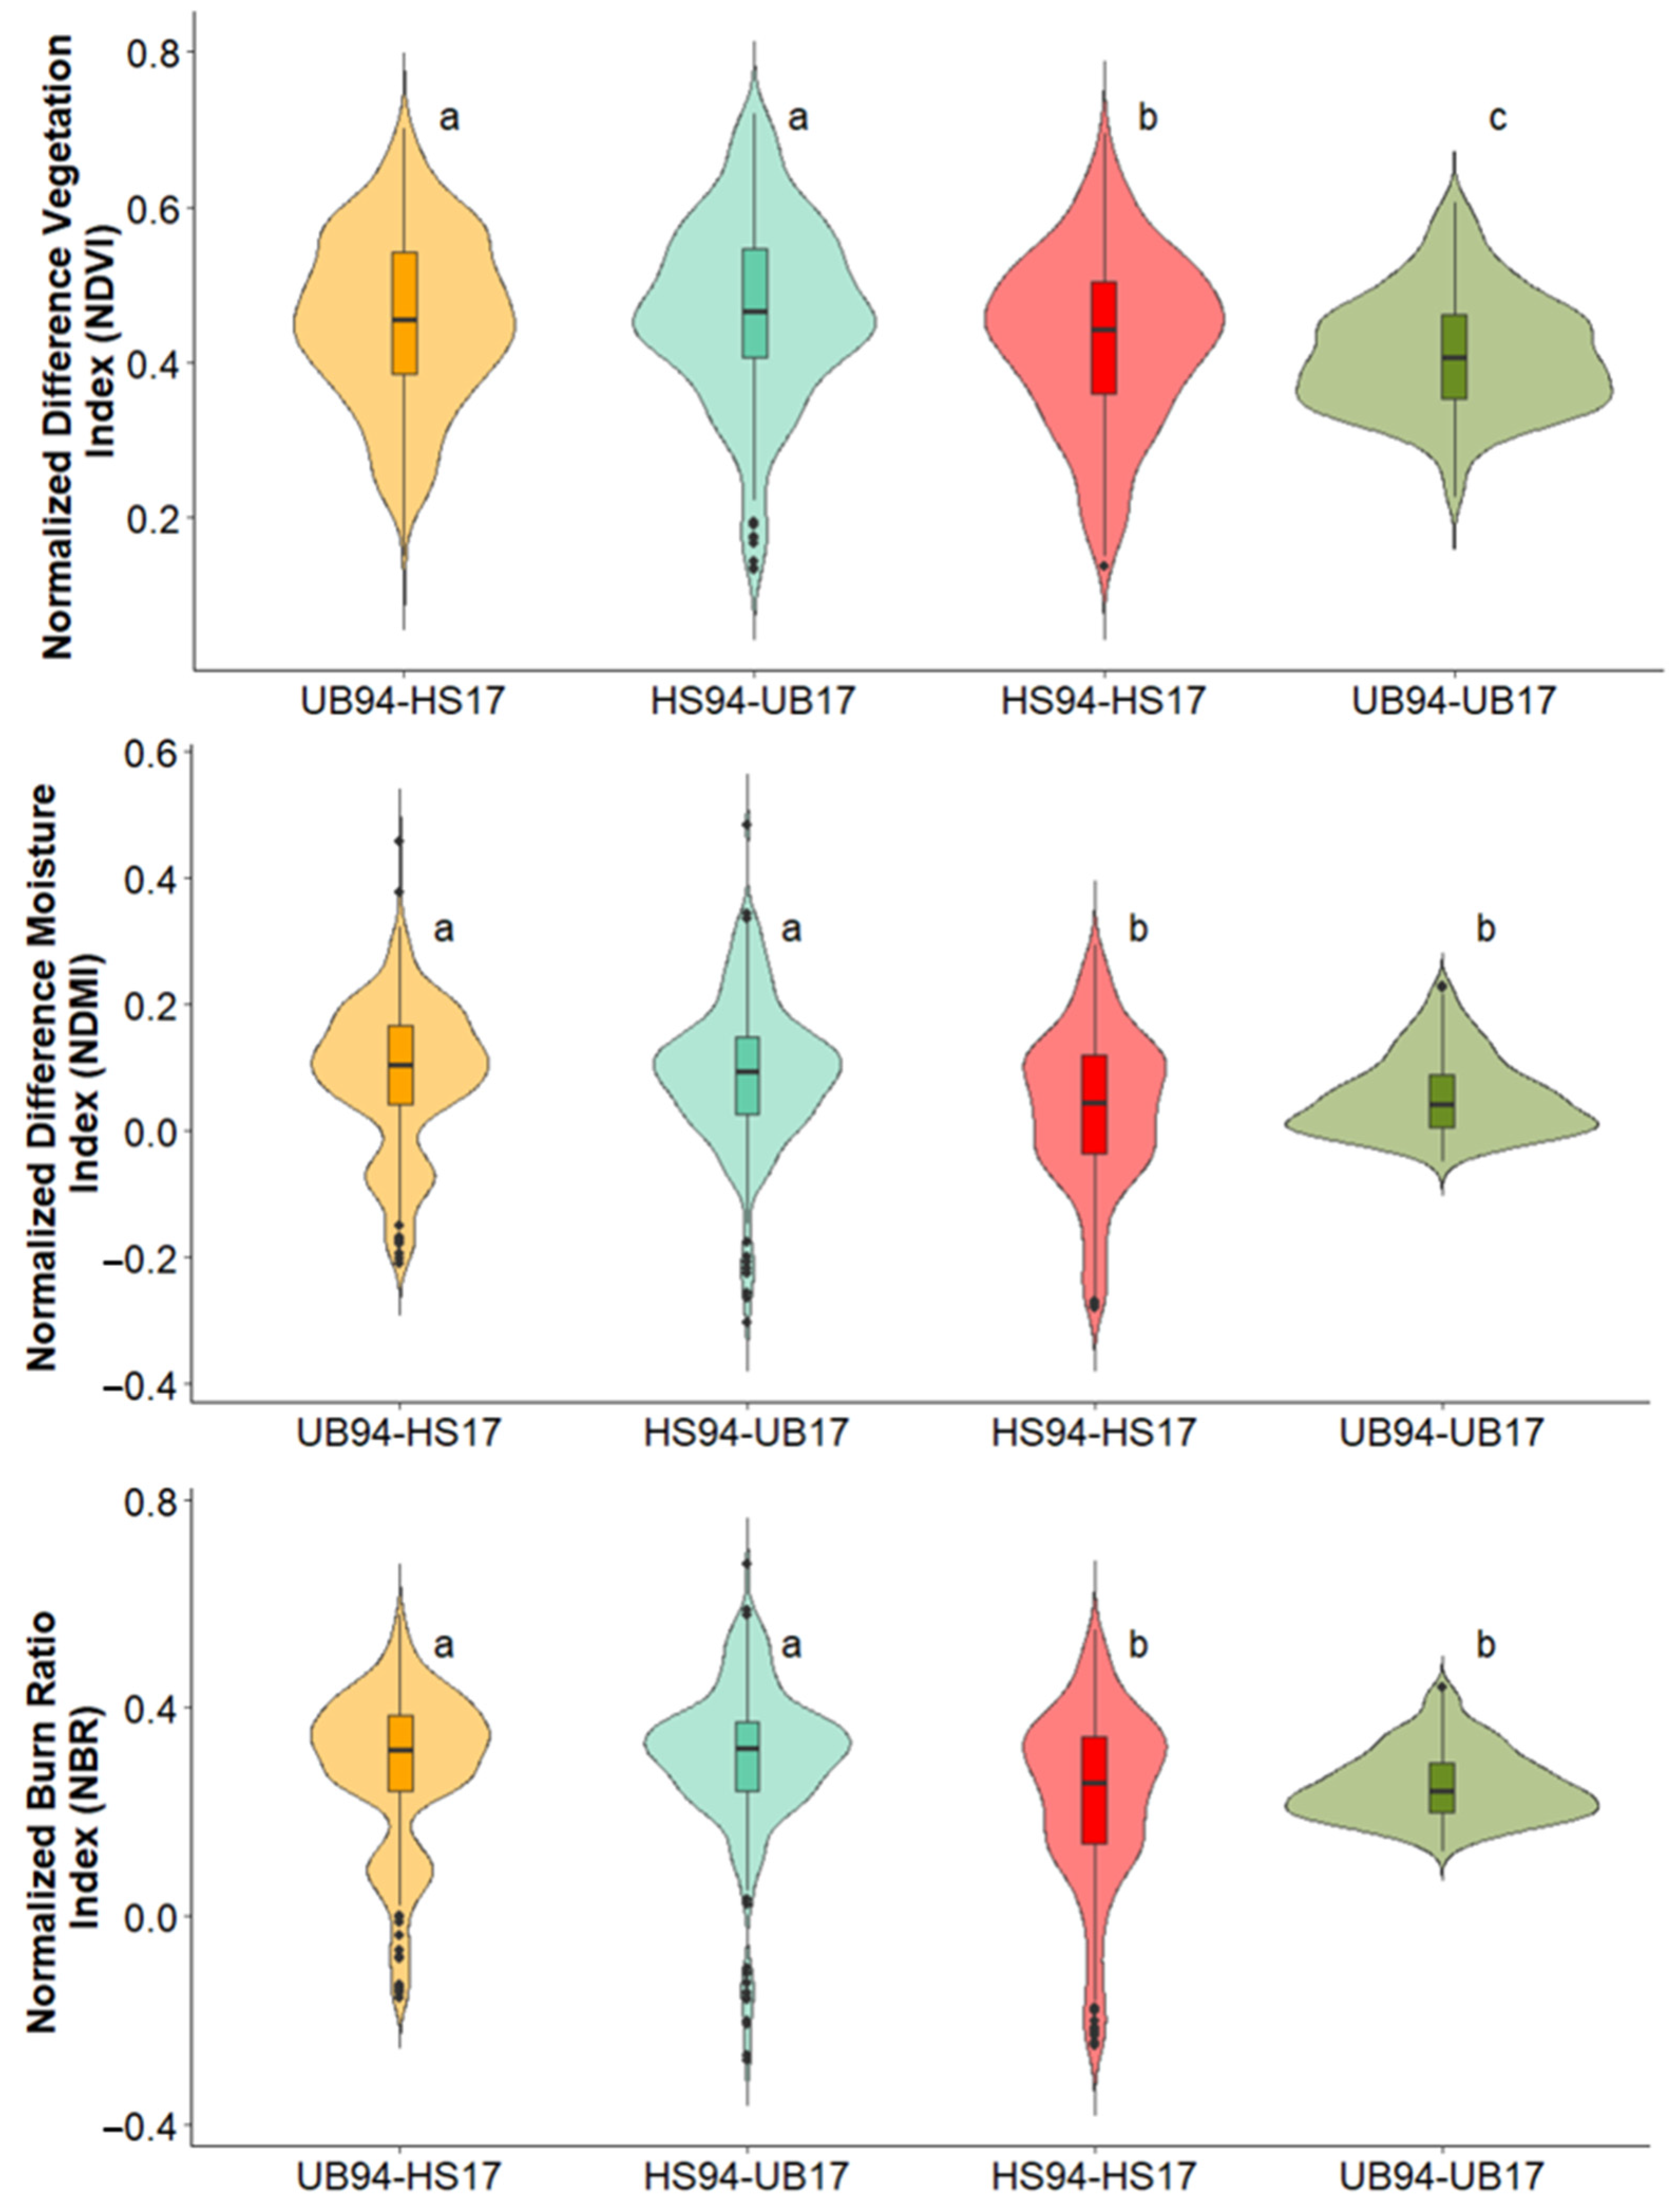
3.1. Vegetation Recovery Dynamic Trends by Region

The dNBR index was only utilized to assess the fire severity and identify recovery regions (UB94-HS17; HS94-UB17; HS94-HS17; UB94-UB17), as described at the end of Section 2.3.1. First, we evaluated the long-term series of NDVI (Figure 3), NDMI (Figure 4), and NBR (Figure 5) across the recovery regions, and we plotted the vegetation recovery dynamics. We observed changes and interannual variations for the NDVI, NDMI, and NBR from 1990 to 2023 (Table 5). Before the 1994 fire (from 1990 to 1994), the mean values observed between all regions were similar for the indices calculated, which significantly decreased when the 1994 wildfire occurred, especially in the HS94-UB17 and HS94-HS17 regions. Subsequently, just after the 1994 fire (from 1994 to 2000), the three indices slowly increased their mean values (Figure 3, Figure 4 and Figure 5). Between 2000 and 2017, the mean NDVI values recovered, while NDMI and NBR values still showed lower values than in the 1994 pre-fire situation. Notably, after the 2017 wildfire, there was a sharp drop in all three indices (NDVI, NDMI, and NBR). This drop was more noticeable in UB94-HS17 and HS94-HS17, while HS94-UB17 recovered its spectral values from the 1994 fire. Despite six years having elapsed, the mean values before the 2017 wildfire were not attained in 2023. In the UB94-UB17 region across the complete study period (1990–2023), the mean NDVI values slightly increased, the mean NDMI values were relatively constant, and the mean NBR values were the most unchanged, although they increased slightly at the end of the period.
Table 6 displays the time-series statistical analysis outcomes on each spectral index across the different recovery regions. The statistics indicate that the three spectral indices (NDVI, NDMI, and NBR) exhibit identical trends and seasonality for UB94-HS17, HS94-UB17, and UB94-UB17. Regarding HS94-HS17, the NDMI and NBR showed a consistent trend and temporal pattern; however, the NDVI did not demonstrate a notable trend.
The Kruskal–Wallis and Dunn–Bonferroni tests showed significant differences between the NDVI time series across the following recovery regions (Figure 6): UB94-HS17 and HS94-HS17, UB94-HS17 and UB94-UB17, HS94-UB17 and HS94-HS17, HS94-UB17 and UB94-UB17, and HS94-HS17 and UB94-UB17. The only zones that showed no significant differences were UB94-HS17 and HS94-UB17, which corresponded to the areas that had undergone a single fire event (in either 1994 or 2017). The results for the NDMI and NBR were similar except for HS94-HS17 and UB94-UB17, which showed no differences.
Field measurements are crucial for validating the quality, reliability, and correct interpretation of data obtained from remote sensors. We used the model presented in Table 7 to validate the results obtained from the NDVI in the field. Figure 7 compares the NDVI values obtained from remote sensors (GEE) and NDVI values obtained from field measurements (LAI). There were no significant differences in the NDVI derived from GEE compared to those obtained from LAI measurements.
The results for the calculations of recovery rates are shown in Table 8. The RRI showed similar values for the three indices (NDVI, NDMI, and NBR) in the different recovery areas (UB94-HS17; HS94-UB17; HS94-HS17; UB94-UB17). UB94-HS17 and UB94-UB17 for the 1994 fire displayed values above 2, indicating that there had been more recovery than disturbance (which is consistent, because these areas did not experience fire damage in 1994). In contrast, HS94-UB17 and HS94-HS17 showed values close to 1, indicating the same amount of spectral recovery as a disturbance having occurred. After the 2017 fire, the RRI for UB94-HS17 and HS94-HS17 showed lower recovery values than the 1994 fire-affected areas (0.90–1.30 versus 0.49–0.82) for all indices analyzed. HS94-UB17 and UB94-UB17, unaffected by the 2017 fire, displayed values exceeding 2.
The R80P results for the 1994 fire indicate that all regions have reached 80% recovery based on their pre-disturbance spectral index values. The UB94-HS17 region for NDVI, the HS94-HS17 region for NDMI, and both the UB94-HS17 and HS94-HS17 regions for NBR still need to recover from the 2017 fire.
The YrYr displayed positive values for all indices (NDVI, NDMI, and NBR) and both fires (1994 and 2017), suggesting that all zones increased their spectral index values. Additionally, the areas affected by recent forest fires showed more significant changes.

3.2. Mapping Vegetation’s Resilience and Vulnerability to Wildfires

Figure 8 spatially represents the calculated VRAF and V2FIRE indices. These indices allowed us to identify areas with low recovery capacity after a fire and vulnerable regions in the event of a new disturbance. The study area predominantly exhibited low-to-moderate levels of resilience, with VRAF values consistently below 2.5. This can be attributed to environmental characteristics, such as slopes, aspect, fuel loads, and proximity to areas of high ecological value. Consequently, most of the study area showed medium-to-high vulnerability values (10 ≤ V2FIRE ≤ 18).
The comparison between the VRAF and V2FIRE indices is shown in Table 9. Areas that have been burned once or twice (UB94-HS17, HS94-UB17, and HS94-HS17) exhibited VRAF values around 2, indicating a low recovery capacity (1.7 < VRAF ≤ 2.5). The regions unburned by both fires (UB94-UB17) showed moderate recovery capacity (2.5 < VRAF ≤ 3.3). Therefore, in line with these findings, fire-affected areas (UB94-HS17, HS94-UB17, and HS94-HS17) showed high vulnerability to fire, while unburned areas (UB94-UB17) displayed medium vulnerability to fire.

4. Discussion

4.1. Vegetation Recovery Dynamics by Region

We utilized the NDVI as an indicator of the photosynthetic activity of the forest canopy, the NDMI as an indicator of vegetation water content, and the NBR as an indicator of vegetation biomass. The combination of these indices provides insights into the seasonal variations in vegetation status [92] when a disturbance occurs, along with whether it recovers after disturbance or not [93]. The indices NDVI, NDMI, and NBR exhibited similar responses to forest fires (Table 5). Before the 1994 fire, all zones had consistent averages for the three indicators. Following the 1994 fire, the areas affected by the fire (HS94-UB17 and HS94-HS17) experienced significant decreases in the values of the three indices. Between 1994 and 2017, during the first six years after the fire, the spectral indices showed growth (Figure 3, Figure 4 and Figure 5). These indices eventually reached values similar to those before the fire. The 2017 fire significantly decreased the values of the three indices in the fire-affected areas (UB94-HS17 and HS94-HS17), which are recovering. The regions unaffected by forest fires (UB94-UB17) exhibited relatively stable values throughout the study period, without experiencing significant declines. These results are consistent with the findings of [94,95], where the indices analyzed showed similar performance after the fire.
However, the three indices responded differently to the Mann–Kendall and unit root statistical tests (Table 6). This was particularly evident in areas with two fire episodes (HS94-HS17), where the NDVI exhibited no discernible pattern. On the other hand, the NDMI and NBR displayed a negative trend. The NDVI and NDMI showed comparable stationarity patterns. More precisely, UB94-HS17 and HS94-HS17 produced time series that exhibited non-stationarity, whereas HS94-UB17 and UB94-UB17 produced time series that revealed stationarity. All of the recovery regions related to NBR showed a non-stationary series except for UB94-UB17. A stationary time series has consistent statistical qualities (such as mean, variance, and autocorrelation) that remain constant over time, simplifying the analysis and interpretation of the data. Non-stationary time series can pose challenges for modeling and accurate prediction because of trends or fluctuations in data variability across time [96].
The NDVI better captured the differences between the recovery regions than the NBR and NDMI (Figure 6). The long-term survey of post-wildfire vegetation recovery [94] revealed that the NDMI outperformed the NDVI in capturing vegetation canopy moisture content. Similarly, another study [97] demonstrated that the NDMI exhibited greater sensitivity to vegetation disturbances and enhanced resistance to data noise compared to other tested indices. That study also highlighted that the NBR performs poorly under arid conditions, while the NDMI is only effective in wet areas.
The results obtained from the RRI, R80P, and YrYr metrics of the NDVI, NDMI, and NBR (Table 8) time series enabled the identification of the time needed for vegetation to exhibit similar spectral values to those observed before the fire, as reported in other studies [98,99,100]. The NDVI values derived from RS and LAI field measurements did not show any statistically significant differences throughout all recovery regions, as illustrated in Figure 7. Thus, the outcomes derived via RS align well with those computed based on field data. However, field verification is necessary to assess vegetation’s recovery after fire, including potential changes in floristic composition, structure, and regeneration, among other parameters. Our findings align with previous research that also reported increased rates of vegetation regrowth in the short term based on spectral vegetation indices in Mediterranean pine forests [101]. While the remote sensing data analysis indicated that the spectral photosynthetic response recovered within 5–10 years after a wildfire, it did not provide information on these specific parameters [102]. The obtained spectral recovery rate was similar to the results reported in other studies [37,93,103]. It is important to note that the area burned in 2017 is still recovering, while the area burned in 1994 has fully recovered and showed comparable NDVI spectral values to the pre-fire conditions. The areas that had undergone two high-severity fire events appeared to exhibit similar recovery patterns to those that had faced a single fire event. However, the statistical tests (Figure 6) indicated significant differences in index evolution between these two areas. As highlighted by [80], these differences may be due to the reduction in species richness and the changes in the proportions of seeders and resprouter species in the study area because of fire severity and recurrence effects. A future research line will investigate what is happening in all of these areas regarding vegetation and soil functional recovery.
Employing cloud-based processing platforms for monitoring and assessing vegetation responses to wildfires offers significant advantages [98,104]. Numerous researchers have highlighted that utilizing cloud computing platforms for managing extensive datasets is a popular research topic [95]. Our results, compared to similar ones involving the use of the GEE, showed similarities [100]. However, it is essential to be cautious and consider interannual variations when interpreting the results [105].

4.2. Mapping Resilience and Vulnerability to Wildfires

UB94-UB17 showed the highest recovery capacity after fire, at 2.24 ± 0.25, with HS94-UB17 closely following at 2.23 ± 0.22. The HS94-HS17 and UB94-HS17 regions exhibited reduced fire recovery capacities (2.11 ± 0.22 and 2.07 ± 0.20, respectively). An inverse relationship was noted between vulnerability to fires and recovery capacity. UB94-UB17 had the lowest fire vulnerability, at 13.64 ± 1.31, followed by UB94-HS17 and HS94-UB17 at 14.21 ± 1.04 and 14.28 ± 1.09, respectively. HS94-HS17 (14.99 ± 1.06) was identified as the most vulnerable area. These results emphasize the significance of monitoring the post-fire recovery of vegetation and soil properties. Changes in vegetation coverage and soil erosion can hinder ecosystem recovery, reducing the recovery capacity and increasing the vulnerability to fire [80].
Recovery capacity (VRAF index) depends directly on burn severity [82]. As mentioned by other authors [37,106], slopes play a crucial role in determining recovery capacity due to their relationship with soil erosion. Areas with high burn severity and steeper slopes are more susceptible to soil erosion during the initial rainfalls that follow wildfires. This poses a challenge for these areas to undergo a successful recovery process. The correlation analysis did not show a significant relationship between high slopes and fire severity, so based on these results (Figure 9) we cannot conclusively state that high slopes significantly influence fire severity.
Identifying potentially vulnerable zones is a major concern to mitigate wildfires’ impacts. Different authors are working on determining the factors affecting vulnerability to forest fires. The authors of [107] highlighted that alteration to fire regimes is the most significant factor contributing to fire susceptibility, and leading areas previously considered to be relatively safe are now classified as vulnerable to fire. Therefore, comparative assessments and protocols are necessary to better comprehend the factors that influence wildfire susceptibility [108]. Another example of vulnerability assessment in a wildland–urban interface has found that landscapes with high road density and diverse land uses are more vulnerable [109]. Understanding how vegetation recovers after these extreme events will be extremely useful for forest managers in making management and restoration decisions in a world with a changing climate.

5. Conclusions

To conclude, if we consider the points mentioned above and the findings of this study, the employed tools have proven effective in assessing spectral recovery rates after fire events and identifying potential vulnerability. Given the increasing prevalence of high-severity wildfires, assessments based on remote sensing data and available cloud computing platforms (like GEE) may be an effective tool for forest managers when monitoring post-fire restoration efforts.
However, the limitations of the present study should also be highlighted. Being a case study, the results obtained cannot be generalized, as many factors depend on the conditions of the site itself. In addition, this study acknowledges that field verification is necessary to fully assess vegetation’s recovery after fire, including changes in parameters not captured by the remote sensing data.
Hence, as a future proposal, further research is necessary to continue to study and verify whether the factors included in the proposed V2FIRE index can be improved for a better assessment of ecosystems’ vulnerability to wildfires, e.g., considering changes in species composition that may affect the successional stage or even the degradation of the pine forests under recurrent burning scenarios. In this regard, work is underway to examine the vegetation and soils in each delineated recovery zone in this study (on a smaller scale), so as to evaluate the extent of their recovery.

Author Contributions

Conceptualization, E.P.-M., D.M., J.L.T. and E.M.; methodology, E.P.-M.; software, E.P.-M.; validation, J.L.T. and E.M.; formal analysis, E.P.-M.; investigation, E.P.-M.; resources, J.d.l.H.; data curation, E.P.-M.; writing—original draft preparation, E.P.-M., D.M., J.L.T. and E.M.; writing—review and editing, E.P.-M., D.M., J.L.T. and E.M.; visualization, E.P.-M., Á.F.-C. and J.G.-R.; supervision, D.M., J.L.T., E.M., M.E.L.-B. and J.d.l.H.; project administration, J.d.l.H.; funding acquisition, J.d.l.H. All authors have read and agreed to the published version of the manuscript.

Funding

Esther Peña is supported by a doctoral fellowship from the Internal Research Plan of the University of Castilla-La Mancha, co-financed by the European Social Fund (2020-PREDUCLM-16032). This study was also funded by the Spanish Institute for Agricultural Research and Technology (INIA) under the National Research Project “VIS4FIRE”: Integrated vulnerability of forest systems to wildfire: implications for forest management tools (RTA2017-0042-C05-05), along with regional funds from the “Junta Comunidades Castilla-La Mancha (PRESFIRE: SBPLY/19/180501/000130/1)”, MCIN/AEI/10.13039/501100011033 “ERDF a way of making Europe” (ENFIRES: PID2020-116494RR-C43).

Data Availability Statement

Data will be available upon request from the corresponding author.

Conflicts of Interest

The authors declare no conflicts of interest.

References

  1. Halofsky, J.E.; Peterson, D.L.; Harvey, B.J. Changing Wildfire, Changing Forests: The Effects of Climate Change on Fire Regimes and Vegetation in the Pacific Northwest, USA. Fire Ecol. 2020, 16, 4. [Google Scholar] [CrossRef]
  2. Tedim, F.; Leone, V.; Coughlan, M.; Bouillon, C.; Xanthopoulos, G.; Royé, D.; Correia, F.J.M.; Ferreira, C. 1—Extreme Wildfire Events: The Definition. In Extreme Wildfire Events and Disasters; Tedim, F., Leone, V., McGee, T.K., Eds.; Elsevier: Amsterdam, The Netherlands, 2020; pp. 3–29. ISBN 978-0-12-815721-3. [Google Scholar]
  3. Castellnou, M. Los Incendios de Sexta Generación Son Más Difíciles de Controlar y Afectan a Medio Planeta. Available online: https://www.lavanguardia.com/ciencia/planeta-tierra/20180817/451324516370/incendios-sexta-generacion-marc-castellnou-cambio-climatico-regenarar-ecosistemas.html (accessed on 13 March 2023).
  4. Varga, K.; Jones, C.; Trugman, A.; Carvalho, L.M.V.; McLoughlin, N.; Seto, D.; Thompson, C.; Daum, K. Megafires in a Warming World: What Wildfire Risk Factors Led to California’s Largest Recorded Wildfire. Fire 2022, 5, 16. [Google Scholar] [CrossRef]
  5. Fryirs, K.A.; Zhang, N.; Duxbury, E.; Ralph, T.; Fryirs, K.A.; Zhang, N.; Duxbury, E.; Ralph, T. Rivers up in Smoke: Impacts of Australia’s 2019–2020 Megafires on Riparian Systems. Int. J. Wildland Fire 2022, 31, 720–727. [Google Scholar] [CrossRef]
  6. Malandra, F.; Vitali, A.; Morresi, D.; Garbarino, M.; Foster, D.E.; Stephens, S.L.; Urbinati, C. Burn Severity Drivers in Italian Large Wildfires. Fire 2022, 5, 180. [Google Scholar] [CrossRef]
  7. Nolan, R.H.; Anderson, L.O.; Poulter, B.; Varner, J.M. Increasing Threat of Wildfires: The Year 2020 in Perspective: A Global Ecology and Biogeography Special Issue. Glob. Ecol. Biogeogr. 2022, 31, 1898–1905. [Google Scholar] [CrossRef]
  8. Costafreda-Aumedes, S.; Cardil, A.; Molina, D.M.; Daniel, S.N.; Mavsar, R.; Vega-Garcia, C. Analysis of Factors Influencing Deployment of Fire Suppression Resources in Spain Using Artificial Neural Networks. iForest-Biogeosci. For. 2015, 9, 138. [Google Scholar] [CrossRef]
  9. Lecina-Diaz, J.; Chas-Amil, M.-L.; Aquilué, N.; Sil, Â.; Brotons, L.; Regos, A.; Touza, J. Incorporating Fire-Smartness into Agricultural Policies Reduces Suppression Costs and Ecosystem Services Damages from Wildfires. J. Environ. Manag. 2023, 337, 117707. [Google Scholar] [CrossRef]
  10. WWF. Informe Incendios Forestales 2020: El Planeta en Llamas. Available online: https://www.wwf.es/?54921/Informe-incendios-forestales-2020-El-planeta-en-llamas (accessed on 13 March 2023).
  11. Johnstone, J.F.; McIntire, E.J.B.; Pedersen, E.J.; King, G.; Pisaric, M.J.F. A Sensitive Slope: Estimating Landscape Patterns of Forest Resilience in a Changing Climate. Ecosphere 2010, 1, art14. [Google Scholar] [CrossRef]
  12. Stevens-Rumann, C.S.; Kemp, K.B.; Higuera, P.E.; Harvey, B.J.; Rother, M.T.; Donato, D.C.; Morgan, P.; Veblen, T.T. Evidence for Declining Forest Resilience to Wildfires under Climate Change. Ecol. Lett. 2018, 21, 243–252. [Google Scholar] [CrossRef]
  13. Doblas-Miranda, E.; Alonso, R.; Arnan, X.; Bermejo, V.; Brotons, L.; de las Heras, J.; Estiarte, M.; Hódar, J.A.; Llorens, P.; Lloret, F.; et al. A Review of the Combination among Global Change Factors in Forests, Shrublands and Pastures of the Mediterranean Region: Beyond Drought Effects. Glob. Planet. Chang. 2017, 148, 42–54. [Google Scholar] [CrossRef]
  14. Vaz, P. Wildfire Resilience in Mediterranean Landscapes: A Review; Technical University of Lisbon: Lisbon, Portugal, 2009. [Google Scholar]
  15. Keeley, J.E. Resilience of Mediterranean Shrub Communities to Fires. In Resilience in Mediterranean-Type Ecosystems; Dell, B., Hopkins, A.J.M., Lamont, B.B., Eds.; Tasks for Vegetation Science; Springer: Dordrecht, The Netherlands, 1986; pp. 95–112. ISBN 978-94-009-4822-8. [Google Scholar]
  16. Díaz-Delgado, R.; Lloret, F.; Pons, X.; Terradas, J. Satellite Evidence of Decreasing Resilience in Mediterranean Plant Communities after Recurrent Wildfires. Ecology 2002, 83, 2293–2303. [Google Scholar] [CrossRef]
  17. Fernandez-Manso, A.; Quintano, C.; Roberts, D.A. Burn Severity Influence on Post-Fire Vegetation Cover Resilience from Landsat MESMA Fraction Images Time Series in Mediterranean Forest Ecosystems. Remote Sens. Environ. 2016, 184, 112–123. [Google Scholar] [CrossRef]
  18. Commission, F. Building Wildfire Resilience into Forest Management Planning; Forestry Commission: Columbia, SC, USA, 2014.
  19. Olson, R.L.; Bengston, D.N.; DeVaney, L.A.; Thompson, T.A.C. Wildland Fire Management Futures: Insights from a Foresight Panel; General Technical Report NRS-152; U.S. Department of Agriculture, Forest Service, Northern Research Station: Newtown Square, PA, USA, 2015; Volume 152, 44p. [CrossRef]
  20. Smith, A.M.S.; Kolden, C.A.; Paveglio, T.B.; Cochrane, M.A.; Bowman, D.M.; Moritz, M.A.; Kliskey, A.D.; Alessa, L.; Hudak, A.T.; Hoffman, C.M.; et al. The Science of Firescapes: Achieving Fire-Resilient Communities. BioScience 2016, 66, 130–146. [Google Scholar] [CrossRef]
  21. Holling, C.S. Resilience and Stability of Ecological Systems. Annu. Rev. Ecol. Syst. 1973, 4, 1–23. [Google Scholar] [CrossRef]
  22. Tedim, F.; Remelgado, R.; Borges, C.; Carvalho, S.; Martins, J. Exploring the Occurrence of Mega-Fires in Portugal. For. Ecol. Manag. 2013, 294, 86–96. [Google Scholar] [CrossRef]
  23. Hoegl, M.; Hartmann, S. Bouncing Back, If Not beyond: Challenges for Research on Resilience. Asian Bus. Manag. 2021, 20, 456–464. [Google Scholar] [CrossRef]
  24. Manyena, S.B. The Concept of Resilience Revisited. Disasters 2006, 30, 434–450. [Google Scholar] [CrossRef]
  25. Cutter, S.L.; Barnes, L.; Berry, M.; Burton, C.; Evans, E.; Tate, E.; Webb, J. A Place-Based Model for Understanding Community Resilience to Natural Disasters. Glob. Environ. Chang. 2008, 18, 598–606. [Google Scholar] [CrossRef]
  26. Norris, F.H.; Stevens, S.P.; Pfefferbaum, B.; Wyche, K.F.; Pfefferbaum, R.L. Community Resilience as a Metaphor, Theory, Set of Capacities, and Strategy for Disaster Readiness. Am. J. Community Psychol. 2008, 41, 127–150. [Google Scholar] [CrossRef]
  27. Reghezza-Zitt, M.; Rufat, S.; Djament-Tran, G.; Le Blanc, A.; Lhomme, S. What Resilience Is Not: Uses and Abuses Cybergeo: European Journal of Geography [Online], Environment, Nature, Landscape, Document 621, Online since 18 October 2012, Connection on 12 May 2024. Available online: http://journals.openedition.org/cybergeo/25554 (accessed on 21 March 2024). [CrossRef]
  28. Cretney, R. Resilience for Whom? Emerging Critical Geographies of Socio-Ecological Resilience. Geogr. Compass 2014, 8, 627–640. [Google Scholar] [CrossRef]
  29. Welsh, M. Resilience and Responsibility: Governing Uncertainty in a Complex World. Geogr. J. 2014, 180, 15–26. [Google Scholar] [CrossRef]
  30. Tierney, K. Resilience and the Neoliberal Project: Discourses, Critiques, Practices—And Katrina. Am. Behav. Sci. 2015, 59, 1327–1342. [Google Scholar] [CrossRef]
  31. Weichselgartner, J.; Kelman, I. Geographies of Resilience: Challenges and Opportunities of a Descriptive Concept. Prog. Hum. Geogr. 2015, 39, 249–267. [Google Scholar] [CrossRef]
  32. Southwick, S.M.; Bonanno, G.A.; Masten, A.S.; Panter-Brick, C.; Yehuda, R. Resilience Definitions, Theory, and Challenges: Interdisciplinary Perspectives. Eur. J. Psychotraumatol. 2014, 5, 25338. [Google Scholar] [CrossRef]
  33. Lindner, M.; Maroschek, M.; Netherer, S.; Kremer, A.; Barbati, A.; Garcia-Gonzalo, J.; Seidl, R.; Delzon, S.; Corona, P.; Kolström, M.; et al. Climate Change Impacts, Adaptive Capacity, and Vulnerability of European Forest Ecosystems. For. Ecol. Manag. 2010, 259, 698–709. [Google Scholar] [CrossRef]
  34. Duguy, B.; Alloza, J.A.; Baeza, M.J.; De la Riva, J.; Echeverría, M.; Ibarra, P.; Llovet, J.; Cabello, F.P.; Rovira, P.; Vallejo, R.V. Modelling the Ecological Vulnerability to Forest Fires in Mediterranean Ecosystems Using Geographic Information Technologies. Environ. Manag. 2012, 50, 1012–1026. [Google Scholar] [CrossRef]
  35. Paveglio, T.B.; Prato, T.; Edgeley, C.; Nalle, D. Evaluating the Characteristics of Social Vulnerability to Wildfire: Demographics, Perceptions, and Parcel Characteristics. Environ. Manag. 2016, 58, 534–548. [Google Scholar] [CrossRef]
  36. Ghorbanzadeh, O.; Blaschke, T.; Gholamnia, K.; Aryal, J. Forest Fire Susceptibility and Risk Mapping Using Social/Infrastructural Vulnerability and Environmental Variables. Fire 2019, 2, 50. [Google Scholar] [CrossRef]
  37. Bisson, M.; Fornaciai, A.; Coli, A.; Mazzarini, F.; Pareschi, M.T. The Vegetation Resilience After Fire (VRAF) Index: Development, Implementation and an Illustration from Central Italy. Int. J. Appl. Earth Obs. Geoinf. 2008, 10, 312–329. [Google Scholar] [CrossRef]
  38. Gómez-Sánchez, E.; de las Heras, J.; Lucas-Borja, M.; Moya, D. Assessing fire severity in semi-arid environments: Application in Donceles 2012 wildfire (SE Spain). Rev. Teledetección 2017, 49, 103–113. [Google Scholar] [CrossRef]
  39. Gorelick, N.; Hancher, M.; Dixon, M.; Ilyushchenko, S.; Thau, D.; Moore, R. Google Earth Engine: Planetary-Scale Geospatial Analysis for Everyone. Remote Sens. Environ. 2017, 202, 18–27. [Google Scholar] [CrossRef]
  40. Perilla, G.; Mas, J. Google Earth Engine (GEE): Una poderosa herramienta que vincula el potencial de los datos masivos y la eficacia del procesamiento en la nube. Investig. Geográficas 2020, 101, e59929. [Google Scholar] [CrossRef]
  41. Hansen, M.C.; Potapov, P.V.; Moore, R.; Hancher, M.; Turubanova, S.A.; Tyukavina, A.; Thau, D.; Stehman, S.V.; Goetz, S.J.; Loveland, T.R.; et al. High-Resolution Global Maps of 21st-Century Forest Cover Change. Science 2013, 342, 850–853. [Google Scholar] [CrossRef]
  42. Ferrara, C.; Salvati, L.; Corona, P.; Romano, R.; Marchi, M. The Background Context Matters: Local-Scale Socioeconomic Conditions and the Spatial Distribution of Wildfires in Italy. Sci. Total Environ. 2019, 654, 43–52. [Google Scholar] [CrossRef]
  43. Lambrou, N.; Kolden, C.; Loukaitou-Sideris, A.; Anjum, E.; Acey, C. Social Drivers of Vulnerability to Wildfire Disasters: A Review of the Literature. Landsc. Urban Plan. 2023, 237, 104797. [Google Scholar] [CrossRef]
  44. Higuera, P.E.; Metcalf, A.L.; Miller, C.; Buma, B.; McWethy, D.B.; Metcalf, E.C.; Ratajczak, Z.; Nelson, C.R.; Chaffin, B.C.; Stedman, R.C.; et al. Integrating Subjective and Objective Dimensions of Resilience in Fire-Prone Landscapes. BioScience 2019, 69, 379–388. [Google Scholar] [CrossRef]
  45. Marey-Perez, M.; Loureiro, X.; Corbelle-Rico, E.J.; Fernández-Filgueira, C. Different Strategies for Resilience to Wildfires: The Experience of Collective Land Ownership in Galicia (Northwest Spain). Sustainability 2021, 13, 4761. [Google Scholar] [CrossRef]
  46. Marino, E.; Hernando, C.; Planelles, R.; Madrigal, J.; Guijarro, M.; Sebastián, A.; Marino, E.; Hernando, C.; Planelles, R.; Madrigal, J.; et al. Forest Fuel Management for Wildfire Prevention in Spain: A Quantitative SWOT Analysis. Int. J. Wildland Fire 2014, 23, 373–384. [Google Scholar] [CrossRef]
  47. Moya, D.; Certini, G.; Fulé, P.Z.; Moya, D.; Certini, G.; Fulé, P.Z. Fire Regime and Ecosystem Responses: Adaptive Forest Management in a Changing World (Part 2). Int. J. Wildland Fire 2019, 28, 471–472. [Google Scholar] [CrossRef]
  48. Kottek, M.; Grieser, J.; Beck, C.; Rudolf, B.; Rubel, F. World Map of the Köppen-Geiger Climate Classification Updated. Meteorol. Z. 2006, 15, 259–263. [Google Scholar] [CrossRef]
  49. SIGA. Available online: https://sig.mapama.gob.es/siga/ (accessed on 30 November 2022).
  50. Soil Survey Staff. Keys to Soil Taxonomy, 13th ed.; USDA-Natural Resources Conservation Service: Washington, DC, USA, 2022.
  51. Masek, J.G.; Vermote, E.F.; Saleous, N.E.; Wolfe, R.; Hall, F.G.; Huemmrich, K.F.; Gao, F.; Kutler, J.; Lim, T.-K. A Landsat Surface Reflectance Dataset for North America, 1990–2000. IEEE Geosci. Remote Sens. Lett. 2006, 3, 68–72. [Google Scholar] [CrossRef]
  52. Vermote, E.; Justice, C.; Claverie, M.; Franch, B. Preliminary Analysis of the Performance of the Landsat 8/OLI Land Surface Reflectance Product. Remote Sens. Environ. 2016, 185, 46–56. [Google Scholar] [CrossRef] [PubMed]
  53. Zhu, Z. Change Detection Using Landsat Time Series: A Review of Frequencies, Preprocessing, Algorithms, and Applications. ISPRS J. Photogramm. Remote Sens. 2017, 130, 370–384. [Google Scholar] [CrossRef]
  54. PNOA. Geoportal Web Del Plan Nacional de Ortofotografía Aérea. Available online: https://pnoa.ign.es/ (accessed on 13 October 2022).
  55. MFE. Foto Fija del Mapa Forestal de España. Available online: https://www.miteco.gob.es/es/biodiversidad/temas/inventarios-nacionales/mapa-forestal-espana/foto_fija_mfe.aspx (accessed on 17 March 2023).
  56. USGS. Landsat Surface Reflectance-Derived Spectral Indices|U.S. Geological Survey. Available online: https://www.usgs.gov/landsat-missions/landsat-surface-reflectance-derived-spectral-indices (accessed on 17 March 2023).
  57. Bright, B.C.; Hudak, A.T.; Kennedy, R.E.; Braaten, J.D.; Henareh Khalyani, A. Examining Post-Fire Vegetation Recovery with Landsat Time Series Analysis in Three Western North American Forest Types. Fire Ecol. 2019, 15, 8. [Google Scholar] [CrossRef]
  58. Ba, R.; Song, W.; Lovallo, M.; Zhang, H.; Telesca, L. Informational Analysis of MODIS NDVI and EVI Time Series of Sites Affected and Unaffected by Wildfires. Phys. A Stat. Mech. Its Appl. 2022, 604, 127911. [Google Scholar] [CrossRef]
  59. Lasaponara, R.; Abate, N.; Fattore, C.; Aromando, A.; Cardettini, G.; Di Fonzo, M. On the Use of Sentinel-2 NDVI Time Series and Google Earth Engine to Detect Land-Use/Land-Cover Changes in Fire-Affected Areas. Remote Sens. 2022, 14, 4723. [Google Scholar] [CrossRef]
  60. Rouse, W.; Haas, R.H.; Schell, J.A.; Deering, D.W. Monitoring Vegetation Systems in the Great Plains with ERTS; NASA: Washington, DC, USA, 1974.
  61. Jin, S.; Sader, S.A. Comparison of Time Series Tasseled Cap Wetness and the Normalized Difference Moisture Index in Detecting Forest Disturbances. Remote Sens. Environ. 2005, 94, 364–372. [Google Scholar] [CrossRef]
  62. Normalized Burn Ratio (NBR)|UN-SPIDER Knowledge Portal. Available online: https://un-spider.org/advisory-support/recommended-practices/recommended-practice-burn-severity/in-detail/normalized-burn-ratio (accessed on 25 February 2021).
  63. Lutes, D.C.; Keane, R.E.; Caratti, J.F.; Key, C.H.; Benson, N.C.; Sutherland, S.; Gangi, L.J. FIREMON: Fire Effects Monitoring and Inventory System. In General Technical Report RMRS-GTR-164-CD; U.S. Department of Agriculture, Forest Service, Rocky Mountain Research Station. 1 CD: Fort Collins, CO, USA, 2006; p. 164. [Google Scholar] [CrossRef]
  64. Wilson, E.H.; Sader, S.A. Detection of Forest Harvest Type Using Multiple Dates of Landsat TM Imagery. Remote Sens. Environ. 2002, 80, 385–396. [Google Scholar] [CrossRef]
  65. Normalized Difference Moisture Index|U.S. Geological Survey. Available online: https://www.usgs.gov/landsat-missions/normalized-difference-moisture-index (accessed on 16 June 2022).
  66. Keeley, J.E. Fire Intensity, Fire Severity and Burn Severity: A Brief Review and Suggested Usage. Int. J. Wildland Fire 2009, 18, 11. [Google Scholar] [CrossRef]
  67. GEE Objects and Methods Overview|Google Earth Engine|Google Developers. Available online: https://developers.google.com/earth-engine/guides/objects_methods_overview (accessed on 17 March 2023).
  68. Frazier, R.J.; Coops, N.C.; Wulder, M.A.; Hermosilla, T.; White, J.C. Analyzing Spatial and Temporal Variability in Short-Term Rates of Post-Fire Vegetation Return from Landsat Time Series. Remote Sens. Environ. 2018, 205, 32–45. [Google Scholar] [CrossRef]
  69. Rothermel, R.C. A Mathematical Model for Predicting Fire Spread in Wildland Fuels; Research Paper. INT-115; U.S. Department of Agriculture, Intermountain Forest and Range Experiment Station: Ogden, UT, USA, 1972; Volume 115, 40p.
  70. Chuvieco, E.; Yebra, M.; Martino, S.; Thonicke, K.; Gómez-Giménez, M.; San-Miguel, J.; Oom, D.; Velea, R.; Mouillot, F.; Molina, J.R.; et al. Towards an Integrated Approach to Wildfire Risk Assessment: When, Where, What and How May the Landscapes Burn. Fire 2023, 6, 215. [Google Scholar] [CrossRef]
  71. Zhai, J.; Ning, Z.; Dahal, R.; Yang, S. Wildfire Susceptibility of Land Use and Topographic Features in the Western United States: Implications for the Landscape Management. Forests 2023, 14, 807. [Google Scholar] [CrossRef]
  72. Milazzo, F.; Fernández, P.; Peña, A.; Vanwalleghem, T. The Resilience of Soil Erosion Rates under Historical Land Use Change in Agroecosystems of Southern Spain. Sci. Total Environ. 2022, 822, 153672. [Google Scholar] [CrossRef] [PubMed]
  73. Chuvieco, E.; Martínez, S.; Román, M.V.; Hantson, S.; Pettinari, M.L. Integration of Ecological and Socio-Economic Factors to Assess Global Vulnerability to Wildfire. Glob. Ecol. Biogeogr. 2014, 23, 245–258. [Google Scholar] [CrossRef]
  74. Aretano, R.; Semeraro, T.; Petrosillo, I.; De Marco, A.; Pasimeni, M.R.; Zurlini, G. Mapping Ecological Vulnerability to Fire for Effective Conservation Management of Natural Protected Areas. Ecol. Model. 2015, 295, 163–175. [Google Scholar] [CrossRef]
  75. Francos, M.; Sánchez-García, C.; Girona-García, A.; Fernández-García, V. Influence of Topography on Sediment Dynamics and Soil Chemical Properties in a Mediterranean Forest Historically Affected by Wildfires: NE Iberian Peninsula. Environ. Earth Sci. 2021, 80, 436. [Google Scholar] [CrossRef]
  76. Ferreira, C.S.S.; Seifollahi-Aghmiuni, S.; Destouni, G.; Ghajarnia, N.; Kalantari, Z. Soil Degradation in the European Mediterranean Region: Processes, Status and Consequences. Sci. Total Environ. 2022, 805, 150106. [Google Scholar] [CrossRef]
  77. Hewelke, E.; Oktaba, L.; Gozdowski, D.; Kondras, M.; Olejniczak, I.; Górska, E.B. Intensity and Persistence of Soil Water Repellency in Pine Forest Soil in a Temperate Continental Climate under Drought Conditions. Water 2018, 10, 1121. [Google Scholar] [CrossRef]
  78. Lucas-Borja, M.E.; Plaza-Alvarez, P.A.; Xu, X.; Carra, B.G.; Zema, D.A. Exploring the Factors Influencing the Hydrological Response of Soil after Low and High-Severity Fires with Post-Fire Mulching in Mediterranean Forests. Int. Soil Water Conserv. Res. 2023, 11, 169–182. [Google Scholar] [CrossRef]
  79. Jiménez-Pinilla, P.; Lozano, E.; Mataix-Solera, J.; Arcenegui, V.; Jordán, A.; Zavala, L.M. Temporal Changes in Soil Water Repellency after a Forest Fire in a Mediterranean Calcareous Soil: Influence of Ash and Different Vegetation Type. Sci. Total Environ. 2016, 572, 1252–1260. [Google Scholar] [CrossRef]
  80. Spatola, M.F.; Borghetti, M.; Nolè, A. Elucidating Factors Driving Post-Fire Vegetation Recovery in the Mediterranean Forests Using Landsat Spectral Metrics. Agric. For. Meteorol. 2023, 342, 109731. [Google Scholar] [CrossRef]
  81. González-De Vega, S.; De las Heras, J.; Moya, D. Resilience of Mediterranean Terrestrial Ecosystems and Fire Severity in Semiarid Areas: Responses of Aleppo Pine Forests in the Short, Mid and Long Term. Sci. Total Environ. 2016, 573, 1171–1177. [Google Scholar] [CrossRef]
  82. Huerta, S.; Marcos, E.; Fernández-García, V.; Calvo, L. Resilience of Mediterranean Communities to Fire Depends on Burn Severity and Type of Ecosystem. Fire Ecol. 2022, 18, 28. [Google Scholar] [CrossRef]
  83. Karavani, A.; Boer, M.M.; Baudena, M.; Colinas, C.; Díaz-Sierra, R.; Pemán, J.; de Luis, M.; Enríquez-de-Salamanca, Á.; Resco de Dios, V. Fire-Induced Deforestation in Drought-Prone Mediterranean Forests: Drivers and Unknowns from Leaves to Communities. Ecol. Monogr. 2018, 88, 141–169. [Google Scholar] [CrossRef]
  84. Guerra, C.A.; Maes, J.; Geijzendorffer, I.; Metzger, M.J. An Assessment of Soil Erosion Prevention by Vegetation in Mediterranean Europe: Current Trends of Ecosystem Service Provision. Ecol. Indic. 2016, 60, 213–222. [Google Scholar] [CrossRef]
  85. Cerdà, A.; Lucas-Borja, M.E.; Franch-Pardo, I.; Úbeda, X.; Novara, A.; López-Vicente, M.; Popović, Z.; Pulido, M. The Role of Plant Species on Runoff and Soil Erosion in a Mediterranean Shrubland. Sci. Total Environ. 2021, 799, 149218. [Google Scholar] [CrossRef] [PubMed]
  86. Chatfield, C.; Xing, H. The Analysis of Time Series: An Introduction with R; CRC Press: Boca Raton, FL, USA, 2019. [Google Scholar]
  87. Mann, H.B. Nonparametric Tests Against Trend. Econometrica 1945, 13, 245–259. [Google Scholar] [CrossRef]
  88. Said, S.E.; Dickey, D.A. Testing for Unit Roots in Autoregressive-Moving Average Models of Unknown Order. Biometrika 1984, 71, 599–607. [Google Scholar] [CrossRef]
  89. Posit Team R Studio: Integrated Development Environment for R. Posit Software, PBC, Boston, MA. 2024. Available online: http://www.posit.co/ (accessed on 31 January 2024).
  90. Wickham, H.; François, R.; Henry, L.; Müller, K.; Vaughan, D. Posit. PBC Dplyr: A Grammar of Data Manipulation 2023. R Package Version 1.1.4. Available online: https://github.com/tidyverse/dplyr; https://dplyr.tidyverse.org (accessed on 31 January 2024).
  91. Wickham, H. Ggplot2: Elegant Graphics for Data Analysis; Springer: New York, NY, USA, 2016; ISBN 978-3-319-24277-4. [Google Scholar]
  92. Sankey, T.; Belmonte, A.; Massey, R.; Leonard, J. Regional-Scale Forest Restoration Effects on Ecosystem Resiliency to Drought: A Synthesis of Vegetation and Moisture Trends on Google Earth Engine. Remote Sens. Ecol. Conserv. 2021, 7, 259–274. [Google Scholar] [CrossRef]
  93. Petropoulos, G.P.; Griffiths, H.M.; Kalivas, D.P. Quantifying Spatial and Temporal Vegetation Recovery Dynamics Following a Wildfire Event in a Mediterranean Landscape Using EO Data and GIS. Appl. Geogr. 2014, 50, 120–131. [Google Scholar] [CrossRef]
  94. Hao, B.; Xu, X.; Wu, F.; Tan, L. Long-Term Effects of Fire Severity and Climatic Factors on Post-Forest-Fire Vegetation Recovery. Forests 2022, 13, 883. [Google Scholar] [CrossRef]
  95. Zhao, Q.; Yu, L.; Li, X.; Peng, D.; Zhang, Y.; Gong, P. Progress and Trends in the Application of Google Earth and Google Earth Engine. Remote Sens. 2021, 13, 3778. [Google Scholar] [CrossRef]
  96. Petropoulos, F.; Apiletti, D.; Assimakopoulos, V.; Babai, M.Z.; Barrow, D.K.; Ben Taieb, S.; Bergmeir, C.; Bessa, R.J.; Bijak, J.; Boylan, J.E.; et al. Forecasting: Theory and Practice. Int. J. Forecast. 2022, 38, 705–871. [Google Scholar] [CrossRef]
  97. Liu, W.; Guan, H.; Hesp, P.A.; Batelaan, O. Remote Sensing Delineation of Wildfire Spatial Extents and Post-Fire Recovery along a Semi-Arid Climate Gradient. Ecol. Inform. 2023, 78, 102304. [Google Scholar] [CrossRef]
  98. Robinson, N.P.; Allred, B.W.; Jones, M.O.; Moreno, A.; Kimball, J.S.; Naugle, D.E.; Erickson, T.A.; Richardson, A.D. A Dynamic Landsat Derived Normalized Difference Vegetation Index (NDVI) Product for the Conterminous United States. Remote Sens. 2017, 9, 863. [Google Scholar] [CrossRef]
  99. Hird, J.N.; Kariyeva, J.; McDermid, G.J. Satellite Time Series and Google Earth Engine Democratize the Process of Forest-Recovery Monitoring over Large Areas. Remote Sens. 2021, 13, 4745. [Google Scholar] [CrossRef]
  100. Meng, Y.; Wei, C.; Guo, Y.; Tang, Z. A Planted Forest Mapping Method Based on Long-Term Change Trend Features Derived from Dense Landsat Time Series in an Ecological Restoration Region. Remote Sens. 2022, 14, 961. [Google Scholar] [CrossRef]
  101. Viana-Soto, A.; Aguado, I.; Salas, J.; García, M. Identifying Post-Fire Recovery Trajectories and Driving Factors Using Landsat Time Series in Fire-Prone Mediterranean Pine Forests. Remote Sens. 2020, 12, 1499. [Google Scholar] [CrossRef]
  102. Cohen, W.B.; Yang, Z.; Kennedy, R. Detecting Trends in Forest Disturbance and Recovery Using Yearly Landsat Time Series: 2. TimeSync—Tools for Calibration and Validation. Remote Sens. Environ. 2010, 114, 2911–2924. [Google Scholar] [CrossRef]
  103. João, T.; João, G.; Bruno, M.; João, H. Indicator-Based Assessment of Post-Fire Recovery Dynamics Using Satellite NDVI Time-Series. Ecol. Indic. 2018, 89, 199–212. [Google Scholar] [CrossRef]
  104. Pironkova, Z.; Whaley, R.; Lan, K. Time Series Analysis of Landsat NDVI Composites with Google Earth Engine and R: User Guide—Science and Research Technical Manual TM-06; Ontario Ministry of Natural Resources and Forestry, Science and Research Branch: Peterborough, ON, Canada, 2018; Volume 39, p. 39. [Google Scholar] [CrossRef]
  105. Forkel, M.; Carvalhais, N.; Verbesselt, J.; Mahecha, M.; Neigh, C.; Reichstein, M. Trend Change Detection in NDVI Time Series: Effects of Inter-Annual Variability and Methodology. Remote Sens. 2013, 5, 2113–2144. [Google Scholar] [CrossRef]
  106. Rodrigues, M.; Ibarra, P.; Echeverría, M.; Pérez-Cabello, F.; Riva, J. de la A Method for Regional-Scale Assessment of Vegetation Recovery Time after High-Severity Wildfires: Case Study of Spain. Prog. Phys. Geogr. Earth Environ. 2014, 38, 556–575. [Google Scholar] [CrossRef]
  107. Arrogante-Funes, F.; Aguado, I.; Chuvieco, E. Global Assessment and Mapping of Ecological Vulnerability to Wildfires. Nat. Hazards Earth Syst. Sci. 2022, 22, 2981–3003. [Google Scholar] [CrossRef]
  108. Tavakkoli Piralilou, S.; Einali, G.; Ghorbanzadeh, O.; Nachappa, T.G.; Gholamnia, K.; Blaschke, T.; Ghamisi, P. A Google Earth Engine Approach for Wildfire Susceptibility Prediction Fusion with Remote Sensing Data of Different Spatial Resolutions. Remote Sens. 2022, 14, 672. [Google Scholar] [CrossRef]
  109. Ortega, M.; Saura, S.; González-Avila, S.; Gómez-Sanz, V.; Elena-Rosselló, R. Landscape Vulnerability to Wildfires at the Forest-Agriculture Interface: Half-Century Patterns in Spain Assessed through the SISPARES Monitoring Framework. Agrofor. Syst. 2012, 85, 331–349. [Google Scholar] [CrossRef]
Figure 1. (a) Location of Albacete Province and the study site in Spain. (b) Recovery regions based on fire severity and recurrence: areas with high severity in 2017 but not in 1994 (UB94-HS17), areas with high severity in 1994 but not in 2017 (HS94-UB17), areas with high severity in both fires (HS94-HS17), and areas unaffected by either fire (UB94-UB17). The reference coordinate system is ETRS89 (EPSG:25830).
Remotesensing 16 01718 g001
Figure 2. Methodology flowchart.
Remotesensing 16 01718 g002
Figure 3. NDVI time-series graphs by region (UB94-HS17; HS94-UB17; HS94-HS17; UB94-UB17) from 1990 to 2023.
Remotesensing 16 01718 g003
Figure 4. NDMI time-series graphs by region (UB94-HS17; HS94-UB17; HS94-HS17; UB94-UB17) from 1990 to 2023.
Remotesensing 16 01718 g004
Figure 5. NBR time-series graphs by region (UB94-HS17; HS94-UB17; HS94-HS17; UB94-UB17) from 1990 to 2023.
Remotesensing 16 01718 g005
Figure 6. Boxplots of each recovery region (from 1990 to 2023) using all spectral indices calculated (NDVI, NDMI, NBR). The black dots represent abnormal observations. Not sharing a letter indicates statistically significant differences.
Remotesensing 16 01718 g006
Figure 7. Comparison of NDVI values from different recovery regions (UB94-HS17; HS94-UB17; HS94-HS17; UB94-UB17) derived from remote sensors (GEE) with NDVI values obtained from field measurements (LAI). Not sharing a letter indicates statistically significant differences. The black solid circles represent outliers.
Remotesensing 16 01718 g007
Figure 8. (a) Location of Albacete Province and the study site in Spain; (b) Vegetation Resilience After Fire (VRAF) index and (c) Vulnerability to Fire (V2FIRE) index for each recovery region (UB94-HS17; HS94-UB17; HS94-HS17; UB94-UB17).
Remotesensing 16 01718 g008
Figure 9. Correlation analysis between fire severity (dNBR) and slope gradient (%).
Remotesensing 16 01718 g009
Table 1. Summary and descriptions of the image collections used in this study.
SensorTimeframeNumber of Images
Landsat 5 (L5)16 January 1990–9 October 2011158
Landsat 7 (L7)10 October 2011–24 February 201313
Landsat 8 (L8)25 February 2013–20 October 202182
Landsat 9 (L9)21 October 2021–25 April 202317
Table 3. Summary of the metric equations used to compare the recovery rates of each region.
MetricEquationDescription
Relative Recovery
Indicator (RRI)
M a x ( I n d e x y + 5 ,   I n d e x y + 4 )     I n d e x y 0 I n d e x p r e     I n d e x y 0 Compare the disturbance magnitude to the recovery magnitude five years post-disturbance.
Ratio of Eighty
Percent (R80P)
M a x ( I n d e x y + 5 ,   I n d e x y + 4 ) I n d e x p r e   ×   0.8 Represent the amount of spectral recovery relative to the pre-disturbance situation.
Year-on-Year
average (YrYr)
I n d e x y + 5     I n d e x y 0 5 Average rate of spectral change from the year of disturbance.
Table 4. Description of the indicators and corresponding values assigned to each parameter to calculate the V2FIRE index.
IndicatorHigh Vulnerability (3)Medium Vulnerability (2)Low Vulnerability (1)
Slope (SL)>45%15–45%<15%
Aspect (A)Southwest–southeastNortheast–southeast; southwest–northwestNorthwest–northeast
Fuel types (FTs)FT4; FT7; FT6; FT5FT3; FT2; FT1FT8; FT9, FT12
Singularity (SN)Protected areas or proximity to SPAs/SACs Typical landscapes with relative significanceAreas without visual richness
Soil (S)Hilly grave soils; calcareous soilsSilty clay soils;
non-calcareous soils
Organic soils; alluvial soils
Vegetation (V)Transition communities; protected ecosystemsPine forestsDeciduous forest; Mediterranean macchia
Table 5. Changes in the mean values of spectral indices (NDVI, NDMI, and NBR) for each recovery region (UB94-HS17; HS94-UB17; HS94-HS17; UB94-UB17) in different periods: before the 1994 fire (from 1990 to 1994), just after the 1994 fire (from 1994–2000), before the 2017 fire (from 1998–2017), and after the fire of 2017 (from 2017 to 2023).
Before 1994 Fire (1990–1994)After 1994 Fire (1994–2000)Before 2017 Fire (2000–2017)After 2017 Fire (2017–2023)
Spectral IndexRecovery RegionMeansdMeansdMeansdMeansd
NDVIUB94-HS170.4330.0400.4730.0670.5370.0730.3120.059
HS94-UB170.4390.0470.2940.0880.4710.0840.5910.068
HS94-HS170.4750.0540.2960.0880.4910.0860.3550.083
UB94-UB170.3470.0330.3580.0510.4150.0620.4900.055
NDMIUB94-HS170.0790.0400.1040.0690.1680.056−0.0780.098
HS94-UB170.1330.079−0.0610.1260.0710.0680.1850.080
HS94-HS170.1430.066−0.1010.1000.0830.070−0.0670.090
UB94-UB170.0420.0550.0280.0660.0430.0510.1020.056
NBRUB94-HS170.2850.0470.3190.0750.3880.0580.0510.119
HS94-UB170.3680.0860.0870.1850.2900.0760.4110.085
HS94-HS170.3800.0770.0440.1540.3020.0810.0730.141
UB94-UB170.2380.0630.2200.0700.2430.0560.3030.060
Table 6. Analysis of trends and stationarity of time series for each region; “z” is the time-series trend test statistic. A positive “z” implies an ascending trend, while a negative “z” suggests a declining trend.
Spectral IndexRecovery RegionMann-Kendall (z)p-ValueTrendUnit Root Test (p-Value)Stationarity
NDVIUB94-HS17−0.2740.78400.48No
HS94-UB1712.7700.000+0.05Yes
HS94-HS170.5000.61700.34No
UB94-UB1713.6090.000+0.01Yes
NDMIUB94-HS171.0500.29400.46No
HS94-UB177.6410.000+0.09Yes
HS94-HS17−2.8060.0050.35No
UB94-UB177.1900.000+0.01Yes
NBRUB94-HS170.4570.64800.40No
HS94-UB177.1920.000+0.11No
HS94-HS17−3.5610.0000.26No
UB94-UB177.1920.000+0.01Yes
Table 7. NDVI–LAI model validation. Model trends to estimate the NDVI results with the parameters measured in the field.
ModelR2RMSE (%)
NDVI = –0.0317 × LAI2 + 0.2389 × LAI + 0.16330.5613–29%
Table 8. Comparison between recovery indicators (Relative Recovery Indicator, RRI; Ratio of Eighty Percent, R80P; and Year-on-Year Average, YrYr) after the 1994 and 2017 wildfires across the different recovery areas (UB94-HS17; HS94-UB17; HS94-HS17; UB94-UB17).
1994 Fire2017 Fire
Spectral IndexRecovery RegionRRIR80PYrYrRRIR80PYrYr
NDVIUB94-HS174.061.660.020.490.840.03
HS94-UB171.011.260.045.511.640.02
HS94-HS170.901.160.040.821.100.05
UB94-UB172.911.590.028.371.630.01
NDMIUB94-HS176.825.170.020.881.000.02
HS94-UB171.302.280.065.223.580.02
HS94-HS171.051.420.040.770.590.04
UB94-UB172.604.100.015.604.410.01
NBRUB94-HS176.972.360.020.800.930.05
HS94-UB171.101.460.105.562.150.03
HS94-HS170.951.160.080.790.840.07
UB94-UB172.411.830.026.512.090.01
Table 9. Comparison between resilience after fire (VRAF index) and vulnerability to fire (V2FIRE index) for each recovery region: UB94-HS17, HS94-UB17, HS94-HS17, and UB94-UB17.
VRAF IndexV2FIRE Index
Recovery RegionMinMaxMeanSDMinMaxMeanSD
UB94-HS171.622.902.070.2011.0017.0014.211.04
HS94-UB171.622.902.230.2211.0017.0014.281.09
HS94-HS171.622.902.110.2212.0017.0014.991.06
UB94-UB171.623.302.240.259.0017.0013.641.31
Disclaimer/Publisher’s Note: The statements, opinions and data contained in all publications are solely those of the individual author(s) and contributor(s) and not of MDPI and/or the editor(s). MDPI and/or the editor(s) disclaim responsibility for any injury to people or property resulting from any ideas, methods, instructions or products referred to in the content.

