Abstract
The loss of life and property in economically developed areas due to geological hazards caused by intense ground subsidence is incalculable. As one of the fastest growing areas in the Guangdong-Hong Kong-Macao Greater Bay Area, the study of ground subsidence in Nansha will help to provide a scientific basis for urban planning and improve the capacity of monitoring and prevention of ground subsidence. The combination of coastal soft soil foundation and urbanization conditions creates a certain risk of land subsidence. We chose Nansha District, the geographical center of the Greater Bay Area, as the study area to analyze its surface subsidence characteristics in recent years. The 20-view Sentinel-1A data and SBAS-InSAR technique were used to monitor the ground subsidence in Nansha from 2017 to 2023. The main rate of ground subsidence in Nansha ranges from −19.4 to 7.7 mm/yr and is distributed in the urban area, along the rivers, in the construction area, and in the reclamation area. As of 4 May 2023, the average ground settlement in Nansha is 10.05 mm and the maximum settlement can be up to 142.45 mm. The 6-year total settlement at all four settlement intensities is greater than 60 mm, with the highest value exceeding 110 mm. The cumulative settlement increases with time, but inverse settlement and no settlement also occur at points where settlement is severe. For settlement caused by soft soil consolidation, it is recommended that drainage pipes be installed to accelerate drainage as a means of stabilizing settlement. For settlement caused by groundwater extraction and additional loads on the road surface, it is recommended to rationally extract groundwater and reinforce the foundation of the road surface with severe settlement.
1. Introduction
Ground subsidence is a slow and continuous process that occurs all the time in every corner of the earth [1]. Severe ground subsidence can bring disasters to human beings, such as road collapse, building cracks and damage, and seawater inundation in coastal cities [2,3]. Therefore, investigating the phenomenon and mechanism of urban subsidence can help us to better cope with the disasters caused by ground subsidence. The Guangdong-Hong Kong-Macao Greater Bay Area is one of the most highly developed urban agglomerations in China and even in the world. The problem of land subsidence in this area is of great significance for research. Located in the southern part of Guangzhou right at the geometric center of the Greater Bay Area and situated at the supporting position of the “A” shape formed by Guangzhou, Hong Kong, and Macao, Nansha District is the hub connecting the city groups on the banks of the Pearl River Estuary. In this paper, Nansha is taken as the study area to investigate the ground subsidence and the causes of subsidence from 2017 to 2023. The coastal cities in the Greater Bay Area are highly economically developed and are in the Pearl River Delta region, which is affected by ground subsidence. Its ground subsidence characteristics have not been adequately studied, so we chose Nansha District, the center of the Greater Bay Area, for the ground subsidence study. Ground subsidence in coastal cities consists of two main difficulties. On the one hand, the causes of ground subsidence are complex and are influenced by multiple factors, such as sea level rise, groundwater extraction, and geological formations. On the other hand, the monitoring technology is limited, and the monitoring of ground subsidence in coastal cities requires high-precision monitoring equipment and technology. In this paper, the effects of geological structure, groundwater exploitation, and human engineering activities on ground subsidence were deeply analyzed in terms of the causes of subsidence. In terms of monitoring technology, SBAS-InSAR technology can realize large-area, high-precision, and continuous ground subsidence monitoring work. It solved the problem that traditional ground subsidence monitoring cannot realize large-area, high-resolution, and high-repeatability monitoring. These research results can provide a geological basis for the planning and construction of this city, and ultimately improve the level of ground subsidence prevention and control in Nansha District. This study will help Nansha to better prevent disasters caused by ground subsidence, protect people’s safety and property, and help Nansha to better develop into the new core area of Guangzhou city.
Three methods, D-InSAR, SBAS-InSAR, and PS-InSAR, are available within the SARScape for generating maps of the rate of average ground subsidence and subsidence time series. Table 1 provides the advantages and disadvantages of these three methods in terms of the application range, accuracy, and data processing. Since this paper studies urban ground settlement, which is a moderate range of deformation monitoring, the SBAS-InSAR method is chosen. The D-InSAR dual-track method is based on SAR imagery and DEM data from two time periods in the study area to analyze the ground subsidence at the latter time. D-InSAR calculates the phase difference between images taken at different times before and after the event [4,5]. The D-InSAR technique and its GNSS-optimized D-InSAR technique are often used to monitor ground subsidence caused by mining [6,7,8]. Fan et al. [9] proposed a new algorithm for extracting large deformation mining subsidence using the D-InSAR technique and the probabilistic integration method, with a relative error of 8.3% for the maximum subsidence point, which is much better than the traditional D-InSAR (the relative error is 68.0%). PS-InSAR and SBAS-InSAR require multiple images compared to D-InSAR, and the more images there are the higher the accuracy of the output results. PS-InSAR technology has a wider coverage and more intensive measurements than traditional geodetic methods [10]. The PS method analyzes the interferograms generated from public images to find target points that remain stable over time, generating signals that remain coherent from one acquisition to the next. Whereas PS results are more susceptible to noise, SBAS is able to mitigate noise by imposing spatial and temporal constraints on the choice of the interferogram. The SBAS method relies on small baseline interferograms that maximize spatial and temporal coherence. SBAS analysis is more suitable for geological studies as it maximizes consistency and mitigates noise over large areas [1]. The SBAS-based decomposition method can significantly reduce the positional offset of single-track SBAS and improve monitoring accuracy [11]. Differential settlement maps obtained by the SBAS method describe localized features related to urban construction and infrastructure, while the PS method quantitatively describes the movement of individual targets [12]. For deformation monitoring along oil and gas pipelines, SBAS outperforms PS-InSAR in terms of complete coverage of measurement points, reduced dispersion of results, and ground deformation rates that are closer to historical GPS measurements [13]. In terms of deformation mapping displacement, the DS-InSAR method fusing PS points has an advantage over PS-InSAR and SBAS-InSAR methods because of the higher density of MPs [14]. Zhang et al. proposed a combined PS-InSAR and SBAS-InSAR method by fusing data from different interferometric measurements in different radar reflection regions [15]. Most of the studies compare the performance of PS-InSAR and SBAS-InSAR on ground subsidence results in the same area and validate each other [16,17,18,19,20].

Table 1.
Advantages and disadvantages of InSAR methods in terms of application range, accuracy, and data processing.
Ground settlement can be caused by a variety of factors, including the extraction of groundwater, natural gas, and mineral resources, as well as the consolidation of soft subsurface soils, and highway loading, to name a few. Table 2 shows the literature statistics on data, methods, and causes of ground settlement in some countries. Our research area is located in Nansha District, Guangzhou City, Guangdong Province, China. Due to frequent groundwater extraction and underground excavation, the average ground displacement ranged from −35 mm/yr (subsidence) to 10 mm/yr (uplift) in Guangzhou and Foshan City from 2011–2017 [21]. Using the IPTA (Interferometric Point Target Analysis) technique to analyze the ASAR (Advanced Synthetic Aperture Radar) imagery from 2007–2008, the maximum subsidence rate in Guangzhou city ranges from −26 mm/yr to −20 mm/yr, with three main spatially distributed subsidence zones in the central-western, eastern, and south-western parts of the city [22]. According to PSI (persistent scatterer interferometry) measurements, the fastest settlement rate in Nansha District during the period of February 2012–August 2013 was over 20 mm/yr for industrial areas, between −15 mm/yr and −10 mm/yr for new traffic roads, and very serious settlement in and around illegal self-built houses in rural areas due to the lack of soft foundation treatment [23]. Widely distributed sediments and rapid urbanization in the Greater Bay Area have led to the simultaneous occurrence of large- and small-scale subsidence [24]. Nansha District is a region with very significant soft ground characteristics along the delta coast, and various settlement effects and factors can make a good case for the region. Settlement in other coastal areas may be spotty and not as pronounced. Therefore, we finally chose Nansha District as our study case.
Table 2.
Literature statistics on data, methods, and causes of ground settlement abroad.
This paper is organized as below. Section 2 consists of four subsections; Section 2.1 is an overview of the study area; Section 2.2 is data and software; Section 2.3 is the principles of SBAS-InSAR; and Section 2.4 is the operational procedures of SBAS-InSAR. Section 3 also consists of four subsections; Section 3.1 is the analysis of the rate of ground settlement; Section 3.2 is the analysis of the cumulative ground settlement; Section 3.3 is the characterization of the temporal variations of the regional settlement; and Section 3.4 is the investigation of the accuracy of the ground settlement. The analysis of the causes of ground settlement in Section 4 mainly includes the effects of geological conditions in Section 4.1 and the effects of human engineering activities in Section 4.2.
2. Materials and Methods
2.1. Overview of the Study Area
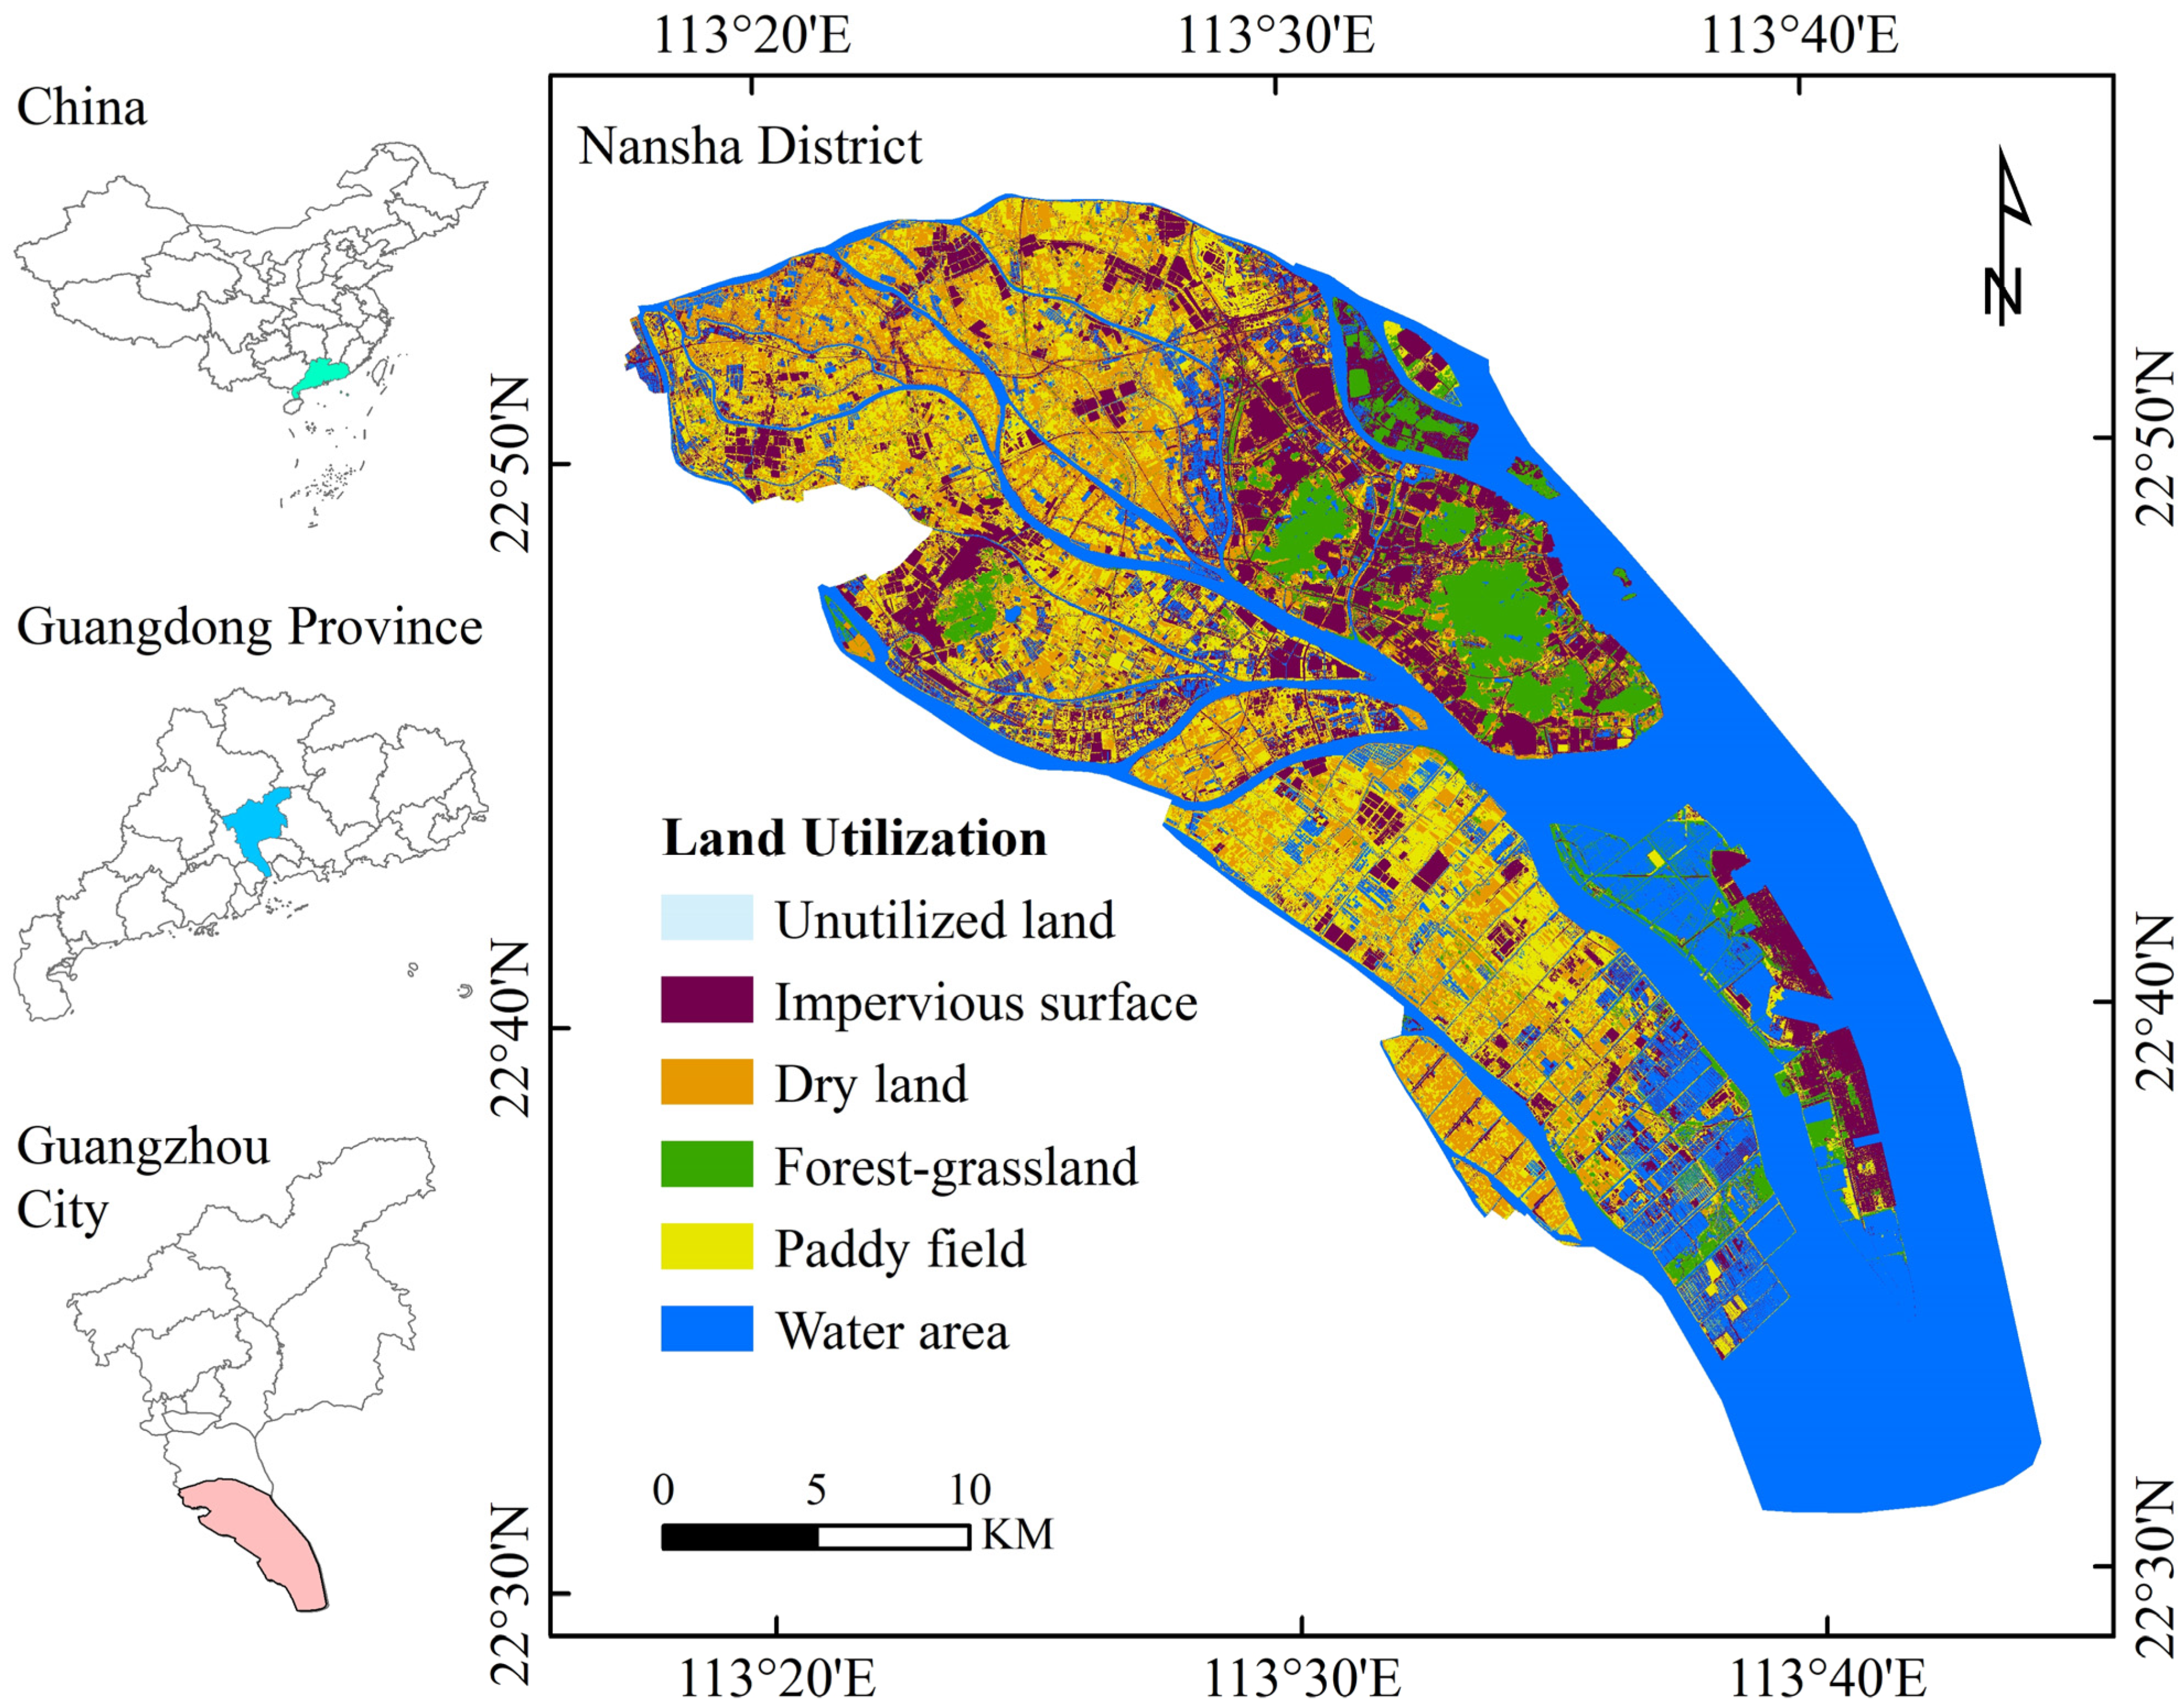
Nansha was originally an ancient bay with continuous seawater and scattered islands. After several changes in the ocean plane, sand and silt are deposited and gradually become flat land. Nansha District is a municipal district of Guangzhou City, Guangdong Province. It is located in the river network area of the Pearl River Delta and is the outlet of the Xijiang, Beijiang, and Dongjiang rivers. Its location borders the Lion Ocean to the east and flows south into the South China Sea. The whole area is mainly plain and densely covered with rivers and ponds. Nansha District covers a total area of 803 km2, of which the land area and the outer river waterway area are 580 km2 and 223 km2, respectively. Nansha District belongs to a subtropical monsoon Marine climate. Due to the back of the mountains facing the sea, the oceanic climate is mild and humid, with warm and rainy and hot and sunny conditions, small temperature differences, long summers, and other climatic characteristics. Nansha District consists of three streets and six towns, namely Nansha Street, Zhujiang Street, Longxue Street, Dongchong Town, Lanhe Town, Dagang Town, Huangge Town, Hengli Town, and Wanqingsha Town [34]. By the end of 2021, the resident population of Nansha District was 900,400, the household population was 517,500, and the GDP was RMB 2883.9 billion, with the population and GDP accounting for 4.8% and 7.8% of the city of Guangzhou, respectively. Figure 1 shows the location distribution and land use of Nansha District.

Figure 1.
Location distribution and land use in Nansha District. The land use was obtained by interpreting the GF-1 PMS data for the year 2022 with a spatial accuracy of 2 m. The remote-sensing interpretation method used was the support vector machine algorithm with supervised classification. The decoded land use was corrected by visual decoding and field visit correction. The overall accuracy of the sampling validation was greater than 90%, with a Kappa coefficient greater than 0.85 [35].
2.2. Data and Software
Synthetic aperture radar (SAR) data were derived from the European Space Agency (ESA) 20-scene Sentinel-1 interferometric wide-area IW mode imagery. The pixel resolution of the interferometric wide mode imagery was 5 m (azimuthal) × 20 m (distance) with a width of 250 km and a revisit period of 12 days [36]. Compared with other SAR data, Sentinel-1 is used more because it is free and open source and can be analyzed with the help of SARScape. Shorter-period open SAR data with global coverage have been launched continuously in recent years, notably the free and open-source Sentinel-1 satellite, which was launched by the ESA in 2014. It carries a C-band synthetic aperture radar (SAR) and has an interferometric baseline well below the critical limit. As a result, it is no longer subject to strong spatial de-correlation images and provides a large source of continuously archived data for ground subsidence monitoring. It not only meets the needs of regional subsidence monitoring but also enables the monitoring of small deformations at fine scales.
Sentinel-1 has an average incidence angle of approximately 42° in the Nansha District, and the isotropic VV polarization provides better reception of radar waves reflected from ground objects [37]. And with the increase in sensor wavelength, the radar signal penetrates deeper. The microwave remote sensing imaging modality, which works almost all day, can also penetrate some degree of cloud cover, vegetation, and topsoil. Since Sentinel-1 is a C-band radar, its shorter wavelength and high sensitivity enable high-precision monitoring of small deformations during the revisit cycle. In addition, the strict orbit control is also conducive to SAR image alignment. Orbital positioning adopts POD precision orbiting ephemeris. This is the most accurate orbit data for Sentinel-1, and the positioning accuracy is better than 5 cm, which is used to remove the systematic errors caused by orbit errors. The reference Digital Elevation Model (DEM) uses SRTM 30 m spatial resolution data, which is used to remove errors caused by terrain on the interferometric phase. Table 3 shows the description of the research data and Table 4 shows the parameters related to the SAR data in the experimental area. The SBAS-InSAR model was run using SARScape 5.2.1 [38]. The results were presented and plotted using QGIS 3.34.
Table 3.
Description of research data.
Table 4.
Parameters related to SAR data in the experimental area.
2.3. SBAS-InSAR Principle
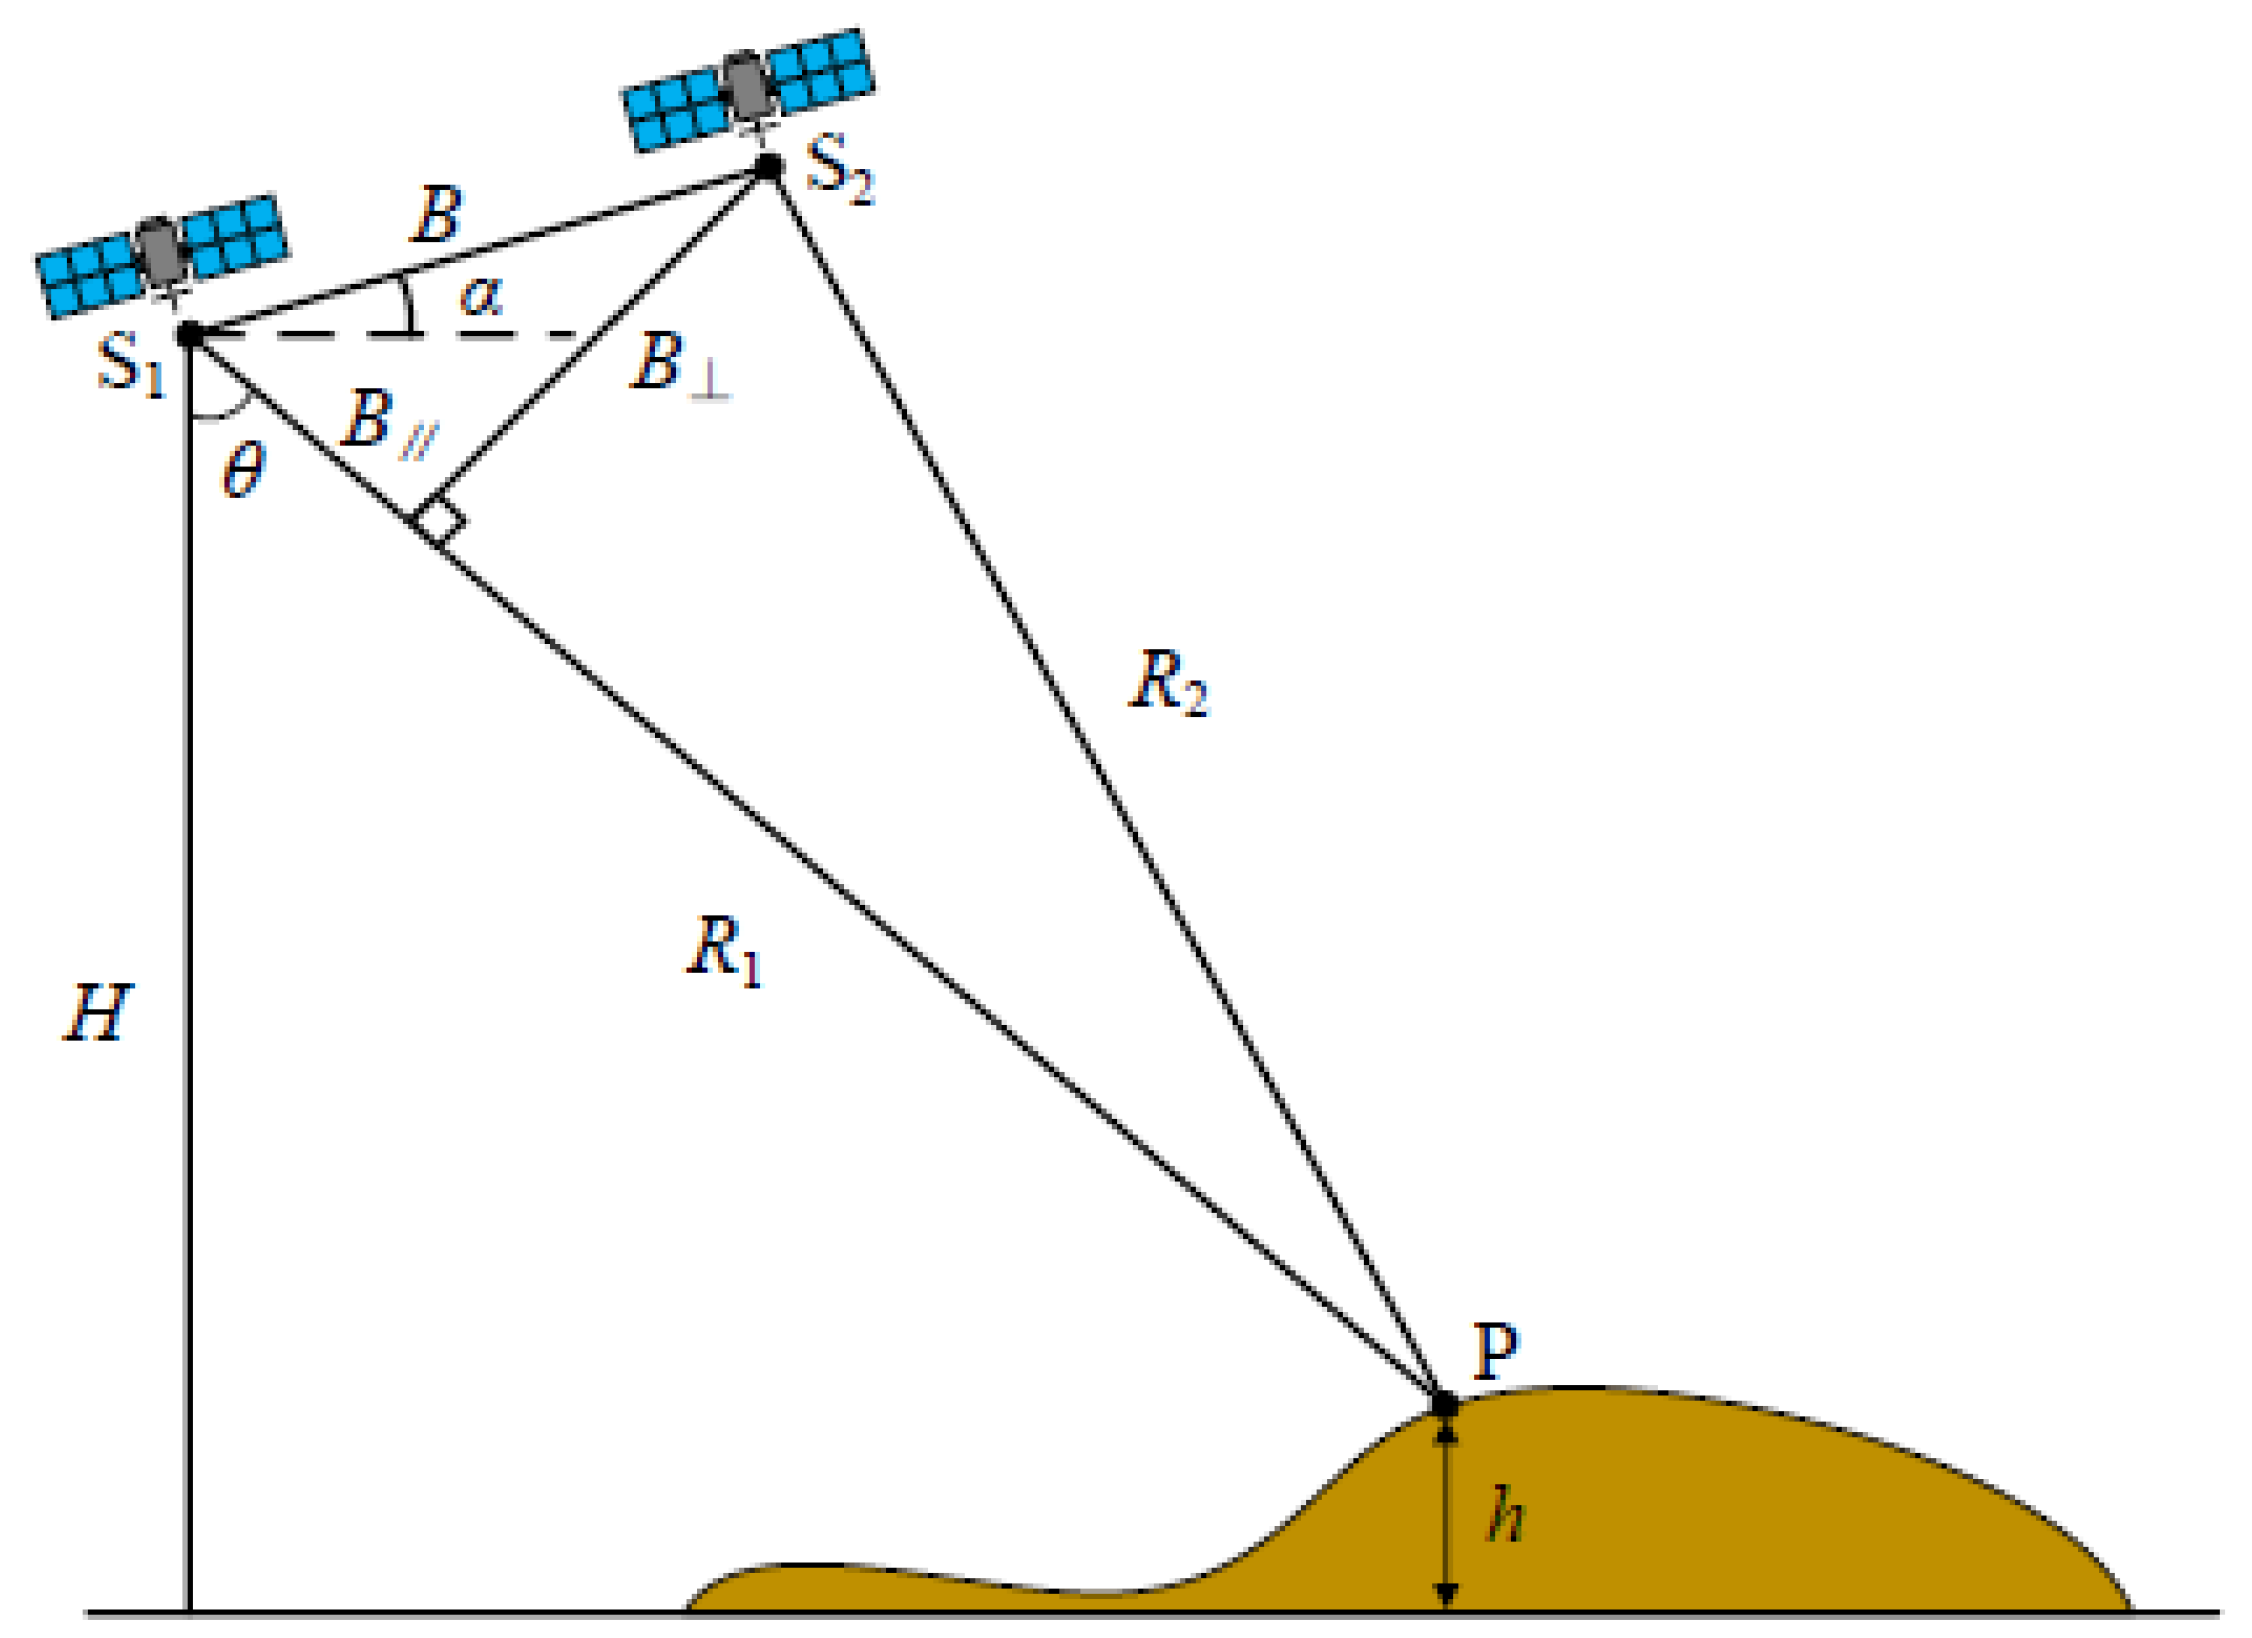
InSAR obtains the distance from the satellite to the ground target (i.e., slant distance) by observing the phase difference between two electromagnetic wave echo signals at different times in the same area on the ground, and then calculates the elevation or deformation information of the ground target. In Figure 2, S1 and S2 are the positions of the satellite at the two imaging times before and after, and P is the ground observation point. The slant distance difference is an important observation in SAR interferometry, reflecting the sum of contributions from many factors such as interferometric geometry, reference ellipsoid, terrain relief, and ground displacement during the two imaging times. Especially when the meteorological conditions at the two imaging moments are different, the electromagnetic wave will be deflected to different degrees during the propagation process between the radar and the ground, so that the contribution of atmospheric delay is included in the slant distance difference. Therefore, the phase contribution of the interferometric phase ϕ comes mainly from the reference ellipsoid trend, terrain undulation variations, surface deformation during the two imaging times, atmospheric delays, and other noises.

Figure 2.
InSAR technology principles [39].
In 2002, Berardino et al. [40,41] proposed the small baseline subset InSAR (SBAS-InSAR) method. The basic idea is to follow the principle of a small baseline distance within the subset and a large baseline distance between the subsets. All images are paired according to a certain spatial-temporal baseline threshold to obtain a number of subsets, and the singular value decomposition (SVD) method is used to solve several small baseline subsets together.
SAR image maps of N + 1 spokes covering the same area are combined with interferometric pairs according to the conditions of the spatial baseline and the temporal baseline to obtain M differential interferograms. To simplify the model, the decoherence factor, elevation error, atmospheric error, and other factors are neglected, and then the phase value of the image element in the j differential interferogram is:
where is the wavelength of the radar; and are the deformations of the image element along the radar line-of-sight direction at times and , respectively. The phase of the differential interferogram is deconvolved and is the phase value relative to the deconvolved reference point. The corresponding time series of the major and secondary images are:
If the major and secondary images are arranged in a time series, i.e., , the set of equations contains M equations with N unknowns, and the phase in the differential interferogram is expressed as follows:
is a singular matrix if the baseline set contains multiple subsets. If there are N distinct subsets of the baseline set, then the rank of the matrix A is N − L + 1. For matrix A, singular value decomposition is obtained:
where U is an M*N orthogonal matrix; the diagonal elements of are singular values . The least-squares paradigm solution of Equation (4) is:
Upon converting the phase solution into a phase change velocity solution, the parameter vector to be solved is denoted as:
Based on singular value decomposition, removing the DEM error and the atmospheric phase, the average velocity V during each time period can be solved, and integrating it into the time domain yields the time-series shape variable.
2.4. SBAS-InSAR Operation Procedure
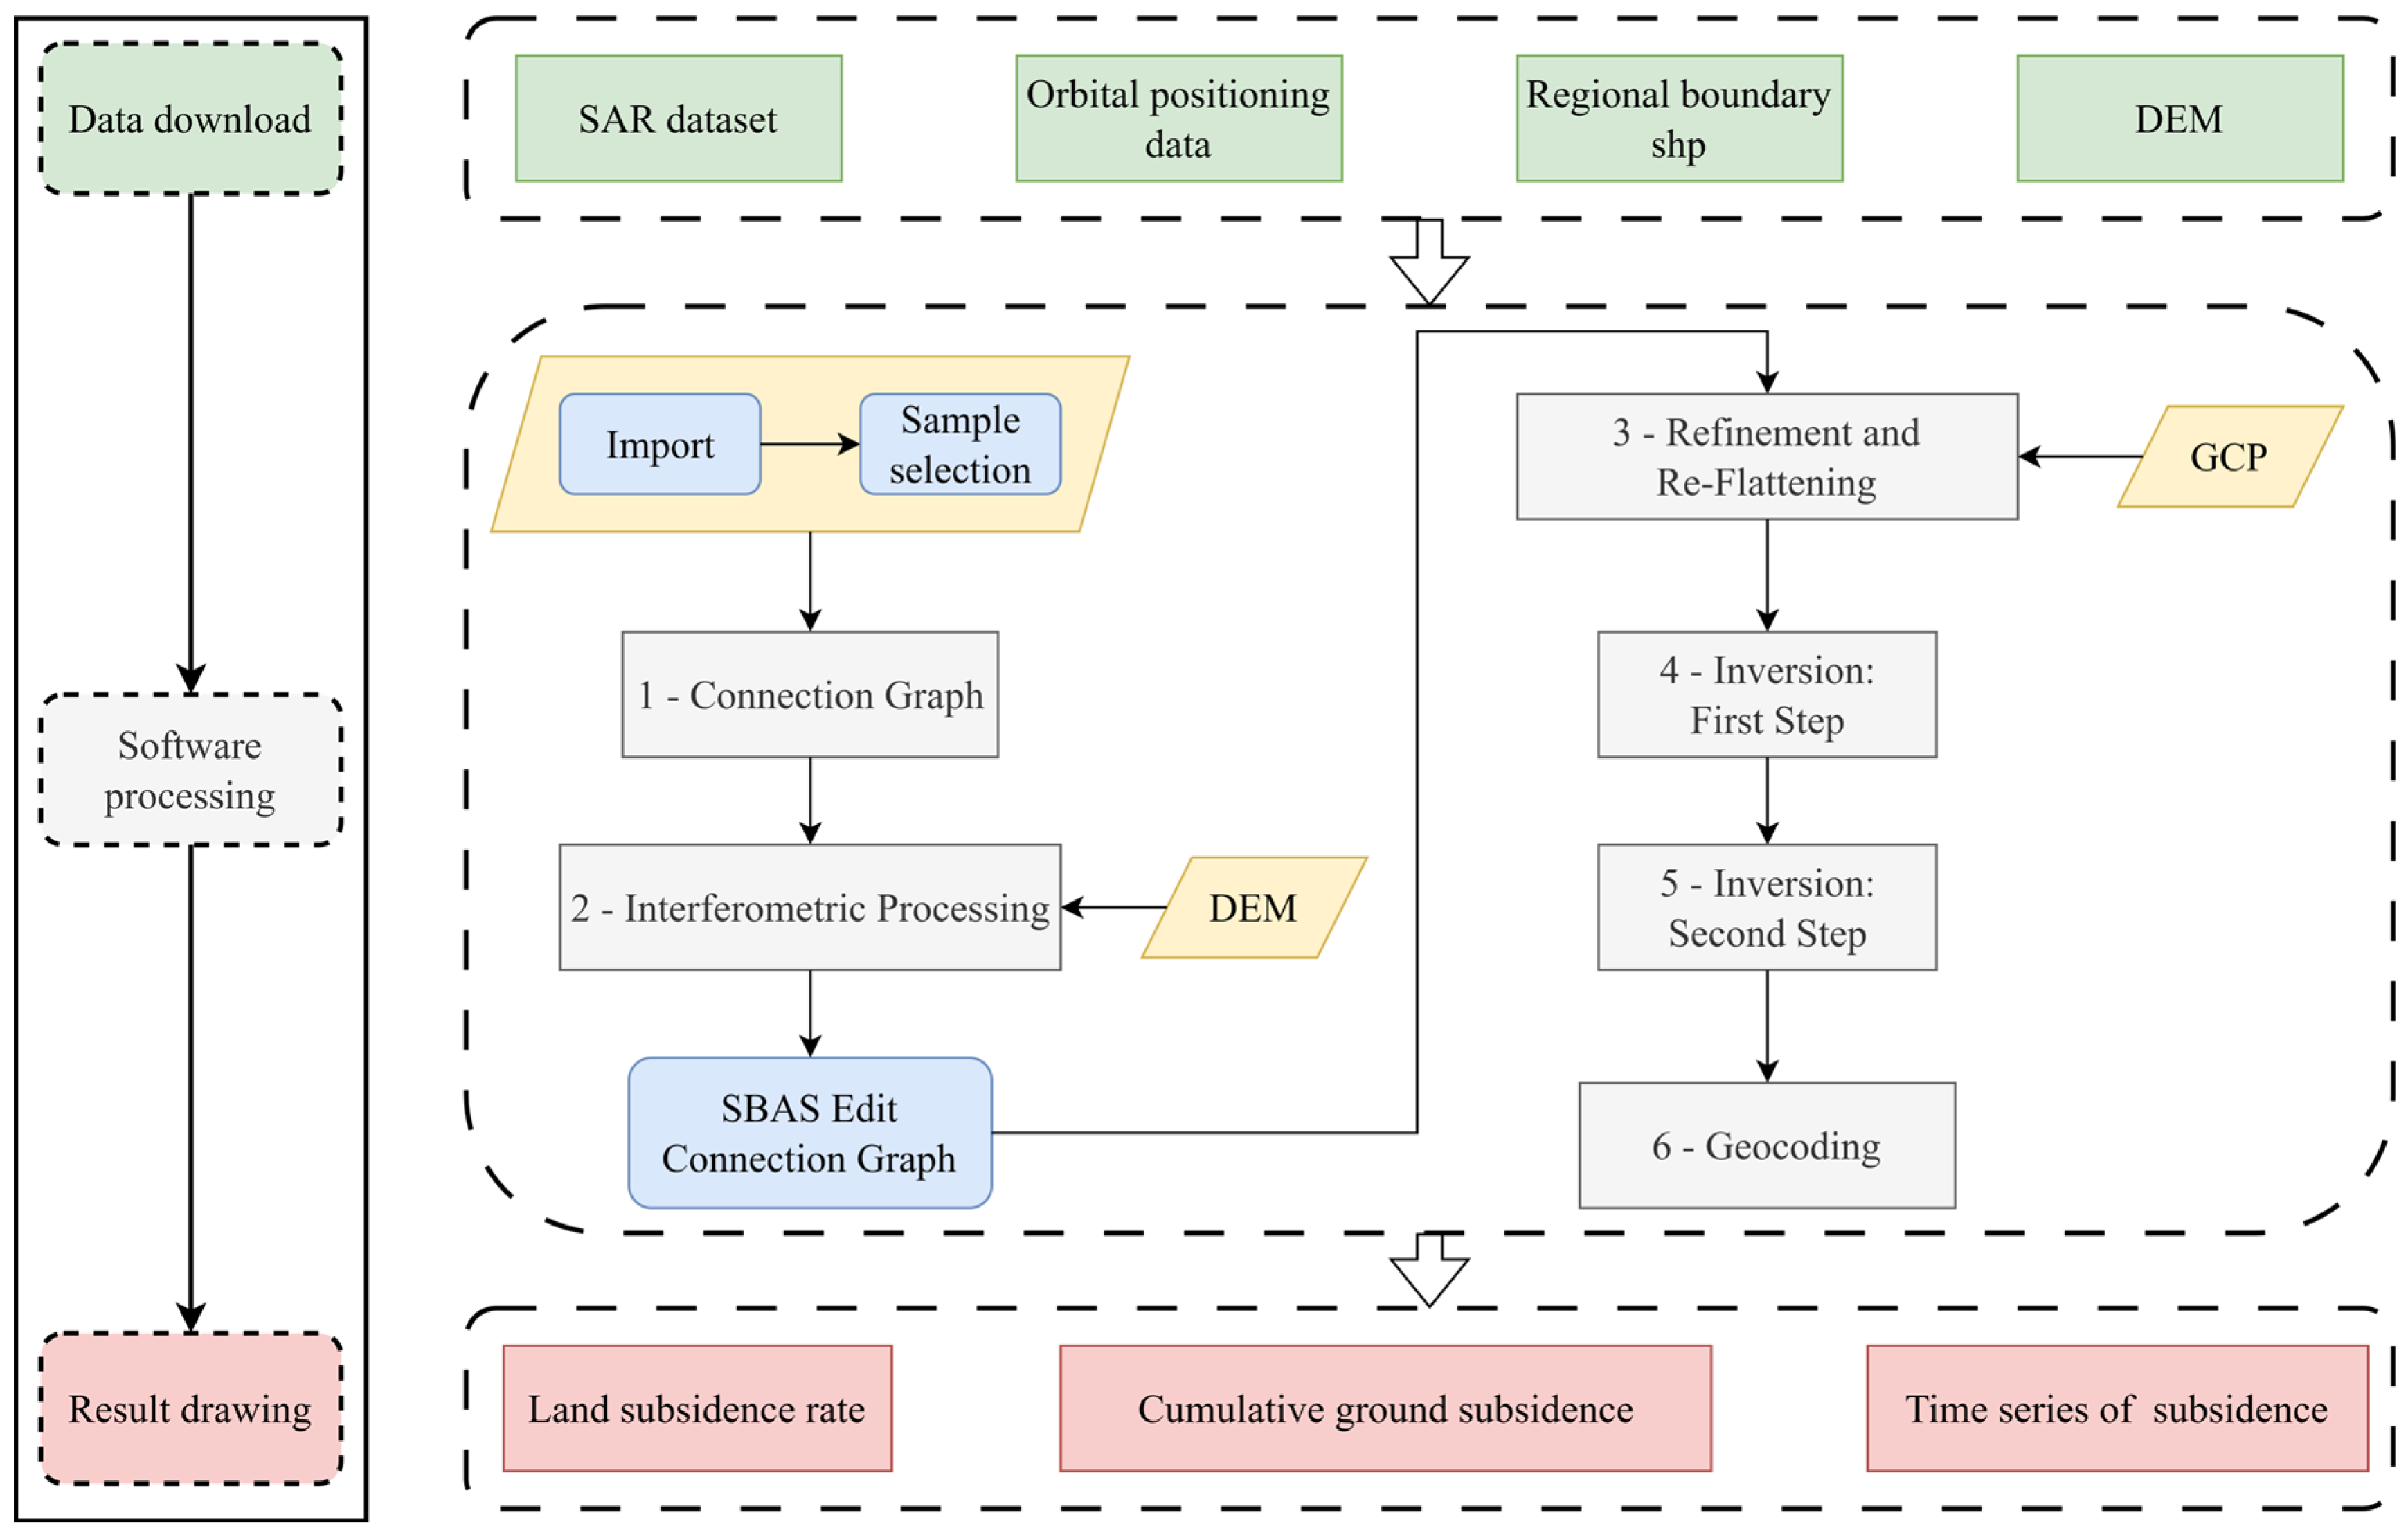
The SBAS-InSAR processing steps mainly include data preprocessing, interferometric workflow, deformation inversion of the SBAS method, and ground settlement analysis [42,43]. Figure 3 shows the flow chart of SBAS-InSAR technology.
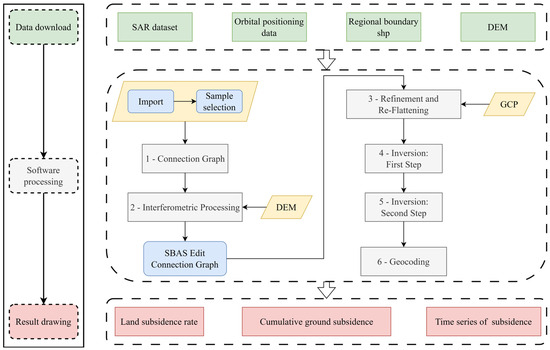
Figure 3.
Flowchart of SBAS-InSAR technology.
The following are the specific processing steps for SBAS-InSAR [44].
- Data preprocessing
The raw SAR data are cropped for the study area to reduce the subsequent computational run time. The cropped inputs are imported into SARscape, and the default software input parameters are entered at the Connection Graph step to generate the SAR data pair connection plot, as seen in Figure 4.
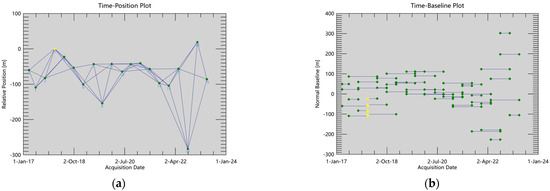
Figure 4.
Interfering image pairs spatial and temporal baseline connectivity maps. Yellow dots are the super master image and green dots are the slave image. (a) Interferometric image pair spatial baseline connectivity map; (b) interferometric image pair temporal baseline connectivity map.
This step not only generates the temporal and spatial baseline connectivity maps of the interferometric image pairs but also produces a text report showing the baseline conditions of each image pair (e.g., Table 4) and the super-master image selected automatically. As shown in the figure and report above, the super-master image selected by SBAS-InSAR from among the 20-spoke images is the 30 January 2018 image.
- 2.
- Interference workflow
This step is used to process the interferometric workflow for each pair of image pairs according to their connectivity. The workflow includes interferogram generation, interferogram deleveling, adaptive filtering and coherence generation, and phase detangling. The coherence coefficient, amplitude index, and intensity value were considered together for high coherence point selection, and the threshold of the coherence coefficient was set to 0.4 and the threshold of amplitude deviation was set to 0.8. The Delaunay MCF method is chosen for the de-entanglement method, and the image pairs with poor coherence (the whole image has no coherence) are rejected. The Delaunay MCF considers only the portion of the Delaunay triangular lattice mesh where the coherence is greater than a threshold value, and only the portion with high coherence is de-entangled. Since it is not affected by low-coherence image elements, the effect of phase mutation caused by too-low coherence is reduced [45].
- 3.
- SBAS method deformation inversion
This step converts phase values to deformation values. The penetration of the microwave bands is weakened by cloud water vapor, and the C-band also interacts with the vegetation canopy and does not reach the ground in areas of high vegetation cover. Considering the seasonal precipitation and dense vegetation in Nansha District, the atmospheric effect will be one of the main sources of error. The smaller the window size, the stronger the filter and atmospheric filtering may smooth out important deformation information. In mountain ranges with few atmospheric modes, the filter size must be adjusted accordingly. This study area is in the plains, so the default parameters were used. According to the characteristic that the atmosphere is highly correlated in space and uncorrelated in time, a large filtering window of 365 days for the atmospheric high pass and 1200 m for the atmospheric low pass is set to estimate and remove the atmospheric phase.
- 4.
- Ground settlement analysis.
SAR images are based on the oblique distance coordinate system, and in order to better compare the results of monitoring deformation, it is necessary to convert the SAR images from the oblique distance geometric projection coordinate system to the geographic coordinate system. The SBAS technique observes generally based on the deformation observed within the radar line-of-sight (LOS) direction. The InSAR measurement of radar LOS direction deformation is the projection of the vertical and horizontal motions in the azimuthal LOS direction. The larger the coherence threshold is set, the more distinct settlements are obtained, but if it is set too large, some settlements are missed. In contrast, if the threshold is set too low, a lot of noise is generated. Coherent points with coherence thresholds greater than 0.20 were geocoded to obtain the annual average ground subsidence rate and the time-series cumulative ground subsidence at the coherent points in Nansha District.
3. Results
3.1. Ground Subsidence Rate Analysis
The distribution results of the annual mean subsidence rate and cumulative subsidence in Nansha District from March 2017 to May 2023 were obtained by the SBAS-InSAR experiment. As shown in Figure 5, the range of the ground subsidence rate in Nansha District is [−23.8, 42.5] mm/yr, and the average subsidence rate is −1.363 mm/yr. Considering the number of settlements and the continuity of the settlement rate, we define a major settlement as one with a number of settlements greater than 20. This threshold is only for the purpose of this study and is not generalizable, and the resulting range of settlement rates can be used as a reference. As shown in the histogram of the subsidence rate frequency, the range of major subsidence rate in Nansha District is [−19.4, 7.7] mm/yr. The areas with the most severe subsidence in Nansha District are distributed in the eastern part of Dagang Town, the northern part of Hengli Town, the eastern part of Dongchong Town, and sporadically in the vicinity of inland surges of Wanqingsha Town, which have a subsidence rate of [−24, −8] mm/yr. The distribution of points with subsidence rates in the range of [−7, 5] mm/yr was approximately the same as that in the range of [−24, 8] mm/yr. The most subsidence points are located in the interval of [−4, 0] mm/yr, which are mainly located in the vicinity of the Nansha Street ring woodland, the central part of Dongchong Town, the expressway connecting Dongchong Town and Lanhe Town, the southwestern part of Lanhe Town, the western part of the woodland in Dagang Town, the central part of Hengli Town, the central part of Zhujiang Street, and the eastern part of Longxue Street. Uplift and subsidence often occur simultaneously, and where there is subsidence, there is bound to be uplift; the main rate of uplift in Nansha District is less than 7.7 mm/yr, and the main areas of uplift are also located in the areas with the most subsidence sites in Nansha District. In general, the ground subsidence area in Nansha District is mainly distributed along the rivers, construction areas, and reclamation areas, and most of the areas within the monitoring range have small deformation magnitudes and are in a stable state. At the same time, there are also areas of intense subsidence, with a subsidence rate as high as −23.8 mm/yr.
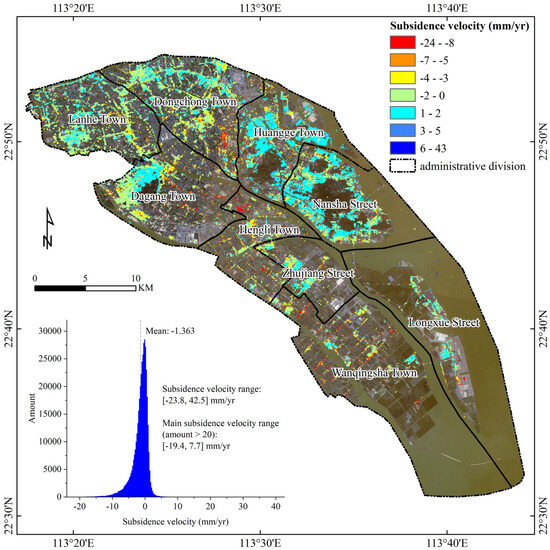
Figure 5.
Spatial distribution of average annual subsidence rates in Nansha District, 2017–2023. This map contains two maps; the large map is the spatial distribution of ground subsidence in Nansha District and the small map is the frequency distribution of ground subsidence. The base map of the large map is the 2022 GF-1 remote sensing map with a spatial resolution of 2 m.
3.2. Cumulative Ground Settlement Analysis
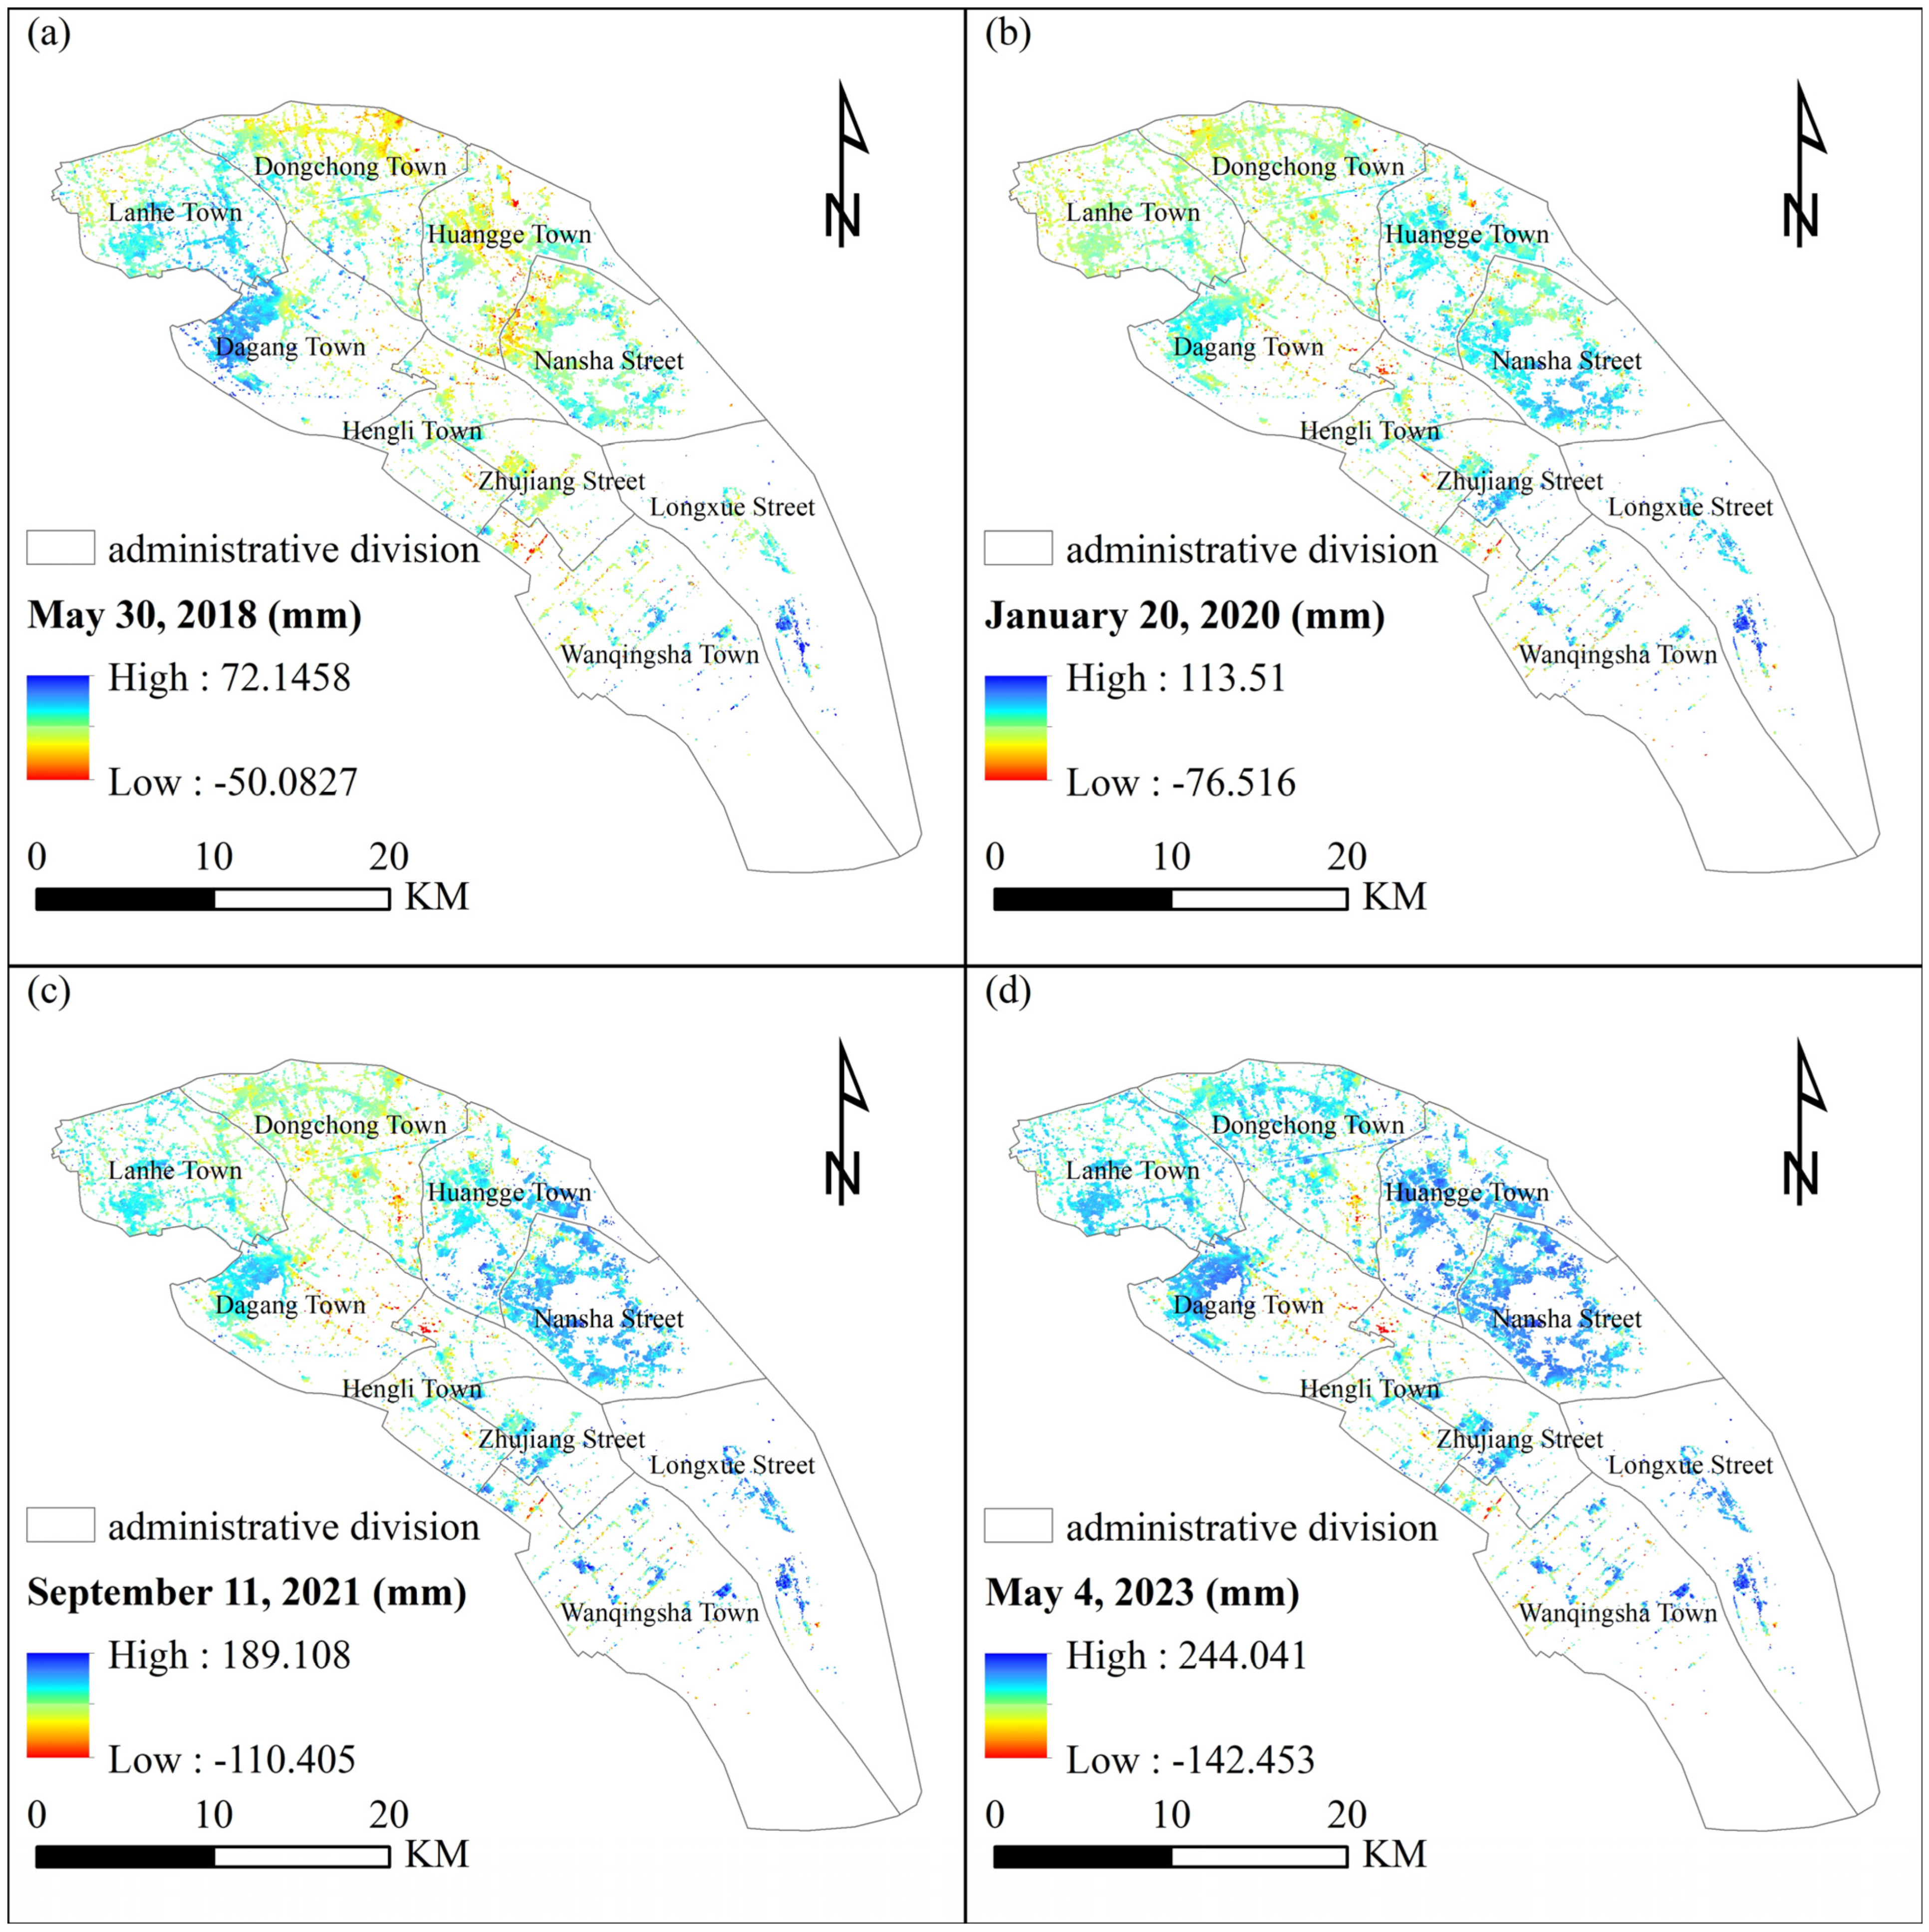
One of the 20 dates was selected at certain intervals to analyze the accumulation of ground subsidence. A total of four dates were selected, 30 May 2018, 20 January 2020, 11 September 2021, and 4 May 2023. Table 5 shows the characteristic values of cumulative subsidence in the different years. According to Table 5, it can be seen that the average value of subsidence in Nansha District from 12 March 2017 to 4 May 2023 is −10.05 mm, the maximum subsidence is −142.45 mm, and the maximum lifting is 244.04 mm. Taking the sentinel image of 12 March 2017 as a base, it can be found that the average value of subsidence from 30 May 2018 to 11 September 2021 expands, indicating that during this period, the Nansha District is in a phase of accelerated subsidence. The mean value of subsidence from 11 September 2021 to 4 May 2023 remains basically unchanged, indicating that the subsidence generally tends to stabilize in this period. The maximum values of subsidence and uplift increased in these four periods, indicating that the area of intense subsidence and uplift has a tendency to expand.
Table 5.
Characteristic values of cumulative subsidence in different years.
Figure 6 shows the distribution of cumulative ground subsidence in Nansha District as of 12 March 2017 for different years. As can be seen from Figure 6, the distribution location of the cumulative subsidence in 2023 is basically the same as the distribution of the average annual subsidence rate, which is mainly located in the towns of Dongchong, Dagang, Hengli, and Wanqingsha. However, the development of ground subsidence from 2017 to 2023 is not always distributed in these towns and streets. As of 2018, ground subsidence is mainly distributed in Nansha Street, Huangge Town, Dongchong Town, Hengli Town, and Wanqingsha Town. By 2020, ground subsidence is decreasing in Nansha Street, Huangge Town, and Dongchong Town and significantly increasing in Dagang Town and Hengli Town. And by 2021, the distribution of ground subsidence points is basically the same as in 2020.
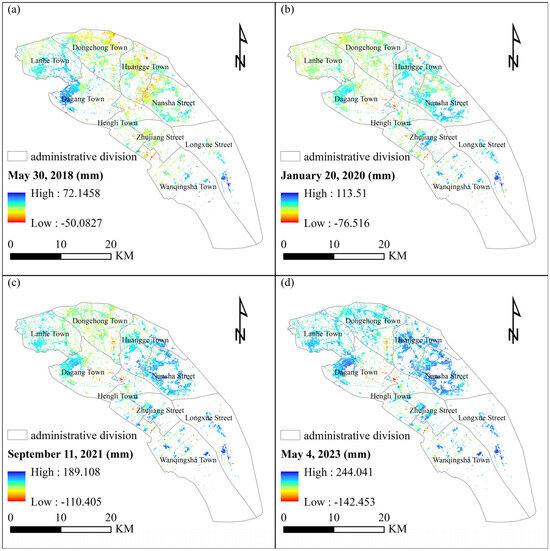
Figure 6.
Distribution of cumulative ground subsidence in Nansha District in different years. (a–d) The spatial distribution of cumulative subsidence in Nansha District as of 30 May 2018, 20 January 2020, 11 September 2021, and 4 May 2023, respectively.
3.3. Change Characteristics of Settling Time
According to Figure 7, four settling points were selected in the areas with dramatic subsidence in Nansha District to analyze the cumulative changes in the amount of subsidence over time from 12 March 2017 to 4 May 2023 at the four settling points. Settling point 1 is located in the southeast of Dongchong Town, with latitude and longitude (22°50′27.04″N, 113°28′6.58″E). Settling point 2 is located in the central part of Dagang Town, with latitude and longitude (22°46′38.45″N, 113°25′56.39″E). Settling point 3 is located in the northern part of Hengli Town, where the latitude and longitude are (22°46′23.45″N, 113°28′49.18″E). Settling point 4 is located in the northwestern part of Wanqingsha Town, where the latitude and longitude are (22°40′53.46″N, 113°32′8.97″E). Figure 7 shows the location distribution and remote-sensing images of the settling drastic points. As can be seen from Figure 7, the four points of intense subsidence are located in suburban houses or roads.
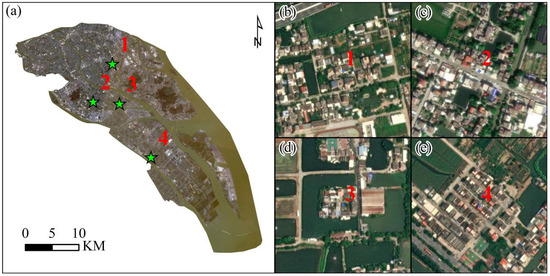
Figure 7.
Location distribution and remote-sensing images of intense subsidence points. The base map of (a) is a GF-1 remote sensing image with a spatial resolution of 2 m. (b–e) Derived from Google Earth.
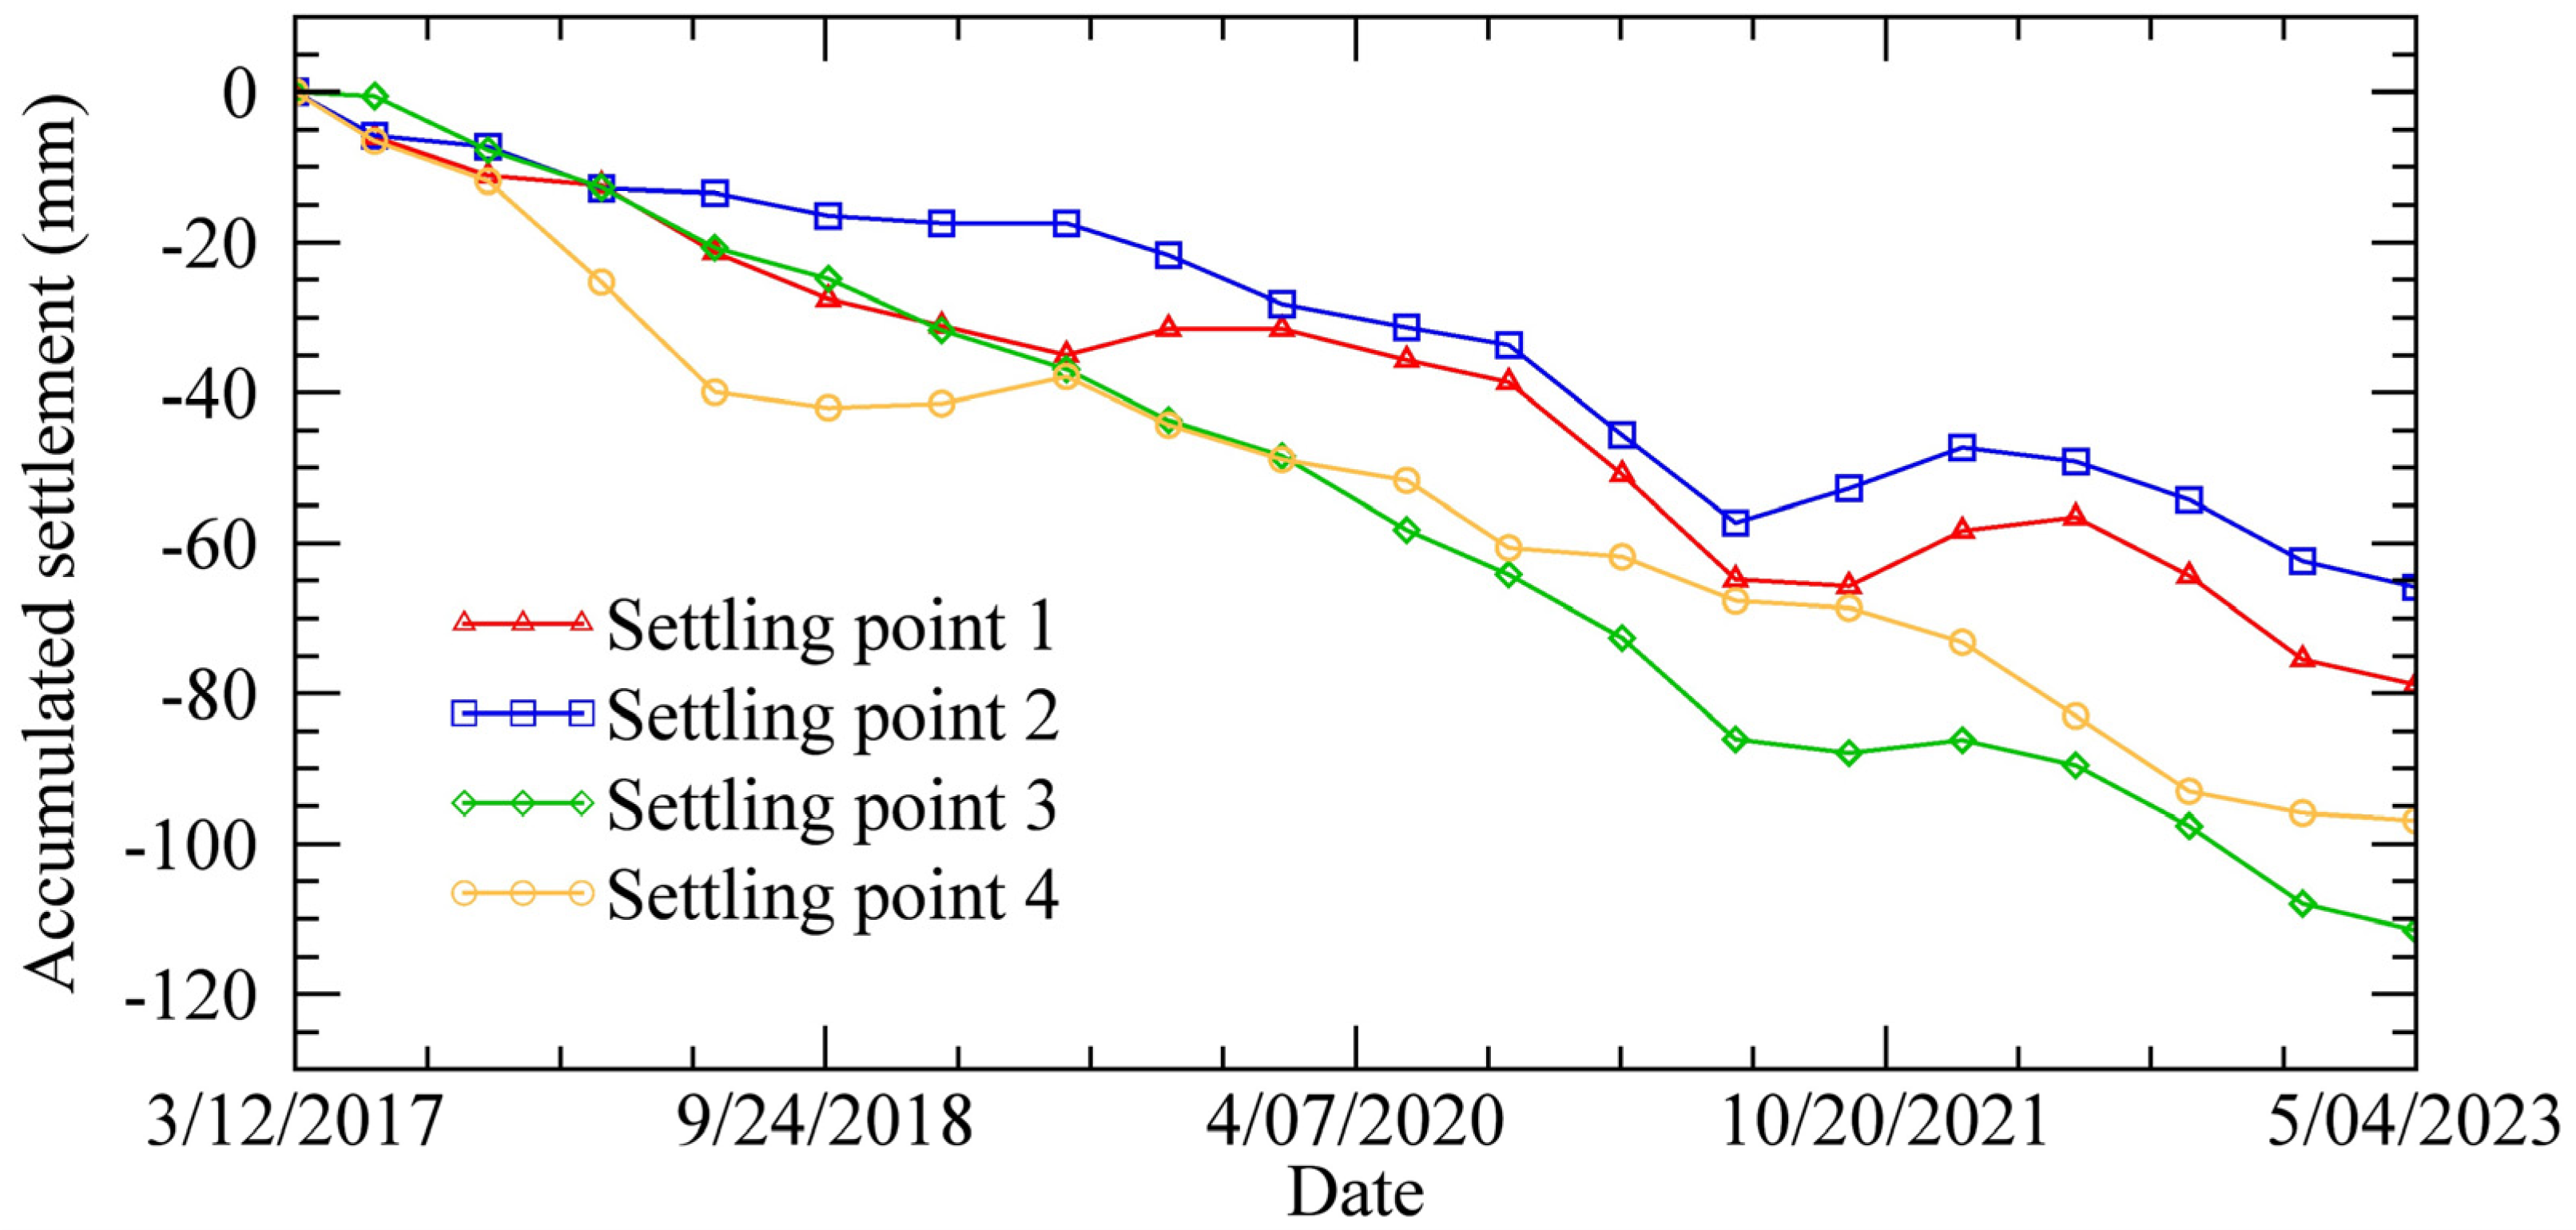
Figure 8 shows the cumulative settlement from 12 March 2017 to 4 May 2023 for the four points with dramatic settlement. Overall, the cumulative settlement of the four settlement points increases with time, and the cumulative settlement reaches the maximum on 4 May 2023. The cumulative settlement of the four points is higher than 60 mm, and the maximum settlement is higher than 110 mm. According to Figure 8, it can be seen that the four settlement points do not settle every year, and there is inverse settlement (uplift) in some of these years. Settling point 1 had inverse subsidence on 6 June 2019 and 11 September 2021. Settling point 2 only experienced inverse subsidence on 14 May 2021. Setting point 3 did not experience large inverse settlement, but the cumulative settlement remained essentially constant between 14 May 2021 and 9 January 2022, indicating that settling point 3 neither settled nor lifted during this period. In contrast, settling point 4 was ahead of settling point 3 during this period, from 30 May 2018 to 25 January 2019, and experienced minor inverse settlement after 25 January 2019, followed by a resumption of settlement.
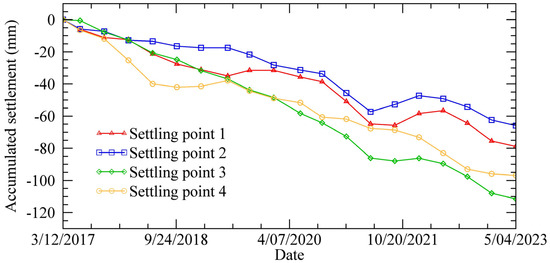
Figure 8.
Temporal changes in cumulative settlement at intense settlement sites. The locations and latitudes and longitudes of the four settlement sites are depicted in Figure 7.
3.4. Ground Settlement Accuracy Survey
The accuracy evaluation of the ground settlement comes from the contemporaneous leveling measurements and the research results from the literature, among which the verification of the contemporaneous leveling measurements is the most convincing. Since the contemporaneous level measurement data is difficult to obtain, the trend of the ground settlement results and the consistency of the approximate values can be verified from the research results in the literature. Firstly, the error of the results obtained by the software is analyzed, and the average error of the measurement of the ground subsidence rate in Nansha District is less than 11.13 mm/yr, which indicates that the results of the software have a certain degree of credibility. Secondly, we read the relevant literature to find the average annual rate of subsidence in Nansha District and verify the infallibility of the results of ground subsidence on the whole. In his master’s thesis, Lin [37] used the SBAS-InSAR method to process the sentinel data of Nansha District from June 2015 to April 2018 and determined that most of the subsidence rate in Nansha District is located to the left of the zero value, with a value of approximately −1.81 mm/yr. In this paper, we determined that the average subsidence rate of Nansha District is −1.363 mm/yr, which has a consistent trend, so the results obtained in this paper are reliable regarding the trend and numbers. The monitoring accuracy of the ground subsidence results is verified through on-site fieldwork. Figure 9 shows the photos taken at the ground subsidence site in Nansha District. By comparing them with the annual average ground subsidence rate map obtained by the SBAS-InSAR method, the subsidence areas in the field are reflected in the subsidence rate map. Therefore, the results obtained by this method have a certain degree of reliability in the distribution of subsidence locations. The ground settlement monitoring report of Greater Bay Area mentions that the ground settlement in areas such as Mingzhuwan Development Zone in Hengli Town, within the town of Zhujiang Street, Yihewei Village between Eight Chong and Ten Chong in Zhujiang Street, the main town area between Thirteen Chong and Fourteen Chong in Wanqingsha Town, the shipyard and harbor area in Longxue Street, and so on, are severe and generally less than 100 mm. Meanwhile, the ground settlement in undeveloped areas such as farmland, wasteland, and fishponds is smaller. The areas of intense settlement mentioned in the report (Focus Work Areas) are consistent with this paper’s identification of areas of intense settlement. Although the trend and accuracy of the results were verified in all aspects, there is still a great deal of uncertainty in the results. The higher the density of data selection, the more accurate the results analyzed, similar to the situation that exists in hydrogeological systems [46].
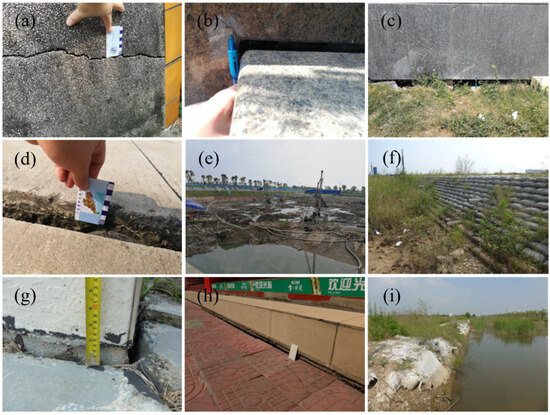
Figure 9.
Photographs taken at the site of ground settlement in Nansha District. These photos are from the report on the results of the “Monitoring of Ground Subsidence in the Guangdong-Hong Kong-Macao Greater Bay Area–Pilot Project in Nansha District, Guangzhou” prepared by the Guangzhou Provincial General Station of Geological and Environmental Monitoring. (a) The cracking of the wall of the building near Renan Road in Wuchong, the main town area of Wanqingsha Town, with a crack width of 50–150 mm; (b) the cracking of the steps of the staff canteen on the north side of the Kouan building in Longxue Street, with a maximum seam width of 40–60 mm; (c) the obvious ground settlement in the area to the east of the Nansha Haigang Building in Longxue Street, with the amount of settlement amounting to 150–200 mm; (d) the ground settlement at the place opposite to No. 119, Fuan 1 Street, Wanqingsha Town highway, settlement amount of approximately 20 mm; (e) the Mingzhuwan construction site, pumping groundwater resulting in uneven ground settlement; (f) the bonded port area ground settlement area edge of the drainage outlet, artificial drainage to accelerate the consolidation of settlement; (g) the Guangzhou Shipbuilding International Shipyard within the office building wall corner cracking and subsidence, the amount of subsidence of 50 mm; (h) obvious ground settlement occurred on the lower ground of the steps of the house at No. 68 Yucai Road, Wanqingsha Town, and the amount of subsidence was 10–50 mm; (i) the site of accelerated consolidation by artificial drainage of under consolidated soft soil at the site of Yihewei Village, between Eight Chong and Ten Chong in Zhujiang Street.
According to the occurrence of ground settlement objects being different, the status of ground settlement is divided into four major categories: buildings, road soft foundation, construction sites (including underground space development), and artificial drainage to accelerate the self-consolidation of soft soil. As shown in Figure 9a, the house building is subjected to uneven settlement of soft soil ground, which causes the phenomenon of tilting and cracking damage to the building. The high compressibility of soft soil, the occurrence of uneven settlement, and the foundation of the building being affected by the concentration of stress cracks ultimately caused the building to become damaged due to the production of cracks, causing it to lose its use function. As shown in Figure 9b,c, the building was built in a newer age, with higher floors, and with bedrock or weathered bedrock as the pile-bearing layer, therefore the foundation-bearing capacity was higher and the overall structure of the building was stable. The neighboring ground, on the other hand, was subjected to static and dynamic loads, resulting in an overall consolidation and settlement of the ground, leading to the main body of the building being higher than the ground or even elevated. As shown in Figure 9d, the road surface is uneven, and horizontal cracks appear under the influence of automobile dynamic load. At the same time, the region has frequent engineering construction, and the road travels a large number of loaded trucks, so the road is mostly seen to have the settlement phenomenon. As shown in Figure 9e, human engineering activities in the Mingzhuwan area are strong, there are more underground construction works (foundation pits, sewers, etc.), underground work requires the pumping of groundwater during construction, and pumping may lead to the loss of fine particles such as sand layer, silt layer compaction, sand, and soil, which will result in the uneven settlement of the ground. As shown in Figure 9f, the under-consolidated soft soil was formed in the Quaternary Holocene Series, the formation age is not long, and it did not complete its own consolidation in the process of its geologic age. At the same time, Wanqingsha Town, Longxue Street, and other areas are recently reclaimed land, so the soft soil in this area is still in the slow drainage and consolidation development process due to drainage, the soft soil volume contraction, and the formation of ground subsidence. As shown in Figure 9g,h, the corners of the house walls cracked to different degrees under the effect of the uneven settlement of the foundation and the self-weight load of the house. Figure 9i is similar to Figure 9f, which shows the site of artificial drainage to accelerate the consolidation of under-consolidated soil at the site.
4. Discussion
The phenomenon of ground settlement is a complex and undesirable geological phenomenon in which a large vertical decline in ground elevation occurs under the combined and superimposed effects of a number of factors, and the factors that give rise to ground settlement include natural geological factors and man-made factors. Ground settlement can be induced by a single factor, but more often it is the result of the combined action of several factors.
4.1. Impact of Geological Conditions
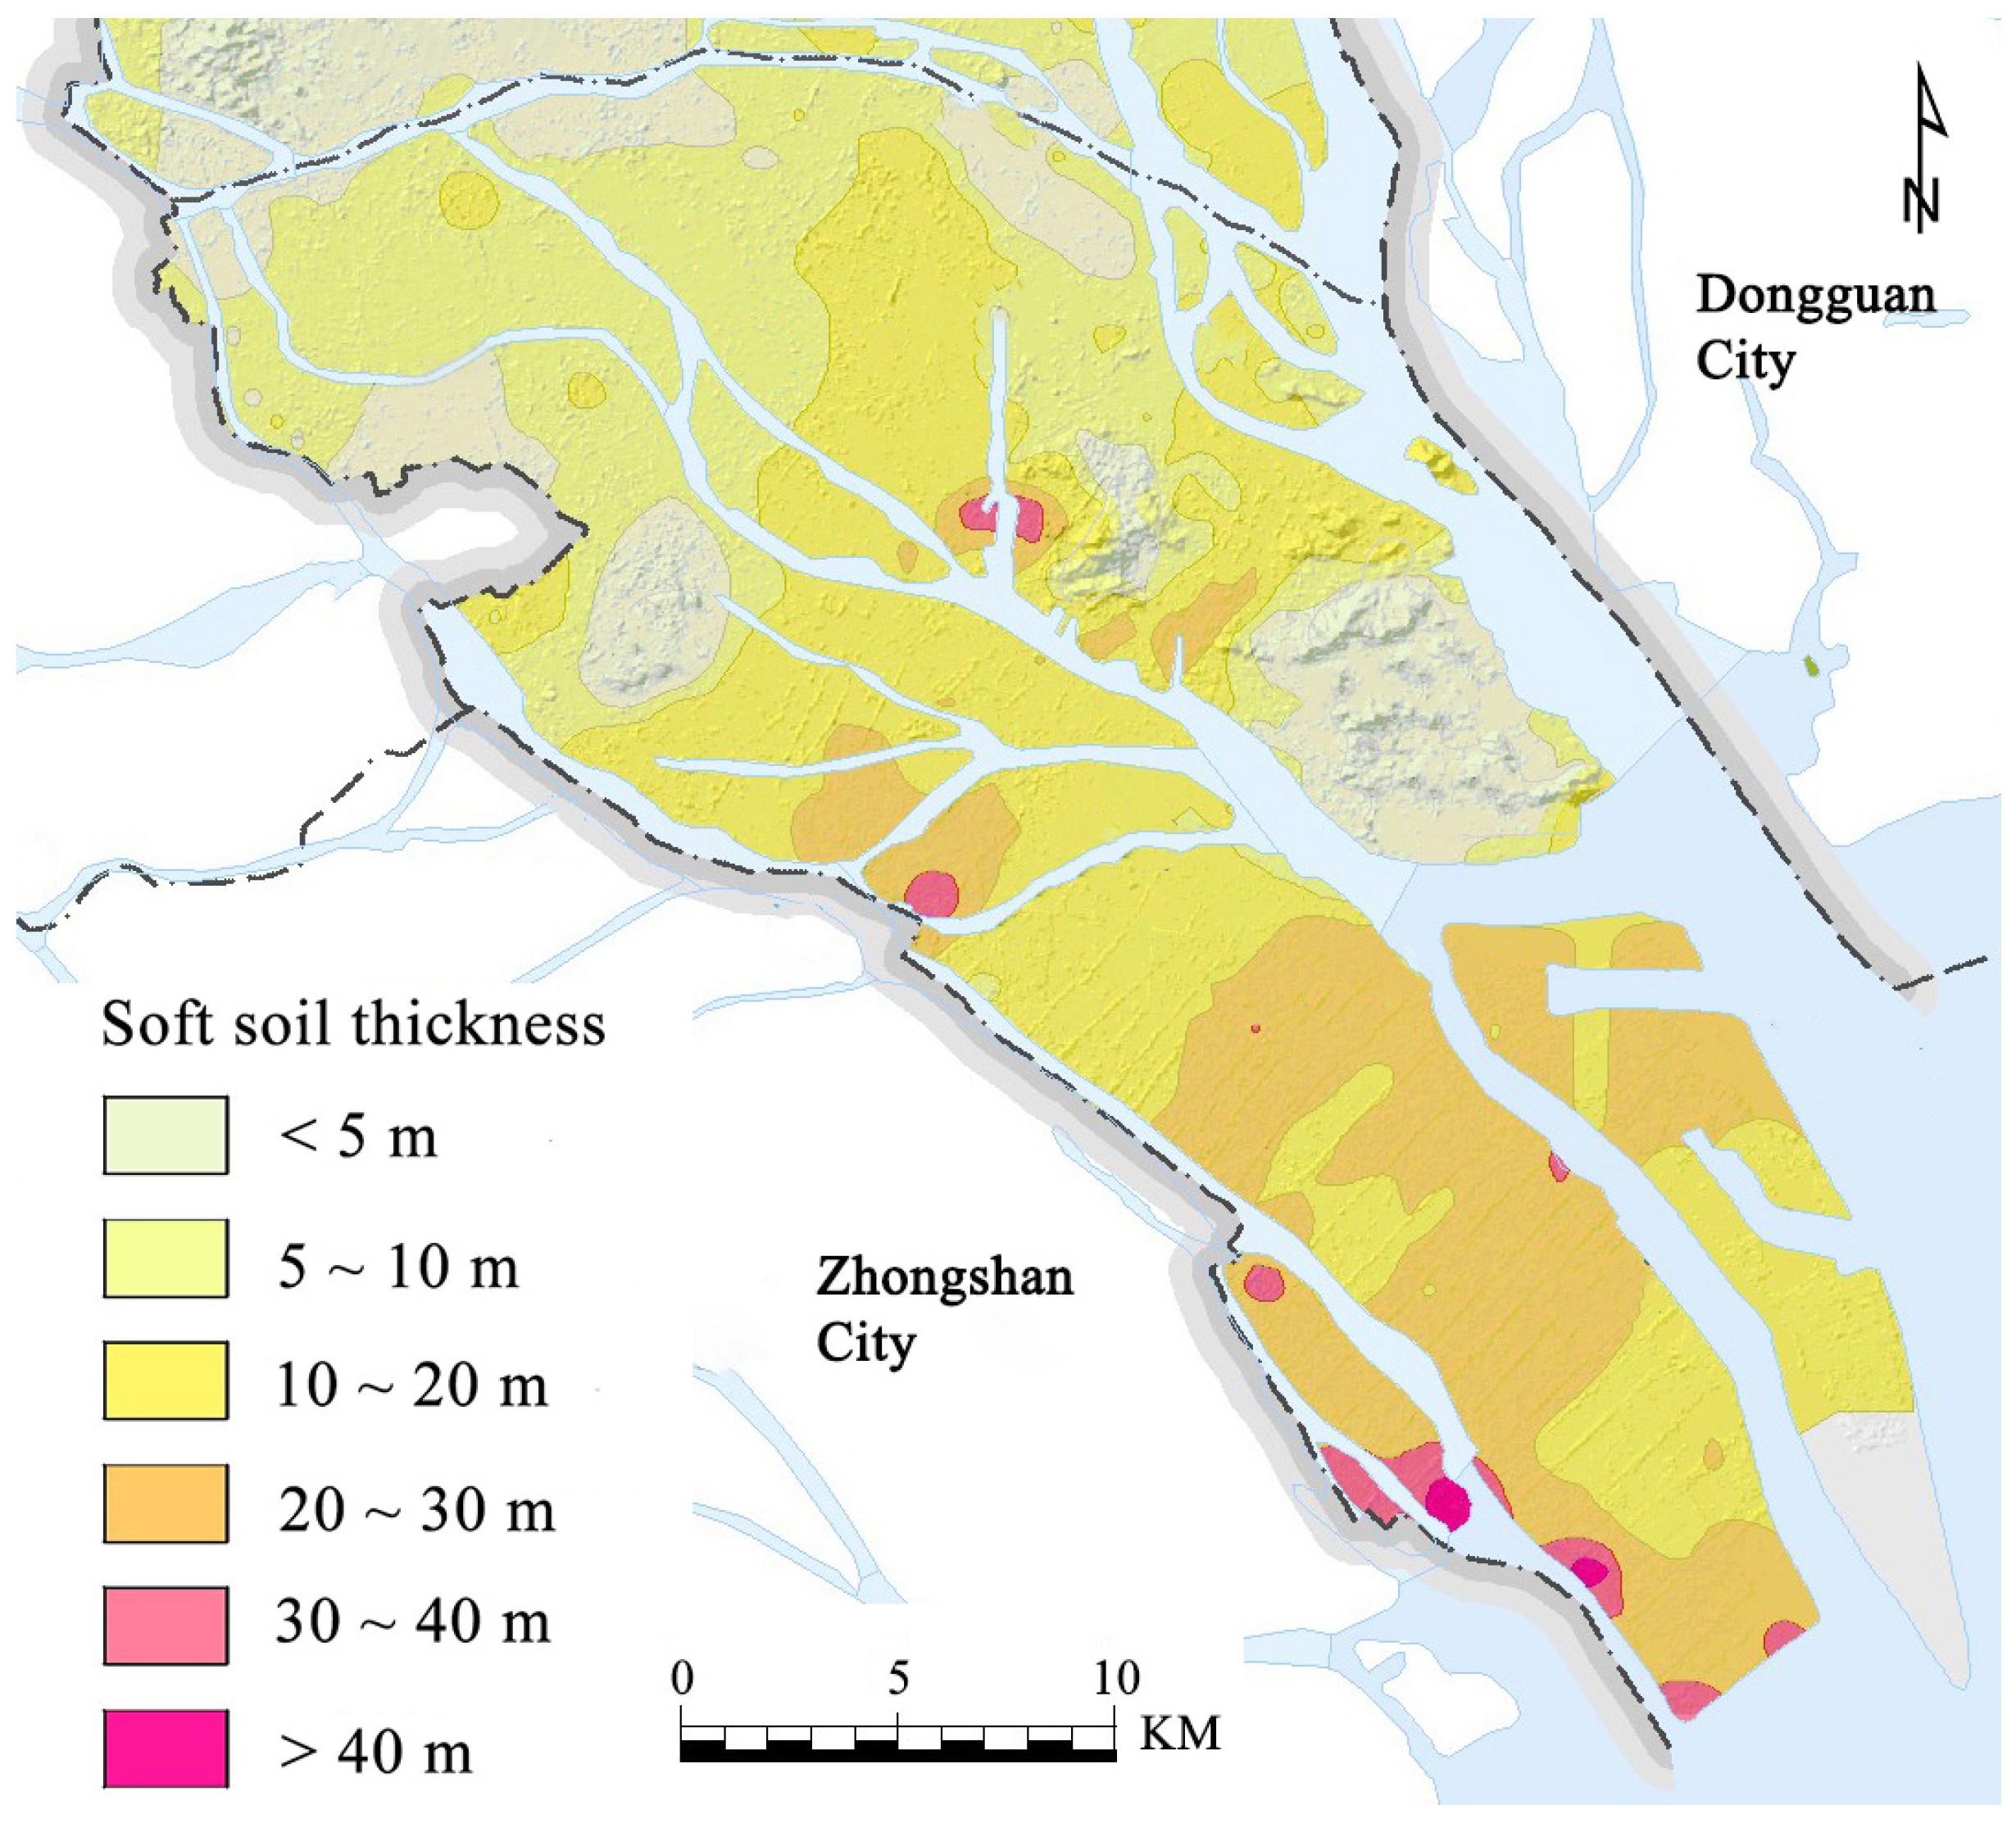
The soft soil in the main settlement area of Nansha is more developed [23], with a cumulative thickness of 8.65–29.30 m, an average thickness of 18.31 m, and a shallow burial depth of 0.90–8.70 m at the top plate. The soft soil type is mainly silty soil, which is gray, saturated, and fluid-plastic. Silt-type soil is characterized by high natural water content, high porosity, high compressibility, poor consolidation, and poor engineering properties. Therefore, in soft soil on the one hand, under the action of its own gravity, the pore water pressure will gradually decrease before the soil layer reaches complete consolidation, which will inevitably cause ground settlement [47]. On the other hand, it is easy to produce subsidence and shear deformation under the action of external load or a groundwater level drop, which has a greater impact on the stability of the site. Figure 10 shows the contour map of soft soil thickness in Nansha District. The spatial distribution of ground settlement and the spatial distribution of soft soil basically coincide, indicating that there is a positive correlation between the amount of ground settlement and the size of soft soil thickness, i.e., the larger the thickness of soft soil, the larger the amount of ground settlement.

Figure 10.
Distribution of soft soil thickness in Nansha District [48]. The data were obtained from Geoscientific Data and Discovery Publishing System, and the soft soil thickness distribution in Guangzhou City was cropped and translated to obtain the soft soil thickness distribution map of Nansha District.
The high water content of the soft soil is the geological cause of the rapid ground settlement in Nansha District. Based on this, we propose the following countermeasures. For the problem of high water content in soft soil, drainage pipes can be installed to accelerate drainage.
4.2. Impact of Human Engineering Activities
4.2.1. Artificial Fill
Most of the original landforms within the area of ground settlement were fishponds, river surges, cultivated land, and the sea, which have experienced large-scale reclamation activities in the past 100 years [49]. Filling and leveling of the site are required for the construction of the project, and the average thickness of the fill in the area is 2.47 m, with a maximum thickness of 4.90 m. Due to the structure of the fill being loose, the poor uniformity with a large pore ratio, high compression, low compactness, low strength, etc., there is compression of the soil, and in the role of the vertical load, it is more prone to generating compression of the ground subsidence caused by geological disasters [50,51]. Generally, the newly filled soil is not compacted, which will produce large self-weight compression consolidation, and before the completion of the natural compression consolidation, the soil structure is loose, the settlement is generally higher, and the bearing capacity is lower and cannot be used as the foundation-bearing layer. In addition, the uneven thickness and density of the fill are also likely to lead to uneven settlement of the ground.
4.2.2. Groundwater Level Changes
Porewater is discharged from the soil, causing a decrease in the pore water pressure in the soil layer, resulting in an increase in the effective stress between the particles, which is equivalent to applying additional stress to the soil layer so that the weak soil layer is compressed to produce deformation. The size of the deformation is affected by the size of the stress (i.e., water level variation), the physical and mechanical properties of the compression layer, and the distance from the aquifer and other factors, and the superposition of the compression deformation of the soil layer is manifested as ground settlement deformation.
On the one hand, the rivers in Nansha District are crisscrossed and densely networked, and the dynamics of the groundwater level show seasonal cycle changes. During the dry season, groundwater is discharged to the surface water body, the aquifer releases part of the water, the groundwater level decreases, the effective stress in the soil layer increases, and compression deformation occurs between the soil particles. At the same time, the clayey soil is compressed irreversibly during the drainage process, which results in the formation of ground settlement caused by the groundwater changes [52]. On the other hand, both pit descending and pit drainage in engineering construction can cause a large drop in water level. In particular, the long time and large depth of pit descending has been the main cause of urban ground subsidence in recent years [53]. Therefore, groundwater needs to be controlled, and managing it well is key to achieving sustainable development goals [54].
4.2.3. Additional Load
Under the influence of additional load, the soft soil is subjected to an external force, which destroys the original stress equilibrium state, and the effective stress and pore water pressure are transformed into each other, which artificially accelerates the drainage consolidation–compression settlement process of soft soil. In general, the settlement is naturally larger where the stress is concentrated. The locations where settlement occurs in the geohazard investigation are mainly in the walls, steps, roadbeds, and between bridge piers and roadbeds.
Ground settlement in the Nansha area is very closely related to human engineering activities. Human engineering activities accelerated or exacerbated the development of ground subsidence in the region [55,56]. Ground subsidence caused by the upper load has become the main control factor of ground subsidence in some areas, and the impact is even greater than groundwater mining in local areas. According to the type of load, it can be divided into static load influence and dynamic load influence. Static loads are mainly reflected in the construction of ground buildings, bridge and road construction, land enclosure construction, and underground space development. Dynamic loads are mainly reflected in the Pearl River Delta’s well-developed transportation network, busy traffic, and logistics [57], and the impact of dynamic vehicle loads should not be ignored.
The high porosity of the artificial fill, the drop in groundwater level due to engineering measures, and the increase in ground load due to busy logistics are man-made factors of ground settlement in the Nansha District. For the settlement problem caused by artificial fill, consolidation can be accelerated by repeated mechanical rolling of the soil. For the groundwater level drop caused by pit descending and drainage, water barrier walls can be installed to minimize the impact of civil engineering works on groundwater. For the cracking and settlement of road surfaces caused by ground vehicle loads, the settlement of road surfaces can be mitigated by repairing and reinforcing the road surfaces.
5. Conclusions
This paper investigates the ground subsidence in Nansha District from 12 March 2017 to 4 May 2023 using SBAS-InSAR technology based on 20-view Sentinel 1 C-band radar images. The accuracy of the monitoring results is verified by literature comparison and fieldwork side by side, and the following conclusions are obtained. The main rate of ground subsidence in Nansha ranges from −19.4 to 7.7 mm/yr, and the average rate of subsidence is −1.363 mm/yr. Spatially, it is mainly distributed in the urban area, the river coast, the construction area, and the reclamation area in Nansha. The average cumulative sedimentation in Nansha over more than 6 years is −10.05 mm, the average sedimentation increases with time, and the spatial distribution is basically the same as the sedimentation rate distribution map. In the area of intense settlement, four points were selected to analyze the temporal changes, and it was found that the cumulative settlement of the four points was basically increasing with the passage of time, but there was still inverse settlement (uplift) or no settlement in the process. Through the field study, it was found that the causes of ground settlement in Nansha are complex and are mainly affected by geological conditions (artificial fill and soft soil) and human engineering activities (groundwater, surcharge loading, and soft soil consolidation).
Although the results obtained in this paper have been validated in various aspects, the following three limitations still exist. First, the amount of data handled by the model is small. For the SBAS-InSAR method, the more data input to the model, the higher the accuracy of the results obtained. Secondly, the model lacks the information on GCP real measurement points to correct it. Third, the model runs too slowly. When too many data are processed, the time required for the model to run can reach an excess of one month. This is too much time to obtain the results when dealing with seismic settlement. In subsequent studies, the Google Earth Engine cloud platform can be used to perform ground subsidence. The platform is fast in processing data and can directly call Sentinel-1 data. The advantages are more obvious compared to personal computer processing.
Author Contributions
Conceptualization, H.Y. and B.L.; methodology, H.Y. and J.S.; validation, Y.X., J.S. and G.J.; formal analysis, H.Y.; investigation, C.C. and H.L.; resources, B.L.; data curation, J.S.; writing—original draft preparation, H.Y.; writing—review and editing, B.L. All authors have read and agreed to the published version of the manuscript.
Funding
This research was funded by the National Key Research and Development Program of China, grant number 2023YFC3209204, and the Major Science and Technology Project of Guangzhou Nansha Water Authority, grant number 2022-263.
Data Availability Statement
Thanks to the global availability of free and open Sentinel-1A data of the Alaska Satellite Facility (ASF), the SAR data are accessible at https://search.asf.alaska.edu (accessed on 5 May 2023). Precision orbit data and 30-m DEM data can be downloaded from https://scihub.copernicus.eu/gnss/#/home (accessed on 30 May 2023) and https://dwtkns.com/srtm30m (accessed on 9 May 2023). No new data were created.
Conflicts of Interest
Author Gaoyang Jin was employed by the company China Water Resources Pearl River Planning, Surveying & Designing Co., Ltd. The remaining authors declare that the research was conducted in the absence of any commercial or financial relationships that could be construed as a potential conflict of interest.
References
- Gheorghe, M.; Armaş, I. Comparison of Multi-Temporal Differential Interferometry Techniques Applied to the Measurement of Bucharest City Subsidence. Procedia Environ. Sci. 2016, 32, 221–229. [Google Scholar] [CrossRef]
- Chaussard, E.; Amelung, F.; Abidin, H.; Hong, S.-H. Sinking Cities in Indonesia: ALOS PALSAR Detects Rapid Subsidence Due to Groundwater and Gas Extraction. Remote Sens. Environ. 2013, 128, 150–161. [Google Scholar] [CrossRef]
- Cigna, F.; Tapete, D. Present-Day Land Subsidence Rates, Surface Faulting Hazard and Risk in Mexico City with 2014–2020 Sentinel-1 IW InSAR. Remote Sens. Environ. 2021, 253, 112161. [Google Scholar] [CrossRef]
- Massonnet, D.; Feigl, K.L. Radar Interferometry and Its Application to Changes in the Earth’s Surface. Rev. Geophys. 1998, 36, 441–500. [Google Scholar] [CrossRef]
- Casu, F.; Manzo, M.; Lanari, R. A Quantitative Assessment of the SBAS Algorithm Performance for Surface Deformation Retrieval from DInSAR Data. Remote Sens. Environ. 2006, 102, 195–210. [Google Scholar] [CrossRef]
- Fan, H.; Lian, X.; Yang, W.; Ge, L.; Hu, H.; Du, Z. Mining Large-Gradient Subsidence Monitoring Using D-InSAR Optimized by GNSS. Imaging Sci. J. 2021, 69, 207–218. [Google Scholar] [CrossRef]
- Zhang, Z.; Zeng, Q.; Jiao, J. Application of D-InSAR Technology on Risk Assessment of Mining Area. In Proceedings of the IGARSS 2019—2019 IEEE International Geoscience and Remote Sensing Symposium, Yokohama, Japan, 28 July–2 August 2019; pp. 9695–9698. [Google Scholar]
- Jiang, X.; Min, X.; Ye, T.; Li, X.; Hu, X. Monitoring the Subsidence at Different Periods in High Underground Water Level Coal Mine Areas Using Differential Interferometric Synthetic Aperture Radar (D-InSAR). Geocarto Int. 2023, 38, 2215730. [Google Scholar] [CrossRef]
- Fan, H.; Gu, W.; Qin, Y.; Xue, J.; Chen, B. A Model for Extracting Large Deformation Mining Subsidence Using D-InSAR Technique and Probability Integral Method. Trans. Nonferrous Met. Soc. China 2014, 24, 1242–1247. [Google Scholar] [CrossRef]
- Wang, H.; Feng, G.; Xu, B.; Yu, Y.; Li, Z.; Du, Y.; Zhu, J. Deriving Spatio-Temporal Development of Ground Subsidence Due to Subway Construction and Operation in Delta Regions with PS-InSAR Data: A Case Study in Guangzhou, China. Remote Sens. 2017, 9, 1004. [Google Scholar] [CrossRef]
- Han, Y.; Tao, Q.; Liu, G.; Hou, A.; Guo, Z.; Wang, F. Accuracy Verification and Correction of Ascending and Descending SBAS- and MSBAS-InSAR in Monitoring Mining Surface Subsidence. Geocarto Int. 2022, 37, 16370–16397. [Google Scholar] [CrossRef]
- Yan, Y.; Doin, M.-P.; Lopez-Quiroz, P.; Tupin, F.; Fruneau, B.; Pinel, V.; Trouve, E. Mexico City Subsidence Measured by InSAR Time Series: Joint Analysis Using PS and SBAS Approaches. IEEE J. Sel. Top. Appl. Earth Obs. Remote Sens. 2012, 5, 1312–1326. [Google Scholar] [CrossRef]
- Bayramov, E.; Buchroithner, M.; Kada, M. Radar Remote Sensing to Supplement Pipeline Surveillance Programs through Measurements of Surface Deformations and Identification of Geohazard Risks. Remote Sens. 2020, 12, 3934. [Google Scholar] [CrossRef]
- Li, Y.; Zuo, X.; Yang, F.; Bu, J.; Wu, W.; Liu, X. Effectiveness Evaluation of DS-InSAR Method Fused PS Points in Surface Deformation Monitoring: A Case Study of Hongta District, Yuxi City, China. Geomat. Nat. Hazards Risk 2023, 14, 2176011. [Google Scholar] [CrossRef]
- Zhang, P.; Guo, Z.; Guo, S.; Xia, J. Land Subsidence Monitoring Method in Regions of Variable Radar Reflection Characteristics by Integrating PS-InSAR and SBAS-InSAR Techniques. Remote Sens. 2022, 14, 3265. [Google Scholar] [CrossRef]
- Li, D.; Hou, X.; Song, Y.; Zhang, Y.; Wang, C. Ground Subsidence Analysis in Tianjin (China) Based on Sentinel-1A Data Using MT-InSAR Methods. Appl. Sci. 2020, 10, 5514. [Google Scholar] [CrossRef]
- Li, Y.; Yang, K.; Zhang, J.; Hou, Z.; Wang, S.; Ding, X. Research on Time Series InSAR Monitoring Method for Multiple Types of Surface Deformation in Mining Area. Nat. Hazards 2022, 114, 2479–2508. [Google Scholar] [CrossRef]
- Huang, C.; Guo, J.; Yu, X.; Nie, Z. Ground Deformation Monitoring in Tongzhou Based on High Resolution SAR Images. J. Indian Soc. Remote Sens. 2016, 44, 495–504. [Google Scholar] [CrossRef]
- Wang, H.; Li, K.; Zhang, J.; Hong, L.; Chi, H. Monitoring and Analysis of Ground Surface Settlement in Mining Clusters by SBAS-InSAR Technology. Sensors 2022, 22, 3711. [Google Scholar] [CrossRef]
- Xiao, B.; Zhao, J.; Li, D.; Zhao, Z.; Xi, W.; Zhou, D. The Monitoring and Analysis of Land Subsidence in Kunming (China) Supported by Time Series InSAR. Sustainability 2022, 14, 12387. [Google Scholar] [CrossRef]
- Ng, A.; Wang, H.; Dai, Y.; Pagli, C.; Chen, W.; Ge, L.; Du, Z.; Zhang, K. InSAR Reveals Land Deformation at Guangzhou and Foshan, China between 2011 and 2017 with COSMO-SkyMed Data. Remote Sens. 2018, 10, 813. [Google Scholar] [CrossRef]
- Zhao, Q.; Lin, H.; Jiang, L.; Chen, F.; Cheng, S. A Study of Ground Deformation in the Guangzhou Urban Area with Persistent Scatterer Interferometry. Sensors 2009, 9, 503–518. [Google Scholar] [CrossRef] [PubMed]
- Ao, M.; Wang, C.; Xie, R.; Zhang, X.; Hu, J.; Du, Y.; Li, Z.; Zhu, J.; Dai, W.; Kuang, C. Monitoring the Land Subsidence with Persistent Scatterer Interferometry in Nansha District, Guangdong, China. Nat. Hazards 2015, 75, 2947–2964. [Google Scholar] [CrossRef]
- Ma, P.; Wang, W.; Zhang, B.; Wang, J.; Shi, G.; Huang, G.; Chen, F.; Jiang, L.; Lin, H. Remotely Sensing Large- and Small-Scale Ground Subsidence: A Case Study of the Guangdong–Hong Kong–Macao Greater Bay Area of China. Remote Sens. Environ. 2019, 232, 111282. [Google Scholar] [CrossRef]
- Hussain, M.A.; Chen, Z.; Shoaib, M.; Shah, S.U.; Khan, J.; Ying, Z. Sentinel-1A for Monitoring Land Subsidence of Coastal City of Pakistan Using Persistent Scatterers In-SAR Technique. Sci. Rep. 2022, 12, 5294. [Google Scholar] [CrossRef] [PubMed]
- Kumar, S.; Kumar, D.; Chaudhary, S.K.; Singh, N.; Malik, K.K. Land Subsidence Mapping and Monitoring Using Modified Persistent Scatterer Interferometric Synthetic Aperture Radar in Jharia Coalfield, India. J. Earth Syst. Sci. 2020, 129, 146. [Google Scholar] [CrossRef]
- Modeste, G.; Doubre, C.; Masson, F. Time Evolution of Mining-Related Residual Subsidence Monitored over a 24-Year Period Using InSAR in Southern Alsace, France. Int. J. Appl. Earth Obs. Geoinf. 2021, 102, 102392. [Google Scholar] [CrossRef]
- Minh, D.H.T.; Tran, Q.C.; Pham, Q.N.; Dang, T.T.; Nguyen, D.A.; El-Moussawi, I.; Le Toan, T. Measuring Ground Subsidence in Ha Noi Through the Radar Interferometry Technique Using TerraSAR-X and Cosmos SkyMed Data. IEEE J. Sel. Top. Appl. Earth Obs. Remote Sens. 2019, 12, 3874–3884. [Google Scholar] [CrossRef]
- Umarhadi, D.A.; Avtar, R.; Widyatmanti, W.; Johnson, B.A.; Yunus, A.P.; Khedher, K.M.; Singh, G. Use of Multifrequency (C-band and L-band) SAR Data to Monitor Peat Subsidence Based on Time-series SBAS InSAR Technique. Land Degrad. Dev. 2021, 32, 4779–4794. [Google Scholar] [CrossRef]
- Yeşilmaden, H.M.; İnan, Ç.A.; Kurtuluş, B.; Canoğlu, M.C.; Avşar, Ö.; Razack, M. Land Subsidence Assessment under Excessive Groundwater Pumping Using ESA Sentinel-1 Satellite Data: A Case Study of Konya Basin, Turkey. Environ. Earth Sci. 2021, 80, 409. [Google Scholar] [CrossRef]
- Ramirez, R.A.; Lee, G.-J.; Choi, S.-K.; Kwon, T.-H.; Kim, Y.-C.; Ryu, H.-H.; Kim, S.; Bae, B.; Hyun, C. Monitoring of Construction-Induced Urban Ground Deformations Using Sentinel-1 PS-InSAR: The Case Study of Tunneling in Dangjin, Korea. Int. J. Appl. Earth Obs. Geoinf. 2022, 108, 102721. [Google Scholar] [CrossRef]
- Peng, M.; Lu, Z.; Zhao, C.; Motagh, M.; Bai, L.; Conway, B.D.; Chen, H. Mapping Land Subsidence and Aquifer System Properties of the Willcox Basin, Arizona, from InSAR Observations and Independent Component Analysis. Remote Sens. Environ. 2022, 271, 112894. [Google Scholar] [CrossRef]
- Mohammadimanesh, F.; Salehi, B.; Mahdianpari, M.; English, J.; Chamberland, J.; Alasset, P.-J. Monitoring Surface Changes in Discontinuous Permafrost Terrain Using Small Baseline SAR Interferometry, Object-Based Classification, and Geological Features: A Case Study from Mayo, Yukon Territory, Canada. GIScience Remote Sens. 2019, 56, 485–510. [Google Scholar] [CrossRef]
- Luo, J.; Zhou, X.; Huang, Y.; Liu, Y.; Zhang, Z.; Zeng, L. The Influence of Land Use Change on the Ecosystem Service Value in Nansha District. J. South China Norm. Univ. Nat. Sci. Ed. 2022, 54, 100–110. [Google Scholar]
- Chen, G.; Yu, H.; Li, B.; Chen, C.; Xu, D.; Sun, J. Characteristics of Land Use Changes in Nansha District, Guangzhou Based on GF-1 Remote Sensing Images. Pearl River 2023, 44, 54–63. [Google Scholar]
- Edalat, A.; Khodaparast, M.; Rajabi, A.M. Detecting Land Subsidence Due to Groundwater Withdrawal in Aliabad Plain, Iran, Using ESA Sentinel-1 Satellite Data. Nat. Resour. Res. 2020, 29, 1935–1950. [Google Scholar] [CrossRef]
- Lin, G. Land Subsidence Monitoring and Influencing Factors Analysis in Nansha District of Guangzhou Based on Time Series InSAR. Master’s Thesis, Guangzhou University, Guangzhou, China, 2021. [Google Scholar]
- Lanari, R.; Mora, O.; Manunta, M.; Mallorqui, J.J.; Berardino, P.; Sansosti, E. A Small-Baseline Approach for Investigating Deformations on Full-Resolution Differential SAR Interferograms. IEEE Trans. Geosci. Remote Sens. 2004, 42, 1377–1386. [Google Scholar] [CrossRef]
- He, M. TS-InSAR Atmospheric Delay Estimating Based on Terrain 3D Information and Its Application on Urban Subsidence Monitoring. Master’s Thesis, Southwest Jiaotong University, Chengdu, China, 2018. [Google Scholar]
- Berardino, P.; Fornaro, G.; Lanari, R.; Sansosti, E. A New Algorithm for Surface Deformation Monitoring Based on Small Baseline Differential SAR Interferograms. IEEE Trans. Geosci. Remote Sens. 2002, 40, 2375–2383. [Google Scholar] [CrossRef]
- Zhang, X.; He, L.; Liu, C.; Wang, X.; Tang, Y.; He, R. Monitoring and Analysis of Coal Mining Subsidence based on SBAS-InSAR Method. Remote Sens. Technol. Appl. 2022, 37, 1021–1028. [Google Scholar]
- Tarighat, F.; Foroughnia, F.; Perissin, D. Monitoring of Power Towers’ Movement Using Persistent Scatterer SAR Interferometry in South West of Tehran. Remote Sens. 2021, 13, 407. [Google Scholar] [CrossRef]
- Guo, C.; Yan, Y.; Zhang, Y.; Zhang, X.; Zheng, Y.; Li, X.; Yang, Z.; Wu, R. Study on the Creep-Sliding Mechanism of the Giant Xiongba Ancient Landslide Based on the SBAS-InSAR Method, Tibetan Plateau, China. Remote Sens. 2021, 13, 3365. [Google Scholar] [CrossRef]
- Liu, L.; Yu, J.; Chen, B.; Wang, Y. Urban Subsidence Monitoring by SBAS-InSAR Technique with Multi-Platform SAR Images: A Case Study of Beijing Plain, China. Eur. J. Remote Sens. 2020, 53, 141–153. [Google Scholar] [CrossRef]
- Xiao, L.; He, Y.; Xing, X.; Wen, D.; Tong, C.; Chen, L.; Yu, X. Time series subsidence analysis of drilling solution miningrock salt mines based on Sentinel-1 data and SBAS-InSAR technique. Natl. Remote Sens. Bull. 2019, 23, 501–513. [Google Scholar] [CrossRef]
- Dashti, Z.; Nakhaei, M.; Vadiati, M.; Karami, G.H.; Kisi, O. A Literature Review on Pumping Test Analysis (2000–2022). Environ. Sci. Pollut. Res. 2022, 30, 9184–9206. [Google Scholar] [CrossRef] [PubMed]
- Zhang, Y.; Huang, H.; Liu, Y.; Bi, H.; Zhang, Z.; Wang, K.; Yan, L. Impacts of Soft Soil Compaction and Groundwater Extraction on Subsidence in the Yellow River Delta. Mar. Georesour. Geotechnol. 2021, 39, 1497–1504. [Google Scholar] [CrossRef]
- Liu, F.; Huang, C.; Zheng, X.; Zhao, X. Supporting Services Guangzhou City Planning and Construction and Green Development Resources and Environment Atlas Data Set. Geol. China 2019, 46, 102–109, (In Chinese with English abstract). [Google Scholar]
- Lu, Q.; Bai, J.; Zhang, G.; Wu, J. Effects of Coastal Reclamation History on Heavy Metals in Different Types of Wetland Soils in the Pearl River Delta: Levels, Sources and Ecological Risks. J. Clean. Prod. 2020, 272, 122668. [Google Scholar] [CrossRef]
- Bai, Z.; Wang, Y.; Li, M.; Sun, Y.; Zhang, X.; Wu, Y.; Li, Y.; Li, D. Land Subsidence in the Singapore Coastal Area with Long Time Series of TerraSAR-X SAR Data. Remote Sens. 2023, 15, 2415. [Google Scholar] [CrossRef]
- Liu, P.; Chen, X.; Li, Z.; Zhang, Z.; Xu, J.; Feng, W.; Wang, C.; Hu, Z.; Tu, W.; Li, H. Resolving Surface Displacements in Shenzhen of China from Time Series InSAR. Remote Sens. 2018, 10, 1162. [Google Scholar] [CrossRef]
- Cao, G.; Han, D.; Moser, J. Groundwater Exploitation Management Under Land Subsidence Constraint: Empirical Evidence from the Hangzhou–Jiaxing–Huzhou Plain, China. Environ. Manag. 2013, 51, 1109–1125. [Google Scholar] [CrossRef]
- Liu, Z.; Wang, Y.; Ke, X.; Luo, X. Distribution characteristics and causes of land subsidence in Nansha District, Guangzhou. Chin. J. Geol. Hazard Control 2023, 34, 49–57. [Google Scholar] [CrossRef]
- Dashti, Z.; Nakhaei, M.; Vadiati, M.; Karami, G.H.; Kisi, O. Estimation of Unconfined Aquifer Transmissivity Using a Comparative Study of Machine Learning Models. Water Resour. Manag. 2023, 37, 4909–4931. [Google Scholar] [CrossRef]
- Chen, B.; Gong, H.; Li, X.; Lei, K.; Ke, Y.; Duan, G.; Zhou, C. Spatial Correlation between Land Subsidence and Urbanization in Beijing, China. Nat. Hazards 2015, 75, 2637–2652. [Google Scholar] [CrossRef]
- Zhang, J.; Ke, C.; Shen, X.; Lin, J.; Wang, R. Monitoring Land Subsidence along the Subways in Shanghai on the Basis of Time-Series InSAR. Remote Sens. 2023, 15, 908. [Google Scholar] [CrossRef]
- Yang, Y.; Lu, X.; Chen, J.; Li, N. Factor Mobility, Transportation Network and Green Economic Growth of the Urban Agglomeration. Sci. Rep. 2022, 12, 20094. [Google Scholar] [CrossRef]


Disclaimer/Publisher’s Note: The statements, opinions and data contained in all publications are solely those of the individual author(s) and contributor(s) and not of MDPI and/or the editor(s). MDPI and/or the editor(s) disclaim responsibility for any injury to people or property resulting from any ideas, methods, instructions or products referred to in the content. |
© 2023 by the authors. Licensee MDPI, Basel, Switzerland. This article is an open access article distributed under the terms and conditions of the Creative Commons Attribution (CC BY) license (https://creativecommons.org/licenses/by/4.0/).