
Impact of Climate Change and Human Activities to Runoff in the Du River Basin of the Qinling-Daba Mountains, China

Abstract
:1. Introduction
2. Study Area and Data
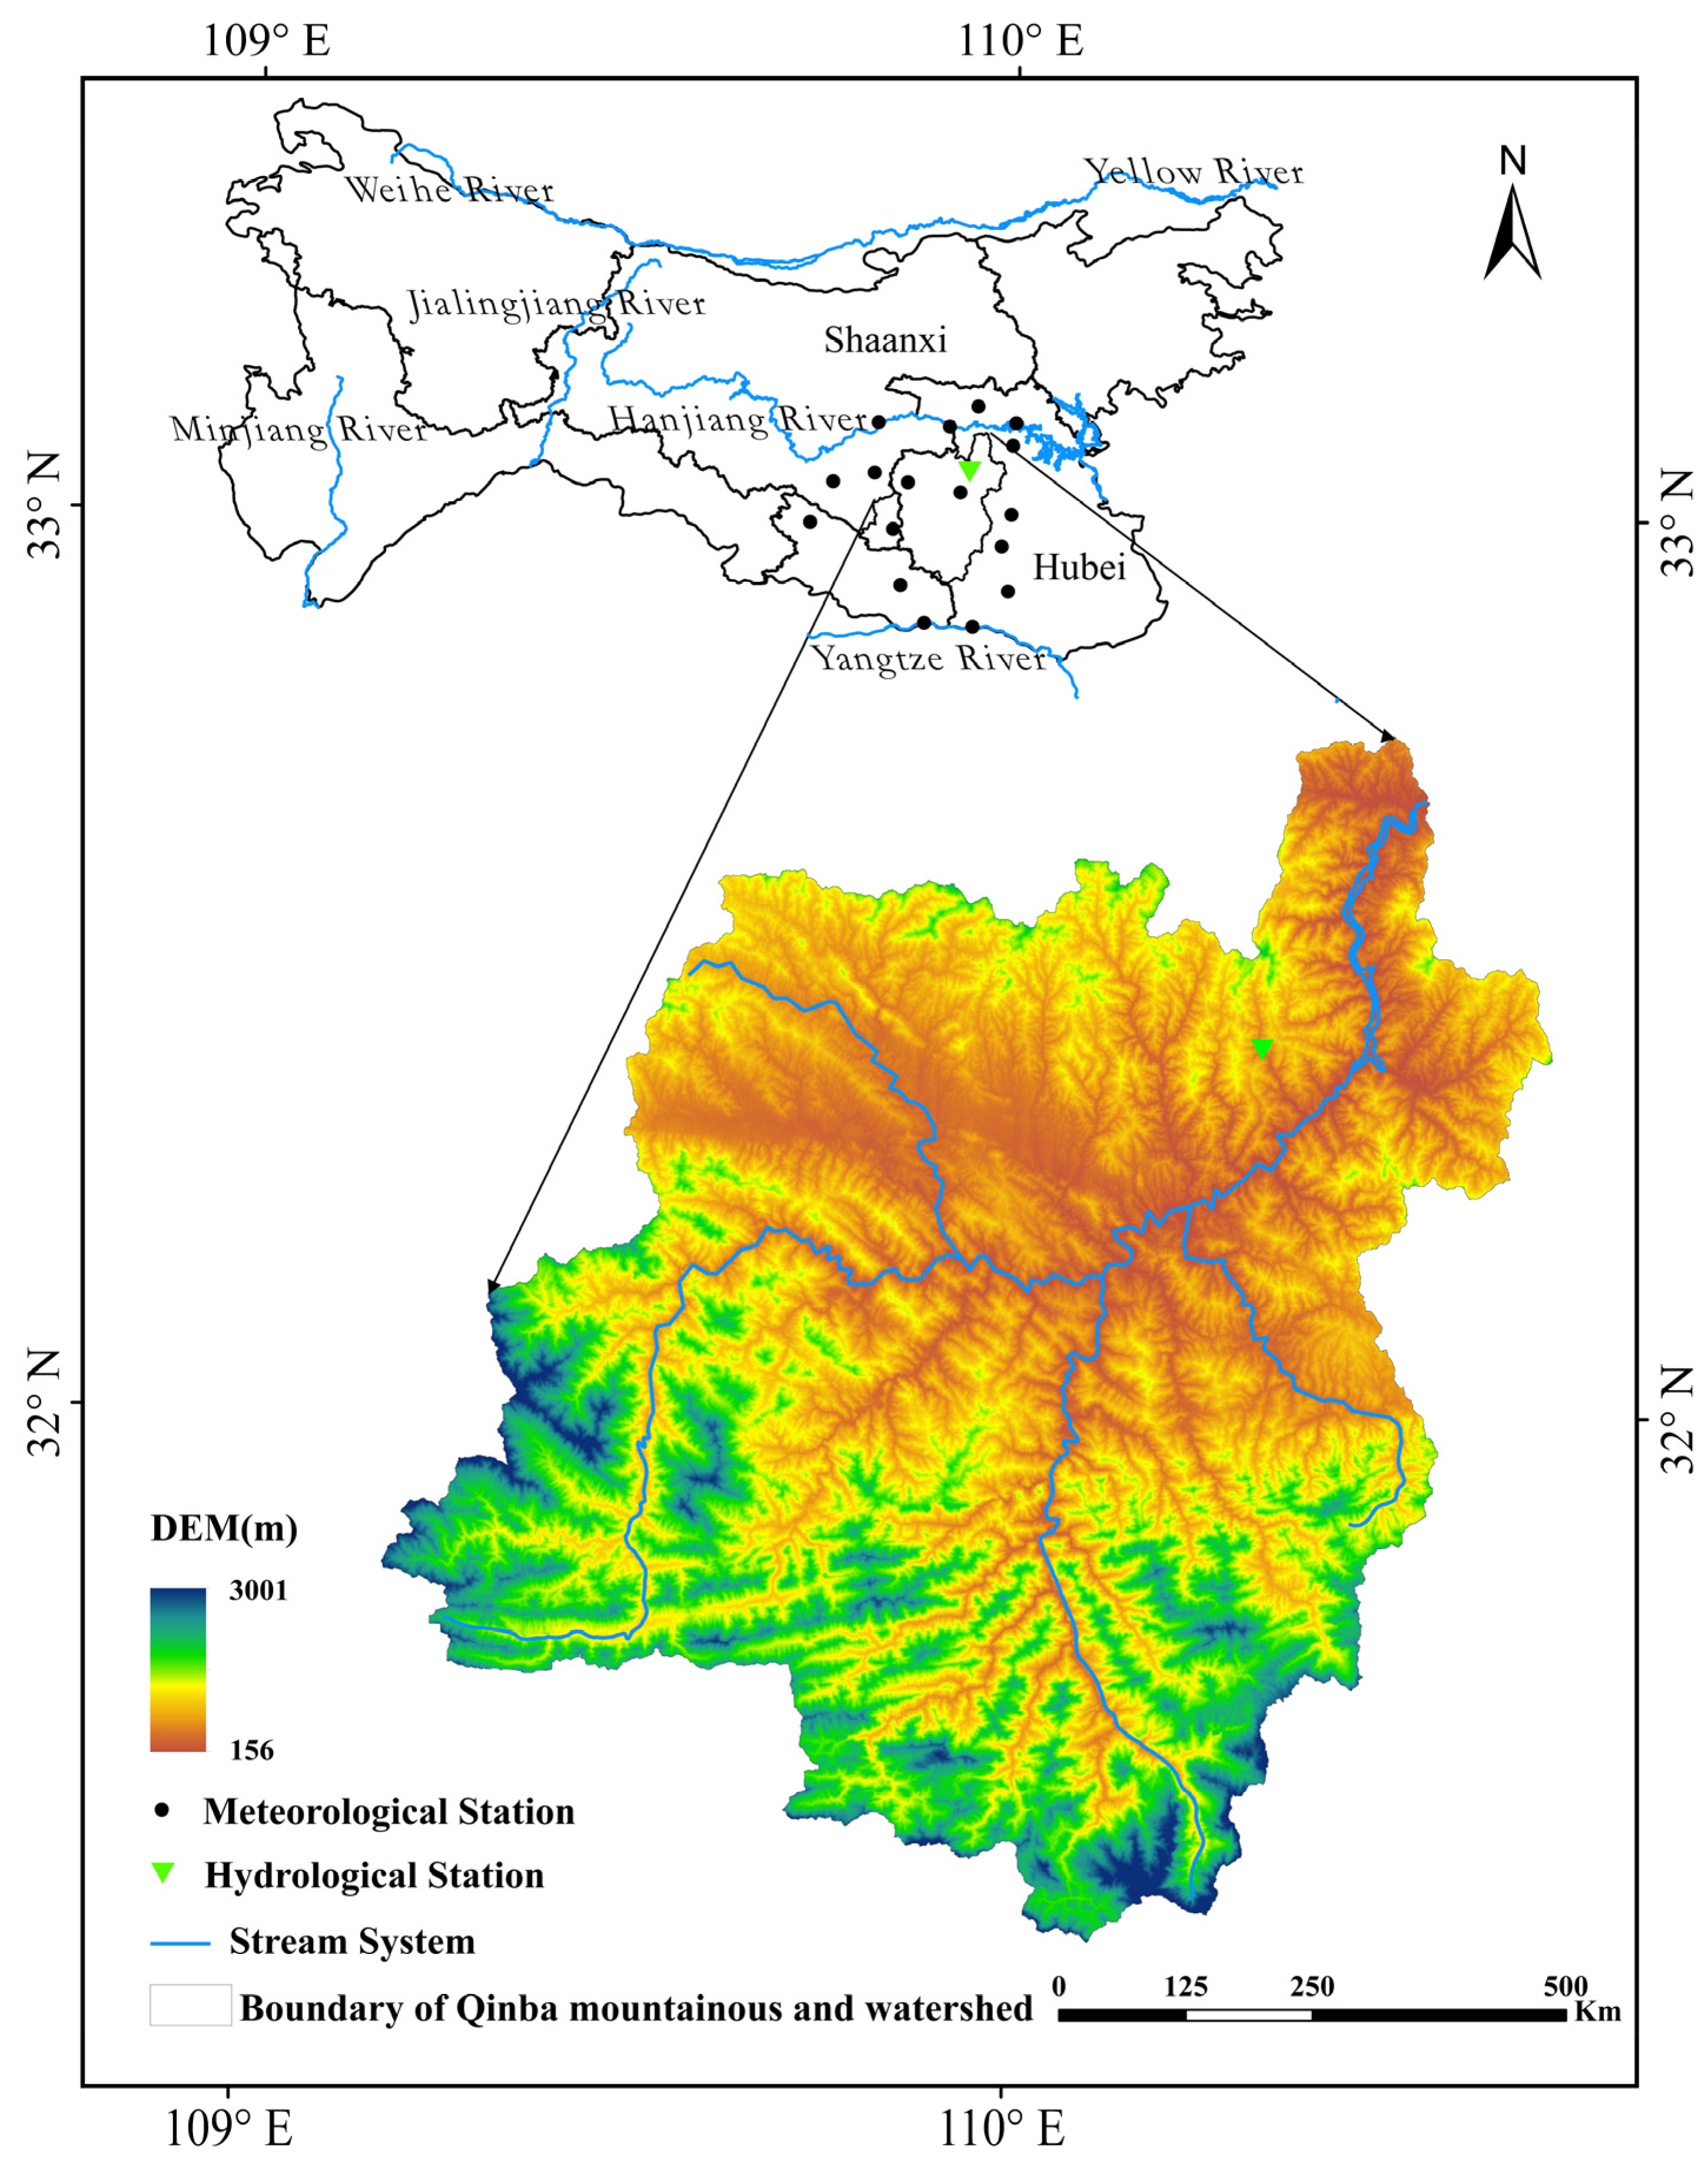
2.1. Study Area
2.2. Data
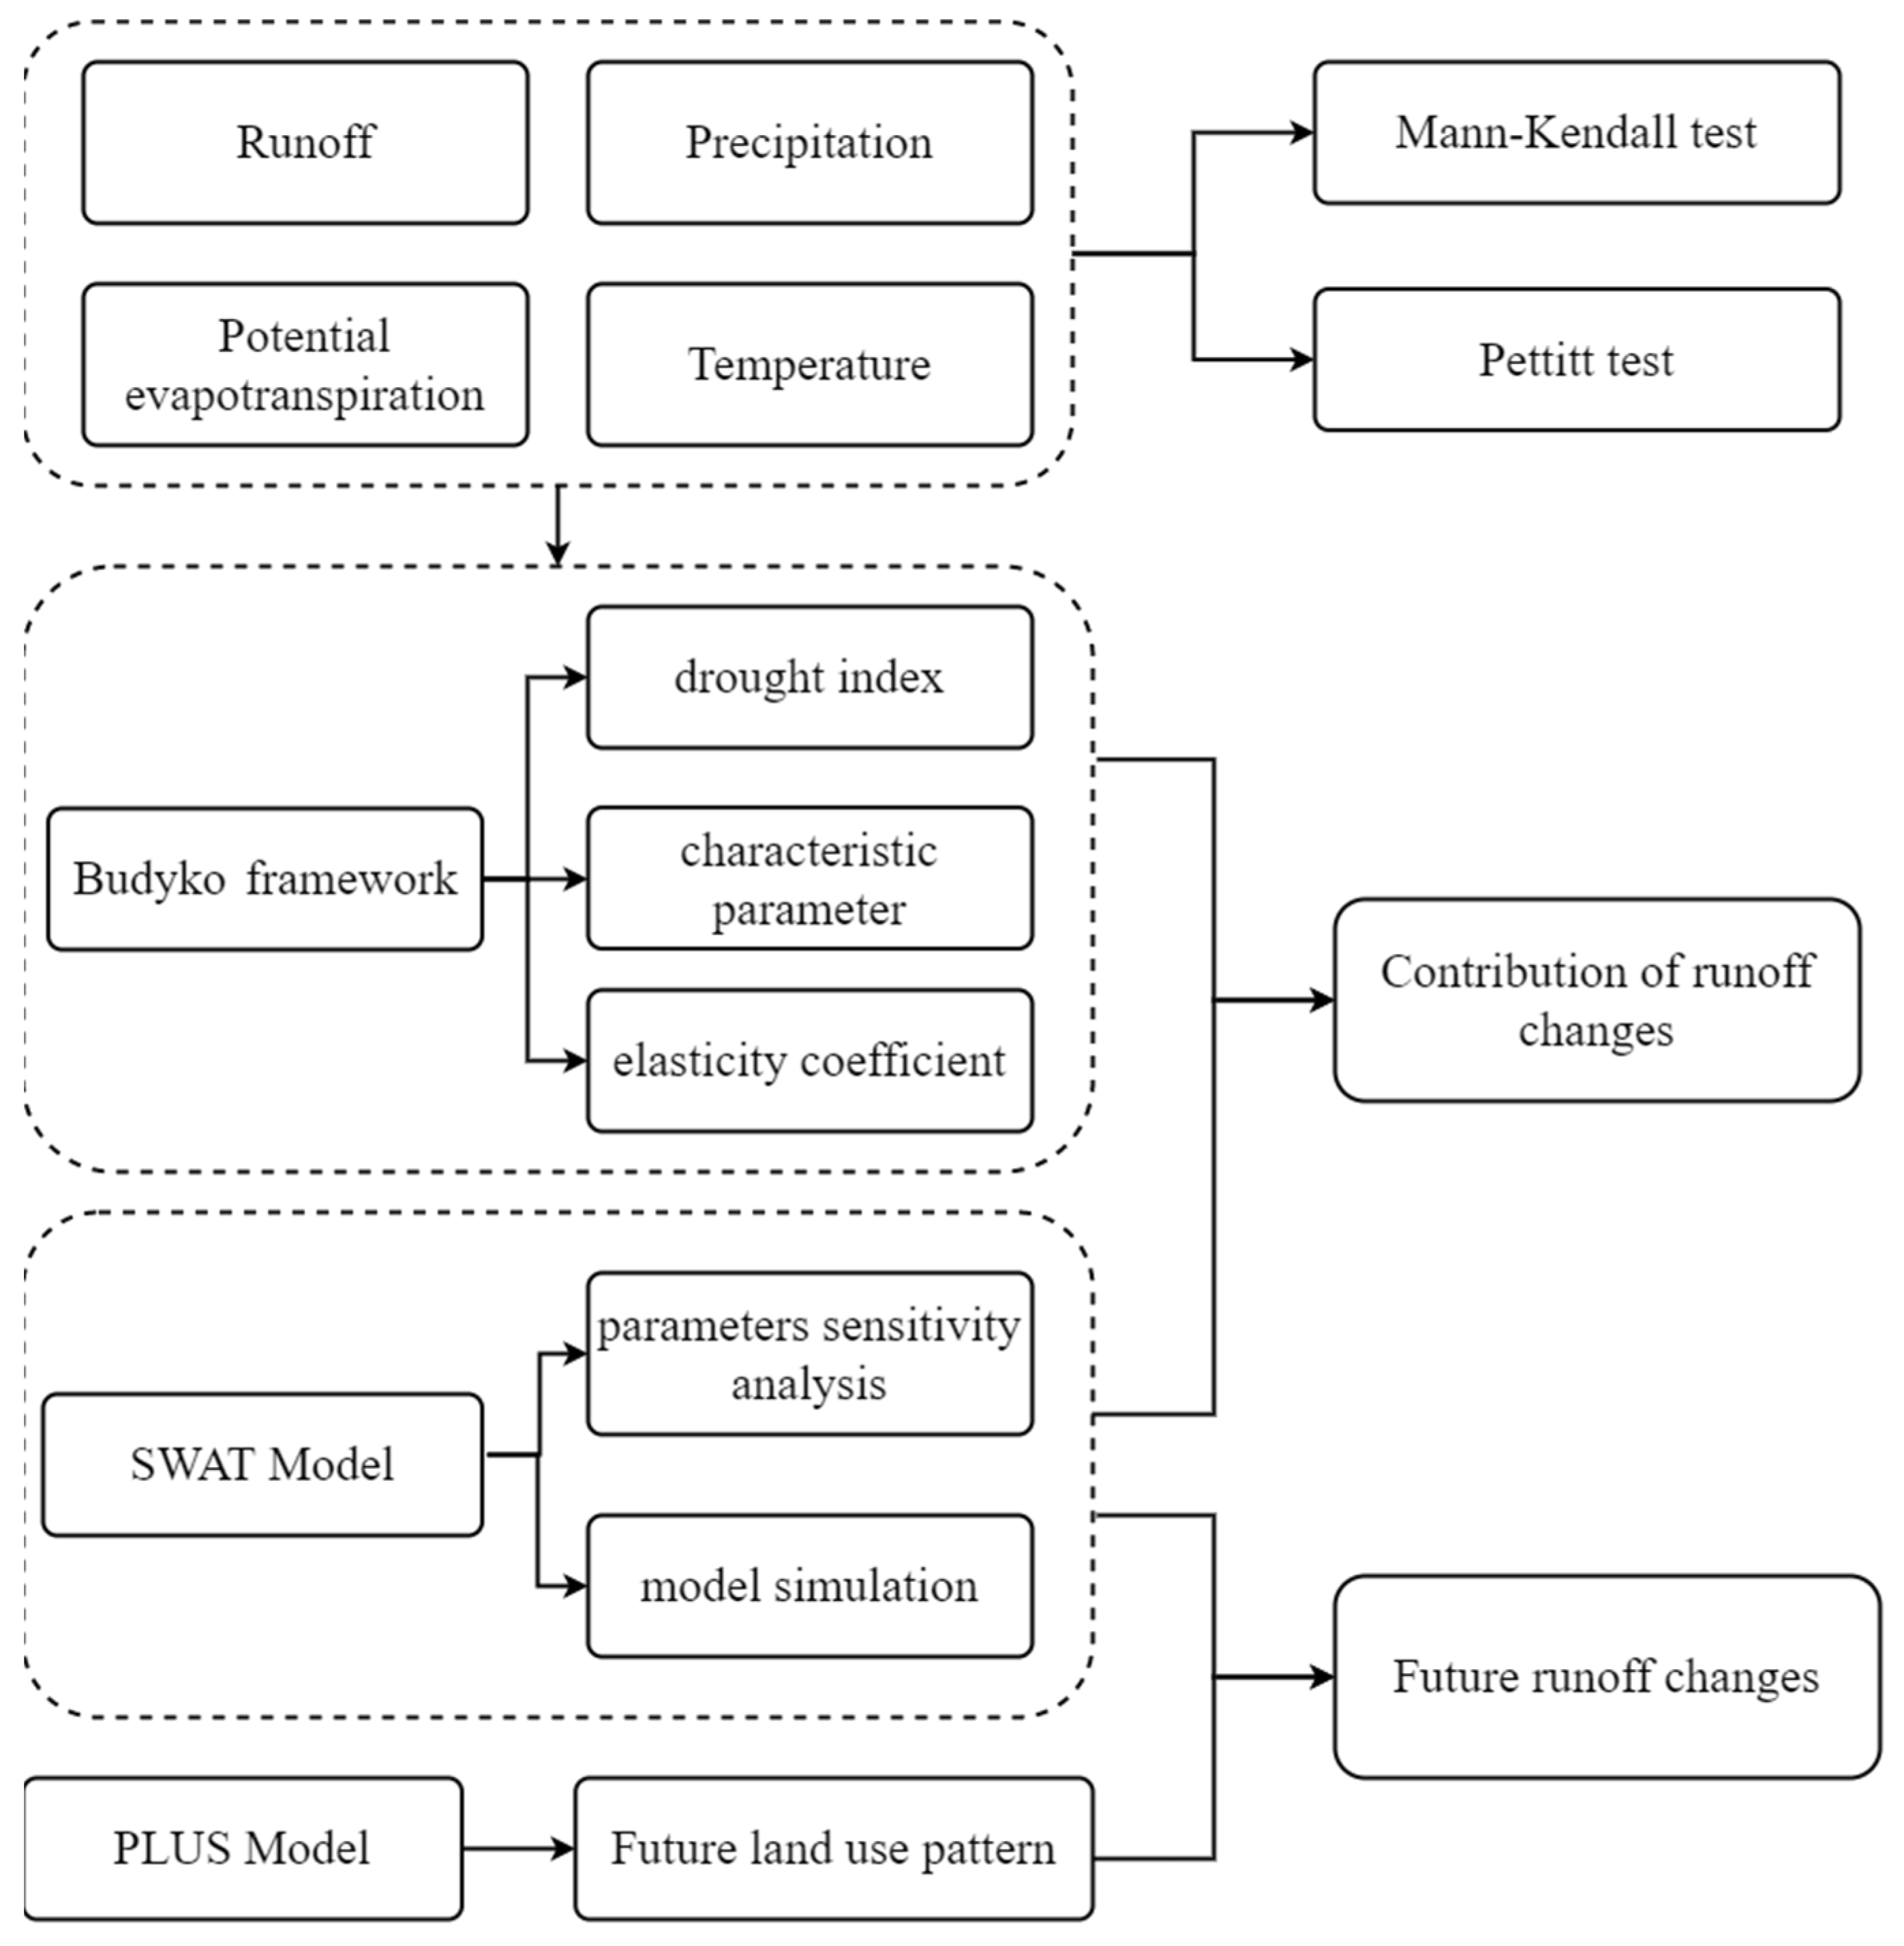
3. Methodology
3.1. Statistics Method
3.2. Budyko Framework
3.2.1. Water Balance Equation
3.2.2. Sensitivity Analysis
3.2.3. Analysis of Contribution to Runoff Changes
3.3. SWAT Model
3.4. PLUS Model
4. Results
4.1. Trend Variation of Hydrometeorological Elements
4.2. Contribution of Runoff Changes Based on Budyko Framework
4.2.1. Runoff Sensitivity Analysis
4.2.2. Quantitative Contribution of Different Factors to Runoff Changes
4.3. Contribution of Runoff Changes Based on SWAT Model
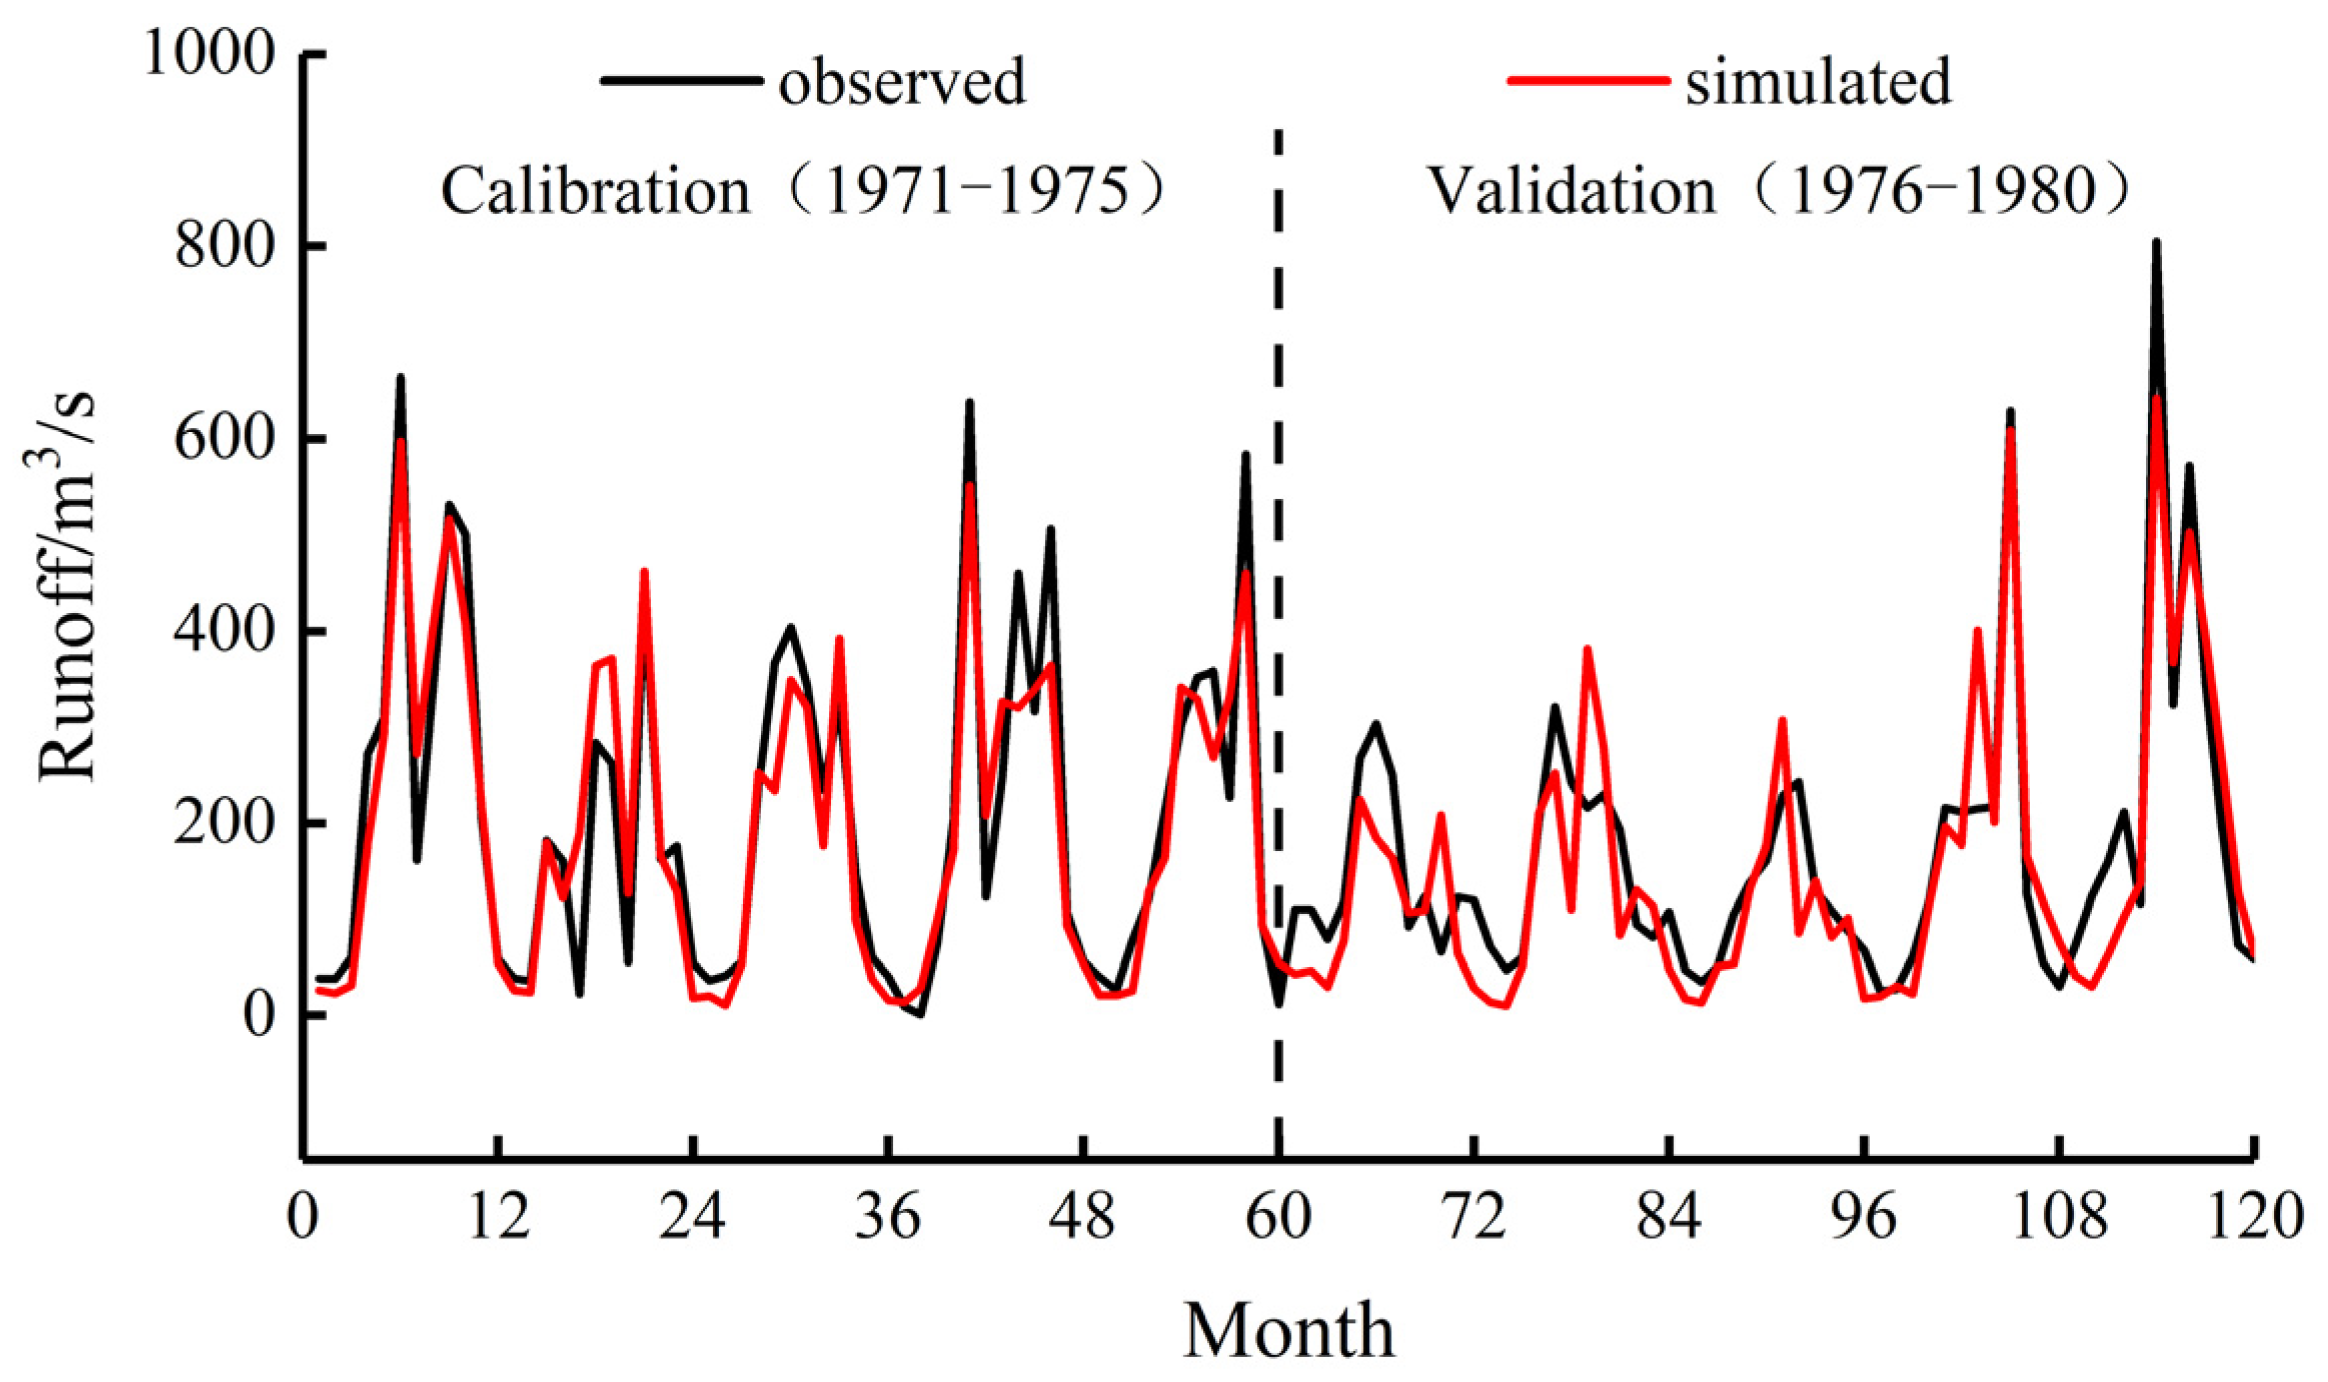
4.3.1. SWAT Model Construction
4.3.2. Quantitative Contribution of Different Factors to Runoff Changes
4.4. Prediction of Future Runoff Changes
4.4.1. Prediction of Land Use Change in 2025
4.4.2. Trend Analysis of Future Runoff Changes
5. Discussion
6. Conclusions
Author Contributions
Funding
Data Availability Statement
Conflicts of Interest
References
- Chen, Y.N.; Li, B.F.; Li, Z.; Li, W.H. Water resource formation and conversion and water security in arid region of Northwest China. J. Geogr. Sci. 2016, 26, 939–952. [Google Scholar]
- Yang, L.; Zhao, G.J.; Tian, P.; Mu, X.M.; Tian, X.J.; Feng, J.H.; Bai, Y.P. Runoff changes in the major river basins of China and their responses to potential driving forces. J. Hydrol. 2022, 607, 127536. [Google Scholar]
- Senbeta, B.T.; Romanowicz, J.R. The role of climate change and human interventions in affecting watershed runoff responses. Hydrol. Process. 2021, 35, e14448. [Google Scholar]
- Chen, M.J.; Wang, H.; Wang, F. Water-driven ecological evolution mechanism in inland arid region. Acta Ecol. Sin. 2004, 10, 2108–2114. [Google Scholar]
- Rodríguez-Rodríguez, M.; Green, A.J.; López, R.; Martos-Rosillo, S. Changes in water level, land use, and hydrological budget in a semi-permanent playa lake, Southwest Spain. Environ. Monit. Assess. 2012, 184, 797–810. [Google Scholar] [PubMed]
- Stathi, E.; Kastridis, A.; Myronidis, D. Analysis of Hydrometeorological Characteristics and Water Demand in Semi-Arid Mediterranean Catchments under Water Deficit Conditions. Climate 2023, 11, 137. [Google Scholar]
- Destouni, G.; Jaramillo, F.; Prieto, C. Hydroclimatic shifts driven by human water use for food and energy production. Nat. Clim. Change 2013, 3, 213–217. [Google Scholar] [CrossRef]
- Wan, L.; Ye, X.; Lee, J.; Lu, X.Q.; Zheng, L.; Wu, K.Y. Effects of urbanization on ecosystem service values in a mineral resource-based city. Habitat Int. 2015, 46, 54–63. [Google Scholar]
- Song, X.M.; Zhang, J.Y.; Zhan, C.S.; Liu, C.Z. Review for impacts of climate change and human activities on water cycle. J. Hydraul. Eng. 2013, 44, 779–790. [Google Scholar]
- Zheng, H.Y.; Miao, C.Y.; Zhang, G.H.; Li, X.Y.; Wang, S.; Wu, J.W.; Gou, J.J. Is the runoff coefficient increasing or decreasing after ecological restoration on China’s Loess Plateau? Int. Soil Water Conserv. Res. 2021, 9, 333–343. [Google Scholar]
- Dey, P.; Mishra, A. Separating the impacts of climate change and human activities on streamflow: A review of methodologies and critical assumptions. J. Hydrol. 2017, 548, 278–290. [Google Scholar] [CrossRef]
- Ning, Y.N.; Yang, X.N.; Sun, W.Y.; Mu, X.M.; Gao Peng Zhao, G.J.; Song, X.Y. Variation trend and attribution of runoff in the middle reaches of the Yellow River. J. Nat. Resour. 2021, 36, 256–269. [Google Scholar]
- Wang, Q.M.; Zhang, J.B.; Fu, Y.C. Runoff Change and Its Influencing Factors Under Changing Environment in Tarim River. Bull. Soil Water Conserv. 2010, 30, 99–103. [Google Scholar]
- Wang, X. Advances in separating effects of climate variability and human activity on stream discharge: An overview. Adv. Water Resour. 2014, 71, 209–218. [Google Scholar] [CrossRef]
- Han, J.C.; Huang, G.H.; Li, G.Q.; Li, W. Parameter Uncertainty Analysis and Daily Streamfiow Simulation of SLURP Hydrologic Model Based on Bayesian Theory. Water Rwsources Power 2013, 31, 13–17. [Google Scholar]
- Li, L.C.; Zhang, L.P.; Xia, J.; Shan, L.J.; Li, L. Quantitative Assessment of Impacts of Climate Variability and Human Activities on Runoff Change in the Typical Basin of the MiddleRoute of the South-to-North Water Transfer Project. Clim. Change Res. 2014, 10, 118–126. [Google Scholar]
- Lin, R.L.; Zhuo, W.S.; Gao, Y.K.; Gao, Y.J.; Fu, H.E.; Liu, Z.F. Assessment of ecohydrological regulation service in the Beijiang River Basin based on SWAT model. Water Resour. Prot. 2020, 36, 131–136. [Google Scholar]
- Caracciolo, D.; Pumo, D.; Viola, F. Budyko’s Based Method for Annual Runoff Characterization across Different Climatic Areas: An Application to United States. Water Resour. Manag. 2018, 32, 3189–3202. [Google Scholar] [CrossRef]
- Krajewski, A.; Sikorska-Senoner, A.; Hejduk, L.; Banasik, K. An attempt to decompose the impact of land use and climate change on annual runoff in a small agricultural catchment. Water Resour. Manag. 2021, 35, 881–896. [Google Scholar] [CrossRef]
- Busico, G.; Colombani, N.; Fronzi, D.; Pellegrini, M.; Tazioli, A.; Mastrocicco, M. Evaluating SWAT model performance, considering different soils data input, to quantify actual and future runoff susceptibility in a highly urbanized basin. J. Environ. Manag. 2020, 266, 110625. [Google Scholar] [CrossRef]
- Pervez, M.S.; Henebry, G.M. Assessing the impacts of climate and land use and land cover change on the freshwater availability in the Brahmaputra River basin. J. Hydrol. Reg. Stud. 2015, 3, 285–311. [Google Scholar] [CrossRef]
- Marhaento, H.; Booij, M.J.; Rientjes, T.H.M.; Hoekstra, A.Y. Attribution of changes in the water balance of a tropical catchment to land use change using the SWAT model. Hydrol. Process. 2017, 31, 2029–2040. [Google Scholar] [CrossRef]
- Fanta, S.S.; Sime, C.H. Performance assessment of SWAT and HEC-HMS model for runoff simulation of Toba watershed, Ethiopia. Sustain. Water Resour. Manag. 2022, 8, 8. [Google Scholar] [CrossRef]
- Yang, Q.L.; Luo, S.S.; Wu, H.C.; Wang, G.Q.; Han, D.W.; Lu, H.S.; Shao, J.M. Attribution analysis for runoff change on multiple scales in a humid subtropical basin dominated by forest, East China. Forests 2019, 10, 184. [Google Scholar] [CrossRef]
- Yang, Q.; Liu, D.F.; Meng, X.M.; Huang, Q.; Lin, M. Quantitative analysis of impacts of environment changes on runoff in upper Han River. J. Hydroelectr. Eng. 2019, 38, 73–84. [Google Scholar]
- Xu, R.R.; Qiu, D.X.; Wu, C.X.; Mu, X.M.; Zhao, G.J.; Sun, W.Y.; Gao, P. Quantifying climate and anthropogenic impacts on runoff using the SWAT model, a Budyko-based approach and empirical methods. Hydrol. Sci. J. 2023, 68, 1358–1371. [Google Scholar] [CrossRef]
- Wang, D.B.; Hejazi, M. Quantifying the relative contribution of the climate and direct human impacts on mean annual streamflow in the contiguous United States. Water Resour. Res. 2011, 47, W00J12. [Google Scholar] [CrossRef]
- Xu, X.Y. Hydrological Response to Climate Change in Typical Catchments. Ph.D. Thesis, Tsinghua University, Beijing, China, 2012. [Google Scholar]
- Zhang, Y.R.; He, Y.; Li, Y.L.; Jia, L.P. Spatiotemporal variation and driving forces of NDVI from 1982 to 2015 in the Qinba Mountains, China. Environ. Sci. Pollut. Res. 2022, 29, 52277–52288. [Google Scholar] [CrossRef]
- Liang, X.Q.; Ji, C.M.; Yu, H.J.; Yan, X.R.; Zhang, Y.K. Analysis on Runoff Change Characteristics of Duhe River Basin during 1962–2015. Water Power 2019, 45, 4–8. [Google Scholar]
- Wang, Z.H.; He, D.C.; Lu, X.F. Analysis of Hydrological Characteristics of Duhe River Basin. J. China Hydrol. 2015, 35, 92–96. [Google Scholar]
- Liang, X.Q.; Zhang, Y.K.; Yan, X.R. Research on Evolution of Precipitation in Duhe River Basin. J. Gansu Norm. Coll. 2020, 25, 45–49. [Google Scholar]
- Gu, S.F.; Yu, W.Q.; Wu, S.J.; Jang, Y.X. Analysis on Runoff Variation Trend and Characteristics in Duhe River. J. Water Resour. Res. 2021, 10, 426–434. [Google Scholar] [CrossRef]
- Ma, Y.M.; Zhang, L.H.; Zhu, Z.R.; Fu, Y.S. Division of Duhe River Basin and analysis of its NDVI characteristics. J. Yunnan Univ. Nat. Sci. Ed. 2020, 42, 290–298. [Google Scholar]
- Pu, Y.H.; Zhang, Y.K.; Jiang, M.X.; Shi, D.L.; Cao, G.B.; Zheng, D.G. Study on Plant Diversity of Duheyuan Nature Rwserve on the Northern Slope of Shennongjia, Hubei, China. Plant Sci. J. 2006, 4, 327–332. [Google Scholar]
- Sun, H.B.; Wang, Y.Y.; Zhou, F.; Liu, M.Q.; Pan, H.; Zhang, D.G. Analysis of Characteristics and Causes of Water Discharge and Sediment Load Changes of Duhe River. Pearl River 2016, 37, 14–17. [Google Scholar]
- Allen, R.G.; Pereira, L.S.; Raes, D.; Smith, M. Crop Evapotranspiration Guidelines for Computing Crop Water Requirements; FAO Irrigation and Drainage Paper No. 56; FAO: Rome, Italy, 1998. [Google Scholar]
- Wu, X.; Wang, P.J.; Huo, Z.G.; Bai, Y.M. Spatio-temporal distribution characteristics of potential evapotranspriation and impact factors in China from 1961 to 2015. Resour. Sci. 2017, 39, 964–977. [Google Scholar]
- Sun, C.J.; Zheng, Z.J.; Li, X.G.; Sun, J.L. Spatio-temporal distribution of the potential evapotranspriation and its controlling factors in the tableland protected region of the LOESS Plateau. J. Nat. Resour. 2020, 35, 857–868. [Google Scholar]
- Zuo, D.X.; Zang, C.F.; Wang, L.N. Temporal and spatial variation of potential evaporation and its influencing factors in pearl river basin from 1980 to 2019. Pearl River 2022, 43, 41–49. [Google Scholar]
- Mann, H.B. Non-parametric test against trend. Econometrika 1945, 13, 245–259. [Google Scholar] [CrossRef]
- Kendall, M.G. Rank correlation methods. Br. J. Psychol. 1948, 25, 86–91. [Google Scholar] [CrossRef]
- Zhao, K.F.; Jing, L.; Ma, X.P.; Deng, C.H. The Effects of Land-Use and Climatic Changes on the Hydrological Environment in the Qinling Mountains of Shaanxi Province. Forests 2022, 13, 1776. [Google Scholar] [CrossRef]
- Burgan, H.I. The Short-Term and Seasonal Trend Detection of Sediment Discharges in Turkish Rivers. Rocz. Ochr. Sr. 2022, 24, 214–230. [Google Scholar]
- Feidas, H.; Makrogiannis, T.; Bora-Senta, E. Trend analysis of air temperature time series in Greece and their relationship with circulation using surface and satellite data: 1955–2001. Theor. Appl. Climatol. 2004, 79, 185–208. [Google Scholar] [CrossRef]
- Pettitt, A.N. A non-parametric approach to the change-point problem. J. R. Stat. Soc. 1979, 28, 126–135. [Google Scholar] [CrossRef]
- Zhang, Y.H.; Song, X.F. Techniques of abrupt change detection and trends analysis in hydroclimatic time-series: Advances and evaluation. Arid Land Geogr. 2015, 38, 652–665. [Google Scholar]
- Choudhury, B.J. Evaluation of an empirical equation for annual evaporation using field observations and results from a biophysical model. J. Hydrol. 1999, 216, 99–110. [Google Scholar] [CrossRef]
- Yang, H.B.; Yang, D.W.; Lei, Z.D.; Sun, F.B. New analytical derivation of the mean annual water-energy balance equation. Water Resour. Res. 2008, 44, W03410. [Google Scholar] [CrossRef]
- Yang, D.; Zhang, S.; Xu, X. Attribution analysis for runoff decline in Yellow River Basin during past fifty years based on Budyko hypothesis. Sci. Sin. Technol. 2015, 45, 1024–1034. [Google Scholar]
- Zhang, L.M.; Zhao, G.J.; Mu, X.M.; Gao, P.; Sun, W.Y. Attribution of runoff variation in the Wei River basin based on the Budyko hypothesis. Acta Ecol. Sin. 2018, 38, 7607–7617. [Google Scholar]
- Kiniry, J.; Williams, J.; Srinivasan, R. Soil and Water Assessment Tool User’s ManualVersion 2000; TWRI Report TR-192; Texas Water Resources Institute: College Station, TX, USA, 2002. [Google Scholar]
- Hu, J.; Ma, J.; Nie, C.; Xue, L.Q.; Zhang, Y.; Ni, F.Q.; Deng, Y.; Liu, J.S.; Zhou, D.K.; Li, L.H.; et al. Attribution Analysis of Runoff Change in Min-Tuo River Basin based on SWAT model simulations, China. Sci. Rep. 2020, 10, 2900. [Google Scholar] [CrossRef]
- Wu, H.; Chen, B. Evaluating uncertainty estimates in distributed hydrological modeling for the Wenjing River watershed in China by GLUE, SUFI-2, and ParaSol methods. Ecol. Eng. 2015, 76, 110–121. [Google Scholar] [CrossRef]
- Li, H.D.; Zeng, J.L.; Pan, Y.F.; Zhang, L.; Lai, Z.G. Quantitative Attribution of Runoff and Sediment Changes in the East River Basin and Impact on Erosion and Siltation of River Channel. Pearl River 2020, 41, 1–10. [Google Scholar]
- Nash, J.E.; Sutcliffe, J.V. River flow forecasting through conceptual models part I—A discussion of principles. J. Hydrol. 1970, 10, 282–290. [Google Scholar] [CrossRef]
- Gupta, H.V.; Sorooshian, S.; Yapo, P.O. Status of Automatic Calibration for Hydrologic Models: Comparison with Multilevel Expert Calibration. J. Hydrol. Eng. 1999, 4, 2. [Google Scholar] [CrossRef]
- Moriasi, D.N.; Arnold, J.G.; Van Liew, M.W.; Bingner, R.L.; Harmel, R.D.; Veith, T.L. Model Evaluation Guidelines for Systematic Quantification of Accuracy in Watershed Simulations. Trans. ASABE 2007, 50, 885–900. [Google Scholar] [CrossRef]
- Miao, Z.W.; Li, N.; Lu, M.; Xu, L.G. Attribution analysis of runoff variations in the upper reaches of Hutuo River Basin. J. Beijing Norm. Univ. (Nat. Sci.) 2021, 57, 756–767. [Google Scholar]
- Zhang, J.D.; Mei, Z.X.; Lv, J.H. Simulating multiple land use scenarios based on the FLUS model considering spatial auto-correlation. J. Geo-Inf. Sci. 2020, 22, 531–542. [Google Scholar] [CrossRef]
- Arnold, J.G.; Srinivasan, R.; Muttiah, R.S.; Williams, J.R. Large area hydrologic modeling and assessment, Part I:model development. J. Am. Water Resour. Assoc. 1998, 34, 73. [Google Scholar] [CrossRef]
- Niu, L.Q. The Study Based on the SWAT Model about the Climate and Landuse Change Affected on the Runoff-Set the Du River as an Example. Master’s Thesis, Central China Normal University, Wuhan, China, 2013. [Google Scholar]
- Peng, T.; Mei, Z.Y.; Dong, X.H.; Wang, J.B.; Liu, J.; Chang, W.J.; Wang, G.X. Attribution of runoff changes in the Hanjiang River basin based on Budyko hypothesis. South-to-North Water Transf. Water Sci. Technol. 2021, 19, 1114–1124. [Google Scholar]
- Xia, J.; Ma, X.Y.; Zou, L.; Wang, Y.L.; Jing, Z.X. Quantitative analysis of the effects of climate change and human activities on runoff in the Upper Hanjiang River basin. South-to-North Water Transf. Water Sci. Technol. 2017, 15, 1–6. [Google Scholar]
- Wang, J.F. Analysis on runoff variation in the Beida River Basin under the influence of cli- mate change and human activities. J. Arid Land Resour. Environ. 2019, 33, 86–91. [Google Scholar]
- Ma, C.; Lu, C.X.; Li, Y.Q.; Sun, Y.Z. Runoff change in the lower reaches of ankang reservoir and the influence of ankang reservoir on ITS downstream. Resour. Environ. Yangtze Basin 2013, 22, 1433–1440. [Google Scholar]
- Luo, W.X.; Bai, L.Q.; Song, X.D.; Liu, T.Y.; Ma, Z.M. Runoff and scouring amount in forest and grass land with different cover rate. J. Soil Water Conserv. 1990, 1, 30–35. [Google Scholar]


| Land Use Patterns | Cultivated Land | Forest | Grassland | Water Area | Built-Up Land | Unused Land |
|---|---|---|---|---|---|---|
| Cultivated land | 1 | 1 | 1 | 1 | 1 | 0 |
| Forest | 1 | 1 | 1 | 1 | 1 | 1 |
| Grassland | 1 | 1 | 1 | 1 | 1 | 1 |
| Water area | 1 | 1 | 1 | 1 | 1 | 0 |
| Built-up land | 1 | 1 | 1 | 1 | 1 | 0 |
| Unused land | 0 | 1 | 1 | 0 | 0 | 1 |
| Land Use Patterns | Cultivated Land | Forest | Grassland | Water Area | Built-Up Land | Unused Land |
|---|---|---|---|---|---|---|
| Neighborhood weights | 0.2955 | 0.3746 | 0.0728 | 0.1607 | 0.0962 | 0.0003 |
| Hydrometeorological Element | Statistic Value | Trend | Significance Level | Amount of Change before and after Mutation |
|---|---|---|---|---|
| Q/mm | −2.40 | Decrease | 0.05 | −117 |
| P/mm | −0.56 | Decrease | - | −40.9 |
| E0/mm | −1.25 | Decrease | - | +1.9 |
| T/°C | 1.63 | Increase | - | +0.4 |
| Hydrometeorological Element | Min | Max | Median | Skewness | Coefficient of Variation |
|---|---|---|---|---|---|
| Q/mm | 180 | 871 | 455 | 0.52 | 0.32 |
| P/mm | 654.4 | 1372.8 | 980.9 | 0.11 | 0.16 |
| E0/mm | 795.5 | 1003.6 | 905.0 | −0.12 | 0.05 |
| T/°C | 13.9 | 15.6 | 14.8 | 0.06 | 0.03 |
| Period | E0/P | n | Elasticity Coefficient | ||
|---|---|---|---|---|---|
| εp | εE0 | εn | |||
| 1960–1994 | 0.92 | 1.01 | 1.48 | −0.48 | −0.63 |
| 1995–2016 | 0.96 | 1.34 | 1.71 | −0.71 | −0.72 |
| Period | ΔQp | ΔQE0 | ΔQn | ΔQ | ΔAQ | δ | CP | CE0 | Cn |
|---|---|---|---|---|---|---|---|---|---|
| mm | mm | mm | mm | mm | mm | % | % | % | |
| 1960–1994 1995–2016 | −32 | −1 | −96 | −129 | −117 | 12 | 24.81 | 0.77 | 74.42 |
| Period | R2 | NSE | PBIAS (%) | RSR |
|---|---|---|---|---|
| 1971–1975 (calibration) 1976–1980 (validation) | 0.87 | 0.87 | 4.20 | 0.36 |
| 0.78 | 0.75 | 10.10 | 0.50 |
| Period | ||||||||
|---|---|---|---|---|---|---|---|---|
| mm | mm | mm | mm | mm | mm | % | % | |
| 1960–1994 1995–2016 | 491 | 465 | 423 | −68 | −26 | −42 | 38.24 | 61.76 |
| Land Use Patterns | Area (km2) | ||||
|---|---|---|---|---|---|
| 1990 | 2000 | 2010 | 2015 | Change from 1990 to 2015 | |
| Cultivated land | 1883.23 | 1889.36 | 1879.17 | 1842.50 | −40.73 |
| Forest | 9058.55 | 9043.23 | 9046.59 | 9021.23 | −37.32 |
| Grassland | 1011.98 | 1020.50 | 1010.06 | 1005.93 | −6.05 |
| Water area | 47.30 | 47.93 | 59.54 | 98.02 | 50.72 |
| Built-up land | 12.31 | 12.39 | 18.12 | 45.70 | 33.39 |
| Unused land | 0.15 | 0.11 | 0.04 | 0.14 | −0.01 |
| 1990–2015 (km2) | Cultivated Land | Forest | Grassland | Water Area | Built-Up Land | Unused Land | 2015 Total |
|---|---|---|---|---|---|---|---|
| Cultivated land | 1744.85 | 84.43 | 17.93 | 22.63 | 13.39 | 1883.23 | |
| Forest | 78.68 | 8909.59 | 22.09 | 30.59 | 17.49 | 0.11 | 9058.55 |
| Grassland | 16.25 | 23.45 | 965.80 | 3.43 | 3.05 | 1011.98 | |
| Water area | 2.48 | 3.62 | 0.03 | 41.12 | 0.05 | 47.30 | |
| Built-up land | 0.23 | 0.06 | 0.08 | 0.25 | 11.69 | 12.31 | |
| Unused land | 0.01 | 0.08 | 0.03 | 0.03 | 0.15 | ||
| 1990 total | 1842.50 | 9021.23 | 1005.93 | 98.02 | 45.70 | 0.14 | 12,013.52 |
Disclaimer/Publisher’s Note: The statements, opinions and data contained in all publications are solely those of the individual author(s) and contributor(s) and not of MDPI and/or the editor(s). MDPI and/or the editor(s) disclaim responsibility for any injury to people or property resulting from any ideas, methods, instructions or products referred to in the content. |
© 2023 by the authors. Licensee MDPI, Basel, Switzerland. This article is an open access article distributed under the terms and conditions of the Creative Commons Attribution (CC BY) license (https://creativecommons.org/licenses/by/4.0/).
Share and Cite
Zhang, X.; He, Y. Impact of Climate Change and Human Activities to Runoff in the Du River Basin of the Qinling-Daba Mountains, China. Remote Sens. 2023, 15, 5178. https://doi.org/10.3390/rs15215178
Zhang X, He Y. Impact of Climate Change and Human Activities to Runoff in the Du River Basin of the Qinling-Daba Mountains, China. Remote Sensing. 2023; 15(21):5178. https://doi.org/10.3390/rs15215178
Chicago/Turabian StyleZhang, Xiaoying, and Yi He. 2023. "Impact of Climate Change and Human Activities to Runoff in the Du River Basin of the Qinling-Daba Mountains, China" Remote Sensing 15, no. 21: 5178. https://doi.org/10.3390/rs15215178
APA StyleZhang, X., & He, Y. (2023). Impact of Climate Change and Human Activities to Runoff in the Du River Basin of the Qinling-Daba Mountains, China. Remote Sensing, 15(21), 5178. https://doi.org/10.3390/rs15215178